preqin quarterly update: private debt q3 2019
TRANSCRIPT
PREQINQUARTERLY UPDATE:PRIVATE DEBTQ3 2019Insight on the quarter from the leading provider of alternative assets data
FundraisingFunds in MarketInvestorsPerformanceDry Powder
Foreword
Private debt fundraising in Q3 continued at the lacklustre levels that have characterized 2019 so far. Notably, twice as many funds were closed in the corresponding quarter in 2018. That said, the levels of capital raised each quarter are somewhat consistent in this environment, where competition for lending opportunities remains a pressing concern for investors as the market continues to mature.
Manager sentiment remains buoyant as future searches and mandates issued by investors in the quarter are up from Q3 last year. The need for a diversified portfolio is greater than ever as geopolitical tensions intensify, producing persistently low interest rates and unattractively low yields on traditional fixed income assets.
Although returns for the asset class have slowed over the past year, with direct lending funds contributing directly to the slump, private debt has continued to
outperform both natural resources and real estate. Amid ongoing economic turbulence, the asset class is proving its ability to provide a sustainable and reliable income stream to investors, and therefore protection on the downside.
As increasing levels of capital are being put to work by fund managers, investors are hoping the more experienced managers can guide them through the turbulence. Although the debate continues, the consensus is that we are in the late stage of the market cycle. As a result, fund managers across private capital are bracing themselves for more uncertainty, especially those in the private debt space, an asset class that has not yet faced a true market downturn.
Contents
All rights reserved. The entire contents of Preqin Quarterly Update: Private Debt, Q3 2019 are the Copyright of Preqin Ltd. No part of this publication or any information contained in it may be copied, transmitted by any electronic means, or stored in any electronic or other data storage medium, or printed or published in any document, report or publication, without the express prior written approval of Preqin Ltd. The information presented in Preqin Quarterly Update: Private Debt, Q3 2019 is for information purposes only and does not constitute and should not be construed as a solicitation or other offer, or recommendation to acquire or dispose of any investment or to engage in any other transaction, or as advice of any nature whatsoever. If the reader seeks advice rather than information then he should seek an independent financial advisor and hereby agrees that he will not hold Preqin Ltd. responsible in law or equity for any decisions of whatever nature the reader makes or refrains from making following its use of Preqin Quarterly Update: Private Debt, Q3 2019. While reasonable efforts have been made to obtain information from sources that are believed to be accurate, and to confirm the accuracy of such information wherever possible, Preqin Ltd. does not make any representation or warranty that the information or opinions contained in Preqin Quarterly Update: Private Debt, Q3 2019 are accurate, reliable, up to date or complete. Although every reasonable effort has been made to ensure the accuracy of this publication Preqin Ltd. does not accept any responsibility for any errors or omissions within Preqin Quarterly Update: Private Debt, Q3 2019 or for any expense or other loss alleged to have arisen in any way with a reader’s use of this publication.
3 Sponsored Lending Today: Competition, Tight Spreads and Loosening Provisions – Darius Mozaffarian, White Oak Global Advisors, LLC
4 Fundraising
5 Funds in Market
6 Investors
7 Performance & Dry Powder
2
PREQIN QUARTERLY UPDATE: PRIVATE DEBT Q3 2019

After a decade of strong investment returns, fuelled by easy monetary policy and a recovering global economy, investors today face the issue of where and what to invest in during a late-cycle market environment. Many asset prices are high – either at a tipping point before a correction, or at best reflecting lower return expectations in the coming years.
It’s no surprise that investors worldwide have piled into the private credit asset class to diversify their portfolio without sacrificing returns. The first beneficiaries of this influx were sponsored lenders, or credit managers who lend money to companies with a private equity sponsor. While sponsored lending has its benefits in a bull market, it can be one of the more risky aspects of private credit in a late-cycle environment like where we are today. Many credit managers today cite increased competition as a result of a growing number of funds raised that are chasing fewer and fewer opportunities. These competitive dynamics drive spreads tighter and yields lower. Consequently, sponsored lenders have increasingly relied on fund-level leverage to keep headline returns attractive. All the while, credit risk metrics such as leverage ratios and loan-to-value show signs of overextension.
Covenant-lite loans which gained attention in 2014 starting with the syndicated bank loan market have also made their way into the sponsored lending world. To be competitive in an auction-style process, it’s now not uncommon for managers to make covenants and lender-protection provisions secondary in negotiations. There are also more and more examples of other loosening provisions in loan documentation. For example, EBITDA-addbacks and other verbiage that allow borrowers to add more debt to their balance sheets without breaching covenants are on the rise. All this can lead to more stress in the event of a credit market downturn.
While sponsored lending originally supported private equity buyout transactions of the past 10-20 years, banks have been in the business of lending for hundreds of years. It is on this bank-lending model that non-sponsored lenders today base much of their product offering and value proposition. Because non-sponsored lenders often directly originate and underwrite each investment opportunity like a bank, they establish a direct relationship with the borrower and have greater say over pricing, terms and conditions. In this way, direct non-sponsored lenders can offer higher yields, stronger financial covenants and better lender protection language than a sponsored lender participating in a bidding process to secure a lending opportunity.
Given the market dynamics today of easy monetary policy and rising asset prices, we expect the global demand for private credit to remain robust. Yet in a market where lending to sponsored companies is becoming increasingly crowded, investors can benefit by better diversifying their credit risk and exploring lending opportunities that once were served solely by banks.
Sponsored Lending Today: Competition, Tight Spreads and Loosening Provisions
Darius MozaffarianPartner & Co-President, White Oak Global Advisors, LLC
Differentiation is key to success as sponsored lending market matures
© Preqin Ltd. www.preqin.com 3
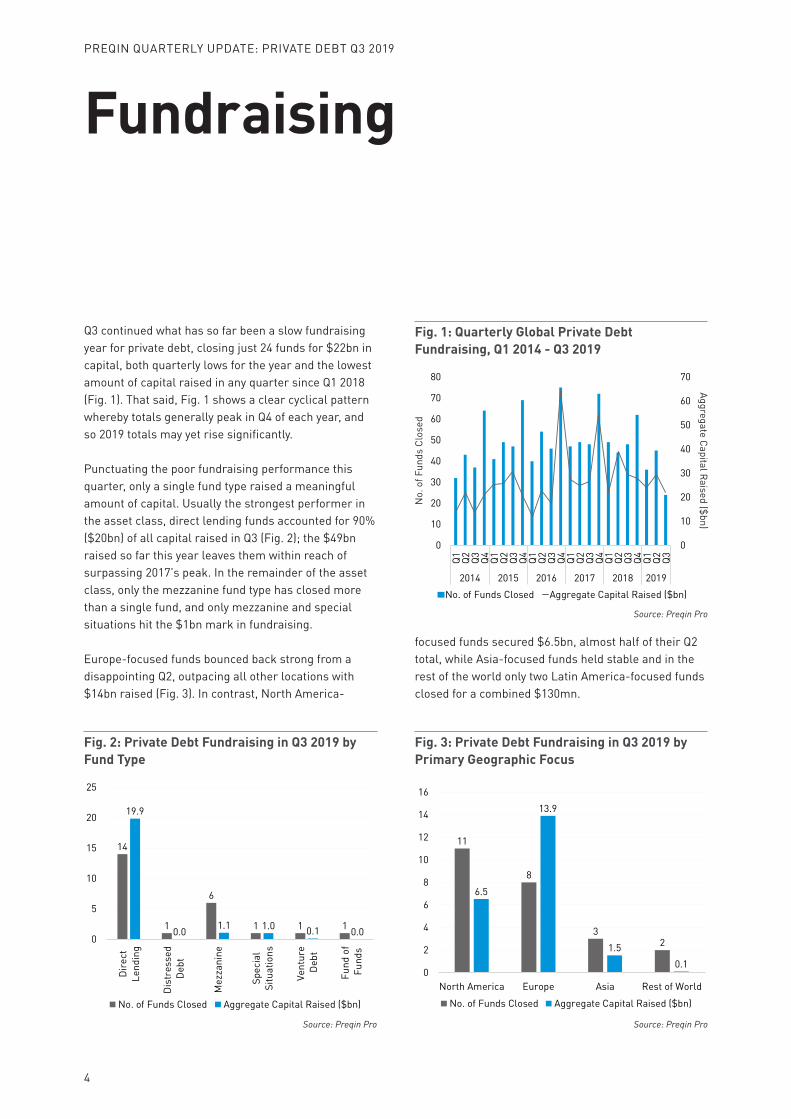
Q3 continued what has so far been a slow fundraising year for private debt, closing just 24 funds for $22bn in capital, both quarterly lows for the year and the lowest amount of capital raised in any quarter since Q1 2018 (Fig. 1). That said, Fig. 1 shows a clear cyclical pattern whereby totals generally peak in Q4 of each year, and so 2019 totals may yet rise significantly.
Punctuating the poor fundraising performance this quarter, only a single fund type raised a meaningful amount of capital. Usually the strongest performer in the asset class, direct lending funds accounted for 90% ($20bn) of all capital raised in Q3 (Fig. 2); the $49bn raised so far this year leaves them within reach of surpassing 2017’s peak. In the remainder of the asset class, only the mezzanine fund type has closed more than a single fund, and only mezzanine and special situations hit the $1bn mark in fundraising.
Europe-focused funds bounced back strong from a disappointing Q2, outpacing all other locations with $14bn raised (Fig. 3). In contrast, North America-
focused funds secured $6.5bn, almost half of their Q2 total, while Asia-focused funds held stable and in the rest of the world only two Latin America-focused funds closed for a combined $130mn.
Fundraising
Fig. 3: Private Debt Fundraising in Q3 2019 by Primary Geographic Focus
Source: Preqin Pro
11
8
32
6.5
13.9
1.50.1
0
2
4
6
8
10
12
14
16
North America Europe Asia Rest of World
No. of Funds Closed Aggregate Capital Raised ($bn)
Fig. 2: Private Debt Fundraising in Q3 2019 by Fund Type
Source: Preqin Pro
14
1
6
1 1 1
19.9
0.0 1.1 1.0 0.1 0.00
5
10
15
20
25
Dire
ctLe
ndin
g
Dist
ress
ed D
ebt
Mez
zani
ne
Spec
ial
Situ
atio
ns
Vent
ure
Deb
t
Fund
of
Fun
ds
No. of Funds Closed Aggregate Capital Raised ($bn)
Fig. 1: Quarterly Global Private Debt Fundraising, Q1 2014 - Q3 2019
Source: Preqin Pro
0
10
20
30
40
50
60
70
0
10
20
30
40
50
60
70
80
Q1 Q2 Q3 Q4 Q1 Q2 Q3 Q4 Q1 Q2 Q3 Q4 Q1 Q2 Q3 Q4 Q1 Q2 Q3 Q4 Q1 Q2 Q3
2014 2015 2016 2017 2018 2019No. of Funds Closed Aggregate Capital Raised ($bn)
No.
of F
unds
Clo
sed
Aggregate Capital Raised ($bn)
4
PREQIN QUARTERLY UPDATE: PRIVATE DEBT Q3 2019
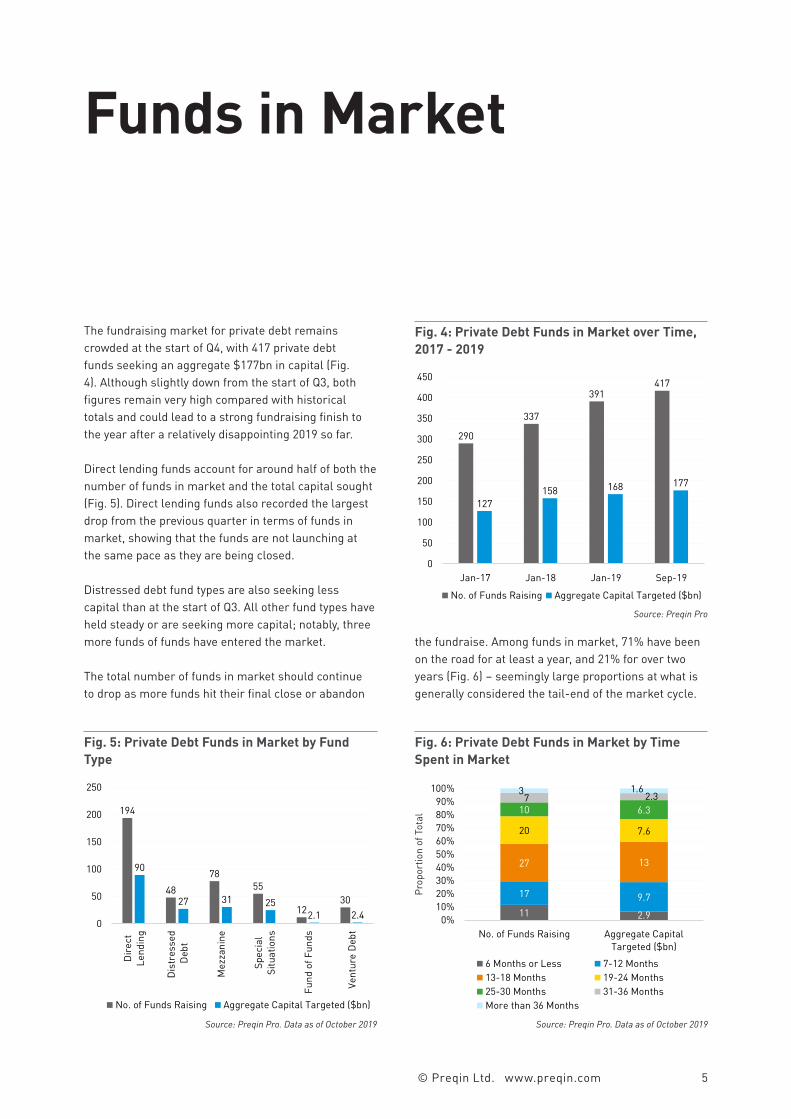
The fundraising market for private debt remains crowded at the start of Q4, with 417 private debt funds seeking an aggregate $177bn in capital (Fig. 4). Although slightly down from the start of Q3, both figures remain very high compared with historical totals and could lead to a strong fundraising finish to the year after a relatively disappointing 2019 so far.
Direct lending funds account for around half of both the number of funds in market and the total capital sought (Fig. 5). Direct lending funds also recorded the largest drop from the previous quarter in terms of funds in market, showing that the funds are not launching at the same pace as they are being closed.
Distressed debt fund types are also seeking less capital than at the start of Q3. All other fund types have held steady or are seeking more capital; notably, three more funds of funds have entered the market.
The total number of funds in market should continue to drop as more funds hit their final close or abandon
the fundraise. Among funds in market, 71% have been on the road for at least a year, and 21% for over two years (Fig. 6) – seemingly large proportions at what is generally considered the tail-end of the market cycle.
Funds in Market
Fig. 6: Private Debt Funds in Market by Time Spent in Market
Source: Preqin Pro. Data as of October 2019
11 2.9
17 9.7
27 13
20 7.6
10 6.37 2.33 1.6
0%10%20%30%40%50%60%70%80%90%
100%
No. of Funds Raising Aggregate CapitalTargeted ($bn)
6 Months or Less 7-12 Months13-18 Months 19-24 Months25-30 Months 31-36 MonthsMore than 36 Months
Fig. 5: Private Debt Funds in Market by Fund Type
Source: Preqin Pro. Data as of October 2019
194
4878
55
1230
90
27 31 252.1 2.4
0
50
100
150
200
250
Dire
ctLe
ndin
g
Dist
ress
ed D
ebt
Mez
zani
ne
Spec
ial
Situ
atio
ns
Fund
of F
unds
Vent
ure
Debt
No. of Funds Raising Aggregate Capital Targeted ($bn)
Fig. 4: Private Debt Funds in Market over Time, 2017 - 2019
Source: Preqin Pro
290
337
391417
127158 168 177
0
50
100
150
200
250
300
350
400
450
Jan-17 Jan-18 Jan-19 Sep-19
No. of Funds Raising Aggregate Capital Targeted ($bn)
Prop
ortio
n of
Tot
al
© Preqin Ltd. www.preqin.com 5
Investors
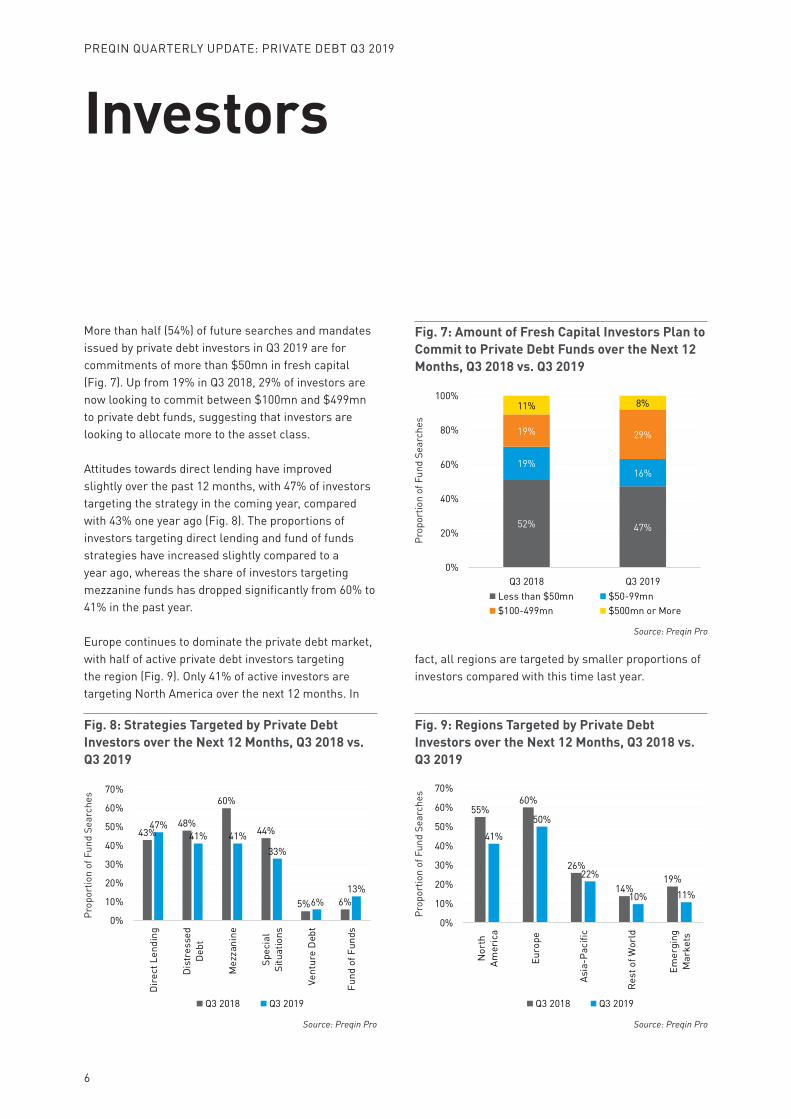
More than half (54%) of future searches and mandates issued by private debt investors in Q3 2019 are for commitments of more than $50mn in fresh capital (Fig. 7). Up from 19% in Q3 2018, 29% of investors are now looking to commit between $100mn and $499mn to private debt funds, suggesting that investors are looking to allocate more to the asset class.
Attitudes towards direct lending have improved slightly over the past 12 months, with 47% of investors targeting the strategy in the coming year, compared with 43% one year ago (Fig. 8). The proportions of investors targeting direct lending and fund of funds strategies have increased slightly compared to a year ago, whereas the share of investors targeting mezzanine funds has dropped significantly from 60% to 41% in the past year.
Europe continues to dominate the private debt market, with half of active private debt investors targeting the region (Fig. 9). Only 41% of active investors are targeting North America over the next 12 months. In
fact, all regions are targeted by smaller proportions of investors compared with this time last year.
Fig. 9: Regions Targeted by Private Debt Investors over the Next 12 Months, Q3 2018 vs. Q3 2019
Source: Preqin Pro
55%60%
26%
14%19%
41%
50%
22%
10% 11%
0%
10%
20%
30%
40%
50%
60%
70%
Nor
thAm
eric
a
Euro
pe
Asia
-Pac
ific
Rest
of W
orld
Emer
ging
Mar
kets
Q3 2018 Q3 2019
Fig. 8: Strategies Targeted by Private Debt Investors over the Next 12 Months, Q3 2018 vs. Q3 2019
Source: Preqin Pro
43%48%
60%
44%
5% 6%
47%41% 41%
33%
6%13%
0%
10%
20%
30%
40%
50%
60%
70%
Dir
ect L
endi
ng
Dis
tres
sed
Deb
t
Mez
zani
ne
Spec
ial
Situ
atio
ns
Vent
ure
Deb
t
Fund
of F
unds
Q3 2018 Q3 2019
Fig. 7: Amount of Fresh Capital Investors Plan to Commit to Private Debt Funds over the Next 12 Months, Q3 2018 vs. Q3 2019
Source: Preqin Pro
52% 47%
19%16%
19% 29%
11% 8%
0%
20%
40%
60%
80%
100%
Q3 2018 Q3 2019Less than $50mn $50-99mn$100-499mn $500mn or More
Prop
ortio
n of
Fun
d Se
arch
es
Prop
ortio
n of
Fun
d Se
arch
es
Prop
ortio
n of
Fun
d Se
arch
es
6
PREQIN QUARTERLY UPDATE: PRIVATE DEBT Q3 2019
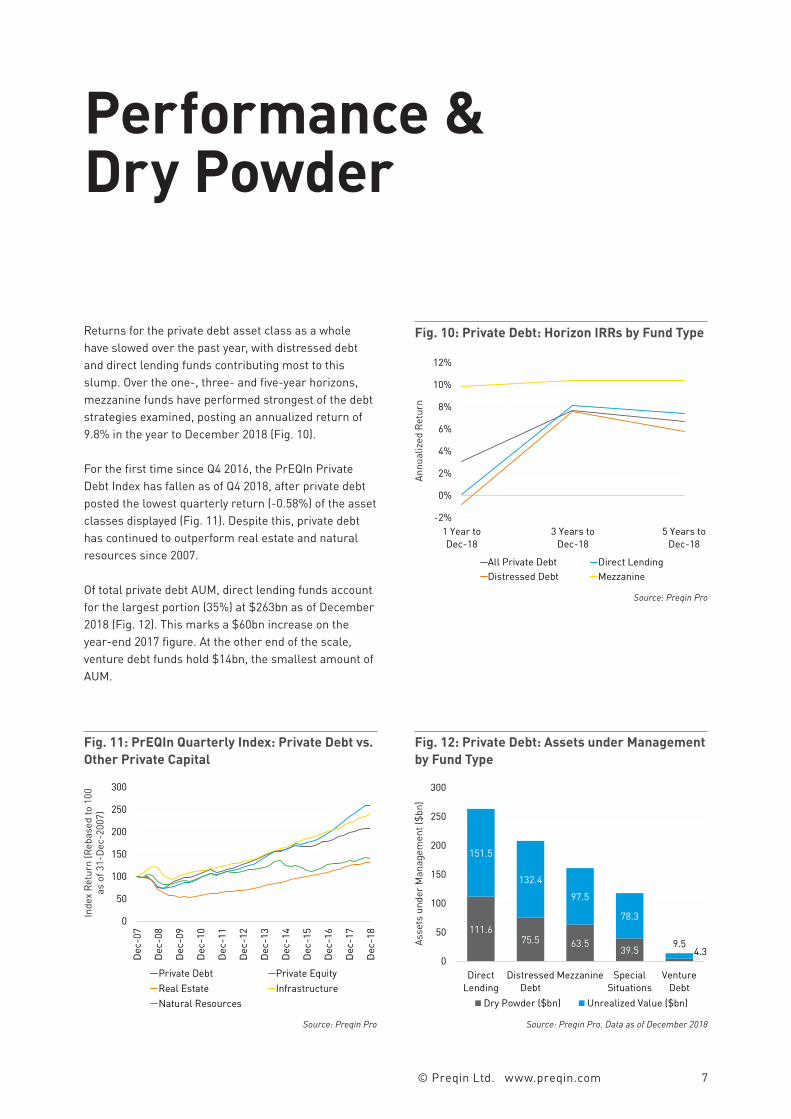
Fig. 12: Private Debt: Assets under Management by Fund Type
Source: Preqin Pro. Data as of December 2018
111.675.5 63.5
39.5 4.3
151.5
132.4
97.5
78.3
9.5
0
50
100
150
200
250
300
DirectLending
DistressedDebt
Mezzanine SpecialSituations
VentureDebt
Dry Powder ($bn) Unrealized Value ($bn)
Returns for the private debt asset class as a whole have slowed over the past year, with distressed debt and direct lending funds contributing most to this slump. Over the one-, three- and five-year horizons, mezzanine funds have performed strongest of the debt strategies examined, posting an annualized return of 9.8% in the year to December 2018 (Fig. 10).
For the first time since Q4 2016, the PrEQIn Private Debt Index has fallen as of Q4 2018, after private debt posted the lowest quarterly return (-0.58%) of the asset classes displayed (Fig. 11). Despite this, private debt has continued to outperform real estate and natural resources since 2007.
Of total private debt AUM, direct lending funds account for the largest portion (35%) at $263bn as of December 2018 (Fig. 12). This marks a $60bn increase on the year-end 2017 figure. At the other end of the scale, venture debt funds hold $14bn, the smallest amount of AUM.
Performance & Dry Powder
Fig. 10: Private Debt: Horizon IRRs by Fund Type
Source: Preqin Pro
-2%
0%
2%
4%
6%
8%
10%
12%
1 Year toDec-18
3 Years toDec-18
5 Years toDec-18
All Private Debt Direct LendingDistressed Debt Mezzanine
Annu
aliz
ed R
etur
n
Fig. 11: PrEQIn Quarterly Index: Private Debt vs. Other Private Capital
Source: Preqin Pro
0
50
100
150
200
250
300
Dec
-07
Dec
-08
Dec
-09
Dec
-10
Dec
-11
Dec
-12
Dec
-13
Dec
-14
Dec
-15
Dec
-16
Dec
-17
Dec
-18
Private Debt Private EquityReal Estate InfrastructureNatural Resources
Inde
x Re
turn
(Reb
ased
to 1
00
as o
f 31-
Dec-
2007
)
Asse
ts u
nder
Man
agem
ent (
$bn)
© Preqin Ltd. www.preqin.com 7