Download - Pozolo Andrew

TRANSFER AND DEVELOPMENT LENGTHS OF STEEL STRANDS IN FULL-SCALE PRESTRESSED SELF-CONSOLIDATING CONCRETE BRIDGE GIRDERS
BY
ANDREW M. POZOLO
THESIS
Submitted in partial fulfillment of the requirements for the degree of Master of Science in Civil Engineering
in the Graduate College of the University of Illinois at Urbana-Champaign, 2010
Urbana, Illinois
Adviser: Professor Bassem Andrawes

ii
ABSTRACT
Self-consolidating concrete (SCC) is a workable yet stable concrete which flows easily
and consolidates under its own weight. Its unique properties can substantially reduce the labor
required to pour complex or heavily reinforced structural members. Over the past decade, the
American precast industry has taken significant strides to adopt SCC in commercial projects,
though concern about early-age bond behavior has limited the material’s application in
prestressed members. A keen understanding of SCC’s bond strength, including its impact on
transfer and development lengths in prestressed members, is essential to safely implement SCC
in prestressed design.
The Illinois Department of Transportation (IDOT) has sponsored a three-phase study
exploring the bond behavior of steel strands in prestressed bridge girders. In the first phase, 56
pullout tests were conducted to compare the performance of seven-wire strands embedded in
SCC and conventionally-consolidated concrete blocks. In the second phase, transfer lengths of
prestressing strands in two SCC hollow box girders and two SCC I-girders were determined
experimentally. In the third phase, the development length of strands in the two box girders was
determined through a series of iterative flexural tests.
This thesis details the three phases of the IDOT study and compares results to industry
standards and requirements of the American Concrete Institute and the American Association of
State Highway and Transportation Officials. Results are also compared to analytical methods
proposed in the literature. Additionally, a systematic method is developed to predict transfer
lengths in full-scale specimens using pullout test data and finite element analysis. The proposed
method may be useful when large-scale testing is impractical in terms of time or cost.

iii
This thesis is dedicated to my parents, Gary & Cynthia.

iv
ACKNOWLEDGMENTS
I first thank my advisor, Dr. Bassem Andrawes, for his continual guidance during my
graduate studies at the University of Illinois. Without his support, this research would not have
been possible. I also extend gratitude to Dr. Gregory Banas, Timothy Prunkard, and my fellow
graduate students for assisting with experiments in the structural testing laboratory. In addition, I
thank Michael Johnson and the workers at Prestressed Engineering Corporation in Blackstone,
Illinois for cooperation during test specimen fabrication. I also acknowledge the Illinois Center
for Transportation and the Illinois Department of Transportation for funding this project. Finally,
I am forever grateful to my family and friends for their unyielding love and encouragement.
v
TABLE OF CONTENTS
CHAPTER 1: INTRODUCTION................................................................................................ 1
1.1 MOTIVATION FOR RESEARCH PROJECT .................................................................... 1 1.2 THESIS OUTLINE............................................................................................................... 1
CHAPTER 2: LITERATURE REVIEW.................................................................................... 3 2.1 BACKGROUND ON SELF-CONSOLIDATING CONCRETE ......................................... 3 2.2 TRANSFER AND DEVELOPMENT LENGTH DEFINITIONS....................................... 5 2.3 EXPERIMENTAL TEST METHODS................................................................................. 9 2.4 TRANSFER AND DEVELOPMENT LENGTH TESTS ON SCC SPECIMENS............ 17
CHAPTER 3: PULLOUT TESTS ............................................................................................. 30 3.1 PULLOUT BLOCK SPECIMENS..................................................................................... 30 3.2 PULLOUT TEST SETUP................................................................................................... 34 3.3 PULLOUT TEST RESULTS ............................................................................................. 35
CHAPTER 4: FULL-SCALE GIRDER DESIGN AND ANALYSIS .................................... 40 4.1 SPECIMEN DESCRIPTION.............................................................................................. 40 4.2 SPECIMEN FABRICATION............................................................................................. 42 4.3 SECTION PROPERTIES ................................................................................................... 48 4.4 PRESTRESS LOSSES........................................................................................................ 49 4.5 DEVELOPMENT LENGTH PREDICTIONS................................................................... 56 4.6 DESIGN CAPACITIES...................................................................................................... 58 4.7 SUPPLEMENTARY SHEAR REINFORCEMENT.......................................................... 62
CHAPTER 5: TRANSFER LENGTH ...................................................................................... 67 5.1 MEASUREMENTS............................................................................................................ 67 5.2 DISCUSSION OF TRANSFER LENGTH RESULTS ...................................................... 69 5.3 COMPARISON TO ANALYTICAL TRANSFER LENGTH........................................... 72
CHAPTER 6: DEVELOPMENT LENGTH ............................................................................ 75 6.1 THREE-POINT FLEXURAL TEST SETUP..................................................................... 75 6.2 DEVELOPMENT LENGTH TESTS ................................................................................. 83 6.3 DISCUSSION OF DEVELOPMENT LENGTH RESULTS........................................... 103
CHAPTER 7: FINITE ELEMENT ANALYSIS.................................................................... 111 7.1 MODELING PHILOSOPHY ........................................................................................... 111 7.2 ELEMENT TYPES AND MATERIAL MODELS.......................................................... 112 7.3 BOND-SLIP MECHANISM ............................................................................................ 115 7.4 PULLOUT MODEL ......................................................................................................... 119 7.5 GIRDER MODELS .......................................................................................................... 121 7.6 DISCUSSION OF FINITE ELEMENT RESULTS ......................................................... 125
CHAPTER 8: CONCLUSIONS .............................................................................................. 127 REFERENCES.......................................................................................................................... 130 APPENDIX A: PULLOUT TEST FORCE-DISPLACEMENT RESPONSES .................. 136 APPENDIX B: FABRICATION DRAWINGS FOR FULL-SCALE GIRDERS ............... 142 APPENDIX C: EXAMPLE CALCULATIONS OF PRESTRESS LOSSES ...................... 146 APPENDIX D: EXAMPLE SHEAR AND MOMENT CAPACITY CALCULATIONS .. 150 APPENDIX E: STRAIN PROFILES FOR 95% AMS TRANSFER LENGTH................. 157 APPENDIX F: END-SLIP RESPONSES FOR FLEXURAL TESTS ................................. 165
1
CHAPTER 1: INTRODUCTION
1.1 MOTIVATION FOR RESEARCH PROJECT
Self-consolidating concrete (SCC) is a workable yet stable concrete which flows easily
and consolidates under its own weight. Its unique properties can substantially reduce the labor
required to pour complex or heavily reinforced structural members. Over the past decade, the
United States (U.S.) precast industry has taken significant strides to adopt SCC, recognizing its
potential to reduce material costs, labor costs, and turn-over time. Concern about early-age bond
behavior, however, has thus far limited the material’s application in prestressed members.
Limited experimental data is available for full-scale prestressed SCC specimens, and studies
assessing bond behavior in SCC have shown wide variability in their results. A keen
understanding of SCC’s bond strength, including its impact on transfer and development lengths
in prestressed members, is essential to safely implement SCC in prestressed design.
In response to rising demand to adopt SCC in the state of Illinois, the Illinois Department
of Transportation (IDOT) has sponsored a study exploring the application of SCC in full-scale
prestressed girders. The study aims specifically at assessing the bond properties of prestressing
strands in I-girders and hollow box girders cast with IDOT-approved SCC. Testing of SCC box
girders is particularly notable because of the absence of similar testing in previous literature.
1.2 THESIS OUTLINE
This thesis presents the scope, methodology, and experimental results of research
performed at the University of Illinois at Urbana-Champaign (UIUC) for the three-phase IDOT
study. The thesis also presents comparisons of experimental data to previous research and
outlines a method for predicting transfer lengths in full-scale specimens using pullout test data
and finite element analysis. Chapter 1 discusses the motivation for this research.
Chapter 2 contains a literature review which highlights the properties of SCC, discusses
code requirements for transfer and development lengths, and summarizes results from recent
studies concerned with bond behavior of prestressed SCC specimens.
Chapter 3 presents experimental results from pullout tests conducted on 0.5-in. diameter,
low-relaxation seven-wire steel strands embedded in SCC and NCC blocks. The tests are used to
characterize strand behavior in SCC as acceptable when compared to behavior in NCC.
2
Chapter 4 outlines the design and analysis of two 28-ft. hollow box girders and two 48-ft.
I-girders. The fabrication process and specimen geometry are described in detail. Theoretical
prestress losses, shear capacities, and flexural capacities are presented. The design procedure for
external FRP shear reinforcement is described, as is the application of CFRP to one box girder
specimen.
Chapter 5 describes the transfer length measurements taken for the four full-scale girders.
Experimental results are compared to requirements of the 2008 American Concrete Institute
(ACI) building design code (ACI Committee 318) and the American Association of State
Highway and Transportation Officials (AASHTO) LRFD Bridge Design Specifications
(AASHTO 2004). Results are also compared to proposed analytical transfer length expressions
from the literature.
Chapter 6 provides a thorough review of the flexural tests conducted to determine
development length in the box girder specimens. Experimental results are compared to code
requirements, theoretical design capacities, and analytical development length expressions from
the literature. The shear-strengthening effect of externally bonded carbon fiber-reinforced
polymer (CFRP) fabric is also noted.
Chapter 7 outlines a systematic method to predict transfer length using pullout test data
incorporated into finite element analyses. The finite element program ANSYS (2007) is utilized
to create models of the pullout blocks and girder specimens. Transfer length predictions from the
analyses are compared to experimental results. The proposed method may be useful when large-
scale testing is not feasible due to time, cost, or other prohibitive constraints.
Chapter 8 summarizes the major findings of the experimental and analytical portions of
this research, with limitations or assumptions noted where appropriate.
Six appendices follow the main text of this thesis. Appendix A contains plots of all force-
displacement responses obtained from the pullout tests. Appendix B provides fabrication
drawings of the full-scale girder specimens; all pertinent reinforcement details and girder
dimensions are included. Appendices C and D provide example calculations for prestress losses,
shear capacities, and flexural capacities. Appendix E presents the strain profiles obtained for
transfer length measurements in all four girders. Finally, Appendix F presents the end-slip
behavior of strands during flexural testing of the two box girders.
3
CHAPTER 2: LITERATURE REVIEW
2.1 BACKGROUND ON SELF-CONSOLIDATING CONCRETE
Developed by researchers concerned with the durability of Japan’s concrete infrastructure
and the declining number of skilled laborers in Japan’s workforce, self-consolidating concrete
emerged as a structural material in the late 1980’s (Okamura & Ouchi 2003). By altering typical
concrete mixture proportions and incorporating various chemical admixtures, researchers created
a concrete which would easily flow and consolidate under its own weight, drastically reducing
the labor required in the casting process. Japan and Europe soon began implementing SCC in
large-scale applications, particularly in bridges (Ouchi et al. 2003). Over the past decade, the
United States precast industry has taken significant strides to adopt the material in prestressed
design, recognizing its tremendous potential to reduce fabrication time, labor, and cost.
2.1.1 Definition and Plastic Properties of SCC
The U.S. Precast/Prestressed Concrete Institute (PCI) defines SCC as “a highly workable
concrete that can flow through densely reinforced or complex structural elements under its own
weight and adequately fill voids without segregation or excessive bleeding without the need for
vibration,” (PCI 2003-a). The PCI classifies a concrete mixture as SCC if it meets specified
requirements for three criteria: (1) filling ability, (2) passing ability, and (3) stability. Adequate
filling ability ensures concrete can completely flow under its own weight without vibration into
formwork. Adequate passing ability ensures concrete can flow through openings near the size of
its coarse aggregate without experiencing blockage. Passing ability is particularly important in
specimens with irregular shapes or dense reinforcement. Finally, stability refers to concrete’s
resistance to segregation, or its ability to retain homogenous characteristics during placement.
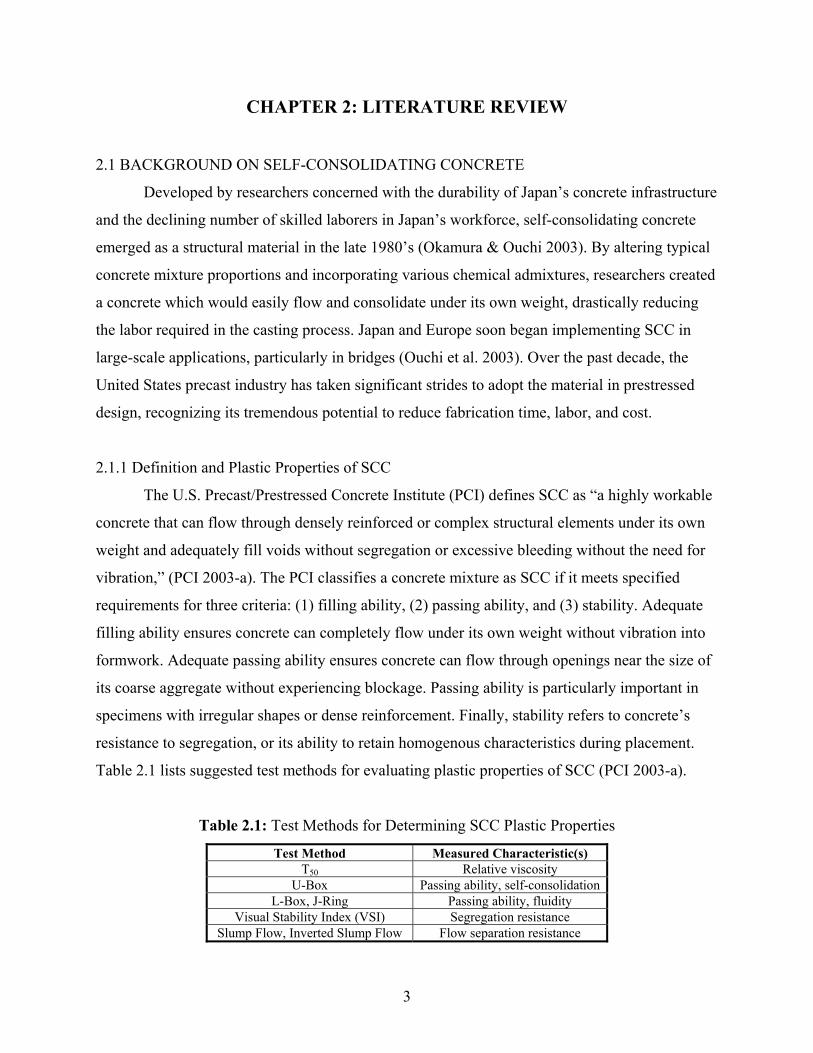
Table 2.1 lists suggested test methods for evaluating plastic properties of SCC (PCI 2003-a).
Table 2.1: Test Methods for Determining SCC Plastic Properties
Test Method Measured Characteristic(s) T50 Relative viscosity
U-Box Passing ability, self-consolidation L-Box, J-Ring Passing ability, fluidity
Visual Stability Index (VSI) Segregation resistance Slump Flow, Inverted Slump Flow Flow separation resistance
4
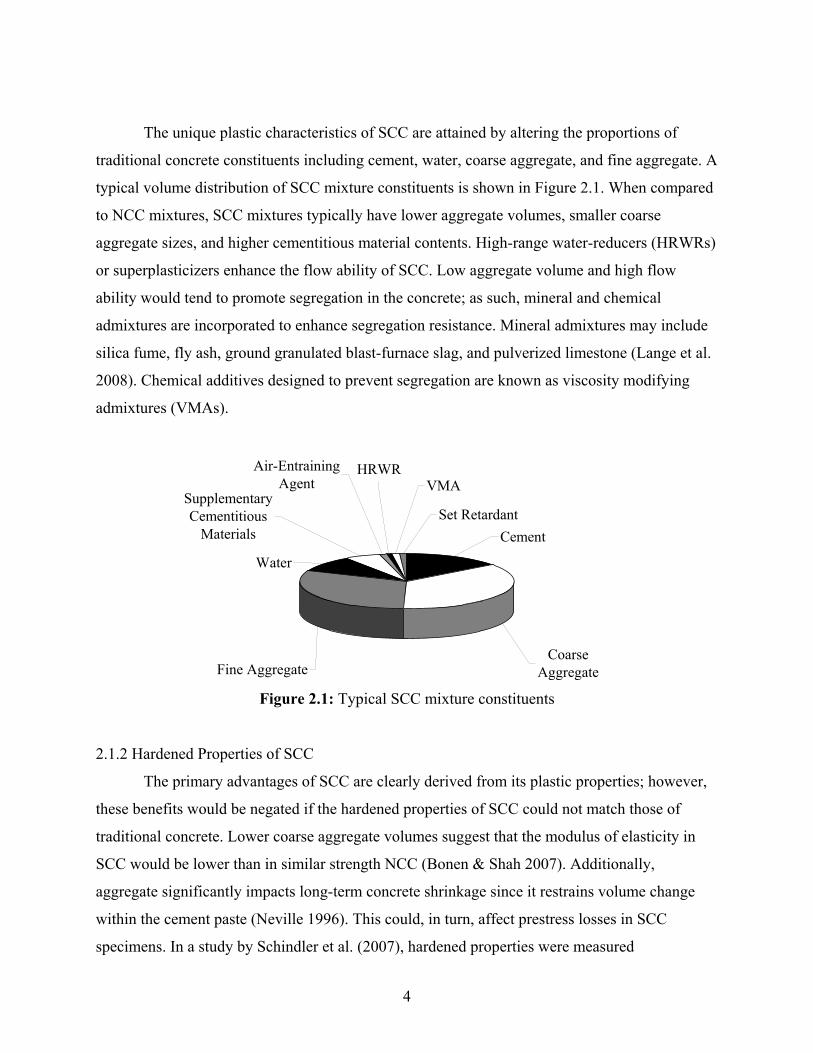
The unique plastic characteristics of SCC are attained by altering the proportions of
traditional concrete constituents including cement, water, coarse aggregate, and fine aggregate. A
typical volume distribution of SCC mixture constituents is shown in Figure 2.1. When compared
to NCC mixtures, SCC mixtures typically have lower aggregate volumes, smaller coarse
aggregate sizes, and higher cementitious material contents. High-range water-reducers (HRWRs)
or superplasticizers enhance the flow ability of SCC. Low aggregate volume and high flow
ability would tend to promote segregation in the concrete; as such, mineral and chemical
admixtures are incorporated to enhance segregation resistance. Mineral admixtures may include
silica fume, fly ash, ground granulated blast-furnace slag, and pulverized limestone (Lange et al.
2008). Chemical additives designed to prevent segregation are known as viscosity modifying
admixtures (VMAs).
HRWRVMA
Set RetardantCement
Coarse Aggregate
Air-Entraining Agent
Supplementary Cementitious
Materials
Water
Fine Aggregate Figure 2.1: Typical SCC mixture constituents
2.1.2 Hardened Properties of SCC
The primary advantages of SCC are clearly derived from its plastic properties; however,
these benefits would be negated if the hardened properties of SCC could not match those of
traditional concrete. Lower coarse aggregate volumes suggest that the modulus of elasticity in
SCC would be lower than in similar strength NCC (Bonen & Shah 2007). Additionally,
aggregate significantly impacts long-term concrete shrinkage since it restrains volume change
within the cement paste (Neville 1996). This could, in turn, affect prestress losses in SCC
specimens. In a study by Schindler et al. (2007), hardened properties were measured
5
experimentally on cylinders cast with twenty-one SCC mixtures with varying water/cement (w/c)
ratios, sand-to-total aggregate ratios, and cementitious material types. The researchers concluded
that 112-day drying shrinkage strains in the SCC mixtures were of the same order of magnitude
or less than corresponding strains in control specimens cast with NCC. The sand-to-total
aggregate ratios appeared to have no significant effect on 112-day drying shrinkage strains or
concrete compressive strength at any age. Finally, after 18 hours of curing, the modulus of
elasticity in SCC was less than that in control specimens with comparable strength. After 56
days, however, moduli in SCC and NCC were comparable.
2.2 TRANSFER AND DEVELOPMENT LENGTH DEFINITIONS
A pretensioned concrete specimen is fabricated by casting concrete around prestressed
strands, allowing the concrete to harden, and then releasing the strands. Upon release, specimens
rely on bond between strands and concrete in transfer zones of the specimen to develop the
imparted prestress. Three factors which may contribute to bond are adhesion between steel and
concrete, friction between steel and concrete, and mechanical interlock (Janney 1954; Hanson &
Kaar 1959). Since strands move relative to concrete upon release, it is generally accepted that
bond due to pure adhesion is negligible; thus, friction and mechanical resistance are the two
primary contributors to bond. Friction results from the wedging action of strands, commonly
known as the Hoyer effect. When strands are initially stressed, they constrict in size; when
released, they attempt to return to their original size, resulting in high radial pressure and
frictional resistance. Additionally, the outer wires of helical strands tend to twist when released
from tension; concrete surrounding the strands prevents twisting through mechanical interlock,
thereby increasing bond. Specimens with adequate bond are able to reach their full shear and
flexural design capacities without experiencing bond-slip failure at strand locations. Current
design code requirements for transfer and development lengths were derived primarily from the
work of Hanson and Kaar (1959) and are discussed in Section 2.2.1.
2.2.1 ACI and AASHTO Code Requirements
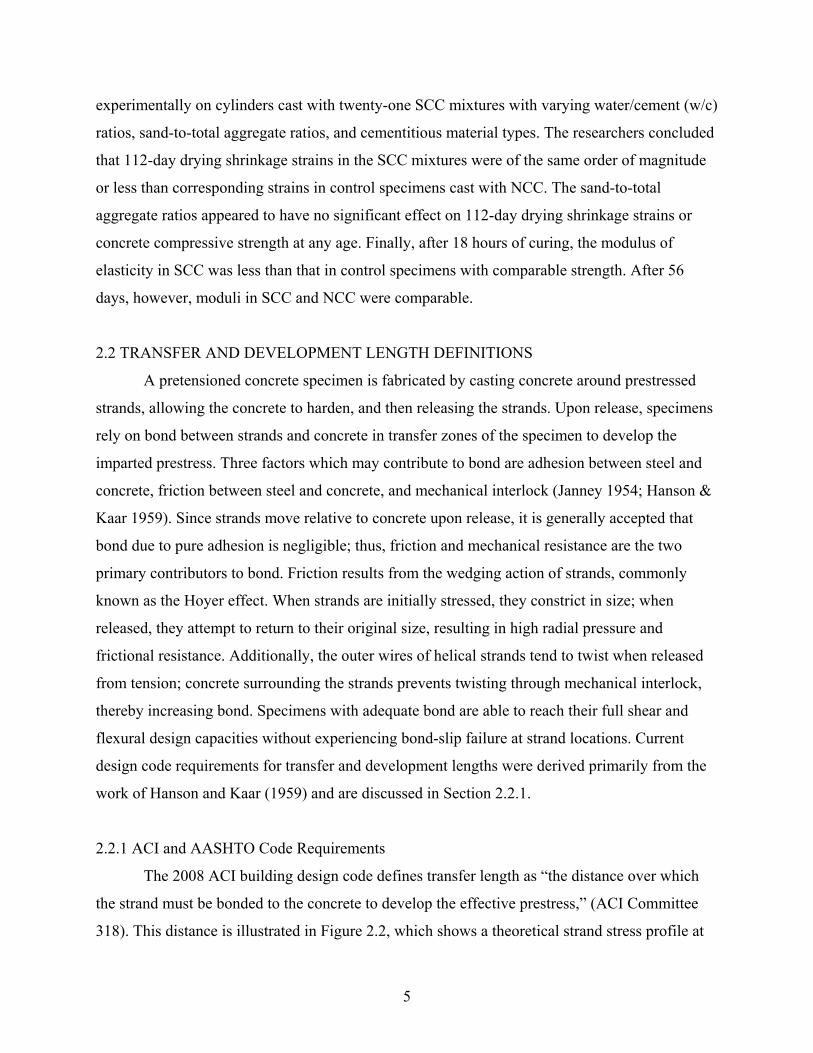
The 2008 ACI building design code defines transfer length as “the distance over which
the strand must be bonded to the concrete to develop the effective prestress,” (ACI Committee
318). This distance is illustrated in Figure 2.2, which shows a theoretical strand stress profile at
6
the end of a prestressed specimen. The AASHTO LRFD design specifications require transfer
lengths equal to 60db, where db (in.) is the diameter of the strand (AASHTO 2004). The Chapter
11 ACI shear design guidelines, meanwhile, require transfer lengths equal to 50db (ACI
Committee 318). Additionally, ACI flexural guidelines calculate transfer length Lt as in Equation
2-1, where fpe is the effective prestress (ksi) and db is given in inches.
3
= pe bt
f dL (Eq. 2-1)
Development length is defined by the ACI as the transfer length plus “the additional
length over which the strand must be bonded so that a stress fps may develop in the strand at
nominal strength,” (ACI Committee 318). This is quantified in Equation 2-2, where fps is the
stress in the prestressed reinforcement at nominal strength (ksi), and fpe (ksi) and db (in.) were
previously defined. The second term in Eq. 2-2 is deemed the flexural bond length and is
illustrated in Figure 2.2.
( )3
= + −pe bd ps pe b
f dL f f d (Eq. 2-2)
Transfer Length
Distance from Free End
Strand Stress
Flexural Bond Length
Development Length
fps
fpe
Transfer Length
Distance from Free End
Strand Stress
Flexural Bond Length
Development Length
fps
fpe
Figure 2.2: Strand stress variation along beam length
7
Equation 2-2 was first incorporated in the 1963 ACI Building Code and was adopted by
AASHTO in 1973 (Buckner 1995). Later, Cousins et al. (1986) completed a study in which
experimental transfer and development lengths of uncoated, un-weathered strands were found to
exceed standard design predictions by a significant margin. As a result of this study and
recognizing code requirements for bond were based on tests using outdated materials, the Federal
Highway Administration (FHWA) issued a memorandum stating, among other items, that
development length shall be taken as 1.6 times that which is determined by Equation 2-2. The
1.6 factor was formally presented at a joint meeting between the AASHTO Technical Committee
for Prestressed Concrete and PCI Bridge Committee and, at present, remains in the AASHTO
LRFD (2004) specifications.
2.2.2 Analytical Transfer Length Equations
Numerous studies were conducted in the past with the aim of analytically predicting
transfer length of steel strands in NCC specimens. Analytical transfer length expressions from
select studies conducted over the past forty years are presented in Table 2.2. The equations
recommended by these studies were primarily derived using empirical data and suggest
modifications to Equations 2-1 and 2-2. Among the goals of this thesis was to assess the viability
of using these equations for prestressed SCC specimens, since no unique transfer length
provisions currently exist for SCC.
As Table 2.2 shows, transfer length expressions varied in part based on whether the initial
or effective prestress (i.e. fpi or fpe) was used. Five of the 15 references utilized fpe in their
analytical equations; the rest utilized fpi. As noted in literature, using the initial prestress may be
appropriate since transfer length is established when a specimen’s prestressing force is released
and does not significantly change thereafter (Marti-Vargas et al. 2007-b). Another parameter was
the concrete compressive strength at transfer f′ci. Three studies showed a correlation between f′ci
and Lt, three showed a correlation between √f′ci and Lt, and three utilized other relationships
between concrete strength and Lt.

8
Table 2.2: Analytical Transfer Length Formulas (in ksi and inch units unless noted otherwise)
Reference Lt Expression Notes & Limitations
Based on Hanson and Kaar (1959) 3
pe bt
f dL =
Olesniewicz (1975)
pet b
ci
fL d
fψ=
′ 10, averageψ = Lt
Zia and Mostafa (1977)
1.54.6= −
′pi b
tci
f dL
f f′ci = 2-8 ksi
Nijhawam (1978)
0.6910.3= +
′pi b
tci
f dL
f
Cousins et al. (1990)
0.5π
⎛ ⎞′ ′= +⎜ ⎟⎜ ⎟ ′ ′⎝ ⎠
pe pt cit
b t ci
f AU fL
B d U f
Concrete strengths in psi; U′t = 6.7 for uncoated strands;
B = bond modulus (psi/in)
Bruggeling and Huyghe (1991)
712(0.13)
pi wt
ci
f dL
f=
′ dw = 0.33db for 0.5-in., 7-wire
strand
Balazs (1992)
3
52=′pi
t bci
fL Kd
f K = 4.64 ksi(-1/5), average Lt
Shahawy et al. (1992) Deatherage et al. (1994)
Buckner (1995) 3pi b
t
f dL =
Mitchell et al. (1993)
30.33=′t pi b
ci
L f df
f′ci = 3.05-7.25 ksi
Russell and Burns (1996) 2
pe bt
f dL =
Tadros and Baishya (1996) 0.8(3.04)
pe bt
f dL =
Mahmoud et al. (1999) 0.67
pi bt
t ci
f dL
fα=
′ αt = 1.269 for steel strands
Marti-Vargas et al. (2007-b) 0.670.282
ψπ
=′
pi pt
b ci
f AL
d f 1, averageψ = Lt
9
2.3 EXPERIMENTAL TEST METHODS
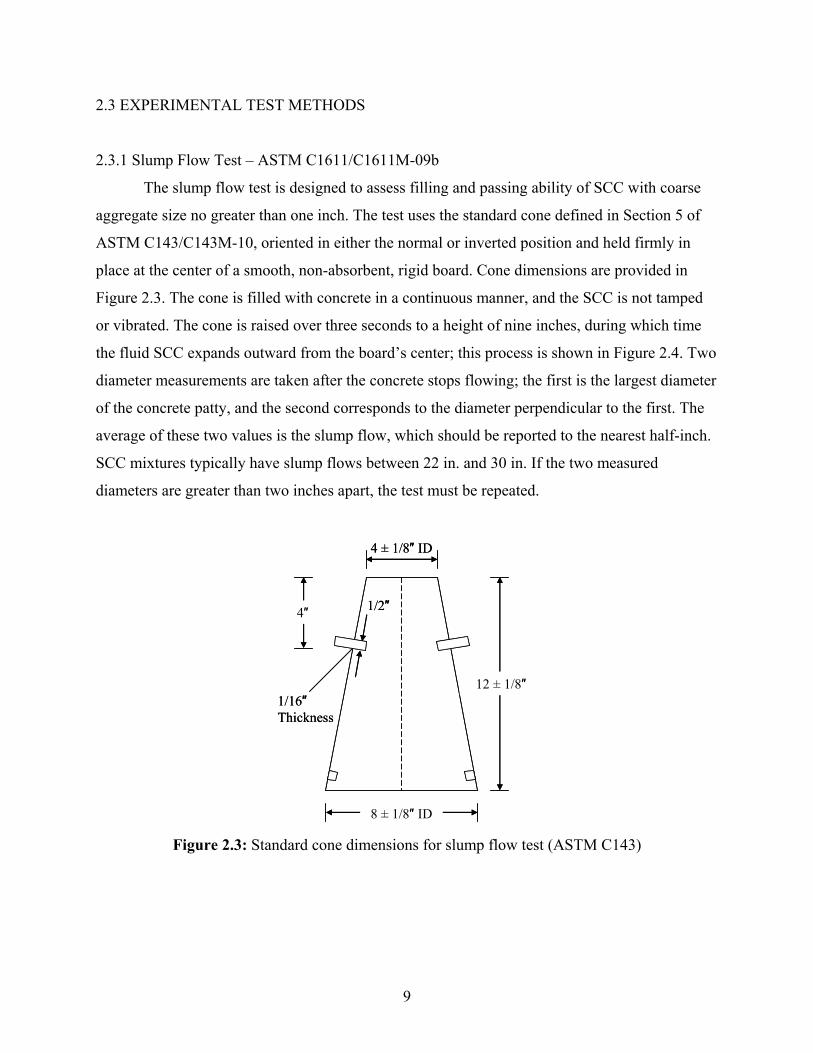
2.3.1 Slump Flow Test – ASTM C1611/C1611M-09b
The slump flow test is designed to assess filling and passing ability of SCC with coarse
aggregate size no greater than one inch. The test uses the standard cone defined in Section 5 of
ASTM C143/C143M-10, oriented in either the normal or inverted position and held firmly in
place at the center of a smooth, non-absorbent, rigid board. Cone dimensions are provided in
Figure 2.3. The cone is filled with concrete in a continuous manner, and the SCC is not tamped
or vibrated. The cone is raised over three seconds to a height of nine inches, during which time
the fluid SCC expands outward from the board’s center; this process is shown in Figure 2.4. Two
diameter measurements are taken after the concrete stops flowing; the first is the largest diameter
of the concrete patty, and the second corresponds to the diameter perpendicular to the first. The
average of these two values is the slump flow, which should be reported to the nearest half-inch.
SCC mixtures typically have slump flows between 22 in. and 30 in. If the two measured
diameters are greater than two inches apart, the test must be repeated.
8 ± 1/8″ ID
12 ± 1/8″
4 ± 1/8″ ID
4″ 1/2″
1/16″Thickness
8 ± 1/8″ ID
12 ± 1/8″
4 ± 1/8″ ID
4″ 1/2″
1/16″Thickness
Figure 2.3: Standard cone dimensions for slump flow test (ASTM C143)
10
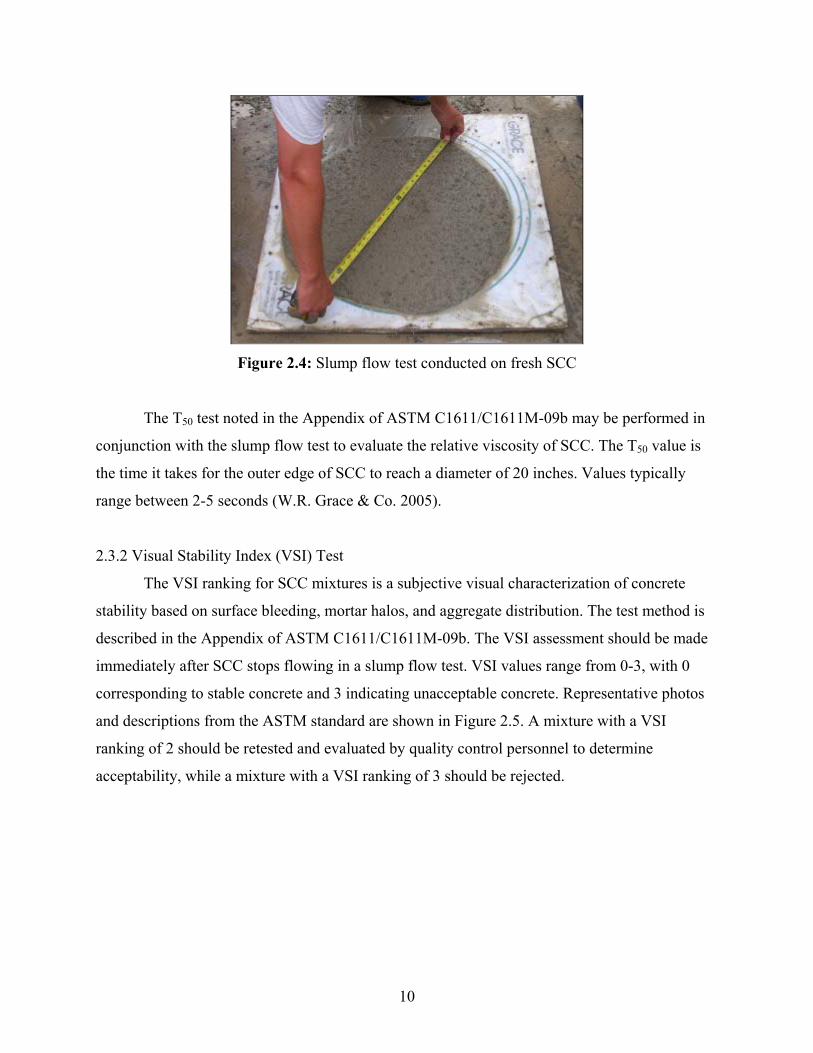
Figure 2.4: Slump flow test conducted on fresh SCC
The T50 test noted in the Appendix of ASTM C1611/C1611M-09b may be performed in
conjunction with the slump flow test to evaluate the relative viscosity of SCC. The T50 value is
the time it takes for the outer edge of SCC to reach a diameter of 20 inches. Values typically
range between 2-5 seconds (W.R. Grace & Co. 2005).
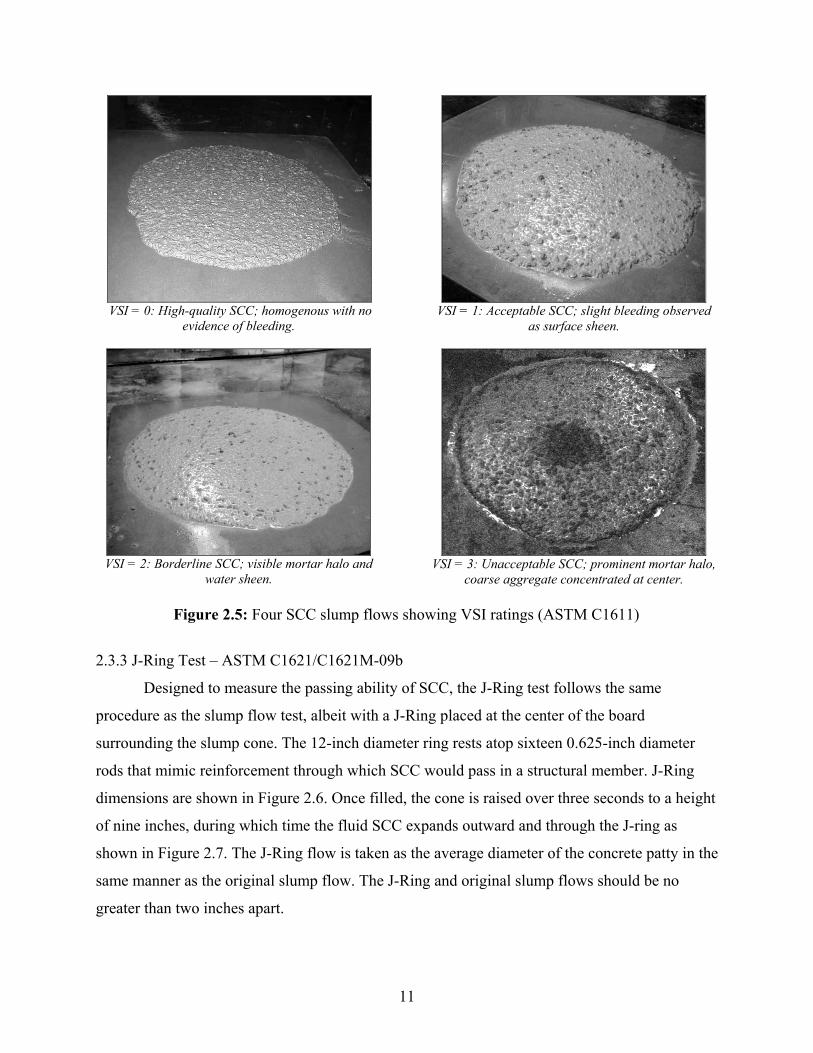
2.3.2 Visual Stability Index (VSI) Test
The VSI ranking for SCC mixtures is a subjective visual characterization of concrete
stability based on surface bleeding, mortar halos, and aggregate distribution. The test method is
described in the Appendix of ASTM C1611/C1611M-09b. The VSI assessment should be made
immediately after SCC stops flowing in a slump flow test. VSI values range from 0-3, with 0
corresponding to stable concrete and 3 indicating unacceptable concrete. Representative photos
and descriptions from the ASTM standard are shown in Figure 2.5. A mixture with a VSI
ranking of 2 should be retested and evaluated by quality control personnel to determine
acceptability, while a mixture with a VSI ranking of 3 should be rejected.
11
VSI = 0: High-quality SCC; homogenous with no
evidence of bleeding.
VSI = 2: Borderline SCC; visible mortar halo and
water sheen.
VSI = 1: Acceptable SCC; slight bleeding observed
as surface sheen.
VSI = 3: Unacceptable SCC; prominent mortar halo,
coarse aggregate concentrated at center.
Figure 2.5: Four SCC slump flows showing VSI ratings (ASTM C1611)
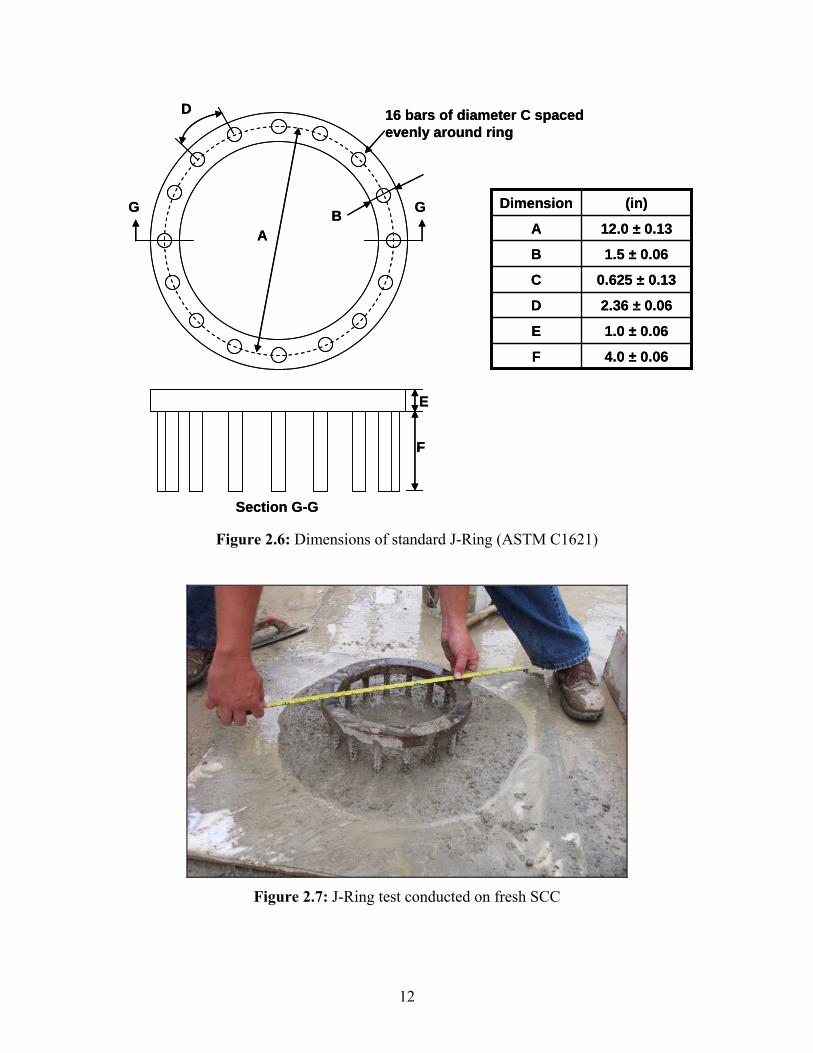
2.3.3 J-Ring Test – ASTM C1621/C1621M-09b
Designed to measure the passing ability of SCC, the J-Ring test follows the same
procedure as the slump flow test, albeit with a J-Ring placed at the center of the board
surrounding the slump cone. The 12-inch diameter ring rests atop sixteen 0.625-inch diameter
rods that mimic reinforcement through which SCC would pass in a structural member. J-Ring
dimensions are shown in Figure 2.6. Once filled, the cone is raised over three seconds to a height
of nine inches, during which time the fluid SCC expands outward and through the J-ring as
shown in Figure 2.7. The J-Ring flow is taken as the average diameter of the concrete patty in the
same manner as the original slump flow. The J-Ring and original slump flows should be no
greater than two inches apart.
12
GG B
16 bars of diameter C spaced evenly around ring
D
A
E
F
Section G-G
GG B
16 bars of diameter C spaced evenly around ring
D
A
E
F
Section G-G
4.0 ± 0.06F
1.0 ± 0.06E
2.36 ± 0.06D
0.625 ± 0.13C
1.5 ± 0.06B
12.0 ± 0.13A
(in)Dimension
4.0 ± 0.06F
1.0 ± 0.06E
2.36 ± 0.06D
0.625 ± 0.13C
1.5 ± 0.06B
12.0 ± 0.13A
(in)Dimension
Figure 2.6: Dimensions of standard J-Ring (ASTM C1621)
Figure 2.7: J-Ring test conducted on fresh SCC

13
2.3.4 L-Box Test
In the same spirit as the J-Ring test, the L-box test assesses the filling and passing ability
of SCC. A typical L-box is shown in Figure 2.8 and comprises a vertical column separated from
a horizontal box by a movable gate and reinforcement bars. The rebar configuration near the gate
should represent the reinforcement expected in the specimens for which the SCC is being mixed.
The horizontal portion of the L-box is approximately 32 inches long and 8 inches wide, while the
vertical column is 4 inches wide.
Figure 2.8: L-box test conducted on fresh SCC
With the gate closed, the vertical L-box column is filled with concrete in a continuous
manner; the concrete is not tamped or vibrated. After removing the gate, the concrete height at
the end of the horizontal box is compared to the concrete height at the beginning of the
horizontal box. The ratio between end and beginning heights should be greater than 75%. Visual
inspection is also used to assess aggregate distribution and SCC passing ability.
2.3.5 Modified Moustafa Pullout Test
The PCI recommends the Moustafa pullout test to qualify bond characteristics of strands
embedded in concrete as satisfactory (PCI 2003-a). Moustafa first performed pullout tests on
lifting loop strands in 1974, considering 3/8-inch, 7/16-inch, and 1/2-inch diameter strands with
14
embedment lengths between 12-30 inches (Moustafa 1974). Each strand was loaded by hydraulic
jacks, and the relative displacement between concrete and strand was monitored throughout
loading until failure occurred. Since no bond quality standard exists for prestressing strands,
Moustafa’s method was adopted with slight modifications in subsequent research by Rose and
Russell (1996) and Logan (1997) to study bond performance of strands intended for pretensioned
applications. For consistency, the latter studies used 0.5-in. diameter strands embedded 18 inches
in large block specimens. The pullout test is attractive given its simplicity and relatively low
cost.
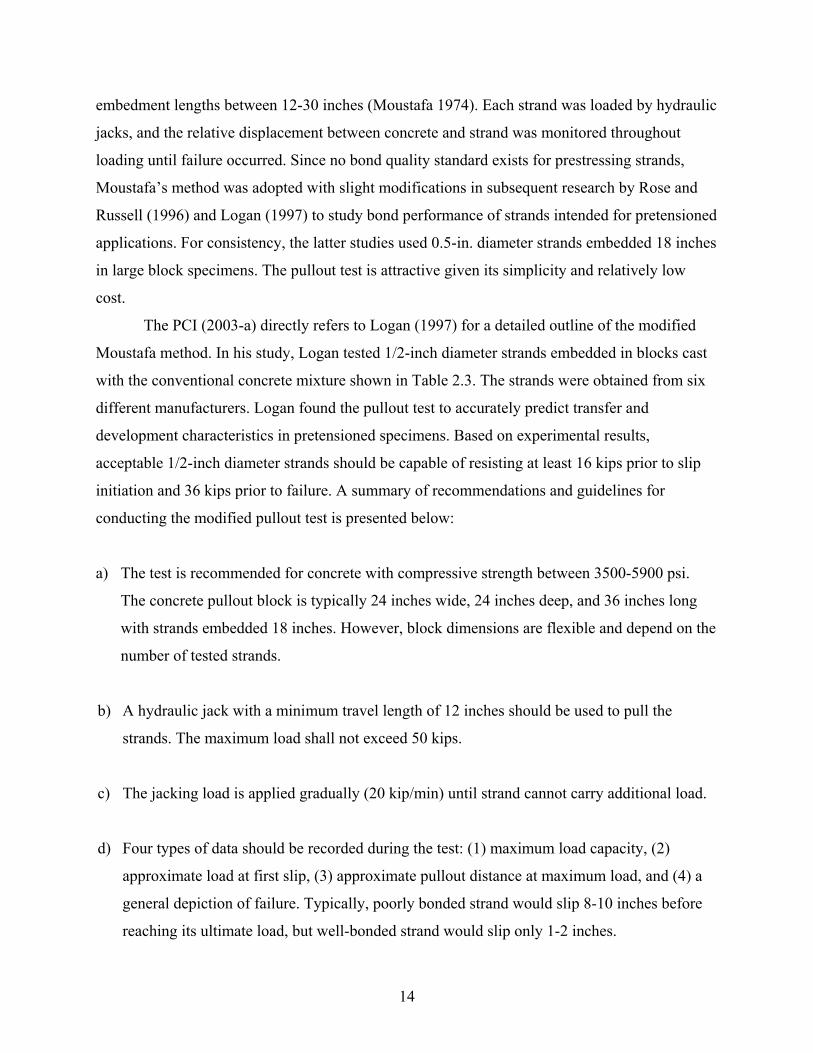
The PCI (2003-a) directly refers to Logan (1997) for a detailed outline of the modified
Moustafa method. In his study, Logan tested 1/2-inch diameter strands embedded in blocks cast
with the conventional concrete mixture shown in Table 2.3. The strands were obtained from six
different manufacturers. Logan found the pullout test to accurately predict transfer and
development characteristics in pretensioned specimens. Based on experimental results,
acceptable 1/2-inch diameter strands should be capable of resisting at least 16 kips prior to slip
initiation and 36 kips prior to failure. A summary of recommendations and guidelines for
conducting the modified pullout test is presented below:
a) The test is recommended for concrete with compressive strength between 3500-5900 psi.
The concrete pullout block is typically 24 inches wide, 24 inches deep, and 36 inches long
with strands embedded 18 inches. However, block dimensions are flexible and depend on the
number of tested strands.
b) A hydraulic jack with a minimum travel length of 12 inches should be used to pull the
strands. The maximum load shall not exceed 50 kips.
c) The jacking load is applied gradually (20 kip/min) until strand cannot carry additional load.
d) Four types of data should be recorded during the test: (1) maximum load capacity, (2)
approximate load at first slip, (3) approximate pullout distance at maximum load, and (4) a
general depiction of failure. Typically, poorly bonded strand would slip 8-10 inches before
reaching its ultimate load, but well-bonded strand would slip only 1-2 inches.

15
e) The test should be repeated as many times as needed and the data obtained should be used to
compute an average failure load and standard deviation for each strand group.
Table 2.3: Normally-Consolidated Concrete Mixture from Logan (1997)
Material Quantity (per yd3)Type III Cement 660 lbs Crushed Gravel 1900 lbs
Sand 1100 lbs Water Reducer 26 oz.
Water 35 gal W/C Ratio 0.44
2.3.6 Transfer Length via 95% Average Maximum Strain Method (95% AMS)
Two methods are commonly used to experimentally measure transfer length: (1) the
“draw-in” or “end-slip” method, and (2) the 95% Average Maximum Strain method (Russell &
Burns 1993). The former method, which was not utilized in this study, calculates transfer length
based on the relative displacement between strand and concrete after prestress release at the free
ends of prestressed specimens; discussion of this method may be found in Balazs (1993) and
Marti-Vargas et al. (2007-a). The latter method, which was utilized in this study, measures
transfer length based on strain measurements throughout the transfer zone of a prestressed
specimen. The procedure for the 95% AMS is detailed as follows:
a) Prior to prestress release, target points are affixed within a transfer zone of a specimen. The
points are attached to the concrete surface at a depth equal to the strands’ center of gravity.
Initial measurements record the distance between each target point.
b) Immediately after prestress release and at any age thereafter, measurements are taken
between all target points to determine the strain profile within the transfer zone.
c) Data may be smoothed by taking the strain at point “a” as the average of the strains at three
adjacent points centered at “a” [e.g. εa, smooth = 1/3·∑ (εa-1, εa, εa+1)]. An example of raw and
smoothed strain data is shown in Figure 2.9.
16
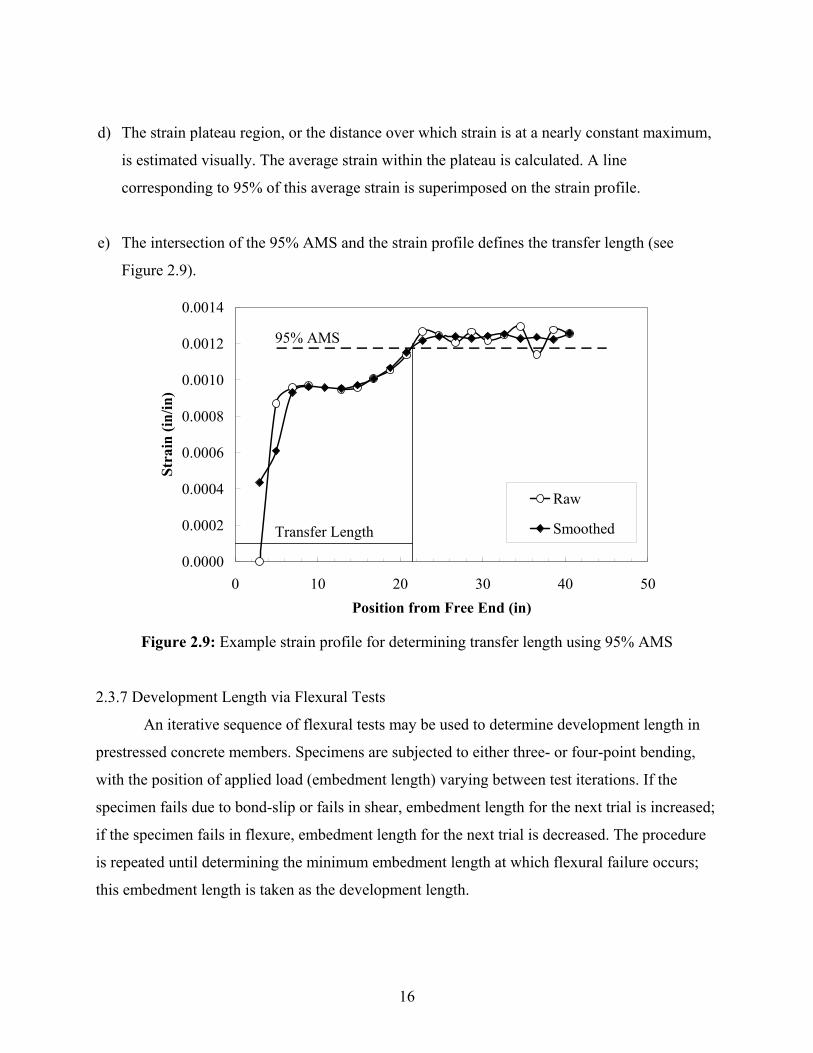
d) The strain plateau region, or the distance over which strain is at a nearly constant maximum,
is estimated visually. The average strain within the plateau is calculated. A line
corresponding to 95% of this average strain is superimposed on the strain profile.
e) The intersection of the 95% AMS and the strain profile defines the transfer length (see
Figure 2.9).
0.0000
0.0002
0.0004
0.0006
0.0008
0.0010
0.0012
0.0014
0 10 20 30 40 50Position from Free End (in)
Stra
in (i
n/in
)
Raw
SmoothedTransfer Length
95% AMS
Figure 2.9: Example strain profile for determining transfer length using 95% AMS
2.3.7 Development Length via Flexural Tests
An iterative sequence of flexural tests may be used to determine development length in
prestressed concrete members. Specimens are subjected to either three- or four-point bending,
with the position of applied load (embedment length) varying between test iterations. If the
specimen fails due to bond-slip or fails in shear, embedment length for the next trial is increased;
if the specimen fails in flexure, embedment length for the next trial is decreased. The procedure
is repeated until determining the minimum embedment length at which flexural failure occurs;
this embedment length is taken as the development length.

17
2.4 TRANSFER AND DEVELOPMENT LENGTH TESTS ON SCC SPECIMENS
Recent studies investigating bond behavior in prestressed SCC members have focused on
comparing experimental data from SCC specimens to data from conventionally-consolidated
concrete specimens and current code provisions. The rest of this chapter summarizes the
pertinent findings of these studies. A more extensive literature review of these studies was
previously conducted by Andrawes et al. (2009).
2.4.1 Kansas State University
Sponsored by the Kansas Department of Transportation, this project aimed to
characterize properties of pretensioned SCC bridge girders via pullout tests, transfer length tests,
and development length tests (Larson et al. 2007). Pullout tests were conducted on 0.5-in.
diameter strands embedded in blocks cast with a conventional concrete mixture utilized by
Logan (1997). Meeting Logan’s suggested criteria, the strands were deemed adequate for use in
flexural test specimens.
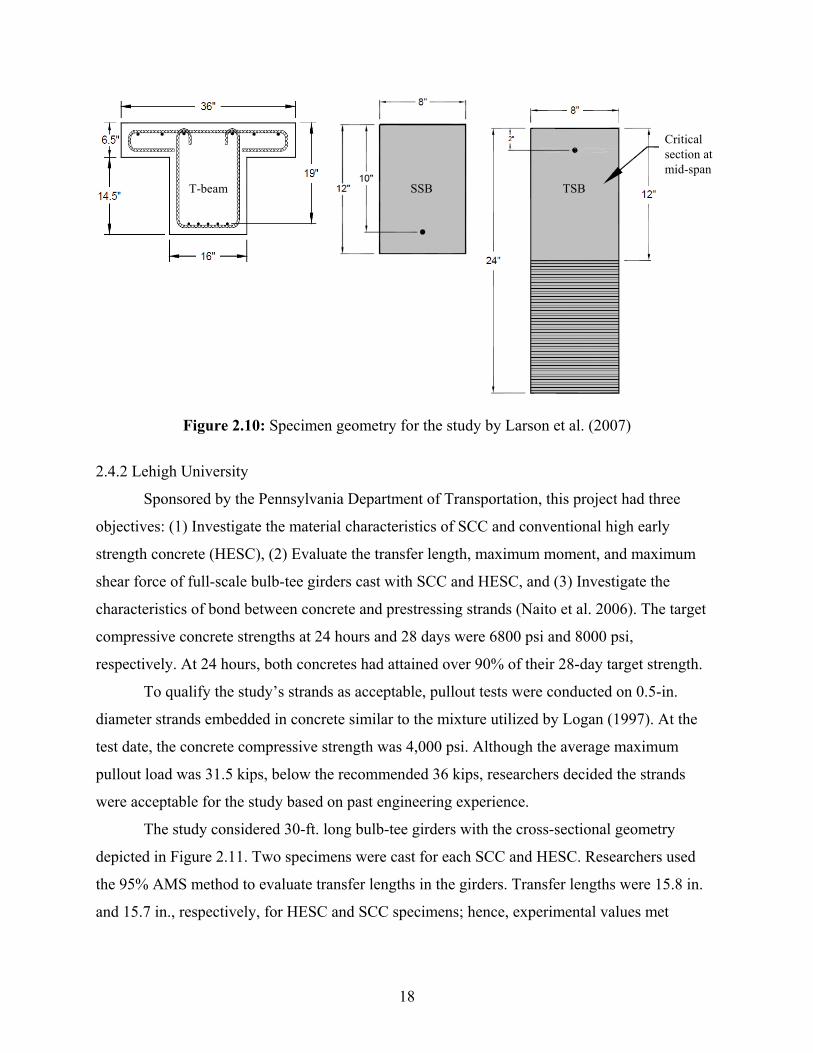
The study considered small-scale rectangular beams with one bottom strand (SSB) or one
top strand (TSB), as well as 21-in. deep T-beams, all of which were cast with SCC. Specimen
geometry is presented in Figure 2.10. Span lengths for the rectangular and T-beams were 13.2 ft.
and 15.5 ft., respectively. Transfer lengths were obtained using the end-slip method immediately
after strand release, 18 days after release, and on the flexural testing day for each specimen.
Average transfer lengths in the three specimen types were below the AASHTO requirement at all
ages. However, average transfer lengths in TSB and T-beam specimens exceeded the ACI
requirement for measurements taken after 18 days past prestress release.
Four-point bending tests were conducted to determine the flexural behavior of the beams.
Strand embedment lengths equal to the code-predicted development length produced flexural
failures. Subsequent flexural failures using shorter embedment lengths demonstrated that
development lengths in the small-scale SCC specimens were 80% of the ACI/AASHTO
predictions. No top-strand effect was observed in development length tests.
18
Critical section at mid-span
T-beam SSB TSB
Critical section at mid-span
Critical section at mid-span
T-beam SSB TSB
Figure 2.10: Specimen geometry for the study by Larson et al. (2007)
2.4.2 Lehigh University
Sponsored by the Pennsylvania Department of Transportation, this project had three
objectives: (1) Investigate the material characteristics of SCC and conventional high early
strength concrete (HESC), (2) Evaluate the transfer length, maximum moment, and maximum
shear force of full-scale bulb-tee girders cast with SCC and HESC, and (3) Investigate the
characteristics of bond between concrete and prestressing strands (Naito et al. 2006). The target
compressive concrete strengths at 24 hours and 28 days were 6800 psi and 8000 psi,
respectively. At 24 hours, both concretes had attained over 90% of their 28-day target strength.
To qualify the study’s strands as acceptable, pullout tests were conducted on 0.5-in.
diameter strands embedded in concrete similar to the mixture utilized by Logan (1997). At the
test date, the concrete compressive strength was 4,000 psi. Although the average maximum
pullout load was 31.5 kips, below the recommended 36 kips, researchers decided the strands
were acceptable for the study based on past engineering experience.
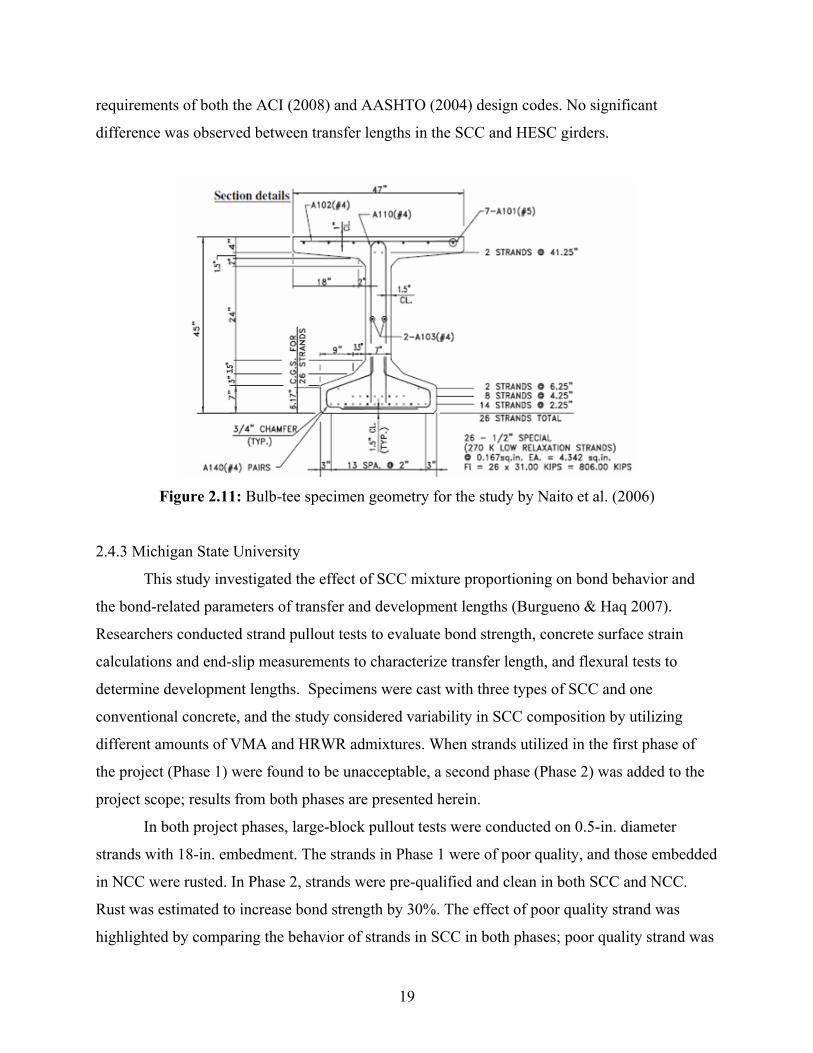
The study considered 30-ft. long bulb-tee girders with the cross-sectional geometry
depicted in Figure 2.11. Two specimens were cast for each SCC and HESC. Researchers used
the 95% AMS method to evaluate transfer lengths in the girders. Transfer lengths were 15.8 in.
and 15.7 in., respectively, for HESC and SCC specimens; hence, experimental values met
19
requirements of both the ACI (2008) and AASHTO (2004) design codes. No significant
difference was observed between transfer lengths in the SCC and HESC girders.
Figure 2.11: Bulb-tee specimen geometry for the study by Naito et al. (2006)
2.4.3 Michigan State University
This study investigated the effect of SCC mixture proportioning on bond behavior and
the bond-related parameters of transfer and development lengths (Burgueno & Haq 2007).
Researchers conducted strand pullout tests to evaluate bond strength, concrete surface strain
calculations and end-slip measurements to characterize transfer length, and flexural tests to
determine development lengths. Specimens were cast with three types of SCC and one
conventional concrete, and the study considered variability in SCC composition by utilizing
different amounts of VMA and HRWR admixtures. When strands utilized in the first phase of
the project (Phase 1) were found to be unacceptable, a second phase (Phase 2) was added to the
project scope; results from both phases are presented herein.
In both project phases, large-block pullout tests were conducted on 0.5-in. diameter
strands with 18-in. embedment. The strands in Phase 1 were of poor quality, and those embedded
in NCC were rusted. In Phase 2, strands were pre-qualified and clean in both SCC and NCC.
Rust was estimated to increase bond strength by 30%. The effect of poor quality strand was
highlighted by comparing the behavior of strands in SCC in both phases; poor quality strand was

20
found to have 103% lower bond strength than the pre-qualified strand. Removing the effects of
rust and poor quality, researchers observed lower bond strength in SCC than in NCC.
All girders utilized for transfer and development length tests were 38-ft. long T-beams
with the cross-section shown in Figure 2.12. The girders included two 0.5-in. diameter low-
relaxation bottom strands, two #4 reinforcing bars within the top flange, and lateral stirrups
placed every 12 inches throughout the entire span. Researchers used the 95% AMS and end-slip
methods to evaluate transfer length. By comparing results from the two project phases, poor
strand quality was estimated to increase transfer length by 17%. The effect of rust on transfer
length was negligible. On average, SCC mixtures yielded transfer lengths which were 36%
longer than in the NCC, though they were less than the value required by the ACI (2008).
Iterative flexural tests were conducted to determine the development length of strands in
the girders. Because trials were limited, an ideal development length was linearly extrapolated
for each concrete mix using test results and the beams’ nominal moment capacities. Again,
effects of rust and strand quality were removed prior to comparing results from both phases.
Development lengths in SCC specimens were approximately 3% longer than those in NCC
specimens; excluding one value, they all met ACI criteria. Additionally, the effect of SCC
mixture proportioning was evident; the SCC with the highest fine aggregate content and lowest
w/c ratio had the worst bond performance, while the SCC with the highest coarse aggregate
content and highest w/c ratio had the best bond performance.
Figure 2.12: Girder cross-section for the study by Burgueno and Haq (2007)
21
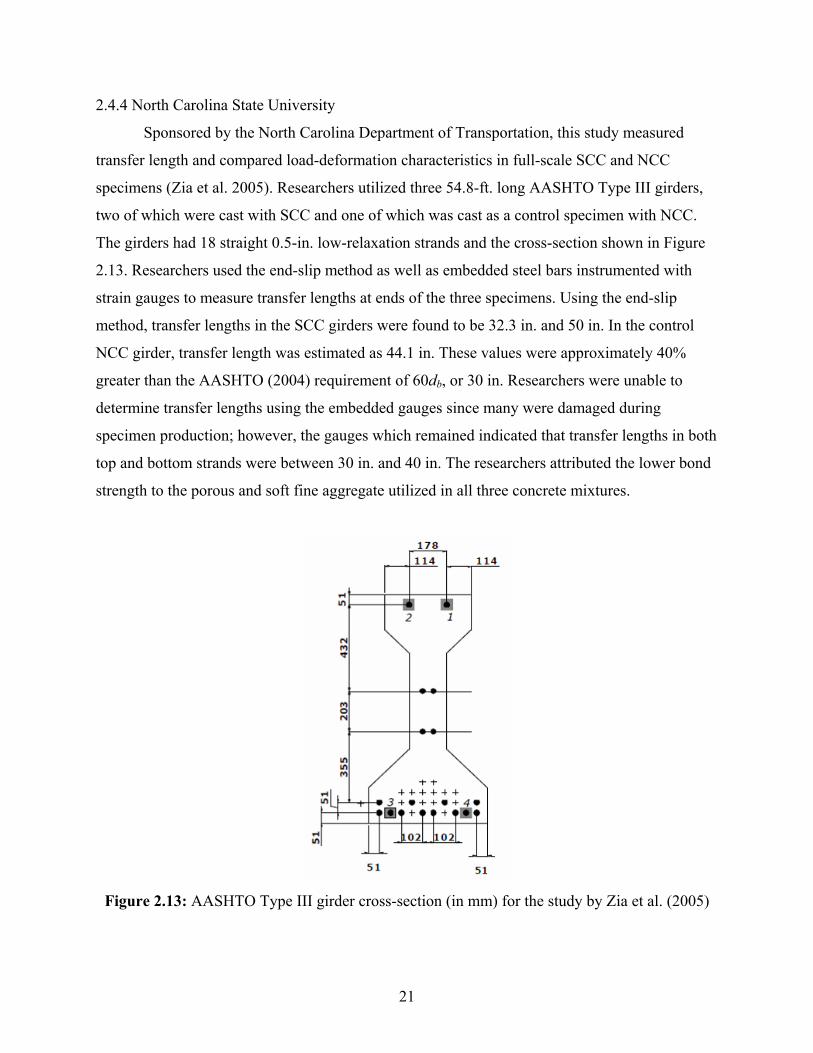
2.4.4 North Carolina State University
Sponsored by the North Carolina Department of Transportation, this study measured
transfer length and compared load-deformation characteristics in full-scale SCC and NCC
specimens (Zia et al. 2005). Researchers utilized three 54.8-ft. long AASHTO Type III girders,
two of which were cast with SCC and one of which was cast as a control specimen with NCC.
The girders had 18 straight 0.5-in. low-relaxation strands and the cross-section shown in Figure
2.13. Researchers used the end-slip method as well as embedded steel bars instrumented with
strain gauges to measure transfer lengths at ends of the three specimens. Using the end-slip
method, transfer lengths in the SCC girders were found to be 32.3 in. and 50 in. In the control
NCC girder, transfer length was estimated as 44.1 in. These values were approximately 40%
greater than the AASHTO (2004) requirement of 60db, or 30 in. Researchers were unable to
determine transfer lengths using the embedded gauges since many were damaged during
specimen production; however, the gauges which remained indicated that transfer lengths in both
top and bottom strands were between 30 in. and 40 in. The researchers attributed the lower bond
strength to the porous and soft fine aggregate utilized in all three concrete mixtures.
Figure 2.13: AASHTO Type III girder cross-section (in mm) for the study by Zia et al. (2005)
22
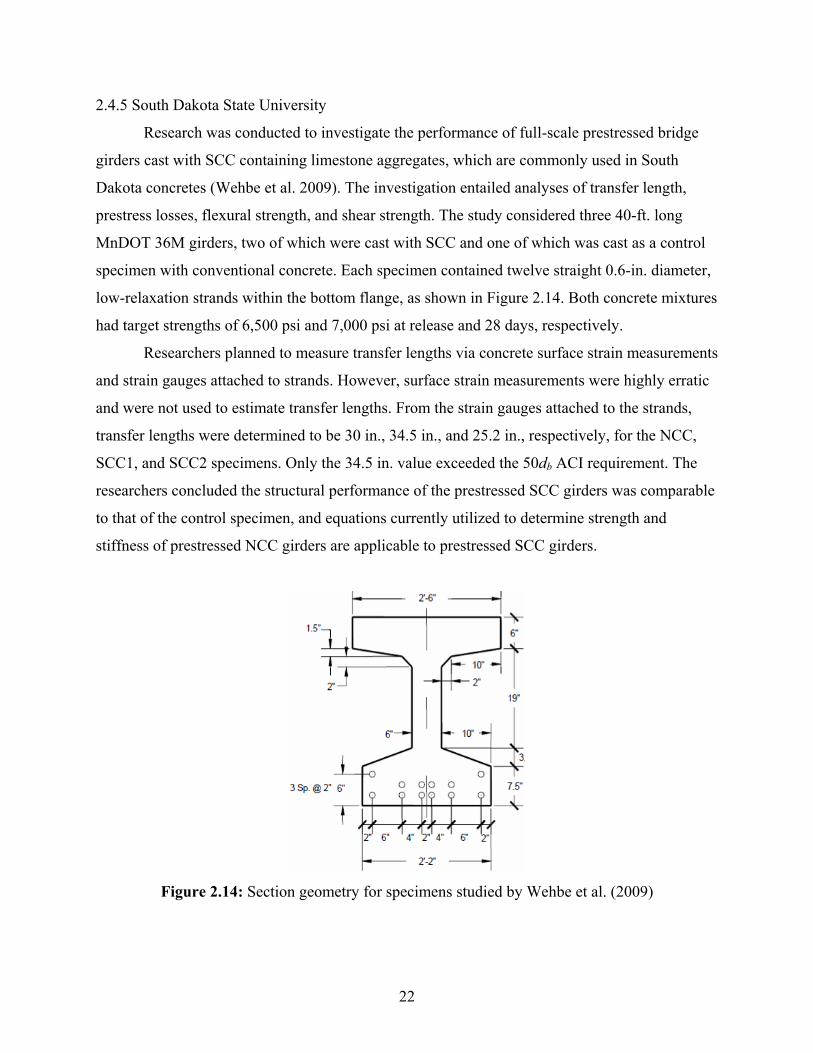
2.4.5 South Dakota State University
Research was conducted to investigate the performance of full-scale prestressed bridge
girders cast with SCC containing limestone aggregates, which are commonly used in South
Dakota concretes (Wehbe et al. 2009). The investigation entailed analyses of transfer length,
prestress losses, flexural strength, and shear strength. The study considered three 40-ft. long
MnDOT 36M girders, two of which were cast with SCC and one of which was cast as a control
specimen with conventional concrete. Each specimen contained twelve straight 0.6-in. diameter,
low-relaxation strands within the bottom flange, as shown in Figure 2.14. Both concrete mixtures
had target strengths of 6,500 psi and 7,000 psi at release and 28 days, respectively.
Researchers planned to measure transfer lengths via concrete surface strain measurements
and strain gauges attached to strands. However, surface strain measurements were highly erratic
and were not used to estimate transfer lengths. From the strain gauges attached to the strands,
transfer lengths were determined to be 30 in., 34.5 in., and 25.2 in., respectively, for the NCC,
SCC1, and SCC2 specimens. Only the 34.5 in. value exceeded the 50db ACI requirement. The
researchers concluded the structural performance of the prestressed SCC girders was comparable
to that of the control specimen, and equations currently utilized to determine strength and
stiffness of prestressed NCC girders are applicable to prestressed SCC girders.
Figure 2.14: Section geometry for specimens studied by Wehbe et al. (2009)

23
2.4.6 University of Arkansas at Fayetteville
This project evaluated the transfer lengths of prestressing strands in SCC beams and
compared them to ACI and AASHTO recommended values and transfer lengths in conventional
concrete (Staton et al. 2009). The study utilized SCC with target strengths of 7000 psi at
prestress release and 12000 psi at 28 days. Twelve 18-ft. long prestressed beams were cast; half
used SCC and half used conventional concrete. The rectangular cross-section for the beams is
shown in Figure 2.15; each beam had two 0.6-in. diameter bottom strands and two #6 bars in the
compression zone.
Researchers used the 95% AMS method to measure transfer length. Additionally,
vibrating wires were placed between the strands at each end of the beam to confirm the results
from the strain gauges. A 2-10% difference was observed between the 95% AMS readings and
the vibrating wire results. The measured transfer lengths in all six beams cast with SCC satisfied
the ACI code requirement by a margin of 33% and the AASHTO code requirement by a margin
of 44%. Transfer lengths did not vary significantly over time after three 3 days of prestress
release; thus, the researchers suggested compressive strength had minor impact on transfer
length.
Figure 2.15: Specimen geometry for the study by Staton et al. (2009)
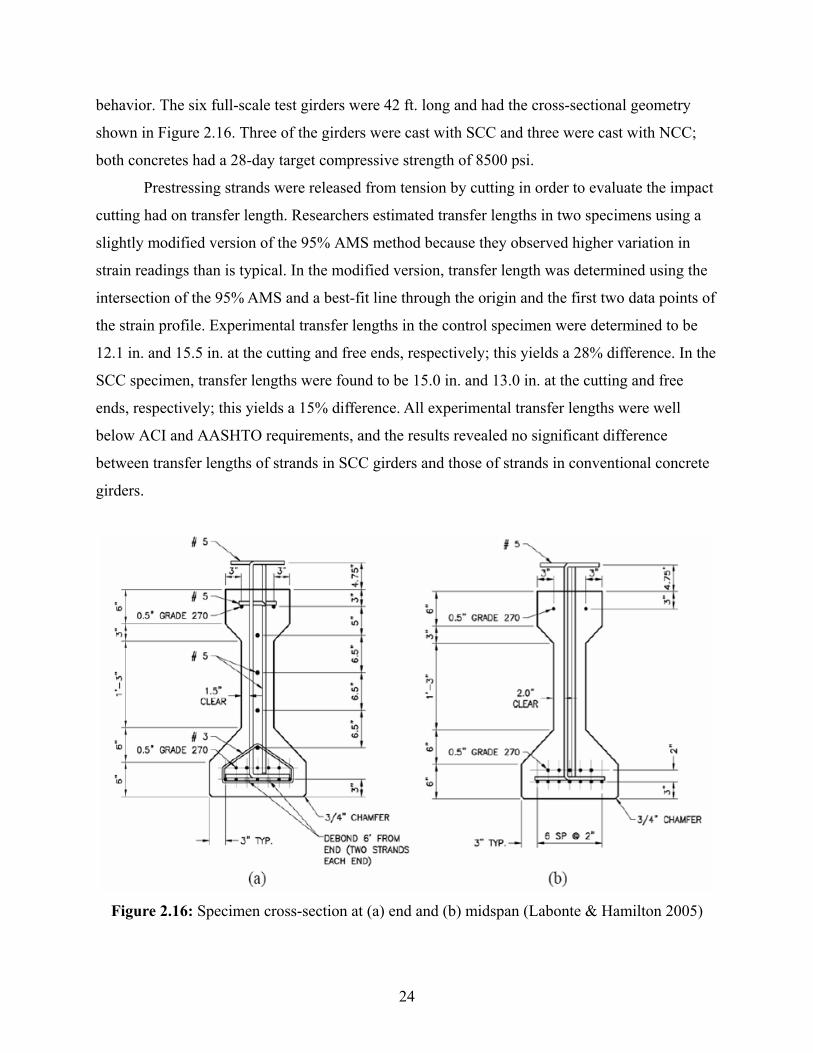
2.4.7 University of Florida
The Florida Department of Transportation sponsored a research project to compare the
structural performance of AASHTO Type II bridge girders cast with SCC to those cast with
conventional concrete (Labonte & Hamilton 2005). The project entailed analyses of production
methods, plastic and hardened mixture properties, transfer length, and shear and flexural
24
behavior. The six full-scale test girders were 42 ft. long and had the cross-sectional geometry
shown in Figure 2.16. Three of the girders were cast with SCC and three were cast with NCC;
both concretes had a 28-day target compressive strength of 8500 psi.
Prestressing strands were released from tension by cutting in order to evaluate the impact
cutting had on transfer length. Researchers estimated transfer lengths in two specimens using a
slightly modified version of the 95% AMS method because they observed higher variation in
strain readings than is typical. In the modified version, transfer length was determined using the
intersection of the 95% AMS and a best-fit line through the origin and the first two data points of
the strain profile. Experimental transfer lengths in the control specimen were determined to be
12.1 in. and 15.5 in. at the cutting and free ends, respectively; this yields a 28% difference. In the
SCC specimen, transfer lengths were found to be 15.0 in. and 13.0 in. at the cutting and free
ends, respectively; this yields a 15% difference. All experimental transfer lengths were well
below ACI and AASHTO requirements, and the results revealed no significant difference
between transfer lengths of strands in SCC girders and those of strands in conventional concrete
girders.
Figure 2.16: Specimen cross-section at (a) end and (b) midspan (Labonte & Hamilton 2005)
25
2.4.8 University of Nebraska-Lincoln
The Nebraska Department of Roads sponsored a research project to assess bond strength
of SCC and transfer length of strands in pretensioned SCC bridge girders (Girgis & Tuan 2005).
Researchers considered concrete mixtures and girder specimens used in three bridge projects;
Mix #1 was an SCC used in the Oak Creek Bridge in Lancaster, NE, Mix #2 was an SCC used in
the Clarks South Bridge in Merrick, NE, and Mix #3 was a conventional concrete used in the
North Broadway Bridge in Sedgwick, KS.
The research team conducted Moustafa pullout tests on 0.6-in. diameter strands
embedded 18-in. in large block specimens cast with the three concretes. At early ages, Mix #1,
Mix #2, and Mix #3 had 43.4-kip, 54.2-kip, and 48-kip maximum pullout forces, respectively. At
28 days, Mix #2 and Mix #3 had maximum pullout loads of 65.7 kips and 63.1 kips, respectively.
To compare results to the 36-kip minimum proposed by Logan (1997) for 0.5-in. diameter
strands, researchers adopted a multiplier based on the ratio of strand diameters. This resulted in a
benchmark pullout value of 43.2 kip, which all pullout loads exceeded.
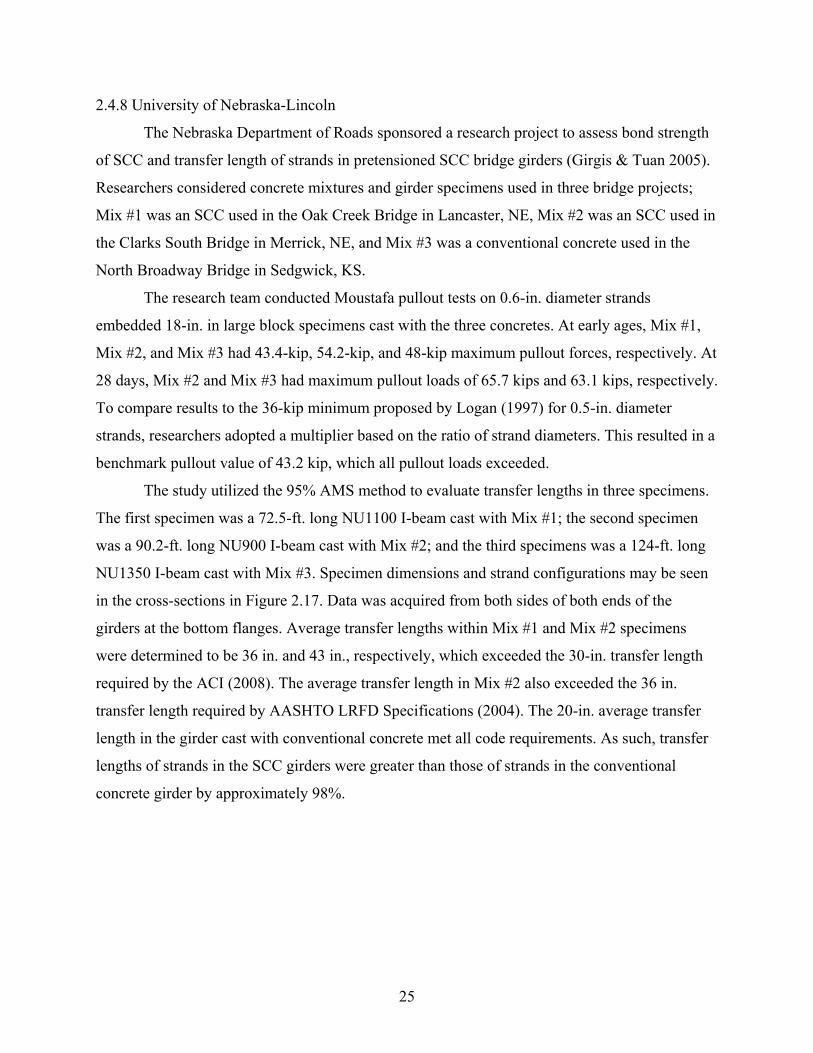
The study utilized the 95% AMS method to evaluate transfer lengths in three specimens.
The first specimen was a 72.5-ft. long NU1100 I-beam cast with Mix #1; the second specimen
was a 90.2-ft. long NU900 I-beam cast with Mix #2; and the third specimens was a 124-ft. long
NU1350 I-beam cast with Mix #3. Specimen dimensions and strand configurations may be seen
in the cross-sections in Figure 2.17. Data was acquired from both sides of both ends of the
girders at the bottom flanges. Average transfer lengths within Mix #1 and Mix #2 specimens
were determined to be 36 in. and 43 in., respectively, which exceeded the 30-in. transfer length
required by the ACI (2008). The average transfer length in Mix #2 also exceeded the 36 in.
transfer length required by AASHTO LRFD Specifications (2004). The 20-in. average transfer
length in the girder cast with conventional concrete met all code requirements. As such, transfer
lengths of strands in the SCC girders were greater than those of strands in the conventional
concrete girder by approximately 98%.

26
Height: 43.3″
Web width: 5.9″
Strands: 14 straight, 2 harped, 4 top with 0.6″ diam.
Mix: #1 (SCC)
Height: 35.4″
Web width: 5.9″
Strands: 26 straight, 8 harped, 4 top with 0.6″ diam.
Mix: #2 (SCC)
Height: 53.6″
Web width: 5.9″
Strands: 44 straight, 10 harped, 4 top with 0.5″ diam.
Mix: #3 (NCC)
Height: 43.3″
Web width: 5.9″
Strands: 14 straight, 2 harped, 4 top with 0.6″ diam.
Mix: #1 (SCC)
Height: 35.4″
Web width: 5.9″
Strands: 26 straight, 8 harped, 4 top with 0.6″ diam.
Mix: #2 (SCC)
Height: 53.6″
Web width: 5.9″
Strands: 44 straight, 10 harped, 4 top with 0.5″ diam.
Mix: #3 (NCC)
Figure 2.17: Transfer length specimens studied by Girgis and Tuan (2005)
2.4.9 Virginia Polytechnic Institute and State University
The Shockey Precast Group of Winchester, VA sponsored research to investigate bond
strength, transfer length, and development length of strands in SCC girders (Trent 2007). The
study considered three concrete mixtures, two of which were SCC (S1CCM, S1CCM2) and one
of which was conventional concrete (S1CRM). All concretes had target compressive strengths of
3500 psi at 12 hours and 6500 psi at 28 days.
The 95% ASM method was utilized to determine transfer lengths in three prestressed
specimens (one for each concrete mixture). The specimens had 6-in. square cross-sections with a
single 9/16-inch diameter, 270-ksi low relaxation strand. Upon prestress release, the two edge
specimens (S1CRM and S1CCM2) absorbed most of the energy before force transferred
gradually to the middle specimen (S1CCM). Experimental transfer lengths were compared to

27
values recommended by ACI (50db = 28.1 inches) and AASHTO (60db = 33.7 inches). Results
indicated two of three specimens (S1CRM and S1CCM) yielded acceptable transfer lengths.
However, transfer lengths in the third specimen (S1CCM2) exceeded ACI requirements at 7 and
28 days after transfer. The transfer length values of the strands used in the SCC specimens were
greater than those of strands in the conventional concrete specimen.
Twelve development length specimens were cast with the three concrete mixtures (four
specimens per mixture). Specimens were 24-ft. long and had a T-beam cross-section as shown in
Figure 2.18. An iterative scheme in which both ends of the specimens were subjected to flexural
testing produced 10 bond failures and 14 flexural failures. An end-slip value of 0.01 inches was
assumed as the threshold for defining a bond failure. Development lengths in the specimens cast
with either SCC mixture were approximately 80%-83% of recommended ACI/AASHTO values.
The study failed to determine a development length for the members cast with conventional
concrete.
Figure 2.18: Cross-section development length specimens (Trent 2007)
2.4.10 SCC Mix Designs from Previous Large-Scale Studies
U.S. State Departments of Transportation are continually establishing guidelines for
proper material proportioning to ensure adequate plastic and hardened behavior of new SCC
mixtures. However, these requirements may significantly vary between institutions. As a result,
the nine aforementioned studies tested specimens with fourteen different SCC mix compositions.
The SCC mixture designs are summarized in Table 2.4; constituents are shown as required for
one cubic yard of concrete. Nine of the mixtures in the table contained Type III cement, two

28
contained Type I/II cement, and three contained Type I cement. Type III cement is commonly
used in prestressed members because its high early strength permits quick turnover times in
fabrication plants. Four of the SCC mixtures also incorporated supplementary cementitious
materials such as fly ash and ground granulated blast-furnace slag.
The chemical additives included in the mixes in Table 2.4 varied considerably. For
instance, in the nine mixtures which utilized an air-entraining agent (AEA), the volume of AEA
ranged from 1.8 oz. to 22.3 oz. per cubic yard. In seven mixtures the volume of VMA ranged
from 10 oz. to 108 oz. per cubic yard. The amount of VMA is significant as it may adversely
affect bond (Girgis & Tuan 2005). Finally, the amount of superplasticizer in the mixes varied
from 14 oz. to 224 oz. per cubic yard. Where a dash is present in the table, either the SCC did not
contain a particular material or the literature did not report a specific value for that material (i.e.
the amount was indeterminate or varied between specimens and no range was presented).
Using results from earlier studies to predict bond adequacy of a proposed SCC mixture
may be unsound when the studies’ mixtures do not comply with standards applicable to the
proposed SCC. If compared to current provisions set forth by the IDOT Bureau of Materials and
Physical Research (2007), presented in Table 2.5, ten mixtures reported in the Table 2.4 would
exceed the maximum cement factor of 705 lbs per cubic yard, eight would exceed the 50% limit
for fine-to-total aggregate proportions, and three would have w/c ratios outside an allowable
0.32-0.44 range. Acknowledging this and recognizing the general need for further research on
large-scale prestressed SCC specimens, the Illinois DOT sponsored a study exploring the bond
behavior of strands in prestressed bridge girders cast with SCC adhering to current IDOT
provisions.

29
Table 2.4: SCC Mix Designs from Studies on Prestressed SCC Specimens
Constituent Units A B C D Type III III III III III III III Cement lbs 750 849 750 700 700 700 810
Fly Ash lbs - - - - - - - Coarse Agg. lbs 1360 1651 1479 1380 1380 1435 1330 Fine Agg. lbs 1500 1283 1628 1426 1426 1275 1300
Fine/Total Agg. 0.52 0.44 0.52 0.51 0.51 0.47 0.49 Water gal. 27 33 31 33 33 37 41
W/C Ratio 0.30 0.32 0.34 0.39 0.39 0.44 0.42 AEA oz. 5.0 2.0 13.1 5.3 12.3 22.3 2.4
HRWR oz. 70 136 97 102 84 108 81 VMA oz. - 16 - 49 13 108 -
Set Retardant oz. - - 525 - 410 327 32
Constituent Units E F G H I Type I/II I I/II III III I I Cement lbs 800 950 752 800 632 750 745
Fly Ash lbs - - 168 150 100 - - Coarse Agg. lbs 1454 1350 1307 1282 1311 1625 1650 Fine Agg. lbs 1343 1474 1414 1417 1449 1340 1308
Fine/Total Agg. 0.48 0.52 0.52 0.53 0.53 0.45 0.44 Water gal. 29 34 31 35 35 34 34
W/C Ratio 0.33 0.30 0.34 0.36 0.46 0.38 0.38 AEA oz. 15.0 - 1.8 - - - -
HRWR oz. 224 105 64 14 14 - - VMA oz. - 19 - 10 10 - -
Set Retardant oz. 24 - 14 5 5 - -
Legend A Larson et al. (2007) B Naito et al. (2006) C Burgueno and Haq (2007) D Zia et al. (2005) E Wehbe et al. (2009) F Staton et al. (2009) G Labonte and Hamilton (2005) H Girgis and Tuan (2005) I Trent (2007)
Table 2.5: IDOT SCC Mixture Requirements
Requirement Units Maximum Cement Factor lbs/cy 705
Maximum Fine/Total Agg. Ratio - 0.50 Allowable Range for W/C Ratio - 0.32-0.44
30
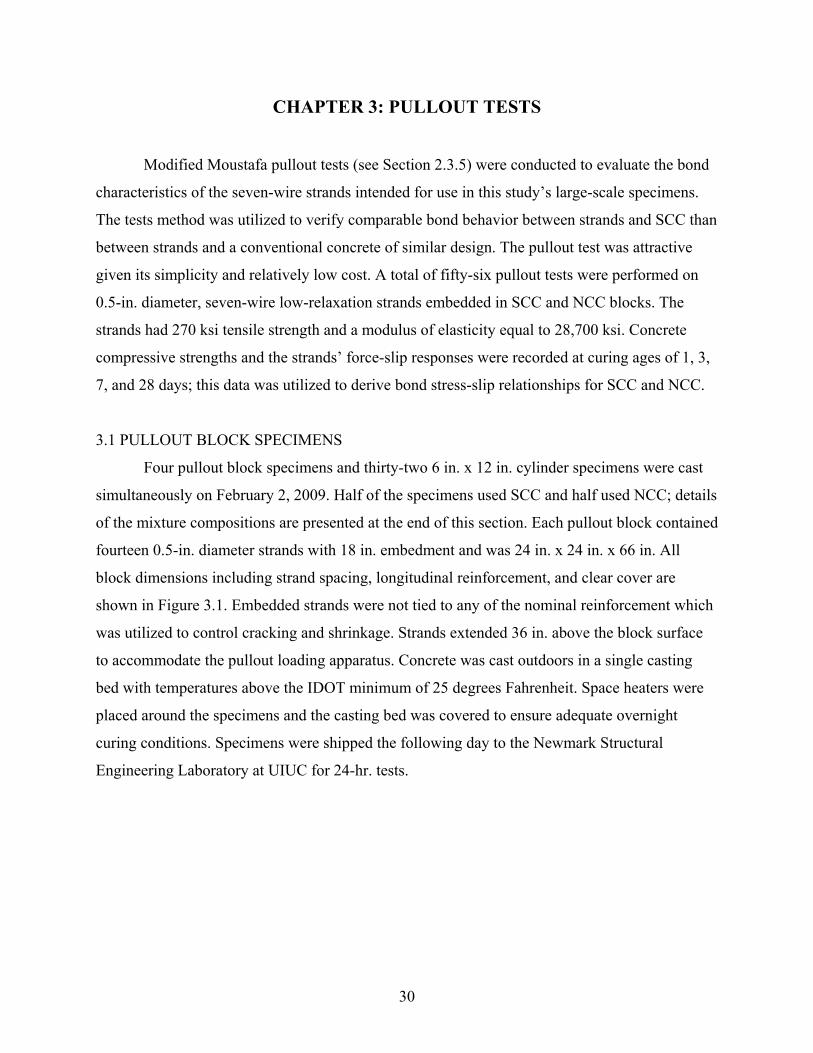
CHAPTER 3: PULLOUT TESTS
Modified Moustafa pullout tests (see Section 2.3.5) were conducted to evaluate the bond
characteristics of the seven-wire strands intended for use in this study’s large-scale specimens.
The tests method was utilized to verify comparable bond behavior between strands and SCC than
between strands and a conventional concrete of similar design. The pullout test was attractive
given its simplicity and relatively low cost. A total of fifty-six pullout tests were performed on
0.5-in. diameter, seven-wire low-relaxation strands embedded in SCC and NCC blocks. The
strands had 270 ksi tensile strength and a modulus of elasticity equal to 28,700 ksi. Concrete
compressive strengths and the strands’ force-slip responses were recorded at curing ages of 1, 3,
7, and 28 days; this data was utilized to derive bond stress-slip relationships for SCC and NCC.
3.1 PULLOUT BLOCK SPECIMENS
Four pullout block specimens and thirty-two 6 in. x 12 in. cylinder specimens were cast
simultaneously on February 2, 2009. Half of the specimens used SCC and half used NCC; details
of the mixture compositions are presented at the end of this section. Each pullout block contained
fourteen 0.5-in. diameter strands with 18 in. embedment and was 24 in. x 24 in. x 66 in. All
block dimensions including strand spacing, longitudinal reinforcement, and clear cover are
shown in Figure 3.1. Embedded strands were not tied to any of the nominal reinforcement which
was utilized to control cracking and shrinkage. Strands extended 36 in. above the block surface
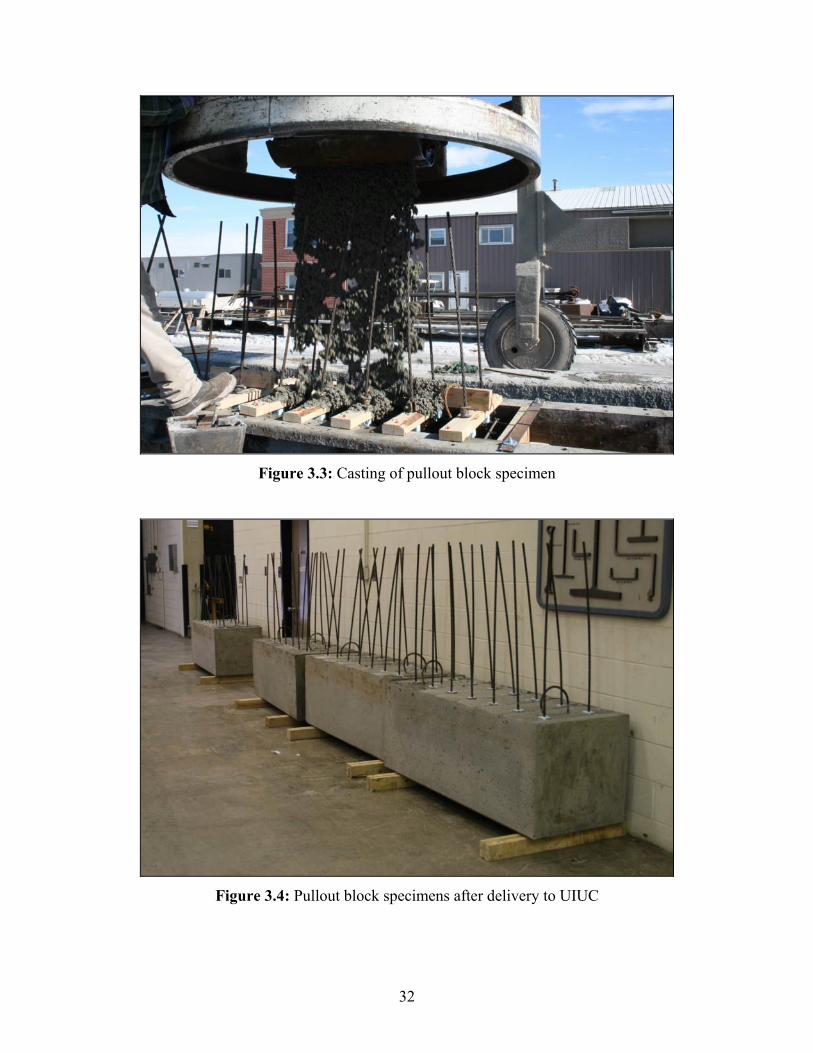
to accommodate the pullout loading apparatus. Concrete was cast outdoors in a single casting
bed with temperatures above the IDOT minimum of 25 degrees Fahrenheit. Space heaters were
placed around the specimens and the casting bed was covered to ensure adequate overnight
curing conditions. Specimens were shipped the following day to the Newmark Structural
Engineering Laboratory at UIUC for 24-hr. tests.

31
Figure 3.1: Pullout specimen design with dimensions in inches
Figure 3.2: Formwork for pullout specimens on casting day
#3 stirrups
#4 longitudinal reinforcement
6″ 9″ 9″ 9″ 9″ 9″ 9″ 6″ 6″ 6″ 12″
18″ 18″ 22″ 2″ clear cover
2″ foam cube
0.5″-diameter strands
2″ c. cover
32
Figure 3.3: Casting of pullout block specimen
Figure 3.4: Pullout block specimens after delivery to UIUC

33
The actual constituent proportions for the two concrete mixtures used in pullout block
specimens are presented in Table 3.1. Pullout specimens were cast using one batch of SCC and
one batch of NCC, both of which were 2 cubic yards in volume. Both mixtures contained Type
III cement, coarse aggregate with maximum 0.5-in. nominal size, and natural sand fine
aggregate. Use of a HRWR and an AEA ensured proper workability for each mixture. The
amount of AEA was half the design volume because an issue with dosing equipment during
specimen fabrication resulted in actual dosages which were half the values output on the batch
tickets. The concretes contained no VMA, though the HRWR was promoted by the manufacturer
as a single-component admixture having properties to improve segregation resistance. The SCC
adhered to all current IDOT standards for precast/prestressed specimens (IDOT 2007).
Table 3.2 summarizes the results for plastic property tests conducted on pullout specimen
concrete. A standard slump test (ASTM C143) was performed on the fresh batch of NCC, which
had a 7-in. slump. Standard slump flow (ASTM C1611), J-Ring (ASTM C1621), L-box, and VSI
tests were conducted for fresh pullout specimen SCC. Table 3.2 shows the SCC utilized in this
study had moderate passing ability, moderate filling ability, and minimal segregation.
Table 3.1: Actual NCC and SCC Mixture Proportioning for Pullout Specimens
Mix Constituent Units Pullout NCC Pullout SCC Type III Cement lbs/cy 670 662
Coarse Aggregate lbs/cy 1849 1607 Fine Aggregate lbs/cy 1180 1441
AEA oz/cy 11 14 HRWR oz/cy 45 81 Water gal/cy 27 22 W/C - 0.33 0.28
Coarse/Fine Aggregate - 1.57 1.12 Fine/Total Aggregate - 0.39 0.47

34
Table 3.2: Fresh Mixture Properties for Pullout Specimen Concrete
Pullout SCC Pullout NCCTemperature °F 63 62 Entrained Air % 5.7 6.3 Slump Flow in. 22.0 -
J-Ring Spread in. 20.0 - L-Box Ratio % 75 -
VSI - 0-1 - Slump in. - 7
3.2 PULLOUT TEST SETUP
The servo-controlled assembly in Figure 3.5 was utilized to apply load to strands in the
pullout tests. The 120-kip capacity hydraulic ram had a 13-in. stroke, a 6.25-in. outer diameter,
and a 3-in. bore diameter. A linear variable differential transducer (LVDT) attached to the ram’s
cylinder monitored displacement of an aluminum plate secured to the top of the piston. Strands
were loaded at a constant displacement-controlled rate of 0.4 in/min, resulting in loading rates
below the maximum 20 kip/min as set forth by Logan (1997). Load was applied continuously
until strands were completely pulled out or fractured. Five criteria were obtained for each pullout
test: (1) First slip load, (2) Peak pullout load, (3) Displacement at first slip, (4) Displacement at
peak load, and (5) Depiction of failure. The former four criteria were taken from the force-
displacement response for each strand, while the latter criterion was made by visual observation.
5″
3.75″1″
6″
2″
18″
Hollow Core Cylinder(6.25″outer diameter)
Aluminum Plate & Steel Adapter Piece
Load Cell
Protective Steel Plates
Prestressing Chuck
Steel Strand
Concrete Block
LVDT
5″
3.75″1″
6″
2″
18″
Hollow Core Cylinder(6.25″outer diameter)
Aluminum Plate & Steel Adapter Piece
Load Cell
Protective Steel Plates
Prestressing Chuck
Steel Strand
Concrete Block
LVDT
Figure 3.5: Servo-controlled assembly utilized to perform pullout tests
35
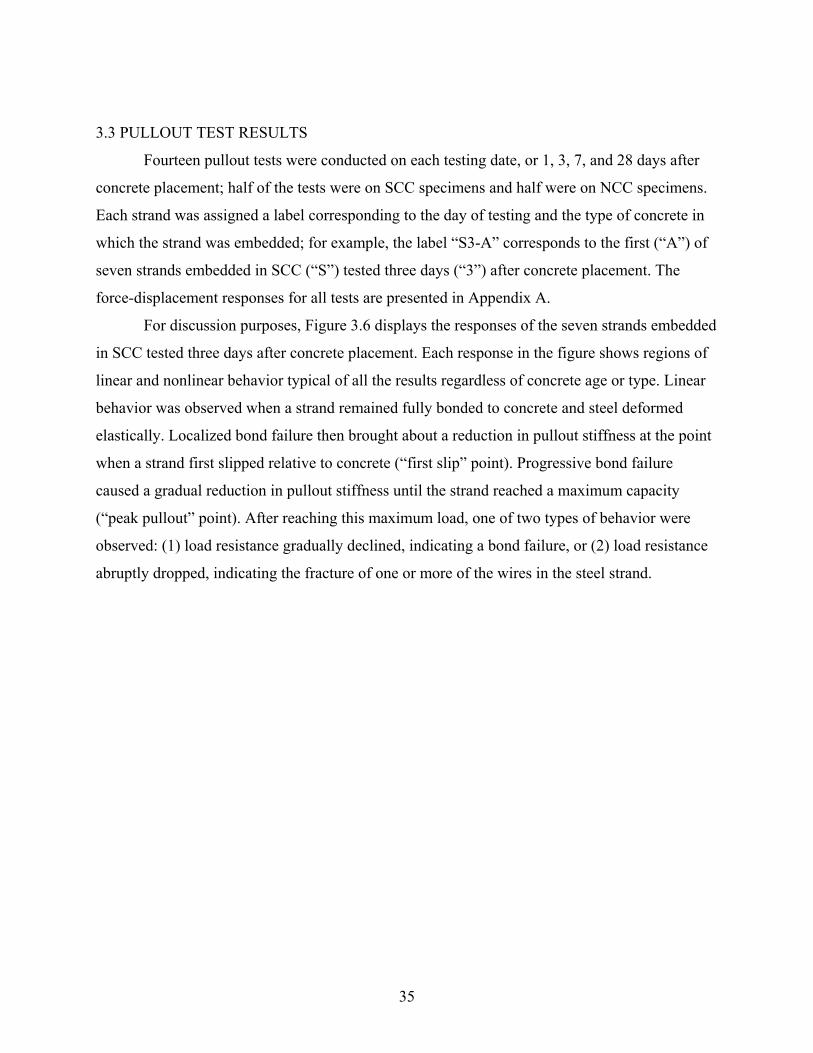
3.3 PULLOUT TEST RESULTS
Fourteen pullout tests were conducted on each testing date, or 1, 3, 7, and 28 days after
concrete placement; half of the tests were on SCC specimens and half were on NCC specimens.
Each strand was assigned a label corresponding to the day of testing and the type of concrete in
which the strand was embedded; for example, the label “S3-A” corresponds to the first (“A”) of
seven strands embedded in SCC (“S”) tested three days (“3”) after concrete placement. The
force-displacement responses for all tests are presented in Appendix A.
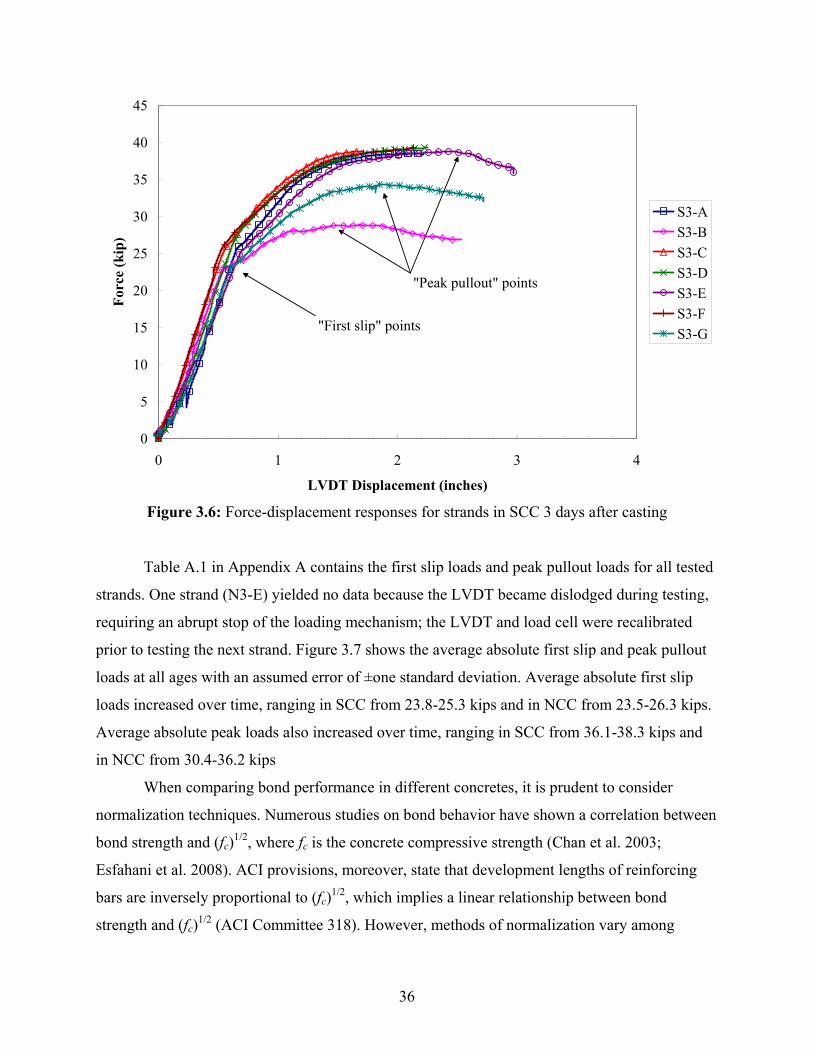
For discussion purposes, Figure 3.6 displays the responses of the seven strands embedded
in SCC tested three days after concrete placement. Each response in the figure shows regions of
linear and nonlinear behavior typical of all the results regardless of concrete age or type. Linear
behavior was observed when a strand remained fully bonded to concrete and steel deformed
elastically. Localized bond failure then brought about a reduction in pullout stiffness at the point
when a strand first slipped relative to concrete (“first slip” point). Progressive bond failure
caused a gradual reduction in pullout stiffness until the strand reached a maximum capacity
(“peak pullout” point). After reaching this maximum load, one of two types of behavior were
observed: (1) load resistance gradually declined, indicating a bond failure, or (2) load resistance
abruptly dropped, indicating the fracture of one or more of the wires in the steel strand.
36
0
5
10
15
20
25
30
35
40
45
0 1 2 3 4
LVDT Displacement (inches)
Forc
e (k
ip)
S3-AS3-BS3-CS3-DS3-ES3-FS3-G"First slip" points
"Peak pullout" points
Figure 3.6: Force-displacement responses for strands in SCC 3 days after casting
Table A.1 in Appendix A contains the first slip loads and peak pullout loads for all tested
strands. One strand (N3-E) yielded no data because the LVDT became dislodged during testing,
requiring an abrupt stop of the loading mechanism; the LVDT and load cell were recalibrated
prior to testing the next strand. Figure 3.7 shows the average absolute first slip and peak pullout
loads at all ages with an assumed error of ±one standard deviation. Average absolute first slip
loads increased over time, ranging in SCC from 23.8-25.3 kips and in NCC from 23.5-26.3 kips.
Average absolute peak loads also increased over time, ranging in SCC from 36.1-38.3 kips and
in NCC from 30.4-36.2 kips
When comparing bond performance in different concretes, it is prudent to consider
normalization techniques. Numerous studies on bond behavior have shown a correlation between
bond strength and (fc)1/2, where fc is the concrete compressive strength (Chan et al. 2003;
Esfahani et al. 2008). ACI provisions, moreover, state that development lengths of reinforcing
bars are inversely proportional to (fc)1/2, which implies a linear relationship between bond
strength and (fc)1/2 (ACI Committee 318). However, methods of normalization vary among

37
studies depending upon the concrete strength range, confinement within specimens, and country
in which testing occurs. Previous research and most European design codes consider bond
strength to vary proportionally with (fc)1/3 (Mitchell & Marzouk 2007). Other studies have found
a more precise correlation between bond strength and (fc)1/4 (Darwin et al.1996). Based on
similarities to the studies discussed in Section 2.4, the current study assumes a linear relationship
between bond strength and (fc)1/2, and Figure 3.8 shows first slip and peak pullout loads
normalized using (fc)1/2 to better assess the bond behavior of SCC and NCC using a common
datum.
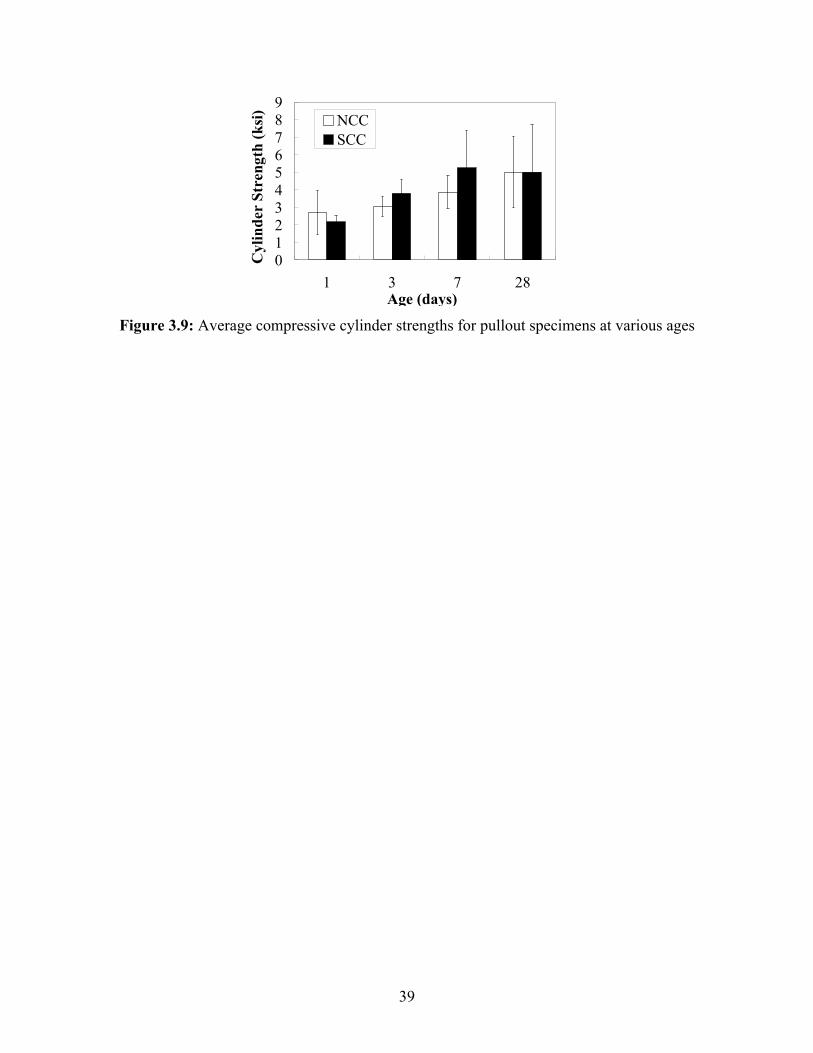
The average compressive cylinder strengths for both concretes at various testing ages are
shown in Figure 3.9 with an assumed error of ±one standard deviation. Both concretes achieved
adequate strength for initial tests and strengthened over time, exceeding 5 ksi after 28 days. It
should be noted, however, that individual cylinder specimens for either concrete type showed
wide variability in strength at the same age (i.e. SCC cylinder strengths at 28 days ranged from
3.5-9.1 ksi). Indeed, cylinder strengths reported for both concrete types prior to shipping pullout
specimens to UIUC were greater than 4 ksi. Normalized first slip loads differed between SCC
and NCC by an average of 10% for all tests. Only the 1-day tests showed first slip normalized
loads in SCC higher than those in NCC (see Figure 3.8). Normalized pullout loads differed
between SCC and NCC by as much as 25% at 1 day and as little as 1% at 3 days. Only the 7-day
tests produced lower normalized pullout loads in SCC than in NCC. From the pullout capacities,
it was concluded that the strands in this study displayed sufficient bond to SCC; therefore, they
were utilized in subsequent full-scale girder testing.

38
0
10
20
30
40
50
1 3 7 28Concrete Age (days)
Abs
olut
e L
oad
(kip
)
NCC First Slip SCC First SlipNCC Peak SCC Peak
Figure 3.7: Average absolute first slip and peak pullout loads at various ages
0
5
10
15
20
25
30
1 3 7 28Concrete Age (days)
Nor
mal
ized
Loa
d (in
√kip
)
NCC First Slip SCC First SlipNCC Peak SCC Peak
Figure 3.8: Average normalized first slip and peak pullout loads at various ages
39
0123456789
1 3 7 28Age (days)
Cyl
inde
r St
reng
th (k
si) NCC
SCC
Figure 3.9: Average compressive cylinder strengths for pullout specimens at various ages
40
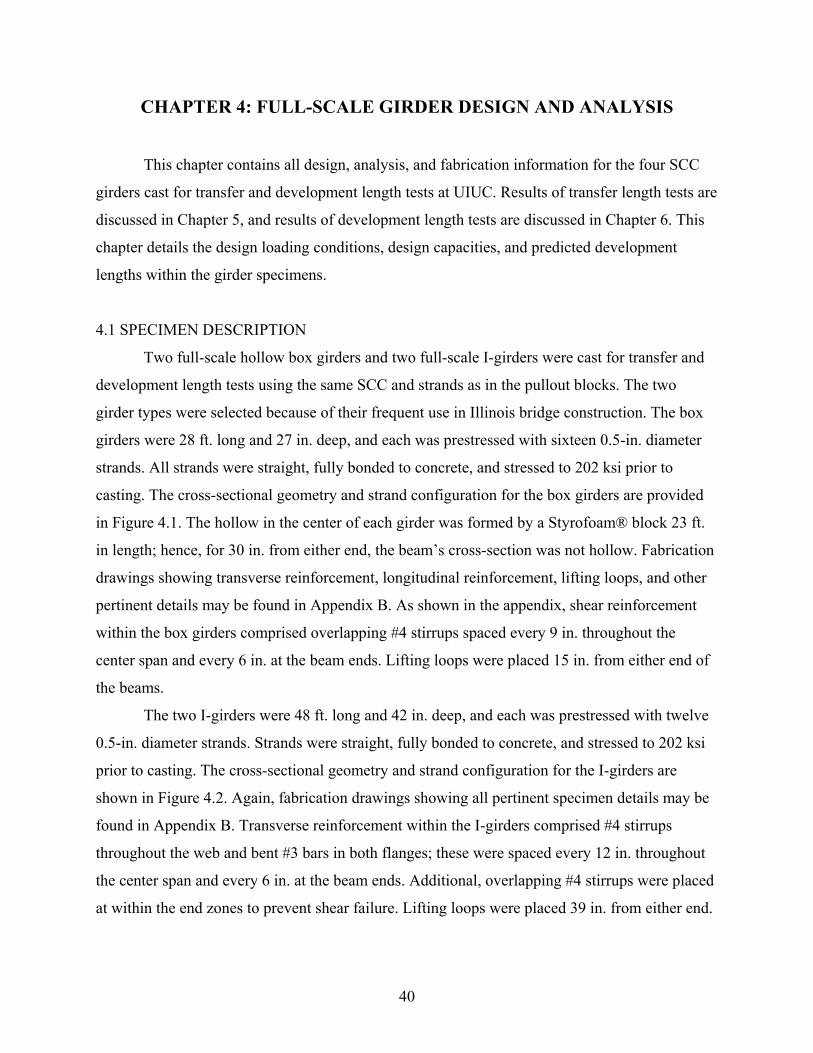
CHAPTER 4: FULL-SCALE GIRDER DESIGN AND ANALYSIS
This chapter contains all design, analysis, and fabrication information for the four SCC
girders cast for transfer and development length tests at UIUC. Results of transfer length tests are
discussed in Chapter 5, and results of development length tests are discussed in Chapter 6. This
chapter details the design loading conditions, design capacities, and predicted development
lengths within the girder specimens.
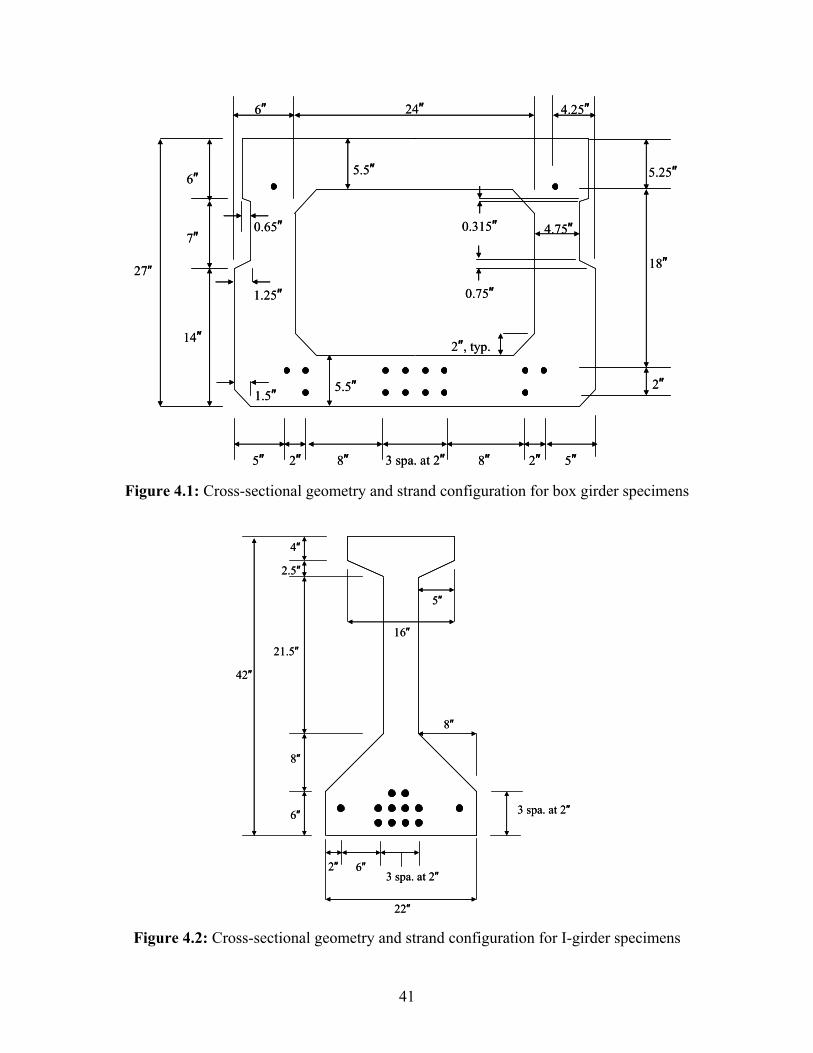
4.1 SPECIMEN DESCRIPTION
Two full-scale hollow box girders and two full-scale I-girders were cast for transfer and
development length tests using the same SCC and strands as in the pullout blocks. The two
girder types were selected because of their frequent use in Illinois bridge construction. The box
girders were 28 ft. long and 27 in. deep, and each was prestressed with sixteen 0.5-in. diameter
strands. All strands were straight, fully bonded to concrete, and stressed to 202 ksi prior to
casting. The cross-sectional geometry and strand configuration for the box girders are provided
in Figure 4.1. The hollow in the center of each girder was formed by a Styrofoam® block 23 ft.
in length; hence, for 30 in. from either end, the beam’s cross-section was not hollow. Fabrication
drawings showing transverse reinforcement, longitudinal reinforcement, lifting loops, and other
pertinent details may be found in Appendix B. As shown in the appendix, shear reinforcement
within the box girders comprised overlapping #4 stirrups spaced every 9 in. throughout the
center span and every 6 in. at the beam ends. Lifting loops were placed 15 in. from either end of
the beams.
The two I-girders were 48 ft. long and 42 in. deep, and each was prestressed with twelve
0.5-in. diameter strands. Strands were straight, fully bonded to concrete, and stressed to 202 ksi
prior to casting. The cross-sectional geometry and strand configuration for the I-girders are
shown in Figure 4.2. Again, fabrication drawings showing all pertinent specimen details may be
found in Appendix B. Transverse reinforcement within the I-girders comprised #4 stirrups
throughout the web and bent #3 bars in both flanges; these were spaced every 12 in. throughout
the center span and every 6 in. at the beam ends. Additional, overlapping #4 stirrups were placed
at within the end zones to prevent shear failure. Lifting loops were placed 39 in. from either end.
41
5″ 2″ 8″ 3 spa. at 2″ 8″ 2″ 5″
7″
14″
6″
27″
6″ 24″ 4.25″
5.5″
2″, typ.
5.25″
18″
2″
4.75″
1.5″
1.25″
0.65″
5.5″
0.75″
0.315″
5″ 2″ 8″ 3 spa. at 2″ 8″ 2″ 5″
7″
14″
6″
27″
6″ 24″ 4.25″
5.5″
2″, typ.
5.25″
18″
2″
4.75″
1.5″
1.25″
0.65″
5.5″
0.75″
0.315″
Figure 4.1: Cross-sectional geometry and strand configuration for box girder specimens
21.5″
2.5″
4″
8″
6″ 3 spa. at 2″
3 spa. at 2″6″2″
8″
5″
42″
22″
16″21.5″
2.5″
4″
8″
6″ 3 spa. at 2″
3 spa. at 2″6″2″
8″
5″
42″
22″
16″
Figure 4.2: Cross-sectional geometry and strand configuration for I-girder specimens
42
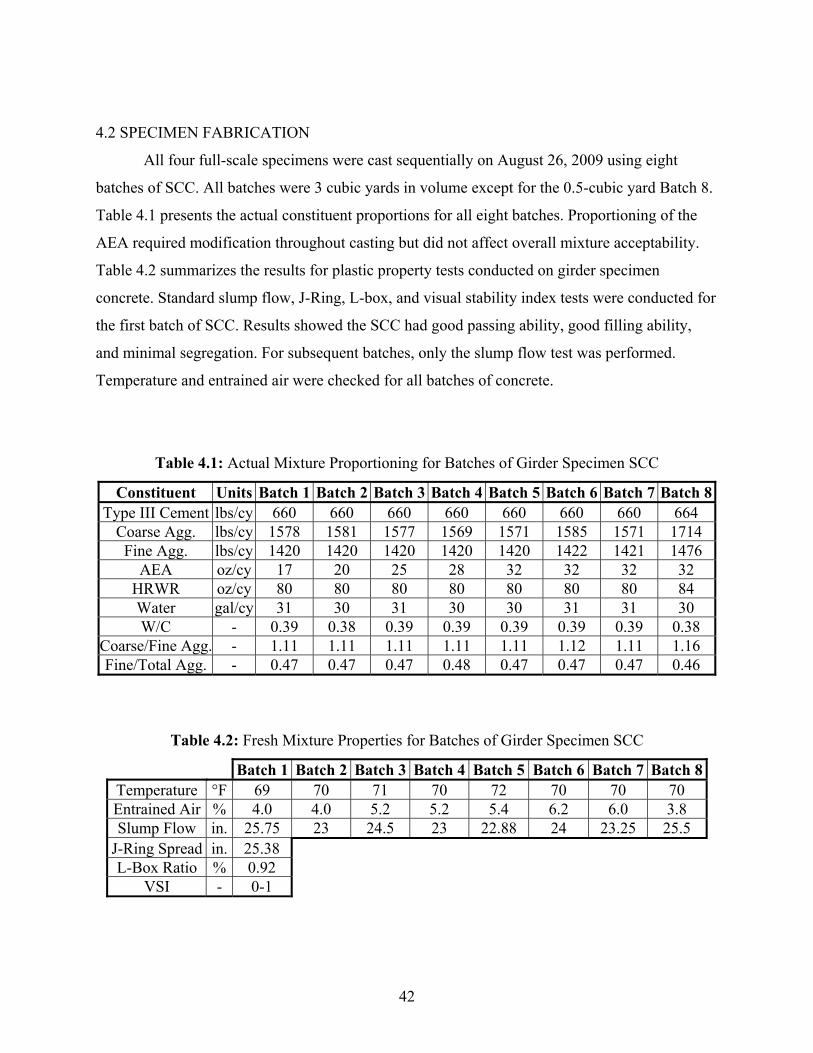
4.2 SPECIMEN FABRICATION
All four full-scale specimens were cast sequentially on August 26, 2009 using eight
batches of SCC. All batches were 3 cubic yards in volume except for the 0.5-cubic yard Batch 8.
Table 4.1 presents the actual constituent proportions for all eight batches. Proportioning of the
AEA required modification throughout casting but did not affect overall mixture acceptability.
Table 4.2 summarizes the results for plastic property tests conducted on girder specimen
concrete. Standard slump flow, J-Ring, L-box, and visual stability index tests were conducted for
the first batch of SCC. Results showed the SCC had good passing ability, good filling ability,
and minimal segregation. For subsequent batches, only the slump flow test was performed.
Temperature and entrained air were checked for all batches of concrete.
Table 4.1: Actual Mixture Proportioning for Batches of Girder Specimen SCC
Constituent Units Batch 1 Batch 2 Batch 3 Batch 4 Batch 5 Batch 6 Batch 7 Batch 8Type III Cement lbs/cy 660 660 660 660 660 660 660 664
Coarse Agg. lbs/cy 1578 1581 1577 1569 1571 1585 1571 1714 Fine Agg. lbs/cy 1420 1420 1420 1420 1420 1422 1421 1476
AEA oz/cy 17 20 25 28 32 32 32 32 HRWR oz/cy 80 80 80 80 80 80 80 84 Water gal/cy 31 30 31 30 30 31 31 30 W/C - 0.39 0.38 0.39 0.39 0.39 0.39 0.39 0.38
Coarse/Fine Agg. - 1.11 1.11 1.11 1.11 1.11 1.12 1.11 1.16 Fine/Total Agg. - 0.47 0.47 0.47 0.48 0.47 0.47 0.47 0.46
Table 4.2: Fresh Mixture Properties for Batches of Girder Specimen SCC
Batch 1 Batch 2 Batch 3 Batch 4 Batch 5 Batch 6 Batch 7 Batch 8Temperature °F 69 70 71 70 72 70 70 70 Entrained Air % 4.0 4.0 5.2 5.2 5.4 6.2 6.0 3.8 Slump Flow in. 25.75 23 24.5 23 22.88 24 23.25 25.5
J-Ring Spread in. 25.38 L-Box Ratio % 0.92
VSI - 0-1

43
The casting bed configurations for the four girders are provided in Figure 4.3. Per the
figure, Box-1 and Box-2 hereafter refer to the box girder specimens, and I-1 and I-2 hereafter
refer to the I-girder specimens. Specimen Box-1 was cast first with Batches 1-2 (see Tables 4.1
and 4.2); then, specimen Box-2 was cast with Batches 2-4, specimen I-1 was cast with Batches
4-6, and specimen I-2 was cast with Batches 6-8. The box girders were cast monolithically
starting at their south ends; the I-girders were cast starting at their north ends (see Figure 4.3). A
monolithic pour of a hollow girder is typically more problematic when using conventional
concrete than when using SCC because formwork for the center void obstructs the flow of
concrete. No mechanical vibration or tamping was utilized during casting. Casting and strand
release locations were noted in order to analyze whether they affected transfer length at either
girder end. All girders had a specified 5000 psi release strength and 6000 psi 28-day target
strength at 28 days. Seventy 4 in. x 8 in. cylinders were cast during fabrication to determine
concrete compressive strength at later ages. Figures 4.4 through 4.15 illustrate the fabrication
process for the four girders.
A B A B BED A Box-1 ☼☼ Box-2 ☼ D C D C → NORTH A B A B BED B
☼ I-2 ☼☼ I-1 D C D C → NORTH
Box-1 Started casting at A-D Box-2 Started casting at A-D
Strands first cut at ☼, then cut at ☼☼
I-1 Started casting at B-C I-2 Started casting at B-C
Strands first cut at ☼, then cut at ☼☼
Figure 4.3: Diagram showing casting locations, cutting locations, and beam orientation
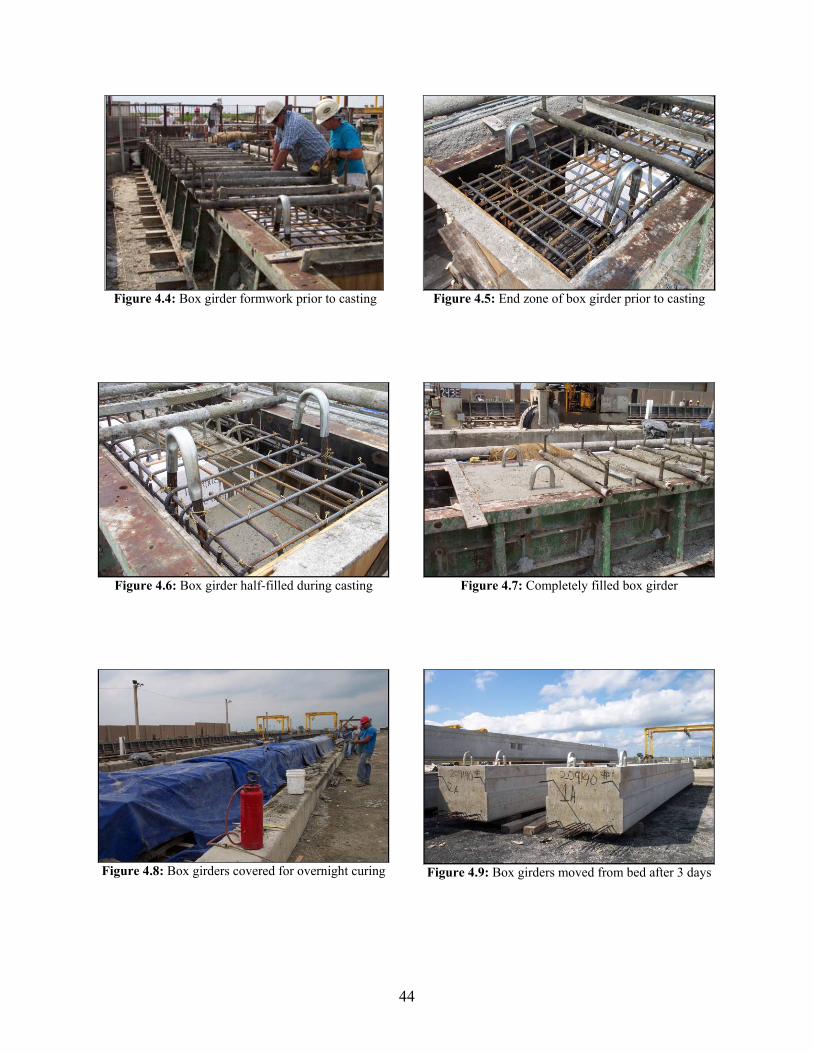
44
Figure 4.4: Box girder formwork prior to casting
Figure 4.6: Box girder half-filled during casting
Figure 4.8: Box girders covered for overnight curing
Figure 4.5: End zone of box girder prior to casting
Figure 4.7: Completely filled box girder
Figure 4.9: Box girders moved from bed after 3 days
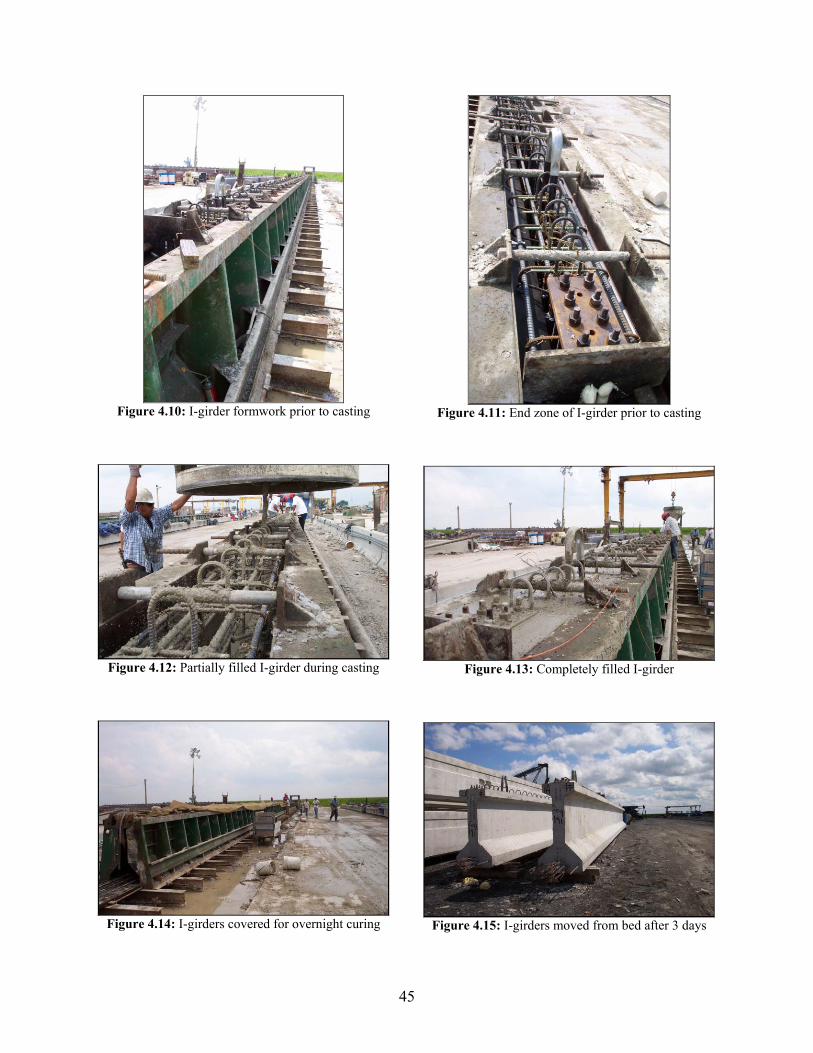
45
Figure 4.10: I-girder formwork prior to casting
Figure 4.12: Partially filled I-girder during casting
Figure 4.14: I-girders covered for overnight curing
Figure 4.11: End zone of I-girder prior to casting
Figure 4.13: Completely filled I-girder
Figure 4.15: I-girders moved from bed after 3 days

46
Approximately one month after casting, when all transfer length measurements had been
completed, specimens were shipped to UIUC. Prior to flexural tests, composite SCC slabs were
cast atop the I-girders to simulate the effective portion of a bridge deck. The slab for girder I-1
was cast on April 23, 2010, and the slab for girder I-2 was cast on April 28, 2010. Provided by a
local fabricator, the slab SCC differed slightly from the concrete utilized to cast the girders,
though the 28-day target strength remained the same. The actual constituent proportions for the
deck SCC are provided in Table 4.3. As shown, the concrete incorporated Type I/II cement,
unlike the girders which utilized Type III cement for rapid strength gain. The AEA manufacturer
differed between mixtures, and only 5 oz. per cubic yard was required for the deck concrete. The
brand of HRWR also differed between mixtures, but the required quantity remained the same.
Each deck was cast using a single, 7-cubic yard batch of concrete. No mechanical vibration or
tamping was utilized during casting.
The slabs were 8 in. x 30 in., extended the entire length of the specimens, and utilized
nominal reinforcement to meet temperature and shrinkage requirements. The transverse
reinforcement in the slabs comprised evenly-spaced #4 bars. Slab dimensions were selected to
ensure strands would yield prior to concrete crushing during flexural tests. Figures 4.16 through
4.21 show the deck fabrication process; decks were allowed to cure, covered with tarps, for one
week prior to formwork removal.
Table 4.3: Actual SCC Mixture Proportioning for I-Girder Decks
Mix Constituent Units SCC Type I/II Cement lbs/cy 658 Coarse Aggregate lbs/cy 1557 Fine Aggregate lbs/cy 1489
AEA oz/cy 5 HRWR oz/cy 91 Water gal/cy 30.1 W/C - 0.38
Coarse/Fine Aggregate - 1.05 Fine/Total Aggregate - 0.49
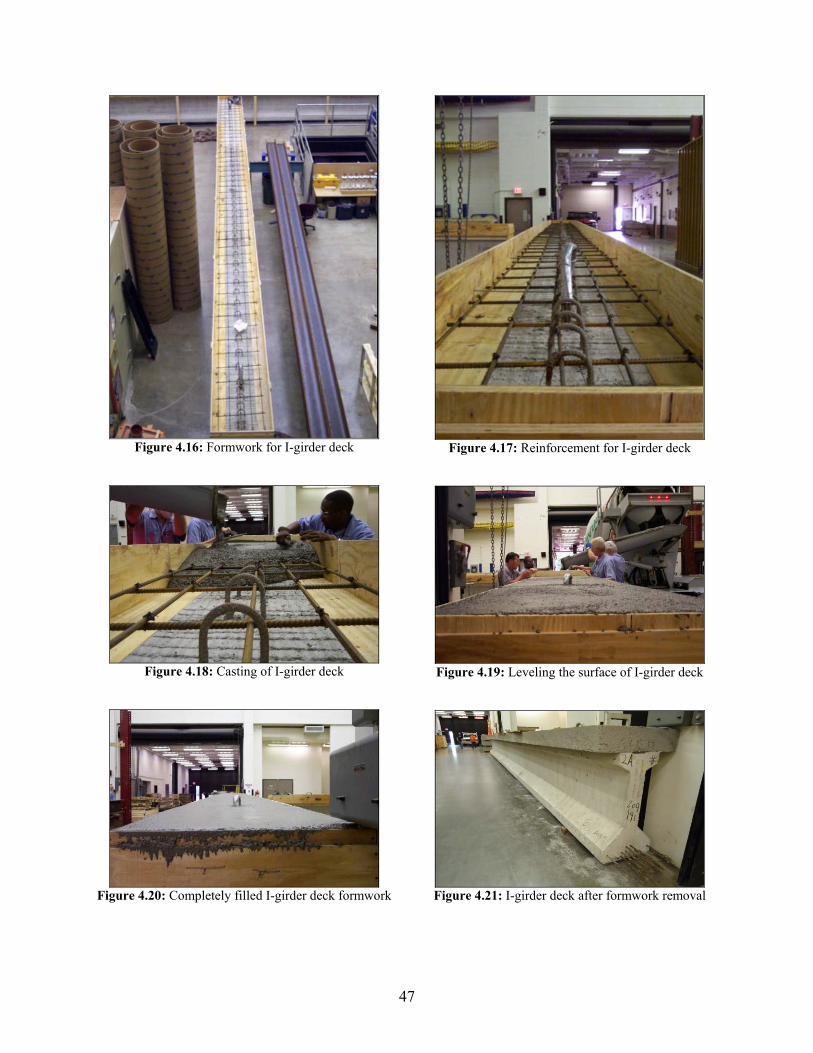
47
Figure 4.16: Formwork for I-girder deck
Figure 4.18: Casting of I-girder deck
Figure 4.20: Completely filled I-girder deck formwork
Figure 4.17: Reinforcement for I-girder deck
Figure 4.19: Leveling the surface of I-girder deck
Figure 4.21: I-girder deck after formwork removal

48
4.3 SECTION PROPERTIES
This section briefly summarizes the geometrical properties used in the analysis of each
specimen type. Table 4.4 contains the properties of both the hollow and filled cross-sections
within the box girder. As shown in the fabrication drawings in Appendix B, the box girder cross-
section is hollow for only 25 ft. within the specimen; for 30 in. from either end, the section is
completely filled. Table 4.5 contains I-girder properties with and without the composite deck.
For simplicity, the concrete in the girder and slab comprising the composite section were
assumed to have the same strength; hence, no transformed moment of inertia or section
properties are presented. Volume-to-surface (V/S) ratios utilized in calculating prestress losses
are also listed in the tables.
Table 4.4: Box Girder Section Properties
Hollow Section Properties Filled Section
Properties Strand Properties
Ac 568.8 in Ac 896.8 in # Strands 16 ht 27.0 in ht 27.0 in CG Strands: 5.25 in dp 21.5 in dp 21.5 in Aps 2.448 in2 eo 8.04 in eo 8.12 in yt 13.29 in yt 13.63 in yb 13.71 in yb 13.37 in
Girder Properties
Ig 49684 in4 Ig 57452 in4 Surface Area 65074 in2 Zb 3739 in3 Zb 4297 in3 Volume 210780 in3 Zt 3624 in3 Zt 4215 in3 V/S Ratio 3.24 in
Table 4.5: I-Girder Section Properties
Original Section Properties Section Properties
with Deck Strand Properties
Ac 464.5 in Ac 704.5 in # Strands 12 ht 42 in ht 50 in CG Strands: 3.67 in dp 38.3 in dp 46.3 in Aps 1.836 in2 eo 14.0 in eo 23.6 in yt 24.35 in yt 22.7 in yb 17.65 in yb 27.3 in
Girder Properties (without deck)
Ig 90822 in4 Ig 219262 in4 Surface Area 79265 in2 Zb 5145.1 in3 Zb 8028.8 in3 Volume 267552 in3 Zt 3730.2 in3 Zt 9663.2 in3 V/S Ratio 3.37 in
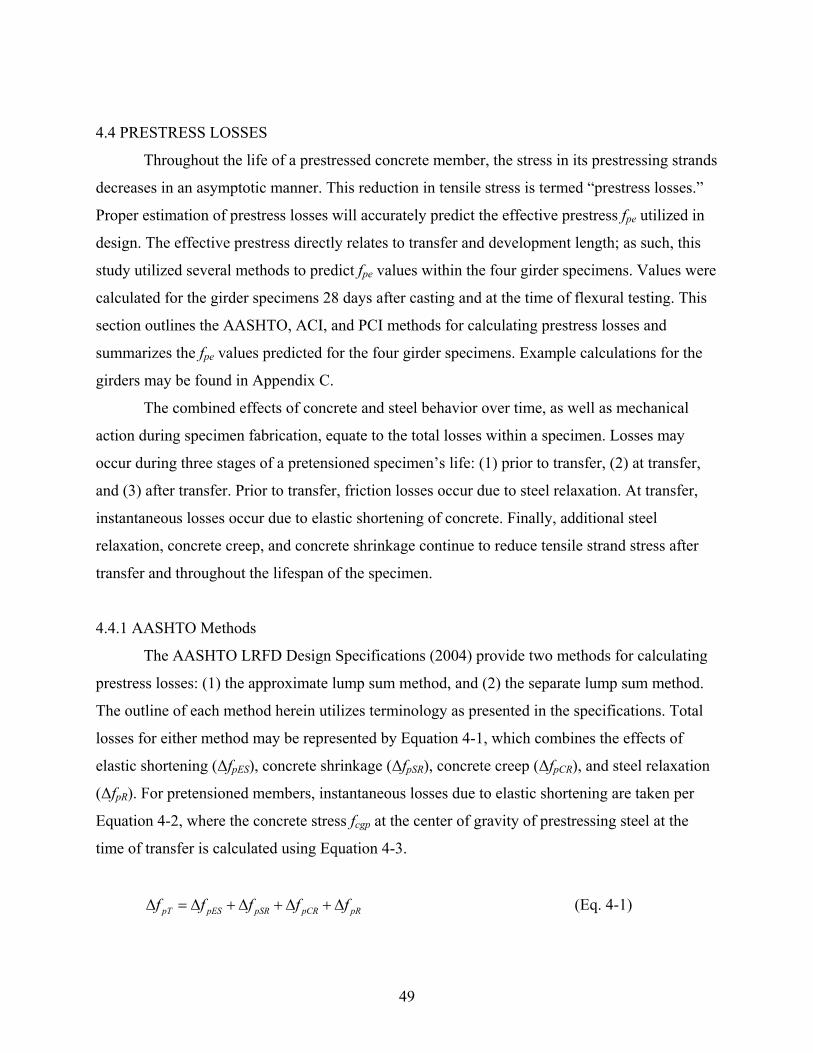
49
4.4 PRESTRESS LOSSES
Throughout the life of a prestressed concrete member, the stress in its prestressing strands
decreases in an asymptotic manner. This reduction in tensile stress is termed “prestress losses.”
Proper estimation of prestress losses will accurately predict the effective prestress fpe utilized in
design. The effective prestress directly relates to transfer and development length; as such, this
study utilized several methods to predict fpe values within the four girder specimens. Values were
calculated for the girder specimens 28 days after casting and at the time of flexural testing. This
section outlines the AASHTO, ACI, and PCI methods for calculating prestress losses and
summarizes the fpe values predicted for the four girder specimens. Example calculations for the
girders may be found in Appendix C.
The combined effects of concrete and steel behavior over time, as well as mechanical
action during specimen fabrication, equate to the total losses within a specimen. Losses may
occur during three stages of a pretensioned specimen’s life: (1) prior to transfer, (2) at transfer,
and (3) after transfer. Prior to transfer, friction losses occur due to steel relaxation. At transfer,
instantaneous losses occur due to elastic shortening of concrete. Finally, additional steel
relaxation, concrete creep, and concrete shrinkage continue to reduce tensile strand stress after
transfer and throughout the lifespan of the specimen.
4.4.1 AASHTO Methods
The AASHTO LRFD Design Specifications (2004) provide two methods for calculating
prestress losses: (1) the approximate lump sum method, and (2) the separate lump sum method.
The outline of each method herein utilizes terminology as presented in the specifications. Total
losses for either method may be represented by Equation 4-1, which combines the effects of
elastic shortening (ΔfpES), concrete shrinkage (ΔfpSR), concrete creep (ΔfpCR), and steel relaxation
(ΔfpR). For pretensioned members, instantaneous losses due to elastic shortening are taken per
Equation 4-2, where the concrete stress fcgp at the center of gravity of prestressing steel at the
time of transfer is calculated using Equation 4-3.
pT pES pSR pCR pRf f f f fΔ = Δ + Δ + Δ + Δ (Eq. 4-1)
50
pspES cgp
ci
Ef f
EΔ = (Eq. 4-2)
where: Eps = elastic modulus of prestressing steel Eci = elastic modulus of concrete at time of transfer fcgp = concrete stress at strand CG from self-weight, prestress force at transfer
2
pi ps pi ps swcgp
c
f A f A e M efA I I
⎛ ⎞= + −⎜ ⎟⎜ ⎟⎝ ⎠
(Eq. 4-3)
The approximate lump sum method estimates the combined effect of all time-dependent
losses based on specimen and strand type. For box girders with Grade 270 strands, the upper
bound estimate of time-dependent losses ΔfpTD is taken per Equation 4-4, where PPR is the
partial prestressing ratio. For low-relaxation strands, AASHTO permits Eq. 4-4 to be reduced by
4 ksi. For I-girders with Grade 270 strands, the average estimate of time-dependent losses is
calculated using Equation 4-5, which may be reduced by 6 ksi for low-relaxation strands. Both
equations are valid for pretensioned members cast with normal-weight concrete, stressed after
reaching 3.5-ksi strength, and either steam or moist cured.
21.0 4.0pTDf PPRΔ = + (Eq. 4-4)
633 1 0.15 66
cpTD
ff PPR′⎡ − ⎤⎛ ⎞Δ = − +⎜ ⎟⎢ ⎥⎝ ⎠⎣ ⎦
(Eq. 4-5)
The separate lump sum method provides refined estimates for individual components of
time-dependent losses. Losses due to concrete shrinkage and creep are calculated using
Equations 4-6 and 4-7, respectively. The change in concrete stress Δfcdp in Equation 4-7 is
calculated at the same section for which fcgp is calculated. Losses due to steel relaxation are
calculated separately for the time prior to prestress transfer (ΔfpR1) and the time after transfer
(ΔfpR2) using Equations 4-8 and 4-9, respectively, for lox-relaxation strands. The time t is taken
as the number of days between strand prestressing and transfer.
17.0 0.15Δ = −pSf H (Eq. 4-6) where: H = relative humidity

51
12.0 7.0 0Δ = − Δ ≥pC cgp cdpf f f (Eq. 4-7) where: Δfcdp = change in stress at strand CG due to permanent loads absent at transfer
1log(24.0 ) 0.55
40.0⎛ ⎞
Δ = −⎜ ⎟⎜ ⎟⎝ ⎠
pJpR pJ
py
ftf ff
(Eq. 4-8)
2 0.30 20.0 0.4 0.2( )pR pES pSR pCRf f f f⎡ ⎤Δ = − Δ − Δ + Δ⎣ ⎦ (Eq. 4-9)
4.4.2 PCI Method
The PCI Design Handbook (2004) outlines a method to predict prestress losses for
normal design conditions. As the handbook states, typical prestress losses range from 25 ksi to
50 ksi in normal-weight concrete members, and from 30 ksi to 55 ksi in lightweight concrete
members. The method outlined below utilizes terminology as written in the design handbook;
variables repeated from previous text are not redefined. First, total losses are represented by
Equation 4-10, which combines losses due to elastic shortening (ES), concrete creep (CR),
concrete shrinkage (SH), and steel relaxation (RE). The individual components of loss are
calculated using Equations 4-11 through 4-14.
= + + +TL ES CR SH RE (Eq. 4-10)
= es ps cir
ci
K E fES
E (Eq. 4-11)
where: Kes = 1.0 for pretensioned members fcir = net compressive stress in concrete at strand CG at transfer
( )= −r pscir cds
c
K ECR f f
E (Eq. 4-12)
where: Kr = 2.0 for normal weight concrete, 1.6 for light weight concrete fcds = stress at strand CG due to superimposed dead loads applied after transfer Ec = elastic modulus of concrete at 28 days
( ) ( )68.06 10 1 0.06 100− ⎛ ⎞= × − −⎜ ⎟⎝ ⎠
sh psVSH K E RHS
(Eq. 4-13)
where: Ksh = 1.0 for pretensioned members V/S = volume-to-surface ratio RH = average ambient relative humidity

52
( )= − + +⎡ ⎤⎣ ⎦reRE K J SH CR ES C (Eq. 4-14) where: J = coefficient from PCI Table 4.7.3.1 Kre = coefficient from PCI Table 4.7.3.1
The net compressive stress fcir in concrete at the strands’ center of gravity at transfer, as
referenced in Eq. 4-11, is calculated using Eq. 4-15. Meanwhile, the stress fcds in concrete at the
strands’ center of gravity due to superimposed dead loads applied after transfer is calculated
using Equation 4-16. For Grade 270 low-relaxation strands, the coefficients J and Kre in Eq. 4-14
are taken as 0.040 and 5000, respectively. The coefficient C in Eq. 4-14 may be obtained from
PCI Table 4.7.3.2, but it may also be calculated using either Equation 4-17 or 4-18.
2
gi icir cir
g g g
P Pe M ef KA I I
⎛ ⎞= + −⎜ ⎟⎜ ⎟
⎝ ⎠ (Eq. 4-15)
where: Kcir = 0.9 for pretensioned members Pi = initial prestressing force Mg = bending moment due to self-weight and permanent loads at transfer
= sdcds
g
M efI
(Eq. 4-16)
where: Msd = moment due to superimposed dead and sustained loads after transfer
0.54 :≥pi
pu
ff
0.550.21 0.9
⎡ ⎤⎛ ⎞ ⎛ ⎞⎢ ⎥⎜ ⎟ ⎜ ⎟⎜ ⎟ ⎜ ⎟⎢ ⎥⎝ ⎠ ⎝ ⎠= −⎢ ⎥⎢ ⎥⎢ ⎥⎣ ⎦
pi pi
pu pu
f ff f
C (Eq. 4-17)
0.54 :<pi
pu
ff
4.25
⎛ ⎞⎜ ⎟⎜ ⎟⎝ ⎠=
pi
pu
ff
C (Eq. 4-18)
4.4.3 ACI Committee 209 Method
While ACI Committee 343 (1995) utilizes the AASHTO separate lump sum method to
estimate prestress losses, ACI Committee 209 (2008) suggests an alternative approach
incorporating refined creep and shrinkage effects. The method outline below utilizes terminology
53
as presented in the ACI manual; variables repeated from previous text are not redefined. Total
losses are represented using Equation 4-19; the four terms in the equation represent losses due to
elastic shortening, concrete creep, concrete shrinkage, and steel relaxation, respectively.
( ) ( ) ( ) ( )12 1
sh st tt c c t sr t
o s
EFnf nf v fF n
ελ
ρξ⎛ ⎞
= + − + +⎜ ⎟ +⎝ ⎠ (Eq. 4-19)
where: λt = total losses n = modular ratio of steel to concrete at time of loading fc = concrete stress such at steel CG due to prestress and dead load vt = creep coefficient at any time Ft = total loss of prestress at any time minus the initial elastic loss Fo = prestress force at transfer, after elastic loss (εsh)t = shrinkage strain at any time ρ = reinforcement ratio ξs = cross section shape coefficient (fsr)t = stress loss due to steel relaxation in prestressed member at any time
As the ACI manual suggests, Fo, Ag, and Ig are frequently used as approximations to Fi,
At, and It in Equation 4-19, with Fo = Fi(1-nρ). Approximate values for the ratio Ft/Fo may be
obtained for normal-weight concrete from ACI Table 4.4.1.2 (ACI Committee 209). For a time
span of three weeks to one month between prestressing and sustained load application, the ratio
is taken as 0.10; for a time span of two to three months, the ratio is taken as 0.14; at ultimate, the
ratio is taken equal to 0.18. For low-relaxation strands, values of stress loss due to steel
relaxation may be obtained using ACI Table 4.4.1.3 (ACI Committee 209). For specimens with
0.65 < fpi/fpy < 0.80, steel relaxation may calculated using Equation 4-20, where t is the time after
initial stressing in hours. The ultimate steel relaxation may be taken equal to 0.025(fsi).
( ) ( )0.005 log( )sr sitf f t= (Eq. 4-20)
Values for the creep coefficient and shrinkage strain at any time are calculated using
Equations 4-21 and 4-22, respectively, where vu is the ultimate creep coefficient, (εsh)u is the
ultimate shrinkage strain, and t is the time after loading. In the absence of specific data,
recommended values for vu and (εsh)u are 2.35γc and 0.000780γsh, respectively, for moist-cured
concrete; γc and γsh are correction factors derived based on loading age, relative humidity,

54
specimen geometry, and initial moist curing (ACI Committee 209). For brevity, the correction
factors are not described in detail here, though they are included in example calculations in
Appendix C.
0.60
0.6010t utv v
t=
+ (Eq. 4-21)
( ) ( )35sh sht u
tt
ε ε=+
(Eq. 4-22)
According to ACI Committee 209, the correlation between measured and computed
prestress losses is reasonable but not accurate. With general knowledge of the environmental
conditions, load history, or concrete constituent properties of a specimen, calculated prestress
losses may be expected to correlate to actual losses within 15-20%. A more rigorous method of
computing prestress losses is the time-step method, where time-dependent losses are evaluated at
successive intervals over a specified length of time. In doing so, the interdependent effects of
relaxation, creep, and shrinkage, all of which occur at different rates, are included in analysis.
However, since the estimated long-term losses using the aforementioned methods were
reasonable, the time-step method was not utilized in this study.
Examples C.1-C.3 in Appendix C contain example prestress loss calculations for
specimen Box-1 to illustrate the execution of the aforementioned methods. Table 4.6 lists the
effective prestress in the box girders calculated using various methods; Table 4.7 lists the same
for the I-girders. For comparison, effective prestress was calculated using design and actual
concrete strengths, as well as curing ages of 28 and 365 days. To illustrate the time-dependent
behavior of prestress losses, total losses calculated via the ACI Committee 209 procedure are
plotted for specimen Box-1 in Figure 4.22.
As the two tables show, the difference in design and actual concrete strengths had little
impact on calculated effective prestress (less than 2 ksi difference). The time-dependent behavior
of creep and shrinkage are clearly evident in the fpe values calculated using the ACI Committee
209 method at concrete ages of 28 and 365 days. The AASHTO approximate lump sum, separate
lump sum, and ACI Committee 209 methods predict effective prestress in the box girders with
reasonable precision. However, the PCI method calculates effective prestress in the box girders
at approximately 6 ksi larger than the other three methods. Much greater variability is seen in the
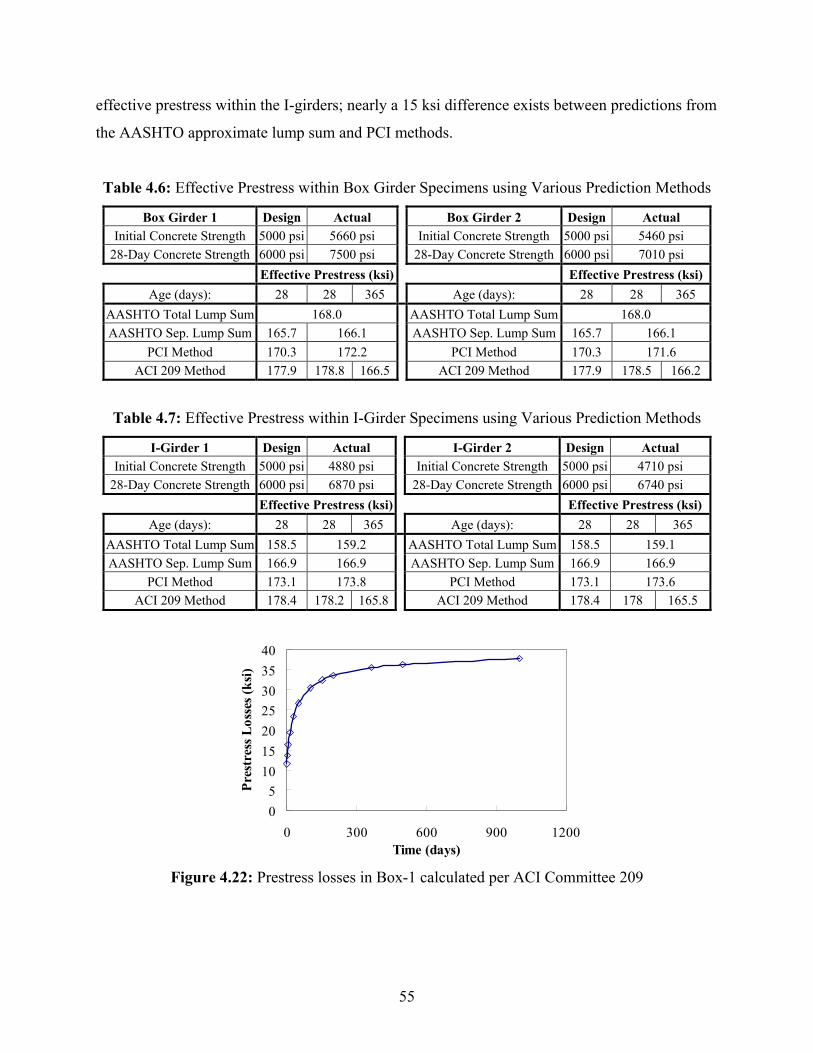
55
effective prestress within the I-girders; nearly a 15 ksi difference exists between predictions from
the AASHTO approximate lump sum and PCI methods.
Table 4.6: Effective Prestress within Box Girder Specimens using Various Prediction Methods
Box Girder 1 Design Actual Box Girder 2 Design Actual Initial Concrete Strength 5000 psi 5660 psi Initial Concrete Strength 5000 psi 5460 psi
28-Day Concrete Strength 6000 psi 7500 psi 28-Day Concrete Strength 6000 psi 7010 psi Effective Prestress (ksi) Effective Prestress (ksi)
Age (days): 28 28 365 Age (days): 28 28 365 AASHTO Total Lump Sum 168.0 AASHTO Total Lump Sum 168.0 AASHTO Sep. Lump Sum 165.7 166.1 AASHTO Sep. Lump Sum 165.7 166.1
PCI Method 170.3 172.2 PCI Method 170.3 171.6 ACI 209 Method 177.9 178.8 166.5 ACI 209 Method 177.9 178.5 166.2
Table 4.7: Effective Prestress within I-Girder Specimens using Various Prediction Methods
I-Girder 1 Design Actual I-Girder 2 Design Actual Initial Concrete Strength 5000 psi 4880 psi Initial Concrete Strength 5000 psi 4710 psi
28-Day Concrete Strength 6000 psi 6870 psi 28-Day Concrete Strength 6000 psi 6740 psi Effective Prestress (ksi) Effective Prestress (ksi)
Age (days): 28 28 365 Age (days): 28 28 365 AASHTO Total Lump Sum 158.5 159.2 AASHTO Total Lump Sum 158.5 159.1 AASHTO Sep. Lump Sum 166.9 166.9 AASHTO Sep. Lump Sum 166.9 166.9
PCI Method 173.1 173.8 PCI Method 173.1 173.6 ACI 209 Method 178.4 178.2 165.8 ACI 209 Method 178.4 178 165.5
05
10152025303540
0 300 600 900 1200Time (days)
Pres
tres
s Los
ses (
ksi)
Figure 4.22: Prestress losses in Box-1 calculated per ACI Committee 209
56
4.5 DEVELOPMENT LENGTH PREDICTIONS
Development lengths in the four specimens were predicted using Equation 2-2. Both the
effective prestress fpe and the nominal strand stress fps may vary depending on method of
calculation. Effective prestress was calculated using four different methods (Section 4.4). The
nominal strand stress was calculated using two methods, the first of which was the AASHTO
code approximation shown in Equation 4-22.
1ps pups
kcf fd
⎛ ⎞= −⎜ ⎟⎜ ⎟
⎝ ⎠ (Eq. 4-22)
where: c = neutral axis depth dps = depth of center of gravity of prestressing steel k = defined by Equation 4-23
2 1.04 py
pu
fk
f⎛ ⎞
= −⎜ ⎟⎜ ⎟⎝ ⎠
(Eq. 4-23)
Nominal strand stress was also calculated using constitutive stress-strain material properties of
270-ksi prestressing strand. In this iterative method, three strain components are calculated for an
assumed nominal stress fps; if the sum of the three strains is within reasonable tolerance of the
corresponding strain on the strand’s stress-strain curve, the fps is acceptable. The procedure is
outlined in Equations 4-24 through 4-27. The first strain is due to the effective prestressing load,
without self-weight; the second strain is due to the load required to negate the effect of camber;
the third strain is the additional strain required to reach ultimate failure. Only the third strain
depends on the assumed nominal stress.
1pe
ps
fE
ε = (Eq. 4-24)
2
21
c
Fe FeE A I
ε⎛ ⎞
= +⎜ ⎟⎝ ⎠
(Eq. 4-25)
( )
3
0.003 psd cc
ε−
= , where 10.85
ps ps
c
A fc
f bβ= (Eq. 4-26)
1 2 3total stress strain OKε ε ε ε ε −= + + ≈ → (Eq. 4-27)
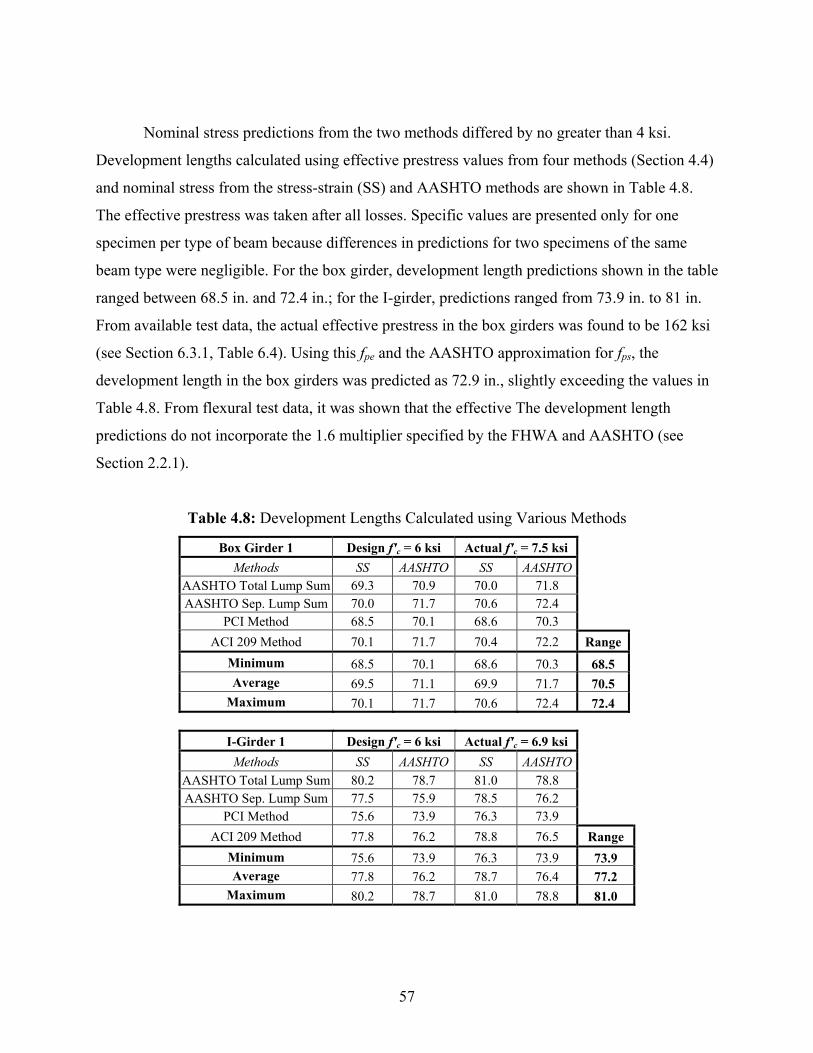
57
Nominal stress predictions from the two methods differed by no greater than 4 ksi.
Development lengths calculated using effective prestress values from four methods (Section 4.4)
and nominal stress from the stress-strain (SS) and AASHTO methods are shown in Table 4.8.
The effective prestress was taken after all losses. Specific values are presented only for one
specimen per type of beam because differences in predictions for two specimens of the same
beam type were negligible. For the box girder, development length predictions shown in the table
ranged between 68.5 in. and 72.4 in.; for the I-girder, predictions ranged from 73.9 in. to 81 in.
From available test data, the actual effective prestress in the box girders was found to be 162 ksi
(see Section 6.3.1, Table 6.4). Using this fpe and the AASHTO approximation for fps, the
development length in the box girders was predicted as 72.9 in., slightly exceeding the values in
Table 4.8. From flexural test data, it was shown that the effective The development length
predictions do not incorporate the 1.6 multiplier specified by the FHWA and AASHTO (see
Section 2.2.1).
Table 4.8: Development Lengths Calculated using Various Methods
Box Girder 1 Design f′c = 6 ksi Actual f′c = 7.5 ksi Methods SS AASHTO SS AASHTO
AASHTO Total Lump Sum 69.3 70.9 70.0 71.8 AASHTO Sep. Lump Sum 70.0 71.7 70.6 72.4
PCI Method 68.5 70.1 68.6 70.3 ACI 209 Method 70.1 71.7 70.4 72.2 Range
Minimum 68.5 70.1 68.6 70.3 68.5 Average 69.5 71.1 69.9 71.7 70.5
Maximum 70.1 71.7 70.6 72.4 72.4
I-Girder 1 Design f′c = 6 ksi Actual f′c = 6.9 ksi Methods SS AASHTO SS AASHTO
AASHTO Total Lump Sum 80.2 78.7 81.0 78.8 AASHTO Sep. Lump Sum 77.5 75.9 78.5 76.2
PCI Method 75.6 73.9 76.3 73.9 ACI 209 Method 77.8 76.2 78.8 76.5 Range
Minimum 75.6 73.9 76.3 73.9 73.9 Average 77.8 76.2 78.7 76.4 77.2
Maximum 80.2 78.7 81.0 78.8 81.0
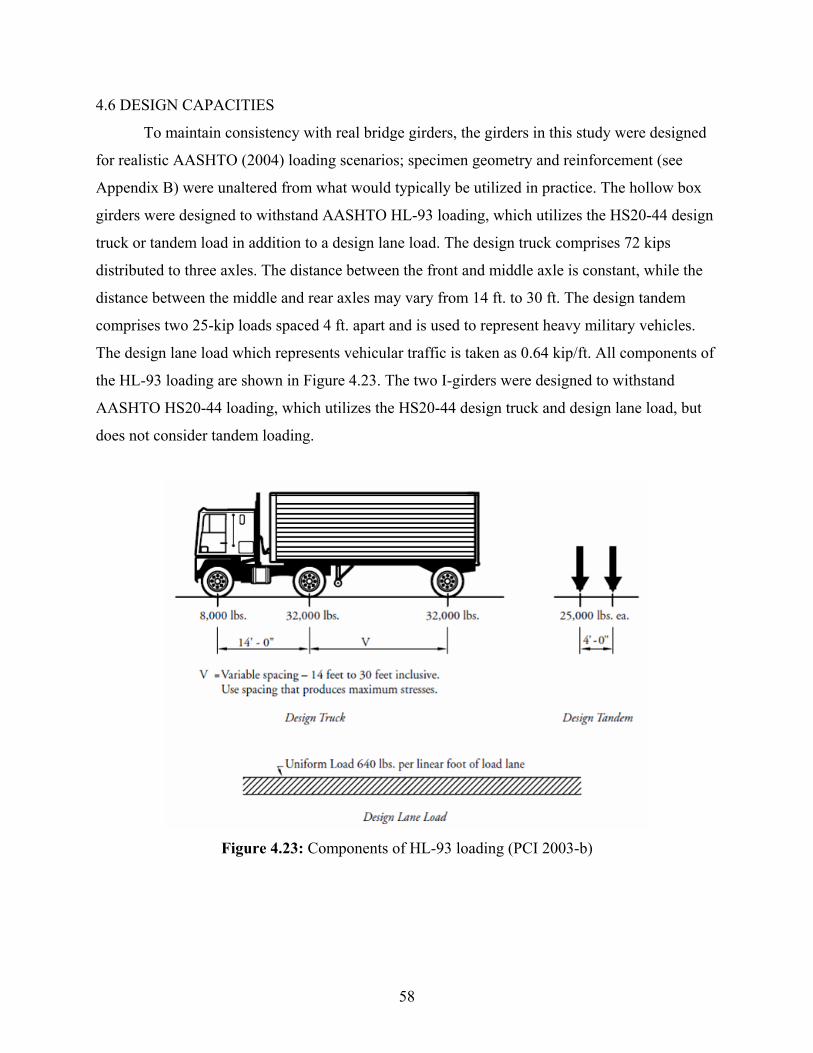
58
4.6 DESIGN CAPACITIES
To maintain consistency with real bridge girders, the girders in this study were designed
for realistic AASHTO (2004) loading scenarios; specimen geometry and reinforcement (see
Appendix B) were unaltered from what would typically be utilized in practice. The hollow box
girders were designed to withstand AASHTO HL-93 loading, which utilizes the HS20-44 design
truck or tandem load in addition to a design lane load. The design truck comprises 72 kips
distributed to three axles. The distance between the front and middle axle is constant, while the
distance between the middle and rear axles may vary from 14 ft. to 30 ft. The design tandem
comprises two 25-kip loads spaced 4 ft. apart and is used to represent heavy military vehicles.
The design lane load which represents vehicular traffic is taken as 0.64 kip/ft. All components of
the HL-93 loading are shown in Figure 4.23. The two I-girders were designed to withstand
AASHTO HS20-44 loading, which utilizes the HS20-44 design truck and design lane load, but
does not consider tandem loading.
Figure 4.23: Components of HL-93 loading (PCI 2003-b)

59
A MATLAB® code was utilized to generate the shear and moment envelopes for both
specimen types. The code incorporated all loading scenarios including variable axle distance and
vehicle position, load factors specified by AASHTO, and dead load due to beam self-weight and
a superimposed bridge deck. The superimposed dead load was taken as 1.0 kip/ft., equivalent to
a 10-ft. wide, 8-in. thick deck. All analyses utilized a 1.75 live load factor, a 1.25 dead load
factor, and a 1.33 impact factor; the impact factor accounts for the 33% dynamic load allowance
specified by AASHTO and was applied only to the design truck and tandem loads. The code also
incorporated shear and moment distribution factors used to distribute loads from a full lane to an
individual girder. The demand envelopes for the box girders are shown in Figure 4.24, and the
envelopes for the I-girders are shown in Figure 4.25. The figures also display as-built sectional
capacities for each specimen; shear capacities were calculated using both ACI and AASHTO
methods, flexural capacity was calculated using the AASHTO fps, and all calculations utilized the
6000 psi design strength. Example calculations for each method may be found in Appendix D.
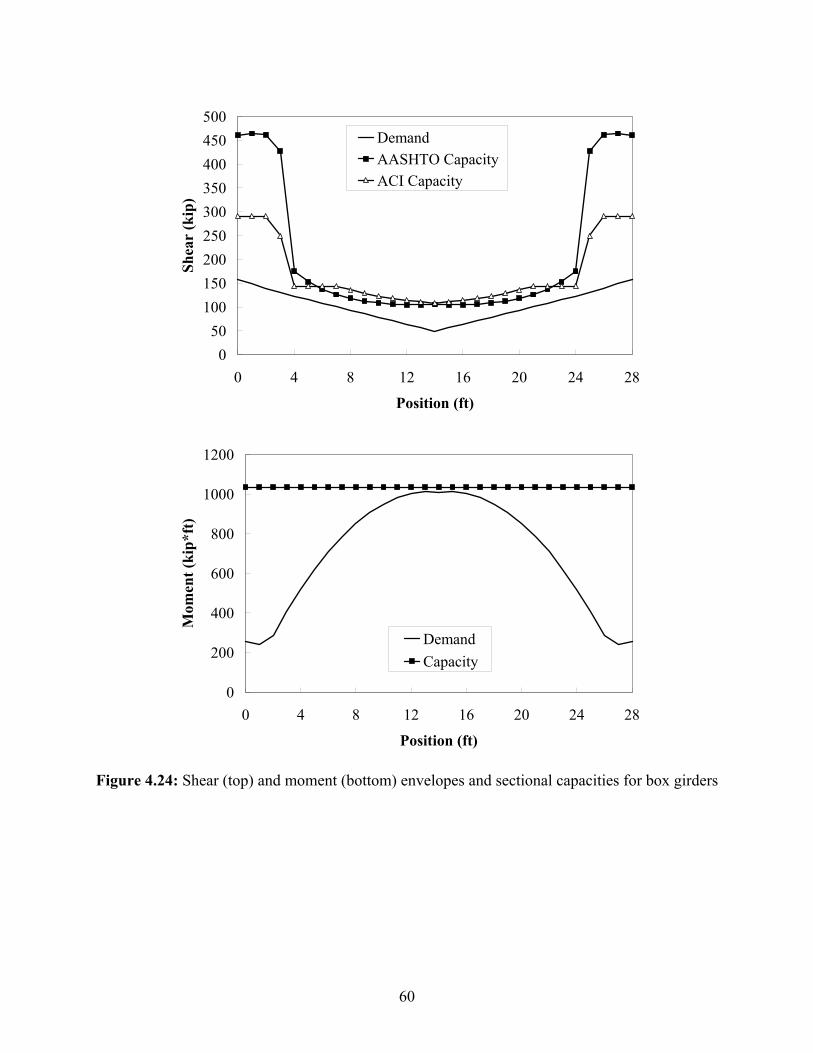
60
050
100150200250300350400450500
0 4 8 12 16 20 24 28
Position (ft)
Shea
r (k
ip)
DemandAASHTO CapacityACI Capacity
0
200
400
600
800
1000
1200
0 4 8 12 16 20 24 28
Position (ft)
Mom
ent (
kip*
ft)
DemandCapacity
Figure 4.24: Shear (top) and moment (bottom) envelopes and sectional capacities for box girders
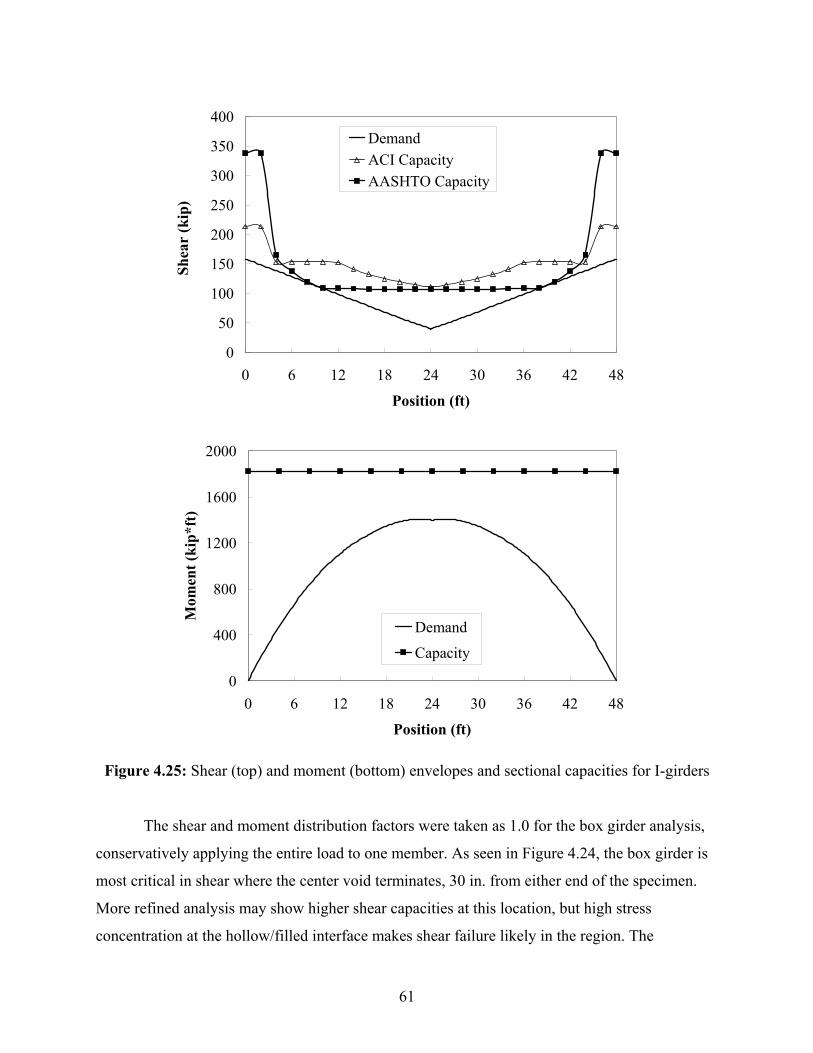
61
0
50
100
150
200
250
300
350
400
0 6 12 18 24 30 36 42 48
Position (ft)
Shea
r (k
ip)
DemandACI CapacityAASHTO Capacity
0
400
800
1200
1600
2000
0 6 12 18 24 30 36 42 48
Position (ft)
Mom
ent (
kip*
ft)
Demand
Capacity
Figure 4.25: Shear (top) and moment (bottom) envelopes and sectional capacities for I-girders
The shear and moment distribution factors were taken as 1.0 for the box girder analysis,
conservatively applying the entire load to one member. As seen in Figure 4.24, the box girder is
most critical in shear where the center void terminates, 30 in. from either end of the specimen.
More refined analysis may show higher shear capacities at this location, but high stress
concentration at the hollow/filled interface makes shear failure likely in the region. The

62
theoretical moment capacity of 1035 kip-ft is adequate for the 28-ft. specimen under the
prescribed loading.
The capacities shown in Figure 4.25 were calculated using the composite I-girder, with
an 8 in. thick and 30 in. wide slab. Demand was calculated using assumed 6-ft. center-to-center
beam spacing, resulting in shear and moment distribution factors of 75% and 60%, respectively.
Akin to the box girder, the I-girder is more vulnerable in shear than in flexure; especially
between 4 ft. and 10 ft. from either end of the specimen. Within this region the stirrup area
decreases from 0.8 in2 to 0.4 in2 and stirrup spacing increases from 6 in. to 12 in. on center (see
Figure B.5). The theoretical moment of the composite section was found to be 1800 kip-ft; as the
figure shows, the as-built girder is adequate for the prescribed loading. The nominal stress at
ultimate failure (fps) was calculated as 263 ksi and 266.4 ksi using an AASHTO approximation
and strain compatibility, respective.
4.7 SUPPLEMENTARY SHEAR REINFORCEMENT
As discussed in Section 4.6, one of the key characteristics of the specimens used in this
study is that they were designed for realistic AASHTO (2004) load conditions, resulting in
girders which were more vulnerable in shear than flexure within the vicinity of the development
length. As such, it was anticipated that the girders would fail in shear prior to reaching nominal
moment capacity at the loaded section. To maintain consistency between the tested specimens
and real bridge girders, no additional internal shear reinforcement was added; however, in one
trial an attempt was made to increase the shear strength of the girder in the shear-vulnerable
region through the use of external Carbon Fiber Reinforced Polymer (CFRP) sheets. Studies by
Norris et al. (1997) and Kachlakev and McCurry (2000) have shown bonded FRP to be effective
in strengthening concrete members in shear. One benefit of using CFRP sheets is that the
external application had no impact on the flow of the concrete during casting or the bond
between concrete and internal strands. This section summarizes the ACI Committee 440 (2008)
design procedure for external FRP reinforcement and describes the application process for
specimen Box-2.
63
4.7.1 ACI Design Procedure for External FRP Reinforcement
ACI Committee 440 (2008) outlines a design procedure for strengthening of concrete
specimens using externally-bonded FRP, an extremely efficient material whose relevance in
structural applications continues to grow. The procedure draws upon basic design principles and
recent experimental results to predict the actual strength contribution of FRP systems. The
nominal shear strength of a member reinforced with FRP may be calculated using Equation 4-28.
The strength reduction factor Ψf derives from reliability analyses and is taken equal to 0.85 for
three-sided wraps and equal to 0.95 for fully wrapped reinforcement. The nominal FRP shear
strength Vf is determined in essentially the same manner as the nominal strength of steel stirrups.
As shown in Equation 4-29, Vf accounts for the orientation and CL-to-CL spacing of FRP strips.
Where strips are placed adjacent to one another, forming a continuous wrap, the spacing term sf
is taken equivalent to the width of the entire wrap. The depth dfv is the distance from the top of
the FRP to the depth of tensile steel. The combined nominal steel and FRP shear strength must
not exceed the limit in Equation 4-30.
( )Φ = Φ + +Ψn c s f fV V V V (Eq. 4-28)
where: Vc = concrete shear strength from Ch. 11 of ACI 318-08 Vs = steel contribution to shear strength from Ch. 11 of ACI 318-08 Vf = FRP contribution to shear strength from Section 11.4 in ACI 440.2R-08 Ψf = 0.85 for 3-sided wraps, 0.95 for full wraps (Table 11.1, ACI 440.2R-08)
(sin cos )fv fe fv
ff
A f dV
sα α+
= (Eq. 4-29)
where: Afv = total cross-sectional area of FRP acting in shear: 2tfwfnlayers ffe = effective stress in FRP
8s f w cV V b d f ′+ ≤ (Eq. 4-30)
The effective stress ffe in Eq. 4-29 is the product of the FRP’s tensile modulus and the
effective strain εfe; the effective strain is calculated by applying reduction factors to the ultimate
FRP strain εfu to account for concrete strength and wrapping configuration. For U-wraps, where
reinforcement covers only three sides of a specimen, adjustment factors may be calculated in
64
using Equations 4-31 through 4-35 in accordance with Section 11.4.1.2 of ACI 440.2R-08. For
the case of fully-wrapped FRP, the effective strain may be taken as a maximum 0.004 ≤ 0.75εfu.
The 0.004 limit is imposed to preclude failure due to loss of aggregate interlock, which has been
observed in experimental tests (ACI Committee 440). For long-term effects, ACI Table 9.1
provides environmental reduction factors applied to the ultimate FRP strength and strain
provided by manufacturers; the factor for interior exposure to carbon fiber is 0.95.
fe v fuε κ ε= (Eq. 4-31)
1 2
468e
vfu
k k Lκε
= (Eq. 4-32)
2/3
1 4000cfk′⎛ ⎞= ⎜ ⎟
⎝ ⎠ (Eq. 4-33)
2fv e
fv
d Lk
d−
= (Eq. 4-34)
0.58
2500( )
=ef f
Lnt E
(Eq. 4-35)
4.7.2 External CFRP Wrap for Specimen Box-2
To increase the shear strength of one end of specimen Box-2, a CFRP wrap was applied
in the shear-vulnerable region prior to testing. Five coupon tests were conducted to evaluate the
tensile modulus and strength of the composite formed with unidirectional carbon fabric and a
saturating epoxy resin. Coupons were 0.6 in. x 14 in., and each had 4-in. long perforated plastic
tabs at either end for gripping within the loading apparatus. The specimens were formed by
saturating two 0.014-in. thick layers of fabric with an epoxy resin designed to have a 120-minute
pot life. Specimens were cured for 36 hours prior to testing. The average tensile modulus and
ultimate strength of the composite coupons were 19694 ksi and 284 ksi, respectively. The
coupon specimens consistently failed at the location of grips due to high stress concentration or
fracture of the plastic tabs; therefore, the average modulus and strength values were probably
conservative.
Following the method described in Section 4.7.1, it was determined that two layers of
0.014-in. thick, unidirectional carbon fabric wrapped entirely around an 18-in. wide section of

65
the girder (see Figure 4.26) would provide sufficient shear strength for the intended loading. No
portion of the wrap was placed less than 20.3 in. away from the point of load; in this
configuration, the CFRP would not interfere with plastic hinge development, nor would it cover
the end of the specimen where shear was already adequate. The girder was first prepared by
roughening the smoothed concrete surface with an electric diamond-toothed grinder to facilitate
better adhesion between the FRP and concrete. The effect of grinding is illustrated in Figure
4.27. After the roughened surface had been cleaned, a first coat of epoxy resin was applied
directly to the concrete. Then, the first layer of carbon fabric was pressed onto the epoxy and
held firmly in place. An absorbent roller was utilized to impregnate the fabric with another layer
of epoxy resin, as shown in Figures 4.28 and 4.29. The process was repeated for the second layer
of fabric. The final wrap is shown in Figure 4.30. Care was taken to ensure the fabric was
completely saturated, and excess resin was removed by lightly pulling a rubber squeegee along
the contour of the beam.
65 in. shear span
20-¼ in.18 in
CFRP wrap
Figure 4.26: CFRP Wrap Location on Box-2

66
Figure 4.27: Surface roughened with toothed grinder
Figure 4.29: First epoxy/fabric layer applied to Box-2
Figure 4.28: Placing the first epoxy/fabric on Box-2
Figure 4.30: Final CFRP wrap on specimen Box-2

67
CHAPTER 5: TRANSFER LENGTH
After fabrication, transfer lengths in the four full-scale girders were measured between
August 27, 2009 and September 28, 2009. Measurements were taken at 16 locations to obtain
average transfer lengths for the eight girder ends and each girder as a whole. Experimental data
was compared to ACI (2008) and AASHTO (2004) requirements. Additionally, transfer lengths
were compared to analytical predictions proposed in the literature.
5.1 MEASUREMENTS
After 20 hours of moist curing, forms for all girders were removed to provide access for
attaching surface-strain target points, which were used to obtain longitudinal strain profiles at the
ends of specimens. For each girder, 0.39-in. diameter stainless steel target points were glued to
each side of both ends at a depth corresponding to strands’ center of gravity; five-minute metal-
concrete epoxy was used, and concrete surfaces were wiped clean prior to application. Figure 5.1
and Figure 5.2 show targets attached to specimens Box-1 and I-1, respectively. Targets were
spaced 2 in. apart on specimens Box-1 and I-1, 4 in. apart on specimens Box-2 and I-2, and were
extended approximately 45 in. from the end of each beam. Prior to releasing the pretensioned
strands, initial distance measurements were taken between each pair of target points using a
mechanical gauge with 4-in. length.
Strands were released after 24 hours of curing; Box-1 and Box-2 had reached 5660 psi
and 5460 psi strengths, respectively, while I-1 and I-2 had reached 4880 psi and 4710 psi
strengths, respectively. Although the latter two girders did not meet the specified 5000 psi
release strength, it was deemed appropriate to release all four specimens so that subsequent
measurements could proceed on the same day. Strands were flame-cut (see Figure 4.3 for cutting
locations), and distances between target points were measured immediately after release. In
conjunction with the initial target point measurements, these readings were then used to develop
a strain profile for all sides and ends of the beams. The specimens were moved from their casting
beds to the fabrication plant yard after 1-day measurements were complete. The beams remained
unmoved in the yard for measurements taken 3, 7, 14, and 28 days after concrete placement.
For each day of transfer length measurements, seven concrete compressive cylinder tests
were performed to determine the strength of the beams. The top and bottom cylinder surfaces
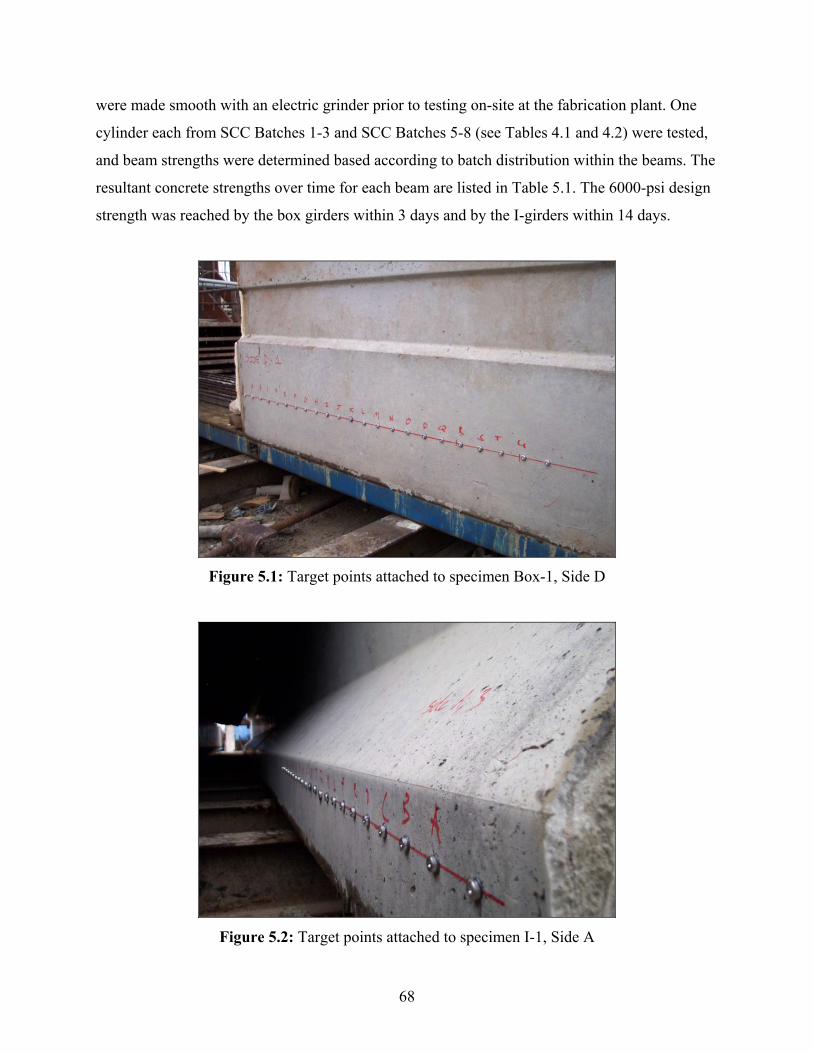
68
were made smooth with an electric grinder prior to testing on-site at the fabrication plant. One
cylinder each from SCC Batches 1-3 and SCC Batches 5-8 (see Tables 4.1 and 4.2) were tested,
and beam strengths were determined based according to batch distribution within the beams. The
resultant concrete strengths over time for each beam are listed in Table 5.1. The 6000-psi design
strength was reached by the box girders within 3 days and by the I-girders within 14 days.
Figure 5.1: Target points attached to specimen Box-1, Side D
Figure 5.2: Target points attached to specimen I-1, Side A
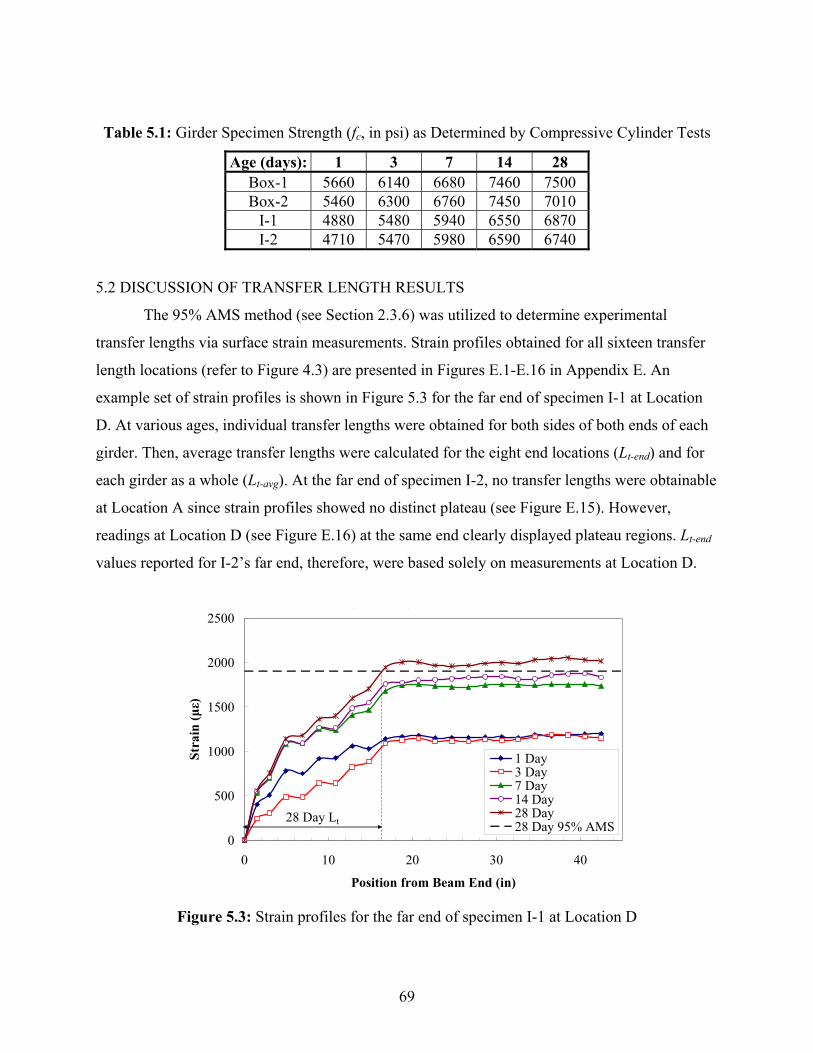
69
Table 5.1: Girder Specimen Strength (fc, in psi) as Determined by Compressive Cylinder Tests
Age (days): 1 3 7 14 28 Box-1 5660 6140 6680 7460 7500 Box-2 5460 6300 6760 7450 7010
I-1 4880 5480 5940 6550 6870 I-2 4710 5470 5980 6590 6740
5.2 DISCUSSION OF TRANSFER LENGTH RESULTS
The 95% AMS method (see Section 2.3.6) was utilized to determine experimental
transfer lengths via surface strain measurements. Strain profiles obtained for all sixteen transfer
length locations (refer to Figure 4.3) are presented in Figures E.1-E.16 in Appendix E. An
example set of strain profiles is shown in Figure 5.3 for the far end of specimen I-1 at Location
D. At various ages, individual transfer lengths were obtained for both sides of both ends of each
girder. Then, average transfer lengths were calculated for the eight end locations (Lt-end) and for
each girder as a whole (Lt-avg). At the far end of specimen I-2, no transfer lengths were obtainable
at Location A since strain profiles showed no distinct plateau (see Figure E.15). However,
readings at Location D (see Figure E.16) at the same end clearly displayed plateau regions. Lt-end
values reported for I-2’s far end, therefore, were based solely on measurements at Location D.
, ,
0
500
1000
1500
2000
2500
0 10 20 30 40
Position from Beam End (in)
Stra
in (μ
ε)
1 Day3 Day7 Day14 Day28 Day28 Day 95% AMS
28 Day Lt
Figure 5.3: Strain profiles for the far end of specimen I-1 at Location D
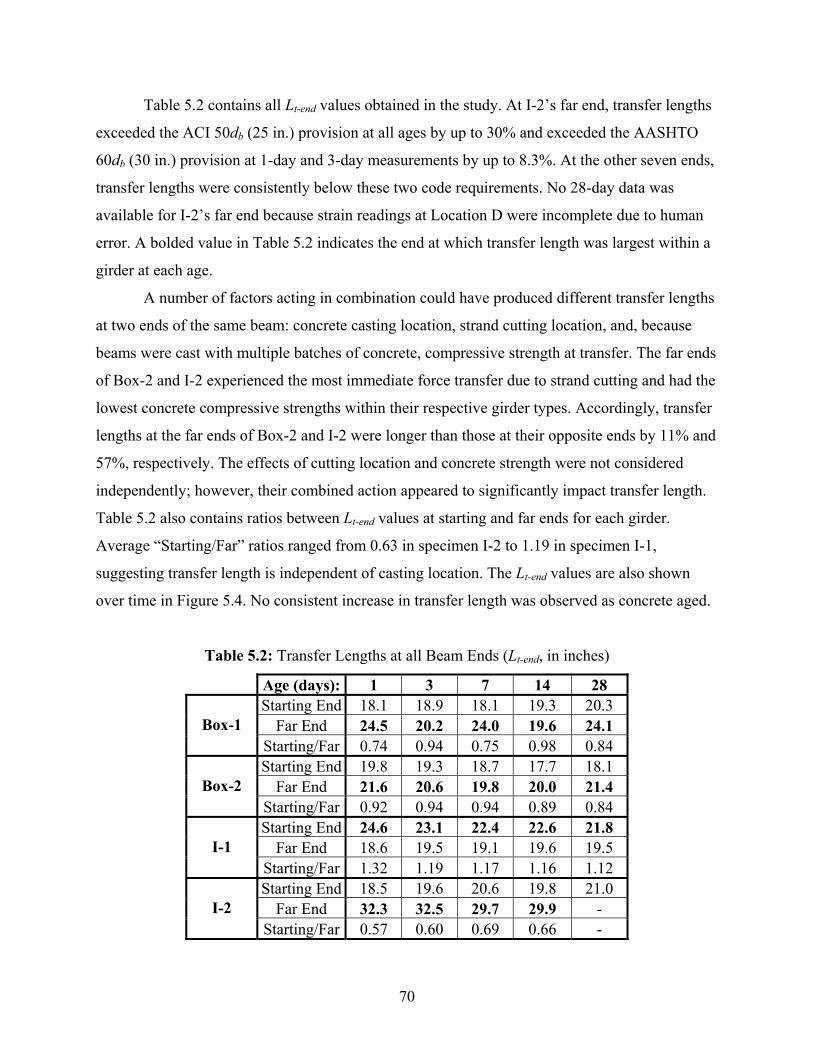
70
Table 5.2 contains all Lt-end values obtained in the study. At I-2’s far end, transfer lengths
exceeded the ACI 50db (25 in.) provision at all ages by up to 30% and exceeded the AASHTO
60db (30 in.) provision at 1-day and 3-day measurements by up to 8.3%. At the other seven ends,
transfer lengths were consistently below these two code requirements. No 28-day data was
available for I-2’s far end because strain readings at Location D were incomplete due to human
error. A bolded value in Table 5.2 indicates the end at which transfer length was largest within a
girder at each age.
A number of factors acting in combination could have produced different transfer lengths
at two ends of the same beam: concrete casting location, strand cutting location, and, because
beams were cast with multiple batches of concrete, compressive strength at transfer. The far ends
of Box-2 and I-2 experienced the most immediate force transfer due to strand cutting and had the
lowest concrete compressive strengths within their respective girder types. Accordingly, transfer
lengths at the far ends of Box-2 and I-2 were longer than those at their opposite ends by 11% and
57%, respectively. The effects of cutting location and concrete strength were not considered
independently; however, their combined action appeared to significantly impact transfer length.
Table 5.2 also contains ratios between Lt-end values at starting and far ends for each girder.
Average “Starting/Far” ratios ranged from 0.63 in specimen I-2 to 1.19 in specimen I-1,
suggesting transfer length is independent of casting location. The Lt-end values are also shown
over time in Figure 5.4. No consistent increase in transfer length was observed as concrete aged.
Table 5.2: Transfer Lengths at all Beam Ends (Lt-end, in inches)
Age (days): 1 3 7 14 28 Starting End 18.1 18.9 18.1 19.3 20.3
Far End 24.5 20.2 24.0 19.6 24.1 Box-1 Starting/Far 0.74 0.94 0.75 0.98 0.84 Starting End 19.8 19.3 18.7 17.7 18.1
Far End 21.6 20.6 19.8 20.0 21.4 Box-2 Starting/Far 0.92 0.94 0.94 0.89 0.84 Starting End 24.6 23.1 22.4 22.6 21.8
Far End 18.6 19.5 19.1 19.6 19.5 I-1 Starting/Far 1.32 1.19 1.17 1.16 1.12 Starting End 18.5 19.6 20.6 19.8 21.0
Far End 32.3 32.5 29.7 29.9 - I-2 Starting/Far 0.57 0.60 0.69 0.66 -
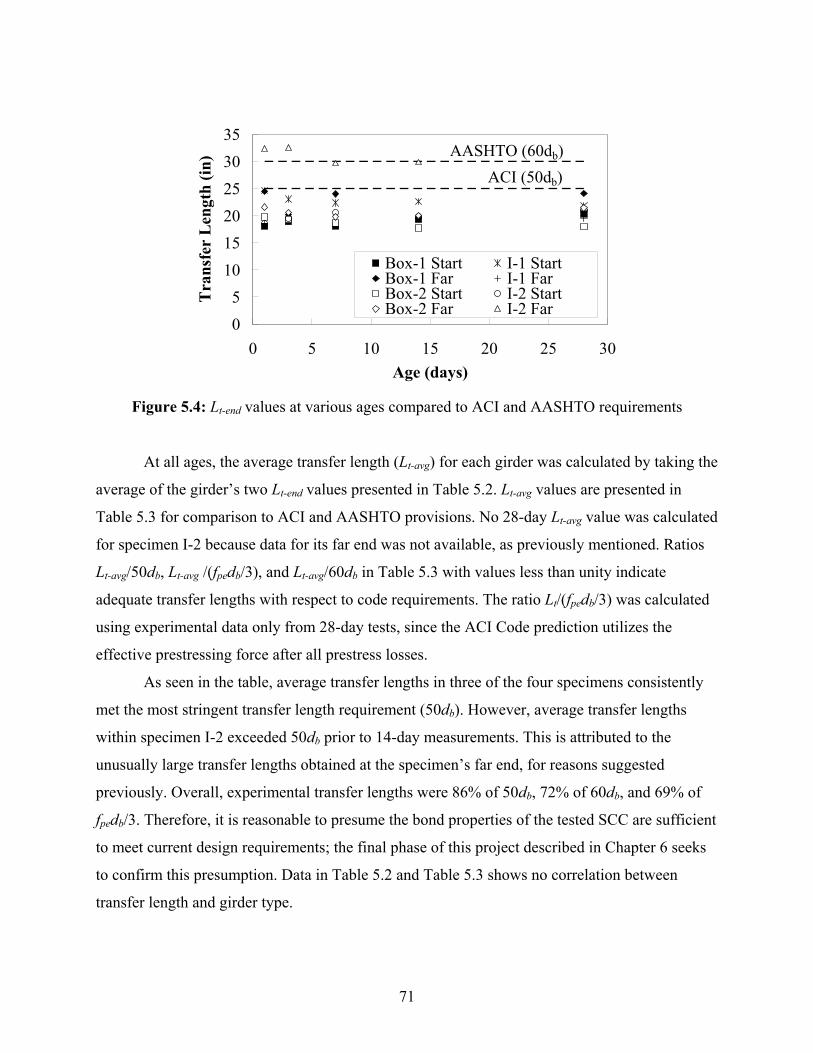
71
05
101520253035
0 5 10 15 20 25 30Age (days)
Tra
nsfe
r L
engt
h (in
)
Box-1 Start I-1 StartBox-1 Far I-1 FarBox-2 Start I-2 StartBox-2 Far I-2 Far
ACI (50db)AASHTO (60db)
Figure 5.4: Lt-end values at various ages compared to ACI and AASHTO requirements
At all ages, the average transfer length (Lt-avg) for each girder was calculated by taking the
average of the girder’s two Lt-end values presented in Table 5.2. Lt-avg values are presented in
Table 5.3 for comparison to ACI and AASHTO provisions. No 28-day Lt-avg value was calculated
for specimen I-2 because data for its far end was not available, as previously mentioned. Ratios
Lt-avg/50db, Lt-avg /(fpedb/3), and Lt-avg/60db in Table 5.3 with values less than unity indicate
adequate transfer lengths with respect to code requirements. The ratio Lt/(fpedb/3) was calculated
using experimental data only from 28-day tests, since the ACI Code prediction utilizes the
effective prestressing force after all prestress losses.
As seen in the table, average transfer lengths in three of the four specimens consistently
met the most stringent transfer length requirement (50db). However, average transfer lengths
within specimen I-2 exceeded 50db prior to 14-day measurements. This is attributed to the
unusually large transfer lengths obtained at the specimen’s far end, for reasons suggested
previously. Overall, experimental transfer lengths were 86% of 50db, 72% of 60db, and 69% of
fpedb/3. Therefore, it is reasonable to presume the bond properties of the tested SCC are sufficient
to meet current design requirements; the final phase of this project described in Chapter 6 seeks
to confirm this presumption. Data in Table 5.2 and Table 5.3 shows no correlation between
transfer length and girder type.
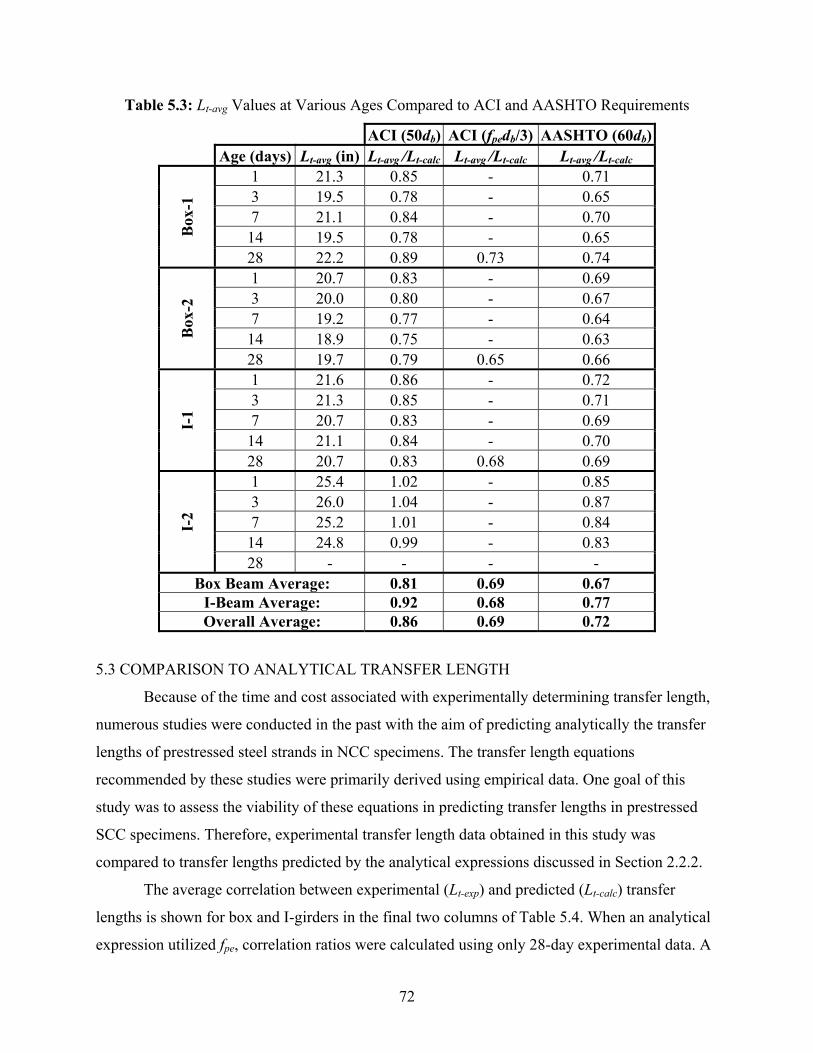
72
Table 5.3: Lt-avg Values at Various Ages Compared to ACI and AASHTO Requirements
ACI (50db) ACI (fpedb/3) AASHTO (60db) Age (days) Lt-avg (in) Lt-avg /Lt-calc Lt-avg /Lt-calc Lt-avg /Lt-calc
1 21.3 0.85 - 0.71 3 19.5 0.78 - 0.65 7 21.1 0.84 - 0.70 14 19.5 0.78 - 0.65 B
ox-1
28 22.2 0.89 0.73 0.74 1 20.7 0.83 - 0.69 3 20.0 0.80 - 0.67 7 19.2 0.77 - 0.64 14 18.9 0.75 - 0.63 B
ox-2
28 19.7 0.79 0.65 0.66 1 21.6 0.86 - 0.72 3 21.3 0.85 - 0.71 7 20.7 0.83 - 0.69 14 21.1 0.84 - 0.70
I-1
28 20.7 0.83 0.68 0.69 1 25.4 1.02 - 0.85 3 26.0 1.04 - 0.87 7 25.2 1.01 - 0.84 14 24.8 0.99 - 0.83
I-2
28 - - - - Box Beam Average: 0.81 0.69 0.67
I-Beam Average: 0.92 0.68 0.77 Overall Average: 0.86 0.69 0.72
5.3 COMPARISON TO ANALYTICAL TRANSFER LENGTH
Because of the time and cost associated with experimentally determining transfer length,
numerous studies were conducted in the past with the aim of predicting analytically the transfer
lengths of prestressed steel strands in NCC specimens. The transfer length equations
recommended by these studies were primarily derived using empirical data. One goal of this
study was to assess the viability of these equations in predicting transfer lengths in prestressed
SCC specimens. Therefore, experimental transfer length data obtained in this study was
compared to transfer lengths predicted by the analytical expressions discussed in Section 2.2.2.
The average correlation between experimental (Lt-exp) and predicted (Lt-calc) transfer
lengths is shown for box and I-girders in the final two columns of Table 5.4. When an analytical
expression utilized fpe, correlation ratios were calculated using only 28-day experimental data. A
73
ratio Lt-exp /Lt-calc less than unity shows an expression to overestimate transfer length. All
equations in Table 5.4 overestimated the average transfer lengths obtained in this study.
However, experimental data showed better correlation to predictions incorporating initial
prestress and concrete compressive strength, regardless of whether f′ci or √f′ci was used, than to
predictions incorporating effective prestress or no concrete strength. The formulas proposed by
Marti-Vargas et al. (2007-b) and Zia and Mostafa (1977) most accurately predicted box beam
transfer lengths with Lt-exp /Lt-calc ratios of 0.95. Marti-Vargas et al. (2007-b) also most accurately
predicted I-beam transfer lengths with a Lt-exp /Lt-calc ratio of 0.99.
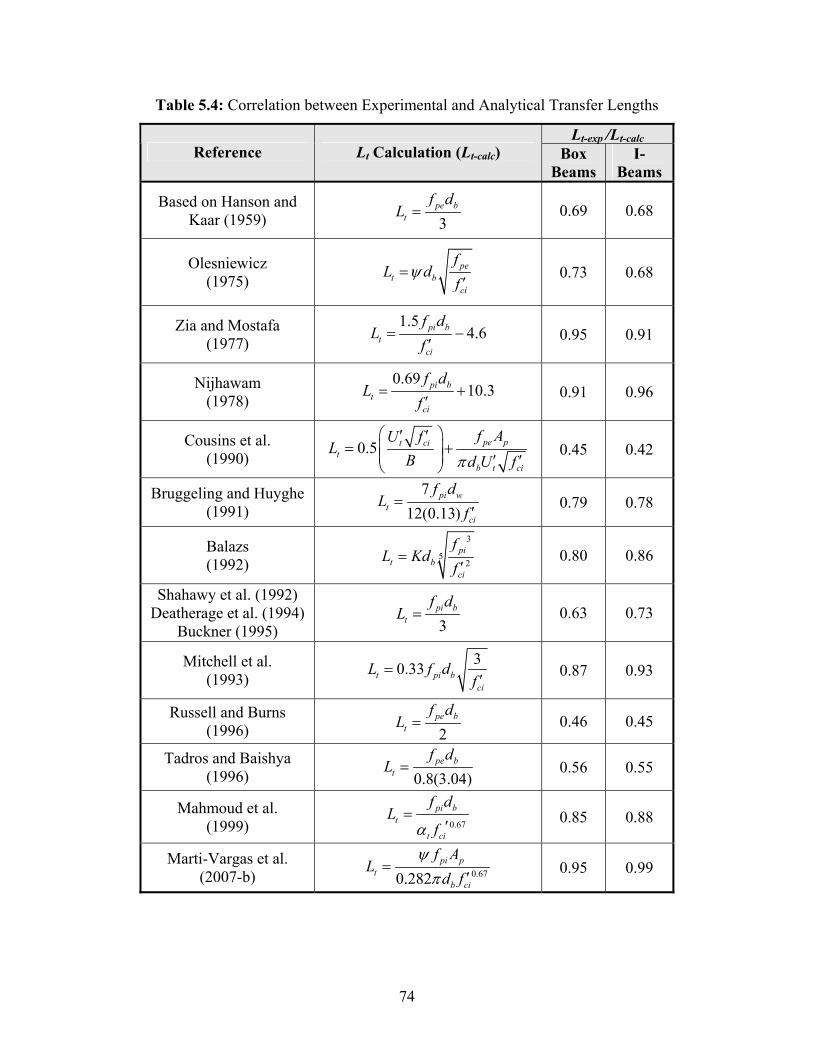
74
Table 5.4: Correlation between Experimental and Analytical Transfer Lengths
Lt-exp /Lt-calc Reference Lt Calculation (Lt-calc) Box
Beams I-
Beams
Based on Hanson and Kaar (1959) 3
pe bt
f dL = 0.69 0.68
Olesniewicz (1975)
pet b
ci
fL d
fψ=
′ 0.73 0.68
Zia and Mostafa (1977)
1.54.6= −
′pi b
tci
f dL
f 0.95 0.91
Nijhawam (1978)
0.6910.3= +
′pi b
tci
f dL
f 0.91 0.96
Cousins et al. (1990)
0.5π
⎛ ⎞′ ′= +⎜ ⎟⎜ ⎟ ′ ′⎝ ⎠
pe pt cit
b t ci
f AU fL
B d U f 0.45 0.42
Bruggeling and Huyghe (1991)
712(0.13)
pi wt
ci
f dL
f=
′ 0.79 0.78
Balazs (1992)
3
52=′pi
t bci
fL Kd
f 0.80 0.86
Shahawy et al. (1992) Deatherage et al. (1994)
Buckner (1995) 3pi b
t
f dL = 0.63 0.73
Mitchell et al. (1993)
30.33=′t pi b
ci
L f df
0.87 0.93
Russell and Burns (1996) 2
pe bt
f dL = 0.46 0.45
Tadros and Baishya (1996) 0.8(3.04)
pe bt
f dL = 0.56 0.55
Mahmoud et al. (1999) 0.67
pi bt
t ci
f dL
fα=
′ 0.85 0.88
Marti-Vargas et al. (2007-b) 0.670.282
ψπ
=′
pi pt
b ci
f AL
d f 0.95 0.99

75
CHAPTER 6: DEVELOPMENT LENGTH
After completion of the final 28-day transfer length tests, the four girder specimens were
transported to the Newmark Structural Engineering Laboratory at UIUC, where development
length tests were conducted. Testing of the two box girders was conducted first, followed by
testing of the two I-girders. At the time this thesis was composed, development length tests on
the I-girders were not complete; thus, this chapter presents details only of test setup,
observations, and results for the two box girder specimens. A total of four flexural tests were
executed to determine the development length of strands in the box girders (see Section 2.3.7).
Concrete cracking, concrete strain, deflection, and strand end-slip were monitored continuously
throughout each test. Experimental results presented herein are compared to current ACI (2008)
and AASHTO (2004) requirements, as well as theoretical shear and moment capacities.
6.1 THREE-POINT FLEXURAL TEST SETUP
6.1.1 Loading Frame
The structural loading frame utilized during testing was designed to apply forces up to
600 kip to the girder specimens. The loading frame components are shown in Figure 6.1, with
pertinent dimensions called out in the frame plan shown in Figure 6.2 and frame elevations
shown in Figures 6.3 and 6.4. The 4 built-up columns were bolted to the structural testing floor.
Two pairs of channels, each with 19-in. depth, 11.13-in. flange width, and 0.625-in. web width,
extended between the columns and were bolted to the columns. A 29.9-in. deep I-beam stiffened
with 0.325-in. thick 36 ksi plates was oriented in the longitudinal direction of the test specimens
and was attached to the channels using mechanical clamping devices.
Attached to the I-beam were two manually-controlled hydraulic rams with 300-kip
capacity each. Load cells were secured to the rams’ pistons by threaded rods and were protected
by 0.75-in. thick aluminum caps on top and bottom. When activated, the rams pressed the load
cells onto a bearing block created by adding two web plates, six bearing stiffeners, and a 1-in.
thick bottom flange plate to a 24-in. long W12X58 beam, as shown in Figure 6.5. The block
rested atop a 3-in. diameter rod which, in turn, rested atop a 5 in. x 2 in. x 24 in. plate, forming a
pinned support at the load point as shown in Figure 6.6. For each test, a pinned support was
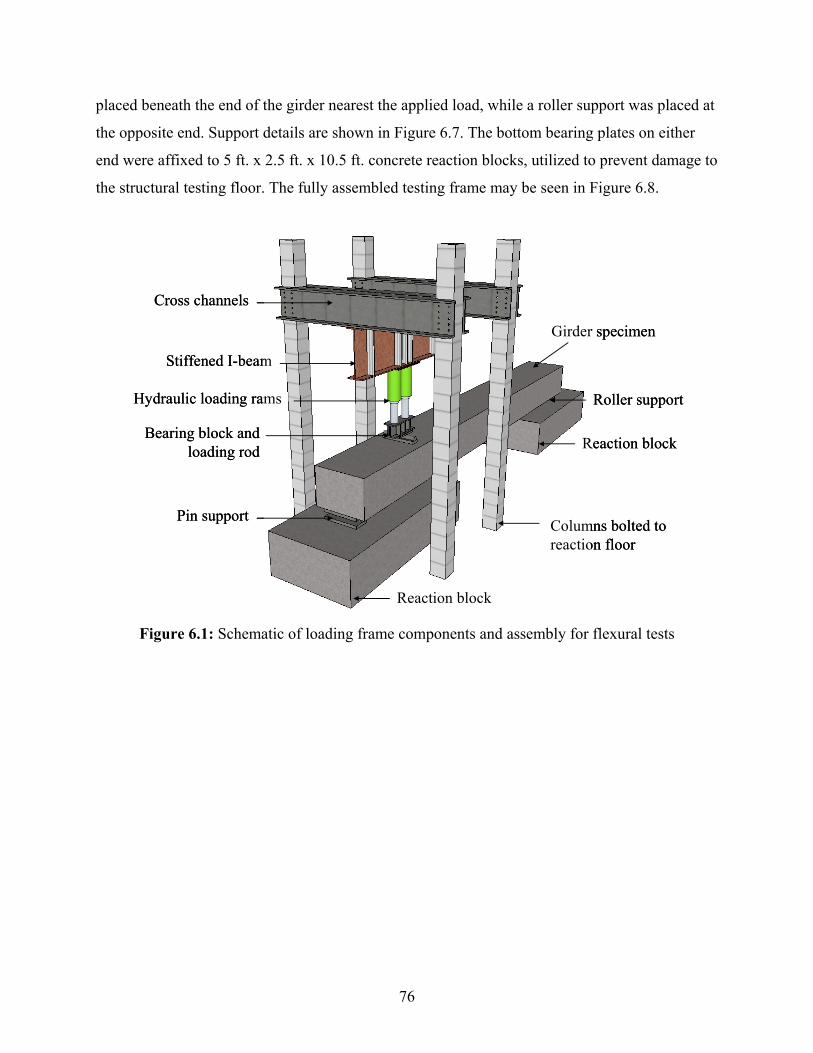
76
placed beneath the end of the girder nearest the applied load, while a roller support was placed at
the opposite end. Support details are shown in Figure 6.7. The bottom bearing plates on either
end were affixed to 5 ft. x 2.5 ft. x 10.5 ft. concrete reaction blocks, utilized to prevent damage to
the structural testing floor. The fully assembled testing frame may be seen in Figure 6.8.
Reaction block
Girder specimen
Columns bolted to reaction floor
Stiffened I-beam
Hydraulic loading rams
Bearing block and loading rod
Cross channels
Reaction block
Pin support
Roller support
Reaction block
Girder specimen
Columns bolted to reaction floor
Stiffened I-beam
Hydraulic loading rams
Bearing block and loading rod
Cross channels
Reaction block
Pin support
Roller support
Figure 6.1: Schematic of loading frame components and assembly for flexural tests
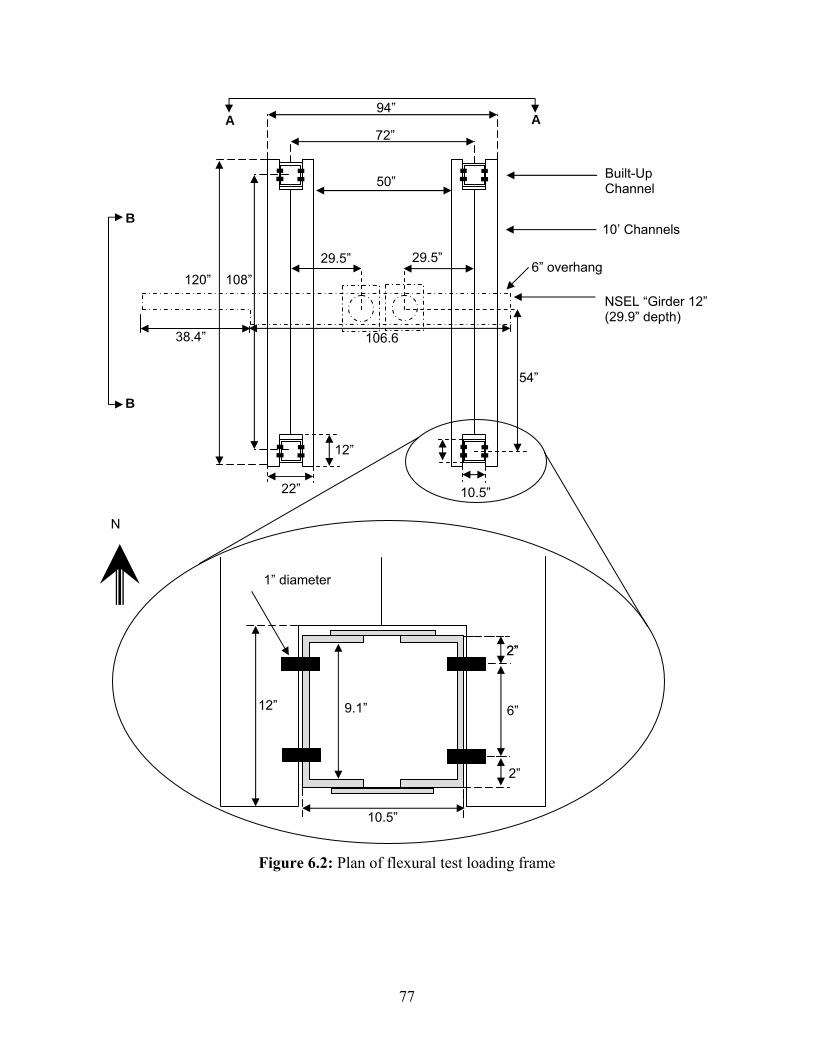
77
Figure 6.2: Plan of flexural test loading frame
22”
12”
10.5”
54”
72”
94”
120” 108”
50”
29.5”
2”
6”
2”
10.5”
9.1”
2”
12”
1” diameter
NSEL “Girder 12” (29.9” depth)
Built-Up Channel
10’ Channels
B
B
A A
N
38.4” 106.6
29.5”6” overhang
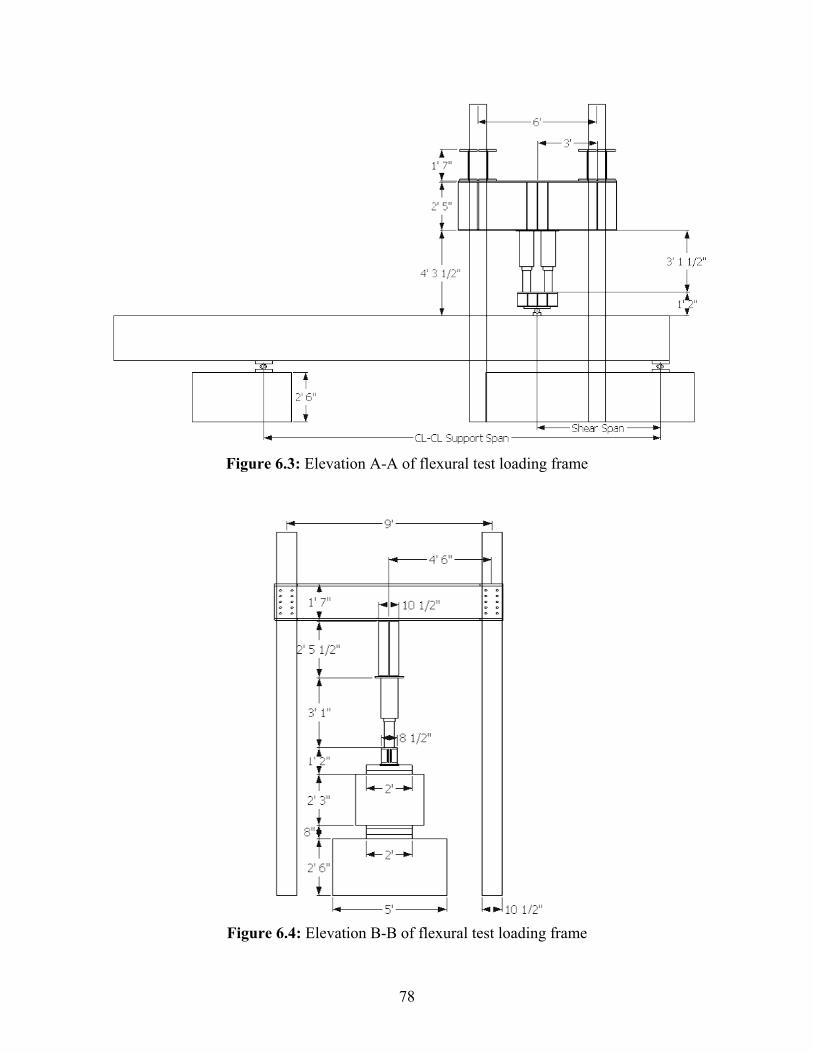
78
Figure 6.3: Elevation A-A of flexural test loading frame
Figure 6.4: Elevation B-B of flexural test loading frame

79
Figure 6.5: Bearing block design for flexural tests
Figure 6.6: Bearing block and pinned support at point of loading
9 ¾″
13/16″
7 1/8″
13/16″
8 3/16″
1″
24″
16″
½″
10″
12″ 2 ¼″ min.
½″
¾"
Extend plate full length (24”)
½″ ½″
6 ½″ 6 ½″
3” DIA.
¼”
1-11/16”

80
Figure 6.7: Roller (left) and pin (right) support in flexural test setup
Figure 6.8: Fully assembled testing frame (left) and loading mechanism (right)
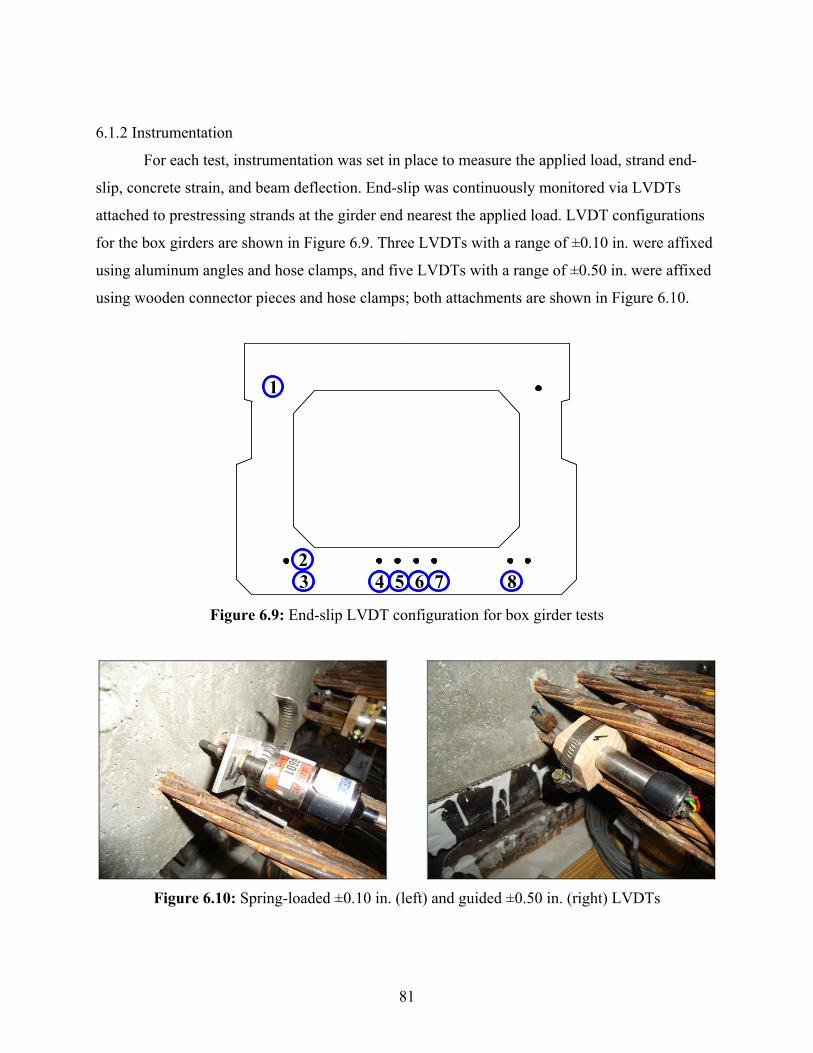
81
6.1.2 Instrumentation
For each test, instrumentation was set in place to measure the applied load, strand end-
slip, concrete strain, and beam deflection. End-slip was continuously monitored via LVDTs
attached to prestressing strands at the girder end nearest the applied load. LVDT configurations
for the box girders are shown in Figure 6.9. Three LVDTs with a range of ±0.10 in. were affixed
using aluminum angles and hose clamps, and five LVDTs with a range of ±0.50 in. were affixed
using wooden connector pieces and hose clamps; both attachments are shown in Figure 6.10.
1
23 4 5 6 7 8
11
2233 44 55 66 77 88
Figure 6.9: End-slip LVDT configuration for box girder tests
Figure 6.10: Spring-loaded ±0.10 in. (left) and guided ±0.50 in. (right) LVDTs
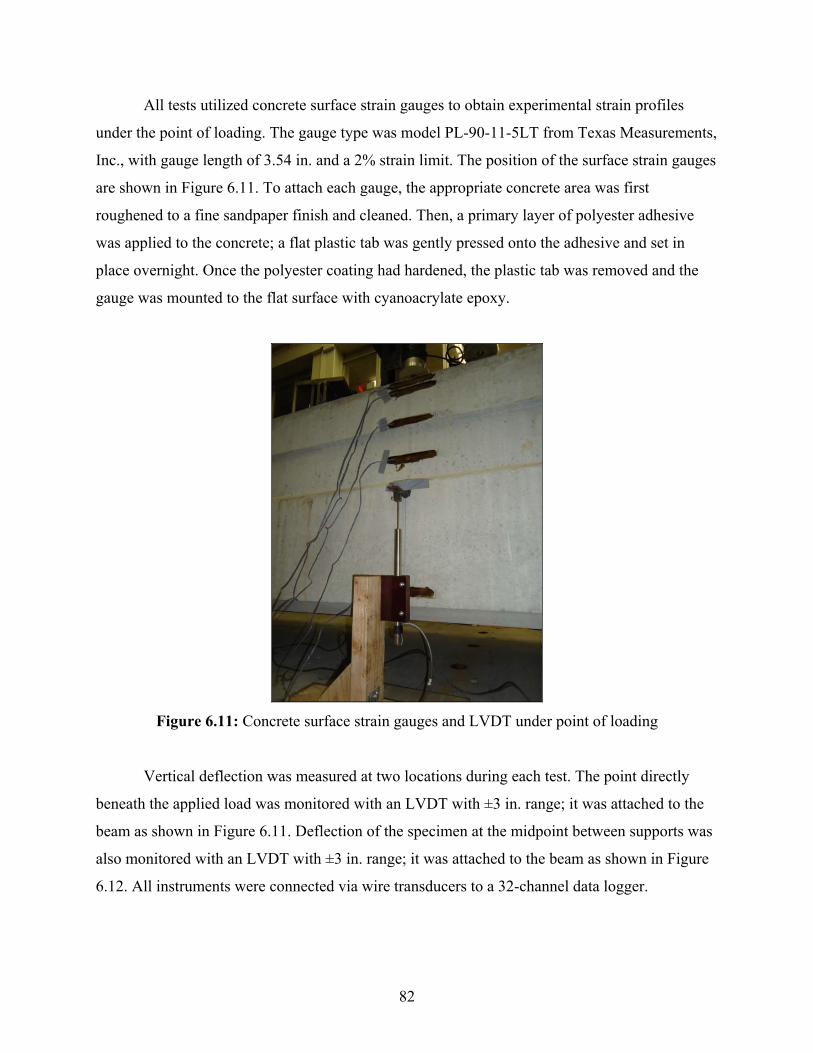
82
All tests utilized concrete surface strain gauges to obtain experimental strain profiles
under the point of loading. The gauge type was model PL-90-11-5LT from Texas Measurements,
Inc., with gauge length of 3.54 in. and a 2% strain limit. The position of the surface strain gauges
are shown in Figure 6.11. To attach each gauge, the appropriate concrete area was first
roughened to a fine sandpaper finish and cleaned. Then, a primary layer of polyester adhesive
was applied to the concrete; a flat plastic tab was gently pressed onto the adhesive and set in
place overnight. Once the polyester coating had hardened, the plastic tab was removed and the
gauge was mounted to the flat surface with cyanoacrylate epoxy.
Figure 6.11: Concrete surface strain gauges and LVDT under point of loading
Vertical deflection was measured at two locations during each test. The point directly
beneath the applied load was monitored with an LVDT with ±3 in. range; it was attached to the
beam as shown in Figure 6.11. Deflection of the specimen at the midpoint between supports was
also monitored with an LVDT with ±3 in. range; it was attached to the beam as shown in Figure
6.12. All instruments were connected via wire transducers to a 32-channel data logger.
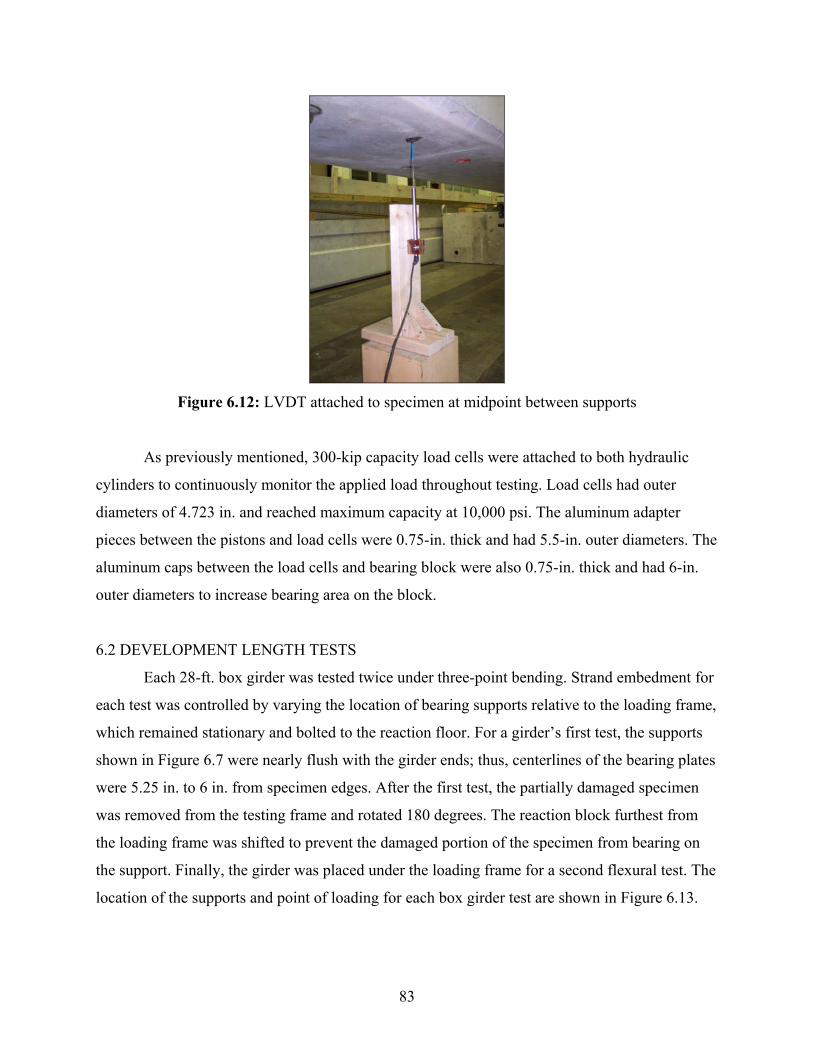
83
Figure 6.12: LVDT attached to specimen at midpoint between supports
As previously mentioned, 300-kip capacity load cells were attached to both hydraulic
cylinders to continuously monitor the applied load throughout testing. Load cells had outer
diameters of 4.723 in. and reached maximum capacity at 10,000 psi. The aluminum adapter
pieces between the pistons and load cells were 0.75-in. thick and had 5.5-in. outer diameters. The
aluminum caps between the load cells and bearing block were also 0.75-in. thick and had 6-in.
outer diameters to increase bearing area on the block.
6.2 DEVELOPMENT LENGTH TESTS
Each 28-ft. box girder was tested twice under three-point bending. Strand embedment for
each test was controlled by varying the location of bearing supports relative to the loading frame,
which remained stationary and bolted to the reaction floor. For a girder’s first test, the supports
shown in Figure 6.7 were nearly flush with the girder ends; thus, centerlines of the bearing plates
were 5.25 in. to 6 in. from specimen edges. After the first test, the partially damaged specimen
was removed from the testing frame and rotated 180 degrees. The reaction block furthest from
the loading frame was shifted to prevent the damaged portion of the specimen from bearing on
the support. Finally, the girder was placed under the loading frame for a second flexural test. The
location of the supports and point of loading for each box girder test are shown in Figure 6.13.
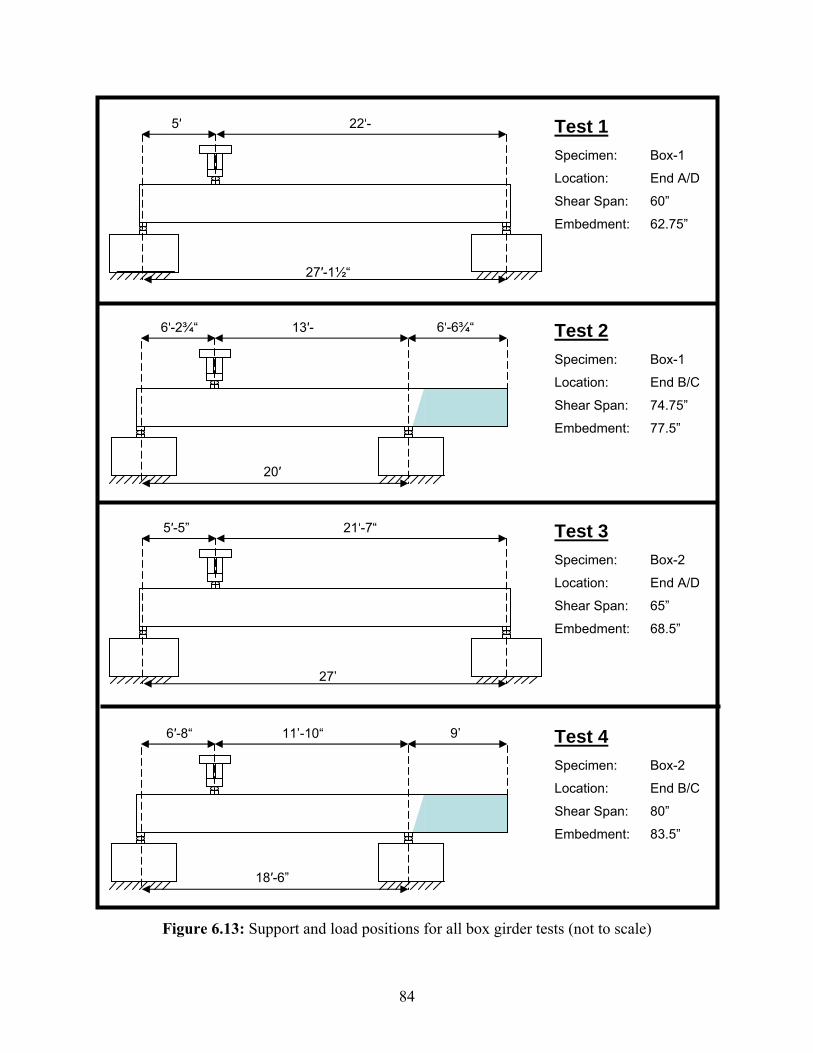
84
Figure 6.13: Support and load positions for all box girder tests (not to scale)
5′
27′-1½“
22′-
20′
6′-2¾“ 13′- 6′-6¾“
5′-5”
27’
21′-7“
18′-6”
6′-8“ 11’-10“ 9’
Test 1 Specimen: Box-1
Location: End A/D
Shear Span: 60”
Embedment: 62.75”
Test 4 Specimen: Box-2
Location: End B/C
Shear Span: 80”
Embedment: 83.5”
Test 3 Specimen: Box-2
Location: End A/D
Shear Span: 65”
Embedment: 68.5”
Test 2 Specimen: Box-1
Location: End B/C
Shear Span: 74.75”
Embedment: 77.5”

85
An electric pump was utilized to advance the two hydraulic rams until the bottom caps of
the load cells were in contact with the bearing block. To afford better control throughout testing,
the rams were disconnected from the electric pump and reconnected to a manual pump; both the
electric and manual pumps had 10,000 psi capacity. The hydraulic system was connected in
parallel to ensure each ram advanced at the same rate. The rams were advanced continuously
until the applied load was within 50 kips of the load predicted to cause flexural cracking. Then,
specimens were loaded in increments of 3 kips. Once cracking initiated, time was allotted
between load steps to monitor crack formation and allow load to settle.
Care was taken to monitor end-slip, cracking patterns, and load resistance to determine
the most probable failure mode in each test. Shear failure was characterized by prominent
diagonal cracking within the shear span and abrupt decreases in load capacity. Flexural failure
was characterized by symmetric cracking about the point of load, concrete crushing and high
strain in the compression flange under the applied load. Constant load resistance and steadily
increasing strand end-slip were indicative of bond failure. When embedment in a specimen
approaches the development length, the specimen may display characteristics of more than one
failure mechanism; such behavior may be termed flexure-shear, flexure-slip, or shear-slip failure.
Tests were stopped once a dominant failure mechanism was evident.
6.2.1 Flexural Test 1: Specimen Box-1, South End (A/D)
The first development length test was performed on the south end of specimen Box-1
(refer to Figure 4.3). The date of testing was April 12, 2010; 229 days after casting. The total
centerline-to-centerline (CL-to-CL) distance between supports was 27.125 ft. The beam was
placed under the loading frame such that the shear span, or distance between the CL of loading
and CL of the pinned support, was 5 ft. The embedment was taken as the distance from the beam
end to the face of the loading plate; in this case, 62.75 in. The chosen embedment was
approximately 12 in. less than the predicted development length.
The loading protocol for the test was described in Section 6.2. The first visible cracks,
both shear and flexural, occurred at an applied load of 165 kip. Shear cracking became dominant
at 176 kip, after which flexural cracks did not significantly widen. The maximum resisted load
was 197.4 kip; including the moment due to self-weight, this corresponds to a maximum
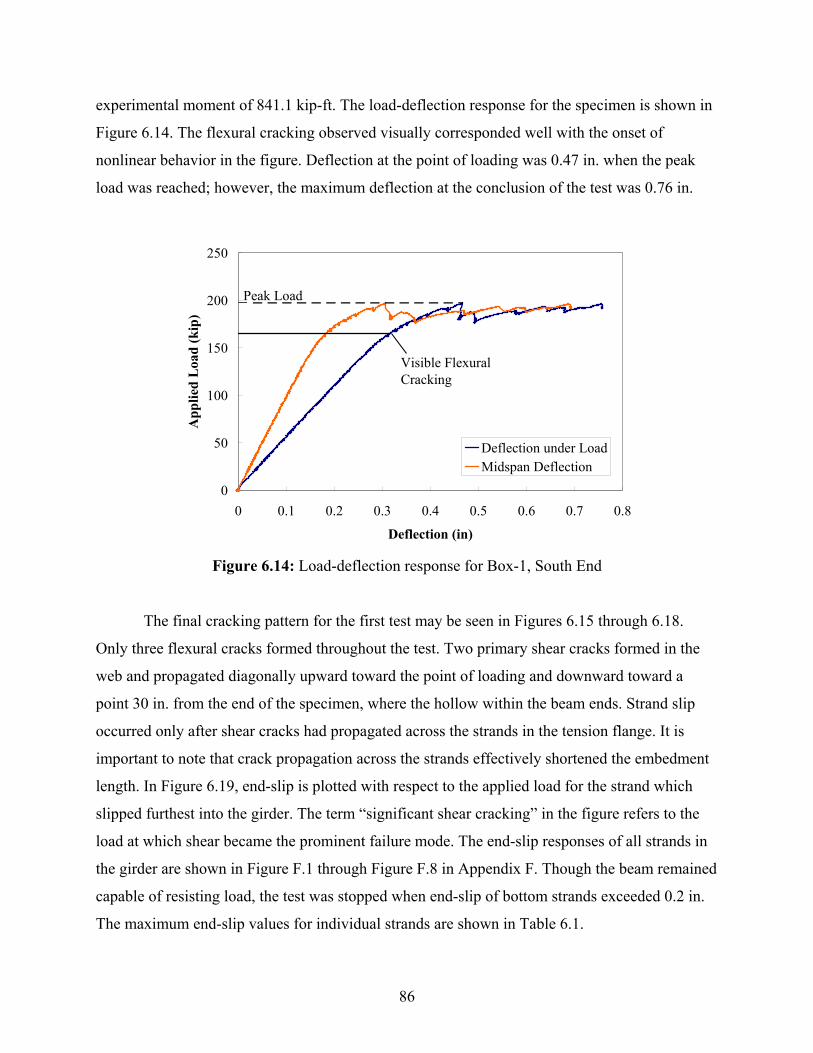
86
experimental moment of 841.1 kip-ft. The load-deflection response for the specimen is shown in
Figure 6.14. The flexural cracking observed visually corresponded well with the onset of
nonlinear behavior in the figure. Deflection at the point of loading was 0.47 in. when the peak
load was reached; however, the maximum deflection at the conclusion of the test was 0.76 in.
0
50
100
150
200
250
0 0.1 0.2 0.3 0.4 0.5 0.6 0.7 0.8
Deflection (in)
App
lied
Loa
d (k
ip)
Deflection under LoadMidspan Deflection
Visible Flexural Cracking
Peak Load
Figure 6.14: Load-deflection response for Box-1, South End
The final cracking pattern for the first test may be seen in Figures 6.15 through 6.18.
Only three flexural cracks formed throughout the test. Two primary shear cracks formed in the
web and propagated diagonally upward toward the point of loading and downward toward a
point 30 in. from the end of the specimen, where the hollow within the beam ends. Strand slip
occurred only after shear cracks had propagated across the strands in the tension flange. It is
important to note that crack propagation across the strands effectively shortened the embedment
length. In Figure 6.19, end-slip is plotted with respect to the applied load for the strand which
slipped furthest into the girder. The term “significant shear cracking” in the figure refers to the
load at which shear became the prominent failure mode. The end-slip responses of all strands in
the girder are shown in Figure F.1 through Figure F.8 in Appendix F. Though the beam remained
capable of resisting load, the test was stopped when end-slip of bottom strands exceeded 0.2 in.
The maximum end-slip values for individual strands are shown in Table 6.1.
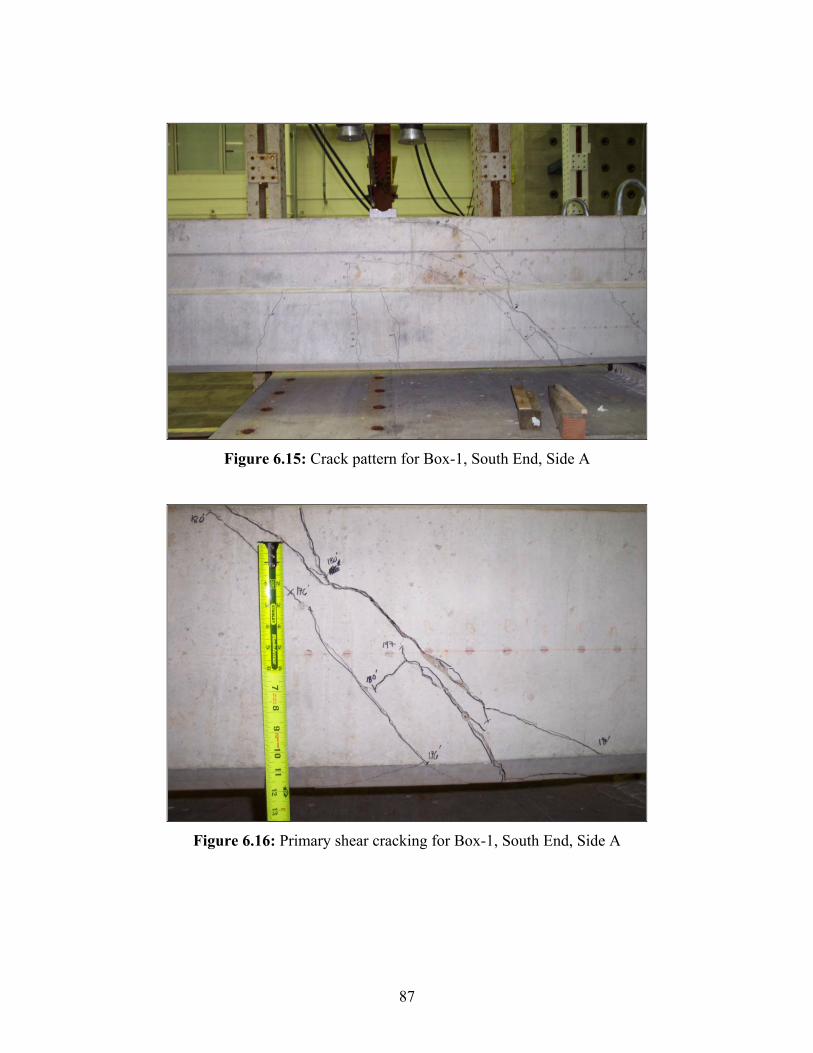
87
Figure 6.15: Crack pattern for Box-1, South End, Side A
Figure 6.16: Primary shear cracking for Box-1, South End, Side A
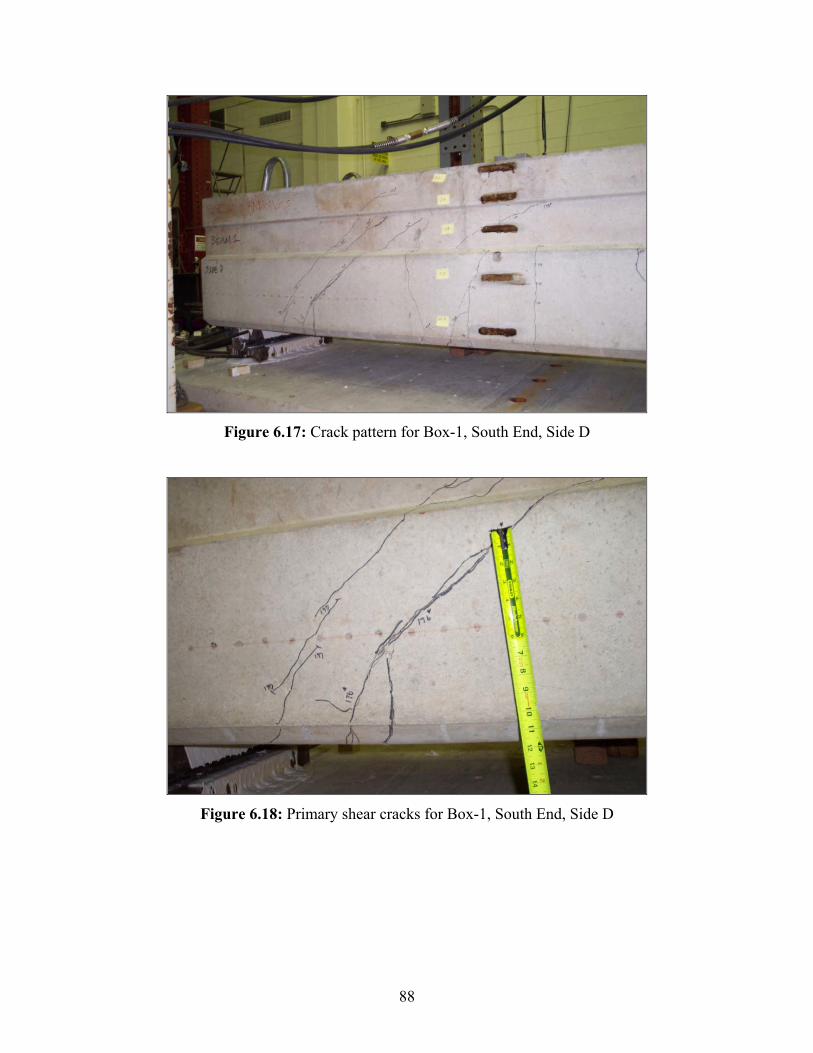
88
Figure 6.17: Crack pattern for Box-1, South End, Side D
Figure 6.18: Primary shear cracks for Box-1, South End, Side D
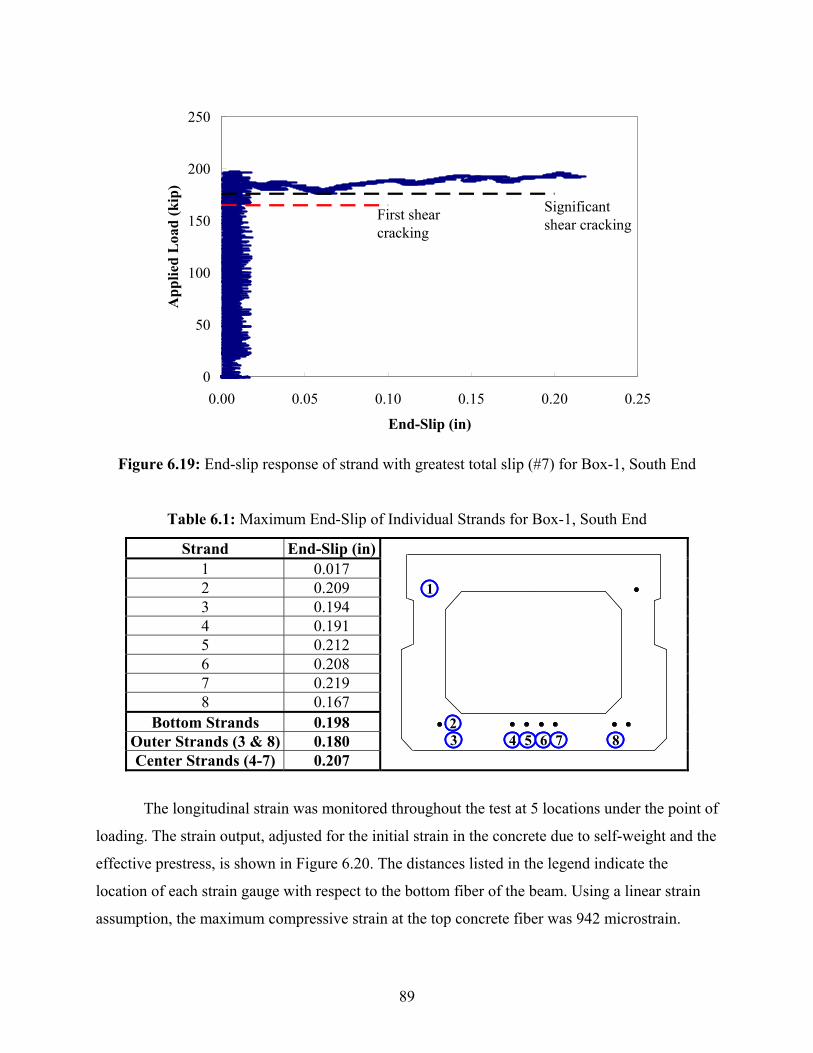
89
0
50
100
150
200
250
0.00 0.05 0.10 0.15 0.20 0.25
End-Slip (in)
App
lied
Loa
d (k
ip)
Significant shear cracking
First shear cracking
Figure 6.19: End-slip response of strand with greatest total slip (#7) for Box-1, South End
Table 6.1: Maximum End-Slip of Individual Strands for Box-1, South End
Strand End-Slip (in)1 0.017 2 0.209 3 0.194 4 0.191 5 0.212 6 0.208 7 0.219 8 0.167
Bottom Strands 0.198 Outer Strands (3 & 8) 0.180 Center Strands (4-7) 0.207
1
23 4 5 6 7 8
11
2233 44 55 66 77 88
The longitudinal strain was monitored throughout the test at 5 locations under the point of
loading. The strain output, adjusted for the initial strain in the concrete due to self-weight and the
effective prestress, is shown in Figure 6.20. The distances listed in the legend indicate the
location of each strain gauge with respect to the bottom fiber of the beam. Using a linear strain
assumption, the maximum compressive strain at the top concrete fiber was 942 microstrain.

90
0
50
100
150
200
250
-1000 -500 0 500 1000 1500 2000
Strain (με)
App
lied
Loa
d (k
ip)
A - 26.0"B - 21.5"C - 17.5"D - 10.2"E - 2.86"
Figure 6.20: Longitudinal strains under loading for Box-1, South End
6.2.2 Flexural Test 2: Specimen Box-1, North End (B/C)
The second development length test was performed on the north end of specimen Box-1
(refer to Figure 4.3). The date of testing was April 26, 2010; 243 days after casting. The total
CL-to-CL distance between supports was 20 ft. The beam was placed under the loading frame
such that the shear span was 6.23 ft. The 77.5 in. embedment for this iteration was selected based
on the obvious shear failure observed in the first test.
The first visible flexural cracks occurred at an applied load of 149 kip. The behavior of
the beam remained heavily flexural until shear cracking initiated under 218-kip loading. The
specimen reached a peak load of 227 kip; including the moment due to self-weight, this
corresponds to a maximum experimental moment of 995.7 kip-ft. The load-deflection response
for the specimen is shown in Figure 6.21. As shown in the figure, after reaching the maximum
load, resistance declined due to flexural cracking, shear cracking, and strand-slip. The hydraulic
rams were pushed downward, though the beam could not again attain the maximum load; the
specimen failed abruptly in shear at a load of 218 kip. Deflection under the point of loading was
0.85 in. at the peak load; however, the maximum deflection at failure was 1.41 in.
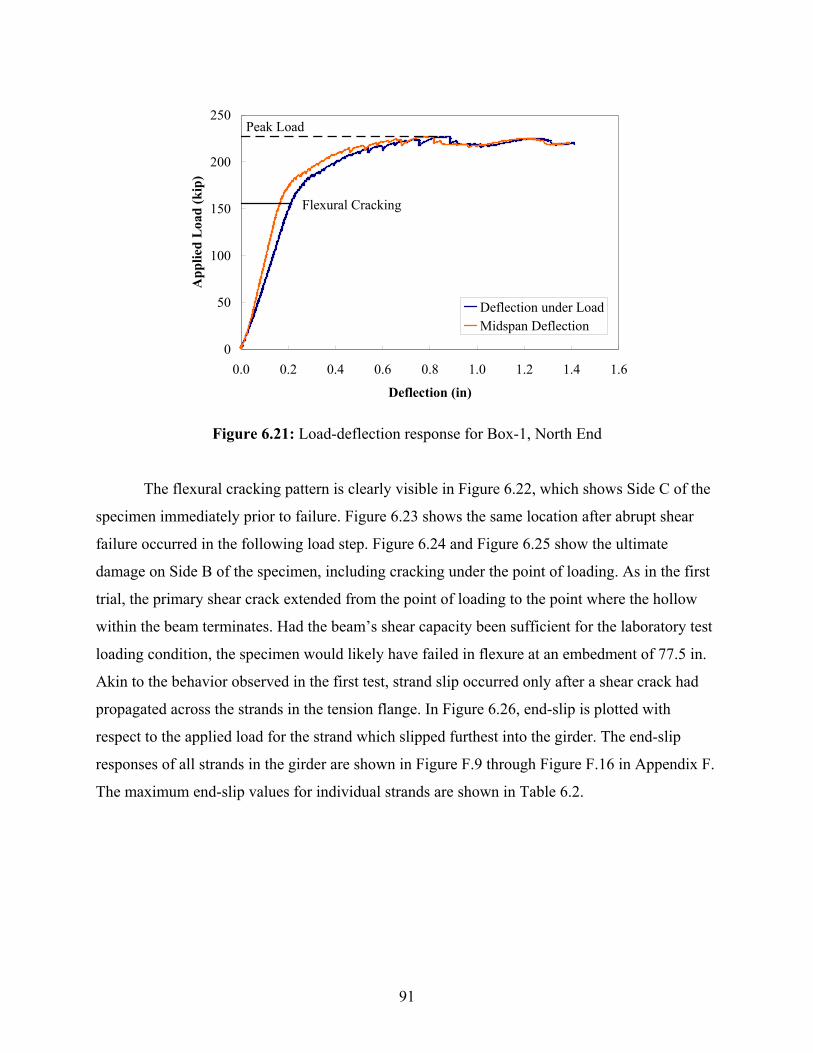
91
0
50
100
150
200
250
0.0 0.2 0.4 0.6 0.8 1.0 1.2 1.4 1.6
Deflection (in)
App
lied
Loa
d (k
ip)
Deflection under LoadMidspan Deflection
Flexural Cracking
Peak Load
Figure 6.21: Load-deflection response for Box-1, North End
The flexural cracking pattern is clearly visible in Figure 6.22, which shows Side C of the
specimen immediately prior to failure. Figure 6.23 shows the same location after abrupt shear
failure occurred in the following load step. Figure 6.24 and Figure 6.25 show the ultimate
damage on Side B of the specimen, including cracking under the point of loading. As in the first
trial, the primary shear crack extended from the point of loading to the point where the hollow
within the beam terminates. Had the beam’s shear capacity been sufficient for the laboratory test
loading condition, the specimen would likely have failed in flexure at an embedment of 77.5 in.
Akin to the behavior observed in the first test, strand slip occurred only after a shear crack had
propagated across the strands in the tension flange. In Figure 6.26, end-slip is plotted with
respect to the applied load for the strand which slipped furthest into the girder. The end-slip
responses of all strands in the girder are shown in Figure F.9 through Figure F.16 in Appendix F.
The maximum end-slip values for individual strands are shown in Table 6.2.
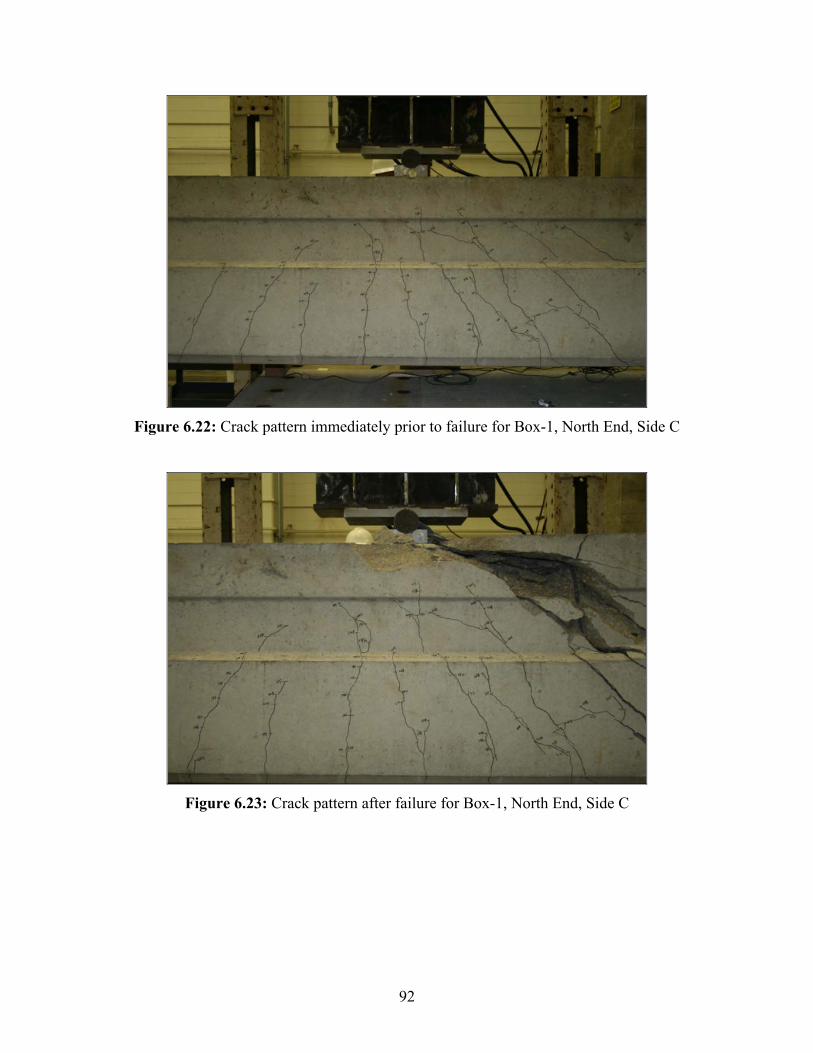
92
Figure 6.22: Crack pattern immediately prior to failure for Box-1, North End, Side C
Figure 6.23: Crack pattern after failure for Box-1, North End, Side C
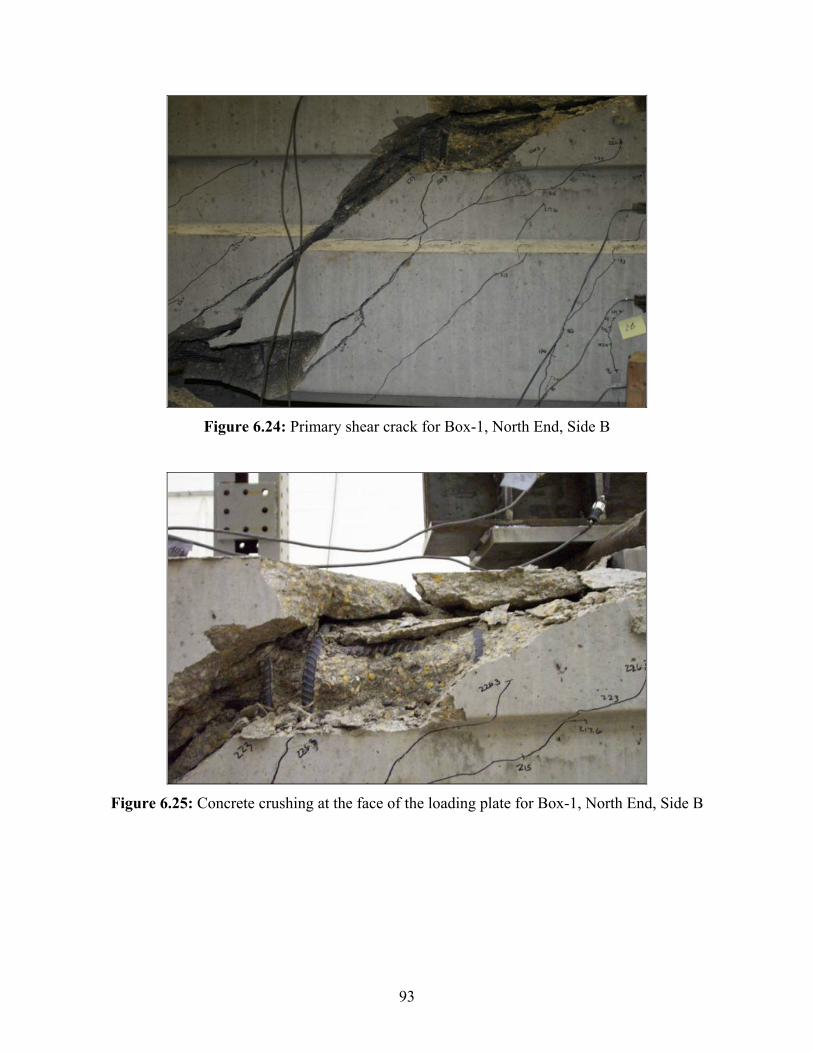
93
Figure 6.24: Primary shear crack for Box-1, North End, Side B
Figure 6.25: Concrete crushing at the face of the loading plate for Box-1, North End, Side B
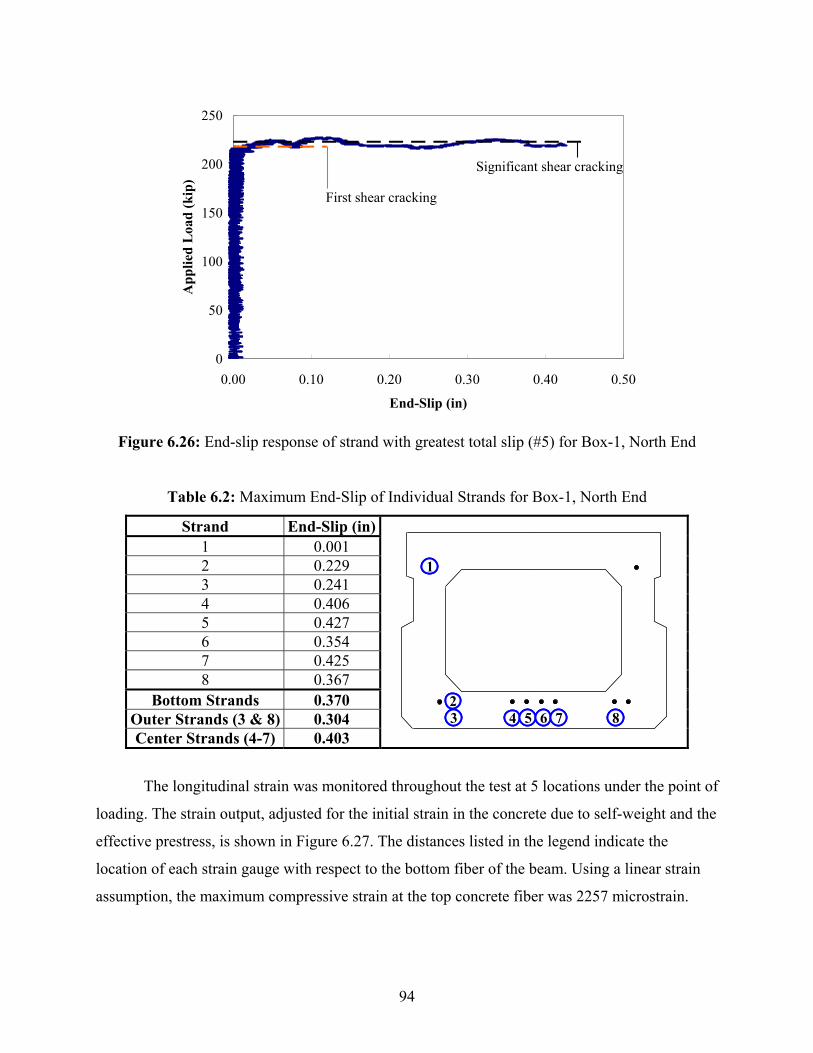
94
0
50
100
150
200
250
0.00 0.10 0.20 0.30 0.40 0.50
End-Slip (in)
App
lied
Loa
d (k
ip)
Significant shear cracking
First shear cracking
Figure 6.26: End-slip response of strand with greatest total slip (#5) for Box-1, North End
Table 6.2: Maximum End-Slip of Individual Strands for Box-1, North End
Strand End-Slip (in)1 0.001 2 0.229 3 0.241 4 0.406 5 0.427 6 0.354 7 0.425 8 0.367
Bottom Strands 0.370 Outer Strands (3 & 8) 0.304 Center Strands (4-7) 0.403
1
23 4 5 6 7 8
11
2233 44 55 66 77 88
The longitudinal strain was monitored throughout the test at 5 locations under the point of
loading. The strain output, adjusted for the initial strain in the concrete due to self-weight and the
effective prestress, is shown in Figure 6.27. The distances listed in the legend indicate the
location of each strain gauge with respect to the bottom fiber of the beam. Using a linear strain
assumption, the maximum compressive strain at the top concrete fiber was 2257 microstrain.
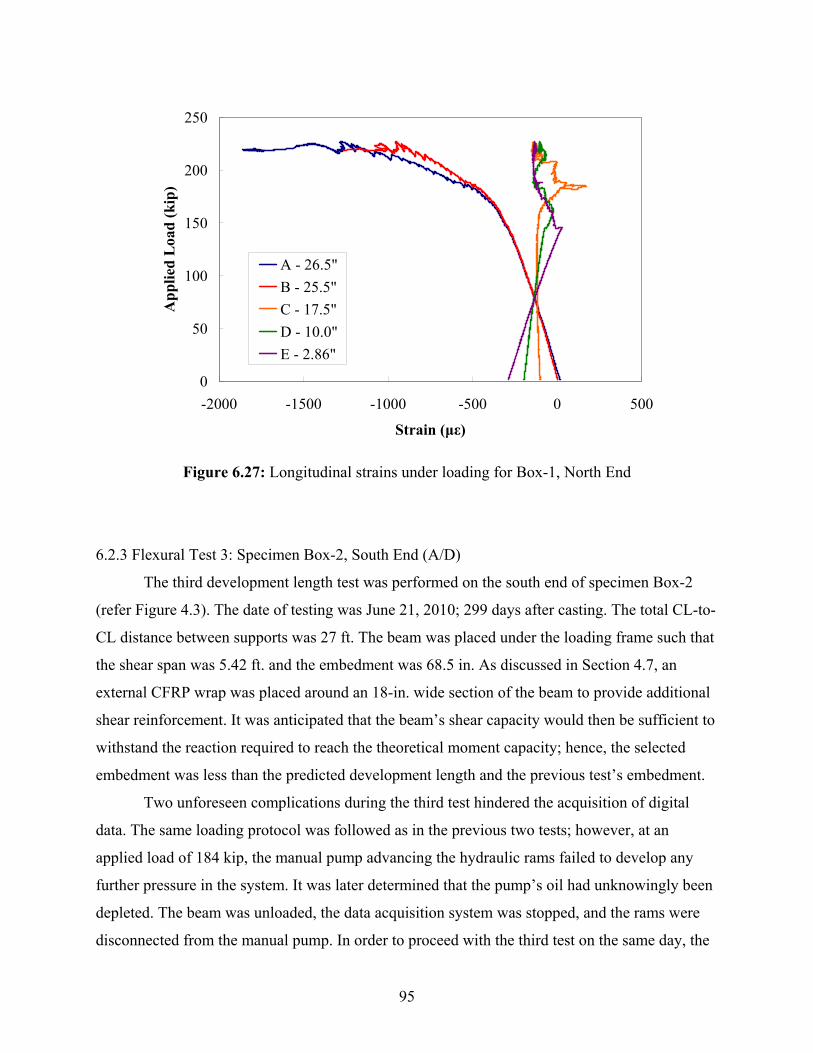
95
0
50
100
150
200
250
-2000 -1500 -1000 -500 0 500
Strain (με)
App
lied
Loa
d (k
ip)
A - 26.5"B - 25.5"C - 17.5"D - 10.0"E - 2.86"
Figure 6.27: Longitudinal strains under loading for Box-1, North End
6.2.3 Flexural Test 3: Specimen Box-2, South End (A/D)
The third development length test was performed on the south end of specimen Box-2
(refer Figure 4.3). The date of testing was June 21, 2010; 299 days after casting. The total CL-to-
CL distance between supports was 27 ft. The beam was placed under the loading frame such that
the shear span was 5.42 ft. and the embedment was 68.5 in. As discussed in Section 4.7, an
external CFRP wrap was placed around an 18-in. wide section of the beam to provide additional
shear reinforcement. It was anticipated that the beam’s shear capacity would then be sufficient to
withstand the reaction required to reach the theoretical moment capacity; hence, the selected
embedment was less than the predicted development length and the previous test’s embedment.
Two unforeseen complications during the third test hindered the acquisition of digital
data. The same loading protocol was followed as in the previous two tests; however, at an
applied load of 184 kip, the manual pump advancing the hydraulic rams failed to develop any
further pressure in the system. It was later determined that the pump’s oil had unknowingly been
depleted. The beam was unloaded, the data acquisition system was stopped, and the rams were
disconnected from the manual pump. In order to proceed with the third test on the same day, the
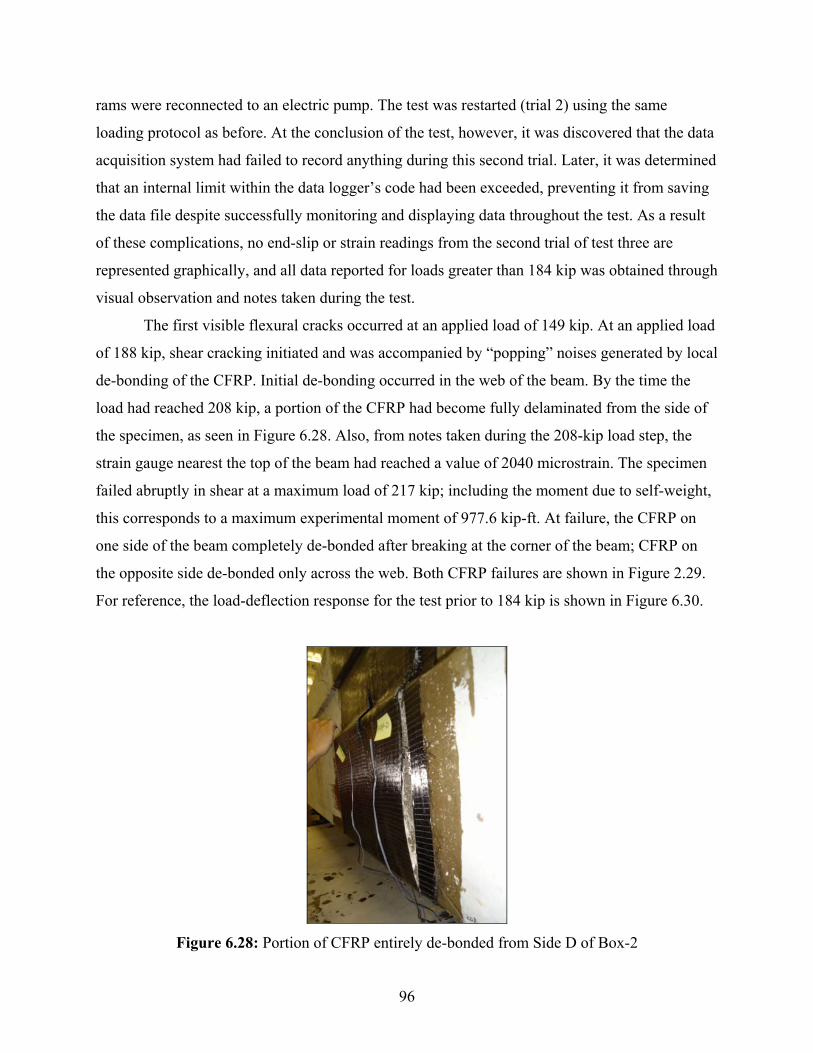
96
rams were reconnected to an electric pump. The test was restarted (trial 2) using the same
loading protocol as before. At the conclusion of the test, however, it was discovered that the data
acquisition system had failed to record anything during this second trial. Later, it was determined
that an internal limit within the data logger’s code had been exceeded, preventing it from saving
the data file despite successfully monitoring and displaying data throughout the test. As a result
of these complications, no end-slip or strain readings from the second trial of test three are
represented graphically, and all data reported for loads greater than 184 kip was obtained through
visual observation and notes taken during the test.
The first visible flexural cracks occurred at an applied load of 149 kip. At an applied load
of 188 kip, shear cracking initiated and was accompanied by “popping” noises generated by local
de-bonding of the CFRP. Initial de-bonding occurred in the web of the beam. By the time the
load had reached 208 kip, a portion of the CFRP had become fully delaminated from the side of
the specimen, as seen in Figure 6.28. Also, from notes taken during the 208-kip load step, the
strain gauge nearest the top of the beam had reached a value of 2040 microstrain. The specimen
failed abruptly in shear at a maximum load of 217 kip; including the moment due to self-weight,
this corresponds to a maximum experimental moment of 977.6 kip-ft. At failure, the CFRP on
one side of the beam completely de-bonded after breaking at the corner of the beam; CFRP on
the opposite side de-bonded only across the web. Both CFRP failures are shown in Figure 2.29.
For reference, the load-deflection response for the test prior to 184 kip is shown in Figure 6.30.
Figure 6.28: Portion of CFRP entirely de-bonded from Side D of Box-2

97
Figure 6.29: Final CFRP failure at Side D (left) and Side A (right) of Box-2
0
20
40
60
80
100
120
140
160
180
200
0 0.1 0.2 0.3 0.4 0.5
Deflection (in)
App
lied
Loa
d (k
ip)
Deflection under LoadMidspan Deflection
Flexural cracking
Unloaded from this point to switch hydraulics
Figure 6.30: Partial load-deflection response for Box-2, South End
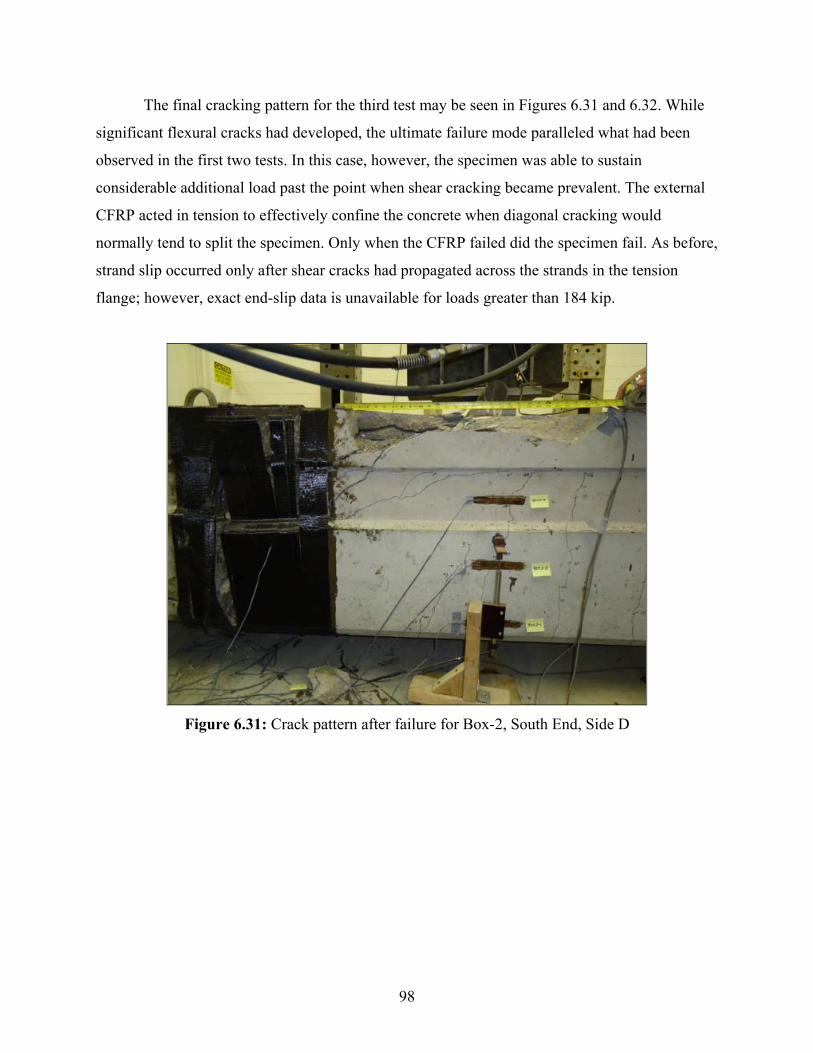
98
The final cracking pattern for the third test may be seen in Figures 6.31 and 6.32. While
significant flexural cracks had developed, the ultimate failure mode paralleled what had been
observed in the first two tests. In this case, however, the specimen was able to sustain
considerable additional load past the point when shear cracking became prevalent. The external
CFRP acted in tension to effectively confine the concrete when diagonal cracking would
normally tend to split the specimen. Only when the CFRP failed did the specimen fail. As before,
strand slip occurred only after shear cracks had propagated across the strands in the tension
flange; however, exact end-slip data is unavailable for loads greater than 184 kip.
Figure 6.31: Crack pattern after failure for Box-2, South End, Side D
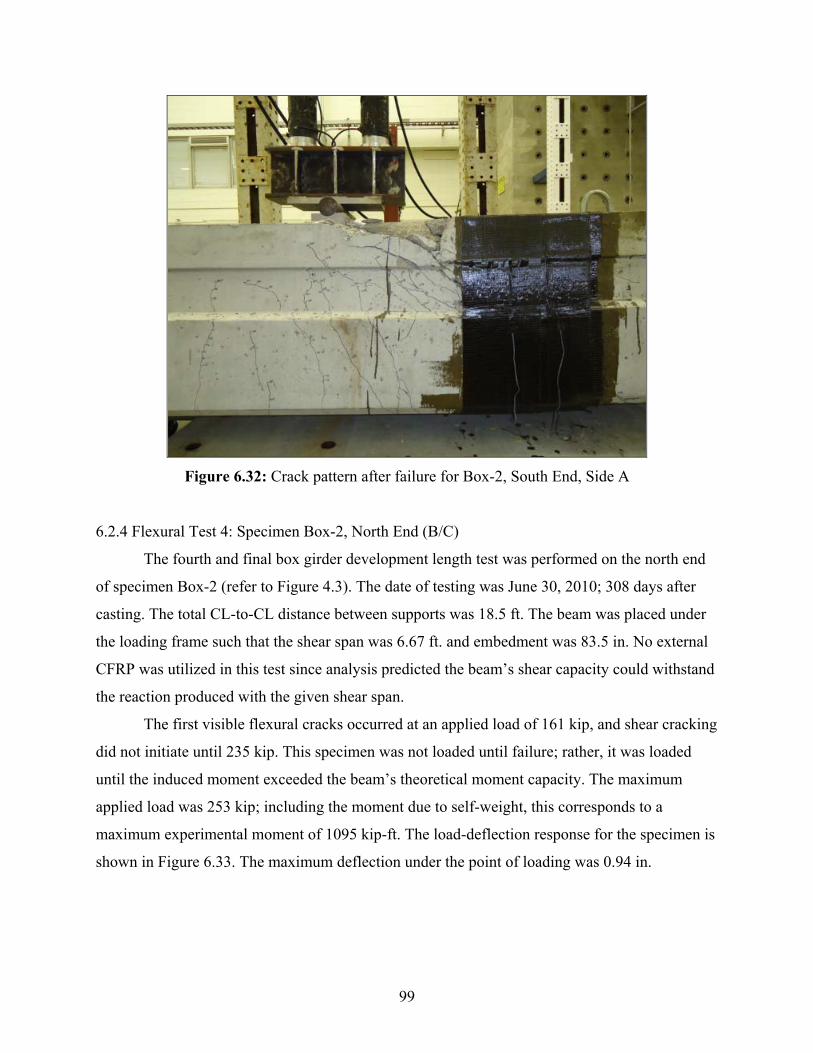
99
Figure 6.32: Crack pattern after failure for Box-2, South End, Side A
6.2.4 Flexural Test 4: Specimen Box-2, North End (B/C)
The fourth and final box girder development length test was performed on the north end
of specimen Box-2 (refer to Figure 4.3). The date of testing was June 30, 2010; 308 days after
casting. The total CL-to-CL distance between supports was 18.5 ft. The beam was placed under
the loading frame such that the shear span was 6.67 ft. and embedment was 83.5 in. No external
CFRP was utilized in this test since analysis predicted the beam’s shear capacity could withstand
the reaction produced with the given shear span.
The first visible flexural cracks occurred at an applied load of 161 kip, and shear cracking
did not initiate until 235 kip. This specimen was not loaded until failure; rather, it was loaded
until the induced moment exceeded the beam’s theoretical moment capacity. The maximum
applied load was 253 kip; including the moment due to self-weight, this corresponds to a
maximum experimental moment of 1095 kip-ft. The load-deflection response for the specimen is
shown in Figure 6.33. The maximum deflection under the point of loading was 0.94 in.

100
0
50
100
150
200
250
300
0.0 0.2 0.4 0.6 0.8 1.0
Deflection (in)
App
lied
Loa
d (k
ip)
Deflection under LoadMidspan Deflection
Flexural Cracking
Peak Load
Figure 6.33: Load-deflection response for Box-2, North End
The final cracking pattern for the fourth box girder test may be seen in Figure 6.34 and
Figure 6.35. As the figures show, cracking followed a flexural failure pattern and was symmetric
about the point of loading. The one significant shear crack was observed only on one side of the
beam (see Figure 6.35). The end-slip recorded for this test was minimal, even after the shear
crack had propagated across through the tension flange. In Figure 6.36, end-slip is plotted with
respect to the applied load for the strand which slipped furthest into the girder. End-slip
responses of all eight strands in the girder are shown in Figure F.17 through Figure F.24 in
Appendix F. The maximum end-slip values for individual strands are listed in Table 6.3.
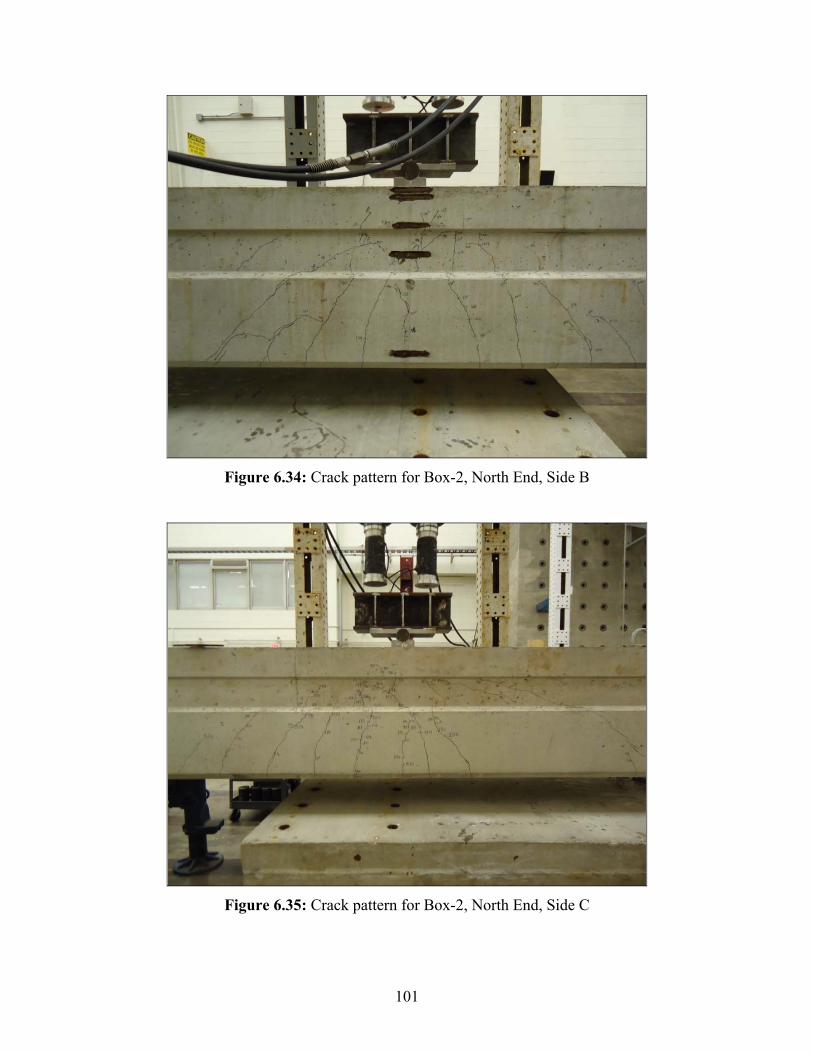
101
Figure 6.34: Crack pattern for Box-2, North End, Side B
Figure 6.35: Crack pattern for Box-2, North End, Side C

102
0
50
100
150
200
250
300
0.00 0.02 0.04 0.06 0.08 0.10
End-Slip (in)
App
lied
Loa
d (k
ip)
First shear cracking
Figure 6.36: End-slip response of strand with greatest total slip (#7) for Box-2, North End
Table 6.3: Maximum End-Slip of Individual Strands for Box-2, North End
Strand End-Slip (in)1 0.000 2 0.005 3 0.001 4 0.035 5 0.012 6 0.038 7 0.044 8 0.001
Bottom Strands 0.022 Outer Strands (3 & 8) 0.001 Center Strands (4-7) 0.032
1
23 4 5 6 7 8
11
2233 44 55 66 77 88
The longitudinal strain was monitored throughout the test at 5 locations under the point of
loading. The strain output, adjusted for the initial strain in the concrete due to self-weight and the
effective prestress, is shown in Figure 6.37. The distances listed in the legend indicate the
location of each strain gauge with respect to the bottom fiber of the beam. Using a linear strain
assumption, the maximum compressive strain at the top concrete fiber was 1941 microstrain. For
scaling purposes, tensile strain readings exceeding 4000 microstrain are not plotted.

103
0
50
100
150
200
250
300
-2000 -1000 0 1000 2000 3000 4000 5000
Strain (με)
App
lied
Loa
d (k
ip)
A - 26.5"B - 25.5"C - 21.5"D - 17.5"E - 2.86"
Figure 6.37: Longitudinal strains under loading for Box-2, North End
6.3 DISCUSSION OF DEVELOPMENT LENGTH RESULTS
This section summarizes the results of four flexural tests performed on full-scale
SCC box girder specimens. First, the effective prestress in the specimens at the time of loading is
calculated using the initial cracking observed in the tests and relationships of mechanics. This
permits comparison to prestress losses calculated in Section 4.4. Then, experimental shear and
moment capacities are compared to the sectional capacities calculated in Section 4.6. The
effectiveness of external CFRP reinforcement in shear strengthening is also evaluated. Finally,
although a single value for strand development length is indeterminate given the low number of
test iterations, an upper bound and reasonable range for development length are established.
6.3.1 Prestress Losses from Initial Cracking
The effective prestress at the time of flexural testing may be back-calculated using the
initial cracking load and relationships of mechanics, as presented in Equation 6.1. Two variables
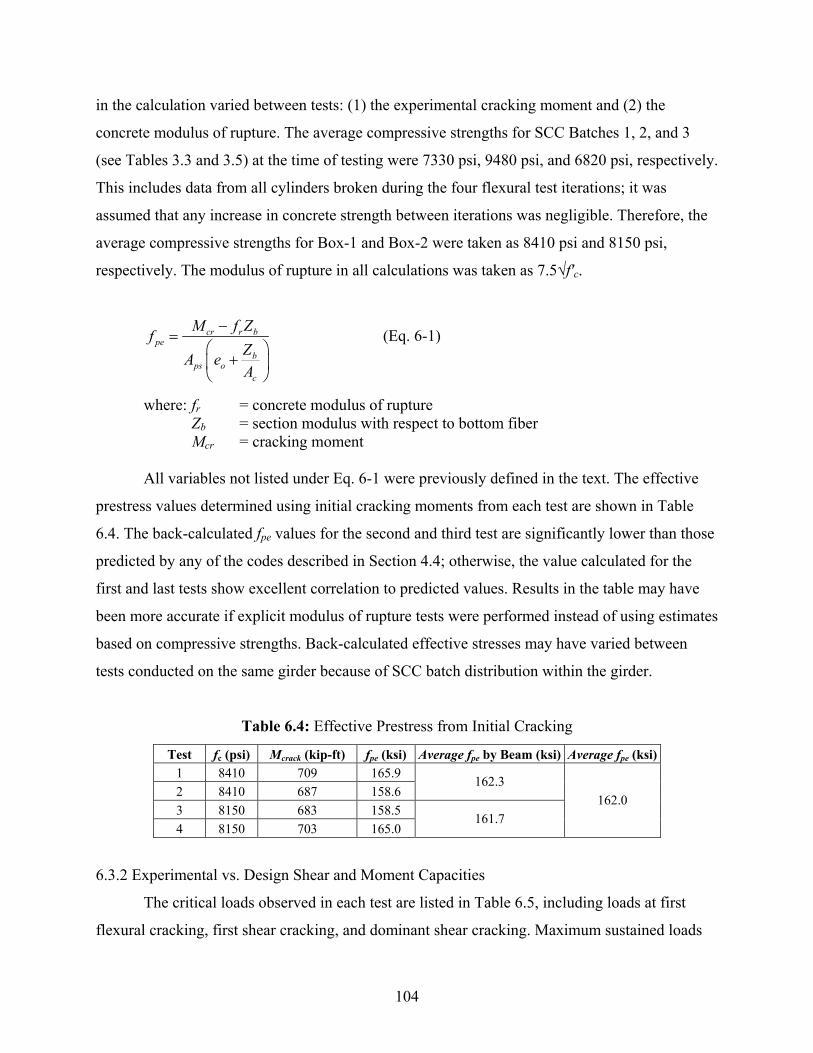
104
in the calculation varied between tests: (1) the experimental cracking moment and (2) the
concrete modulus of rupture. The average compressive strengths for SCC Batches 1, 2, and 3
(see Tables 3.3 and 3.5) at the time of testing were 7330 psi, 9480 psi, and 6820 psi, respectively.
This includes data from all cylinders broken during the four flexural test iterations; it was
assumed that any increase in concrete strength between iterations was negligible. Therefore, the
average compressive strengths for Box-1 and Box-2 were taken as 8410 psi and 8150 psi,
respectively. The modulus of rupture in all calculations was taken as 7.5√f′c.
cr r bpe
bps o
c
M f ZfZA eA
−=
⎛ ⎞+⎜ ⎟
⎝ ⎠
(Eq. 6-1)
where: fr = concrete modulus of rupture Zb = section modulus with respect to bottom fiber Mcr = cracking moment All variables not listed under Eq. 6-1 were previously defined in the text. The effective
prestress values determined using initial cracking moments from each test are shown in Table
6.4. The back-calculated fpe values for the second and third test are significantly lower than those
predicted by any of the codes described in Section 4.4; otherwise, the value calculated for the
first and last tests show excellent correlation to predicted values. Results in the table may have
been more accurate if explicit modulus of rupture tests were performed instead of using estimates
based on compressive strengths. Back-calculated effective stresses may have varied between
tests conducted on the same girder because of SCC batch distribution within the girder.
Table 6.4: Effective Prestress from Initial Cracking
Test fc (psi) Mcrack (kip-ft) fpe (ksi) Average fpe by Beam (ksi) Average fpe (ksi)1 8410 709 165.9 2 8410 687 158.6
162.3
3 8150 683 158.5 4 8150 703 165.0
161.7 162.0
6.3.2 Experimental vs. Design Shear and Moment Capacities
The critical loads observed in each test are listed in Table 6.5, including loads at first
flexural cracking, first shear cracking, and dominant shear cracking. Maximum sustained loads
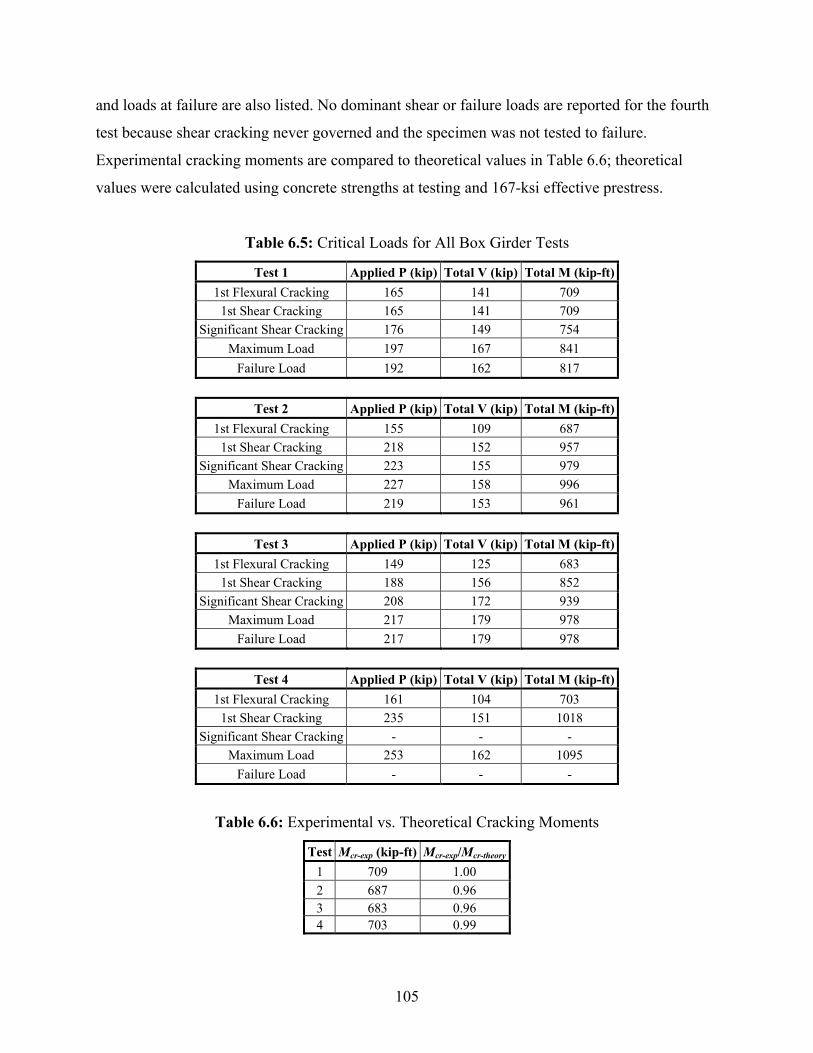
105
and loads at failure are also listed. No dominant shear or failure loads are reported for the fourth
test because shear cracking never governed and the specimen was not tested to failure.
Experimental cracking moments are compared to theoretical values in Table 6.6; theoretical
values were calculated using concrete strengths at testing and 167-ksi effective prestress.
Table 6.5: Critical Loads for All Box Girder Tests
Test 1 Applied P (kip) Total V (kip) Total M (kip-ft) 1st Flexural Cracking 165 141 709
1st Shear Cracking 165 141 709 Significant Shear Cracking 176 149 754
Maximum Load 197 167 841 Failure Load 192 162 817
Test 2 Applied P (kip) Total V (kip) Total M (kip-ft)
1st Flexural Cracking 155 109 687 1st Shear Cracking 218 152 957
Significant Shear Cracking 223 155 979 Maximum Load 227 158 996
Failure Load 219 153 961
Test 3 Applied P (kip) Total V (kip) Total M (kip-ft) 1st Flexural Cracking 149 125 683
1st Shear Cracking 188 156 852 Significant Shear Cracking 208 172 939
Maximum Load 217 179 978 Failure Load 217 179 978
Test 4 Applied P (kip) Total V (kip) Total M (kip-ft)
1st Flexural Cracking 161 104 703 1st Shear Cracking 235 151 1018
Significant Shear Cracking - - - Maximum Load 253 162 1095
Failure Load - - -
Table 6.6: Experimental vs. Theoretical Cracking Moments
Test Mcr-exp (kip-ft) Mcr-exp/Mcr-theory
1 709 1.00 2 687 0.96 3 683 0.96 4 703 0.99

106
The box girders consistently exceeded design and nominal shear values within the shear-
vulnerable region for each test. Table 6.7 contains ratios between experimental and design shear
values, and between experimental and nominal shear capacities. The nominal capacity was taken
as the ACI 318-08 design capacity calculated at the interface of the hollow and filled cross-
sections. The three trials without external reinforcement had an average ratio Vu/ΦVn of 1.13.
Meanwhile, the CFRP externally-wrapped specimen in test three had a Vu/ΦVn ratio of 1.24,
indicating the CFRP resulted in an 11% increase in shear capacity. The effectiveness of the
CFRP was limited, however, by its early delamination from the irregularly-shaped girder,
especially at the web indentation on either side of the beam (see Figure 6.29).
Table 6.7: Experimental vs. Theoretical Shear Capacity
Test Vu (kip) Vu/Vdesign Vu/ΦVn 1 167 1.37 1.16 2 158 1.30 1.10 3 179 1.47 1.24 4 162 1.33 1.12
Ratios between experimental and design moments, and between experimental and
nominal moment capacities, are presented in Table 6.8. In Test 1, shear cracking governed the
response of the girder and only 81% of the nominal moment was achieved at maximum load. In
Test 2, specimen damage was primarily due to flexural cracking, though the girder ultimately
failed in shear with accompanying strand slip; the specimen developed 96% of the nominal
moment. In Test 3, the specimen developed 94% of the nominal moment before failing abruptly
due to shear cracking and CFRP delaminating from the sides of the beam. Finally, in Test 4, the
girder experienced flexural damage with negligible strand slip and developed more than both the
design moment and nominal moment capacity; as stated before, the specimen was not taken to
ultimate failure. Strand slip in all tests occurred only after shear cracks had propagated across
bottom strands. On average, center strands slipped 24% further into the girders than outer
strands. This is likely the result of higher strand concentration and less concrete cover in the
center of the girder than near the web sections. From the limited number of trials, no correlation
was established between casting or strand release location and development length.
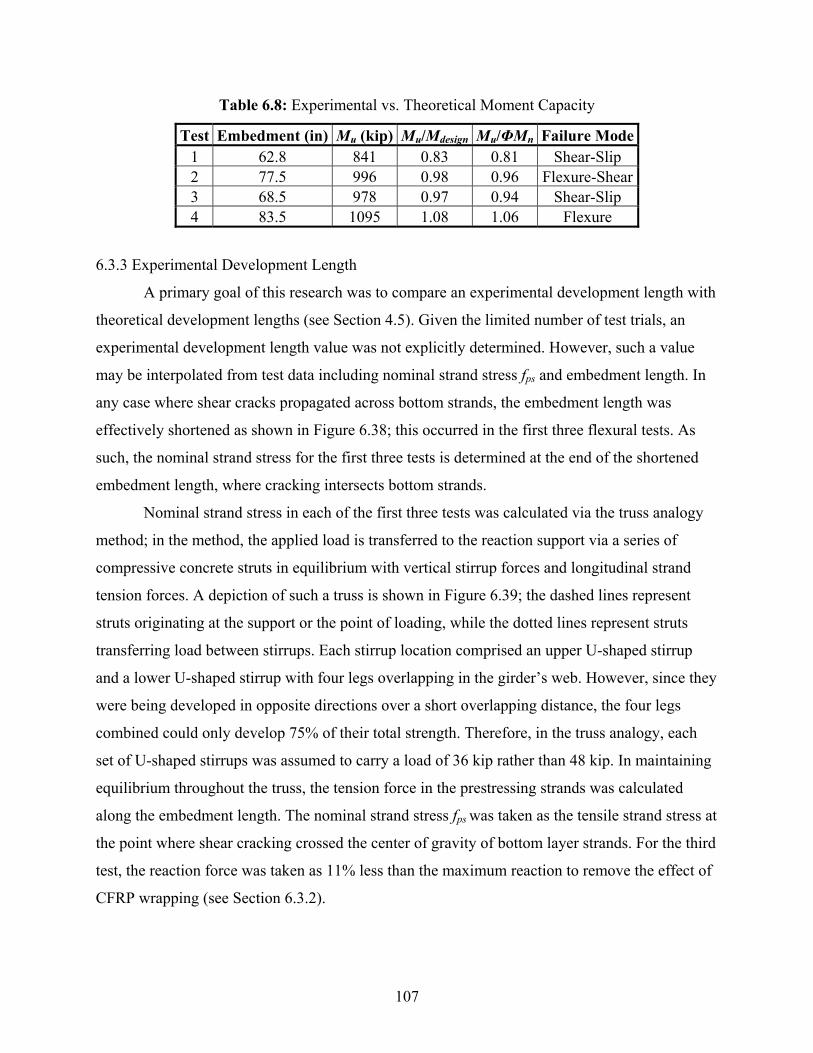
107
Table 6.8: Experimental vs. Theoretical Moment Capacity
Test Embedment (in) Mu (kip) Mu/Mdesign Mu/ΦMn Failure Mode 1 62.8 841 0.83 0.81 Shear-Slip 2 77.5 996 0.98 0.96 Flexure-Shear 3 68.5 978 0.97 0.94 Shear-Slip 4 83.5 1095 1.08 1.06 Flexure
6.3.3 Experimental Development Length
A primary goal of this research was to compare an experimental development length with
theoretical development lengths (see Section 4.5). Given the limited number of test trials, an
experimental development length value was not explicitly determined. However, such a value
may be interpolated from test data including nominal strand stress fps and embedment length. In
any case where shear cracks propagated across bottom strands, the embedment length was
effectively shortened as shown in Figure 6.38; this occurred in the first three flexural tests. As
such, the nominal strand stress for the first three tests is determined at the end of the shortened
embedment length, where cracking intersects bottom strands.
Nominal strand stress in each of the first three tests was calculated via the truss analogy
method; in the method, the applied load is transferred to the reaction support via a series of
compressive concrete struts in equilibrium with vertical stirrup forces and longitudinal strand
tension forces. A depiction of such a truss is shown in Figure 6.39; the dashed lines represent
struts originating at the support or the point of loading, while the dotted lines represent struts
transferring load between stirrups. Each stirrup location comprised an upper U-shaped stirrup
and a lower U-shaped stirrup with four legs overlapping in the girder’s web. However, since they
were being developed in opposite directions over a short overlapping distance, the four legs
combined could only develop 75% of their total strength. Therefore, in the truss analogy, each
set of U-shaped stirrups was assumed to carry a load of 36 kip rather than 48 kip. In maintaining
equilibrium throughout the truss, the tension force in the prestressing strands was calculated
along the embedment length. The nominal strand stress fps was taken as the tensile strand stress at
the point where shear cracking crossed the center of gravity of bottom layer strands. For the third
test, the reaction force was taken as 11% less than the maximum reaction to remove the effect of
CFRP wrapping (see Section 6.3.2).
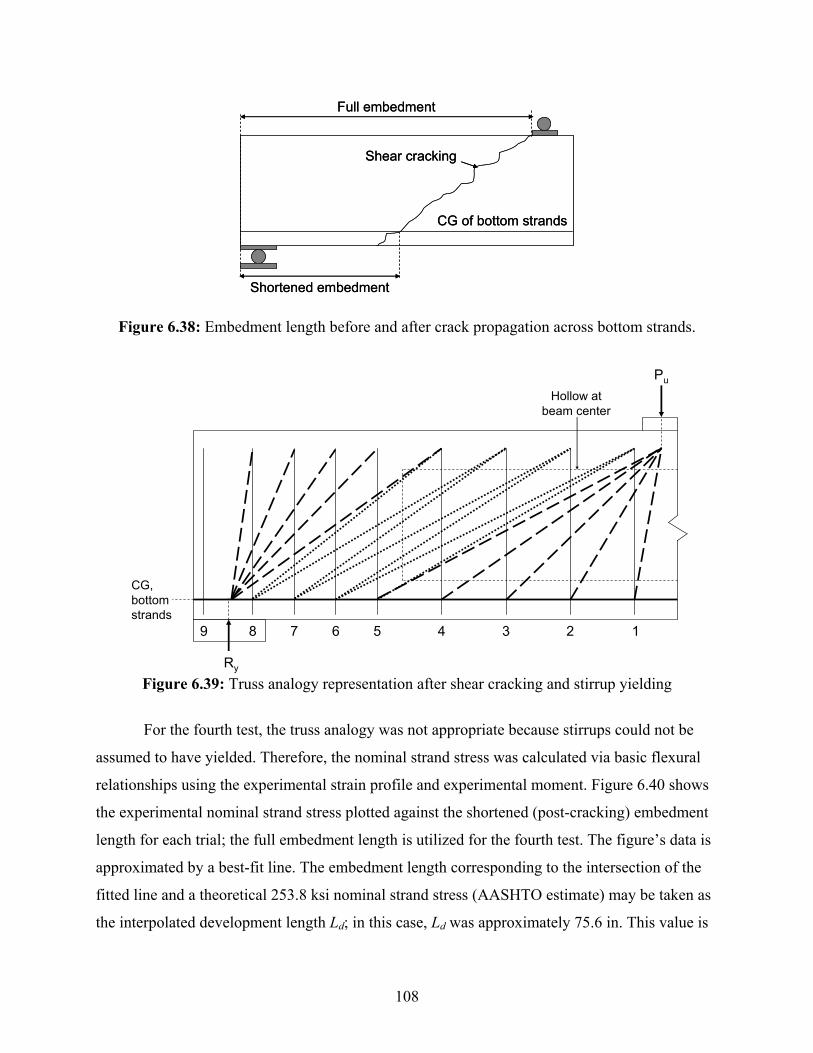
108
Full embedment
Shortened embedment
CG of bottom strands
Shear cracking
Full embedment
Shortened embedment
CG of bottom strands
Shear cracking
Figure 6.38: Embedment length before and after crack propagation across bottom strands.
123456789
Ry
Pu
CG, bottom strands
Hollow at beam center
Figure 6.39: Truss analogy representation after shear cracking and stirrup yielding
For the fourth test, the truss analogy was not appropriate because stirrups could not be
assumed to have yielded. Therefore, the nominal strand stress was calculated via basic flexural
relationships using the experimental strain profile and experimental moment. Figure 6.40 shows
the experimental nominal strand stress plotted against the shortened (post-cracking) embedment
length for each trial; the full embedment length is utilized for the fourth test. The figure’s data is
approximated by a best-fit line. The embedment length corresponding to the intersection of the
fitted line and a theoretical 253.8 ksi nominal strand stress (AASHTO estimate) may be taken as
the interpolated development length Ld; in this case, Ld was approximately 75.6 in. This value is
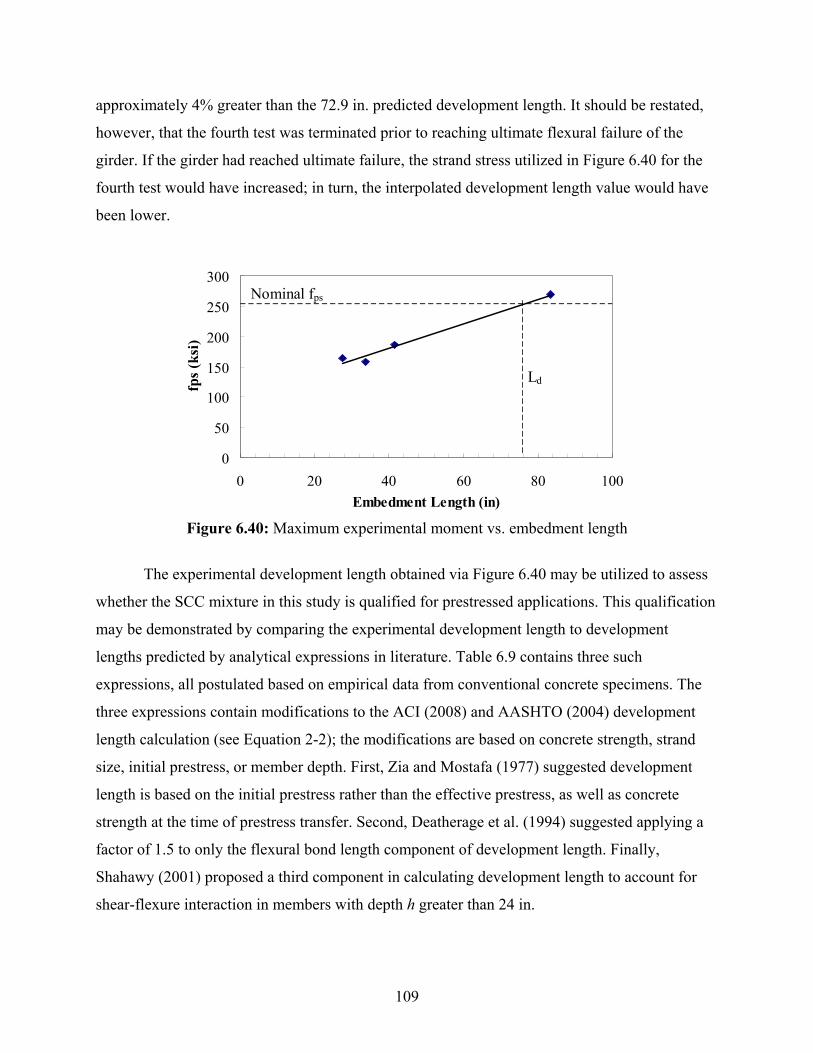
109
approximately 4% greater than the 72.9 in. predicted development length. It should be restated,
however, that the fourth test was terminated prior to reaching ultimate flexural failure of the
girder. If the girder had reached ultimate failure, the strand stress utilized in Figure 6.40 for the
fourth test would have increased; in turn, the interpolated development length value would have
been lower.
0
50
100
150
200
250
300
0 20 40 60 80 100Embedment Length (in)
fps (
ksi)
Nominal fps
Ld
Figure 6.40: Maximum experimental moment vs. embedment length
The experimental development length obtained via Figure 6.40 may be utilized to assess
whether the SCC mixture in this study is qualified for prestressed applications. This qualification
may be demonstrated by comparing the experimental development length to development
lengths predicted by analytical expressions in literature. Table 6.9 contains three such
expressions, all postulated based on empirical data from conventional concrete specimens. The
three expressions contain modifications to the ACI (2008) and AASHTO (2004) development
length calculation (see Equation 2-2); the modifications are based on concrete strength, strand
size, initial prestress, or member depth. First, Zia and Mostafa (1977) suggested development
length is based on the initial prestress rather than the effective prestress, as well as concrete
strength at the time of prestress transfer. Second, Deatherage et al. (1994) suggested applying a
factor of 1.5 to only the flexural bond length component of development length. Finally,
Shahawy (2001) proposed a third component in calculating development length to account for
shear-flexure interaction in members with depth h greater than 24 in.
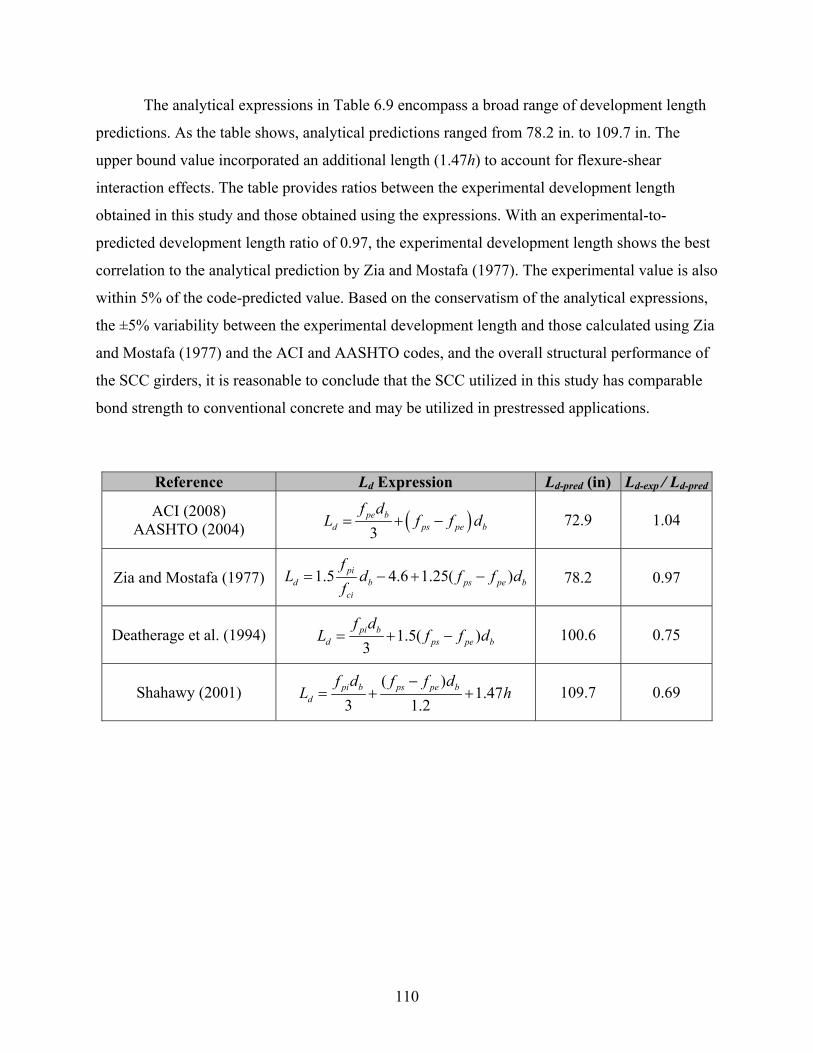
110
The analytical expressions in Table 6.9 encompass a broad range of development length
predictions. As the table shows, analytical predictions ranged from 78.2 in. to 109.7 in. The
upper bound value incorporated an additional length (1.47h) to account for flexure-shear
interaction effects. The table provides ratios between the experimental development length
obtained in this study and those obtained using the expressions. With an experimental-to-
predicted development length ratio of 0.97, the experimental development length shows the best
correlation to the analytical prediction by Zia and Mostafa (1977). The experimental value is also
within 5% of the code-predicted value. Based on the conservatism of the analytical expressions,
the ±5% variability between the experimental development length and those calculated using Zia
and Mostafa (1977) and the ACI and AASHTO codes, and the overall structural performance of
the SCC girders, it is reasonable to conclude that the SCC utilized in this study has comparable
bond strength to conventional concrete and may be utilized in prestressed applications.
Reference Ld Expression Ld-pred (in) Ld-exp / Ld-pred
ACI (2008) AASHTO (2004) ( )
3pe b
d ps pe b
f dL f f d= + − 72.9 1.04
Zia and Mostafa (1977) 1.5 4.6 1.25( )pid b ps pe b
ci
fL d f f d
f= − + − 78.2 0.97
Deatherage et al. (1994) 1.5( )3
pi bd ps pe b
f dL f f d= + − 100.6 0.75
Shahawy (2001) ( )
1.473 1.2
pi b ps pe bd
f d f f dL h
−= + + 109.7 0.69
111
CHAPTER 7: FINITE ELEMENT ANALYSIS
Determining transfer and development lengths through experimental tests may be the
most rigorous method for assessing bond between prestressing strands and SCC. However, such
tests may be prohibitive in terms of time and cost when performed using large-scale specimens.
A simple yet accurate analytical approach to predicting transfer or development length would be
useful in situations where large-scale testing is not feasible. This chapter outlines a systematic
method to predict transfer length in prestressed members using pullout test data and finite
element analysis. The first step involves deriving bond stress-slip relationships from force-
displacement responses obtained via pullout tests. With appropriate modification factors
obtained from the literature, the relationships are then correlated to bond stress-slip behavior
expected in transfer zones of prestressed members. The modified relationships define parameters
in finite element models incorporating bond-slip via nonlinear spring elements. Analytical
transfer lengths from the models are compared with the experimental results presented in
Chapter 5. With proper refinement, the models may be extended to accurately predict
development length.
7.1 MODELING PHILOSOPHY
All analyses for this study were conducted using three-dimensional models in the finite
element program ANSYS (2007). This section describes the procedure followed to develop these
models. Defined first was the solid model geometry including volumes for concrete sections,
volumes for bearing plates, and lines for prestressing strands. Transverse steel reinforcement was
not explicitly modeled; rather, it was incorporated as smeared reinforcement within concrete
elements. The lines defining solid model entities were manually assigned size controls for
meshing. Smaller mesh sizes were specified in areas of high stress concentration. Care was taken
to ensure concrete nodes would coincide with steel nodes at locations of prestressing strands.
Elements were created by sweeping volume entities and using the global mesh tool to mesh line
elements (i.e. prestressing strands).
Each element was assigned a specific element type, set of real constants, and material
model. In ANSYS (2007), an element’s type defines its modeling capabilities and degrees of
freedom; real constants define parameters which remain unchanged throughout analysis; and
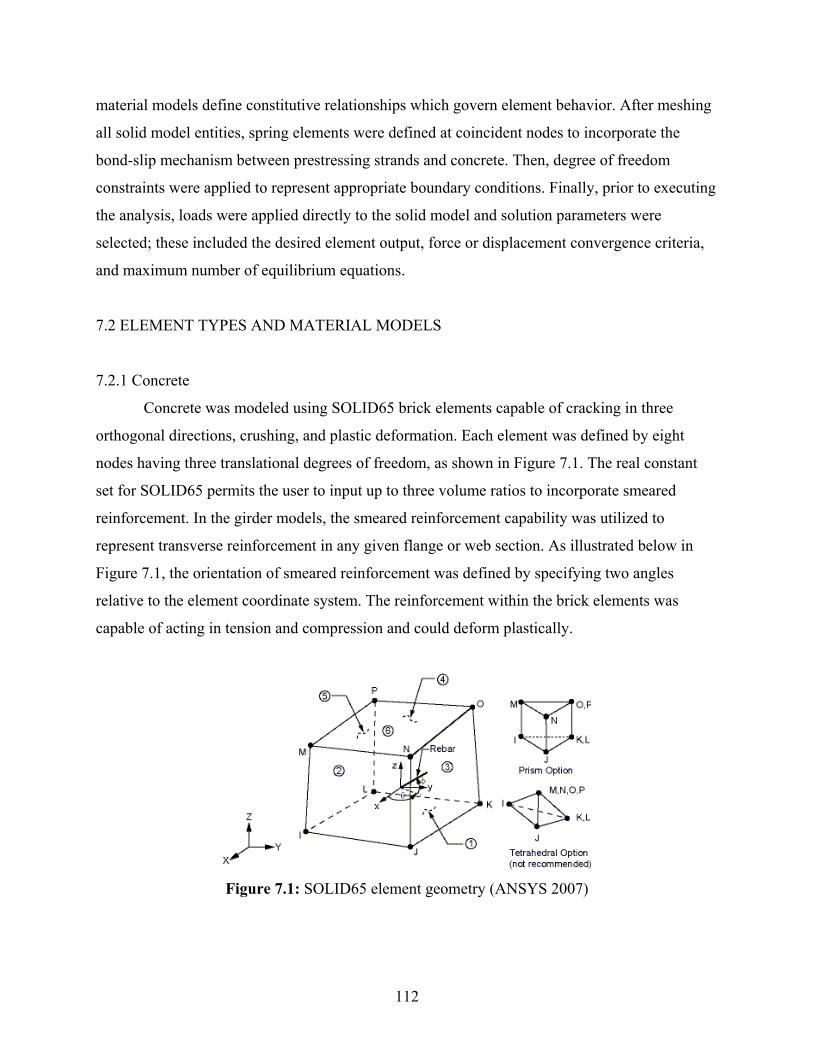
112
material models define constitutive relationships which govern element behavior. After meshing
all solid model entities, spring elements were defined at coincident nodes to incorporate the
bond-slip mechanism between prestressing strands and concrete. Then, degree of freedom
constraints were applied to represent appropriate boundary conditions. Finally, prior to executing
the analysis, loads were applied directly to the solid model and solution parameters were
selected; these included the desired element output, force or displacement convergence criteria,
and maximum number of equilibrium equations.
7.2 ELEMENT TYPES AND MATERIAL MODELS
7.2.1 Concrete
Concrete was modeled using SOLID65 brick elements capable of cracking in three
orthogonal directions, crushing, and plastic deformation. Each element was defined by eight
nodes having three translational degrees of freedom, as shown in Figure 7.1. The real constant
set for SOLID65 permits the user to input up to three volume ratios to incorporate smeared
reinforcement. In the girder models, the smeared reinforcement capability was utilized to
represent transverse reinforcement in any given flange or web section. As illustrated below in
Figure 7.1, the orientation of smeared reinforcement was defined by specifying two angles
relative to the element coordinate system. The reinforcement within the brick elements was
capable of acting in tension and compression and could deform plastically.
Figure 7.1: SOLID65 element geometry (ANSYS 2007)
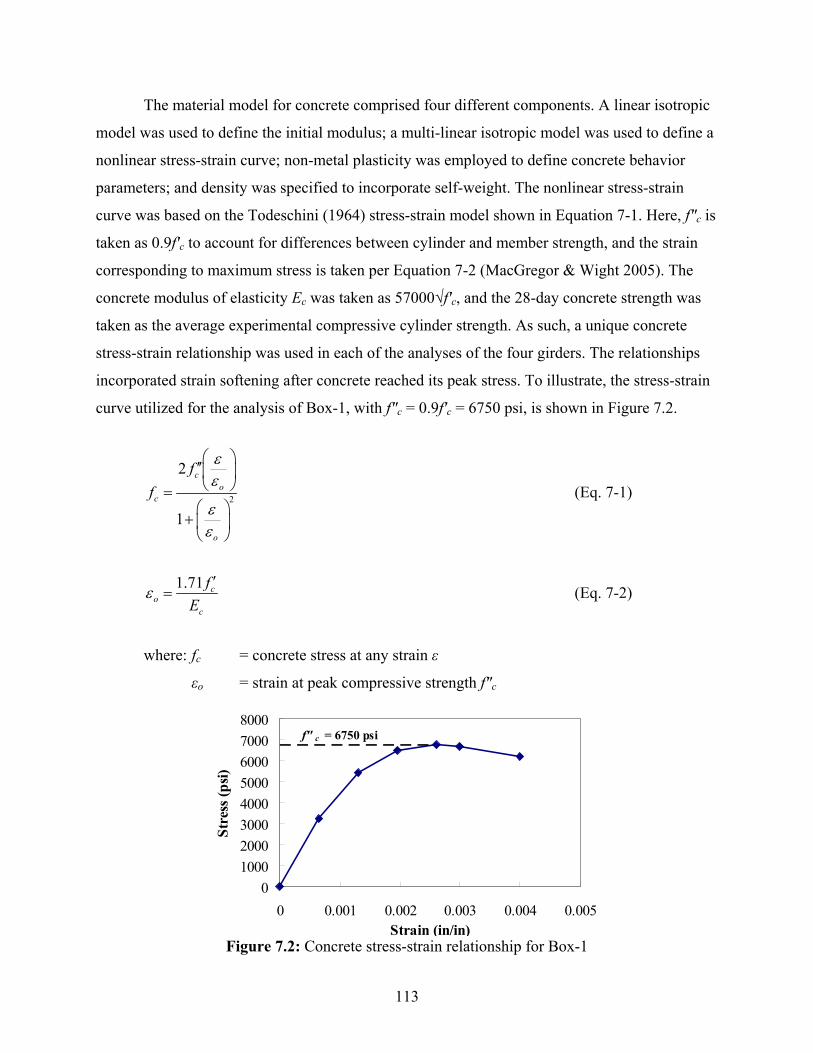
113
The material model for concrete comprised four different components. A linear isotropic
model was used to define the initial modulus; a multi-linear isotropic model was used to define a
nonlinear stress-strain curve; non-metal plasticity was employed to define concrete behavior
parameters; and density was specified to incorporate self-weight. The nonlinear stress-strain
curve was based on the Todeschini (1964) stress-strain model shown in Equation 7-1. Here, f″c is
taken as 0.9f′c to account for differences between cylinder and member strength, and the strain
corresponding to maximum stress is taken per Equation 7-2 (MacGregor & Wight 2005). The
concrete modulus of elasticity Ec was taken as 57000√f′c, and the 28-day concrete strength was
taken as the average experimental compressive cylinder strength. As such, a unique concrete
stress-strain relationship was used in each of the analyses of the four girders. The relationships
incorporated strain softening after concrete reached its peak stress. To illustrate, the stress-strain
curve utilized for the analysis of Box-1, with f″c = 0.9f′c = 6750 psi, is shown in Figure 7.2.
2
2
1
co
c
o
ff
εε
εε
⎛ ⎞′′⎜ ⎟⎝ ⎠=⎛ ⎞
+ ⎜ ⎟⎝ ⎠
(Eq. 7-1)
1.71 co
c
fE
ε′
= (Eq. 7-2)
where: fc = concrete stress at any strain ε
εo = strain at peak compressive strength f″c
010002000300040005000600070008000
0 0.001 0.002 0.003 0.004 0.005Strain (in/in)
Stre
ss (p
si)
f″ c = 6750 psi
Figure 7.2: Concrete stress-strain relationship for Box-1

114
Concrete behavior parameters were defined according to the Willam and Warnke (1974)
failure model. The nine parameters are listed in Table 7.1. The first two constants in the table
relate to load transfer across open and closed cracks. For the analyses at hand, the coefficient for
open cracks was taken as 0.3 and the coefficient for closed cracks was taken as 0.99. The third
constant, the uniaxial cracking stress, was taken as the modulus of rupture determined using
experimental concrete strengths. The fourth constant in the table was set to -1 to disable the
SOLID65 element’s crushing capability and avoid convergence problems. The five remaining
parameters in Table 7.1 were set to ANSYS defaults.
Table 7.1: SOLID65 Concrete Material Model Parameters (ANSYS 2007)
Constant Physical Representation 1 Shear transfer coefficient for an open crack 2 Shear transfer coefficient for a closed crack 3 Uniaxial tensile cracking stress 4 Uniaxial crushing stress 5 Biaxial crushing stress 6 Ambient hydrostatic stress state 7 Biaxial crushing stress under ambient hydrostatic stress 8 Uniaxial crushing stress under ambient hydrostatic stress 9 Stiffness multiplier for cracked tensile condition
7.2.2 Prestressing Strands
Prestressing strands were modeled using three-dimensional LINK8 spar elements capable
of plastic deformation, stress stiffening, and large deflections. The elements resisted uniaxial
tension and compression, but did not consider bending. Each element had two non-coincident
nodes with three translational degrees of freedom each, as shown in Figure 7.3. The real constant
set for LINK8 elements required two inputs. The first parameter defined the cross-sectional area
of the spar, which in these analyses was 0.153 in2. The second parameter defined the initial strain
within the spar; it was through this initial strain that prestress within the girders was incorporated
in the models. The material model for prestressing steel had two components, the first of which
defined the elastic modulus of 28700 ksi. The second defined a nonlinear stress-strain curve
typical of Grade 270, 0.5-in. diameter seven-wire strands.
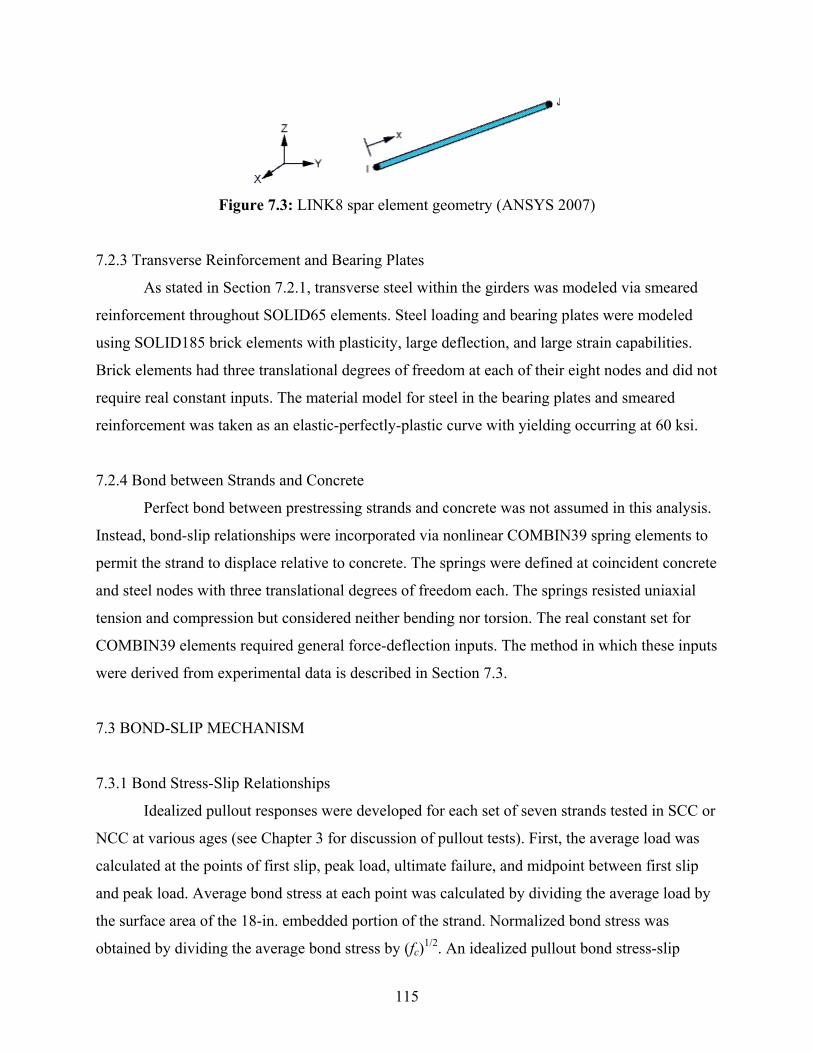
115
Figure 7.3: LINK8 spar element geometry (ANSYS 2007)
7.2.3 Transverse Reinforcement and Bearing Plates
As stated in Section 7.2.1, transverse steel within the girders was modeled via smeared
reinforcement throughout SOLID65 elements. Steel loading and bearing plates were modeled
using SOLID185 brick elements with plasticity, large deflection, and large strain capabilities.
Brick elements had three translational degrees of freedom at each of their eight nodes and did not
require real constant inputs. The material model for steel in the bearing plates and smeared
reinforcement was taken as an elastic-perfectly-plastic curve with yielding occurring at 60 ksi.
7.2.4 Bond between Strands and Concrete
Perfect bond between prestressing strands and concrete was not assumed in this analysis.
Instead, bond-slip relationships were incorporated via nonlinear COMBIN39 spring elements to
permit the strand to displace relative to concrete. The springs were defined at coincident concrete
and steel nodes with three translational degrees of freedom each. The springs resisted uniaxial
tension and compression but considered neither bending nor torsion. The real constant set for
COMBIN39 elements required general force-deflection inputs. The method in which these inputs
were derived from experimental data is described in Section 7.3.
7.3 BOND-SLIP MECHANISM
7.3.1 Bond Stress-Slip Relationships
Idealized pullout responses were developed for each set of seven strands tested in SCC or
NCC at various ages (see Chapter 3 for discussion of pullout tests). First, the average load was
calculated at the points of first slip, peak load, ultimate failure, and midpoint between first slip
and peak load. Average bond stress at each point was calculated by dividing the average load by
the surface area of the 18-in. embedded portion of the strand. Normalized bond stress was
obtained by dividing the average bond stress by (fc)1/2. An idealized pullout bond stress-slip

116
relationship is illustrated in Figure 7.4, where U is the average bond stress and U′ is the
normalized bond stress. Slip was calibrated using steel constitutive properties to eliminate the
effect of the strand elongation that occurred between the concrete surface and the point at which
the LVDT measured displacement (see Figure 3.5 for pullout test assembly). Figure 7.5 displays
idealized bond stress-slip relationships for both concrete types at various curing ages. Until first
slip occurred, SCC and NCC relationships were comparable. The peak normalized bond stress of
SCC was 25% greater than that of NCC one day after concrete placement. After seven days the
converse held true; peak normalized bond stress of NCC was approximately 25% greater than
that of SCC. Differences between the concretes’ peak bond stresses at 3 and 28 days were
negligible.
0
5
10
15
20
25
30
0.0 0.5 1.0 1.5 2.0 2.5 3.0Slip (in.)
U′ =
U/√
f′c (√
psi)
Experimental ResponsesIdealized Response
Figure 7.4: Idealized bond stress-slip curve derived from experimental curves for 3-day SCC
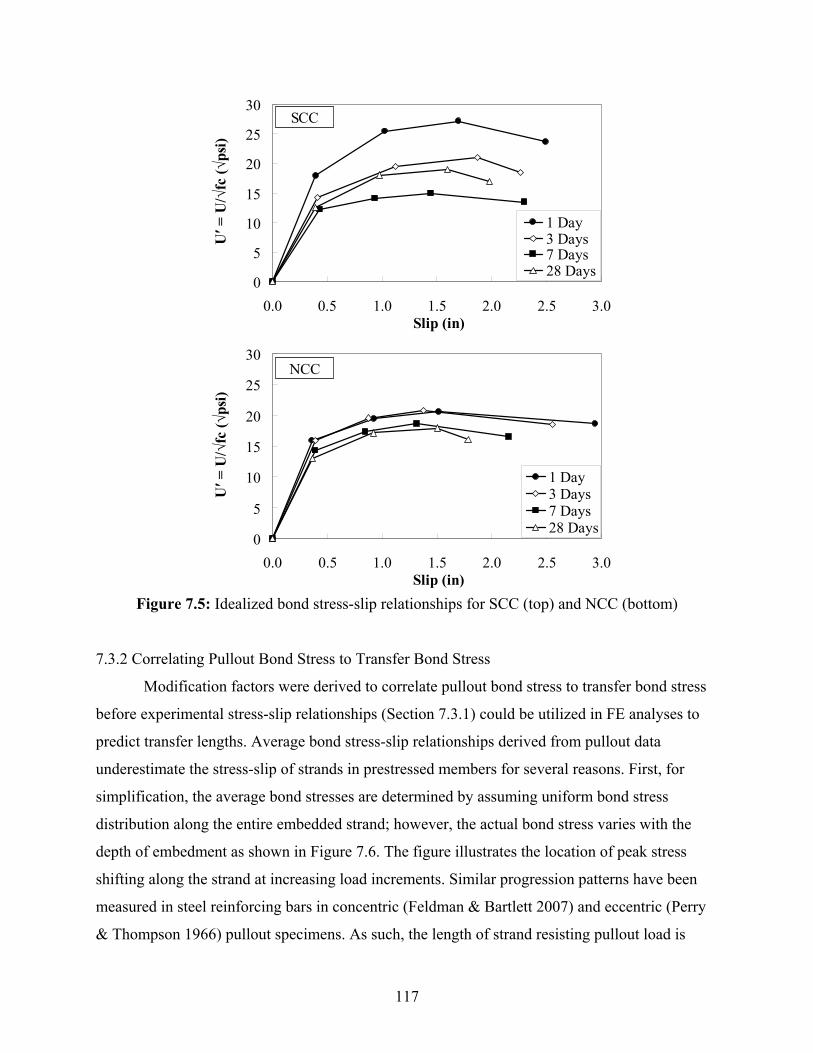
117
0
5
10
15
20
25
30
0.0 0.5 1.0 1.5 2.0 2.5 3.0Slip (in)
U′ =
U/√
fc (√
psi)
1 Day3 Days7 Days28 Days
SCC
0
5
10
15
20
25
30
0.0 0.5 1.0 1.5 2.0 2.5 3.0Slip (in)
U′ =
U/√
fc (√
psi)
1 Day3 Days7 Days28 Days
NCC
Figure 7.5: Idealized bond stress-slip relationships for SCC (top) and NCC (bottom)
7.3.2 Correlating Pullout Bond Stress to Transfer Bond Stress
Modification factors were derived to correlate pullout bond stress to transfer bond stress
before experimental stress-slip relationships (Section 7.3.1) could be utilized in FE analyses to
predict transfer lengths. Average bond stress-slip relationships derived from pullout data
underestimate the stress-slip of strands in prestressed members for several reasons. First, for
simplification, the average bond stresses are determined by assuming uniform bond stress
distribution along the entire embedded strand; however, the actual bond stress varies with the
depth of embedment as shown in Figure 7.6. The figure illustrates the location of peak stress
shifting along the strand at increasing load increments. Similar progression patterns have been
measured in steel reinforcing bars in concentric (Feldman & Bartlett 2007) and eccentric (Perry
& Thompson 1966) pullout specimens. As such, the length of strand resisting pullout load is
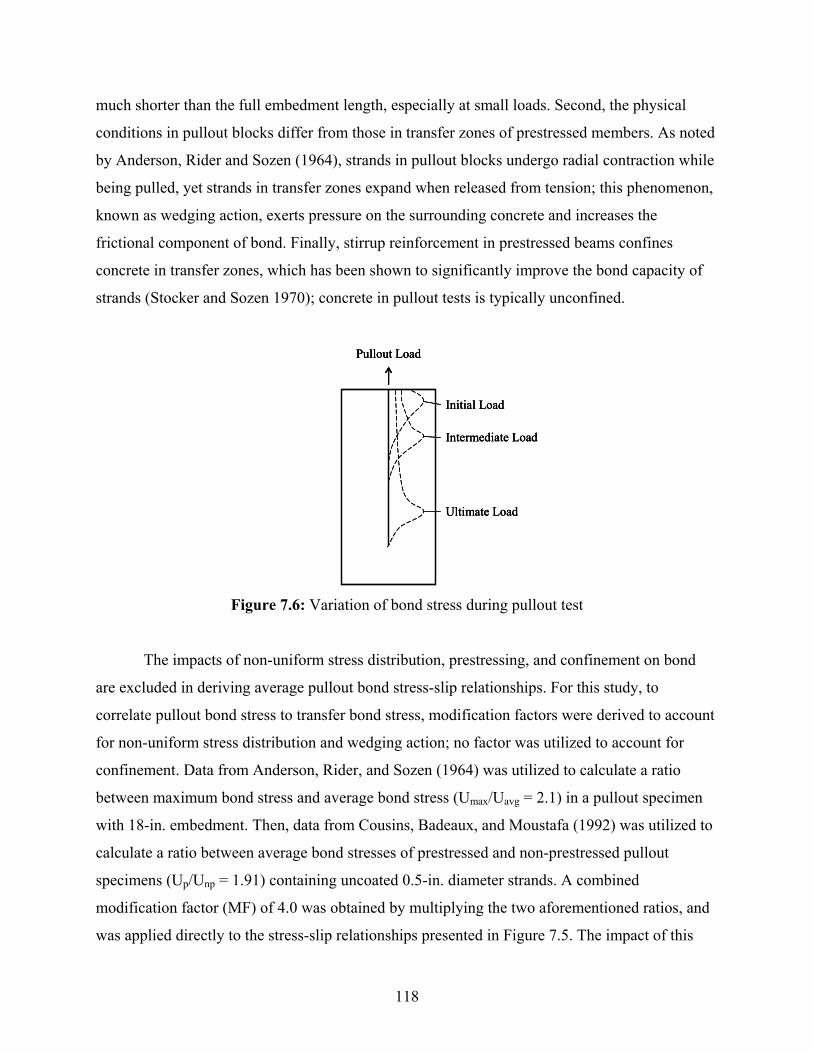
118
much shorter than the full embedment length, especially at small loads. Second, the physical
conditions in pullout blocks differ from those in transfer zones of prestressed members. As noted
by Anderson, Rider and Sozen (1964), strands in pullout blocks undergo radial contraction while
being pulled, yet strands in transfer zones expand when released from tension; this phenomenon,
known as wedging action, exerts pressure on the surrounding concrete and increases the
frictional component of bond. Finally, stirrup reinforcement in prestressed beams confines
concrete in transfer zones, which has been shown to significantly improve the bond capacity of
strands (Stocker and Sozen 1970); concrete in pullout tests is typically unconfined.
Initial Load
Intermediate Load
Ultimate Load
Pullout Load
Initial Load
Intermediate Load
Ultimate Load
Pullout Load
Initial Load
Intermediate Load
Ultimate Load
Pullout Load
Figure 7.6: Variation of bond stress during pullout test
The impacts of non-uniform stress distribution, prestressing, and confinement on bond
are excluded in deriving average pullout bond stress-slip relationships. For this study, to
correlate pullout bond stress to transfer bond stress, modification factors were derived to account
for non-uniform stress distribution and wedging action; no factor was utilized to account for
confinement. Data from Anderson, Rider, and Sozen (1964) was utilized to calculate a ratio
between maximum bond stress and average bond stress (Umax/Uavg = 2.1) in a pullout specimen
with 18-in. embedment. Then, data from Cousins, Badeaux, and Moustafa (1992) was utilized to
calculate a ratio between average bond stresses of prestressed and non-prestressed pullout
specimens (Up/Unp = 1.91) containing uncoated 0.5-in. diameter strands. A combined
modification factor (MF) of 4.0 was obtained by multiplying the two aforementioned ratios, and
was applied directly to the stress-slip relationships presented in Figure 7.5. The impact of this
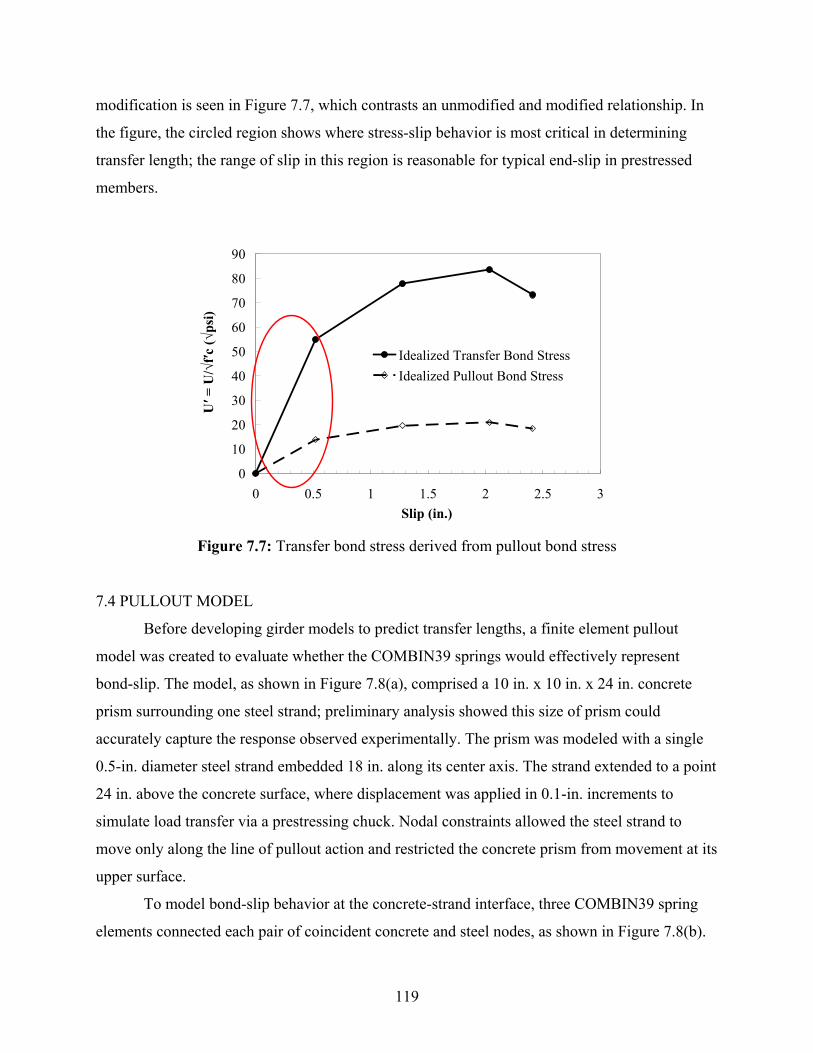
119
modification is seen in Figure 7.7, which contrasts an unmodified and modified relationship. In
the figure, the circled region shows where stress-slip behavior is most critical in determining
transfer length; the range of slip in this region is reasonable for typical end-slip in prestressed
members.
0
10
20
30
40
50
60
70
80
90
0 0.5 1 1.5 2 2.5 3Slip (in.)
U′ =
U/√
f′c (√
psi)
Idealized Transfer Bond StressIdealized Pullout Bond Stress
Figure 7.7: Transfer bond stress derived from pullout bond stress
7.4 PULLOUT MODEL
Before developing girder models to predict transfer lengths, a finite element pullout
model was created to evaluate whether the COMBIN39 springs would effectively represent
bond-slip. The model, as shown in Figure 7.8(a), comprised a 10 in. x 10 in. x 24 in. concrete
prism surrounding one steel strand; preliminary analysis showed this size of prism could
accurately capture the response observed experimentally. The prism was modeled with a single
0.5-in. diameter steel strand embedded 18 in. along its center axis. The strand extended to a point
24 in. above the concrete surface, where displacement was applied in 0.1-in. increments to
simulate load transfer via a prestressing chuck. Nodal constraints allowed the steel strand to
move only along the line of pullout action and restricted the concrete prism from movement at its
upper surface.
To model bond-slip behavior at the concrete-strand interface, three COMBIN39 spring
elements connected each pair of coincident concrete and steel nodes, as shown in Figure 7.8(b).
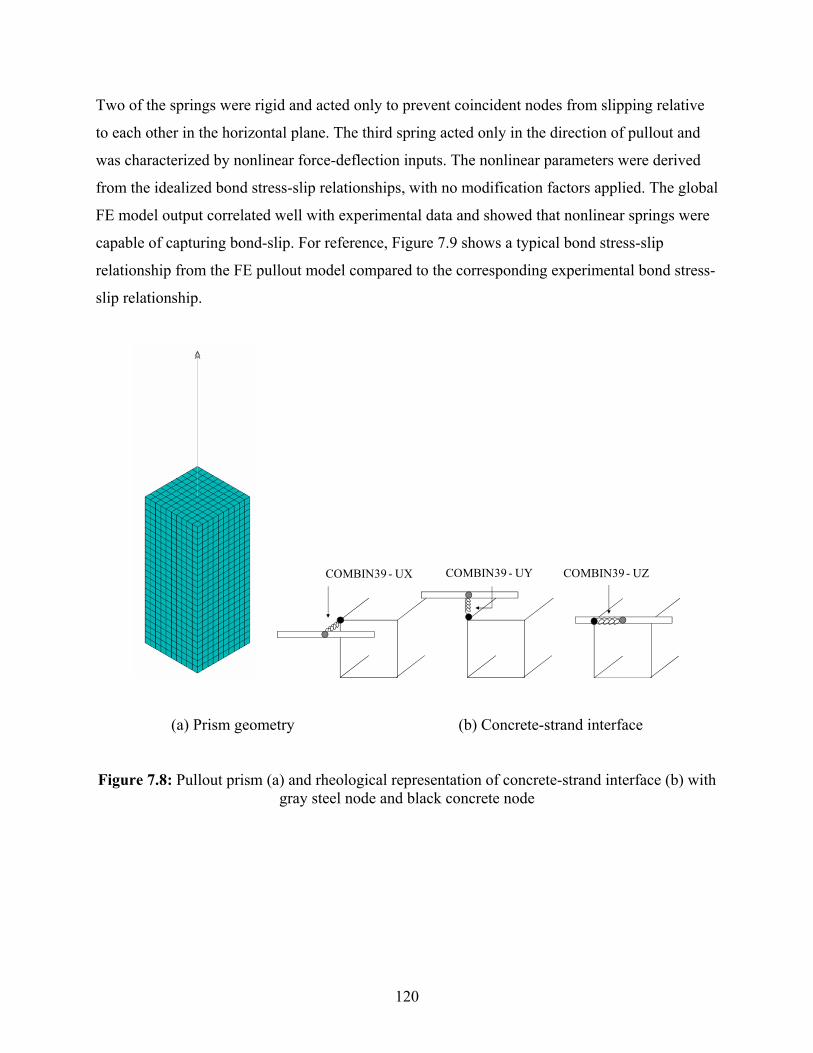
120
Two of the springs were rigid and acted only to prevent coincident nodes from slipping relative
to each other in the horizontal plane. The third spring acted only in the direction of pullout and
was characterized by nonlinear force-deflection inputs. The nonlinear parameters were derived
from the idealized bond stress-slip relationships, with no modification factors applied. The global
FE model output correlated well with experimental data and showed that nonlinear springs were
capable of capturing bond-slip. For reference, Figure 7.9 shows a typical bond stress-slip
relationship from the FE pullout model compared to the corresponding experimental bond stress-
slip relationship.
COMBIN39 - UYCOMBIN39 - UX COMBIN39 - UZ
(a) Prism geometry (b) Concrete-strand interface
Figure 7.8: Pullout prism (a) and rheological representation of concrete-strand interface (b) with gray steel node and black concrete node
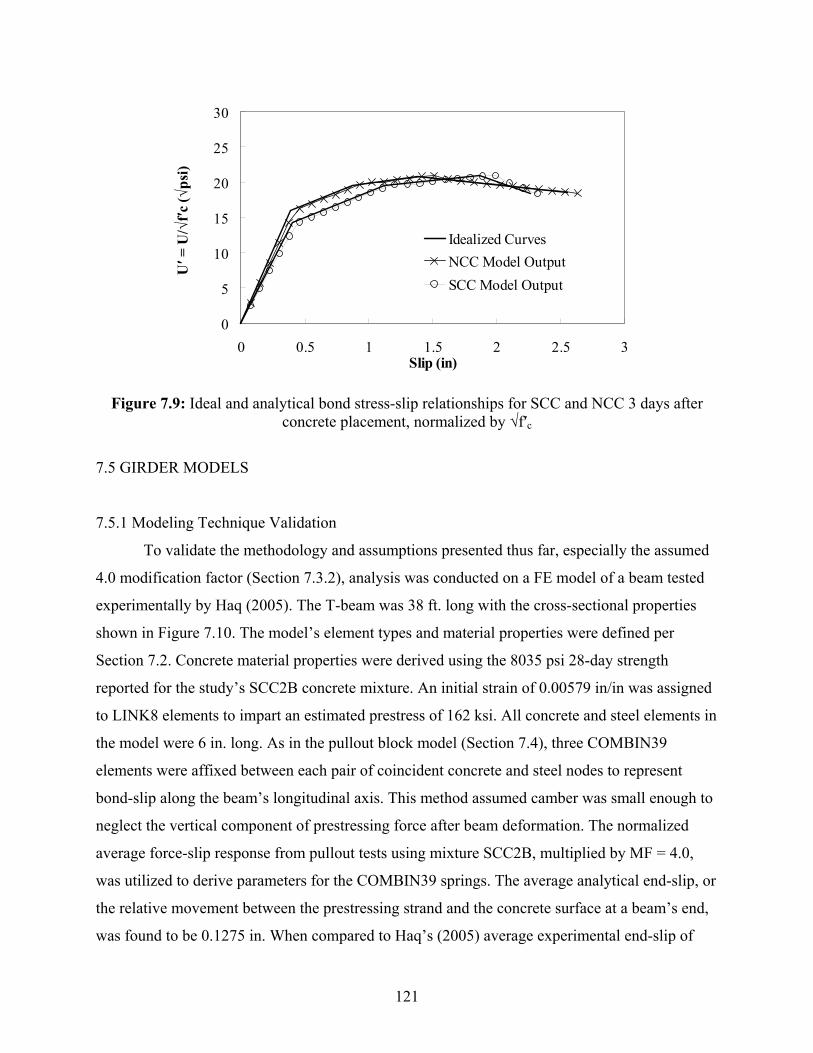
121
0
5
10
15
20
25
30
0 0.5 1 1.5 2 2.5 3Slip (in)
U′ =
U/√
f′c (√
psi)
Idealized CurvesNCC Model OutputSCC Model Output
Figure 7.9: Ideal and analytical bond stress-slip relationships for SCC and NCC 3 days after
concrete placement, normalized by √f′c
7.5 GIRDER MODELS
7.5.1 Modeling Technique Validation
To validate the methodology and assumptions presented thus far, especially the assumed
4.0 modification factor (Section 7.3.2), analysis was conducted on a FE model of a beam tested
experimentally by Haq (2005). The T-beam was 38 ft. long with the cross-sectional properties
shown in Figure 7.10. The model’s element types and material properties were defined per
Section 7.2. Concrete material properties were derived using the 8035 psi 28-day strength
reported for the study’s SCC2B concrete mixture. An initial strain of 0.00579 in/in was assigned
to LINK8 elements to impart an estimated prestress of 162 ksi. All concrete and steel elements in
the model were 6 in. long. As in the pullout block model (Section 7.4), three COMBIN39
elements were affixed between each pair of coincident concrete and steel nodes to represent
bond-slip along the beam’s longitudinal axis. This method assumed camber was small enough to
neglect the vertical component of prestressing force after beam deformation. The normalized
average force-slip response from pullout tests using mixture SCC2B, multiplied by MF = 4.0,
was utilized to derive parameters for the COMBIN39 springs. The average analytical end-slip, or
the relative movement between the prestressing strand and the concrete surface at a beam’s end,
was found to be 0.1275 in. When compared to Haq’s (2005) average experimental end-slip of
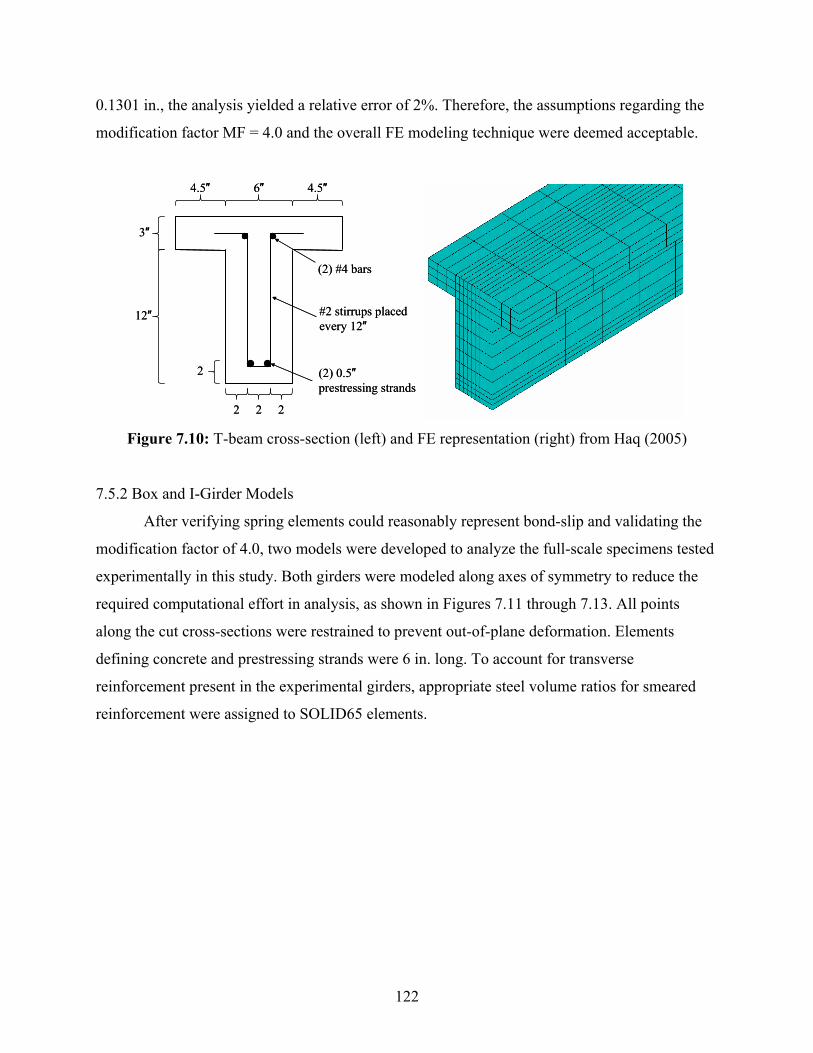
122
0.1301 in., the analysis yielded a relative error of 2%. Therefore, the assumptions regarding the
modification factor MF = 4.0 and the overall FE modeling technique were deemed acceptable.
4.5″ 6″ 4.5″
3″
12″
2
2 2 2
(2) 0.5″prestressing strands
(2) #4 bars
#2 stirrups placed every 12″
4.5″ 6″ 4.5″
3″
12″
2
2 2 2
(2) 0.5″prestressing strands
(2) #4 bars
#2 stirrups placed every 12″
Figure 7.10: T-beam cross-section (left) and FE representation (right) from Haq (2005)
7.5.2 Box and I-Girder Models
After verifying spring elements could reasonably represent bond-slip and validating the
modification factor of 4.0, two models were developed to analyze the full-scale specimens tested
experimentally in this study. Both girders were modeled along axes of symmetry to reduce the
required computational effort in analysis, as shown in Figures 7.11 through 7.13. All points
along the cut cross-sections were restrained to prevent out-of-plane deformation. Elements
defining concrete and prestressing strands were 6 in. long. To account for transverse
reinforcement present in the experimental girders, appropriate steel volume ratios for smeared
reinforcement were assigned to SOLID65 elements.
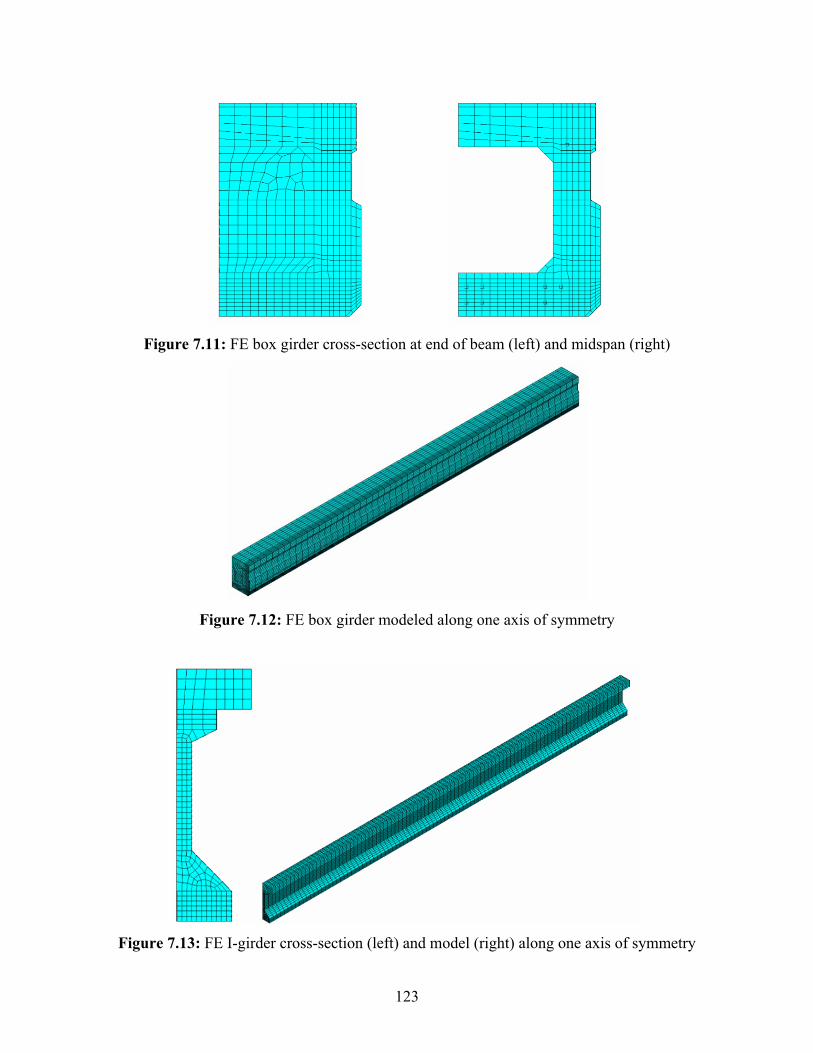
123
Figure 7.11: FE box girder cross-section at end of beam (left) and midspan (right)
Figure 7.12: FE box girder modeled along one axis of symmetry
Figure 7.13: FE I-girder cross-section (left) and model (right) along one axis of symmetry
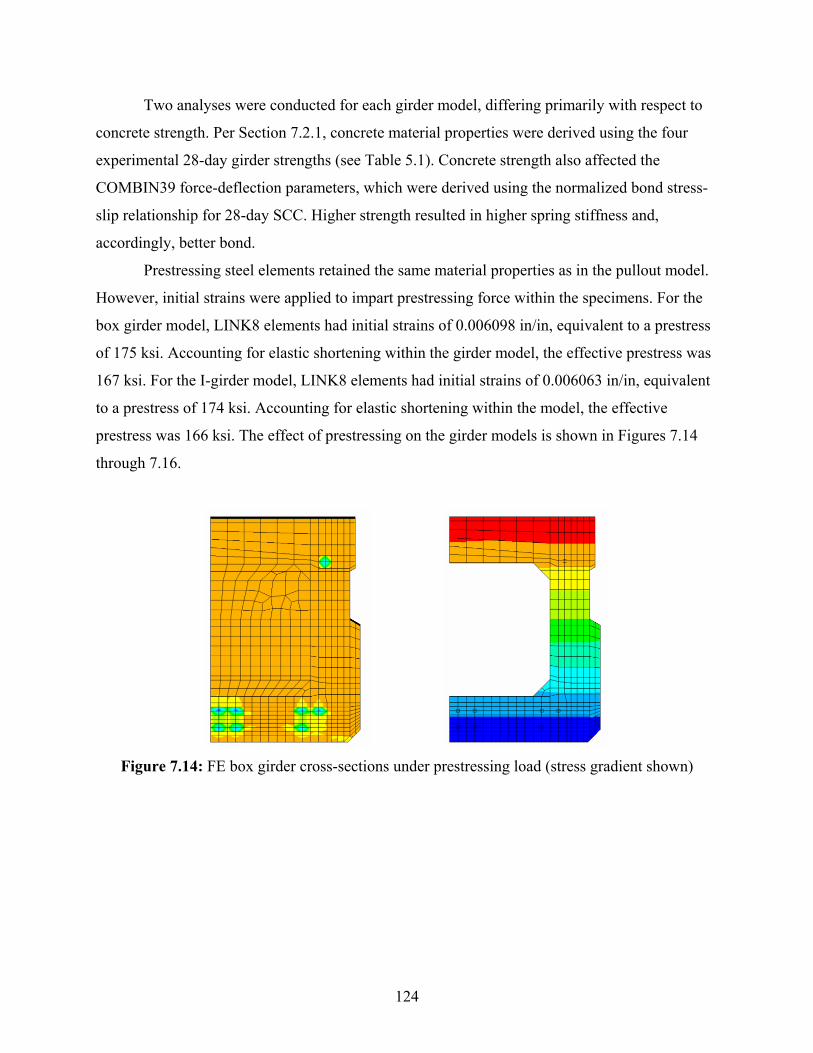
124
Two analyses were conducted for each girder model, differing primarily with respect to
concrete strength. Per Section 7.2.1, concrete material properties were derived using the four
experimental 28-day girder strengths (see Table 5.1). Concrete strength also affected the
COMBIN39 force-deflection parameters, which were derived using the normalized bond stress-
slip relationship for 28-day SCC. Higher strength resulted in higher spring stiffness and,
accordingly, better bond.
Prestressing steel elements retained the same material properties as in the pullout model.
However, initial strains were applied to impart prestressing force within the specimens. For the
box girder model, LINK8 elements had initial strains of 0.006098 in/in, equivalent to a prestress
of 175 ksi. Accounting for elastic shortening within the girder model, the effective prestress was
167 ksi. For the I-girder model, LINK8 elements had initial strains of 0.006063 in/in, equivalent
to a prestress of 174 ksi. Accounting for elastic shortening within the model, the effective
prestress was 166 ksi. The effect of prestressing on the girder models is shown in Figures 7.14
through 7.16.
Figure 7.14: FE box girder cross-sections under prestressing load (stress gradient shown)
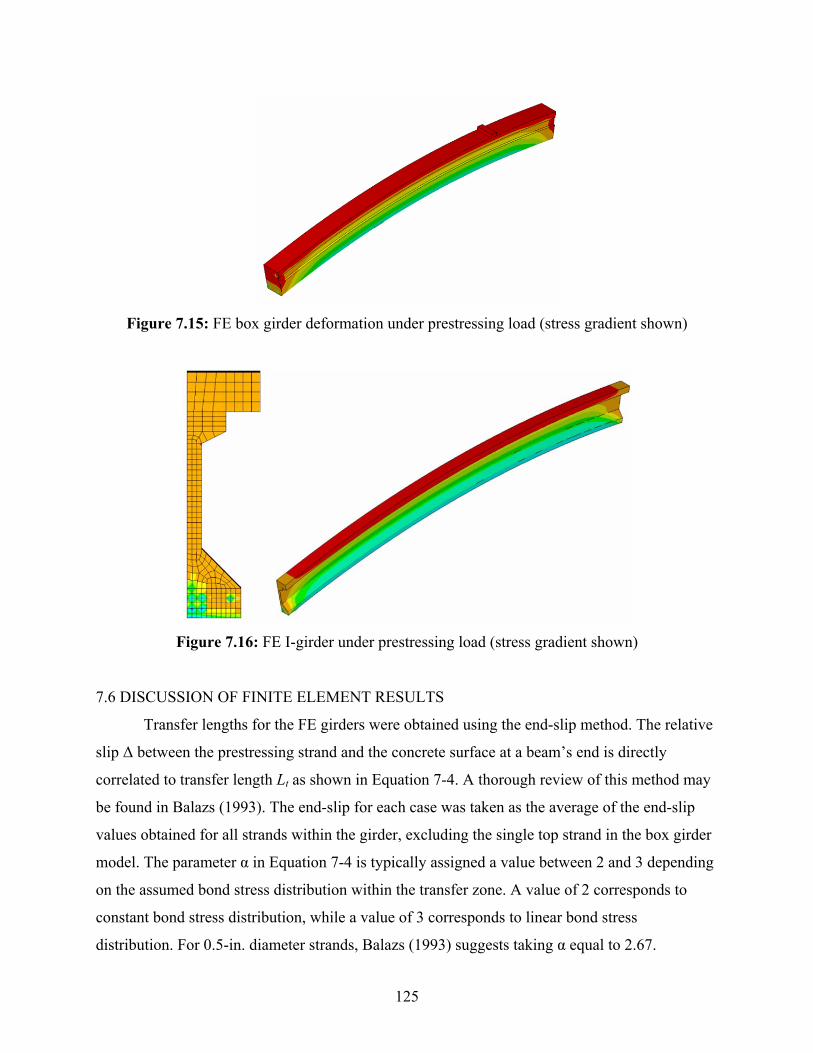
125
Figure 7.15: FE box girder deformation under prestressing load (stress gradient shown)
Figure 7.16: FE I-girder under prestressing load (stress gradient shown)
7.6 DISCUSSION OF FINITE ELEMENT RESULTS
Transfer lengths for the FE girders were obtained using the end-slip method. The relative
slip Δ between the prestressing strand and the concrete surface at a beam’s end is directly
correlated to transfer length Lt as shown in Equation 7-4. A thorough review of this method may
be found in Balazs (1993). The end-slip for each case was taken as the average of the end-slip
values obtained for all strands within the girder, excluding the single top strand in the box girder
model. The parameter α in Equation 7-4 is typically assigned a value between 2 and 3 depending
on the assumed bond stress distribution within the transfer zone. A value of 2 corresponds to
constant bond stress distribution, while a value of 3 corresponds to linear bond stress
distribution. For 0.5-in. diameter strands, Balazs (1993) suggests taking α equal to 2.67.
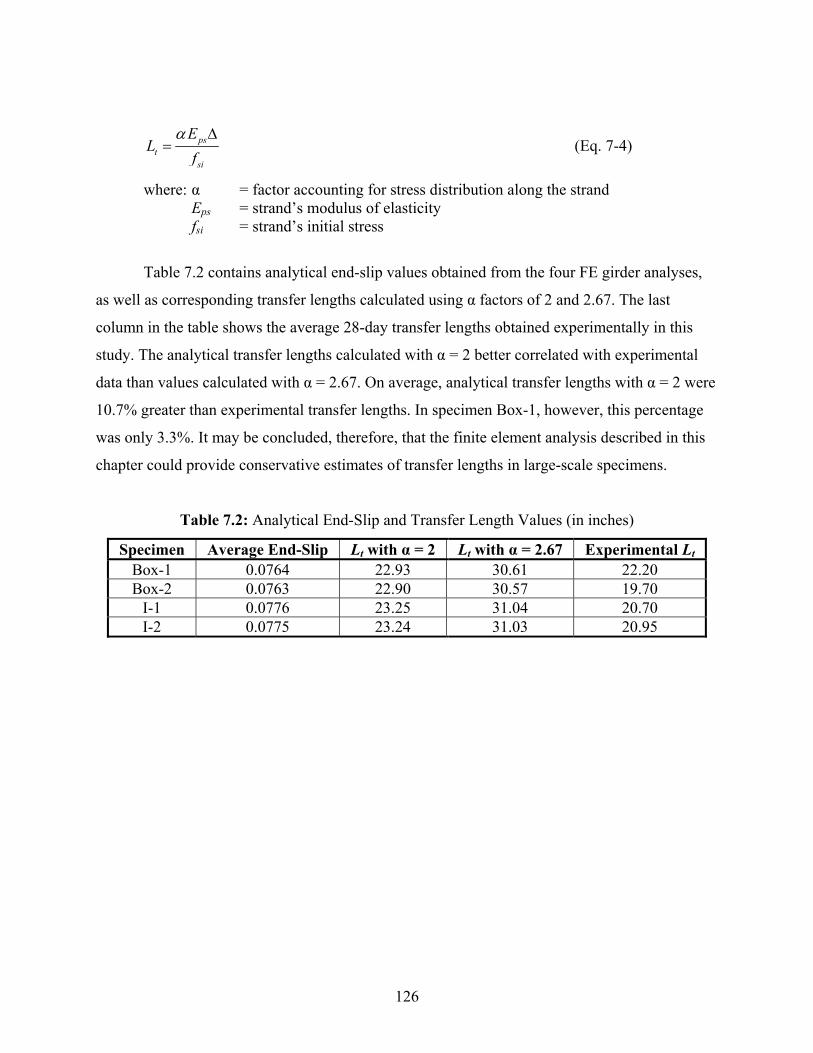
126
pst
si
EL
fα Δ
= (Eq. 7-4)
where: α = factor accounting for stress distribution along the strand Eps = strand’s modulus of elasticity fsi = strand’s initial stress
Table 7.2 contains analytical end-slip values obtained from the four FE girder analyses,
as well as corresponding transfer lengths calculated using α factors of 2 and 2.67. The last
column in the table shows the average 28-day transfer lengths obtained experimentally in this
study. The analytical transfer lengths calculated with α = 2 better correlated with experimental
data than values calculated with α = 2.67. On average, analytical transfer lengths with α = 2 were
10.7% greater than experimental transfer lengths. In specimen Box-1, however, this percentage
was only 3.3%. It may be concluded, therefore, that the finite element analysis described in this
chapter could provide conservative estimates of transfer lengths in large-scale specimens.
Table 7.2: Analytical End-Slip and Transfer Length Values (in inches)
Specimen Average End-Slip Lt with α = 2 Lt with α = 2.67 Experimental Lt Box-1 0.0764 22.93 30.61 22.20 Box-2 0.0763 22.90 30.57 19.70
I-1 0.0776 23.25 31.04 20.70 I-2 0.0775 23.24 31.03 20.95

127
CHAPTER 8: CONCLUSIONS
The primary goal of this research was to experimentally assess the bond behavior of
prestressing strands in full-scale members cast with SCC adhering to IDOT specifications. First,
pullout tests were conducted to compare the performance of seven-wire steel strands embedded
in SCC to the performance of strands embedded in NCC. Then, transfer lengths of prestressing
strands were determined experimentally in two prestressed SCC hollow box girders and two
prestressed SCC I-girders. Finally, a series of flexural tests was used to determine the
development length of strands in the two box girders. Results from these tests were compared to
industry standards, code requirements, and theoretical predications to assess the acceptability of
the IDOT-approved SCC mixture in current design and implementation techniques.
A secondary goal of this research was to assess the viability of various analytical transfer
and development length prediction methods for specimens cast with SCC. Experimental data was
compared to transfer and development length expressions proposed in the literature, and a
method of finite element analysis was developed to predict transfer length in full-scale
specimens using pullout test data. The research presented in this thesis affords the following
observations:
1. Pullout test results at various ages showed strand performance in SCC to be comparable with
strand performance in NCC. Normalized pullout loads differed between the two concrete
types by as little as 1% after three days of curing.
2. Normalized first slip loads were lower in SCC than in NCC for all tests except those
conducted one day after casting. At 28 days, the average normalized first slip load in SCC
was 4% below that in NCC.
3. Normalized peak pullout loads were higher in SCC than in NCC for all tests except those
conducted seven days after casting. At 28 days, the average normalized peak pullout load in
SCC was 6% higher than that in NCC.
4. The strands and SCC mixture utilized in pullout tests were deemed acceptable for use in
large-scale prestressed specimens for transfer and development length testing.
5. Average pullout bond stress-slip relationships obtained using experimental pullout data
establish lower bounds for bond strength because they do not account for non-uniform stress
128
distribution along strands or radial expansion due to prestressing. A modification factor of
4.0 was derived in this study to correlate pullout bond stress-slip relationships to transfer
zone bond stress-slip relationships.
6. A systematic method was developed to predict transfer lengths in large-scale specimens
using pullout test data and finite element analysis. Analytical transfer lengths predicted using
the method and assuming constant bond stress distribution were on average 10.7% larger
than experimental values.
7. While the study utilized SCC adhering to IDOT standards, the analytical procedure relating
pullout stress-slip relationships to transfer stress-slip relationships may be useful in analysis
of any pretensioned specimen. In-depth research may be warranted to refine the stress-slip
modification factor and validate the FE analysis.
8. Experimental transfer lengths at seven of the eight girder ends were below ACI and
AASHTO code-required transfer lengths. Only at one end did experimental results
consistently and significantly exceed code provisions. This end had the lowest concrete
compressive strength of all locations and corresponded to the strand cutting location at
prestress transfer.
9. Transfer lengths showed no correlation to casting location.
10. No correlation was observed between transfer length and girder type.
11. Overall, experimental transfer lengths were 86% of 50db, 72% of 60db, and 69% of fpedb/3.
12. According to an analytical comparison study, experimental transfer lengths showed better
correlation to predictions incorporating initial prestress and concrete compressive strength
than to predictions incorporating effective prestress or no concrete strength. Expressions
from Marti-Vargas et al. (2007-b) and Zia and Mostafa (1977) provided the most accurate
transfer length predictions and may be utilized for SCC specimens.
13. On average, the as-built girders exceeded theoretical nominal shear capacities by 13%.
14. External CFRP shear reinforcement resulted in an approximate 11% increase in shear
capacity of the box girder.
15. In three of the test iterations, strand slip occurred after shear cracks had propagated across
the strands, effectively shortening the strand embedment length. On average, center strands
slipped 24% further into the girders than outer strands, likely due to higher strand
concentration and less concrete cover in the center of the box girder cross-section.

129
16. The box girder was able to develop at least 106% of the nominal moment capacity without
experiencing significant strand slip when an embedment length of 83.5 in. was utilized. At
iterations with shorter embedment lengths, failure was governed by shear which preceded
strand slip; as such, the full flexural capacity of the girder was not realized.
17. Based on interpolated data, the experimental development length was estimated as 75.6 in.
This experimental value is within 5% of the development lengths predicted using either the
ACI (2008) and AASHTO (2004) design codes or the analytical expression proposed in
literature by Zia and Mostafa (1977).
18. With satisfactory pullout behavior, adequate transfer and development lengths, and structural
performance comparable to that of specimens cast with conventional concrete, it is
reasonable to conclude that the SCC mixture in this study had sufficient bond to prestressing
strands and would perform adequately in prestressed applications.
130
REFERENCES AASHTO. (2004). AASHTO LRFD Bridge Design Specifications. Third Edition, American
Association of State Highway and Transportation Officials, Washington, D.C. ACI Committee 209. (2008). Prediction of Creep, Shrinkage, and Temperature Effects in
Concrete Structures (ACI 209R-92). American Concrete Institute, Farmington Hills, MI. ACI Committee 318. (2008). Building Code Requirements for Structural Concrete (ACI 318-08)
and Commentary. American Concrete Institute, Farmington Hills, MI. ACI Committee 343. (2004). Analysis and Design of Reinforced Concrete Bridge Structures
(ACI 343R-95). American Concrete Institute, Farmington Hills, MI. ACI Committee 440. (2008). Guide for the Design and Construction of Externally Bonded FRP
Systems for Strengthening Concrete Structures (ACI 440.2R-08). American Concrete Institute, Farmington Hills, MI.
Anderson, G., Rider, H., and Sozen, M. (1964). “Bond Characteristics of Prestressing Strands.”
Structural Research Series 283, University of Illinois at Urbana-Champaign, Urbana, IL. Andrawes, B., Shin, M., and Pozolo, A. (2009). “Transfer and Development Length of
Prestressing Tendons in Full-Scale AASHTO Prestressed Concrete Girders using Self-Consolidating Concrete.” Report No. ICT-09-038, Illinois Center for Transportation, Urbana, IL.
ANSYS Structural Analysis Guide. (2007). Release 11.0, ANSYS, Inc., Canonsburg, PA. ASTM C143 / C143M-10. (2010). “Standard Test Method for Slump of Hydraulic-Cement
Concrete.” ASTM International, West Conshohocken, PA. ASTM C1611 / C1611M-09b. (2009). “Standard Test Method for Slump Flow of Self-
Consolidating Concrete.” ASTM International, West Conshohocken, PA. ASTM C1621 / C1621M-09b. (2009). “Standard Test Method for Passing Ability of Self-
Consolidating Concrete by J-Ring.” ASTM International, West Conshohocken, PA. Balazs, G. (1992). “Transfer Control of Prestressing Strands.” PCI Journal, Vol. 37, No. 6, p. 60-71. Balazs, G. (1993). “Transfer Length of Prestressing Strand as a Function of Draw-In and Initial
Prestress.” PCI Journal, Vol. 38, No. 2, p. 86-93.

131
Bonen, D. and Shah, S. (2004). “The Effects of Formulation on the Properties of Self-Consolidating Concrete.” Concrete Science and Engineering: A Tribute to Arnon Bentur, Proceedings of the International RILEM Symposium, RILEM Publications, France,
p. 43-56. Bruggeling, A. and Huyghe, G. (1991). Prefabrication with Concrete. A.A. Balkema, Rotterdam,
Netherlands. Buckner, C. (1995). “A Review of Strand Development Length for Pretensioned Concrete
Members.” PCI Journal, Vol. 40, No. 2, p. 84-105. Burgueno, R. and Haq, M. (2007). “Effect of SCC Mixture Proportioning on Transfer and
Development Length of Prestressing Strand.” ACI, SP-247-9, p. 105-116. Chan, Y., Chen, Y., and Liu, Y. (2003). “Development of Bond Strength of Reinforcement Steel
in Self-Consolidating Concrete.” ACI Structural Journal, Vol. 100, No. 4. Cousins, T., Johnston, D., and Zia, P. (1986). “Bond of Epoxy Coated Prestressing Strand.”
Report No. FHWA-NC-87-05, Center for Transportation Engineering Studies, North Carolina State University, Raleigh, NC.
Cousins, T., Johnston, D., and Zia, P. (1990). “Transfer and Development Length of Epoxy-
Coated and Uncoated Prestressing Strand.” PCI Journal, Vol. 35, No. 4, p. 92-103. Cousins, T., Badeaux, M. and Moustafa, S. (1992). “Proposed Test for Determining Bond
Characteristics of Prestressing Strands.” PCI Journal, Vol. 33, No. 1, p. 66-73. Darwin, D. et al. (1996). “Development Length Criteria for Conventional and High Relative Rib
Area Reinforcing Bars.” ACI Structural Journal, Vol. 98, No. 5. Deatherage, J., Burdette, E., and Chew, C. (1994). “Development Length and Lateral Spacing
Requirements of Prestressing Strand for Prestressed Concrete Bridge Girders.” PCI Journal, Vol. 39, No. 1, p. 70-83. Esfahani, M., Lachemi, M., and Kianoush, M. (2008). “Top-Bar Effect of Steel Bars in Self-
Consolidating Concrete (SCC).” Cement and Concrete Composites, Vol. 30, Issue 1. Feldman, L. and Bartlett, F. (2007). “Bond Stresses Along Plain Steel Reinforcing Bars in
Pullout Specimens.” ACI Structural Journal, Vol. 104, No. 6. Girgis, A. and Tuan, C. (2005). “Bond Strength and Transfer Length of Pretensioned Bridge
Girders Cast with Self-Consolidating Concrete.” PCI Journal, Vol. 50, No. 6, p. 72-87. Hanson, N. and Kaar, P. (1959). “Flexural Bond Tests of Pretensioned Prestressed Beams.” ACI Journal, Proceedings, Vol. 55, No. 7, p. 783-803.
132
Haq, M. (2005). “Effect of Self Consolidating Concrete (SCC) Mix Proportioning on Transfer and Development Length of Prestressing Strands.” MS Thesis, Michigan State University, East Lansing, MI.
IDOT. (2007). “Self-Consolidating Concrete for Precast Products (BDE).” Bureau of Materials
and Physical Research, Illinois Department of Transportation, Springfield, IL. Kachlakev, D. and McCurry, D. (2000). “Testing of Full-Size Reinforced Concrete Beams
Strengthened with FRP Composites: Experimental Results and Design Methods Verification.” Report No. FHWA-OR-00-19, U.S. Department of Transportation Federal Highway Administration.
Labonte, T. and Hamilton, H. (2005). “Self-Consolidating Concrete (SCC) Structural
Investigation.” Report No. BD545 RPWO #21, Florida Department of Transportation, Gainesville, FL.
Lange, D. et al. (2008). “Performance and Acceptance of Self-Consolidating Concrete: Final
Report.” Report No. FHWA-ICT-08-020, Illinois Center for Transportation, Urbana, IL. Larson, K., Peterman, R., and Esmaeily, A. (2007). “Evaluating the Time-Dependent
Deformations and Bond Characteristics of a Self-Consolidating Concrete Mix and the Implication for Pretensioned Bridge Applications.” Final Report No. FHWA-KS-07-1, Kansas Department of Transportation, Topeka, KS.
Logan, D. (1997). “Acceptance Criteria for Bond Quality of Strand for Pretensioned Prestressed
Concrete Applications.” PCI Journal, Vol. 42, No. 2, p. 52-90. MacGregor, J. and Wight, J. (2005). Reinforced Concrete: Mechanics and Design. 4th Edition,
Prentice Hall, Upper Saddle River, NJ. Mahmoud, Z., Rizkalla, S. and Zaghloul, E. (1999). “Transfer and Development Lengths of
Carbon Fiber Reinforcement Polymers Prestressed Reinforcement.” ACI Structural Journal, Vol. 96, No. 4, p. 594-602.
Marti-Vargas, J., Arbelaez, C., Serna-Ros, P., and Castro-Bugallo, C. (2007-a). “Reliability of
Transfer Length Estimation from Strand End Slip.” ACI Structural Journal, Vol. 104, No. 4, p. 487-494.
Marti-Vargas, J. et al. (2007-b). “Analytical Model for Transfer Length Prediction of 13 mm
Prestressing Strand.” Structural Engineering and Mechanics, Vol. 26, No. 2, p. 211-229. Mitchell, D. and Marzouk, H. (2007). “Bond Characteristics of High-Strength Lightweight
Concrete.” ACI Structural Journal, Vol. 104, No. 1. Mitchell, D. et al. (1993). “Influence of High Strength Concrete on Transfer and Development
Length of Pretensioning Strand.” PCI Journal, Vol. 38, No. 3, p. 52-66.
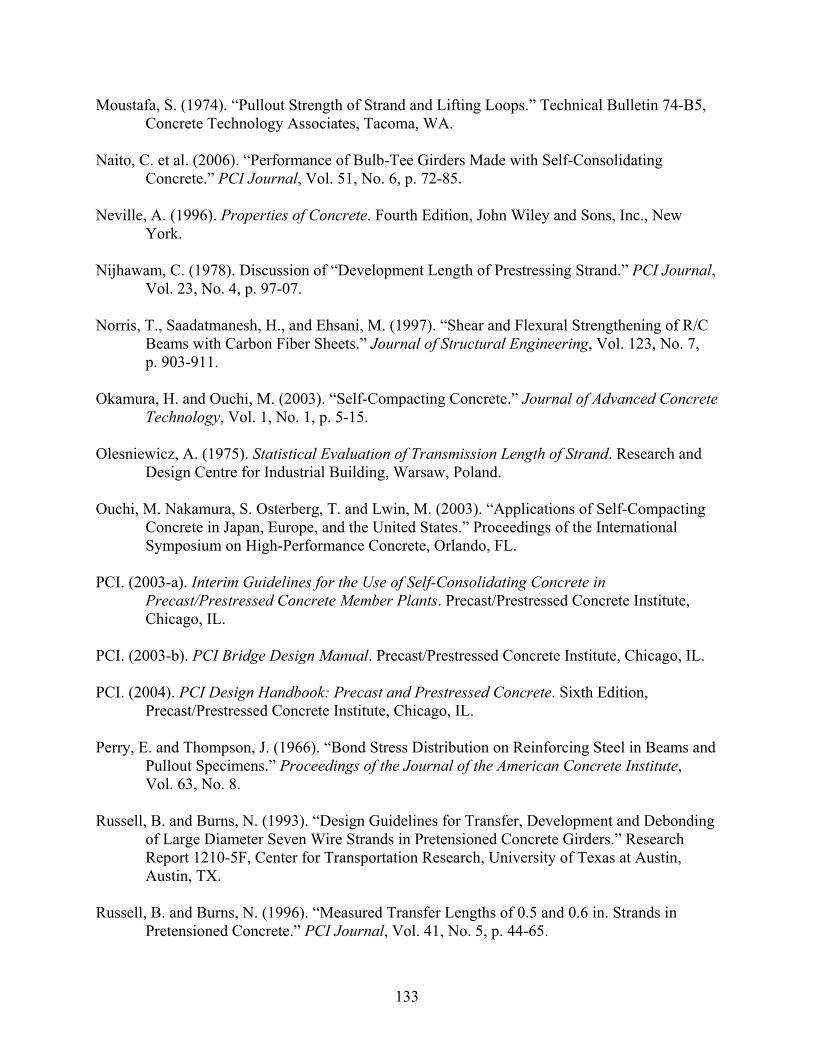
133
Moustafa, S. (1974). “Pullout Strength of Strand and Lifting Loops.” Technical Bulletin 74-B5, Concrete Technology Associates, Tacoma, WA.
Naito, C. et al. (2006). “Performance of Bulb-Tee Girders Made with Self-Consolidating
Concrete.” PCI Journal, Vol. 51, No. 6, p. 72-85. Neville, A. (1996). Properties of Concrete. Fourth Edition, John Wiley and Sons, Inc., New
York. Nijhawam, C. (1978). Discussion of “Development Length of Prestressing Strand.” PCI Journal,
Vol. 23, No. 4, p. 97-07. Norris, T., Saadatmanesh, H., and Ehsani, M. (1997). “Shear and Flexural Strengthening of R/C
Beams with Carbon Fiber Sheets.” Journal of Structural Engineering, Vol. 123, No. 7, p. 903-911. Okamura, H. and Ouchi, M. (2003). “Self-Compacting Concrete.” Journal of Advanced Concrete
Technology, Vol. 1, No. 1, p. 5-15. Olesniewicz, A. (1975). Statistical Evaluation of Transmission Length of Strand. Research and
Design Centre for Industrial Building, Warsaw, Poland. Ouchi, M. Nakamura, S. Osterberg, T. and Lwin, M. (2003). “Applications of Self-Compacting
Concrete in Japan, Europe, and the United States.” Proceedings of the International Symposium on High-Performance Concrete, Orlando, FL.
PCI. (2003-a). Interim Guidelines for the Use of Self-Consolidating Concrete in
Precast/Prestressed Concrete Member Plants. Precast/Prestressed Concrete Institute, Chicago, IL.
PCI. (2003-b). PCI Bridge Design Manual. Precast/Prestressed Concrete Institute, Chicago, IL. PCI. (2004). PCI Design Handbook: Precast and Prestressed Concrete. Sixth Edition,
Precast/Prestressed Concrete Institute, Chicago, IL. Perry, E. and Thompson, J. (1966). “Bond Stress Distribution on Reinforcing Steel in Beams and
Pullout Specimens.” Proceedings of the Journal of the American Concrete Institute, Vol. 63, No. 8. Russell, B. and Burns, N. (1993). “Design Guidelines for Transfer, Development and Debonding
of Large Diameter Seven Wire Strands in Pretensioned Concrete Girders.” Research Report 1210-5F, Center for Transportation Research, University of Texas at Austin, Austin, TX.
Russell, B. and Burns, N. (1996). “Measured Transfer Lengths of 0.5 and 0.6 in. Strands in
Pretensioned Concrete.” PCI Journal, Vol. 41, No. 5, p. 44-65.
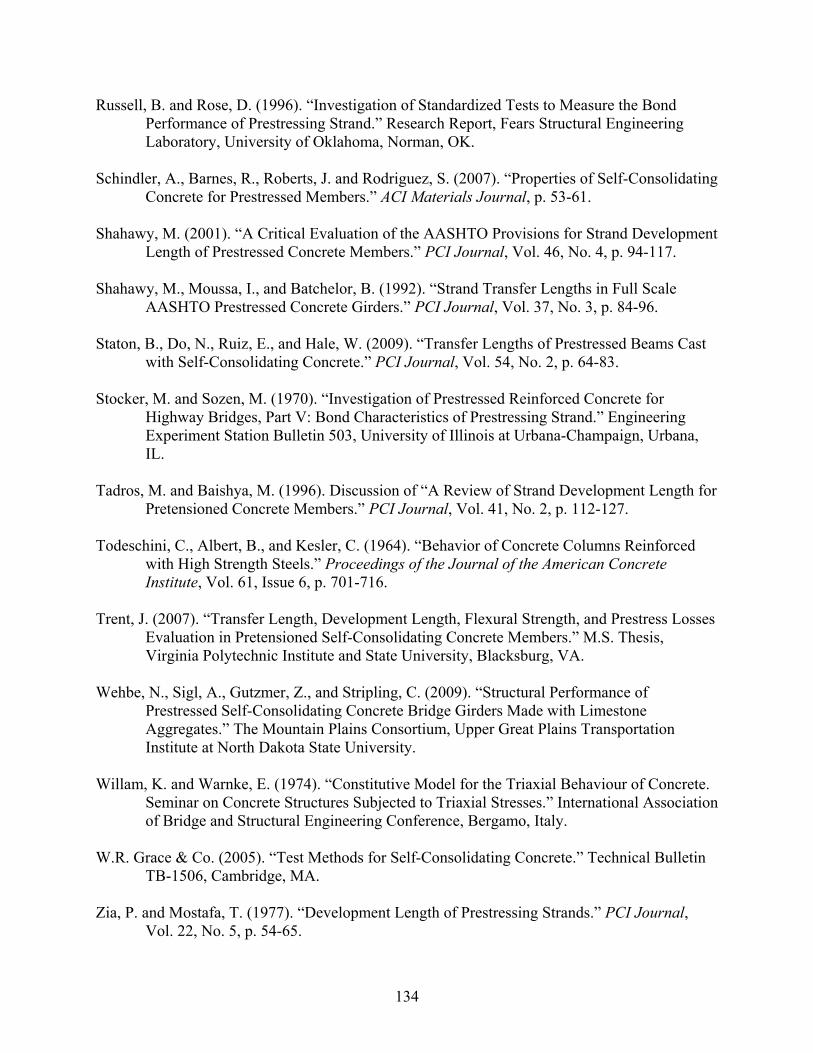
134
Russell, B. and Rose, D. (1996). “Investigation of Standardized Tests to Measure the Bond Performance of Prestressing Strand.” Research Report, Fears Structural Engineering Laboratory, University of Oklahoma, Norman, OK.
Schindler, A., Barnes, R., Roberts, J. and Rodriguez, S. (2007). “Properties of Self-Consolidating
Concrete for Prestressed Members.” ACI Materials Journal, p. 53-61. Shahawy, M. (2001). “A Critical Evaluation of the AASHTO Provisions for Strand Development
Length of Prestressed Concrete Members.” PCI Journal, Vol. 46, No. 4, p. 94-117. Shahawy, M., Moussa, I., and Batchelor, B. (1992). “Strand Transfer Lengths in Full Scale
AASHTO Prestressed Concrete Girders.” PCI Journal, Vol. 37, No. 3, p. 84-96. Staton, B., Do, N., Ruiz, E., and Hale, W. (2009). “Transfer Lengths of Prestressed Beams Cast
with Self-Consolidating Concrete.” PCI Journal, Vol. 54, No. 2, p. 64-83. Stocker, M. and Sozen, M. (1970). “Investigation of Prestressed Reinforced Concrete for
Highway Bridges, Part V: Bond Characteristics of Prestressing Strand.” Engineering Experiment Station Bulletin 503, University of Illinois at Urbana-Champaign, Urbana, IL.
Tadros, M. and Baishya, M. (1996). Discussion of “A Review of Strand Development Length for
Pretensioned Concrete Members.” PCI Journal, Vol. 41, No. 2, p. 112-127. Todeschini, C., Albert, B., and Kesler, C. (1964). “Behavior of Concrete Columns Reinforced
with High Strength Steels.” Proceedings of the Journal of the American Concrete Institute, Vol. 61, Issue 6, p. 701-716.
Trent, J. (2007). “Transfer Length, Development Length, Flexural Strength, and Prestress Losses
Evaluation in Pretensioned Self-Consolidating Concrete Members.” M.S. Thesis, Virginia Polytechnic Institute and State University, Blacksburg, VA.
Wehbe, N., Sigl, A., Gutzmer, Z., and Stripling, C. (2009). “Structural Performance of
Prestressed Self-Consolidating Concrete Bridge Girders Made with Limestone Aggregates.” The Mountain Plains Consortium, Upper Great Plains Transportation Institute at North Dakota State University.
Willam, K. and Warnke, E. (1974). “Constitutive Model for the Triaxial Behaviour of Concrete.
Seminar on Concrete Structures Subjected to Triaxial Stresses.” International Association of Bridge and Structural Engineering Conference, Bergamo, Italy.
W.R. Grace & Co. (2005). “Test Methods for Self-Consolidating Concrete.” Technical Bulletin
TB-1506, Cambridge, MA. Zia, P. and Mostafa, T. (1977). “Development Length of Prestressing Strands.” PCI Journal,
Vol. 22, No. 5, p. 54-65.

135
Zia, P., Nunez, R., and Mata, L. (2005). “Implementation of Self-Consolidating Concrete for Prestressed Concrete Girders.” FHWA-NC-2006-30 Final Report, North Carolina Department of Transportation, Raleigh, NC.
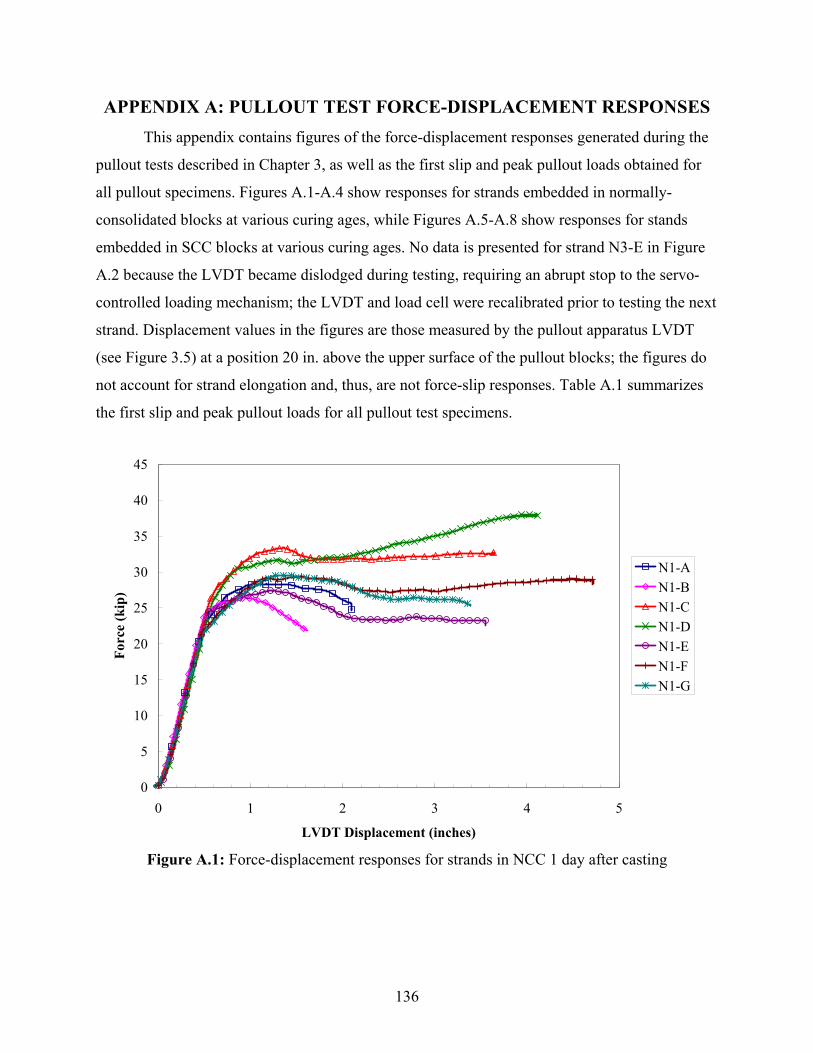
136
APPENDIX A: PULLOUT TEST FORCE-DISPLACEMENT RESPONSES This appendix contains figures of the force-displacement responses generated during the
pullout tests described in Chapter 3, as well as the first slip and peak pullout loads obtained for
all pullout specimens. Figures A.1-A.4 show responses for strands embedded in normally-
consolidated blocks at various curing ages, while Figures A.5-A.8 show responses for stands
embedded in SCC blocks at various curing ages. No data is presented for strand N3-E in Figure
A.2 because the LVDT became dislodged during testing, requiring an abrupt stop to the servo-
controlled loading mechanism; the LVDT and load cell were recalibrated prior to testing the next
strand. Displacement values in the figures are those measured by the pullout apparatus LVDT
(see Figure 3.5) at a position 20 in. above the upper surface of the pullout blocks; the figures do
not account for strand elongation and, thus, are not force-slip responses. Table A.1 summarizes
the first slip and peak pullout loads for all pullout test specimens.
0
5
10
15
20
25
30
35
40
45
0 1 2 3 4 5
LVDT Displacement (inches)
Forc
e (k
ip)
N1-AN1-BN1-CN1-DN1-EN1-FN1-G
Figure A.1: Force-displacement responses for strands in NCC 1 day after casting
137
0
5
10
15
20
25
30
35
40
45
0 1 2 3 4
LVDT Displacement (inches)
Forc
e (k
ip)
N3-AN3-BN3-CN3-DN3-FN3-G
Figure A.2: Force-displacement responses for strands in NCC 3 days after casting
0
5
10
15
20
25
30
35
40
45
0 1 2 3 4
LVDT Displacement (inches)
Forc
e (k
ip)
N7-AN7-BN7-CN7-DN7-EN7-FN7-G
Figure A.3: Force-displacement responses for strands in NCC 7 days after casting
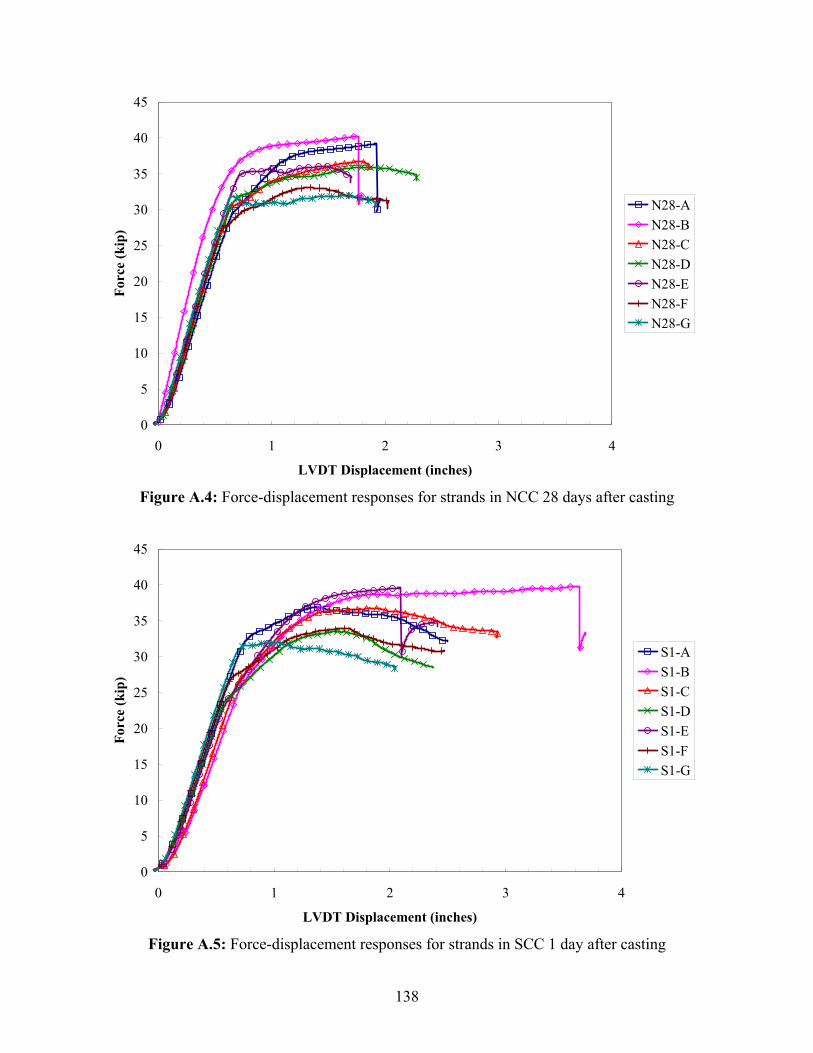
138
0
5
10
15
20
25
30
35
40
45
0 1 2 3 4
LVDT Displacement (inches)
Forc
e (k
ip)
N28-AN28-BN28-CN28-DN28-EN28-FN28-G
Figure A.4: Force-displacement responses for strands in NCC 28 days after casting
0
5
10
15
20
25
30
35
40
45
0 1 2 3 4
LVDT Displacement (inches)
Forc
e (k
ip)
S1-AS1-BS1-CS1-DS1-ES1-FS1-G
Figure A.5: Force-displacement responses for strands in SCC 1 day after casting
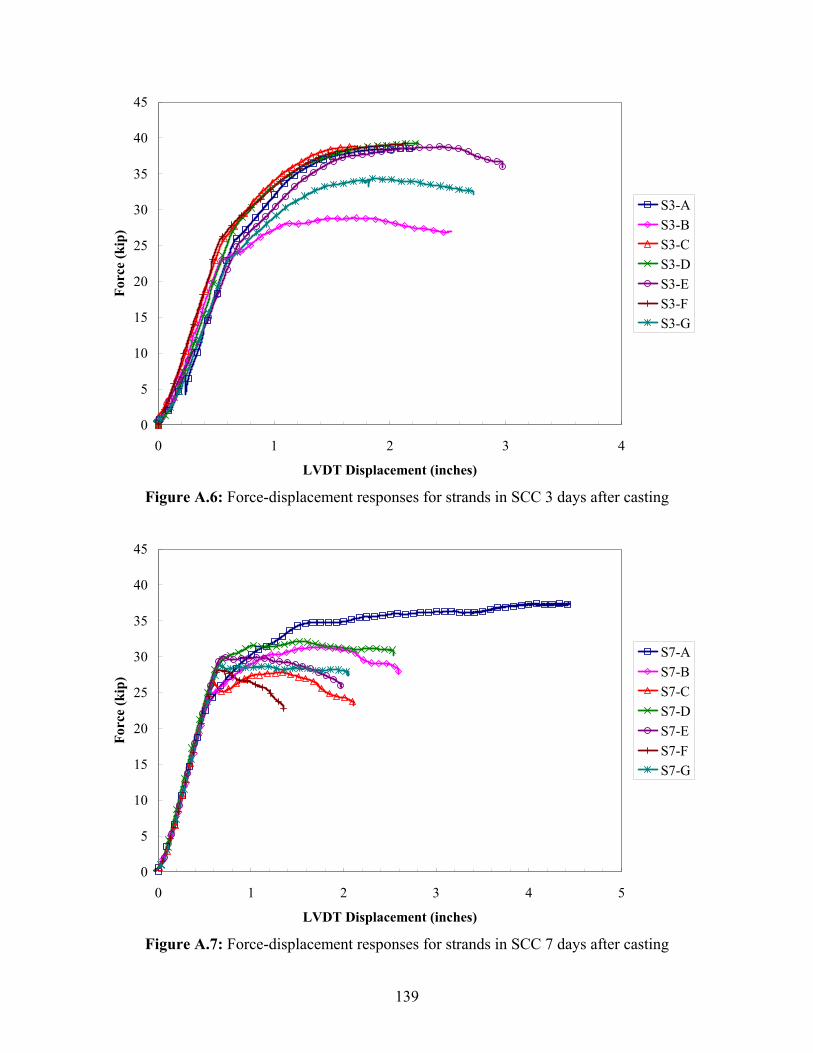
139
0
5
10
15
20
25
30
35
40
45
0 1 2 3 4
LVDT Displacement (inches)
Forc
e (k
ip)
S3-AS3-BS3-CS3-DS3-ES3-FS3-G
Figure A.6: Force-displacement responses for strands in SCC 3 days after casting
0
5
10
15
20
25
30
35
40
45
0 1 2 3 4 5
LVDT Displacement (inches)
Forc
e (k
ip)
S7-AS7-BS7-CS7-DS7-ES7-FS7-G
Figure A.7: Force-displacement responses for strands in SCC 7 days after casting
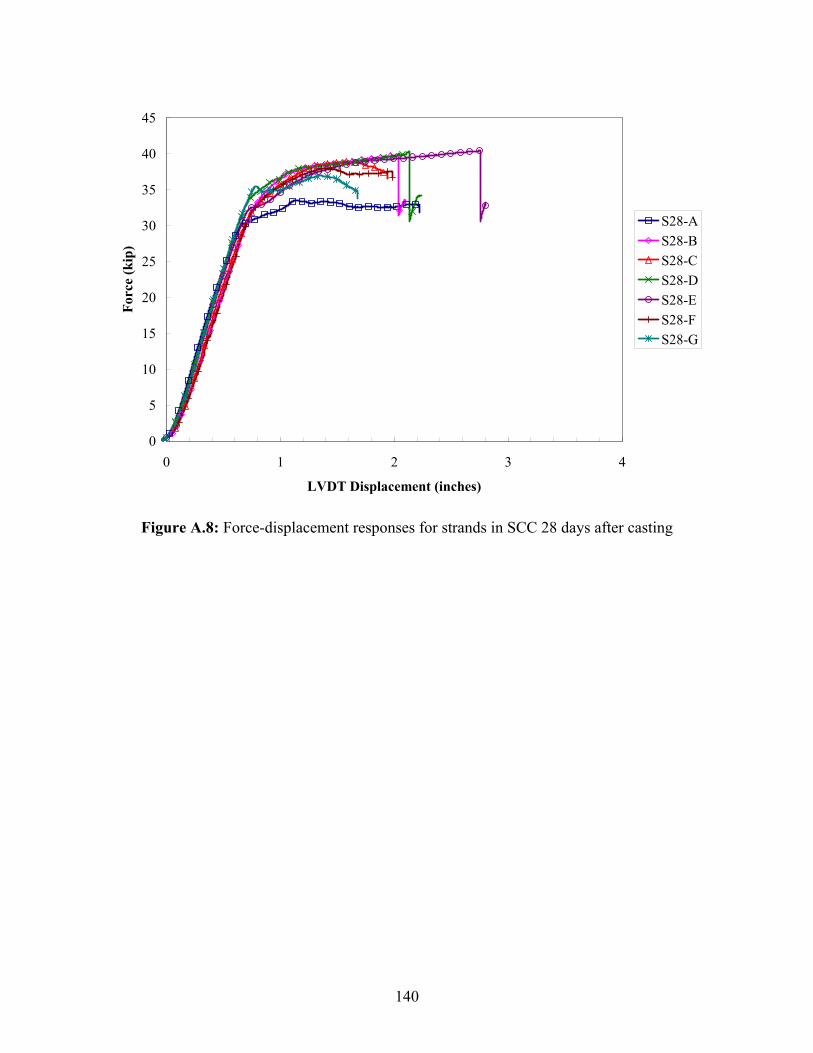
140
0
5
10
15
20
25
30
35
40
45
0 1 2 3 4
LVDT Displacement (inches)
Forc
e (k
ip)
S28-AS28-BS28-CS28-DS28-ES28-FS28-G
Figure A.8: Force-displacement responses for strands in SCC 28 days after casting

141
Table A.1: First Slip and Peak Pullout Loads for all Pullout Tests
First Slip Loads (kip) Peak Pullout Loads (kip) NCC 1 Day 3 Day 7 Day 28 Day 1 Day 3 Day 7 Day 28 Day
A 22.8 24.5 26.6 24.0 28.4 27.9 33.9 39.2 B 24.3 23.1 26.1 27.0 26.5 31.7 37.6 40.3 C 25.8 24.5 26.5 23.0 33.4 32.3 32.0 36.7 D 25.4 28.5 21.7 27.5 38.1 36.8 31.2 35.9 E 23.2 - 26.4 27.0 27.4 - 32.6 36.1 F 21.8 25.0 24.9 28.0 29.4 34.2 32.7 33.2 G 21.1 25.1 25.5 27.5 29.6 33.8 32.1 32.0
Average 23.5 25.1 25.4 26.3 30.4 32.8 33.2 36.2 Std. Dev. 1.8 1.8 1.7 2.0 4.1 3.0 2.1 3.0
First Slip Loads (kip) Peak Pullout Loads (kip)
SCC 1 Day 3 Day 7 Day 28 Day 1 Day 3 Day 7 Day 28 DayA 28.5 25.7 23.4 23.5 36.9 38.5 37.5 33.5 B 23.5 23.1 24.9 25.5 39.8 29.5 31.3 39.8 C 24.1 25.5 25.9 26.0 36.8 38.9 27.8 38.9 D 23.1 25.6 26.1 23.0 33.6 39.3 32.2 40.3 E 21.9 25.6 26.9 24.0 39.6 38.8 30.1 40.4 F 22.3 25.4 23.2 28.0 34.0 39.4 28.2 38.0 G 23.3 23.5 26.4 27.0 32.0 34.3 28.8 36.9
Average 23.8 24.9 25.3 25.3 36.1 36.9 30.8 38.3 Std. Dev. 2.2 1.1 1.5 1.9 3.0 3.7 3.4 2.5
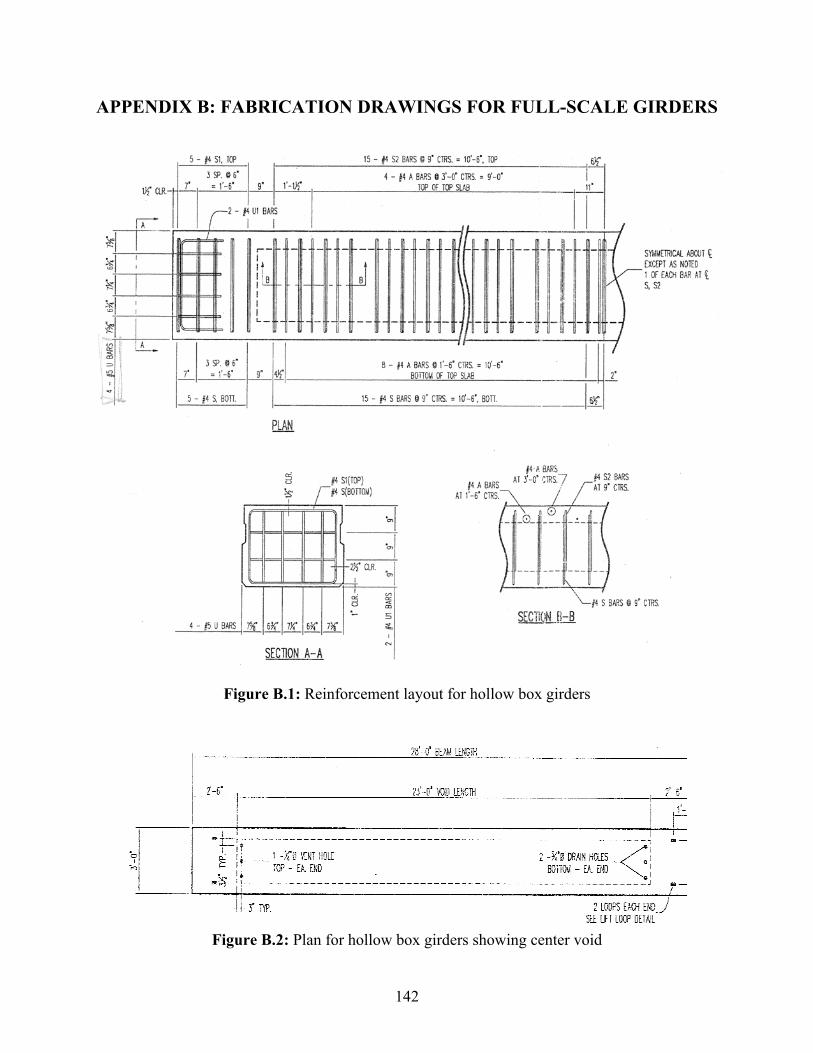
142
APPENDIX B: FABRICATION DRAWINGS FOR FULL-SCALE GIRDERS
Figure B.1: Reinforcement layout for hollow box girders
Figure B.2: Plan for hollow box girders showing center void
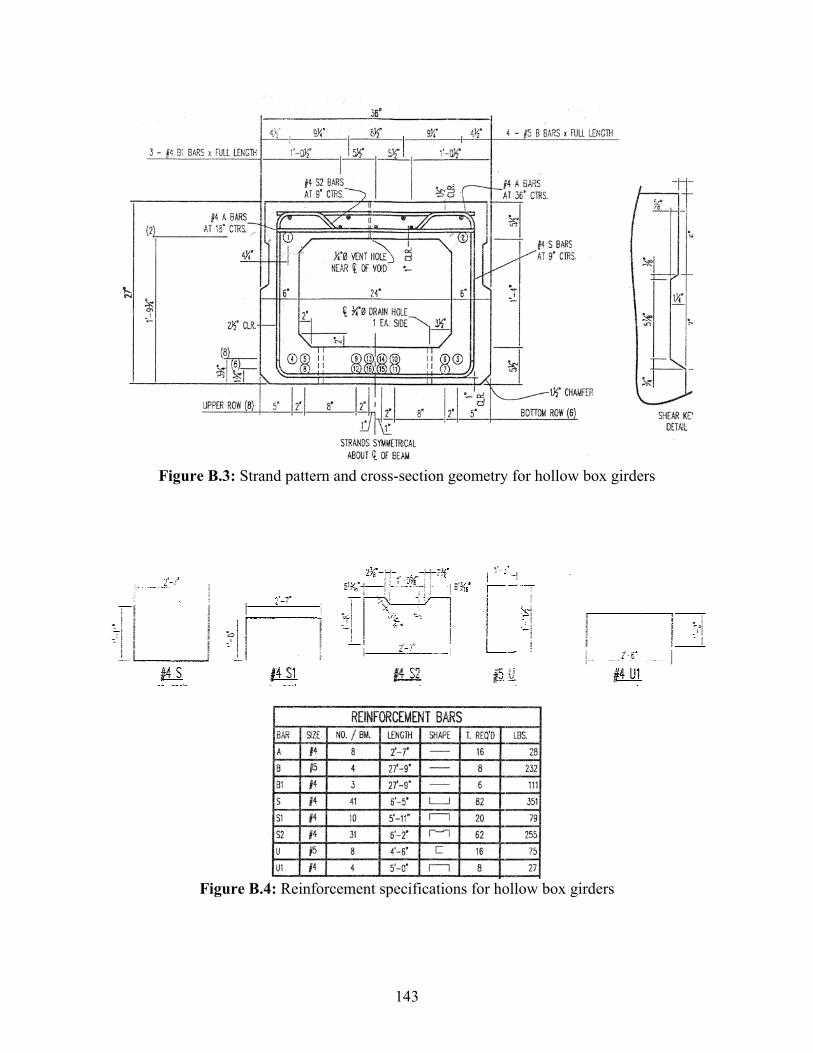
143
Figure B.3: Strand pattern and cross-section geometry for hollow box girders
Figure B.4: Reinforcement specifications for hollow box girders
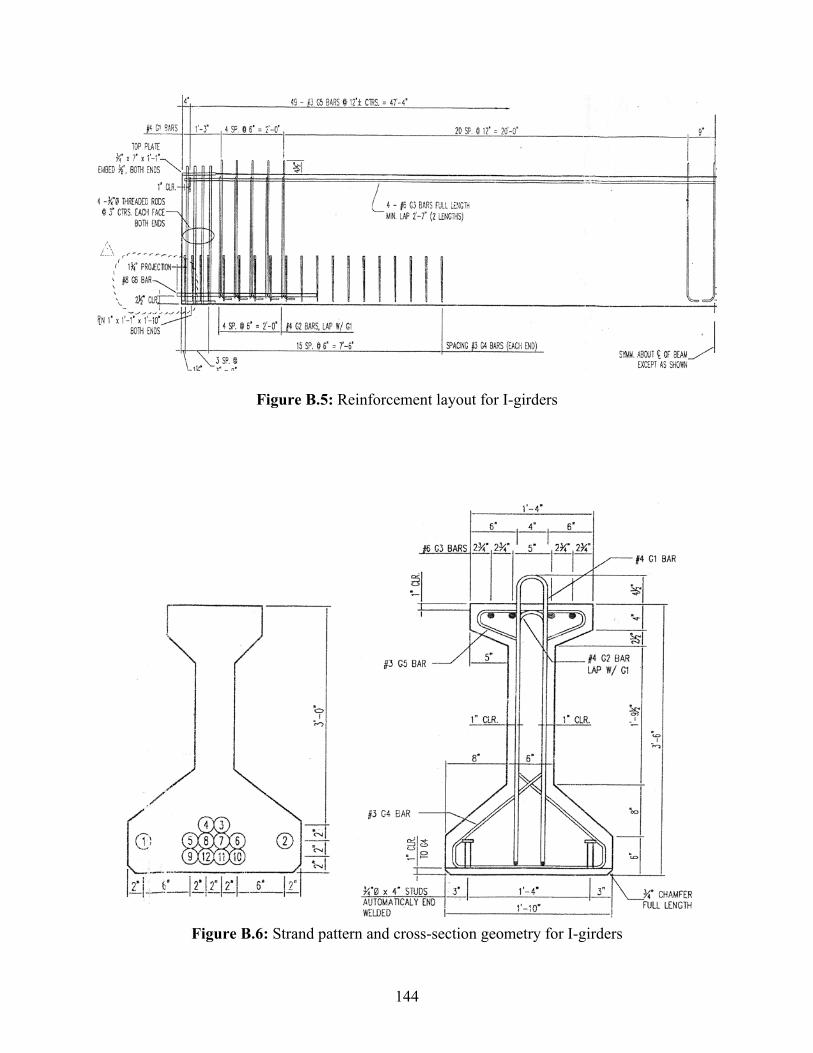
144
Figure B.5: Reinforcement layout for I-girders
Figure B.6: Strand pattern and cross-section geometry for I-girders
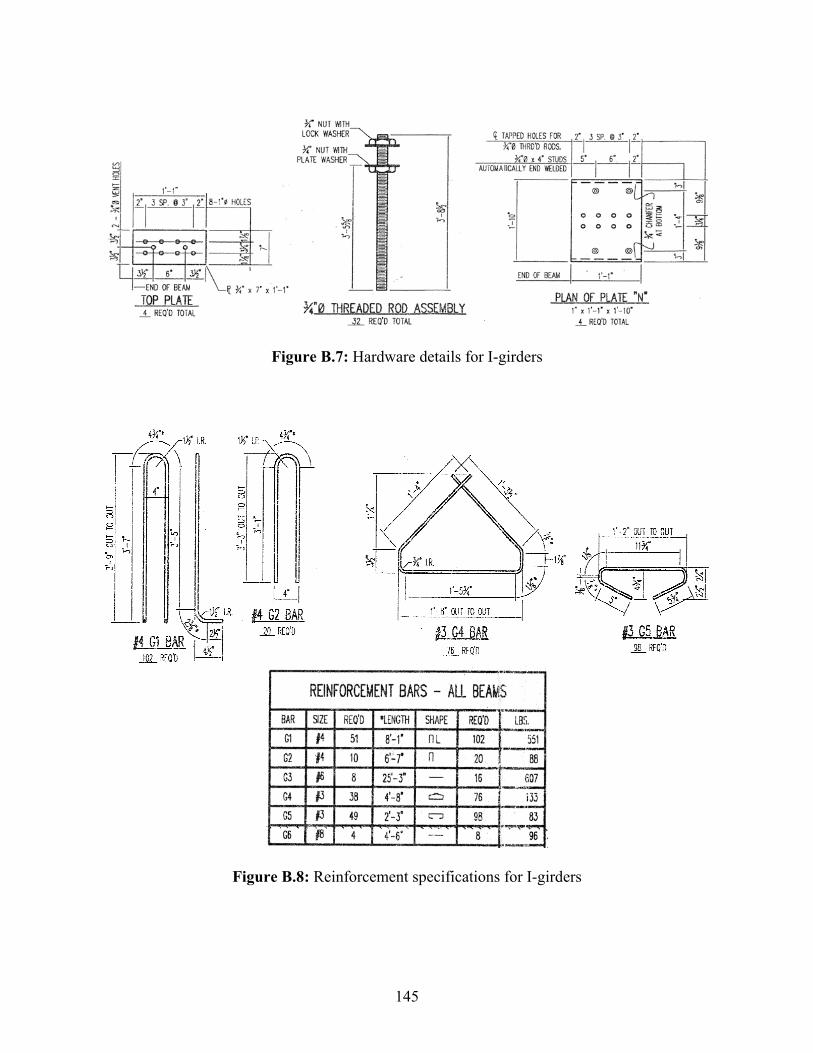
145
Figure B.7: Hardware details for I-girders
Figure B.8: Reinforcement specifications for I-girders

146
APPENDIX C: EXAMPLE CALCULATIONS OF PRESTRESS LOSSES
Example C.1 – Box Girder 1 – Prestress Losses – AASHTO Separate Lump Sum Method Steel Relaxation before Transfer:
1 1log(24.0 ) log(24.0) 2020.55 0.55 202 2
40.0 40.0 243pJ
pR pJpy
ftf f ksif=
⎛ ⎞ ⎛ ⎞Δ = − = − =⎜ ⎟ ⎜ ⎟⎜ ⎟ ⎝ ⎠⎝ ⎠
Elastic Shortening: 18300 / 28000 0.65w klf= =
2 20.65(12)(28 ) 769
8 8swwLM kip ft= = = ⋅
2
2191.2(2.448) 191.2(2.448)(8.04) 769(8.04) 1.31568.8 49684 49684
pi ps pi ps swcgp
c
f A f A e M efA I I
ksi
⎛ ⎞= + −⎜ ⎟⎜ ⎟⎝ ⎠⎛ ⎞
= + − =⎜ ⎟⎝ ⎠
28700 (1.31) 8.857 5660
pspES cgp
ci
Ef f ksi
EΔ = = =
Check 1 202 2 8.8 191.2pi pJ pR pESf f f f ksi= − − = − − = Shrinkage: 17.0 0.15 17.0 0.15(75) 5.8pSf H ksiΔ = − = − = Creep: 12.0 7.0 12.0(1.31) 0 15.7pC cgp cdpf f f ksiΔ = − Δ = − = Steel Relaxation after Transfer: [ ]2 0.30 20.0 0.4(8.8) 0.2(5.8 15.7) 3.66pRf ksiΔ = − − + = Total Losses: 8.8 5.8 15.7 3.66 2 35.8pT pES pSR pCR pRf f f f f ksiΔ = Δ + Δ + Δ + Δ = + + + + = Effective Prestress: 202 35.8 166.1pe pJ pTf f f ksi= −Δ = − =
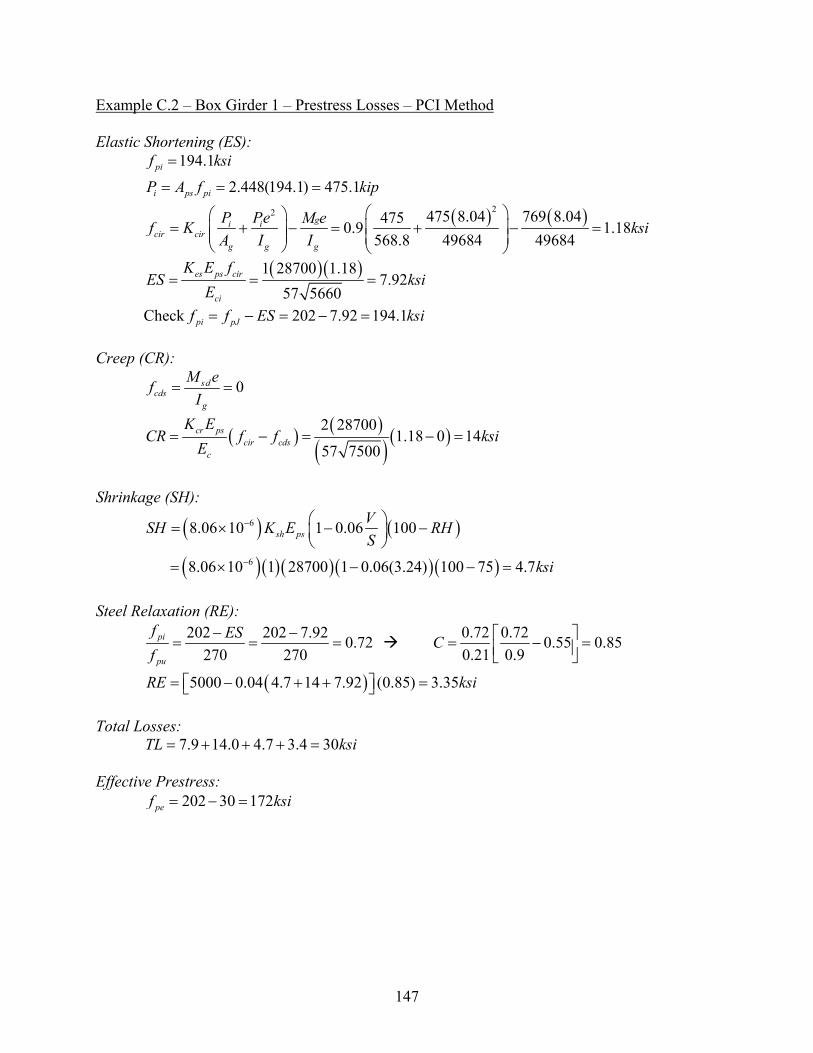
147
Example C.2 – Box Girder 1 – Prestress Losses – PCI Method Elastic Shortening (ES):
194.1
2.448(194.1) 475.1pi
i ps pi
f ksi
P A f kip
=
= = =
( ) ( )22 475 8.04 769 8.044750.9 1.18568.8 49684 49684
gi icir cir
g g g
P Pe M ef K ksiA I I
⎛ ⎞⎛ ⎞= + − = + − =⎜ ⎟⎜ ⎟⎜ ⎟ ⎜ ⎟⎝ ⎠ ⎝ ⎠
( )( )1 28700 1.187.92
57 5660es ps cir
ci
K E fES ksi
E= = =
Check 202 7.92 194.1pi pJf f ES ksi= − = − = Creep (CR):
0sdcds
g
M efI
= =
( ) ( )( ) ( )2 28700
1.18 0 1457 7500
cr pscir cds
c
K ECR f f ksi
E= − = − =
Shrinkage (SH):
( ) ( )
( )( )( )( )( )
6
6
8.06 10 1 0.06 100
8.06 10 1 28700 1 0.06(3.24) 100 75 4.7
sh psVSH K E RHS
ksi
−
−
⎛ ⎞= × − −⎜ ⎟⎝ ⎠
= × − − =
Steel Relaxation (RE):
202 202 7.92 0.72270 270
pi
pu
f ESf
− −= = = 0.72 0.72 0.55 0.85
0.21 0.9C ⎡ ⎤= − =⎢ ⎥⎣ ⎦
( )5000 0.04 4.7 14 7.92 (0.85) 3.35RE ksi= − + + =⎡ ⎤⎣ ⎦ Total Losses: 7.9 14.0 4.7 3.4 30TL ksi= + + + = Effective Prestress: 202 30 172pef ksi= − =

148
Example C.3 – Box Girder 1 – Prestress Losses – ACI Committee 209 Method Steel Relaxation before Transfer:
191.9
2.448(191.9) 469.7pi
i ps pi
f ksi
P A f kip
=
= = =
( ) ( ) ( )0.005 log( ) 0.005 191.9 log(1) 1.32sr pitf f t ksi= = =
Elastic Shortening:
28700 6.69357 5660
ps
ci
En
E= = =
( ) ( )22 470 8.04 769 8.04470 1.31568.8 49684 49684
gi ic
g g g
P Pe M ef ksiA I I
⎛ ⎞⎛ ⎞= + − = + − =⎜ ⎟⎜ ⎟⎜ ⎟ ⎜ ⎟⎝ ⎠ ⎝ ⎠
( ) 6.693(1.31) 8.79cnf ksi= = Check: 1 202 8.79 1.32 191.9pi pJf f ES R ksi= − − = − − = Creep:
( )( )0.54 0.54(3.24)2 21 1.13 1 1.13 0.7983 3
VS
vs e eγ⎛ ⎞−⎜ ⎟ −⎝ ⎠
⎛ ⎞= + = + =⎜ ⎟⎜ ⎟
⎝ ⎠
( ) ( )0.118 0.1181.25 1.25 7 0.994la latγ − −= = = 1.27 0.0067 1.27 0.0067(75) 0.768λγ λ= − = − = 0.994(0.768)(0.978) 0.608c la vsλγ γ γ γ= = = 2.35 2.35(0.608) 1.43u cv γ= = =
0.60 0.60
28 0.60 0.60
28 (1.43) 0.60710 10 28t u
tv vt= = = =
+ +
( ) ( )( ) 0.101 8.79 0.607 1 5.072 2
tc t
o
Fnf v ksiF
⎛ ⎞ ⎛ ⎞− = − =⎜ ⎟ ⎜ ⎟⎝ ⎠⎝ ⎠
Shrinkage:
( )0.12 0.12(3.24)1.2 1.2 0.81VS
vs e eγ⎛ ⎞−⎜ ⎟ −⎝ ⎠= = =
( )1.40 0.010 1.40 0.010 75 0.65λγ λ= − = − = 1.2cpγ = 0.65(0.81)(1.2) 0.63sh vs cpλγ γ γ γ= = =
( ) 6 6780 10 780(0.63) 10 0.000495sh shuε γ − −= × = × =
( ) ( ) ( )28
28 0.000495 0.0002235 35 28sh sht u
tt
ε ε=
= = =+ +

149
( ) ( )
2 28.041 1 1.7449684
568.8s
eI
Aξ = + = + =
( ) ( )( )0.00022 28700
6.61 1 6.69(0.0043)(1.74)
sh st
s
Eksi
nε
ρξ= =
+ +
Steel Relaxation after Transfer: ( ) ( ) ( ) ( )28
0.005 log( ) 0.005 log(1) 0.005 191.9 log(28) 1.32 1.39sr si sitf f t f ksi
== − = − =
Total Losses:
( ) ( ) ( ) ( )1 8.8 5.1 6.6 1.32 1.39 23.212 1
sh st tt c c t sr t
o s
EFnf nf v f ksiF n
ελ
ρξ⎛ ⎞
= + − + + = + + + + =⎜ ⎟ +⎝ ⎠
Effective Prestress: 202 23.2 178.8pef ksi= − =
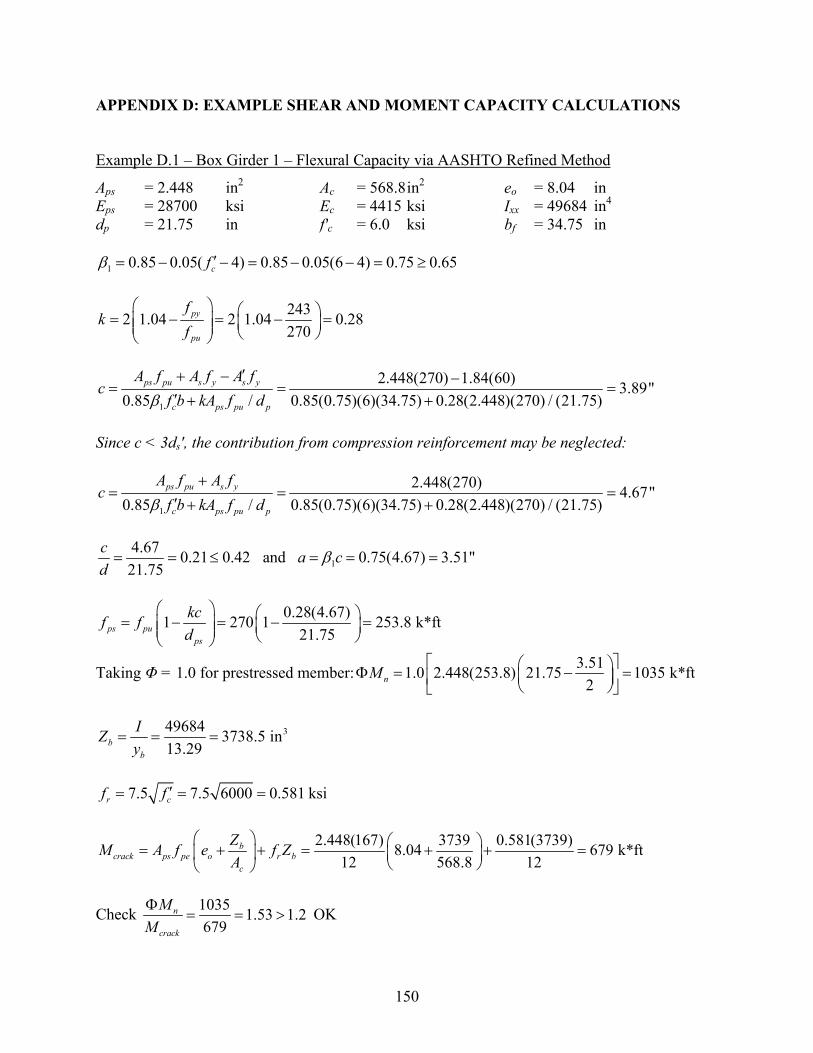
150
APPENDIX D: EXAMPLE SHEAR AND MOMENT CAPACITY CALCULATIONS
Example D.1 – Box Girder 1 – Flexural Capacity via AASHTO Refined Method
Aps = 2.448 in2 Ac = 568.8in2 eo = 8.04 in Eps = 28700 ksi Ec = 4415 ksi Ixx = 49684 in4
dp = 21.75 in f'c = 6.0 ksi bf = 34.75 in
1 0.85 0.05( 4) 0.85 0.05(6 4) 0.75 0.65cfβ ′= − − = − − = ≥
2432 1.04 2 1.04 0.28270
py
pu
fk
f⎛ ⎞ ⎛ ⎞= − = − =⎜ ⎟ ⎜ ⎟⎜ ⎟ ⎝ ⎠⎝ ⎠
1
2.448(270) 1.84(60) 3.89"0.85 / 0.85(0.75)(6)(34.75) 0.28(2.448)(270) / (21.75)
ps pu s y s y
c ps pu p
A f A f A fc
f b kA f dβ′+ − −
= = =′ + +
Since c < 3ds′, the contribution from compression reinforcement may be neglected:
1
2.448(270) 4.67"0.85 / 0.85(0.75)(6)(34.75) 0.28(2.448)(270) / (21.75)
ps pu s y
c ps pu p
A f A fc
f b kA f dβ+
= = =′ + +
14.67 0.21 0.42 and 0.75(4.67) 3.51"21.75
c a cd
β= = ≤ = = =
0.28(4.67)1 270 1 253.8 k*ft
21.75ps pups
kcf fd
⎛ ⎞ ⎛ ⎞= − = − =⎜ ⎟ ⎜ ⎟⎜ ⎟ ⎝ ⎠⎝ ⎠
Taking Φ = 1.0 for prestressed member: 3.511.0 2.448(253.8) 21.75 1035 k*ft2nM ⎡ ⎤⎛ ⎞Φ = − =⎜ ⎟⎢ ⎥⎝ ⎠⎣ ⎦
349684 3738.5 in
13.29bb
IZy
= = =
7.5 7.5 6000 0.581 ksir cf f ′= = =
2.448(167) 3739 0.581(3739)8.04 679 k*ft
12 568.8 12b
crack ps pe o r bc
ZM A f e f ZA
⎛ ⎞ ⎛ ⎞= + + = + + =⎜ ⎟ ⎜ ⎟⎝ ⎠⎝ ⎠
Check 1035 1.53 1.2679
n
crack
MMΦ
= = > OK
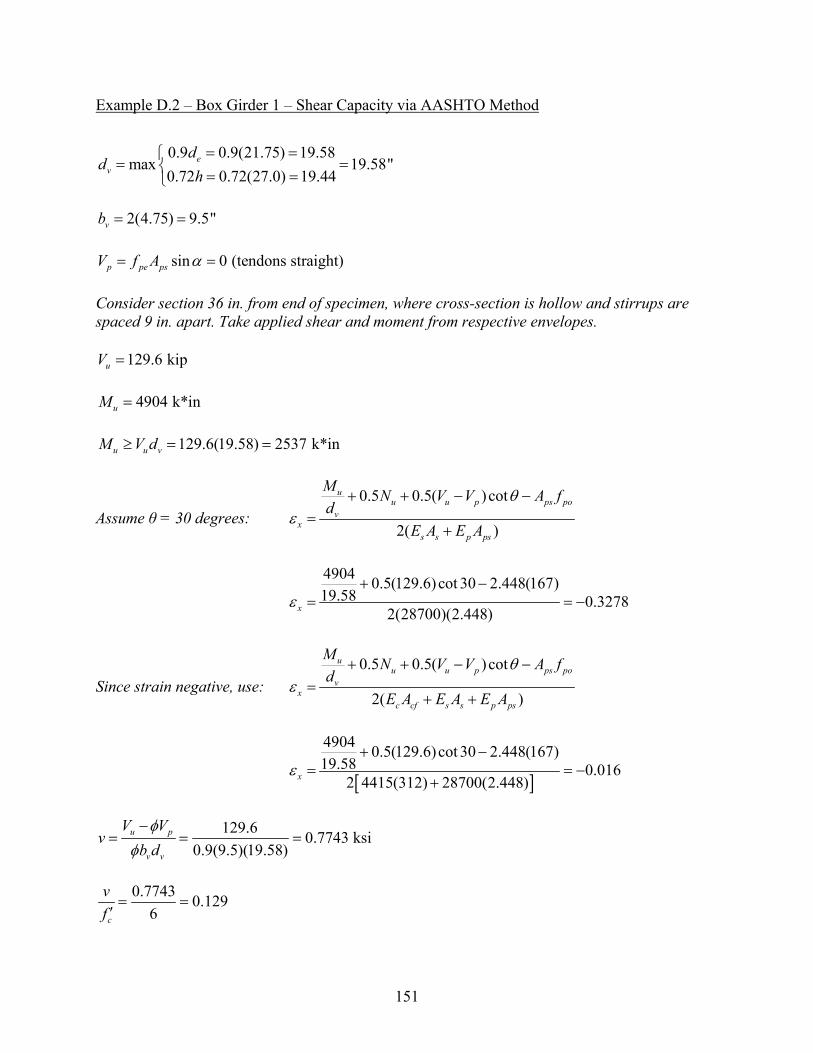
151
Example D.2 – Box Girder 1 – Shear Capacity via AASHTO Method
0.9 0.9(21.75) 19.58
max 19.58"0.72 0.72(27.0) 19.44
ev
dd
h= =⎧
= =⎨ = =⎩
2(4.75) 9.5"vb = =
sin 0 (tendons straight)p pe psV f A α= =
Consider section 36 in. from end of specimen, where cross-section is hollow and stirrups are spaced 9 in. apart. Take applied shear and moment from respective envelopes.
129.6 kipuV =
4904 k*inuM =
129.6(19.58) 2537 k*inu u vM V d≥ = =
Assume θ = 30 degrees: 0.5 0.5( )cot
2( )
uu u p ps po
vx
s s p ps
M N V V A fd
E A E A
θε
+ + − −=
+
4904 0.5(129.6)cot 30 2.448(167)19.58 0.3278
2(28700)(2.448)xε+ −
= = −
Since strain negative, use: 0.5 0.5( )cot
2( )
uu u p ps po
vx
c cf s s p ps
M N V V A fd
E A E A E A
θε
+ + − −=
+ +
[ ]
4904 0.5(129.6)cot 30 2.448(167)19.58 0.016
2 4415(312) 28700(2.448)xε+ −
= = −+
129.6 0.7743 ksi
0.9(9.5)(19.58)u p
v v
V Vv
b dφ
φ−
= = =
0.7743 0.129
6c
vf= =′
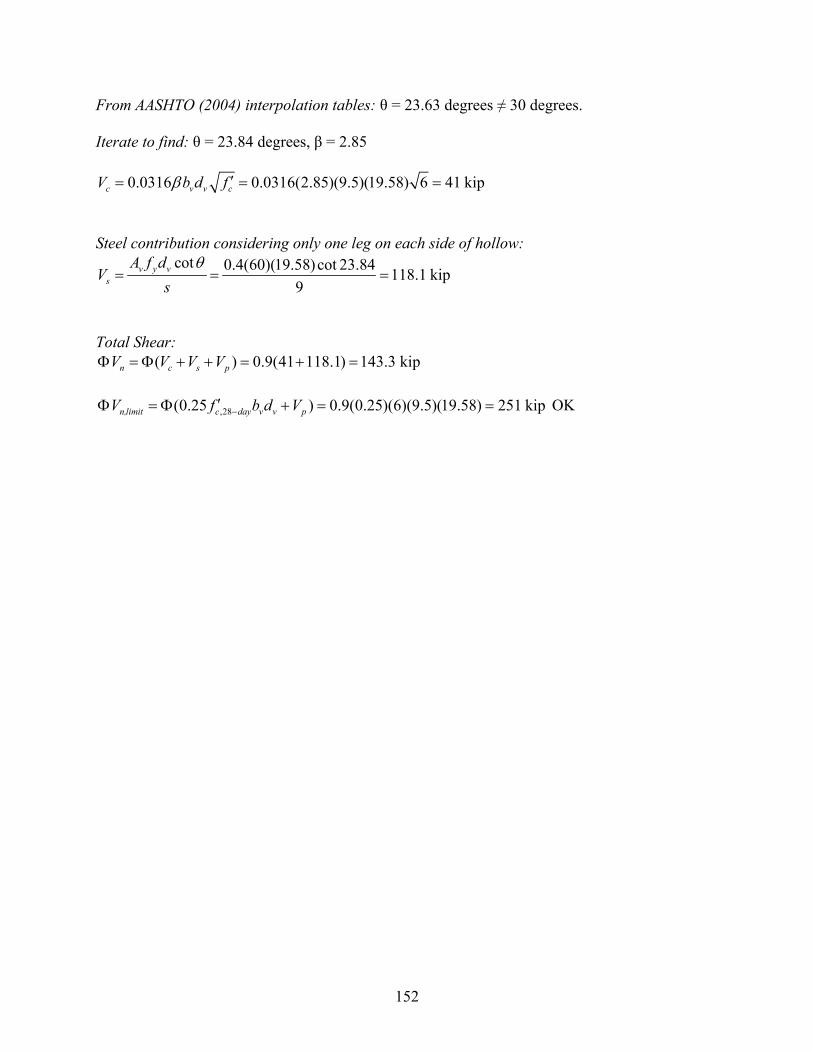
152
From AASHTO (2004) interpolation tables: θ = 23.63 degrees ≠ 30 degrees. Iterate to find: θ = 23.84 degrees, β = 2.85
0.0316 0.0316(2.85)(9.5)(19.58) 6 41 kipc v v cV b d fβ ′= = = Steel contribution considering only one leg on each side of hollow:
cot 0.4(60)(19.58)cot 23.84 118.1 kip9
v y vs
A f dV
sθ
= = =
Total Shear:
( ) 0.9(41 118.1) 143.3 kipn c s pV V V VΦ = Φ + + = + =
,28(0.25 ) 0.9(0.25)(6)(9.5)(19.58) 251 kipn,limit c day v v pV f b d V−′Φ = Φ + = = OK
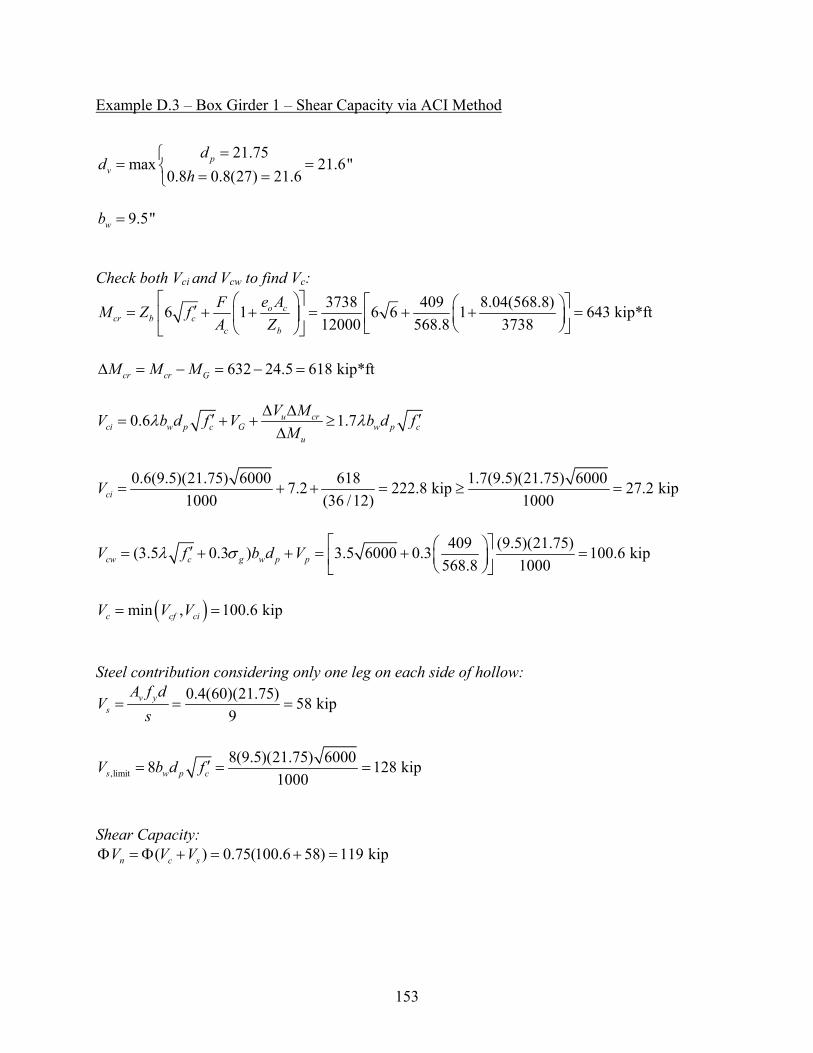
153
Example D.3 – Box Girder 1 – Shear Capacity via ACI Method
21.75
max 21.6"0.8 0.8(27) 21.6
pv
dd
h=⎧
= =⎨ = =⎩
9.5"wb =
Check both Vci and Vcw to find Vc:
3738 409 8.04(568.8)6 1 6 6 1 643 kip*ft12000 568.8 3738
o ccr b c
c b
e AFM Z fA Z
⎡ ⎤⎛ ⎞ ⎡ ⎤⎛ ⎞′= + + = + + =⎢ ⎥⎜ ⎟ ⎜ ⎟⎢ ⎥⎝ ⎠⎣ ⎦⎝ ⎠⎣ ⎦
632 24.5 618 kip*ftcr cr GM M MΔ = − = − =
0.6 1.7u crci w p c G w p c
u
V MV b d f V b d fM
λ λΔ Δ′ ′= + + ≥Δ
0.6(9.5)(21.75) 6000 618 1.7(9.5)(21.75) 60007.2 222.8 kip 27.2 kip
1000 (36 /12) 1000ciV = + + = ≥ =
409 (9.5)(21.75)(3.5 0.3 ) 3.5 6000 0.3 100.6 kip
568.8 1000cw c g w p pV f b d Vλ σ ⎡ ⎤⎛ ⎞′= + + = + =⎜ ⎟⎢ ⎥⎝ ⎠⎣ ⎦
( )min , 100.6 kipc cf ciV V V= =
Steel contribution considering only one leg on each side of hollow:
0.4(60)(21.75) 58 kip9
v ys
A f dV
s= = =
,limit8(9.5)(21.75) 60008 128 kip
1000s w p cV b d f ′= = =
Shear Capacity:
( ) 0.75(100.6 58) 119 kipn c sV V VΦ = Φ + = + =
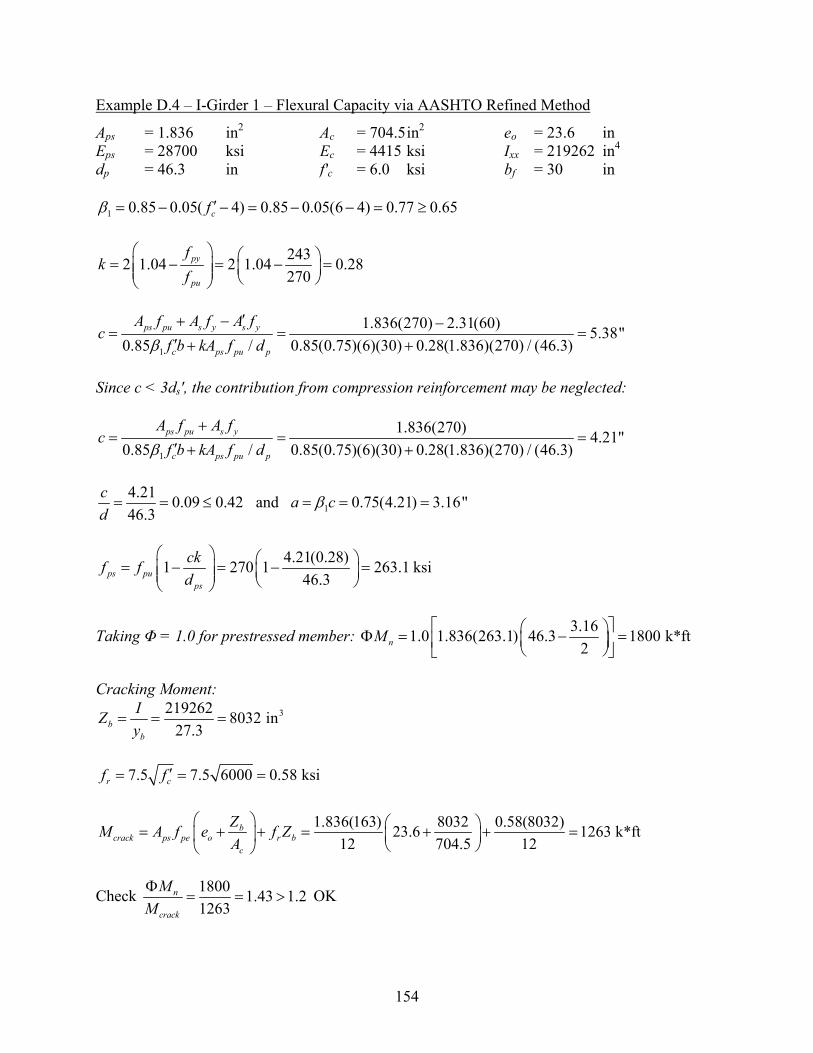
154
Example D.4 – I-Girder 1 – Flexural Capacity via AASHTO Refined Method
Aps = 1.836 in2 Ac = 704.5in2 eo = 23.6 in Eps = 28700 ksi Ec = 4415 ksi Ixx = 219262 in4
dp = 46.3 in f'c = 6.0 ksi bf = 30 in
1 0.85 0.05( 4) 0.85 0.05(6 4) 0.77 0.65cfβ ′= − − = − − = ≥
2432 1.04 2 1.04 0.28270
py
pu
fk
f⎛ ⎞ ⎛ ⎞= − = − =⎜ ⎟ ⎜ ⎟⎜ ⎟ ⎝ ⎠⎝ ⎠
1
1.836(270) 2.31(60) 5.38"0.85 / 0.85(0.75)(6)(30) 0.28(1.836)(270) / (46.3)
ps pu s y s y
c ps pu p
A f A f A fc
f b kA f dβ′+ − −
= = =′ + +
Since c < 3ds′, the contribution from compression reinforcement may be neglected:
1
1.836(270) 4.21"0.85 / 0.85(0.75)(6)(30) 0.28(1.836)(270) / (46.3)
ps pu s y
c ps pu p
A f A fc
f b kA f dβ+
= = =′ + +
14.21 0.09 0.42 and 0.75(4.21) 3.16"46.3
c a cd
β= = ≤ = = =
4.21(0.28)1 270 1 263.1 ksi
46.3ps pups
ckf fd
⎛ ⎞ ⎛ ⎞= − = − =⎜ ⎟ ⎜ ⎟⎜ ⎟ ⎝ ⎠⎝ ⎠
Taking Φ = 1.0 for prestressed member: 3.161.0 1.836(263.1) 46.3 1800 k*ft2nM ⎡ ⎤⎛ ⎞Φ = − =⎜ ⎟⎢ ⎥⎝ ⎠⎣ ⎦
Cracking Moment:
3219262 8032 in27.3b
b
IZy
= = =
7.5 7.5 6000 0.58 ksir cf f ′= = =
1.836(163) 8032 0.58(8032)23.6 1263 k*ft
12 704.5 12b
crack ps pe o r bc
ZM A f e f ZA
⎛ ⎞ ⎛ ⎞= + + = + + =⎜ ⎟ ⎜ ⎟⎝ ⎠⎝ ⎠
Check 1800 1.43 1.21263
n
crack
MMΦ
= = > OK
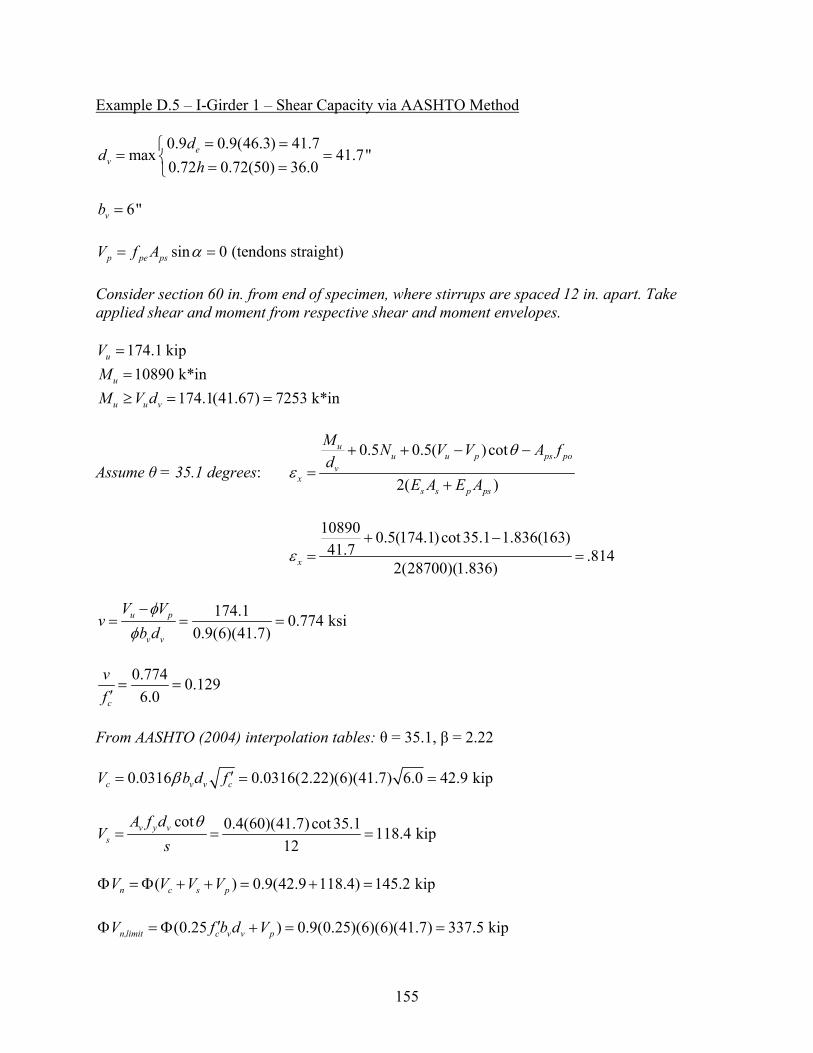
155
Example D.5 – I-Girder 1 – Shear Capacity via AASHTO Method
0.9 0.9(46.3) 41.7max 41.7"
0.72 0.72(50) 36.0e
v
dd
h= =⎧
= =⎨ = =⎩
6"vb =
sin 0 (tendons straight)p pe psV f A α= =
Consider section 60 in. from end of specimen, where stirrups are spaced 12 in. apart. Take applied shear and moment from respective shear and moment envelopes.
174.1 kipuV = 10890 k*inuM =
174.1(41.67) 7253 k*inu u vM V d≥ = =
Assume θ = 35.1 degrees: 0.5 0.5( )cot
2( )
uu u p ps po
vx
s s p ps
M N V V A fd
E A E A
θε
+ + − −=
+
10890 0.5(174.1)cot 35.1 1.836(163)41.7 .814
2(28700)(1.836)xε+ −
= =
174.1 0.774 ksi
0.9(6)(41.7)u p
v v
V Vv
b dφ
φ−
= = =
0.774 0.1296.0c
vf= =′
From AASHTO (2004) interpolation tables: θ = 35.1, β = 2.22
0.0316 0.0316(2.22)(6)(41.7) 6.0 42.9 kipc v v cV b d fβ ′= = =
cot 0.4(60)(41.7)cot 35.1 118.4 kip12
v y vs
A f dV
sθ
= = =
( ) 0.9(42.9 118.4) 145.2 kipn c s pV V V VΦ = Φ + + = + =
(0.25 ) 0.9(0.25)(6)(6)(41.7) 337.5 kipn,limit c v v pV f b d V′Φ = Φ + = =
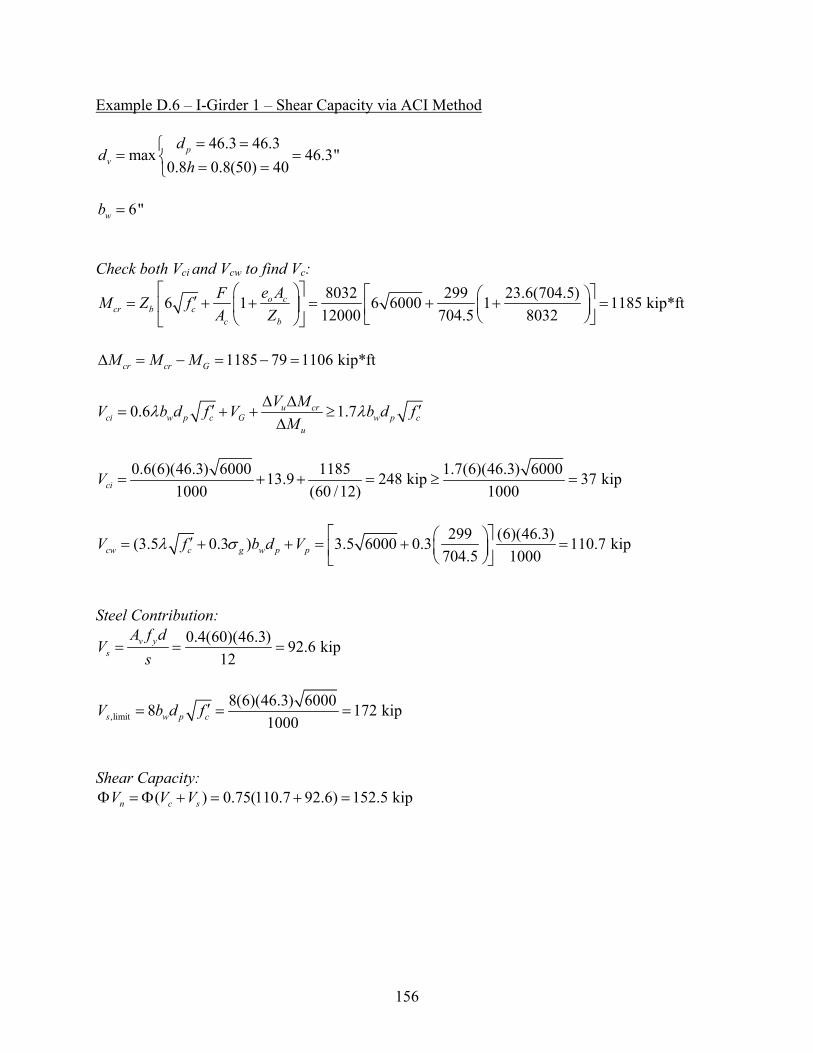
156
Example D.6 – I-Girder 1 – Shear Capacity via ACI Method
46.3 46.3max 46.3"
0.8 0.8(50) 40p
v
dd
h= =⎧
= =⎨ = =⎩
6"wb =
Check both Vci and Vcw to find Vc:
8032 299 23.6(704.5)6 1 6 6000 1 1185 kip*ft12000 704.5 8032
o ccr b c
c b
e AFM Z fA Z
⎡ ⎤⎛ ⎞ ⎡ ⎤⎛ ⎞′= + + = + + =⎢ ⎥⎜ ⎟ ⎜ ⎟⎢ ⎥⎝ ⎠⎣ ⎦⎝ ⎠⎣ ⎦
1185 79 1106 kip*ftcr cr GM M MΔ = − = − =
0.6 1.7u crci w p c G w p c
u
V MV b d f V b d fM
λ λΔ Δ′ ′= + + ≥Δ
0.6(6)(46.3) 6000 1185 1.7(6)(46.3) 600013.9 248 kip 37 kip
1000 (60 /12) 1000ciV = + + = ≥ =
299 (6)(46.3)(3.5 0.3 ) 3.5 6000 0.3 110.7 kip
704.5 1000cw c g w p pV f b d Vλ σ ⎡ ⎤⎛ ⎞′= + + = + =⎜ ⎟⎢ ⎥⎝ ⎠⎣ ⎦
Steel Contribution:
0.4(60)(46.3) 92.6 kip12
v ys
A f dV
s= = =
,limit8(6)(46.3) 60008 172 kip
1000s w p cV b d f ′= = =
Shear Capacity:
( ) 0.75(110.7 92.6) 152.5 kipn c sV V VΦ = Φ + = + =
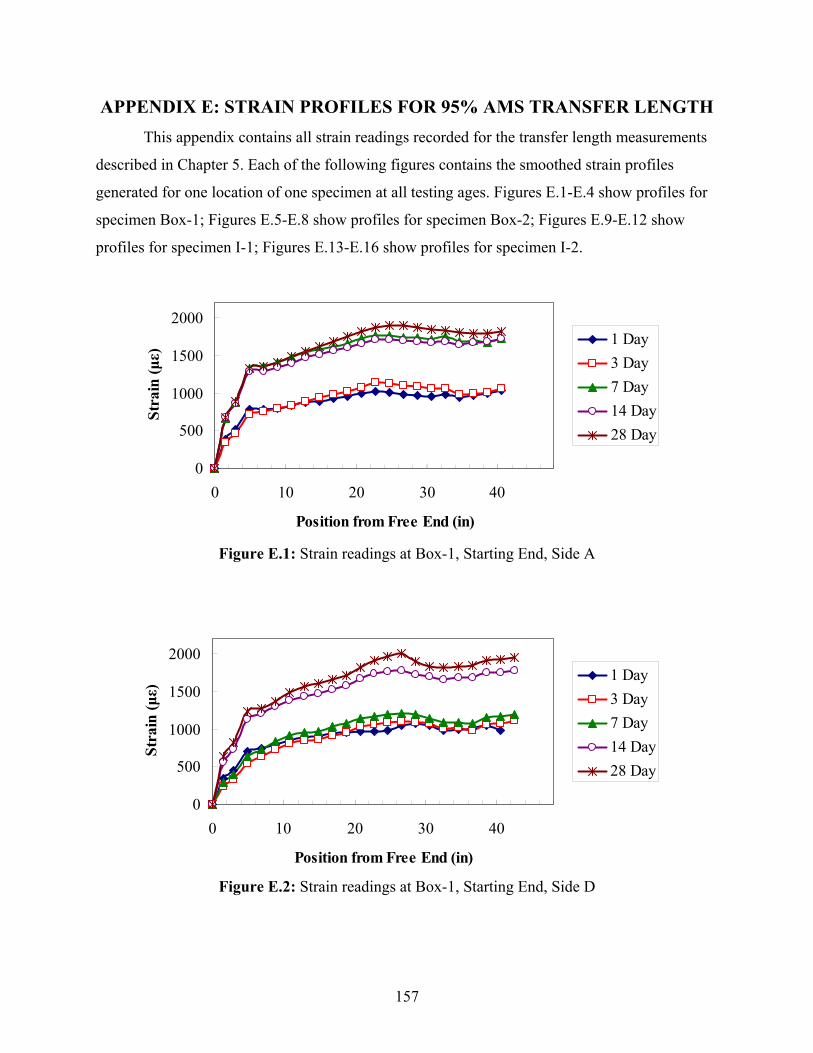
157
APPENDIX E: STRAIN PROFILES FOR 95% AMS TRANSFER LENGTH This appendix contains all strain readings recorded for the transfer length measurements
described in Chapter 5. Each of the following figures contains the smoothed strain profiles
generated for one location of one specimen at all testing ages. Figures E.1-E.4 show profiles for
specimen Box-1; Figures E.5-E.8 show profiles for specimen Box-2; Figures E.9-E.12 show
profiles for specimen I-1; Figures E.13-E.16 show profiles for specimen I-2.
0
500
1000
1500
2000
0 10 20 30 40
Position from Free End (in)
Stra
in (με)
1 Day3 Day7 Day14 Day28 Day
Figure E.1: Strain readings at Box-1, Starting End, Side A
0
500
1000
1500
2000
0 10 20 30 40
Position from Free End (in)
Stra
in (με)
1 Day3 Day7 Day14 Day28 Day
Figure E.2: Strain readings at Box-1, Starting End, Side D
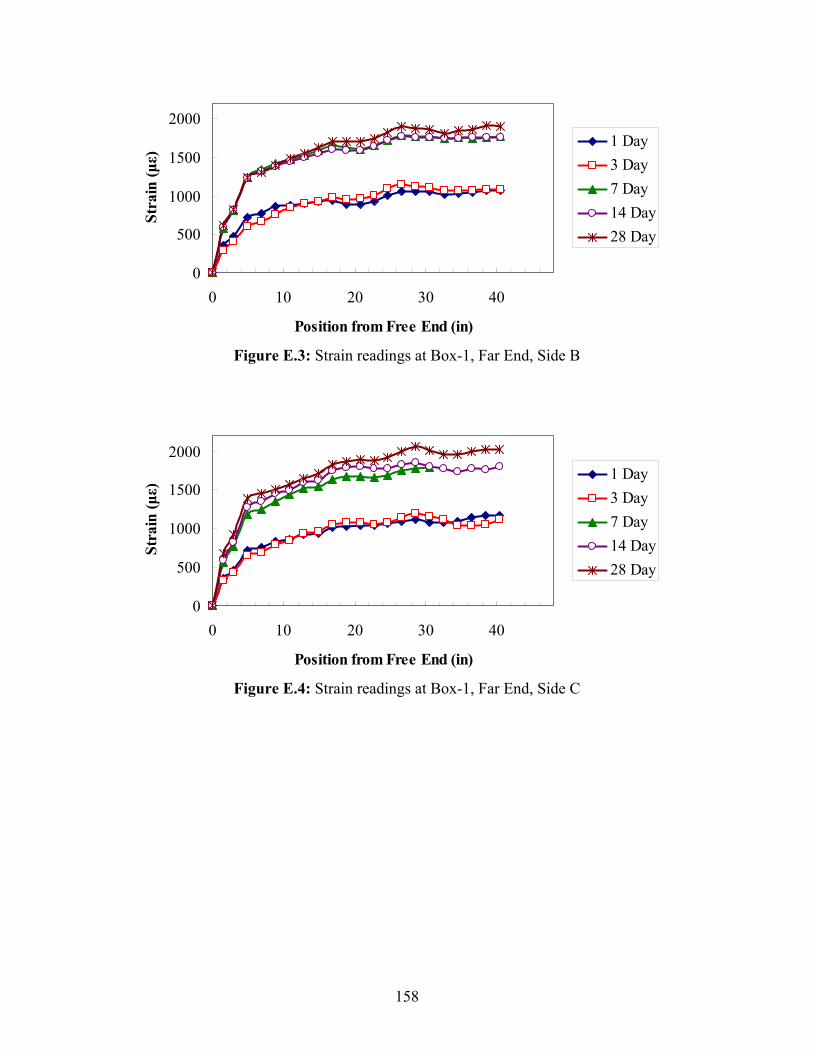
158
0
500
1000
1500
2000
0 10 20 30 40
Position from Free End (in)
Stra
in (με)
1 Day3 Day7 Day14 Day28 Day
Figure E.3: Strain readings at Box-1, Far End, Side B
0
500
1000
1500
2000
0 10 20 30 40
Position from Free End (in)
Stra
in (με)
1 Day3 Day7 Day14 Day28 Day
Figure E.4: Strain readings at Box-1, Far End, Side C
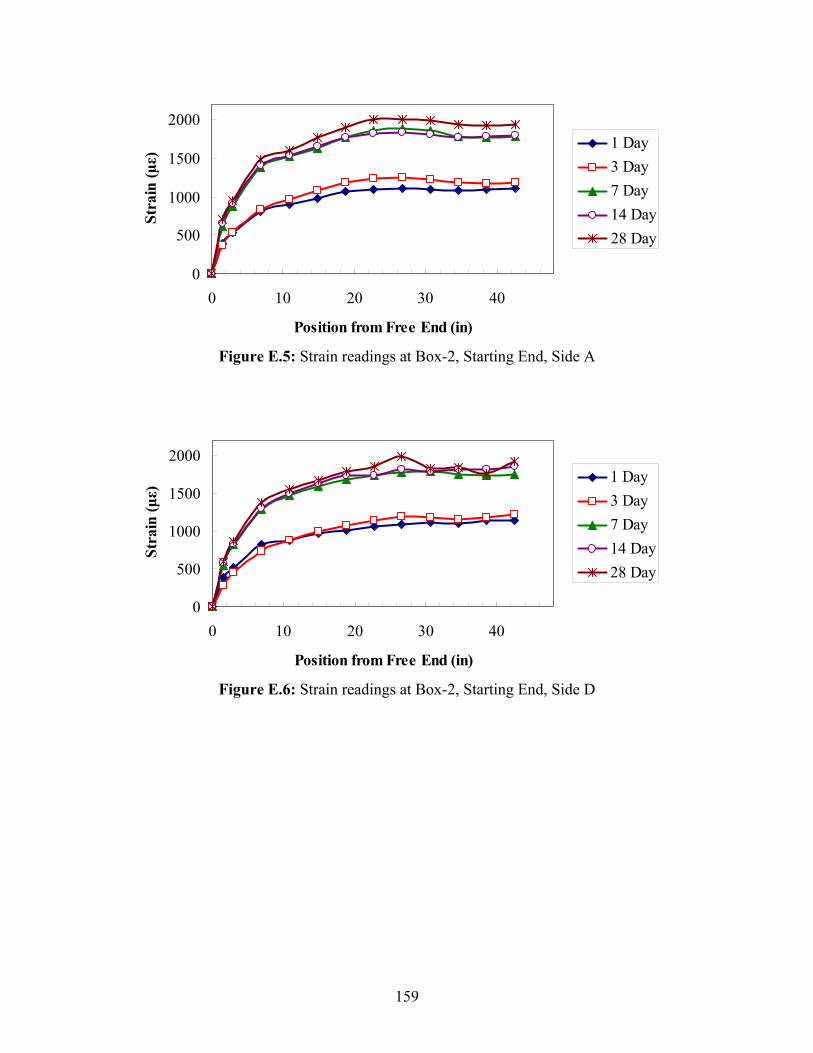
159
0
500
1000
1500
2000
0 10 20 30 40
Position from Free End (in)
Stra
in (με)
1 Day3 Day7 Day14 Day28 Day
Figure E.5: Strain readings at Box-2, Starting End, Side A
0
500
1000
1500
2000
0 10 20 30 40
Position from Free End (in)
Stra
in (με)
1 Day3 Day7 Day14 Day28 Day
Figure E.6: Strain readings at Box-2, Starting End, Side D
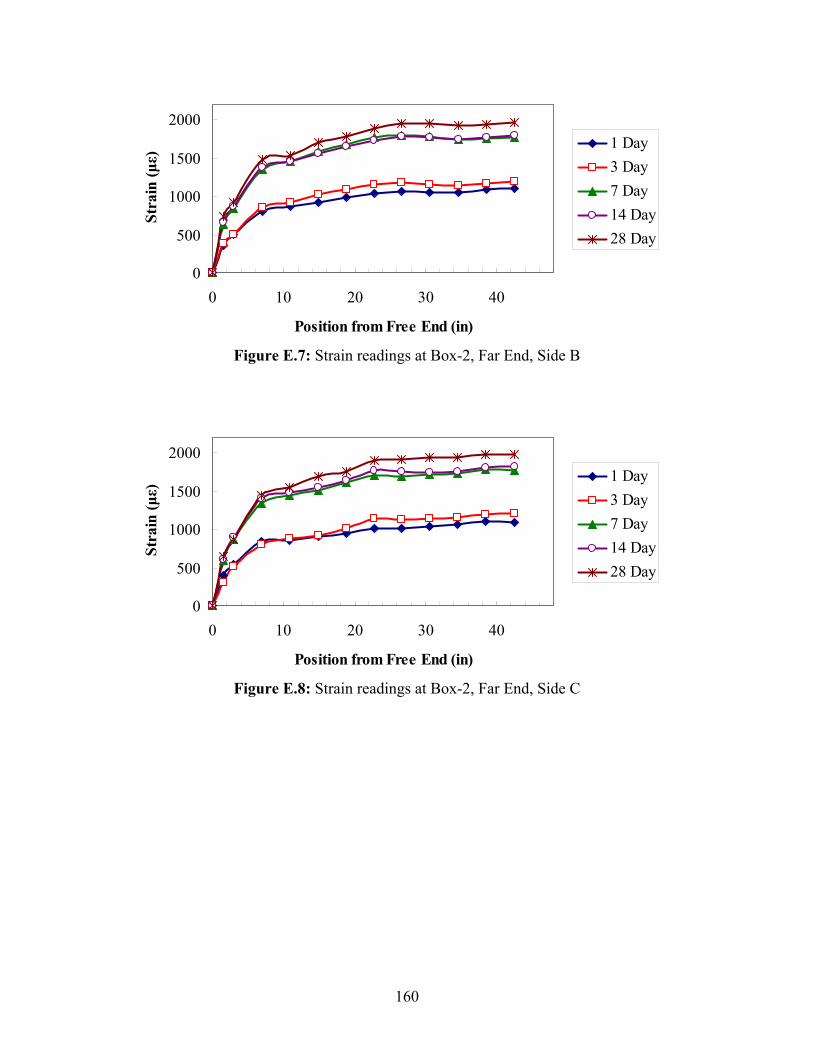
160
0
500
1000
1500
2000
0 10 20 30 40
Position from Free End (in)
Stra
in (με)
1 Day3 Day7 Day14 Day28 Day
Figure E.7: Strain readings at Box-2, Far End, Side B
0
500
1000
1500
2000
0 10 20 30 40
Position from Free End (in)
Stra
in (με)
1 Day3 Day7 Day14 Day28 Day
Figure E.8: Strain readings at Box-2, Far End, Side C
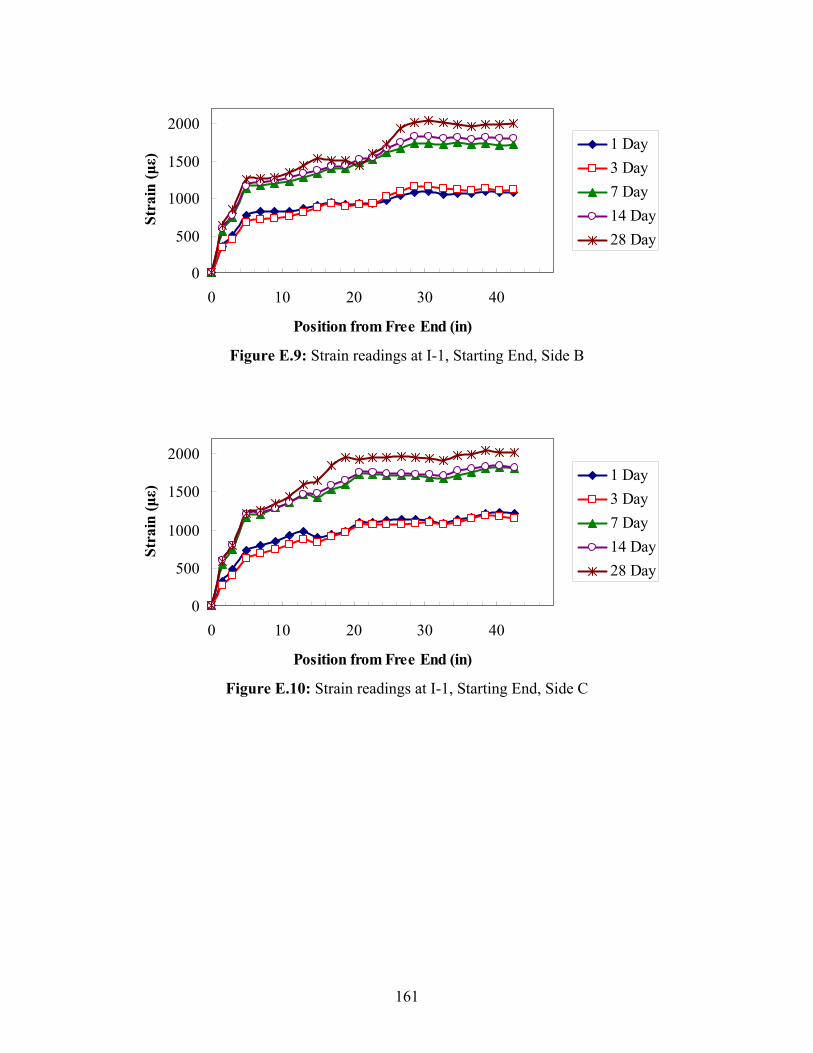
161
0
500
1000
1500
2000
0 10 20 30 40
Position from Free End (in)
Stra
in (με)
1 Day3 Day7 Day14 Day28 Day
Figure E.9: Strain readings at I-1, Starting End, Side B
0
500
1000
1500
2000
0 10 20 30 40
Position from Free End (in)
Stra
in (με)
1 Day3 Day7 Day14 Day28 Day
Figure E.10: Strain readings at I-1, Starting End, Side C
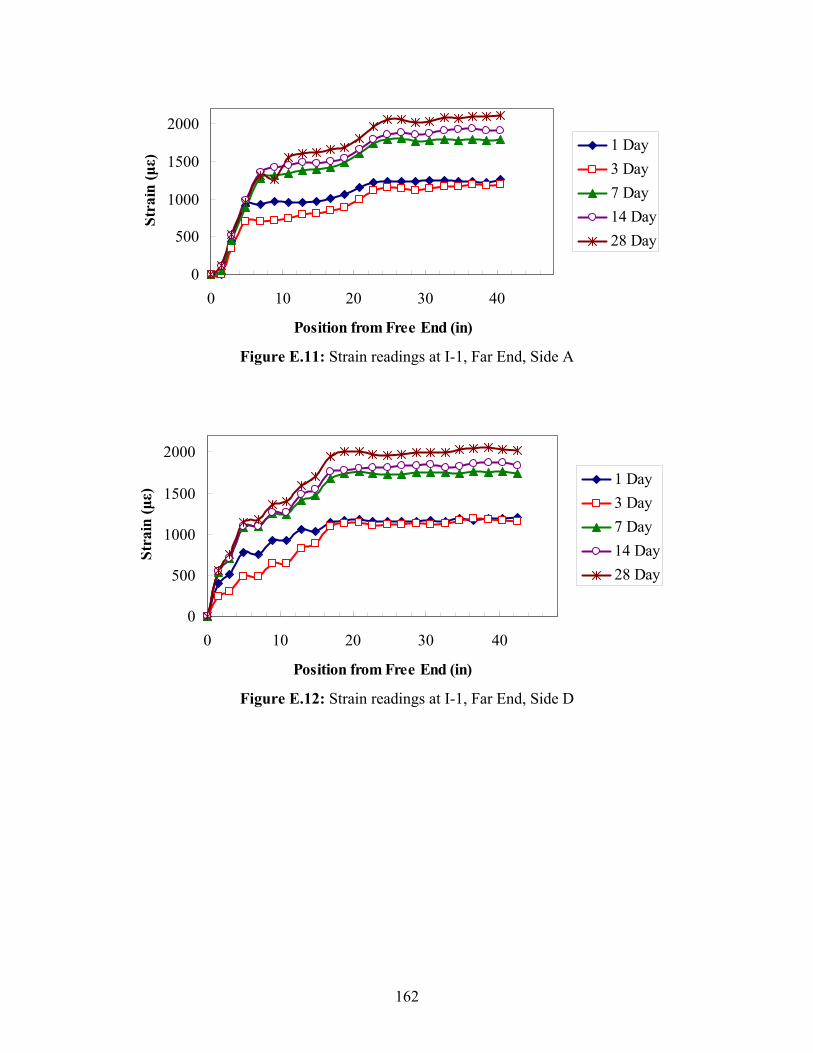
162
0
500
1000
1500
2000
0 10 20 30 40
Position from Free End (in)
Stra
in (με)
1 Day3 Day7 Day14 Day28 Day
Figure E.11: Strain readings at I-1, Far End, Side A
0
500
1000
1500
2000
0 10 20 30 40
Position from Free End (in)
Stra
in (με)
1 Day3 Day7 Day14 Day28 Day
Figure E.12: Strain readings at I-1, Far End, Side D
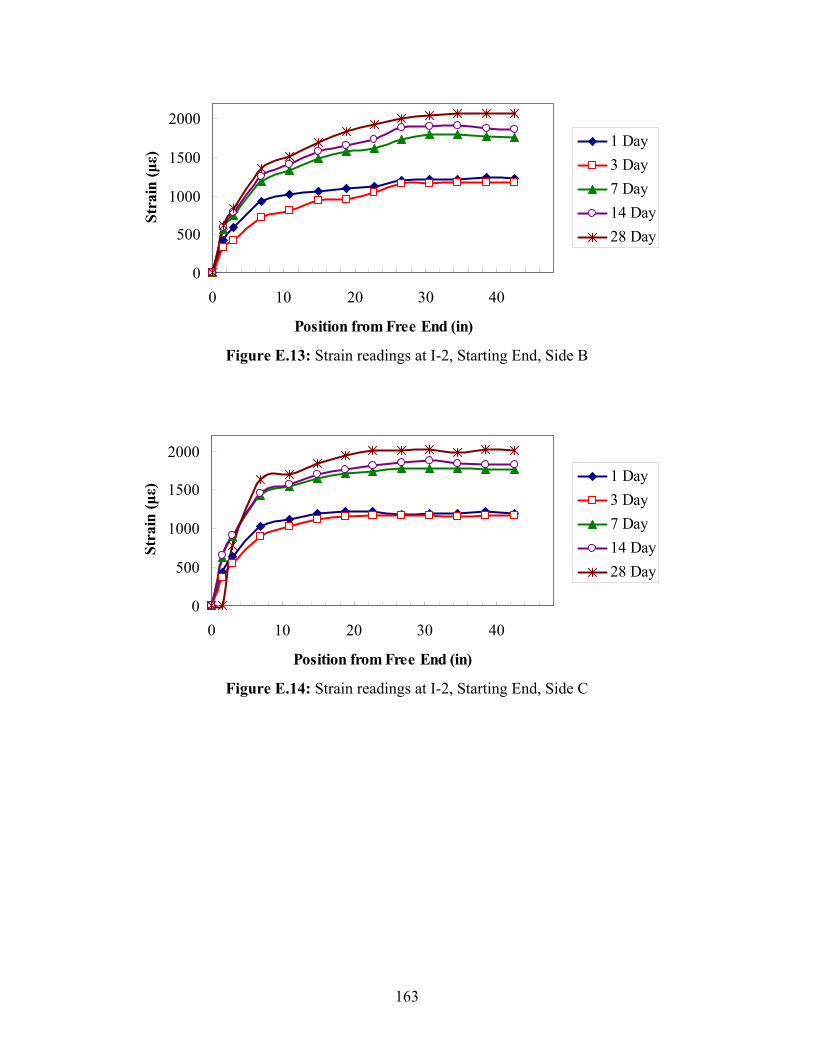
163
0
500
1000
1500
2000
0 10 20 30 40
Position from Free End (in)
Stra
in (με)
1 Day3 Day7 Day14 Day28 Day
Figure E.13: Strain readings at I-2, Starting End, Side B
0
500
1000
1500
2000
0 10 20 30 40
Position from Free End (in)
Stra
in (με)
1 Day3 Day7 Day14 Day28 Day
Figure E.14: Strain readings at I-2, Starting End, Side C
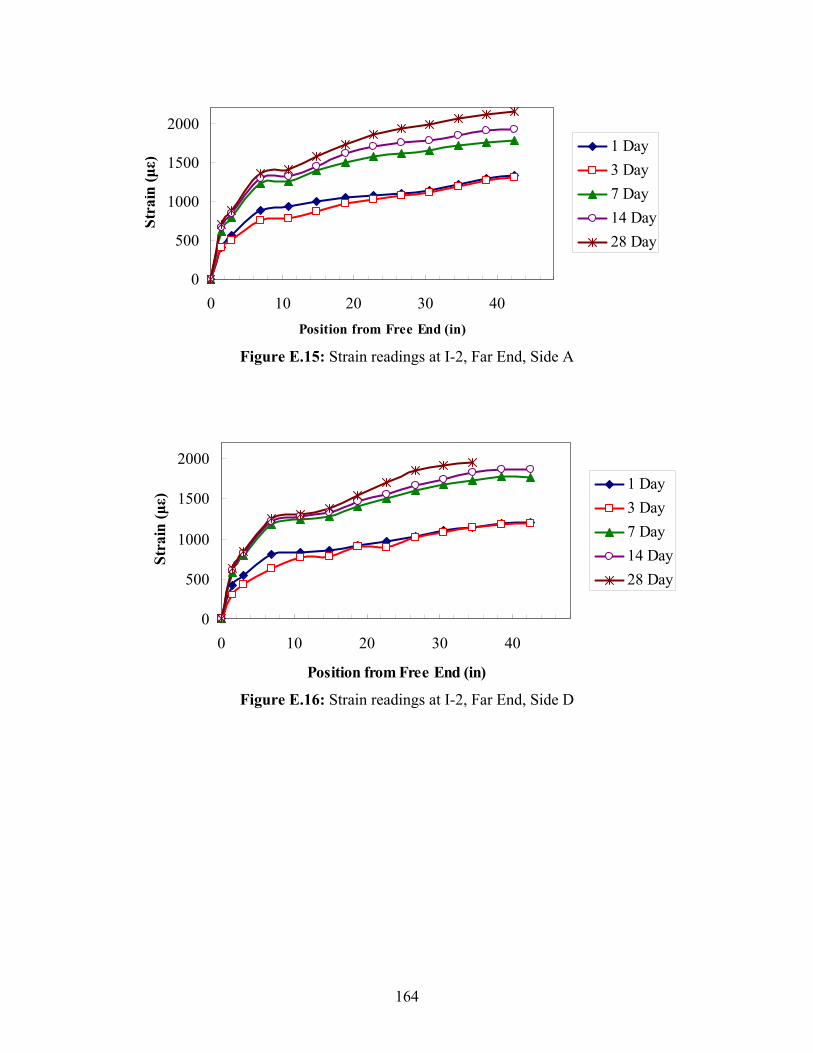
164
0
500
1000
1500
2000
0 10 20 30 40Position from Free End (in)
Stra
in (με)
1 Day3 Day7 Day14 Day28 Day
Figure E.15: Strain readings at I-2, Far End, Side A
0
500
1000
1500
2000
0 10 20 30 40
Position from Free End (in)
Stra
in (με)
1 Day3 Day7 Day14 Day28 Day
Figure E.16: Strain readings at I-2, Far End, Side D
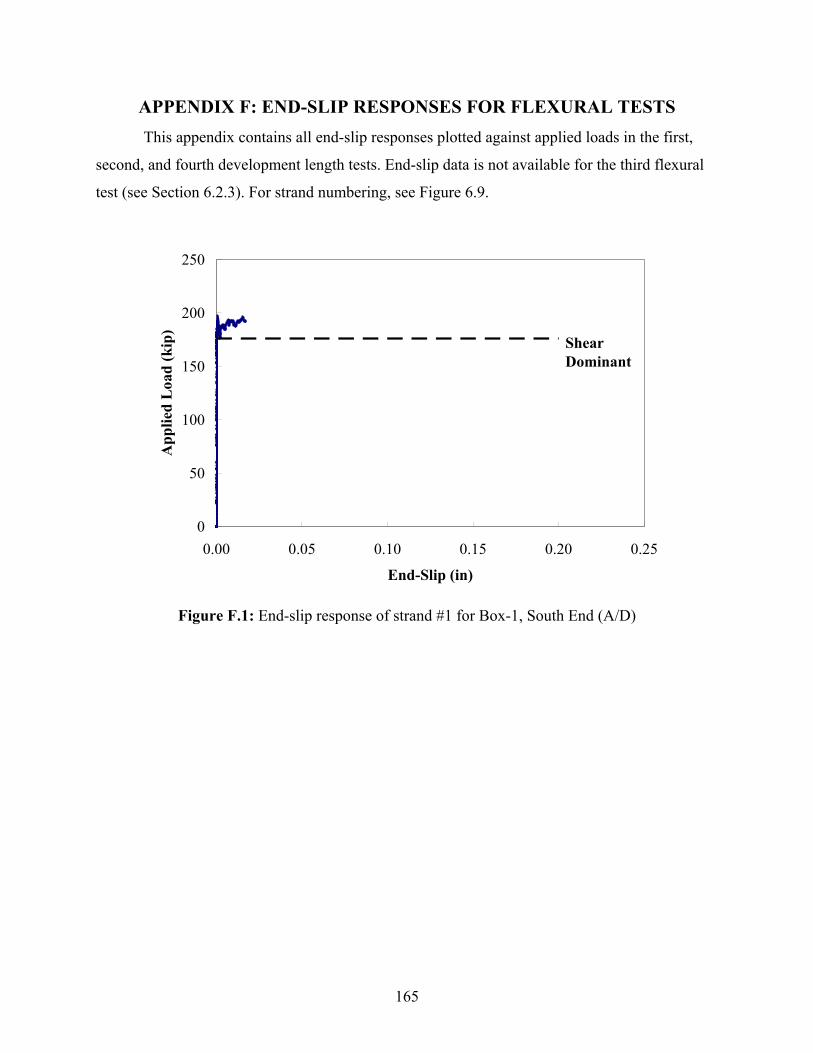
165
APPENDIX F: END-SLIP RESPONSES FOR FLEXURAL TESTS This appendix contains all end-slip responses plotted against applied loads in the first,
second, and fourth development length tests. End-slip data is not available for the third flexural
test (see Section 6.2.3). For strand numbering, see Figure 6.9.
0
50
100
150
200
250
0.00 0.05 0.10 0.15 0.20 0.25
End-Slip (in)
App
lied
Loa
d (k
ip)
ShearDominant
Figure F.1: End-slip response of strand #1 for Box-1, South End (A/D)

166
0
50
100
150
200
250
0.00 0.05 0.10 0.15 0.20 0.25
End-Slip (in)
App
lied
Loa
d (k
ip) Shear
Dominant
Figure F.2: End-slip response of strand #2 for Box-1, South End (A/D)
0
50
100
150
200
250
0.00 0.05 0.10 0.15 0.20 0.25
End-Slip (in)
App
lied
Loa
d (k
ip) Shear
Dominant
Figure F.3: End-slip response of strand #3 for Box-1, South End (A/D)

167
0
50
100
150
200
250
0.00 0.05 0.10 0.15 0.20 0.25
End-Slip (in)
App
lied
Loa
d (k
ip) Shear
Dominant
Figure F.4: End-slip response of strand #4 for Box-1, South End (A/D)
0
50
100
150
200
250
0.00 0.05 0.10 0.15 0.20 0.25
End-Slip (in)
App
lied
Loa
d (k
ip) Shear
Dominant
Figure F.5: End-slip response of strand #5 for Box-1, South End (A/D)

168
0
50
100
150
200
250
0.00 0.05 0.10 0.15 0.20 0.25
End-Slip (in)
App
lied
Loa
d (k
ip) Shear
Dominant
Figure F.6: End-slip response of strand #6 for Box-1, South End (A/D)
0
50
100
150
200
250
0.00 0.05 0.10 0.15 0.20 0.25
End-Slip (in)
App
lied
Loa
d (k
ip) Shear
Dominant
Figure F.7: End-slip response of strand #7 for Box-1, South End (A/D)
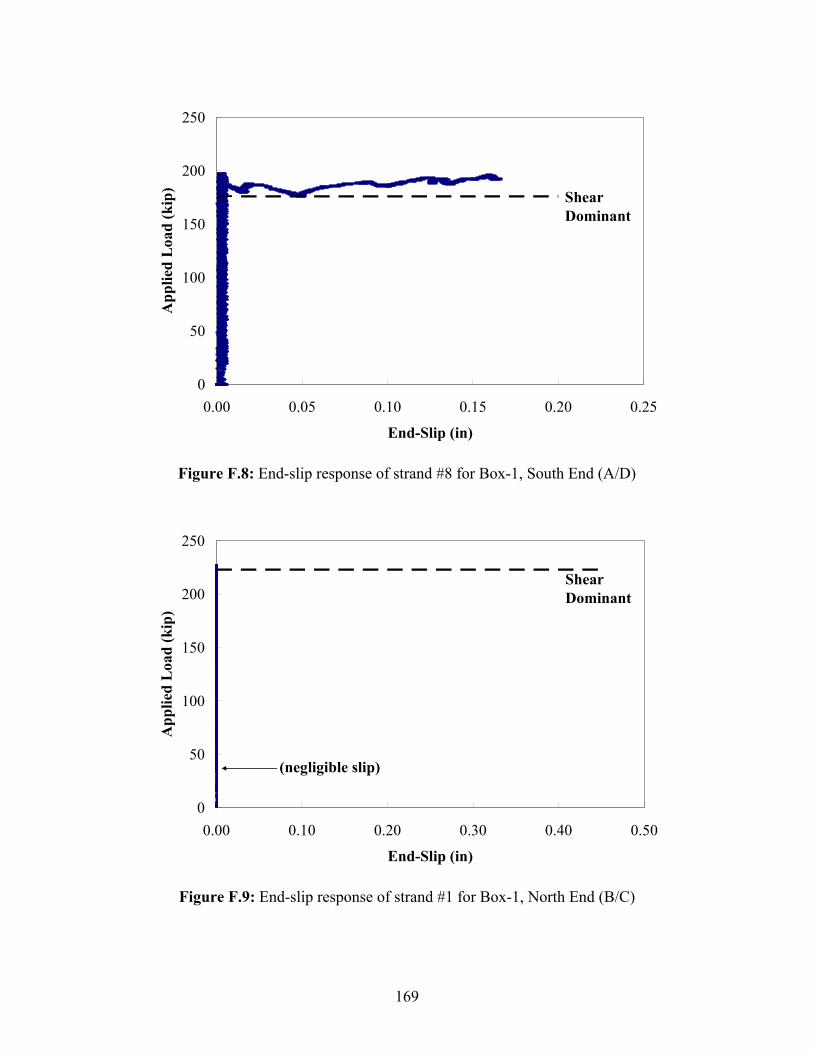
169
0
50
100
150
200
250
0.00 0.05 0.10 0.15 0.20 0.25
End-Slip (in)
App
lied
Loa
d (k
ip) Shear
Dominant
Figure F.8: End-slip response of strand #8 for Box-1, South End (A/D)
0
50
100
150
200
250
0.00 0.10 0.20 0.30 0.40 0.50
End-Slip (in)
App
lied
Loa
d (k
ip)
ShearDominant
(negligible slip)
Figure F.9: End-slip response of strand #1 for Box-1, North End (B/C)
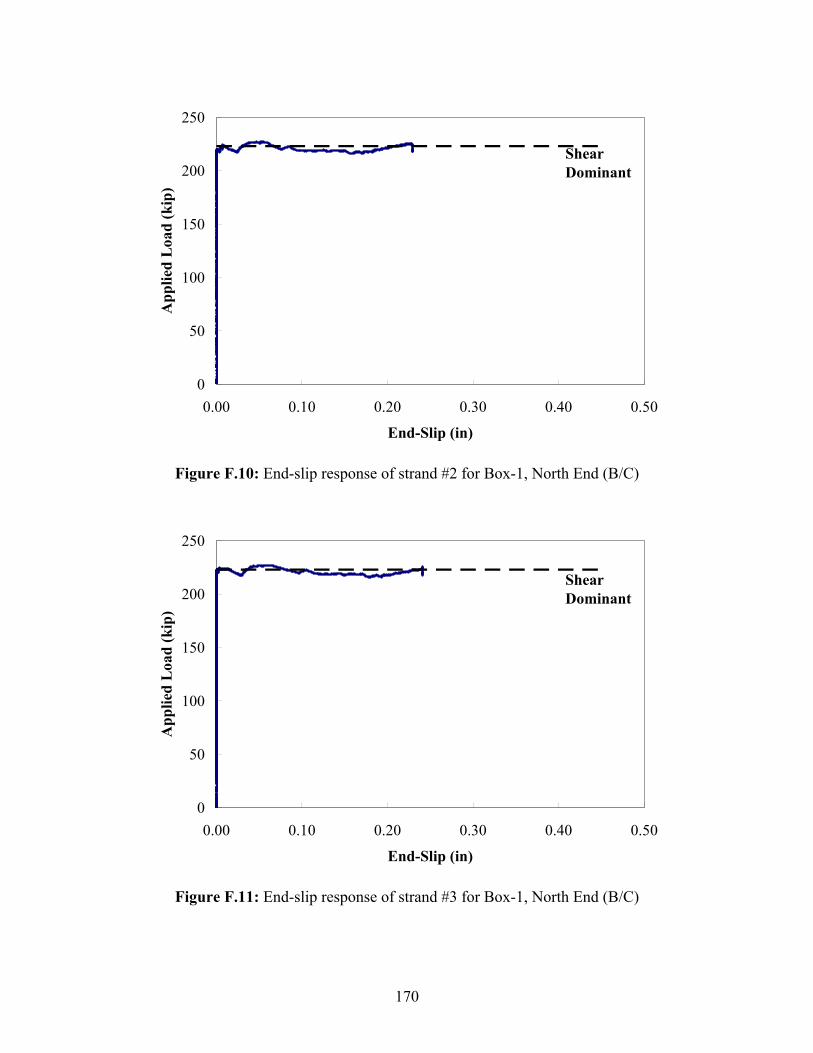
170
0
50
100
150
200
250
0.00 0.10 0.20 0.30 0.40 0.50
End-Slip (in)
App
lied
Loa
d (k
ip)
ShearDominant
Figure F.10: End-slip response of strand #2 for Box-1, North End (B/C)
0
50
100
150
200
250
0.00 0.10 0.20 0.30 0.40 0.50
End-Slip (in)
App
lied
Loa
d (k
ip)
ShearDominant
Figure F.11: End-slip response of strand #3 for Box-1, North End (B/C)
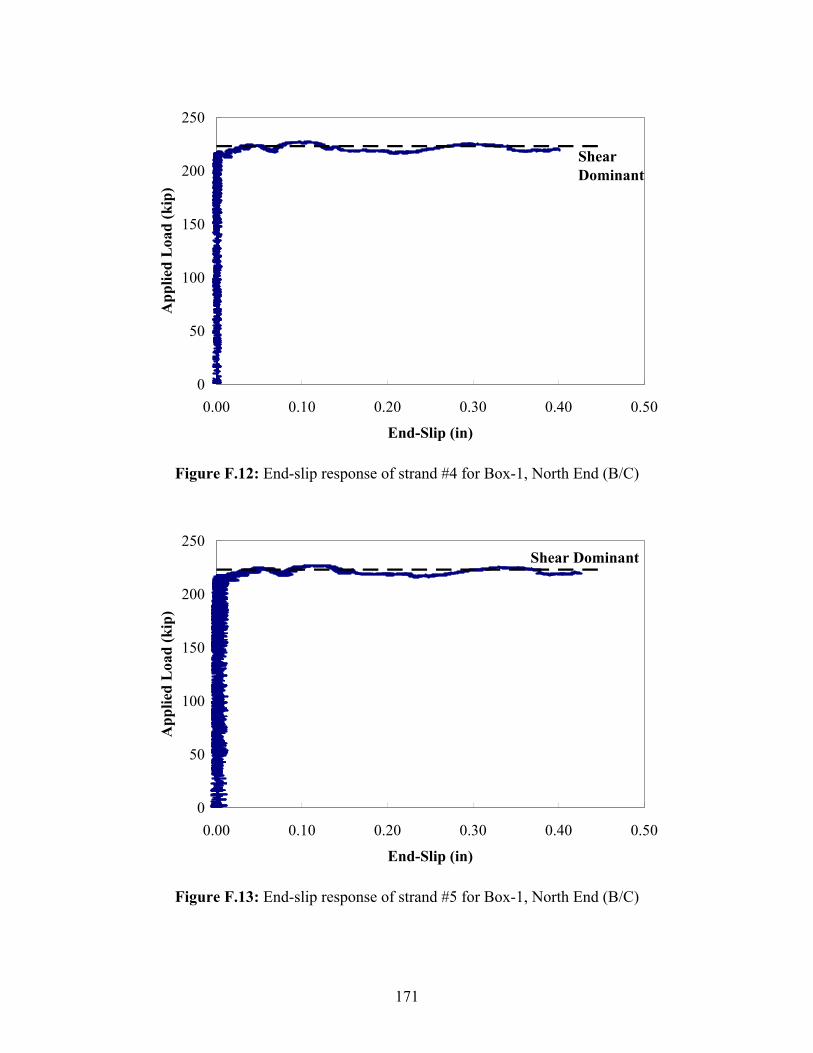
171
0
50
100
150
200
250
0.00 0.10 0.20 0.30 0.40 0.50
End-Slip (in)
App
lied
Loa
d (k
ip)
ShearDominant
Figure F.12: End-slip response of strand #4 for Box-1, North End (B/C)
0
50
100
150
200
250
0.00 0.10 0.20 0.30 0.40 0.50
End-Slip (in)
App
lied
Loa
d (k
ip)
Shear Dominant
Figure F.13: End-slip response of strand #5 for Box-1, North End (B/C)

172
0
50
100
150
200
250
0.00 0.10 0.20 0.30 0.40 0.50
End-Slip (in)
App
lied
Loa
d (k
ip)
ShearDominant
Figure F.14: End-slip response of strand #6 for Box-1, North End (B/C)
0
50
100
150
200
250
0.00 0.10 0.20 0.30 0.40 0.50
End-Slip (in)
App
lied
Loa
d (k
ip)
Shear Dominant
Figure F.15: End-slip response of strand #7 for Box-1, North End (B/C)
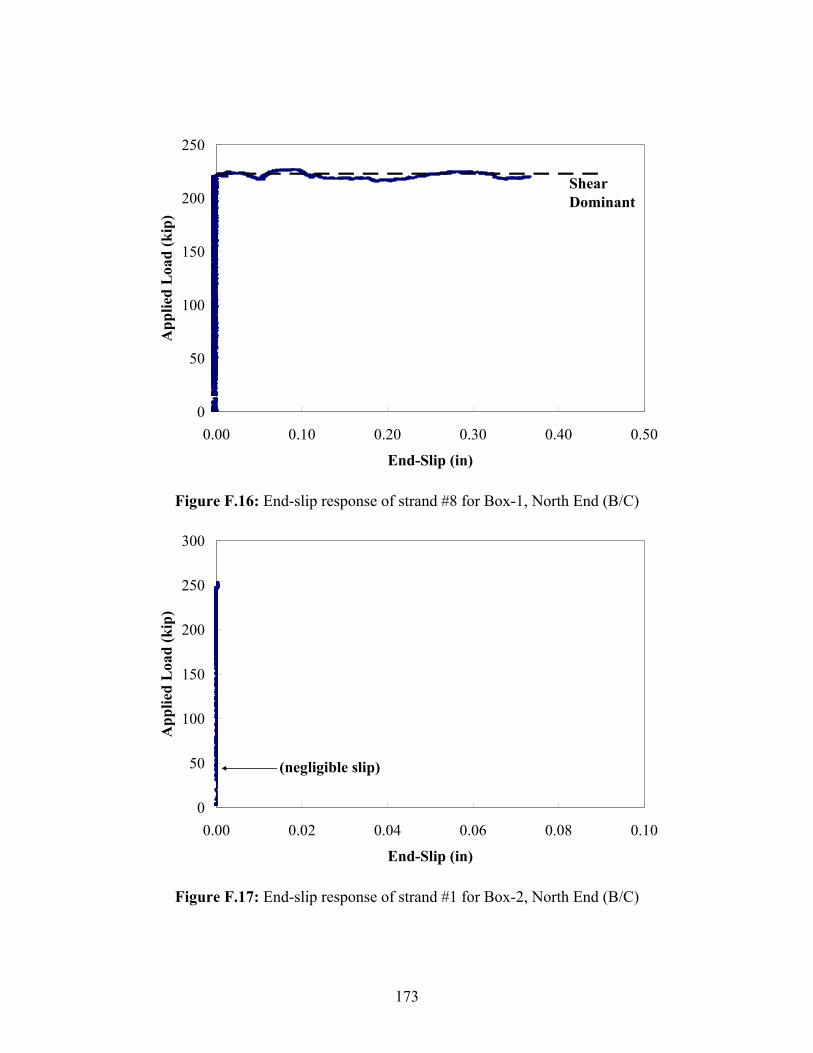
173
0
50
100
150
200
250
0.00 0.10 0.20 0.30 0.40 0.50
End-Slip (in)
App
lied
Loa
d (k
ip)
ShearDominant
Figure F.16: End-slip response of strand #8 for Box-1, North End (B/C)
0
50
100
150
200
250
300
0.00 0.02 0.04 0.06 0.08 0.10
End-Slip (in)
App
lied
Loa
d (k
ip)
(negligible slip)
Figure F.17: End-slip response of strand #1 for Box-2, North End (B/C)
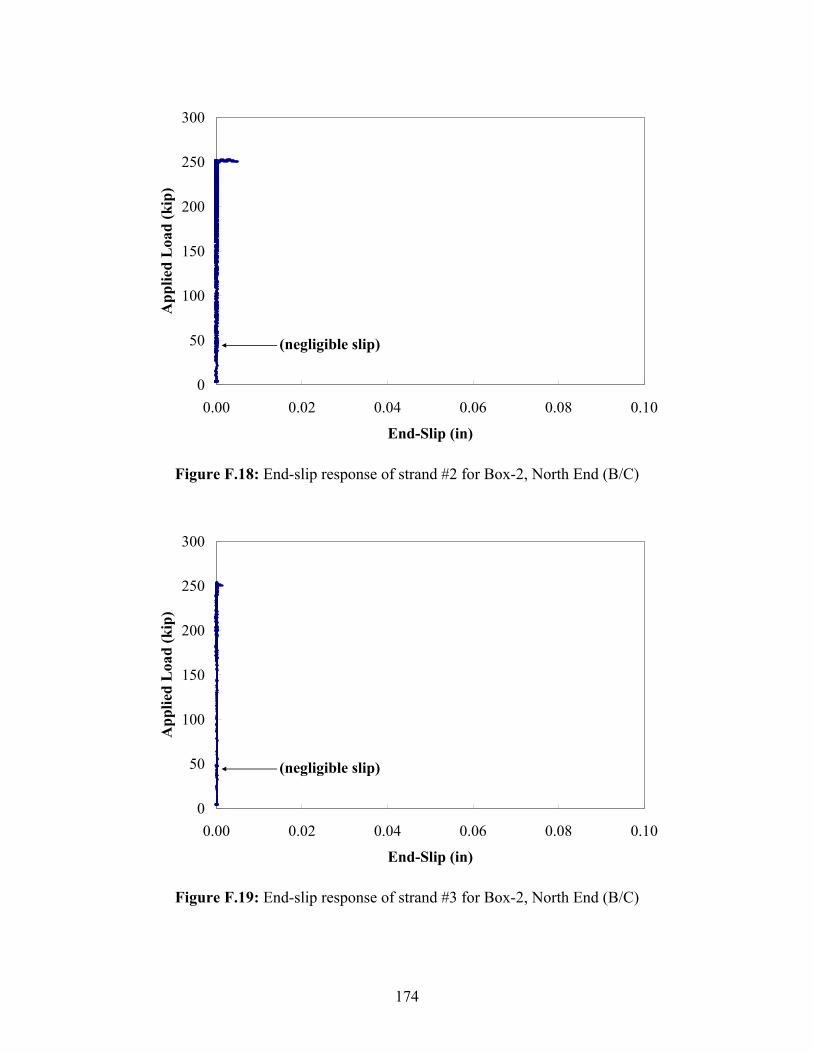
174
0
50
100
150
200
250
300
0.00 0.02 0.04 0.06 0.08 0.10
End-Slip (in)
App
lied
Loa
d (k
ip)
(negligible slip)
Figure F.18: End-slip response of strand #2 for Box-2, North End (B/C)
0
50
100
150
200
250
300
0.00 0.02 0.04 0.06 0.08 0.10
End-Slip (in)
App
lied
Loa
d (k
ip)
(negligible slip)
Figure F.19: End-slip response of strand #3 for Box-2, North End (B/C)

175
0
50
100
150
200
250
300
0.00 0.02 0.04 0.06 0.08 0.10
End-Slip (in)
App
lied
Loa
d (k
ip)
Figure F.20: End-slip response of strand #4 for Box-2, North End (B/C)
0
50
100
150
200
250
300
0.00 0.02 0.04 0.06 0.08 0.10
End-Slip (in)
App
lied
Loa
d (k
ip)
Figure F.21: End-slip response of strand #5 for Box-2, North End (B/C)
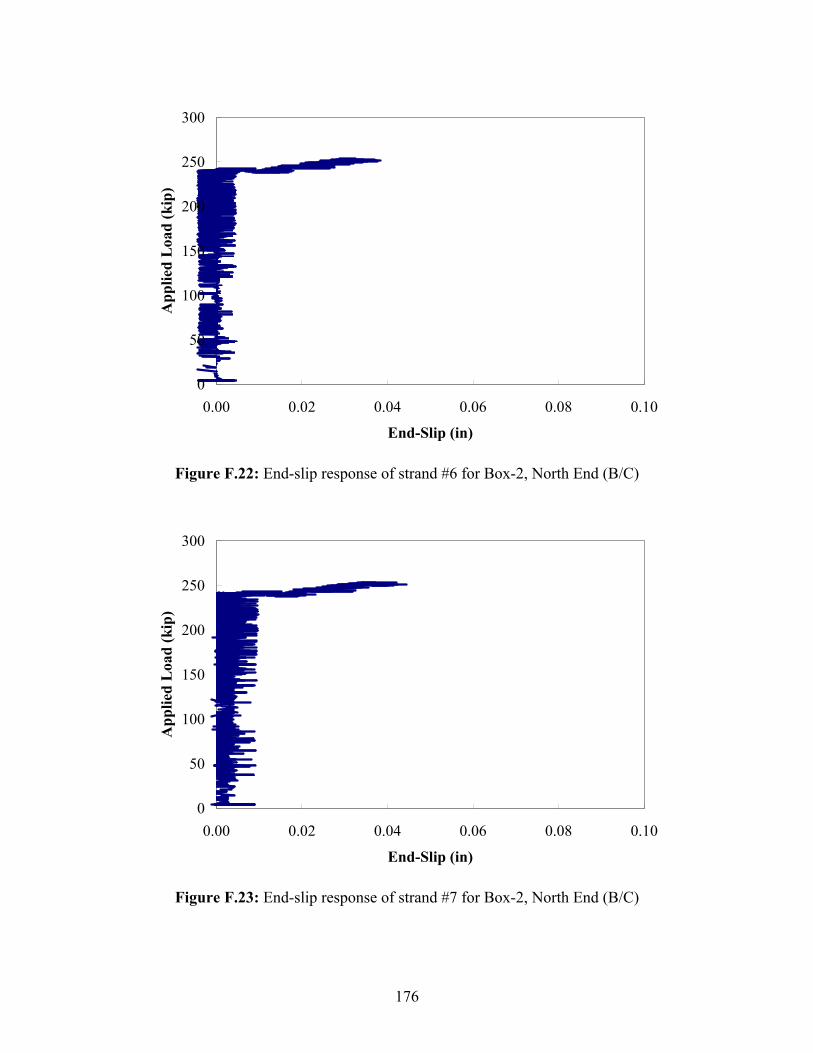
176
0
50
100
150
200
250
300
0.00 0.02 0.04 0.06 0.08 0.10
End-Slip (in)
App
lied
Loa
d (k
ip)
Figure F.22: End-slip response of strand #6 for Box-2, North End (B/C)
0
50
100
150
200
250
300
0.00 0.02 0.04 0.06 0.08 0.10
End-Slip (in)
App
lied
Loa
d (k
ip)
Figure F.23: End-slip response of strand #7 for Box-2, North End (B/C)
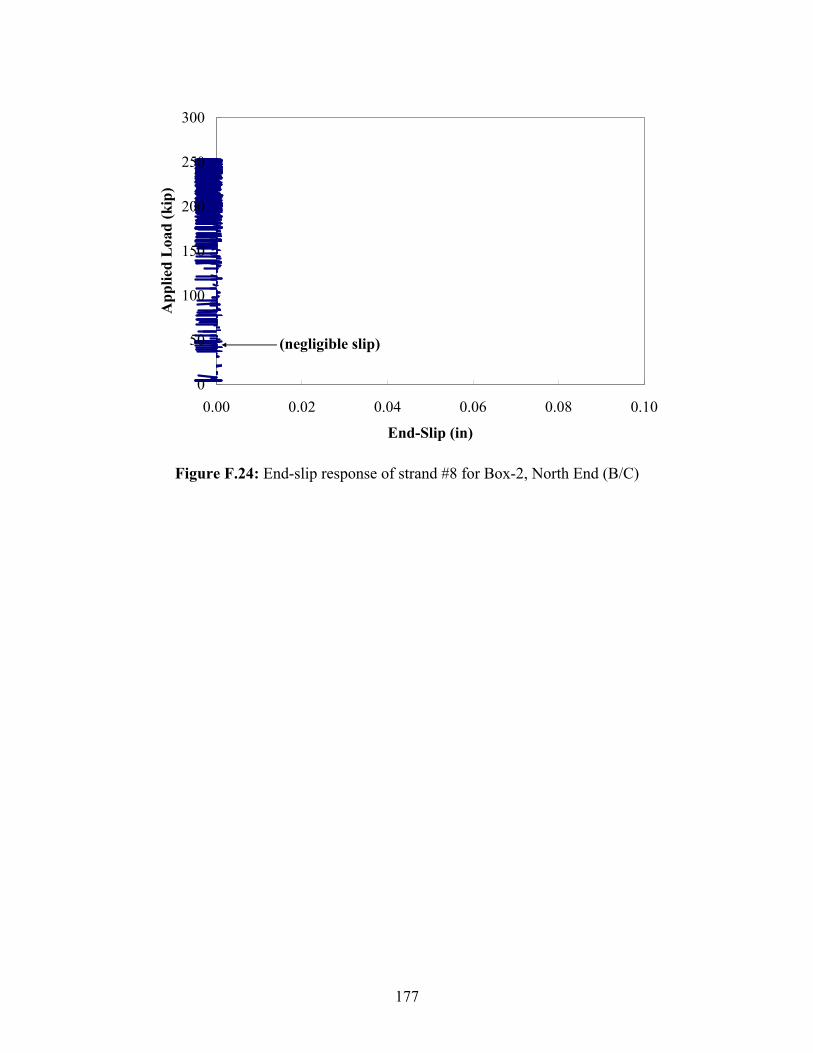
177
0
50
100
150
200
250
300
0.00 0.02 0.04 0.06 0.08 0.10
End-Slip (in)
App
lied
Loa
d (k
ip)
(negligible slip)
Figure F.24: End-slip response of strand #8 for Box-2, North End (B/C)


