
Overview of the Hyperion Imaging Spectrometer
for the NASA EO-1 Mission
J. Pearlman, S. Carman, C. Segal, P. Jarecke, and P. Barry, TRW
and W. Browne, NASA GSFC
IGARSS 2001JULY 9, 2001

2
Hyperion Imaging Spectrometer
Hyperion is a push-broom imager
• 220 10nm bands covering 400nm - 2500nm
• 6% absolute rad. accuracy• Swath width of 7.5 km• IFOV of 42.4 µradian• GSD of 30 m• 12-bit image data• Orbit is 705km alt (16 day
repeat)
3
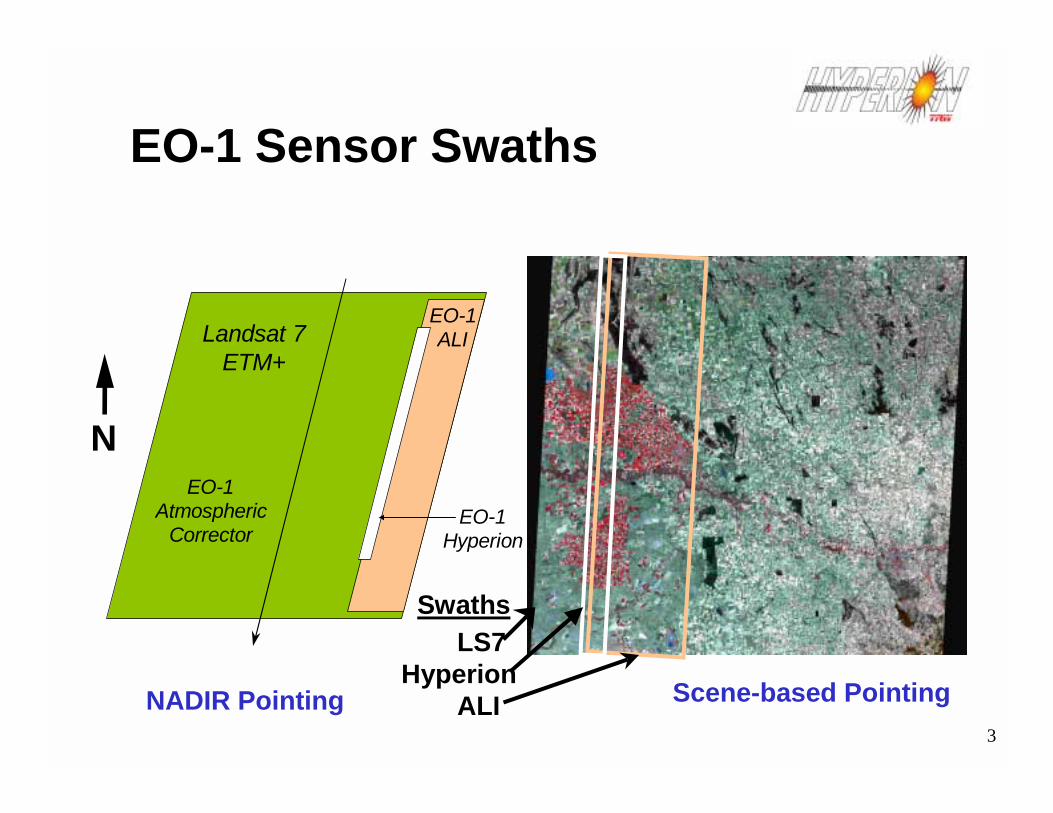
EO-1 Sensor Swaths
N
Landsat 7ETM+
EO-1ALI
EO-1Atmospheric
CorrectorEO-1
Hyperion
NADIR Pointing Scene-based PointingHyperion
Swaths
ALI
LS7

PERFORMANCE CHARACTERIZATION
A broad range of traditional and non-traditional techniques were used to characterize Hyperion

5
Desert Sites used for Vicarious CalibrationLake Frome Arizaro/Barreal BlancoRR Valley

6
Out of this World Calibration
Lunar image providesdirect-viewing radiometricmeasurements for calibrationwithout atmospheric effects.
Issues of the lunar model andanalysis techniques are beingaddressed
Hyperion imageof the moon
courtesy of P. Barry & H. Kieffer

7
Special targets for characterization
Searchlights-California
Planets-Venus
Gas Flares-Moomba 90 deg
Yaw

8
Hyperion SNR
550 nm 650 nm 700 nm 1025 nm 1225 nm 1575 nm 2125 nm161 144 147 90 110 89 40
Hyperion Measured SNR
0
50
100
150
200
400 700 1000 1300 1600 1900 2200 2500Wavelength (nm)
SNR
MeasuredVNIR ModelSWIR Model
Radiometric performance model basedon 60o Solar zenith angle, 30% albedo, standard scene

9
Hyperion CharacteristicsCharacteristic Pre-launch Cal On-orbit CalGSD (m) 29.88 30.38Swath (km) 7.5 7.75No. of Spectral Channels 220 200 (L1 data)VNIR SNR (550-700nm) 144-161 140-190SWIR SNR (~1225nm) 110 96SWIR SNR (~2125nm) 40 38VNIR X-trk Spec. Error 2.8nm@655nm 2.2nmSWIR X-trk Spec. Error 0.6nm@1700nm 0.58Spatial Co-Reg: VNIR 18% @ Pix #126 *Spatial Co-Reg: SWIR 21% @ Pix #131 *Abs. Radiometry(1Sigma) <6% 3.40%VNIR MTF @ 630nm 0.22-0.28 0.23-0.27SWIR MTF @ 1650nm 0.25-0.27 0.28VNIR Bandwidth (nm) 10.19-10.21 *SWIR Bandwidth (nm) 10.08-10.09 *
* Consistent with Pre-Launch Calibration or not measured

APPLICATIONS
Evaluating space-basedhyperspectral imaging

11
Hyperion addresses a broad range of issues and world-wide sites
United States
Canada
Australia
Argentina
Minerals
ForestsAgriculture
Grasslands GlaciersDeserts
SaharaAntarctica

12
Mineral MapDetailed Talc-Tremolite Map
Hyperion Maps Mt. Fitton GeologyAutomatic mineral mapping algorithm creates, in 30 seconds, a quick-look mineral map (left & centre). More precise detail is on right. (Courtesy of CSIRO Australia)
Colours to the right indicate the relative abundance of talc/tremolite .
Red shows areas of greatest abundance and blue shows the least.
2.1 2.32.2Wavelength(microns)
Coloursof spectra match the thematic image to left.
Mineral Spectra
13
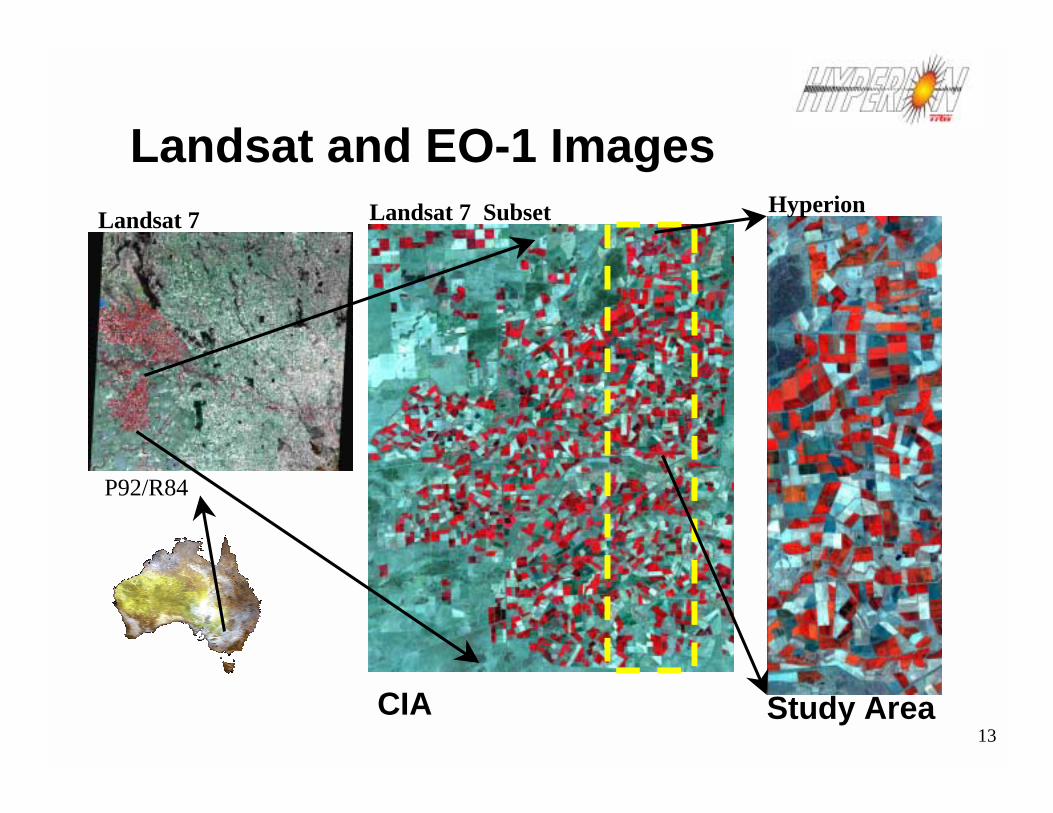
Landsat and EO-1 Images
P92/R84
CIA Study Area
Landsat 7 SubsetLandsat 7Hyperion

14
Temporal Sequence of Hyperion Images
Day 001 Day 072Day 065Day 033
A
B
C
E
D
SOIL
SOIL
SOY
RICE
CORN
Julian calendar days of 2001
Coleambally Irrigation Area
15
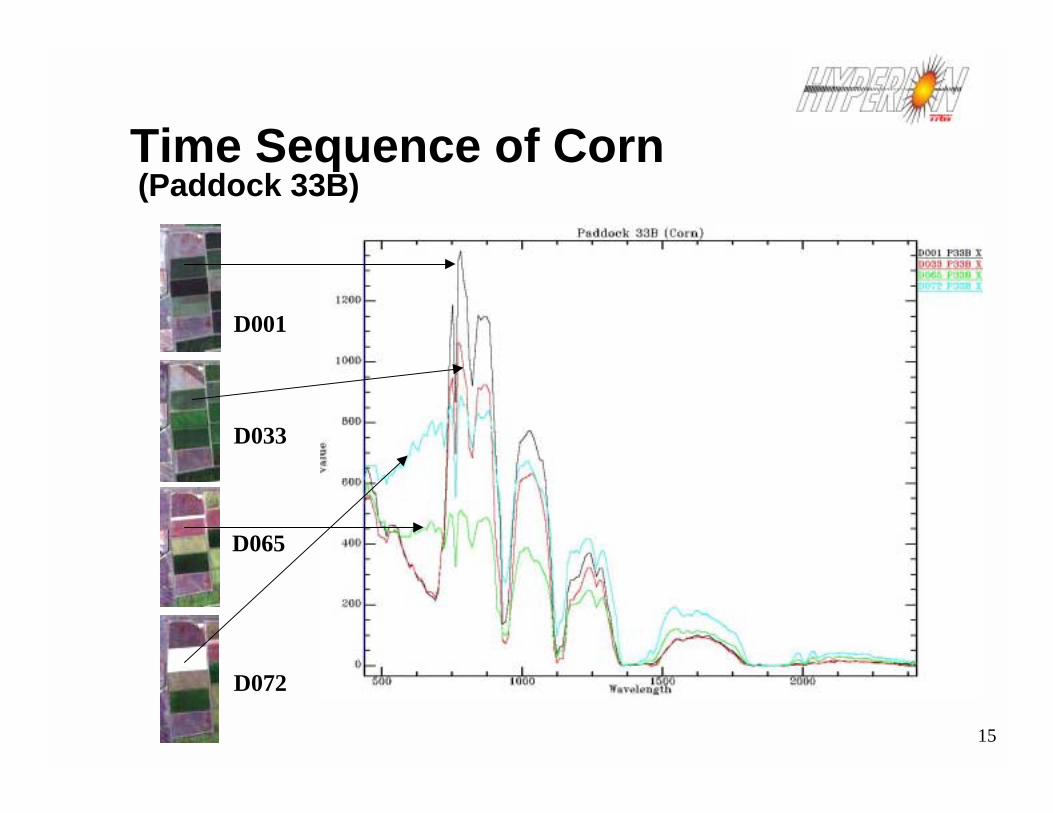
Time Sequence of Corn
D001
D033
D065
D072
(Paddock 33B)
16
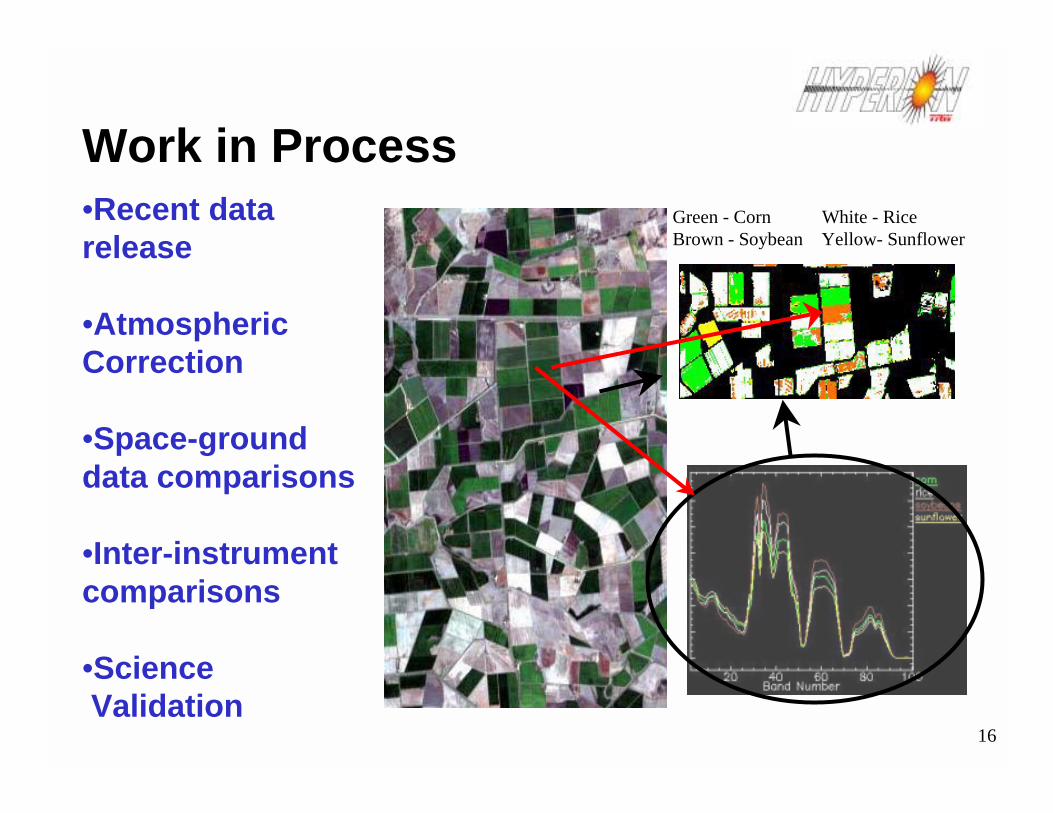
Work in ProcessGreen - Corn White - RiceBrown - Soybean Yellow- Sunflower
•Recent data release
•Atmospheric Correction
•Space-ground data comparisons
•Inter-instrument comparisons
•ScienceValidation

17
Ground Data Teams
18
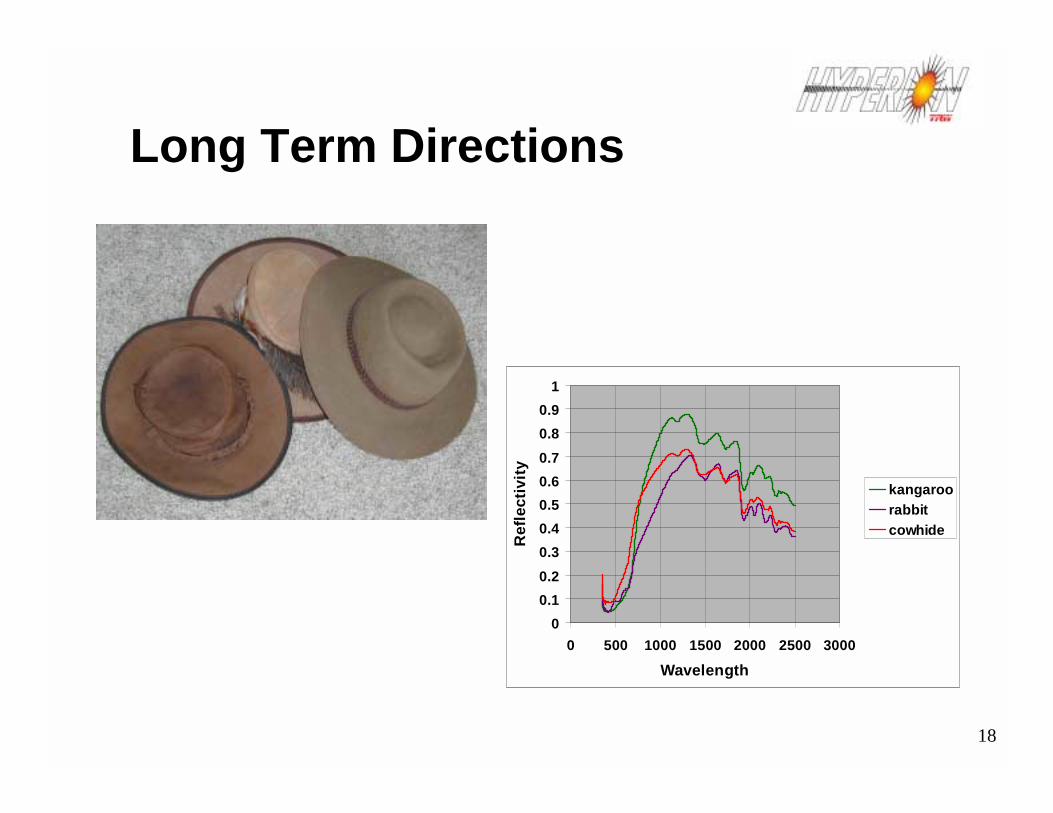
Long Term Directions
00.10.20.30.40.50.60.70.80.9
1
0 500 1000 1500 2000 2500 3000
Wavelength
Ref
lect
ivity
kangaroorabbitcowhide

Backup
20
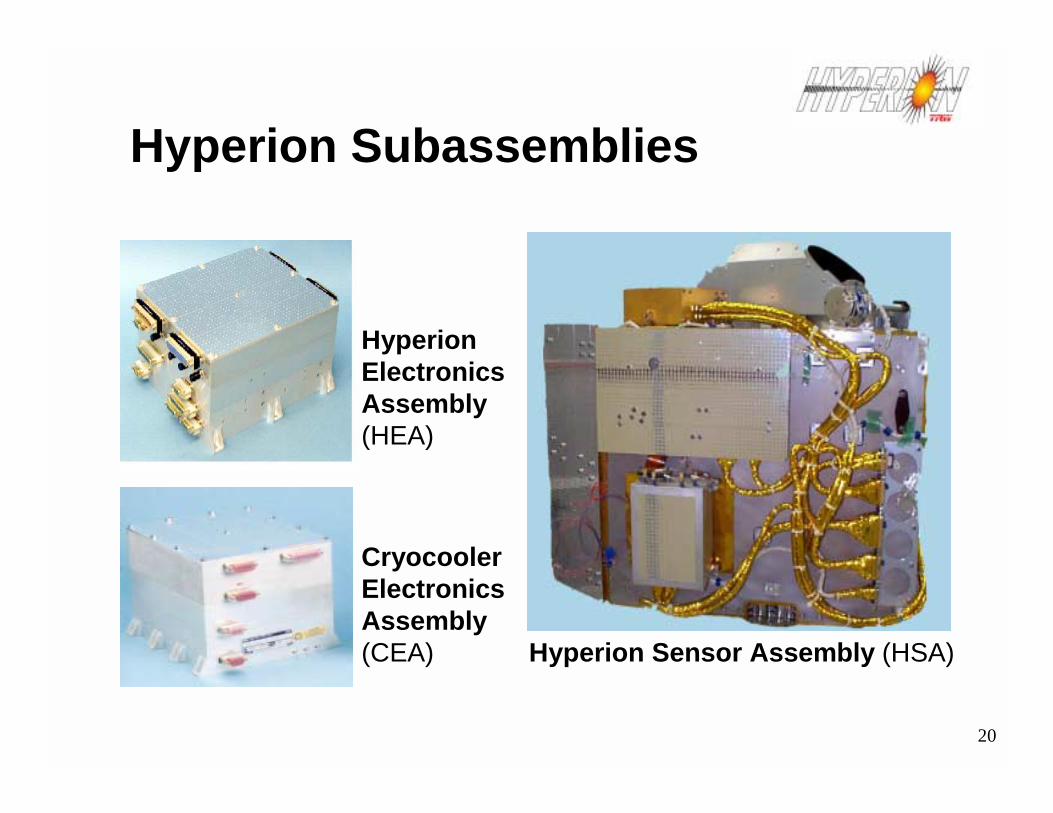
Hyperion Subassemblies
HyperionElectronics Assembly(HEA)
CryocoolerElectronicsAssembly(CEA) Hyperion Sensor Assembly (HSA)

21

22
Less Than 1 Minute
185 km
36 km 7.7 km
Landsat MultispectralImages(185 km @ 30 m)
705 km Altitude
Multispectral Images (36 km @ 30 m)
Hyperspectral Atmospheric Correction (185 km @ 125 / 250 m)
Grating-based Hyperspectral Images (7.5 km @ 30 m)
Landsat-7 EO-1
EO-1 Orbit• EO-1 Spacecraft launched November 21, 2000 from
Vandenberg Air Force Base• EO-1 orbit is one minute behind Landsat-7
23
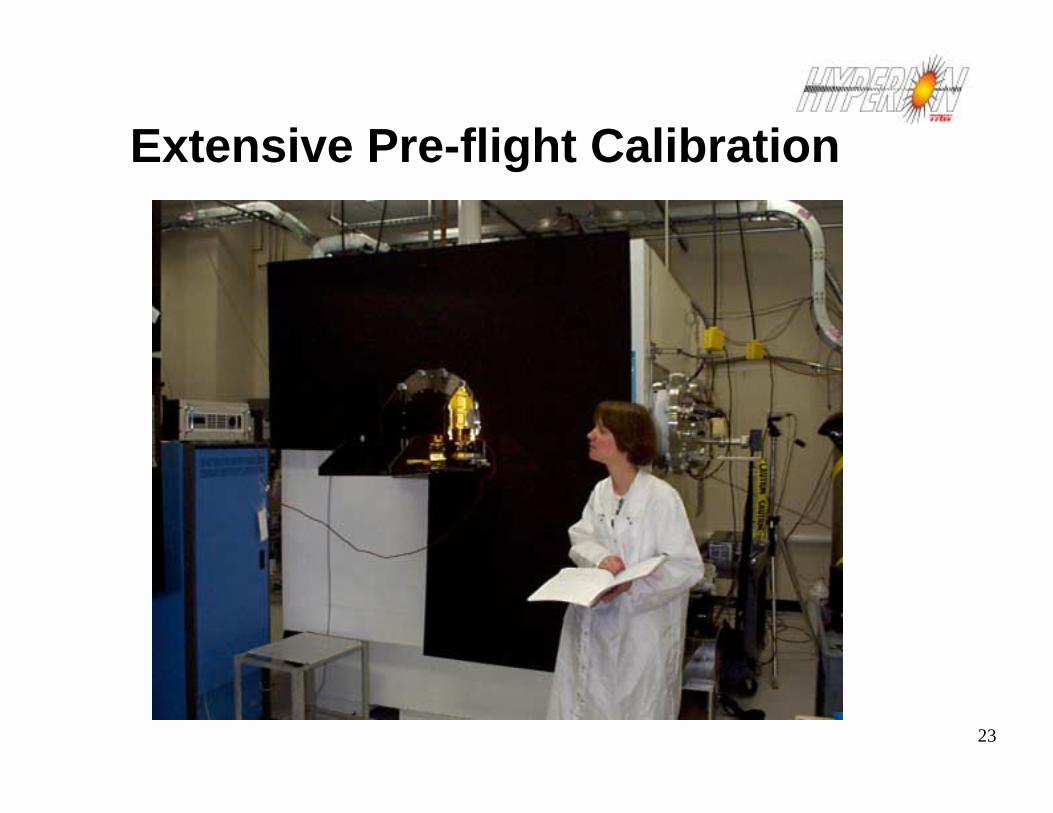
Extensive Pre-flight Calibration

24
Lake Frome Calibration Site

25
Hyperion Spectral Calibration –
800 1000 1200 1400 1600 1800 2000 2200 2400 2600 10
-1
100
101
102
103
Identification of Spectral Features
Wavelength (nm)
S CAL E D S PE CT RUM
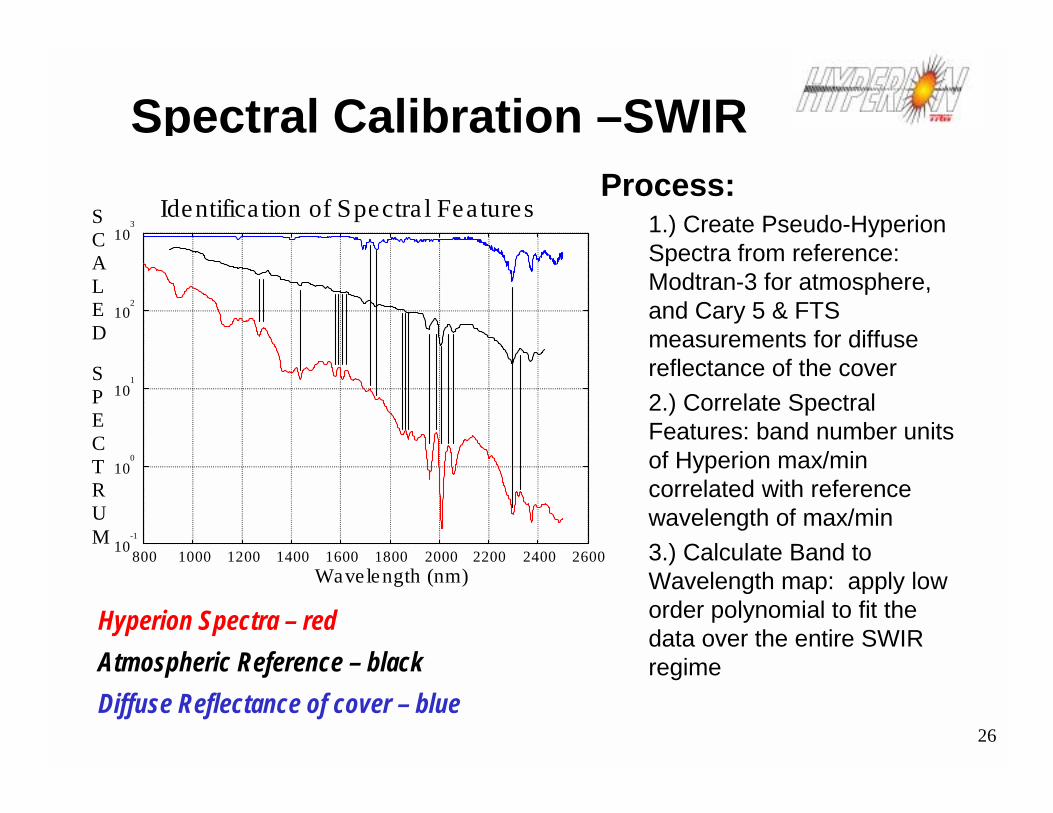
Hyperion Spectra – red
Atmospheric Reference – black
Diffuse Reflectance of cover – blue
atmospheric absorption lines
26
Spectral Calibration –SWIR
800 1000 1200 1400 1600 1800 2000 2200 2400 260010
-1
10 0
10 1
10 2
10 3
Identifica tion of Spectra l Fea tures
Wavelength (nm)
S C A L E D S P E C T R U M
Hyperion Spectra – redAtmospheric Reference – blackDiffuse Reflectance of cover – blue
Process:1.) Create Pseudo-Hyperion Spectra from reference: Modtran-3 for atmosphere, and Cary 5 & FTS measurements for diffuse reflectance of the cover2.) Correlate Spectral Features: band number units of Hyperion max/min correlated with reference wavelength of max/min3.) Calculate Band to Wavelength map: apply low order polynomial to fit the data over the entire SWIR regime

27
MTF Approach
• Calculate cross-track and in-track MTF using a step response and impulse response example
• Results of on-orbit analysis give good agreement with the pre-launch laboratory measurements

28
Example: Cross-track MTF– Scene is Port Eglin from Dec 24, 2000. Bridge is the Mid-bay bridge .
Bridge width is 13.02 meters.– Bridge angle to the S/C direction is small so every 5th line is used to
develop the high resolution bridge image.– MTF result at Nyquist is between 0.39 to 0.42 while the pre-flight
measurement was 0.42.
-10 -5 0 5 100
50
100
150
200
250
Inte rlaced bridge images and curve -fit from band 30
line 220 line 225 line 230 line 235 line 240 Curve -Fit
Cross-track pixel
10 *
Rad
ianc
e

29
Hyperion Maps Mt. Fitton Geology
Hyperion surface composition map agrees with known geology of Mt. Fitton in South Australia
(1) Published Geologic Survey Map(2) Hyperion three color image (visible) showing regions of interest(3) Hyperion surface composition map using SWIR spectra above
(1) (2) (3)
Hyperion Spectra Reference Spectra
(a) (b)
Hyperion-based apparent reflectance compares with library reference spectra
Courtesy of CSIRO, Australia
30
VNIR/SWIR Repeatability
• Solar Calibration demonstrates good pixel-to-pixel repeatability– VNIR is highly repeatable - <0.05% variation– SWIR is repeatable - <0.75% variation
• Spectral Calibration indicates stability based on comparisons of Pre-launch and On-Orbit measurements

DATA CHARACTERISTICS

32
Final product: level 1 data, metadata file
attached
Hyperion Data Flow
L0 Science data
TRWHyperion processing
Raw or GSFC processed data
TRW functionor product
Level 1 Science data
to GSFC
Ancillary data in engineering units
Science Data: Level 0 or Level 1 (radiometrically corrected) data products with VNIR and SWIR data frames combined. Includes solar, lunar calibrations, earth images, dark and light calibrations
Metadata: Data about the science data. Information to support higher level processing, e.g., pre-flight characterization data
Ancillary Data:Supporting data derived from spacecraft telemetry during image collection
GSFC L0 Proc.
METADATA
33
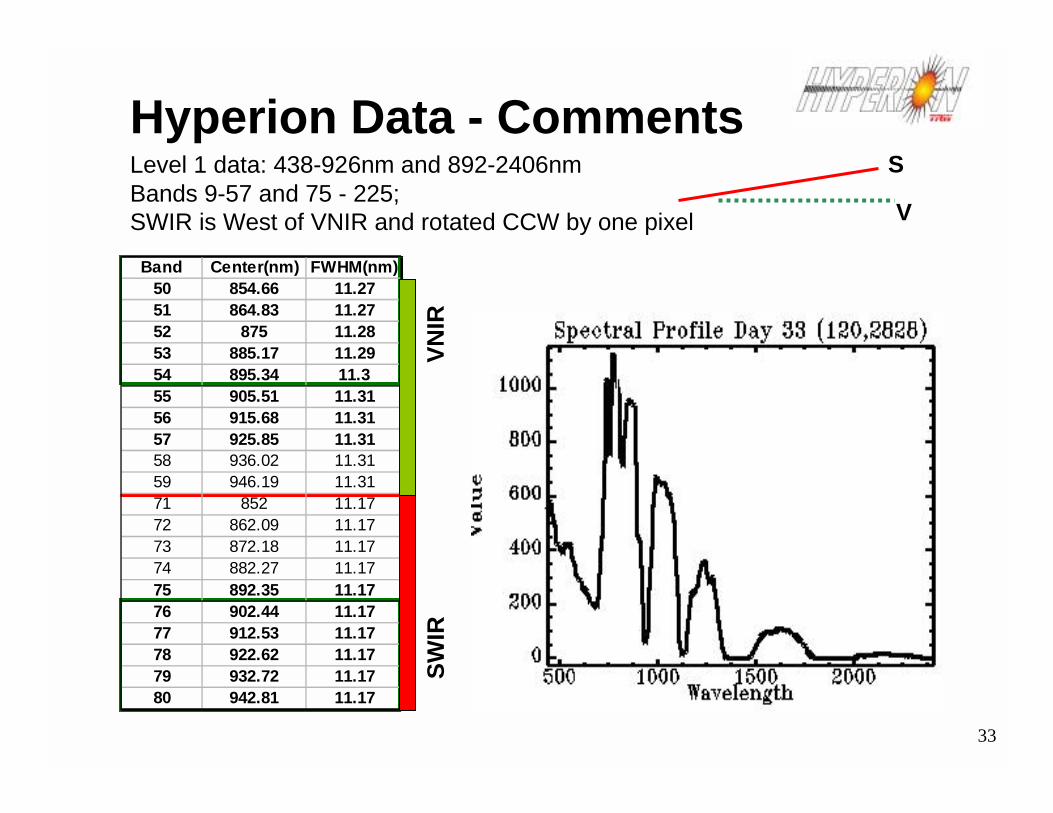
Hyperion Data - Comments
SWIR
VNIR
Band Center(nm) FWHM(nm)50 854.66 11.2751 864.83 11.2752 875 11.2853 885.17 11.2954 895.34 11.355 905.51 11.3156 915.68 11.3157 925.85 11.3158 936.02 11.3159 946.19 11.3171 852 11.1772 862.09 11.1773 872.18 11.1774 882.27 11.1775 892.35 11.1776 902.44 11.1777 912.53 11.1778 922.62 11.1779 932.72 11.1780 942.81 11.17
V
SLevel 1 data: 438-926nm and 892-2406nmBands 9-57 and 75 - 225;SWIR is West of VNIR and rotated CCW by one pixel


