Download - Online measurement-and-strategy-report-2011

Market Data / Supplier Selection / Event Presentations / User Experience Benchmarking / Best Practice /
Template Files /
Online Measurement and Strategy Report 2011
in association with Lynchpin

Online Measurement and Strategy Report 2011 in association with Lynchpin
Econsultancy London
4th Floor, The Corner
91-93 Farringdon Road
London EC1M 3LN
United Kingdom
Telephone:
+44 (0)20 7269 1450
http://econsultancy.com
Econsultancy New York
41 East 11th St., 11th Floor
New York, NY 10003
United States
Telephone:
+1 212 699 3626
All rights reserved. No part of this publication may be
reproduced or transmitted in any form or by any means,
electronic or mechanical, including photocopy, recording
or any information storage and retrieval system, without
prior permission in writing from the publisher.
Copyright © Econsultancy.com Ltd 2011
Published June 2011

Online Measurement and Strategy Report 2011in association with Lynchpin
All rights reserved. No part of this publication may be reproduced or transmitted in any form or by any means, electronic or mechanical, including photocopy, recording or any information storage
and retrieval system, without prior permission in writing from the publisher. Copyright © Econsultancy.com Ltd 2011
Contents
1. About Econsultancy ......................................................... 1
2. About Lynchpin (research sponsor) ................................ 2
3. Executive Summary and Highlights ................................ 3
4. Introduction ..................................................................... 6
4.1. Introduction by Lynchpin ........................................................... 6
5. Methodology and Sample ................................................ 7
6. Findings ........................................................................... 8
6.1. Information requirements .......................................................... 8
6.1.1. Which data requirements are business priorities? .................................... 10
6.2. Business performance and measurement tools ........................ 13
6.2.1. Use of business performance tools ............................................................. 13
6.2.2. Measuring online reputation and social media activity ............................. 15
6.2.3. Use of enterprise web analytics technologies ............................................. 17
6.2.4. Selecting an appropriate web analytics tool ............................................... 19
6.2.5. Interaction with online measurement tools .............................................. 20
6.2.6. Sharing online measurement data .............................................................. 21
6.3. Google Analytics ........................................................................ 22
6.3.1. Use of Google Analytics ............................................................................... 22
6.3.2. What is Google Analytics used for? ............................................................. 24
6.3.3. Frequency of Google Analytics usage (compared to other tool) ................ 25
6.3.4. Reasons for using additional paid-for analytics tools ................................ 26
6.3.5. Reasons for not using Google Analytics ...................................................... 27
6.3.6. Tools used for reporting or insight (Google or other vendor) ................... 28
6.3.7. ROI from paid-for analytics tool ................................................................. 31
6.4. Resourcing and budget ............................................................. 32
6.4.1. Number of dedicated web analysts ............................................................. 32
6.4.2. Number of regular contractors .................................................................... 33
6.4.3. Days of outsourced analysis ........................................................................ 34
6.4.4. Outsourced analytics functions ................................................................... 35
6.4.5. Web analytics resourcing (increase or decrease) ....................................... 36
6.4.6. Total web analytics spend ............................................................................ 37
6.4.7. Breakdown of web analytics expenditure ................................................... 38
6.4.8. Annual change in web analytics budget ...................................................... 39
6.4.9. Ownership of budget .................................................................................... 42
6.5. Joined-up strategy and measurement ...................................... 44
6.5.1. Company-wide strategy ............................................................................... 44

Online Measurement and Strategy Report 2011in association with Lynchpin
All rights reserved. No part of this publication may be reproduced or transmitted in any form or by any means, electronic or mechanical, including photocopy, recording or any information storage
and retrieval system, without prior permission in writing from the publisher. Copyright © Econsultancy.com Ltd 2011
6.5.2. Driving actionable recommendations from analytics ................................ 46
6.5.3. Percentage of useful data .............................................................................48
6.5.4. Integration into broader business strategy ................................................ 50
6.5.5. Integration of analytics data with data from other sources ....................... 52
6.5.6. Analysing customer journeys that cross online and offline ....................... 55
6.5.7. Barriers preventing frameworks for analysing online and offline data .... 56
6.5.8. Attribution modelling .................................................................................. 58
6.6. Barriers to success ..................................................................... 59
6.6.1. Barriers preventing an effective online measurement strategy ................ 59
6.6.2. Main frustrations involved in managing web analytics ............................. 61
7. Appendix ........................................................................ 63
7.1. Respondent profiles .................................................................. 63
7.1.1. Company turnover ....................................................................................... 64
7.1.2. Business sector ............................................................................................. 65
7.1.3. B2B or B2C focus ......................................................................................... 65
7.1.4. Type of supply-side company ...................................................................... 66
7.1.6. Geography .................................................................................................... 67

Online Measurement and Strategy Report 2011–in association with Lynchpin
Page 1
All rights reserved. No part of this publication may be reproduced or transmitted in any form or by any means, electronic or mechanical, including photocopy, recording or any information storage
and retrieval system, without prior permission in writing from the publisher. Copyright © Econsultancy.com Ltd 2011
1. About Econsultancy
Econsultancy is a digital publishing and training group used by more than 200,000 Internet professionals every month.
The company publishes practical and time-saving research to help marketers make better decisions about the digital environment, build business cases, find the best suppliers, look smart in meetings and accelerate their careers.
Econsultancy has offices in New York and London, and hosts more than 100 events every year in the US and UK. Many of the world's most famous brands use Econsultancy to educate and train their staff.
Some of Econsultancy‟s members include: Google, Yahoo, Dell, BBC, BT, Shell, Vodafone, Virgin Atlantic, Barclays, Deloitte, T-Mobile and Estée Lauder.
Join Econsultancy today to learn what‟s happening in digital marketing – and what works.
Call us to find out more on +1 212 699 3626 (New York) or +44 (0)20 7269 1450 (London). You can also contact us online.

Online Measurement and Strategy Report 2011–in association with Lynchpin
Page 2
All rights reserved. No part of this publication may be reproduced or transmitted in any form or by any means, electronic or mechanical, including photocopy, recording or any information storage
and retrieval system, without prior permission in writing from the publisher. Copyright © Econsultancy.com Ltd 2011
2. About Lynchpin (research sponsor) Lynchpin is an independent web analytics consultancy. Since 2005, we've been unlocking the
power of data to help our clients meet their online objectives.
Lynchpin matches commercial experience with technical expertise at every stage of the analytics
journey. We're equally at home providing a complete outsourced analytics function as supporting
experienced in-house analyst teams.
We forge genuine partnerships with our clients. Lynchpin works with Turner Broadcasting,
HSBC, Experian Interactive, Cadbury, Lloyds Banking Group, 3i and Apex Hotels amongst others.
Our Services:
Planning: Consultancy
We plan web analytics strategies with the right metrics, processes and technologies. Then we
empower teams to make insight core to their ongoing success
Measuring: Technology
We get the most out of web analytics technology. Vendor neutral, flexible and capable - we find or
build the right tools for the job.
Discovering: Analytics
We deliver results that matter: actionable insight, continuous performance improvement, the
right information to the right people at the right time.
Please visit our website www.lynchpin.com to find out more, or contact us on 0845 838 1136.

Online Measurement and Strategy Report 2011–in association with Lynchpin
Page 3
All rights reserved. No part of this publication may be reproduced or transmitted in any form or by any means, electronic or mechanical, including photocopy, recording or any information storage
and retrieval system, without prior permission in writing from the publisher. Copyright © Econsultancy.com Ltd 2011
3. Executive Summary and Highlights This is the fourth annual Online Measurement and Strategy Report published by
Econsultancy in association with Lynchpin.
The research is based on a survey of more than 800 companies (including both „client-side‟ organisations and agencies) which was carried out in March and April 2011.
Key findings:
Companies continue to wrestle with a joined-up approach to data collection and
analysis, which incorporates web data into broader business strategy. Only a
minority of companies have common KPIs (key performance indicators) for
online and offline data.
– Disappointingly, fewer companies than last year say they have a company-wide strategy in
place that ties data collection and analysis to business objectives (22% compared to 25%
last year). Only 28% of respondents say that web analytics definitely drive actionable
recommendations that make a difference to their organisation, down from 31% last year.
– 41% of companies say they have common key performance indicators (KPIs) for web and
non-web data, while just 19% have common teams and processes for web and non-web
data.
– Only 22% of companies have a framework for analysing customer journeys that cross
online and offline, while a similar proportion (24%) of responding organisations carry out
attribution modelling to give more insight into the relationship between different
channels.
– But it is encouraging to see that more companies than last year (46% versus 41%) are
analysing data which sheds light on the interaction between online and offline.
Reliance on Google Analytics (GA) continues to grow, but many companies still
prefer to use their other analytics vendor for a range of reporting requirements.
– The proportion of companies using Google exclusively for web analytics now stands at 44%,
up from 38% in 2010 and only 23% in 2009. Only 13% of responding companies don’t use
Google Analytics, while the remainder continue to use Google and a paid-for analytics tool
simultaneously.
– Those companies using both Google and a paid-for analytics tool are more likely to use GA
for PPC optimisation, site search usage and campaign tracking.
– But these companies are more likely to use their other, paid-for vendor for traffic and
conversion KPIs, funnel / conversion optimisation, page flow / navigation analysis,
management reporting, content influence, rich media / flash / video tracking and product
/ cross-sell analysis.
– This group of companies are split evenly in terms of whether they use Google Analytics
(43%) or their other vendor (43%) more frequently.
– Nearly half (48%) of companies using a paid-for tool as well as Google say they do so
because the free tool isn’t sophisticated enough for their requirements.
Companies plan to bolster their resourcing of data analysis for both in-house
staff and outsourced analysts. Companies are more likely than last year to be
increasing budgets for consulting and other third-party services relating to web
analytics.
– 42% of companies are planning to increase the number of employees dedicated to data
analysis over the next 12 months, while a third (31%) are planning for more outsourced
analysis.

Online Measurement and Strategy Report 2011–in association with Lynchpin
Page 4
All rights reserved. No part of this publication may be reproduced or transmitted in any form or by any means, electronic or mechanical, including photocopy, recording or any information storage
and retrieval system, without prior permission in writing from the publisher. Copyright © Econsultancy.com Ltd 2011
– Those outsourcing analytics functions are most likely to do so for analysis and
optimisation (52%), strategic consultancy (47%) and implementation support (41%).
– The proportion of companies spending more than £100,000 a year on web analytics has
increased from 9% to 14%.
– 38% of companies are planning to increase web analytics technology spend over the next
year, down slightly from 41% who answered this way in 2010. Some 40% of companies are
planning to increase spending on internal staff, also down slightly on 2010 (44%).
However, the proportion of companies planning to increase budget for consulting and
services now stands at 37%, up from 30% last year.
The number of companies interested in measuring their online reputation and
social media activity continues to grow.
– The proportion of companies who say they analyse reputation, buzz and social media
metrics has significantly increased. Over half of companies (55%) are now analysing this,
compared to 45% of responding organisations in 2010.
– More companies are interested in listening to the voice of the customer, and in measuring
and benchmarking social media activity. The proportion of companies who have paid for
buzz monitoring tools has increased significantly, up to 41% in 2011 from 30% in 2010.
– Companies are also starting to take a more integrated approach to social media
measurement, in terms of the tools they use. A third of companies (33%) now say they use a
combination of tools (including buzz monitoring software and web analytics technology) to
measure online reputation and social media activity. Last year only a quarter of companies
(24%) said they used a mixture of tools.
Financial and resourcing constraints still present the biggest problems, along
with a lack of co-ordination and absence of strategy.
– The biggest barrier preventing companies from having an effective online measurement
strategy is still lack of budget and resources, though significantly fewer companies than
last year cite this as one of the three most significant issues (48% compared to 57%).
– The next most widely cited barriers (as was the case last year) are lack of co-ordination /
siloed organisation (27%) and lack of strategy (also 27%).
– Difficulty in reconciling data (17%), finding staff (13%) and poor technology (16%) are all
significantly more widespread problems than they were a year ago.

Online Measurement and Strategy Report 2011–in association with Lynchpin
Page 5
All rights reserved. No part of this publication may be reproduced or transmitted in any form or by any means, electronic or mechanical, including photocopy, recording or any information storage
and retrieval system, without prior permission in writing from the publisher. Copyright © Econsultancy.com Ltd 2011
Related reports, training and events
Reports:
Web Analytics Buyer‟s Guide
http://econsultancy.com/reports/web-analytics-buyers-guide
Multivariate Testing Buyer‟s Guide
http://econsultancy.com/reports/multivariate-testing-mvt-buyers-guide
Econsultancy / RedEye Conversion Report
http://econsultancy.com/reports/conversion-report
Econsultancy / Tealeaf Reducing Customer Struggle report
http://econsultancy.com/uk/reports/reducing-customer-struggle
Marketing Budgets Report 2011
http://econsultancy.com/reports/marketing-budgets
Value of Social Media Report
http://econsultancy.com/reports/value-of-social-media-report
Achieving Digital Balance
http://econsultancy.com/reports/achieving-digital-balance-best-practices-for-mastering-digital-strategy-and-
budgets
Web Analytics – Digital Marketing Template files
http://econsultancy.com/reports/web-analytics-digital-marketing-template-files
Web Analytics: A Beginner‟s Guide:
http://econsultancy.com/reports/web-analytics-a-beginner-s-guide
Web Analytics Statistics
http://econsultancy.com/reports/web-analytics-statistics
Web Analytics Request for Proposal
http://econsultancy.com/reports/web-analytics-request-for-proposal-rfp
Training:
Web Measurement and Analytics Training:
http://econsultancy.com/training/courses/web-measurement-analytics
Online Measurement and Strategy Report 2011–in association with Lynchpin
Page 6
All rights reserved. No part of this publication may be reproduced or transmitted in any form or by any means, electronic or mechanical, including photocopy, recording or any information storage
and retrieval system, without prior permission in writing from the publisher. Copyright © Econsultancy.com Ltd 2011
4. Introduction
4.1. Introduction by Lynchpin
Lynchpin is proud to sponsor this ongoing research into online measurement and strategy, a topic
naturally close to our hearts as a web analytics consultancy.
The results of this year‟s survey continue a story of great opportunity matched with a fair dose of
practical frustration.
As a discipline, web analytics is still experiencing some growing pains. The expectations for
insight on demand are ever-increasing; meanwhile data volumes continue to grow and start to
spread themselves across disparate sources, presenting new challenges to overcome.
With headcount of dedicated analysts growing, the focus now increasingly turns to process: how
to keep information flowing effectively around a business to drive decisions. Coordinating
technology and people remains a key point of friction in driving value from web data.
Getting the basics right is still a challenge equally worthy of focus. In the value chain of raw data
to actionable insight, the two most frequent points of failure tend to be failure to align KPIs with
business performance, and not collecting the right data in the first place through poor technology
implementation.
The first phase of consolidation of web analytics technology vendors looks to be reaching its
logical conclusion, with the number of major paid web analytics vendors yet again reduced by
mergers and acquisitions.
Google remains a powerful force in the analytics market. The extent of overlap and
complementary usage of Google Analytics alongside paid for tools hints at continuing functional
weaknesses in the paid-for toolsets set against increasing attention to data ownership.
Online measurement needs to reflect the significant growth of multichannel businesses, and here
we start to see the next phases of the market develop. Web analytics vendors are historically poor
at data flexibility. Meanwhile, traditional Business Intelligence vendors historically lack the mind-
set to deal effectively with clickstream data.
As web analytics comes of age, it needs to join-up both the online and the offline, and the
technical and the strategic. We look forward to playing our part in that process over the coming
year.
Andrew Hood
Managing Director
Lynchpin Analytics

Online Measurement and Strategy Report 2011–in association with Lynchpin
Page 7
All rights reserved. No part of this publication may be reproduced or transmitted in any form or by any means, electronic or mechanical, including photocopy, recording or any information storage
and retrieval system, without prior permission in writing from the publisher. Copyright © Econsultancy.com Ltd 2011
5. Methodology and Sample This is the fourth annual Online Measurement and Strategy Report published by Econsultancy in
association with Lynchpin.
There were more than 800 respondents to our research request, which took the form of an online
survey1 in March and April 2011.
Respondents included both client-side (in-house) organisations who measure their online activity
and supply-side respondents (i.e. agencies, vendors or consultants offering web analytics
services). The findings are shown for client-side (or „company respondents‟) and supply-side
(„agency respondents‟) participants separately.
Please see the appendix for more information about the profile of survey
respondents.
Information about the survey, including the link, was emailed to Econsultancy‟s user base. The
incentive for taking part was access to a complimentary copy of this report just before its
publication on the Econsultancy website. If you have any questions about the research, please
email Econsultancy‟s Research Director, Linus Gregoriadis ([email protected]).
1 Econsultancy uses Clicktools for its online surveys
Online Measurement and Strategy Report 2011–in association with Lynchpin
Page 8
All rights reserved. No part of this publication may be reproduced or transmitted in any form or by any means, electronic or mechanical, including photocopy, recording or any information storage
and retrieval system, without prior permission in writing from the publisher. Copyright © Econsultancy.com Ltd 2011
6. Findings
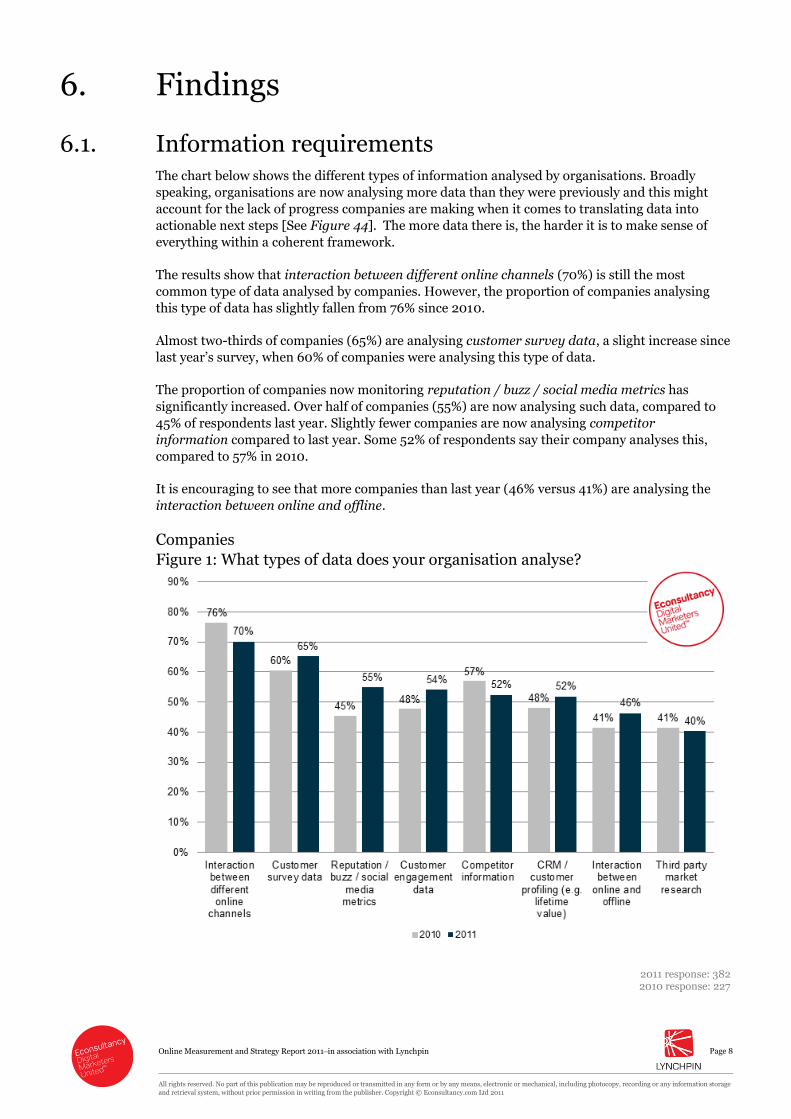
6.1. Information requirements The chart below shows the different types of information analysed by organisations. Broadly
speaking, organisations are now analysing more data than they were previously and this might
account for the lack of progress companies are making when it comes to translating data into
actionable next steps [See Figure 44]. The more data there is, the harder it is to make sense of
everything within a coherent framework.
The results show that interaction between different online channels (70%) is still the most
common type of data analysed by companies. However, the proportion of companies analysing
this type of data has slightly fallen from 76% since 2010.
Almost two-thirds of companies (65%) are analysing customer survey data, a slight increase since
last year‟s survey, when 60% of companies were analysing this type of data.
The proportion of companies now monitoring reputation / buzz / social media metrics has
significantly increased. Over half of companies (55%) are now analysing such data, compared to
45% of respondents last year. Slightly fewer companies are now analysing competitor
information compared to last year. Some 52% of respondents say their company analyses this,
compared to 57% in 2010.
It is encouraging to see that more companies than last year (46% versus 41%) are analysing the
interaction between online and offline.
Companies
Figure 1: What types of data does your organisation analyse?
2011 response: 382 2010 response: 227

Online Measurement and Strategy Report 2011–in association with Lynchpin
Page 9
All rights reserved. No part of this publication may be reproduced or transmitted in any form or by any means, electronic or mechanical, including photocopy, recording or any information storage
and retrieval system, without prior permission in writing from the publisher. Copyright © Econsultancy.com Ltd 2011
Over three-quarters of supply-side respondents (76%) say their clients are analysing the
interaction between different online channels, a significant increase from 2010, when only 64%
of companies were analysing this type of data [Figure 2].
Only 45% of agencies say their clients are analysing customer survey data, compared to 60% of
organisations surveyed.
The proportion of agencies who say their clients are analysing CRM / customer profiling data has
slightly fallen to 45% in 2011, down from 50% in 2010. However, more than half of supply-side
respondents (51%) say their clients are now analysing the interaction between online and offline,
compared to 44% in 2010.
The proportion of clients who are looking at third-party research data has also significantly
increased. Over a third of clients (37%) now analyse this type of data according to the agencies
surveyed. For comparison, in 2010, only 29% of agencies reported their clients analysed this type
of data.
Agencies (supply-side)
Figure 2: What types of data do your clients typically analyse?
2011 response: 274
2010 response: 195

Online Measurement and Strategy Report 2011–in association with Lynchpin
Page 10
All rights reserved. No part of this publication may be reproduced or transmitted in any form or by any means, electronic or mechanical, including photocopy, recording or any information storage
and retrieval system, without prior permission in writing from the publisher. Copyright © Econsultancy.com Ltd 2011
6.1.1. Which data requirements are business priorities?
The chart below indicates the extent to which different information requirements are regarded as
a business priority.
More than half of companies (57%) report that the cost of acquiring a customer or lead is high-
priority information, while just under half (49%) say that the impact of content on acquisition is
high priority.
It is interesting to note that businesses are most interested in understanding cost-per-acquisition,
which is an important but relatively short term metric. A fuller understanding of the customer
journey and lifetime value is less of a priority.
Just over a quarter of respondents (26%) say the relationship between online and offline is high
priority, while 30% say this is low priority.
Customer behaviour on partner sites is thought to be low priority by just under half of
responding companies (46%). Only 15% say this is high priority and, as Figure 3 shows, this has
fallen by 7% since last year‟s survey.
Information relating to drop-off across key site processes is deemed to be high priority by some
49% of companies, and thought to be medium priority by 39%. This is regarded as less important
in 2011 than last year, with the proportion of respondents saying this is a high priority having
dropped by 10% [Figure 4].
Benchmarking traffic has dropped down the list of business priorities. Some 7% fewer companies
than last year report this to be a high priority.
Companies
Figure 3: How much of a business priority are the following information
requirements?
Response: 385

Online Measurement and Strategy Report 2011–in association with Lynchpin
Page 11
All rights reserved. No part of this publication may be reproduced or transmitted in any form or by any means, electronic or mechanical, including photocopy, recording or any information storage
and retrieval system, without prior permission in writing from the publisher. Copyright © Econsultancy.com Ltd 2011
Figure 4: Proportion of respondents reporting information requirement is high
priority – change since 2010
The supply-side responses below show that 61% of agencies report the cost of acquiring a lead to
be a high business priority for clients. The impact of content on acquisition is deemed to be less
important for agency clients than companies themselves indicate.
Some 36% report this type of information as high priority for their clients, compared to just under
half (49%) of companies surveyed.
Only 17% of agencies deem customer behaviour on partner sites to be high priority for clients,
while 38% say this is medium priority and 44% say it is low priority.
Figure 6 shows the change since last year. The proportion of agencies deeming information
relating to performance versus competitors to be high priority for their clients has increased by
6%. The proportion of supply-side respondents reporting information about the customer
journey over multiple visits to be high priority has increased by 5%.

Online Measurement and Strategy Report 2011–in association with Lynchpin
Page 12
All rights reserved. No part of this publication may be reproduced or transmitted in any form or by any means, electronic or mechanical, including photocopy, recording or any information storage
and retrieval system, without prior permission in writing from the publisher. Copyright © Econsultancy.com Ltd 2011
Agencies (supply-side)
Figure 5: Typically, how much of a business priority are the following information
requirements for clients?
Response: 273
Figure 6: Proportion of respondents reporting information requirement is high
priority – change since 2010

Online Measurement and Strategy Report 2011–in association with Lynchpin
Page 13
All rights reserved. No part of this publication may be reproduced or transmitted in any form or by any means, electronic or mechanical, including photocopy, recording or any information storage
and retrieval system, without prior permission in writing from the publisher. Copyright © Econsultancy.com Ltd 2011
6.2. Business performance and measurement tools
6.2.1. Use of business performance tools
The chart below shows that businesses are more likely to be paying for a range of tools which
measure and optimise business performance. The availability of so many optimisation and
measurement tools is a great opportunity for businesses, but also presents challenges for
companies who want to have an integrated strategy for improving performance and measuring
progress.
As discussed above, an increase in data sources is not in itself useful for businesses, unless
information is harnessed effectively and seen in the context of robust, top-level KPIs.
Looking at the chart in more detail, more than two-thirds (67%) of companies have paid for
online survey tools as shown below. Over half of companies (57%) are now paying for media
planning or tools related to competitor analysis.
The proportion of companies who have paid for buzz monitoring tools has increased significantly,
up to 41% in 2011 from 30% in 2010. This indicates that more companies are interested in
listening to the voice of the customer, and in measuring and benchmarking social media activity.
Companies may also be beginning to see value from undertaking reputation monitoring.
On-site optimisation through feedback and testing is also becoming a more significant priority for
companies. Some 29% are now paying for multivariate testing, compared to 26% last year. The
proportion of companies paying for on-site feedback tools has risen to 29%, up from 20% in 2010.
This reinforces the trend of the increased importance of optimising the on-site experience by
listening to the voice of the customer.
Companies
Figure 7: Has your organisation paid for any of the following types of tools?
2011 response: 280 2010 response: 221

Online Measurement and Strategy Report 2011–in association with Lynchpin
Page 14
All rights reserved. No part of this publication may be reproduced or transmitted in any form or by any means, electronic or mechanical, including photocopy, recording or any information storage
and retrieval system, without prior permission in writing from the publisher. Copyright © Econsultancy.com Ltd 2011
The supply-side responses [Figure 8] indicate media analysis and buzz monitoring to be the
types of tool that clients are most likely to pay for. Over half of agencies (56%) say their clients are
now paying for online survey tools, slightly fewer than the proportion of companies.
Buzz and social media monitoring is deemed to be even more important for agencies than for
clients; some 60% of supply-side respondents say their clients are now paying for this technology,
compared to 41% of companies.
Agencies are seeing more evidence of paid-for mobile analytics with a fifth (20%) of supply-side
respondents saying their clients are now paying for this, up from 13% in 2010. Only 13% of
companies this year say they pay for mobile analytics tools, up just a single percentage point since
2010.
Agencies
Figure 8: Do your clients pay for any of the following types of tools?
2011 response: 225 2010 response: 186

Online Measurement and Strategy Report 2011–in association with Lynchpin
Page 15
All rights reserved. No part of this publication may be reproduced or transmitted in any form or by any means, electronic or mechanical, including photocopy, recording or any information storage
and retrieval system, without prior permission in writing from the publisher. Copyright © Econsultancy.com Ltd 2011
6.2.2. Measuring online reputation and social media activity
It is clear that more companies are beginning to focus on benchmarking and measurement of
social media. Fewer companies now say they don’t measure their online reputation or social
media activity; this has fallen from 27% in 2010 to 21% in 2011.
Companies are also starting to take an integrated approach to social media measurement. Only
12% of companies use their web analytics tool exclusively to measure online reputation and social
media activity, compared to 19% in 2010.
In comparison, a third of companies (33%) say they use a combination of paid-for reputation
monitoring tools, free tools and their web analytics software to measure social media activity. The
proportion of companies using a combination of tools has increased from 24% in 2010.
Companies
Figure 9: How does your organisation measure online reputation and social
media activity?
2011 response: 379
2010 response: 221
Figure 10 indicates that just under half of agencies (47%) say their clients use a combination of
different tools to measure online reputation and social media activity, up from 40% in 2011.
In comparison to the companies surveyed, only 15% of agencies say their clients do not measure
social media activity, compared to 21% of companies.
The proportion of agencies who say their clients now use paid-for monitoring tools has slightly
increased to 18%, up from 14% in 2010. Correspondingly, fewer clients are now using free tools
exclusively, as this has fallen to 13%, down from 18% in last year‟s survey.

Online Measurement and Strategy Report 2011–in association with Lynchpin
Page 16
All rights reserved. No part of this publication may be reproduced or transmitted in any form or by any means, electronic or mechanical, including photocopy, recording or any information storage
and retrieval system, without prior permission in writing from the publisher. Copyright © Econsultancy.com Ltd 2011
Agencies
Figure 10: How do your clients measure online reputation and social media
activity?
2011 response: 256
2010 response: 186

Online Measurement and Strategy Report 2011–in association with Lynchpin
Page 17
All rights reserved. No part of this publication may be reproduced or transmitted in any form or by any means, electronic or mechanical, including photocopy, recording or any information storage
and retrieval system, without prior permission in writing from the publisher. Copyright © Econsultancy.com Ltd 2011
6.2.3. Use of enterprise web analytics technologies
The chart below shows the state of the web analytics market in 2011, indicating that Adobe /
Omniture and Webtrends dominate the industry. Some 35% of companies use Adobe, while 32%
currently using Webtrends.
There has been much M&A activity in the web analytics industry in the past year. The acquisition
of analytics vendors by companies such as Adobe (i.e. Omniture) and IBM (i.e. Unica and
Coremetrics) makes it difficult to directly compare the results to 2010.
The agency findings are shown separately in Figure 12. According to supply-side respondents,
Webtrends is now the most frequently used technology.
Companies
Figure 11: If any, which of the following web analytics vendors do you use?
Response: 207

Online Measurement and Strategy Report 2011–in association with Lynchpin
Page 18
All rights reserved. No part of this publication may be reproduced or transmitted in any form or by any means, electronic or mechanical, including photocopy, recording or any information storage
and retrieval system, without prior permission in writing from the publisher. Copyright © Econsultancy.com Ltd 2011
Agencies
Figure 12: If any, which of the following web analytics vendors do your clients
use?
Response: 200
Online Measurement and Strategy Report 2011–in association with Lynchpin
Page 19
All rights reserved. No part of this publication may be reproduced or transmitted in any form or by any means, electronic or mechanical, including photocopy, recording or any information storage
and retrieval system, without prior permission in writing from the publisher. Copyright © Econsultancy.com Ltd 2011
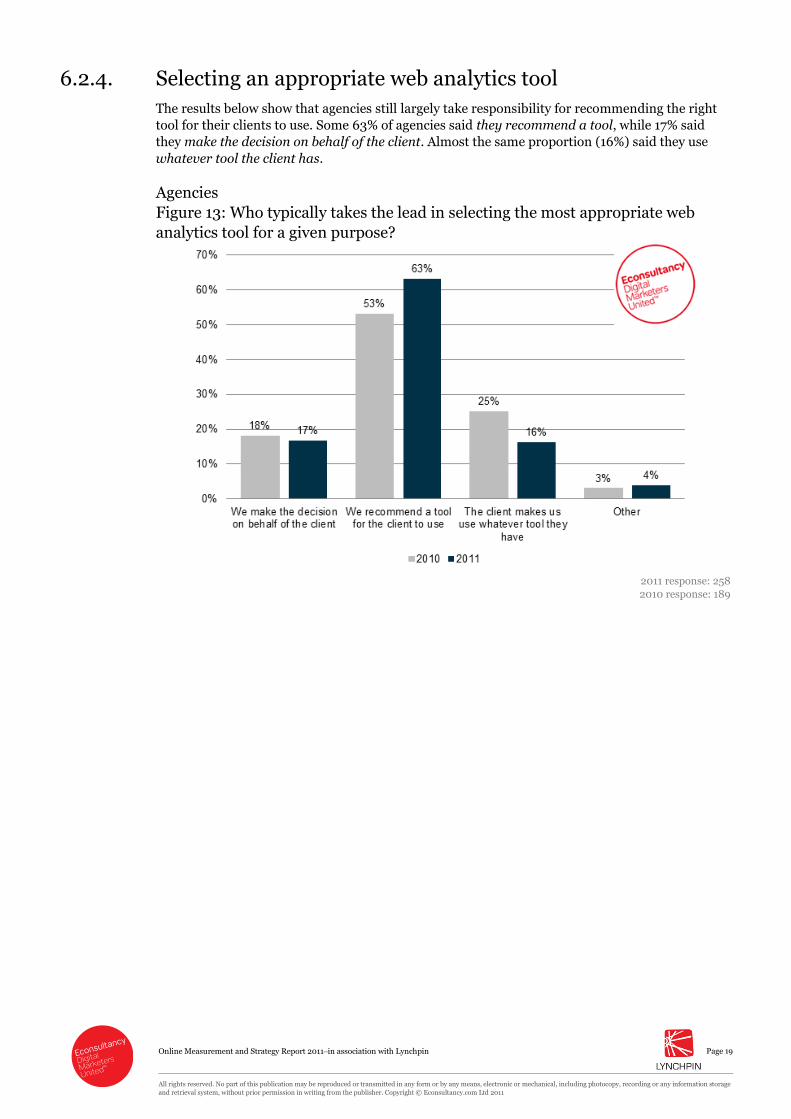
6.2.4. Selecting an appropriate web analytics tool
The results below show that agencies still largely take responsibility for recommending the right
tool for their clients to use. Some 63% of agencies said they recommend a tool, while 17% said
they make the decision on behalf of the client. Almost the same proportion (16%) said they use
whatever tool the client has.
Agencies
Figure 13: Who typically takes the lead in selecting the most appropriate web
analytics tool for a given purpose?
2011 response: 258
2010 response: 189

Online Measurement and Strategy Report 2011–in association with Lynchpin
Page 20
All rights reserved. No part of this publication may be reproduced or transmitted in any form or by any means, electronic or mechanical, including photocopy, recording or any information storage
and retrieval system, without prior permission in writing from the publisher. Copyright © Econsultancy.com Ltd 2011
6.2.5. Interaction with online measurement tools
Some 40% of agencies say they mainly access their clients‟ web analytics tool for them and then
present the results. This compares to 15% who say their clients access the tool directly. Some 46%
of supply-side respondents say there is a mixture between direct client access and their agencies
presenting the findings.
Agencies
Figure 14: How do you and your clients interact with online measurement tools?
Response: 253

Online Measurement and Strategy Report 2011–in association with Lynchpin
Page 21
All rights reserved. No part of this publication may be reproduced or transmitted in any form or by any means, electronic or mechanical, including photocopy, recording or any information storage
and retrieval system, without prior permission in writing from the publisher. Copyright © Econsultancy.com Ltd 2011
6.2.6. Sharing online measurement data
Supply-side respondents were asked to what extent they share online measurement data with
their clients. The majority (55%) said that they did not share as much data with their clients as
they would like.
However, it is more encouraging to see that over a third of agencies (38%) say they share online
measurement data to a great extent.
Agencies
Figure 15: To what extent do you and your clients share online measurement
data?
Response: 255

Online Measurement and Strategy Report 2011–in association with Lynchpin
Page 22
All rights reserved. No part of this publication may be reproduced or transmitted in any form or by any means, electronic or mechanical, including photocopy, recording or any information storage
and retrieval system, without prior permission in writing from the publisher. Copyright © Econsultancy.com Ltd 2011
6.3. Google Analytics
6.3.1. Use of Google Analytics
The proportion of companies exclusively using Google Analytics (44%) has increased again this
year, up from 38% in 2010 and only 23% in 2009. This is accompanied by a drop in the
proportion of companies using Google Analytics in addition to other analytics tools.
Companies
Figure 16: Does your organisation use Google Analytics?
2011 response: 385
2010 response: 227
Online Measurement and Strategy Report 2011–in association with Lynchpin
Page 23
All rights reserved. No part of this publication may be reproduced or transmitted in any form or by any means, electronic or mechanical, including photocopy, recording or any information storage
and retrieval system, without prior permission in writing from the publisher. Copyright © Econsultancy.com Ltd 2011
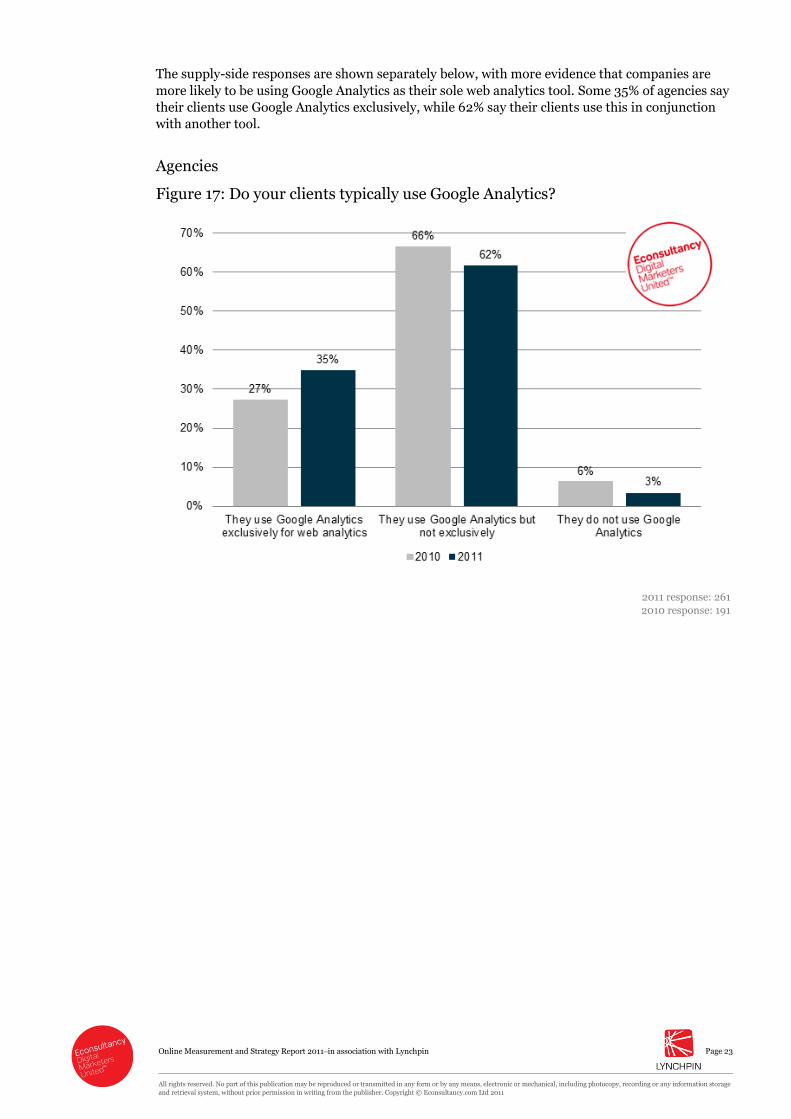
The supply-side responses are shown separately below, with more evidence that companies are
more likely to be using Google Analytics as their sole web analytics tool. Some 35% of agencies say
their clients use Google Analytics exclusively, while 62% say their clients use this in conjunction
with another tool.
Agencies
Figure 17: Do your clients typically use Google Analytics?
2011 response: 261
2010 response: 191

Online Measurement and Strategy Report 2011–in association with Lynchpin
Page 24
All rights reserved. No part of this publication may be reproduced or transmitted in any form or by any means, electronic or mechanical, including photocopy, recording or any information storage
and retrieval system, without prior permission in writing from the publisher. Copyright © Econsultancy.com Ltd 2011
6.3.2. What is Google Analytics used for?
Of the clients who are exclusively using Google Analytics, some 87% use the platform for
understanding traffic and conversion KPIs. Over two-thirds of companies (68%) are using
campaign tracking, while 60% are using it for management reporting.
At the lower end of the scale, only 17% of company use Google for reporting related to product
and cross-sell analysis, while 9% use Google Analytics for rich media, flash and video tracking.
Companies
Figure 18: Do you use Google Analytics for any of the following types of reporting
or insight? [Companies exclusively using Google Analytics]
Response: 167
Online Measurement and Strategy Report 2011–in association with Lynchpin
Page 25
All rights reserved. No part of this publication may be reproduced or transmitted in any form or by any means, electronic or mechanical, including photocopy, recording or any information storage
and retrieval system, without prior permission in writing from the publisher. Copyright © Econsultancy.com Ltd 2011
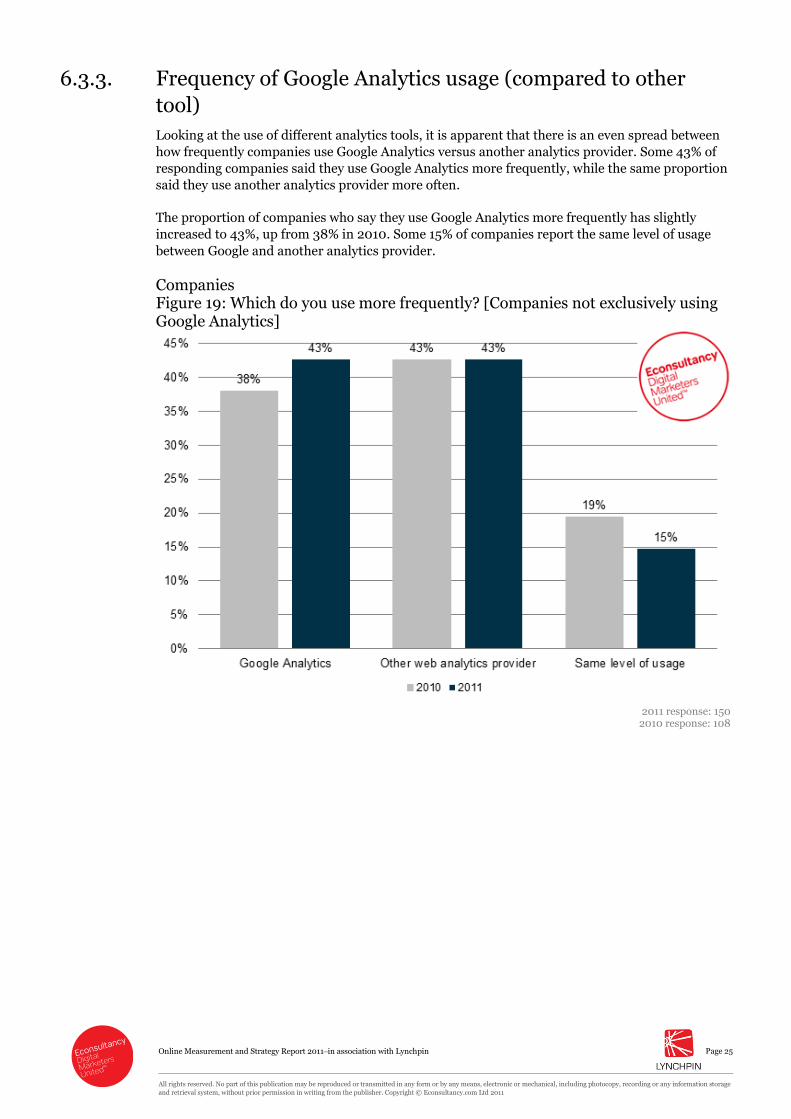
6.3.3. Frequency of Google Analytics usage (compared to other
tool)
Looking at the use of different analytics tools, it is apparent that there is an even spread between
how frequently companies use Google Analytics versus another analytics provider. Some 43% of
responding companies said they use Google Analytics more frequently, while the same proportion
said they use another analytics provider more often.
The proportion of companies who say they use Google Analytics more frequently has slightly
increased to 43%, up from 38% in 2010. Some 15% of companies report the same level of usage
between Google and another analytics provider.
Companies Figure 19: Which do you use more frequently? [Companies not exclusively using Google Analytics]
2011 response: 150
2010 response: 108

Online Measurement and Strategy Report 2011–in association with Lynchpin
Page 26
All rights reserved. No part of this publication may be reproduced or transmitted in any form or by any means, electronic or mechanical, including photocopy, recording or any information storage
and retrieval system, without prior permission in writing from the publisher. Copyright © Econsultancy.com Ltd 2011
6.3.4. Reasons for using additional paid-for analytics tools
Of companies who use another tool in addition to Google Analytics, just under half (48%) say this
is because Google is not sophisticated enough for their requirements. This compares to 41% in
2010.
Companies are less concerned about a dependence on Google, as only 14% said they don’t want to
be completely reliant on Google, down from 30% of respondents in last year‟s survey. Some 14%
are still assessing whether Google Analytics alone is sufficient.
Some 20% of companies stated „other‟. Reasons include the fact that Google only promises to keep
data for up to a year, and some companies require the data to be stored for a longer time period
than this. The lack of competitor benchmarking tools on Google also leads to some companies
using additional analytics tools.
Companies are also concerned with security issues and vulnerabilities in the cloud. One
respondent also mentioned that Google was thought to be unreliable on its own.
A handful of companies only use Google for quick measurements on their microsites, rather than
as a tool to measure their entire main website activity.
Companies
Figure 20: What is the main reason you continue to use a paid-for tool as well as Google Analytics? [Companies not exclusively using Google Analytics]
2011 response: 147
2010 response: 103

Online Measurement and Strategy Report 2011–in association with Lynchpin
Page 27
All rights reserved. No part of this publication may be reproduced or transmitted in any form or by any means, electronic or mechanical, including photocopy, recording or any information storage
and retrieval system, without prior permission in writing from the publisher. Copyright © Econsultancy.com Ltd 2011
6.3.5. Reasons for not using Google Analytics
The chart below shows responses from companies who do not use Google Analytics. Some 42% of
companies say the main reason they do not use Google‟s technology is because they are happy
with their existing web analytics supplier.
A fifth of companies (19%) say they do not want Google to have data about their site, while 15%
say the platform is not sophisticated enough for their requirements. However, it is worth noting
that proportion of companies who now say Google is not sophisticated enough has fallen
considerably, down from 23% in 2010.
There has also been an increase in the proportion if companies who state „other‟. This mainly
relates to legal issues, and concerns about data privacy, as well as restrictions imposed by the
company‟s IT departments.
Note: sample sizes for this chart are small
Companies
Figure 21: What is the principal reason you don't use Google Analytics?
[Companies not using Google Analytics]
2011 response: 53
2010 response: 26

Online Measurement and Strategy Report 2011–in association with Lynchpin
Page 28
All rights reserved. No part of this publication may be reproduced or transmitted in any form or by any means, electronic or mechanical, including photocopy, recording or any information storage
and retrieval system, without prior permission in writing from the publisher. Copyright © Econsultancy.com Ltd 2011
6.3.6. Tools used for reporting or insight (Google or other vendor)
The chart below shows which tools are being used for different types of reporting or insight. At an
overall level, it is clear that organisations are using both Google and other web analytics tools
extensively. The fact that many companies use different tools for different tactical objectives
partly explains why there is such widespread difficulty when it comes to implementing a coherent
overall strategy.
It can be seen that those companies using both Google and a paid-for analytics tool are more
likely to use Google for PPC optimisation, site search usage and campaign tracking. But these
companies are more likely to use their other, paid-for vendor for traffic and conversion KPIs,
funnel / conversion optimisation, page flow / navigation analysis, management reporting,
content influence, rich media / flash / video tracking and product / cross-sell analysis.
Some 43% of responding companies use Google for PPC or AdWords optimisation, while 21% use
another analytics vendor. Over a third of companies (36%) use Google for site search usage data,
while 31% use their other vendor. There is a fairly even split between companies who use Google
and other vendors for campaign tracking. While a third (33%) use Google, some 32% use other
vendors. This compares to over a quarter (28%) who use both Google and other vendors.
Companies are most likely to use other vendors for management reporting (41%) compared to
22% of companies who use Google exclusively. Around a third (30%) say they use Google as well
as another vendor for this requirement.
Companies
Figure 22: Which tool do you use for the following types of reporting or insight?
[Companies not exclusively using Google Analytics]
Response: 153

Online Measurement and Strategy Report 2011–in association with Lynchpin
Page 29
All rights reserved. No part of this publication may be reproduced or transmitted in any form or by any means, electronic or mechanical, including photocopy, recording or any information storage
and retrieval system, without prior permission in writing from the publisher. Copyright © Econsultancy.com Ltd 2011
Supply-side respondents indicate their clients are more likely to use Google Analytics than
another vendor for the full range of reporting needs, except for rich media and video tracking.
Some 68% say their clients are using Google for PPC optimisation, while only 11% use other
vendors.
Over half of agencies (57%) say their clients use Google exclusively for site search metrics.
A quarter (26%) of agencies say their clients use Google for rich media tracking, while 32% say
clients use another vendor for this purpose.
Some 32% of companies use Google Analytics for product and cross-sell analysis, while 27% use
another vendor. Just 16% say they do not use any tool for tracking this, while 24% are using a
mixture of Google Analytics and another vendor for tracking this.
Agencies
Figure 23: Which tool do your clients typically use for the following types of
reporting or insight?
Response: 257

Online Measurement and Strategy Report 2011–in association with Lynchpin
Page 30
All rights reserved. No part of this publication may be reproduced or transmitted in any form or by any means, electronic or mechanical, including photocopy, recording or any information storage
and retrieval system, without prior permission in writing from the publisher. Copyright © Econsultancy.com Ltd 2011
For companies that are not using Google Analytics, some 84% use their current analytics tool for
campaign tracking, while 82% use their tool for traffic and conversion KPIs.
Some 71% of companies are using their tool for management reporting, while over two-thirds
(67%) are using web analytics technology for funnel and conversion optimisation.
At the other end of the scale, only 29% are using their tool for tracking rich media or video, while
the same proportion use technology for gauging content influence.
Companies
Figure 24: Do you use your web analytics tool for any of the following types of
reporting or insight? [Companies not using Google Analytics]
Response: 49
Online Measurement and Strategy Report 2011–in association with Lynchpin
Page 31
All rights reserved. No part of this publication may be reproduced or transmitted in any form or by any means, electronic or mechanical, including photocopy, recording or any information storage
and retrieval system, without prior permission in writing from the publisher. Copyright © Econsultancy.com Ltd 2011
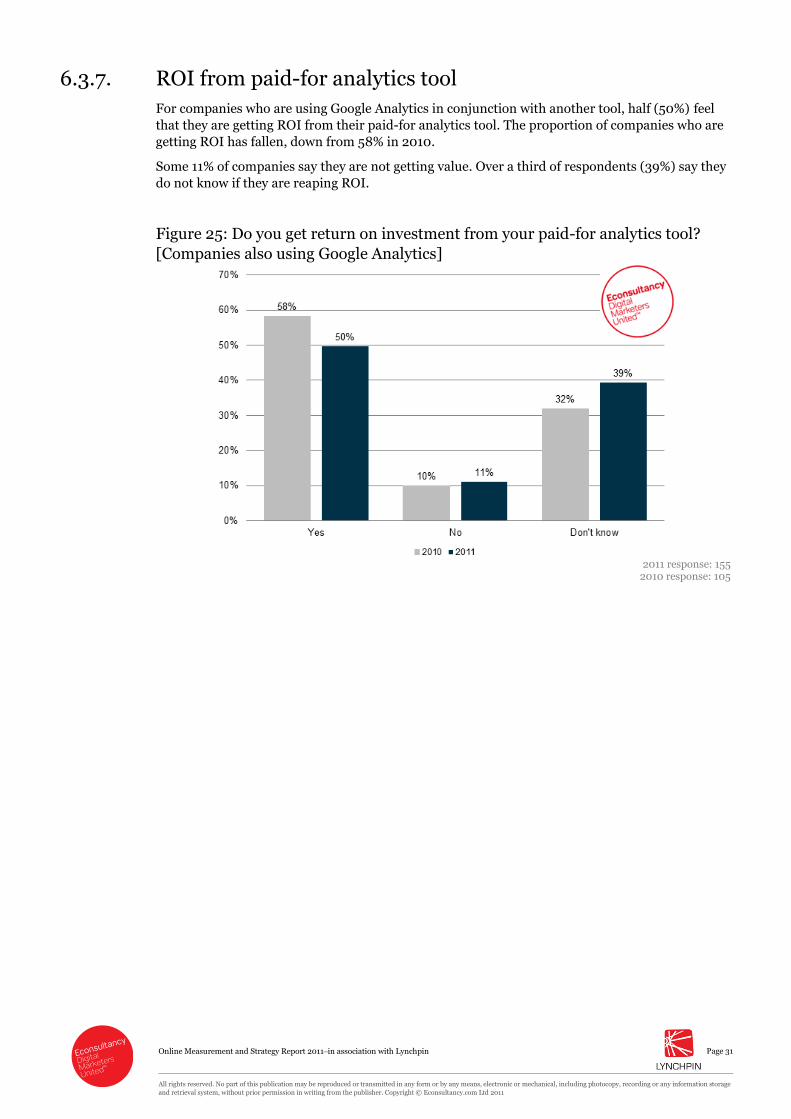
6.3.7. ROI from paid-for analytics tool
For companies who are using Google Analytics in conjunction with another tool, half (50%) feel
that they are getting ROI from their paid-for analytics tool. The proportion of companies who are
getting ROI has fallen, down from 58% in 2010.
Some 11% of companies say they are not getting value. Over a third of respondents (39%) say they
do not know if they are reaping ROI.
Figure 25: Do you get return on investment from your paid-for analytics tool?
[Companies also using Google Analytics]
2011 response: 155
2010 response: 105

Online Measurement and Strategy Report 2011–in association with Lynchpin
Page 32
All rights reserved. No part of this publication may be reproduced or transmitted in any form or by any means, electronic or mechanical, including photocopy, recording or any information storage
and retrieval system, without prior permission in writing from the publisher. Copyright © Econsultancy.com Ltd 2011
6.4. Resourcing and budget
6.4.1. Number of dedicated web analysts
A third of respondents (35%) say they have one dedicated web analyst, a significant drop from
2010, when 42% had a single employee dedicated to analysis of web data.
Although the proportion of companies with no dedicated web analysts has slightly increased from
22% in 2010 to 25% in 2011, more companies this year say they have a team of three dedicated
web analysts. Some 9% of companies now have three dedicated web analysts compared 4% in
2010.
Companies
Figure 26: How many dedicated employees does your organisation have doing
analysis of web data?
2011 response: 364 2010 response: 217

Online Measurement and Strategy Report 2011–in association with Lynchpin
Page 33
All rights reserved. No part of this publication may be reproduced or transmitted in any form or by any means, electronic or mechanical, including photocopy, recording or any information storage
and retrieval system, without prior permission in writing from the publisher. Copyright © Econsultancy.com Ltd 2011
6.4.2. Number of regular contractors
Just under two-thirds of companies (62%) have no regular contractors for analysis of web data,
down from 73% in 2010.
The proportion of companies with one regular contractor has slightly increased since last year.
Just under a quarter of companies (23%) now have one regular contractor, compared to 15% last
year.
Companies
Figure 27: How many regular contractors does your organisation have doing analysis of web data?
2011 response: 364
2010: response: 217

Online Measurement and Strategy Report 2011–in association with Lynchpin
Page 34
All rights reserved. No part of this publication may be reproduced or transmitted in any form or by any means, electronic or mechanical, including photocopy, recording or any information storage
and retrieval system, without prior permission in writing from the publisher. Copyright © Econsultancy.com Ltd 2011
6.4.3. Days of outsourced analysis
Most companies (65%) do not take any days of outsourced analysis from agencies or third parties.
Some 10% say their companies take one day of outsourced analysis from agencies per month,
compared to 7% who take two days per month.
Companies
Figure 28: How many days per month of outsourced analysis does your
organisation take from agencies or other third parties?
2011 response: 369
2010: response: 216

Online Measurement and Strategy Report 2011–in association with Lynchpin
Page 35
All rights reserved. No part of this publication may be reproduced or transmitted in any form or by any means, electronic or mechanical, including photocopy, recording or any information storage
and retrieval system, without prior permission in writing from the publisher. Copyright © Econsultancy.com Ltd 2011
6.4.4. Outsourced analytics functions
Those outsourcing analytics functions are most likely to do so for analysis and optimisation
(52%), strategic consultancy (47%) and implementation support (41%).
The agency results [Figure 30] indicate that almost three-quarters (74%) of clients outsource
analysis and optimisation on a regular basis, while the same proportion report that they regularly
outsource strategic consultancy.
Companies
Figure 29: Which of the following analytics functions do you outsource on a
regular basis?
Response: 141
Agencies
Figure 30: Which of the following analytics functions do your clients outsource
on a regular basis?
Response: 231

Online Measurement and Strategy Report 2011–in association with Lynchpin
Page 36
All rights reserved. No part of this publication may be reproduced or transmitted in any form or by any means, electronic or mechanical, including photocopy, recording or any information storage
and retrieval system, without prior permission in writing from the publisher. Copyright © Econsultancy.com Ltd 2011
6.4.5. Web analytics resourcing (increase or decrease)
The majority of companies are planning to keep resourcing of data analysis the same, as indicated
by the chart below. While some 42% are planning to increase resources for dedicated employees,
57% say they will keep this the same.
Almost three-quarters of respondents (73%) plan to keep regular contractors the same, while 61%
say they plan to keep resourcing for outsourced analysis the same.
Companies
Figure 31: Over the next 12 months, are you planning to increase or decrease your
resourcing of data analysis in these areas?
Response: 360

Online Measurement and Strategy Report 2011–in association with Lynchpin
Page 37
All rights reserved. No part of this publication may be reproduced or transmitted in any form or by any means, electronic or mechanical, including photocopy, recording or any information storage
and retrieval system, without prior permission in writing from the publisher. Copyright © Econsultancy.com Ltd 2011
6.4.6. Total web analytics spend
The proportion of companies spending more than £100,000 a year on web analytics has increased
from 9% last year to 14% this year. Some 42% of companies are spending £5,000 or less on web
analytics per year, the same proportion as 2010.
Generally speaking, the results below show that spending on web analytics technology has not
dramatically changed in the last year, and has remained fairly consistent. Some 8% say they
spend between £100,000 and £200,000 on web analytics, while 6% now spend £200,000 or
more.
Companies
Figure 32: In total, how much do you spend on web analytics each year?
2011 response: 365 2010 response: 215
Some 39% of agencies suggest their clients are spending up to £5,000 on web analytics per year, a
slight increase from 2010. Similarly, the proportion of agency clients spending between £5,000
and £10,000 per year has increased to 24%, up from 15% in 2010.
Agencies
Figure 33: On average, how much do your clients spend on web analytics each
year?
2011 response: 244 2010 response: 181

Online Measurement and Strategy Report 2011–in association with Lynchpin
Page 38
All rights reserved. No part of this publication may be reproduced or transmitted in any form or by any means, electronic or mechanical, including photocopy, recording or any information storage
and retrieval system, without prior permission in writing from the publisher. Copyright © Econsultancy.com Ltd 2011
6.4.7. Breakdown of web analytics expenditure
On average, more than half of web analytics expenditure (52%) is now spent on internal staff,
while 29% is spent on technology. Almost a fifth of investment (19%) is spent on consulting and
services.
According to supply-side respondents [Figure 35], spending on analytics is heaviest for consulting
and services.
Companies
Figure 34: How is your web analytics expenditure split between the following areas?
2011 response: 303 2010 response: 182
Agencies
Figure 35: Typically, how is a client's web analytics expenditure split between the following areas?
2011 response: 214 2010 response: 148

Online Measurement and Strategy Report 2011–in association with Lynchpin
Page 39
All rights reserved. No part of this publication may be reproduced or transmitted in any form or by any means, electronic or mechanical, including photocopy, recording or any information storage
and retrieval system, without prior permission in writing from the publisher. Copyright © Econsultancy.com Ltd 2011
6.4.8. Annual change in web analytics budget
In terms of where companies will be increasing their analytics-related spending over the next
year, there is a fairly even split between spend on technology, consulting or services and internal
staff. Some 40% plan to increase expenditure on internal staff, while a similar proportion plan to
do the same for technology (38%) and consulting (37%). Some 58% plan to keep spending on
these three areas the same over the next 12 months.
The results from 2010 are shown in Figure 37, and highlight that more companies this year are
planning to increase spending on consulting and services, up from 30% in 2010.
Conversely, the percentages for companies increasing investment in technology and internal staff
have slightly fallen.
Companies – 2011 results
Figure 36: Over the next 12 months, are you planning to increase your web
analytics budget in the following areas?
Response: 356

Online Measurement and Strategy Report 2011–in association with Lynchpin
Page 40
All rights reserved. No part of this publication may be reproduced or transmitted in any form or by any means, electronic or mechanical, including photocopy, recording or any information storage
and retrieval system, without prior permission in writing from the publisher. Copyright © Econsultancy.com Ltd 2011
Results from 2010
Figure 37: Over the next 12 months, are you planning to increase your web
analytics budget in the following areas?
Response: 211
Supply-side responses are shown in Figure 38. Over half of agencies (57%) say their clients plan
to increase spend on consulting and services, while 37% say their clients plan to keep this the
same.
More agencies than the companies themselves report clients are increasing consulting budgets
Some 42% say their clients plan to increase spend on technology, while 41% report their clients
are increasing budgets for internal staff.

Online Measurement and Strategy Report 2011–in association with Lynchpin
Page 41
All rights reserved. No part of this publication may be reproduced or transmitted in any form or by any means, electronic or mechanical, including photocopy, recording or any information storage
and retrieval system, without prior permission in writing from the publisher. Copyright © Econsultancy.com Ltd 2011
Agencies
Figure 38: Over the next 12 months, are your clients planning to increase their
web analytics budget in the following areas?
Response: 243
Results from 2010
Figure 39: Over the next 12 months, are your clients planning to increase their
web analytics budget in the following areas?
Response: 148

Online Measurement and Strategy Report 2011–in association with Lynchpin
Page 42
All rights reserved. No part of this publication may be reproduced or transmitted in any form or by any means, electronic or mechanical, including photocopy, recording or any information storage
and retrieval system, without prior permission in writing from the publisher. Copyright © Econsultancy.com Ltd 2011
6.4.9. Ownership of budget
The chart below indicates who within the organisation is most likely to take responsibility for the
budget, and indicates this is most likely to be the remit of senior management or online
marketing.
While some 28% of respondents say senior management owns the budget, a quarter (25%) say
online marketing takes responsibility for this. Some 16% say a mixture of departments takes
charge of managing online measurement budget.
The agency results [Figure 41] also show that the responsibility for online measurement budget
within client organisations usually lies with senior management or online marketing.
The proportion of agencies who say that senior management take responsibility for the online
measurement budget has significantly jumped this year to 30%, up from 18% in 2010. This is
encouraging as it indicates that senior managers increasingly understand the value of online
measurement and reporting.
Companies
Figure 40: Who 'owns' the budget for online measurement within your
organisation?
2011 response: 364
2010 response: 213
Note: ‘mixture of the above’ means a mixture of departments

Online Measurement and Strategy Report 2011–in association with Lynchpin
Page 43
All rights reserved. No part of this publication may be reproduced or transmitted in any form or by any means, electronic or mechanical, including photocopy, recording or any information storage
and retrieval system, without prior permission in writing from the publisher. Copyright © Econsultancy.com Ltd 2011
Agencies
Figure 41: Who is most likely to 'own' the budget for online measurement within
a client company?
2011 response: 243
2010 response: 178
Note: ‘mixture of the above’ means a mixture of departments

Online Measurement and Strategy Report 2011–in association with Lynchpin
Page 44
All rights reserved. No part of this publication may be reproduced or transmitted in any form or by any means, electronic or mechanical, including photocopy, recording or any information storage
and retrieval system, without prior permission in writing from the publisher. Copyright © Econsultancy.com Ltd 2011
6.5. Joined-up strategy and measurement
6.5.1. Company-wide strategy Only 22% of companies say they have a company-wide strategy for collecting and integrating data
analysis with business objectives, while almost two-thirds (63%) say they are working on this.
Some 15% do not have a strategy in place for this at all.
Disappointingly, there hasn‟t been any improvement since last year. We believe this is because the
growing number of data sources and tools available make it harder for companies to decide top-
level KPIs which reflect business objectives.
The lack of improvement in this area may also be due to increased expectations. There is now
more understanding around what goes into a company-wide strategy and increased realisation
that they are further away from this than they originally thought, despite moving in the right
direction.
The agency results [Figure 43] indicate that only 16% of respondents say their clients have a
company-wide strategy in place, while 61% say they are working on this. Just under a quarter
(23%) of respondents say their clients do not have a company-wide strategy in place.
Companies
Figure 42: Do you have a company-wide strategy that ties data collection and
analysis to business objectives?
2011 response: 362
2010 response: 213

Online Measurement and Strategy Report 2011–in association with Lynchpin
Page 45
All rights reserved. No part of this publication may be reproduced or transmitted in any form or by any means, electronic or mechanical, including photocopy, recording or any information storage
and retrieval system, without prior permission in writing from the publisher. Copyright © Econsultancy.com Ltd 2011
Agencies
Figure 43: Do your clients typically have a company-wide strategy that ties data
collection and analysis to business objectives?
2011 response: 244
2010 response: 179

Online Measurement and Strategy Report 2011–in association with Lynchpin
Page 46
All rights reserved. No part of this publication may be reproduced or transmitted in any form or by any means, electronic or mechanical, including photocopy, recording or any information storage
and retrieval system, without prior permission in writing from the publisher. Copyright © Econsultancy.com Ltd 2011
6.5.2. Driving actionable recommendations from analytics
Over three-quarters of companies (85%) say that web analytics drive actionable recommendations
within their organisation. But only 28% say that analytics definitely drive actionable
recommendations, while 57% say they sometimes drive actionable recommendations.
Again, there has sadly not been any improvement since last year which can be attributed to an
increase of data and reporting requirements, which can obfuscate the bigger picture about what is
important and what needs to be done.
Companies
Figure 44: Do web analytics drive actionable recommendations that make a
difference to your organisation?
2011 response: 362
2010 response: 211

Online Measurement and Strategy Report 2011–in association with Lynchpin
Page 47
All rights reserved. No part of this publication may be reproduced or transmitted in any form or by any means, electronic or mechanical, including photocopy, recording or any information storage
and retrieval system, without prior permission in writing from the publisher. Copyright © Econsultancy.com Ltd 2011
Almost two-thirds of supply-side respondents (62%) say web analytics sometimes drive
actionable recommendations for clients, while 27% say this is definitely the case. Only 10% of
agencies responded with „No – not really’. There has been little change since last year, as Figure
45 shows.
Agencies
Figure 45: Do web analytics typically drive actionable recommendations that
make a difference to your clients' organisations?
2010 response: 246
2011 response: 180
Online Measurement and Strategy Report 2011–in association with Lynchpin
Page 48
All rights reserved. No part of this publication may be reproduced or transmitted in any form or by any means, electronic or mechanical, including photocopy, recording or any information storage
and retrieval system, without prior permission in writing from the publisher. Copyright © Econsultancy.com Ltd 2011
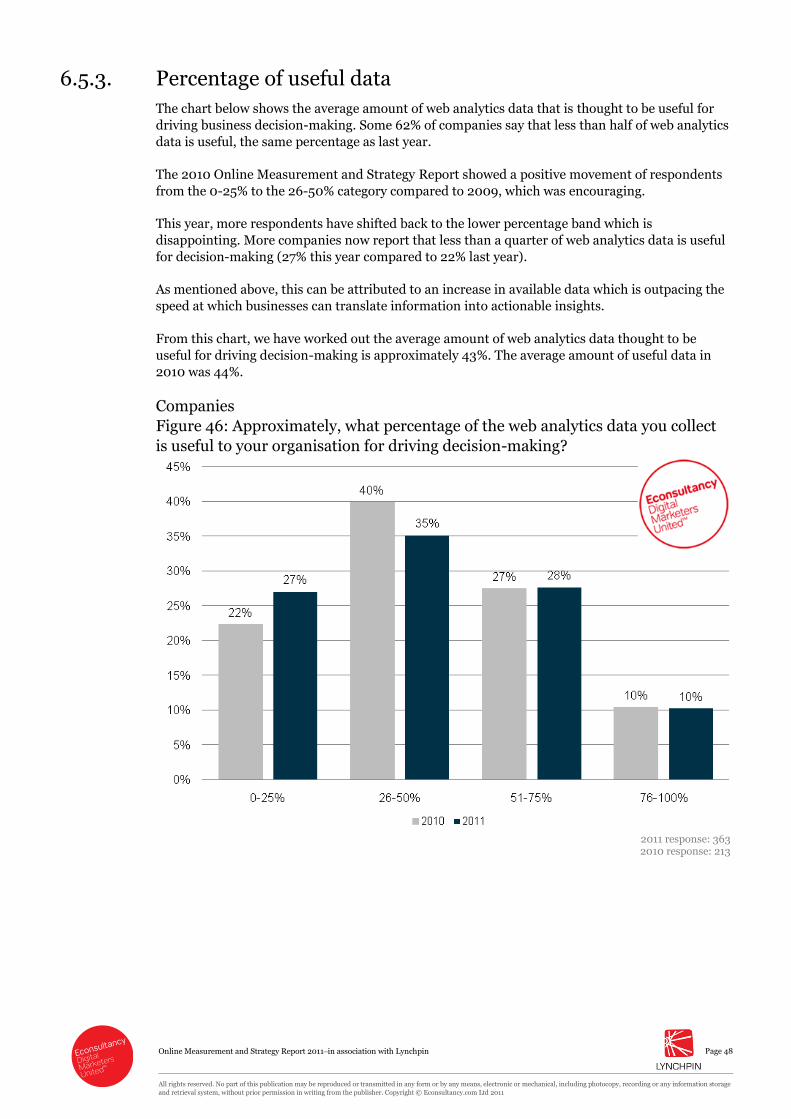
6.5.3. Percentage of useful data
The chart below shows the average amount of web analytics data that is thought to be useful for
driving business decision-making. Some 62% of companies say that less than half of web analytics
data is useful, the same percentage as last year.
The 2010 Online Measurement and Strategy Report showed a positive movement of respondents
from the 0-25% to the 26-50% category compared to 2009, which was encouraging.
This year, more respondents have shifted back to the lower percentage band which is
disappointing. More companies now report that less than a quarter of web analytics data is useful
for decision-making (27% this year compared to 22% last year).
As mentioned above, this can be attributed to an increase in available data which is outpacing the
speed at which businesses can translate information into actionable insights.
From this chart, we have worked out the average amount of web analytics data thought to be
useful for driving decision-making is approximately 43%. The average amount of useful data in
2010 was 44%.
Companies
Figure 46: Approximately, what percentage of the web analytics data you collect
is useful to your organisation for driving decision-making?
2011 response: 363 2010 response: 213

Online Measurement and Strategy Report 2011–in association with Lynchpin
Page 49
All rights reserved. No part of this publication may be reproduced or transmitted in any form or by any means, electronic or mechanical, including photocopy, recording or any information storage
and retrieval system, without prior permission in writing from the publisher. Copyright © Econsultancy.com Ltd 2011
The agency results below show that over a third of respondents (35%) say that between 26% and
50% of analytics data is useful for their clients. This compares to 37% last year. Some 61% of
supply-side respondents report that up to half of analytics data is useful for client decision-
making.
Agencies
Figure 47: Approximately, what percentage of the web analytics data your clients
collect is useful to their organisations for driving decision-making?
2011 response: 242 2010 response: 181

Online Measurement and Strategy Report 2011–in association with Lynchpin
Page 50
All rights reserved. No part of this publication may be reproduced or transmitted in any form or by any means, electronic or mechanical, including photocopy, recording or any information storage
and retrieval system, without prior permission in writing from the publisher. Copyright © Econsultancy.com Ltd 2011
6.5.4. Integration into broader business strategy
The results below show the extent to which companies integrate web analytics data into a broader
business strategy. Some 41% of companies have common KPIs for both web and non-web data.
The reality is that, despite a wealth of good intentions, most businesses aren‟t yet at the stage
where they have agreed high-level business intelligence metrics which feed off online and offline
data.
The chart also shows that only a fifth of companies (19%) have common teams and processes for
web and non-web data. Some 11% have a common technology platform for web and non-web
data.
Some 30% of responding companies say their web analytics are not integrated at all into their
business intelligence strategy, while 15% do not have a business intelligence strategy at all.
Companies
Figure 48: To what extent are web analytics integrated into your broader
business intelligence strategy?
Response: 357
Note: respondents could check multiple options

Online Measurement and Strategy Report 2011–in association with Lynchpin
Page 51
All rights reserved. No part of this publication may be reproduced or transmitted in any form or by any means, electronic or mechanical, including photocopy, recording or any information storage
and retrieval system, without prior permission in writing from the publisher. Copyright © Econsultancy.com Ltd 2011
As shown in Figure 49, 43% of agencies report that their clients have common KPIs, while just
over a fifth (22%) say they have common teams and processes. Just 8% say their clients have a
common technology platform.
Agencies
Figure 49: Do your clients typically integrate web analytics into their broader
business intelligence strategies?
Response: 240
Note: respondents could check multiple options

Online Measurement and Strategy Report 2011–in association with Lynchpin
Page 52
All rights reserved. No part of this publication may be reproduced or transmitted in any form or by any means, electronic or mechanical, including photocopy, recording or any information storage
and retrieval system, without prior permission in writing from the publisher. Copyright © Econsultancy.com Ltd 2011
6.5.5. Integration of analytics data with data from other sources
Some 59% of companies integrate analytics with data from other sources, while 41% do not
integrate with other types of data.
The agency results are shown in Figure 51. Some 52% of agencies say their clients integrate web
analytics with other data sources, while 48% say their clients are not yet doing this.
Companies
Figure 50: Do you integrate web analytics with data from other sources?
Response: 365
Agencies
Figure 51: Do your clients typically integrate web analytics with data from other
sources?
Response: 247

Online Measurement and Strategy Report 2011–in association with Lynchpin
Page 53
All rights reserved. No part of this publication may be reproduced or transmitted in any form or by any means, electronic or mechanical, including photocopy, recording or any information storage
and retrieval system, without prior permission in writing from the publisher. Copyright © Econsultancy.com Ltd 2011
The chart below shows how companies are integrating data. Hhalf (50%) are manually collating
data, while 45% say this is semi-automated, for example using spreadsheets and macros.
The extent to which companies are manually manipulating data explains much of the difficulty
involved with implementing an over-arching business intelligence framework which is accurate
and credible within the organisation.
Around a quarter of companies (26%) say they export data from their analytics tool into another
analysis platform. A fifth (20%) choose to import other data sources into their own analytics
platform.
Some 16% say they collate all data from their analytics platform and other sources into their own
data warehouse for further analysis.
Companies
Figure 52: How do you integrate web analytics with other data sources?
Response: 183
Note: respondents could check multiple options
The agency results [Figure 53] suggest that fewer companies are performing manual collation of
output data. Only 39% of agencies report manual collation, compared to half of companies
surveyed. Significantly more agencies (some 59%) than companies report their clients are
performing semi-automated collation.
More than a third of agencies (36%) say their clients integrate data by exporting data from their
analytics tool, while the same proportion say clients are importing data into their web analytics.
Just under a fifth (19%) say clients integrate analytics data by collating data from all sources and
storing in a data warehouse.

Online Measurement and Strategy Report 2011–in association with Lynchpin
Page 54
All rights reserved. No part of this publication may be reproduced or transmitted in any form or by any means, electronic or mechanical, including photocopy, recording or any information storage
and retrieval system, without prior permission in writing from the publisher. Copyright © Econsultancy.com Ltd 2011
Agencies
Figure 53: How do your clients integrate web analytics with other data sources?
Response: 94
Note: respondents could check multiple options

Online Measurement and Strategy Report 2011–in association with Lynchpin
Page 55
All rights reserved. No part of this publication may be reproduced or transmitted in any form or by any means, electronic or mechanical, including photocopy, recording or any information storage
and retrieval system, without prior permission in writing from the publisher. Copyright © Econsultancy.com Ltd 2011
6.5.6. Analysing customer journeys that cross online and offline
Tying up digital and offline data relating to individual customers is a major challenge for
businesses trying to become truly multichannel.
Only around a fifth of companies (22%) report their organisation has a framework for analysing
customer journeys that cross online and offline. Over half (55%) say this is not in place. Some
22% of respondents do not know if their organisation has this type of framework.
Some 28% of agencies [Figure 55] report their clients have a framework in place, while just under
half (46%) say their clients do not have framework for online and offline journey analysis.
Companies
Figure 54: Does your organisation have a framework for analysing customer
journeys that cross online and offline?
Response: 365
Agencies
Figure 55: Do your clients typically have a framework for analysing customer
journeys that cross online and offline?
Response: 247

Online Measurement and Strategy Report 2011–in association with Lynchpin
Page 56
All rights reserved. No part of this publication may be reproduced or transmitted in any form or by any means, electronic or mechanical, including photocopy, recording or any information storage
and retrieval system, without prior permission in writing from the publisher. Copyright © Econsultancy.com Ltd 2011
6.5.7. Barriers preventing frameworks for analysing online and
offline data
In an open-ended question, companies were asked about the main barriers to having a consistent
framework for analysing online and offline data. The tag cloud below summarises the responses.
Time, lack of understanding, budget constraints and lack of resources are frequently cited as
significant barriers.
Powered by Wordle
The lack of resources was frequently cited by respondents. Many companies are unsure of how to
put an appropriate framework in place, and some companies do not see the value of doing this.
Lack of resources – time, budget and skills
“Lack of resources, lack of awareness of the potential value in doing this.”
“Lack of resources (not currently a main priority) - we have some systems in place but none which would
constitute a consistent framework.”
“We don't have enough resources in-house and suppliers don't offer that but mostly specialised in one or the
other [i.e. online and offline].”
“Not a high priority for the moment.”
Company and agency respondents
Some respondents also reported that the lack of quality data was preventing their organisation
from putting an appropriate framework in place.
Lack of quality data
“The different systems and data sources aren't connected so any tracking between online/offline is done
manually. We simply don't have the resources to do this on a large scale.”
“Tools and data sources, quality of data.”

Online Measurement and Strategy Report 2011–in association with Lynchpin
Page 57
All rights reserved. No part of this publication may be reproduced or transmitted in any form or by any means, electronic or mechanical, including photocopy, recording or any information storage
and retrieval system, without prior permission in writing from the publisher. Copyright © Econsultancy.com Ltd 2011
“No offline data compatible with online data.”
“Offline data is incompatible with online. Television commercials TVRs and media stats are square pegs, online
analytics are round holes.”
Company and agency respondents
The lack of senior management buy-in is also holding back many companies, as they do not see
the value of having such a framework in place. This relates to a lack of understanding, as well as
company culture.
Senior management buy-in and company culture
“The business not understanding why or how this works. Senior Management don't have time to listen to how
the relationship between online and offline is so important and what we can gain from it.”
“Lack of understanding of importance/ relevance from senior management.”
“Company culture, lack of understanding, resistance to truly integrate all departments.”
“Organisational culture. However several things are coming together at present that should change this over the
next 12 months.”
“An antiquated business culture based upon the view that online only serves for low-end customer browsing
while in-store is high-end purchase (fashion industry).”
Company and agency respondents
A handful of respondents also referred to technology restraints, which prevent them from joining
up the data properly.
Technology
“Internal structures and processes; technology barriers.”
“Different agency partners responsible for different channels.”
“Technology limitations.”
Company and agency respondents

Online Measurement and Strategy Report 2011–in association with Lynchpin
Page 58
All rights reserved. No part of this publication may be reproduced or transmitted in any form or by any means, electronic or mechanical, including photocopy, recording or any information storage
and retrieval system, without prior permission in writing from the publisher. Copyright © Econsultancy.com Ltd 2011
6.5.8. Attribution modelling
Just under a quarter of companies (24%) perform some kind of attribution modelling, while over
half (56%) are not yet doing this. Figure 57 shows the agency responses.
Note: for more information on attribution, please refer to Econsultancy’s Marketing Attribution
Management Buyer’s Guide.
Companies
Figure 56: Do you (or a supplier on your behalf) do any kind of attribution
modelling to give more insight into the relationship between different channels?
Response: 362
Agencies
Figure 57: Do your clients do any kind of attribution modelling to give more
insight into the relationship between different channels?
Response: 247

Online Measurement and Strategy Report 2011–in association with Lynchpin
Page 59
All rights reserved. No part of this publication may be reproduced or transmitted in any form or by any means, electronic or mechanical, including photocopy, recording or any information storage
and retrieval system, without prior permission in writing from the publisher. Copyright © Econsultancy.com Ltd 2011
6.6. Barriers to success
6.6.1. Barriers preventing an effective online measurement strategy
The main barrier to an effective online measurement strategy is still the lack of budget and
resources, which is one of the three biggest problems for 48% of organisation surveyed. However,
it is encouraging that there has been a slight drop in the proportion of companies citing this, as
this has fallen from 57% last year.
Organisational silos or lack of co-ordination are reported to be a problem for 27% of companies
this year compared to 30% in 2010. Although this has fallen slightly, it is clear that companies still
need to do more to remove these silos.
A lack of strategy still holds back 27% of companies surveyed, and 23% do not know what to
measure. It is clear that there is still a need for further training and investment to bridge the skills
gap. More companies than last year report that finding staff is a problem; this had increased to
13%, up from 8% in 2010.
While fewer respondents in last year‟s report than in 2009 said that the poor technology was a
problem, there has been a reversal in the last year. The proportion of companies reporting
technology to be a top-three problem has increased by 10% since 2010, as some 16% now cite this
as a barrier, compared to just 6% in 2010.
Companies
Figure 58: What are the barriers that prevent you from having an effective online
measurement strategy?
2011 response: 349 2010 response: 210
Note: respondents could check up to three options.

Online Measurement and Strategy Report 2011–in association with Lynchpin
Page 60
All rights reserved. No part of this publication may be reproduced or transmitted in any form or by any means, electronic or mechanical, including photocopy, recording or any information storage
and retrieval system, without prior permission in writing from the publisher. Copyright © Econsultancy.com Ltd 2011
The supply-side responses indicate that the biggest problem for their clients relates to a lack of
understanding about what to measure. Over half of agencies (51%) reported this to be a problem
for their clients.
The next most significant barrier is thought to be a lack of budget and resources, according to
40% of agencies. Over a third of supply-side respondents (36%) said a lack of strategy is a major
barrier, slightly higher than the companies themselves suggest.
A third of agencies (33%) also note that the lack of senior management buy-in is preventing their
clients from having an effective online measurement strategy. Only 23% of companies reported
this to be an issue, and it may be that agencies are better placed to assess whether this is a
significant barrier to measurement.
Agencies
Figure 59: What are the barriers which prevent your clients from having an
effective online measurement strategy?
2011 response: 245 2010 response: 177
Note: respondents could check up to three options.

Online Measurement and Strategy Report 2011–in association with Lynchpin
Page 61
All rights reserved. No part of this publication may be reproduced or transmitted in any form or by any means, electronic or mechanical, including photocopy, recording or any information storage
and retrieval system, without prior permission in writing from the publisher. Copyright © Econsultancy.com Ltd 2011
6.6.2. Main frustrations involved in managing web analytics
Companies were asked about their main frustrations associated with managing analytics. From
this, it is apparent that a lack of understanding about the data, issues with senior management
buy-in and the lack of time and budget are all significant barriers to managing web analytics.
Powered by Wordle
Many respondents cited information over-load or lack of time to process and understand the
information. Some companies report an undue focus on simply the data itself, rather than the
interpretations and insights that analytics provides.
Too much data / lack of time
“It's so time consuming.”
“Too much data. Too much emphasis by senior management on reporting everything, while refusing to actually
align KPIs directly to business objectives. Senior managers don't really understand analytics but believe that
these tools are some kind of silver bullet. They don't put enough focus on the offline processes and joined up
thinking that is required to ensure analytical tools can give us useful, measurable actionable insights against our
goals.”
“There's so much data it's often difficult to decide where to focus and be confident in numbers that are simply
contradicted by other figures.”
“Too much data.”
“Volume of data and lack of synthesis. Issues with tagging, tracking and dependence on IT.”
Company and agency respondents
As well as too much data, some respondents also feel that they cannot trust the data, particularly
if the tools are using multiple analytics tools which all give different benchmarks and metrics.

Online Measurement and Strategy Report 2011–in association with Lynchpin
Page 62
All rights reserved. No part of this publication may be reproduced or transmitted in any form or by any means, electronic or mechanical, including photocopy, recording or any information storage
and retrieval system, without prior permission in writing from the publisher. Copyright © Econsultancy.com Ltd 2011
Lack of confidence in the data
“Confidence in data; not enough time to tag all events on a content heavy site.”
“Amount of data, data not matching between different data sources, digital competences in overall marketing.”
“Accuracy and customer data.”
“Complexity of multiple data sets and consolidation. Analysis of data benchmarking.”
“Conflicting data, especially when using more than one tool.”
Company and agency respondents
Problems related to a lack of understanding about analytics, and consequently, a lack of senior
management buy-in, were also frequently cited. To rectify this, there is an on-going need to better
educate senior-level executives about measurement, and to translate the value of analytics into
metrics that impact the bottom line. Setting up dedicated teams and hiring people with the right
mix of skills would also help to address the issue of senior management buy-in.
Lack of understanding and senior management buy-in.
“A more robust understanding of what to measure. Why do our sites exist? Very few people if any can agree or
even have the answer to that question. They approach analytics through what is the tool capable of measuring
which means there is less analysis and more reporting and therefore very little context to the numbers which
doesn't help anyone.”
“Lack of internal buy-in.”
“Need dedicated resource to have the time to educate senior teams and then get the investment.”
“Gaining senior buy in and coordinating between departments.”
“Not understanding what you are doing.”
“Not having a strategy in the first place.”
“The gap between what is possible and what we can really do today considering IT blockage, lack of real
understanding of the needs and lack of implementation within the strategy.”
Company and agency respondents
Some respondents also mention the lack of budget, which is an on-going problem. However, as
companies address the issue of senior management buy-in and are able to demonstrate the value
of measurement tools, naturally this will result in more budget being shifted towards web
analytics.
Lack of budget
“Lack of training and limits of current technology/budget.”
“Getting budget and understating within the business of its value.”
“Complexity of requirements conflict with budget available. Lack of follow-on budget to allow action to occur
after insight.”
Company and agency respondents

Online Measurement and Strategy Report 2011–in association with Lynchpin
Page 63
All rights reserved. No part of this publication may be reproduced or transmitted in any form or by any means, electronic or mechanical, including photocopy, recording or any information storage
and retrieval system, without prior permission in writing from the publisher. Copyright © Econsultancy.com Ltd 2011
7. Appendix
7.1. Respondent profiles The figure below indicates that 59% of respondents in this survey are client-side, and some 41%
work for an agency, vendor or consultant who offer web analytics or related services.
Figure 60: Which of the following most accurately describes your job role?
Response: 840

Online Measurement and Strategy Report 2011–in association with Lynchpin
Page 64
All rights reserved. No part of this publication may be reproduced or transmitted in any form or by any means, electronic or mechanical, including photocopy, recording or any information storage
and retrieval system, without prior permission in writing from the publisher. Copyright © Econsultancy.com Ltd 2011
7.1.1. Company turnover
Some 43% of respondents report they have an annual turnover of under £10 million, including a
fifth (20%) who have a turnover of under £1 million. At the other end of the scale, almost a third
of respondents (32%) report an annual turnover of over £150 million, while 15% have a turnover
or more than £1 billion.
Figure 61: What is your annual company turnover?
Response: 346

Online Measurement and Strategy Report 2011–in association with Lynchpin
Page 65
All rights reserved. No part of this publication may be reproduced or transmitted in any form or by any means, electronic or mechanical, including photocopy, recording or any information storage
and retrieval system, without prior permission in writing from the publisher. Copyright © Econsultancy.com Ltd 2011
7.1.2. Business sector
The top business sectors covered in this survey are retail (15%), financial services (15%),
publishing (9%) and consultancy or marketing services (8%).
Figure 62: In which business sector is your organisation?
Response: 355
7.1.3. B2B or B2C focus
A third of companies (33%) are focused on B2B exclusively, while 45% are focused on B2C.
Around a fifth (22%) are focused on both areas.
Figure 63: Is your business more focused on B2B or B2C?
Response: 351

Online Measurement and Strategy Report 2011–in association with Lynchpin
Page 66
All rights reserved. No part of this publication may be reproduced or transmitted in any form or by any means, electronic or mechanical, including photocopy, recording or any information storage
and retrieval system, without prior permission in writing from the publisher. Copyright © Econsultancy.com Ltd 2011
7.1.4. Type of supply-side company
Over half of supply-side respondents (51%) work for a digital agency, while a fifth (20%) are self-
employed consultants. Just under a fifth (18%) say they work for supply-side companies that fall
into other categories, including PR and media agencies, web analytics vendors, and IT services.
Agencies
Figure 64: What type of organisation do you work for?
Response: 257

Online Measurement and Strategy Report 2011–in association with Lynchpin
Page 67
All rights reserved. No part of this publication may be reproduced or transmitted in any form or by any means, electronic or mechanical, including photocopy, recording or any information storage
and retrieval system, without prior permission in writing from the publisher. Copyright © Econsultancy.com Ltd 2011
7.1.6. Geography
Two-thirds of companies (66%) of respondents in this survey are UK-based, while 15% are based
in Europe and 10% are from the US.
Over half of supply-side respondents (55%) are UK-based, while 14% are from Europe, and 10%
are US-based.
Companies
Figure 65: In which country/region are you (personally) based?
Response: 355
Agencies (supply-side)
Figure 66: In which country/region are you (personally) based?
Response: 240


