
Occurrence and Control of Microbial Contaminants of Emerging Concern through
the Urban Water Cycle: Molecular Profiling of Opportunistic Pathogens and
Antibiotic Resistance
Emily Dawn Garner
Dissertation submitted to the faculty of the Virginia Polytechnic Institute and State
University in partial fulfillment of the requirements for the degree of
Doctor of Philosophy
In
Civil Engineering
Amy Pruden, Chair
Marc A. Edwards
Leigh-Anne H. Krometis
Brian D. Badgley
February 22, 2018
Blacksburg, VA
Keywords: opportunistic pathogens, antibiotic resistance, stormwater, drinking water,
distribution system, wastewater reclamation, direct potable reuse
Copyright 2018

Occurrence and Control of Microbial Contaminants of Emerging Concern through
the Urban Water Cycle: Molecular Profiling of Opportunistic Pathogens and
Antibiotic Resistance
Emily Dawn Garner
ABSTRACT
In an era of pervasive water stress caused by population growth, urbanization, drought, and
climate change, limiting the dissemination of microbial contaminants of emerging concern
(MCECs) is of the utmost importance for the protection of public health. In this dissertation, two
important subsets of MCECs, opportunistic pathogens (OP) and antibiotic resistant genes (ARG),
are studied across several compartments of the urban water cycle, including surface water,
stormwater, wastewater, recycled water, and potable water. Collectively, this dissertation advances
knowledge about the occurrence of OPs and ARGs across these water systems and highlights
trends that may be of value in developing management strategies for limiting their regrowth and
transmission.
Field studies of two surface water catchments impacted by stormwater runoff demonstrated
the prevalence of ARGs in urban stormwater compared to pristine, unimpacted sites, or to days
when no precipitation was recorded. The role of wastewater reuse in transmitting OPs and ARGs
was also investigated. Traditional tertiary wastewater treatment plants producing water for non-
potable use were found to be largely ineffective at removing ARGs, but plants using advanced
oxidation processes or ozonation paired with biofiltration to produce direct potable reuse water
were highly effective at removing ARGs. Non-potable reclaimed water consistently had greater
quantities of sul1, a sulfonamide ARG, and Legionella and Mycobacterium, two OPs of significant
public health concern, present than corresponding potable systems. Limited regrowth of OPs and
ARGs did occur in simulated premise (i.e., building) plumbing systems operated with direct
potable reuse waters, but regrowth was comparable to that observed in systems fed with potable
water derived from surface or groundwater. Advancements were also made in understanding the
role of several hypothesized driving forces shaping the antibiotic resistome in natural and
engineered water systems: selection by antimicrobials and other compounds, horizontal gene
transfer, and microbial community composition. Finally, whole-genome and metagenomic
characterization were applied together towards profiling L. pneumophila in clinical and water
samples collected from Flint, Michigan, where an economically-motivated switch to an alternative
water source created conditions favorable for growth of this organism and likely triggered one of
the largest Legionnaires’ Disease outbreaks in U.S. history.

Occurrence and Control of Microbial Contaminants of Emerging Concern through
the Urban Water Cycle: Molecular Profiling of Opportunistic Pathogens and
Antibiotic Resistance
Emily Dawn Garner
GENERAL AUDIENCE ABSTRACT
Population growth, urbanization, drought, and climate change have all driven many U.S.
municipalities to utilize alternative water sources, such as recycled wastewater, to offset demand
on traditional potable water sources. Many water providers have moved towards a modern
paradigm of utilizing multiple available water sources, recognizing the interconnectedness of
various components of the urban water cycle, leading to opportunities to improve sustainability,
optimize infrastructure use, stimulate economic growth, increase coordination among water
agencies, and identify new water resources from which to meet consumer needs. Though
advancements in treatment technologies throughout the twentieth century have largely succeeded
in eliminating waterborne disease outbreaks associated with contamination of municipal water
supplies by fecal pathogens in developed countries, several microbial contaminants of emerging
concern (MCECs) have garnered attention.
Two major groups of MCECs are considered in this dissertation: antibiotic resistance,
including antibiotic resistant bacteria (ARB) and antibiotic resistance genes (ARG), and
opportunistic pathogens (OP), such as Legionella pneumophila, the causative agent of
Legionnaires’ Disease. ARB are a rising cause of disease around the world and are a major
challenge to modern medicine because they make antibiotics used for treatment ineffective. OPs,
the leading cause of waterborne disease in the U.S. and other developed countries, have become
prevalent in engineered water systems where low nutrient concentrations, warm water
temperatures, and long stagnation times can facilitate their growth. Immunocompromised people,
including smokers and the elderly, are especially vulnerable to infection with OPs. The role of the
urban water cycle in facilitating the spread of these MCECs is not well understood. Here they were
studied across several compartments of the urban water cycle, including surface water, stormwater,
wastewater, recycled water (spanning a variety of intended uses, from non-potable to direct potable
reuse), and potable water.
Field studies were conducted of two watersheds impacted by stormwater runoff, one in the
arid Colorado Front Range under conditions of a rare, 1-in-1,000 year rainfall event, and one in
the humid climate of southwest Virginia, during three summer storms. Both studies demonstrated
the prevalence of ARGs in urban stormwater compared to pristine, unimpacted sites, or to days
when no precipitation was recorded.
The role of wastewater reuse in transmitting OPs and ARGs was also investigated.
Wastewater treatment plants producing water for non-potable use (i.e. applications such as
irrigation, but not for human consumption) were found to be largely inefficient at removing ARGs,
and this reclaimed water consistently had greater quantities of the sul1 ARG present than in
corresponding potable systems. In these systems, genes associated with the OPs Legionella and

iv
Mycobacterium as well as total bacteria were more abundant in reclaimed water than in
corresponding potable systems. In more advanced treatment plants utilizing advanced oxidation
processes or ozonation paired with biofiltration to produce direct potable reuse water (i.e. water fit
for human consumption), ARGs were very effectively removed by treatment, with abundances
often found to be higher in corresponding potable waters derived from surface or groundwater.
Limited regrowth of ARGs as well as OPs did occur in simulated home plumbing systems operated
with these waters, but regrowth was comparable to that observed in systems fed with potable water
derived from surface or groundwater.
Finally, a study of L. pneumophila in the Flint, Michigan drinking water system during use
of an alternative water source that has been identified as a likely cause of two Legionnaires’
Disease outbreaks revealed presence of multiple strains of the OP in the system. Genomic
comparisons revealed that strains isolated from hospital and residential water samples were highly
similar to clinical strains associated with the outbreaks.
Advancements were also made in understanding the role of several hypothesized driving
forces in shaping the antibiotic resistome in natural and engineered water systems: selection by
antimicrobials and other compounds, horizontal gene transfer, and microbial community
composition. Together, these chapters describe an advancement in knowledge regarding the
occurrence of OPs and ARGs in a variety of water systems, and highlight trends that may be of
value in developing management strategies for limiting regrowth or transmission of these bacteria
in various compartments of the urban water cycle.

v
ACKOWLEDGEMENTS
I would like to express sincere gratitude to my advisor, Dr. Amy Pruden, for her mentorship,
guidance, and support. I would also like to thank Dr. Marc Edwards for his encouragement and
support of my growth both as an engineer and researcher and as a person. You have both set a
tremendous example of compassionate and dedicated researchers and I have been so privileged
to work with you on projects that make improve people’s lives.
I would also like to thank Dr. Leigh-Anne Krometis and Dr. Brian Badgley for their support and
valuable feedback.
I would like to acknowledge all of the financial support that made this dissertation possible,
provided by the National Science Foundation, The Alfred P. Sloan Foundation Microbiology of
the Built Environment Program, the Water Environment Research Foundation, the Virginia
Water Resources Research Center, the Virginia Tech Institute for Critical Technology and
Applied Science Center for Science and Engineering of the Exposome, and the Virginia Tech
College of Agriculture and Life Sciences Integrated Grants Program. Thank you as well to the
Charles E. Via family, the American Water Works Association Abel Wolman Fellowship, and
the National Science Foundation Graduate Research Fellowship for supporting my work.
To the current and former Pruden and Edwards groups members, thank you for teaching me so
much and for allowing me to be a member of an incredible team. Thank you all for your
encouragement and friendship.
Finally, I would like to thank my friends and family. Thank you to everyone who has made
Blacksburg feel like home. Thank you to my family, Mom, Dad, and Lindsay, for teaching me to
love nature and to always seek to help others, the convictions that led me to become an
environmental engineer. Finally thank you to my husband, Aaron, for your unending patience
and for always encouraging me to pursue my dreams. Thank you all for your love and support.

vi
TABLE OF CONTENTS
ABSTRACT…. ............................................................................................................................... ii
GENERAL AUDIENCE ABSTRACT.......................................................................................... iii
ACKNOWLEDGEMENTS…. ....................................................................................................... v
TABLE OF CONTENTS…. .......................................................................................................... vi
LIST OF FIGURES…. ................................................................................................................... x
LIST OF TABLES…. .................................................................................................................... xi
CHAPTER 1 : INTRODUCTION .................................................................................................. 1 OVERVIEW AND RESEARCH MOTIVATION ..................................................................... 1 MICROBIAL CONTAMINANTS OF EMERGING CONCERN ............................................. 2
Antibiotic Resistance Genes ................................................................................................... 2
Opportunistic Pathogens ......................................................................................................... 2
RESEARCH OBJECTIVES ....................................................................................................... 3 ANNOTATED DISSERTATION OUTLINE AND ATTRIBUTIONS .................................... 3
REFERENCES ............................................................................................................................... 7 CHAPTER 2 : A HUMAN EXPOSOME FRAMEWORK FOR GUIDING RISK
MANAGEMENT AND HOLISTIC ASSESSMENT OF RECYCLED WATER QUALITY .... 10 ABSTRACT .............................................................................................................................. 10
INTRODUCTION .................................................................................................................... 10 UNIQUE ASPECTS OF RWDS DESIGN, OPERATION, AND WATER USE .................... 12
Routes of Exposure ............................................................................................................... 14
Physical and Operational Issues ............................................................................................ 14
IMPORTANT CHEMICAL DIFFERENCES ANTICIPATED BETWEEN RECYCLED AND
POTABLE WATER DISTRIBUTION SYSTEMS ................................................................. 16 Organic Matter ...................................................................................................................... 16
Redox zones and degradation of water quality ..................................................................... 20 Disinfectant residual ............................................................................................................. 20
CHRONIC CONTAMINANTS................................................................................................ 21 ARGS, OPS, AND OTHER EMERGING MICROBIAL CONCERNS .................................. 23
Opportunistic Pathogens ....................................................................................................... 24
Antibiotic Resistance Genes ................................................................................................. 24 Viruses .................................................................................................................................. 26
Amoebae ............................................................................................................................... 27 Algae ..................................................................................................................................... 28
CONCLUSION ......................................................................................................................... 28 ACKNOWLEDGEMENTS ...................................................................................................... 30
REFERENCES ......................................................................................................................... 30 CHAPTER 3 : STORMWATER LOADINGS OF ANTIBIOTIC RESISTANCE GENES IN AN
URBAN STREAM ....................................................................................................................... 39 ABSTRACT .............................................................................................................................. 39 INTRODUCTION .................................................................................................................... 39
MATERIALS AND METHODS .............................................................................................. 41 Site and storm descriptions ................................................................................................... 41 Sample collection and DNA extraction ................................................................................ 41 Molecular analysis and high throughput sequencing ............................................................ 41
Data analysis ......................................................................................................................... 42

vii
RESULTS AND DISCUSSION ............................................................................................... 43 Selection of ARG Targets for Characterizing Storm Loadings ............................................ 43 Gene loading rates and intra-storm variability...................................................................... 43 Event loading rates ................................................................................................................ 45
Association with fecal indicator bacteria and environmental variables ................................ 47 Diversity and richness of the resistome ................................................................................ 48
CONCLUSIONS....................................................................................................................... 51 ACKNOWLEDGEMENTS ...................................................................................................... 51 REFERENCES ......................................................................................................................... 51
CHAPTER 4 : METAGENOMIC PROFILING OF HISTORIC COLORADO FRONT RANGE
FLOOD IMPACT ON DISTRIBUTION OF RIVERINE ANTIBIOTIC RESISTANCE GENES
....................................................................................................................................................... 58 ABSTRACT .............................................................................................................................. 58 INTRODUCTION .................................................................................................................... 58 MATERIALS AND METHODS .............................................................................................. 59
Sample Collection and Preservation ..................................................................................... 59 Quantification of ARGs ........................................................................................................ 61
Quantification of Antibiotics and Metals .............................................................................. 61 16S rRNA Gene Amplicon Sequencing and Metagenomic Analysis ................................... 61 Statistical Analyses ............................................................................................................... 62
RESULTS AND DISCUSSION ............................................................................................... 62 Metagenomic analysis reveals shift in ARG profile following extreme flooding event ...... 62
Potential for selection pressure indicated by co-occurrence of ARGs and antibiotics ......... 64 Potential for co-selective pressures exerted by heavy metals ............................................... 67
Metagenomic scaffold associations reveals probable ARGs susceptible to co-resistance ... 67 Role of horizontal gene transfer in shaping the resistome .................................................... 68
Role of phylogeny in shaping the resistome ......................................................................... 69 CONCLUSIONS....................................................................................................................... 70 ACKNOWLEDGEMENTS ...................................................................................................... 70
REFERENCES ......................................................................................................................... 70 SUPPLEMENTARY INFORMATION FOR CHAPTER 4 .................................................... 75
CHAPTER 5 : METAGENOMIC CHARACTERIZATION OF ANTIBIOTIC RESISTANCE
GENES IN FULL-SCALE RECLAIMED WATER DISTRIBUTION SYSTEMS AND
CORRESPONDING POTABLE SYSTEMS ............................................................................... 84
ABSTRACT .............................................................................................................................. 84
INTRODUCTION .................................................................................................................... 84 METHODS ............................................................................................................................... 86
Site description, sample collection, and preservation ........................................................... 86 Water chemistry .................................................................................................................... 87 Quantification of antibiotic resistance genes ........................................................................ 88
Shotgun metagenomics and 16S rRNA amplicon sequencing ............................................. 88 Statistical Analysis ................................................................................................................ 89
RESULTS AND DISCUSSION ............................................................................................... 89 Metagenomic characterization of the resistome in reclaimed versus potable water ............. 89 Abundance of target ARGs in water and biofilms ................................................................ 91
Associations between ARG abundance and microbial ecological factors ............................ 93

viii
Potential for horizontal gene transfer .................................................................................... 95 Associations between water chemistry and ARGs ............................................................... 97 Implications for ARG dissemination via reclaimed water .................................................... 99
ACKNOWLEDGEMENTS .................................................................................................... 100
REFERENCES ....................................................................................................................... 100 SUPPLEMENTARY MATERIAL FOR CHAPTER 5 .......................................................... 108
Antibiotic Analysis ............................................................................................................. 108 Quantification of antibiotic resistance genes ...................................................................... 108
CHAPTER 6 : MICROBIAL ECOLOGY AND WATER CHEMISTRY IMPACT REGROWTH
OF OPPORTUNISTIC PATHOGENS IN FULL-SCALE RECLAIMED WATER
DISTRIBUTION SYSTEMS ..................................................................................................... 124
ABSTRACT ............................................................................................................................ 124 INTRODUCTION .................................................................................................................. 124 METHODS ............................................................................................................................. 126
Site description, sample collection, and preservation ......................................................... 126
Water Chemistry ................................................................................................................. 126 Quantification of OPs ......................................................................................................... 127
16S rRNA gene amplicon sequencing ................................................................................ 128 Shotgun metagenomic sequencing ...................................................................................... 128 Statistical Analyses ............................................................................................................. 128
RESULTS AND DISCUSSION ............................................................................................. 128 Overview of surveyed distribution systems ........................................................................ 128
Physicochemical water characteristics ................................................................................ 129 Occurrence of OP Gene Markers ........................................................................................ 129
Occurrence of OP Gene Markers in Biofilms ..................................................................... 130 Exploration of other potential OPs using Shotgun Metagenomics ..................................... 132
Relationship between abundance of OPs, water age, and related factors ........................... 133 Relationship between water chemistry measurements and abundance of OPs ................... 135 Microbial ecology – OP associations .................................................................................. 136
Corrosion-Associated Microbial Activity Assays .............................................................. 137 Implications for OP control in reclaimed distribution systems .......................................... 138
ACKNOWLEDGEMENTS .................................................................................................... 139 REFERENCES ....................................................................................................................... 139
SUPPLEMENTARY INFORMATION FOR CHAPTER 6 .................................................. 145
CHAPTER 7 : IMPACT OF BLENDING FOR DIRECT POTABLE REUSE ON PREMISE
PLUMBING MICROBIAL ECOLOGY AND REGROWTH OF OPPORTUNISTIC
PATHOGENS AND ANTIBIOTIC RESISTANT BACTERIA ................................................ 156 ABSTRACT ............................................................................................................................ 156 INTRODUCTION .................................................................................................................. 156 MATERIALS AND METHODS ............................................................................................ 158
Rig design and operation .................................................................................................... 158 Water chemistry .................................................................................................................. 159 Culturing ............................................................................................................................. 159 Quantitative polymerase chain reaction .............................................................................. 159 16S rRNA gene amplicon sequencing and shotgun metagenomics.................................... 161
Statistical Analysis .............................................................................................................. 161

ix
RESULTS AND DISCUSSION ............................................................................................. 161 Comparison of regrowth in simulated premise plumbing rigs............................................ 161 Microbial community composition of regrowth ................................................................. 163 Regrowth of OPPPs ............................................................................................................ 166
Occurrence of ARGs ........................................................................................................... 167 Regrowth of HPC bacteria capable of growth on antibiotic-supplemented media ............. 168 Microbially-influenced corrosion ....................................................................................... 170 Water chemistry .................................................................................................................. 171
CONCLUSIONS..................................................................................................................... 172
ACKNOWLEDGEMENTS .................................................................................................... 174 REFERENCES ....................................................................................................................... 174
SUPPLEMENTARY INFORMATION FOR CHAPTER 7 .................................................. 178 Pipe rig pre-testing .............................................................................................................. 178 Simulated treatment ............................................................................................................ 178 Quantitative polymerase chain reaction .............................................................................. 178
Data analysis for 16S rRNA gene amplicon sequencing and shotgun metagenomics ....... 179 References ........................................................................................................................... 179
CHAPTER 8 : WHOLE GENOME SEQUENCE COMPARISON OF CLINICAL AND
DRINKING WATER LEGIONELLA PNEUMOPHILA ISOLATES ASSOCIATED WITH THE
FLINT WATER CRISIS............................................................................................................. 185
ABSTRACT ............................................................................................................................ 185 INTRODUCTION .................................................................................................................. 186
MATERIALS AND METHODS ............................................................................................ 187 Study Site Description ........................................................................................................ 187
Sample Collection and Preservation ................................................................................... 187 Whole genome sequencing of L. pneumophila isolates ...................................................... 188
Shotgun metagenomic sequencing ...................................................................................... 189 RESULTS ............................................................................................................................... 189
Legionella Isolate characterization ..................................................................................... 190
Annotation of Shotgun Metagenomic Sequences for Identification of Other Putative
Pathogens ............................................................................................................................ 192
DISCUSSION ......................................................................................................................... 193 ACKNOWLEDGEMENTS .................................................................................................... 197
REFERENCES ....................................................................................................................... 198
SUPPLEMENTARY INFORMATION FOR CHAPTER 8 .................................................. 201
CHAPTER 9 : CONCLUSIONS AND RECOMMENDATIONS FOR FUTURE WORK ...... 209

x
LIST OF FIGURES
Figure 2-1: Key aspects of the exposome paradigm for managing RWDS .................................. 12 Figure 2-2: Overview of typical normalized composition and potential magnitude of dissolved
organic matter (DOM) in drinking water sources compared to recycled water sources .. 18 Figure 2-3: Processes by which antibiotic resistant bacteria and opportunistic pathogens (OPs) can
re-grow in RWDSs and relevant exposure routes ............................................................. 25 Figure 3-1: ARG abundance with respect to Stroubles Creek discharge. ..................................... 43 Figure 3-2: ARG relative abundances during storm phases ......................................................... 44
Figure 3-3: Cumulative ARG storm loading distributions ........................................................... 45 Figure 3-4: Average ARG storm event loading and corresponding equivalent background period
loading............................................................................................................................... 46 Figure 3-5: Distribution of ARGs by class in baseline (composite n=3) and peak (n=1) runoff storm
samples determined by shotgun metagenomic sequencing .............................................. 50 Figure 4-1: Poudre River sampling sites ....................................................................................... 60
Figure 4-2: Metagenomic characterizations of ARGs in Poudre River samples .......................... 63 Figure 4-3: Beta Diversity plots of microbial community phylogenetic composition ................. 64
Figure 4-4: Spearman’s Rank Correlation Coefficient between abundance of ARGs and antibiotics
or metals ............................................................................................................................ 66 Figure 4-5: Co-occurrence of ARGs, MRGs, and genetic markers linked to mobile genetic
elements on assembled scaffolds ...................................................................................... 68 Figure 5-1: Metagenomic characterization of ARGs by antibiotic class ...................................... 91
Figure 5-2: Network analysis depicting co-occurrence of ARGs among each other as well as with
plasmid gene markers on assembled scaffolds ................................................................. 97
Figure 6-1: Average relative abundance of DNA fragments matching additional OPs of interest
identified via shotgun metagenomic sequencing ............................................................ 133
Figure 6-2: Temperature, free chlorine, and abundances of 16S rRNA genes, Legionella spp., and
Mycobacterium spp. in select distribution systems......................................................... 135 Figure 6-3: Microbial community composition of potable vs. reclaimed distribution system
samples ............................................................................................................................ 137 Figure 7-1: qPCR abundances of 16S rRNA genes, OPs, and ARGs......................................... 162
Figure 7-2: Microbial community profiles for simulated premise plumbing pipe rigs .............. 165 Figure 7-3: Shotgun metagenomic abundances of ARGs by antibiotic class ............................. 169
Figure 7-4: Organic carbon measurements in water prior to incubation in simulated premise
plumbing pipe rigs .......................................................................................................... 173
Figure 8-1: Single nucleotide polymorphism (SNP) analysis of Legionella pneumophila isolates
......................................................................................................................................... 192 Figure 8-2: Comparison of shotgun metagenomic DNA sequence reads obtained from a cross
section of Flint tap water samples ................................................................................... 194

xi
LIST OF TABLES
Table 2-1: Water quality as a function of treatment process ........................................................ 13 Table 2-2: Overview of non-traditional routes of exposure for recycled water and putative risk of
infection or exposure......................................................................................................... 15 Table 2-3: Comparing water quality of typical drinking water vs different recycled water
applications ....................................................................................................................... 17 Table 2-4: Proposed threshold values to achieve biostability in drinking water distribution systems
........................................................................................................................................... 19
Table 2-5: Case studies of existing application of advanced treatment processes for intended reuse
purposes ............................................................................................................................ 22
Table 3-1: Spearman’s rank correlation coefficients between ARGs, fecal indicator bacteria, and
physicochemical water quality parameters ....................................................................... 48 Table 5-1: Overview of surveyed potable and reclaimed systems ............................................... 87 Table 5-2: Frequency of qPCR detection and abundance of ARGs ............................................. 94
Table 6-1: Overview of surveyed potable and reclaimed systems ............................................. 127 Table 6-2: Frequency of qPCR detectiona for 16S rRNA and opportunistic pathogen genes ... 131
Table 6-3: Spearman’s rank correlation coefficients for correlations between 16S rRNA or
opportunistic pathogen gene markers and physicochemical water quality parameters .. 134 Table 7-1: Blending scenarios, blending water source, treatment, disinfectants, and blending
location tested for each utility ......................................................................................... 160 Table 7-2: Abundnaces of microorganisms associated with microbially-influenced corrosion 171
Table 8-1: Summary of isolates by sequence type (ST), serogroup (SG), and sample origin .... 191

1
CHAPTER 1 : INTRODUCTION
OVERVIEW AND RESEARCH MOTIVATION
Engineering of water infrastructure has facilitated many of the greatest advancements of
modern society with respect to protecting public health and providing convenient and reliable
access to water resources. A stark decrease of approximately 40% in mortality rates in the early
twentieth century has been largely attributed to the application of water treatment technologies,
such as chlorination and filtration, for removing the microorganisms responsible for typhoid,
dysentery, and cholera in water.1 As water treatment became commonplace in the U.S.,
advancements in the engineering of distribution system infrastructure have facilitated the delivery
of safe water to consumers’ homes. While these engineering advancements have been critical in
addressing the most imminent threats to public health associated with drinking water, most being
pathogens of fecal origin, new challenges have arisen regarding the emergence of new
contaminants and society’s ability to procure sustainable water resources.
Population growth, urbanization, drought, and climate change have all driven many U.S.
municipalities to utilize alternative water sources, such as recycled wastewater, to offset demand
on traditional potable water sources.2,3 Of the 32 billion gallons of wastewater produced in the
U.S. each day, only approximately 7-8% is reused.2 In addition, de facto reuse, or the use of a
potable source water that is impacted by upstream wastewater discharges, has become increasingly
widespread. A study of 25 U.S. utilities demonstrated that under-low flow conditions, potable
water supplies consisted of between 7 and 100% of flow resulting from upstream wastewater
discharges.4 Given the prevalence of de facto reuse as well as the emergence of advanced water
treatment technologies, the strict division of water resources into categories such as surface water,
groundwater, stormwater, wastewater, recycled water, and drinking water is becoming antiquated
and fails to provide an appropriately nuanced characterization of most water resources. A more
holistic, integrated system of considering these resources that better accounts for the complexities
of water quality as well as the opportunities associated with modern water resources is needed.
The Water Research Foundation has proposed the “One Water” paradigm for describing
water resources, which is an “integrated planning and implementation approach to managing finite
resources for long-term resilience and reliability, meeting both community and ecosystem needs”.5
This approach highlights the interconnectedness of various components of the urban water cycle,
leading to opportunities to improve sustainability, optimize infrastructure use, stimulate economic
growth, increase coordination among agencies, and identify new water resources from which to
meet consumer needs.5 Accordingly, this dissertation applies the “One Water” framework for
understanding and addressing challenges associated with microbial contaminants of emerging
concern (MCECs). Two major sub-groups of MCECs are addressed in this dissertation: indicators
of antibiotic resistance, including antibiotic resistant bacteria (ARB) and antibiotic resistance
genes (ARG) and opportunistic pathogens (OP). Here these MCECs are examined across many
aspects of the interconnected “One Water” cycle, including surface water, stormwater, wastewater,
recycled water, and potable water. In particular, recycled water is emphasized and a spectrum of
recycled water practices are considered ranging from non-potable reuse (i.e., use of treated
wastewater to meet non-potable demand such as for irrigation) to direct potable reuse (DPR; i.e.
highly treated wastewater intended for direct human consumption).

2
MICROBIAL CONTAMINANTS OF EMERGING CONCERN
Antibiotic Resistance Genes
While the application of filtration and disinfection in modern water treatment has largely
addressed the challenges associated with traditional waterborne pathogens associated with fecal
contamination of water resources, new challenges for controlling the spread of microbial diseases
have arisen. In particular, growing attention has been focused on the potential for the urban water
cycle to disseminate ARB and their associated ARGs.6–8 Excretion of ARB and ARGs that pass
through the human and animal gut, along with residual unmetabolized antibiotics, into municipal
wastewater and to agricultural waste streams creates opportunities for dissemination of antibiotic
resistance to downstream users. Antibiotic resistance is a pressing public health concern,
responsible for at least two million infections and 23,000 deaths in the U.S. annually.9 Thus, it is
critical to understand the role of the urban water cycle in disseminating ARGs as well as to identify
approaches to limit such propagation.
While limiting transmission of resistant human pathogens is of the utmost importance,
autochthonous bacteria carrying ARGs should also be considered, as these could constitute
reservoirs of ARGs in the environment that could subsequently be transferred to pathogens via
horizontal gene transfer.10–12 The potential for horizontal gene transfer of ARGs between live cells
(i.e., conjugation), via bacteriophage infection (i.e., transduction), or via assimilation of
extracellular DNA (i.e., natural transformation) presents a unique challenge for water treatment,
as traditional treatment goals, such as the inactivation of pathogenic bacteria, may not be sufficient
to limit dissemination of ARGs.13,14 In addition, numerous compounds relevant to water can
exhibit selective properties in favor of ARB. Residual antibiotics, heavy metals, herbicides,
nanoparticles, and disinfectants are all likely to be present at some stage of the urban water cycle
and have all been shown to select for or correlate with ARB or ARG in the environment.15–22 Even
at sub-lethal concentrations of these compounds likely to occur in some water environments,
selection of ARB as well as stimulation of horizontal gene transfer can occur.22–28 The unique
challenges associated with the fate and transport of ARGs in water environments warrant research
into the predominant mechanisms governing behavior of these contaminants as well as into
strategies to limit their dissemination.
Opportunistic Pathogens
Another class of microorganisms has emerged over recent decades as a key contributor to
waterborne disease. OPs are a class of microorganisms that are native aquatic bacteria and, unlike
traditional waterborne pathogens, are not associated with fecal contamination.29 OPs are thought
to be the primary source of waterborne outbreaks in developed countries, with Legionella
pneumophila alone responsible for more drinking water-associated outbreaks than any other
pathogen in the U.S. since its surveillance began in 2001.30,31 Other common waterborne OPs
include Acanthamoeba polyphaga, Naegleria fowleri, Acinetobacter baumanni, Mycobacterium
avium, Burkholderia pseudomallei, Stenotrophomonas maltophilia, Pseudomonas aeruginosa,
and Aspergillus fumigatus. OPs tend to grow in engineered water systems and therefore cannot be
controlled through water treatment alone, but their control relies on factors such as distribution
system operation, maintenance of a secondary disinfectant residual, and premise plumbing

3
characteristics and usage.32 Engineered water distribution systems conveying either potable or
recycled water have several characteristics that facilitate the growth of OPs as water travels from
the treatment plant to the point of use. OPs are oligotrophic organisms, capable of growing in low
nutrient concentrations typical of these water systems.29,33 Many OPs are resistant to disinfection
and they tend to grow well in biofilms where they are protected from unamenable conditions.29,34
Other water chemistry parameters can also contribute to the growth of OPs in distribution systems;
for example, elevated iron has been linked with regrowth of L. pneumophila.35–37 In addition, many
OPs have complex ecological relationships with other water microorganisms. Among these
relationships are competition, antagonism, and obligate parasite-host interactions. Thus,
understanding the broader microbial community present in water systems and its influence on the
presence of OPs is of interest.34
Another notable characteristic of OPs is that they tend to infect via exposure routes other
than ingestion. L. pneumophila, A. baumanni, M. avium, B. pseudomallei, S. maltophilia, and A.
fumigatus can infect hosts' lungs via inhalation of aerosols;38–40 P. aeruginosa can infect via the
bloodstream, eyes, ears, skin, or lungs;41 and A. polyphaga can cause infection of the eyes or
central nervous system following inhalation or penetration of skin lacerations.42 These non-
ingestion exposure routes of OPs are particularly important given that non-potable recycled water
is often used for irrigation, cooling, and other applications that may result in aerosolization, thus
creating opportunities for exposure via inhalation. In addition, recycled water can be used for
snowmaking, irrigation of athletic and recreational facilities, and other applications that can result
in dermal contact, creating further opportunities for infection or colonization of human hosts by
OPs.43
RESEARCH OBJECTIVES
The aim of the research described herein was to characterize the specific routes of dissemination
and factors contributing to the propagation of MCECs (i.e. OPs and ARGs) through an integrated,
“One Water” perspective of water management. The specific objectives pursued were to:
1. Investigate the role of stormwater in transporting ARGs in surface water catchments,
2. Assess the role of wastewater reuse in disseminating ARGs,
3. Characterize the capacity of recycled wastewater to support growth of opportunistic
pathogens in distribution systems and premise plumbing, and
4. Assess the growth of opportunistic pathogens in a compromised potable water system.
ANNOTATED DISSERTATION OUTLINE AND ATTRIBUTIONS
Chapter 1: Introduction
This chapter details the motivation for the research described herein and provides context for the
specific research objectives addressed in this dissertation.
Chapter 2: A human exposome framework for guiding risk management and holistic assessment
of recycled water quality

4
This manuscript is a critical review examining the need for a more comprehensive framework for
use in assessing the public health risks associated with recycled water use. This review explores
important distinctions between traditional potable water and recycled water in terms of chemical
composition and its ability to support regrowth of microorganisms in distribution systems and
premise plumbing. This manuscript emphasizes the need to monitor water quality at the point of
use and to consider non-ingestion routes of exposure. It also outlines the characteristics of ARB
and ARGs that make them well suited for growth in recycled water, but these same characteristics
are also relevant to surface water, stormwater, and potable water, as well.
This manuscript has been published:
Garner, E., Zhu, N., Strom, L., Edwards, M., Pruden, A. (2016). A human exposome
framework for guiding risk management and holistic assessment of recycled water
quality. Environ. Sci.: Water Res Technol. 2:580-598.
Attributions: Chapter 2 was co-first authored with Ni Zhu. While the entire manuscript was written
collaboratively, Zhu led the authorship of the section of the manuscript titled “Important chemical
differences anticipated between recycled and potable water distribution systems,” while I led
“ARGs, OPs, and other emerging microbial concerns.” Co-author Laurel Strom contributed to the
discussion of free-living amoebae. Marc Edwards and Amy Pruden contributed guidance on
formulation of the critical commentary and assistance in manuscript preparation and review.
Chapter 3: Stormwater loading of antibiotic resistance genes in an urban stream
Chapter 3 addresses objective (1) by systematically exploring the loading of ARGs associated with
stormwater in Stroubles Creek, located in Blacksburg, VA. Five ARGs (two sulfonamide: sul1 and
sul2; two tetracycline: tet(O) and tet(W); and one macrolide: erm(F)) were monitored in Stroubles
Creek during three storm events and compared to baseline concentrations to assess the extent to
which stormwater runoff contributes to ARG dissemination in surface water. Physicochemical and
hydrometeorological factors were also measured to identify factors contributing to ARG
dissemination. Shotgun metagenomic sequencing was applied to a subset of samples to investigate
the breadth of the resistome (i.e. the full complement of known resistance genes), transcending the
limitations traditionally associated with molecular monitoring of ARGs.
This manuscript has been published:
Garner, E., Benitez, R., von Wagoner, E., Sawyer, R., Shaberg, E., Hession, W. C.,
Krometis, L. A. H., Badgley, B. D., Pruden, A. (2017). Stormwater loading of
antibiotic resistance genes in an urban stream. Water Research. 123:144-152.
Attributions: I conducted all analysis of samples, analyzed data, and led writing of the manuscript
for this chapter. Romina Benitez, Emily von Wagoner, Richard Sawyer, and Erin Schaberg
collected samples. W. Cully Hession, Leigh Anne Krometis, and Brian Badgley contributed to the
experimental design, supervised field work, and assisted with manuscript preparation and review.
Amy Pruden contributed guidance on molecular applications and assisted with manuscript
preparation and review.

5
Chapter 4: Metagenomic profiling of historic Colorado Front Range flood impact on distribution
of riverine antibiotic resistance genes
Chapter 4 further addresses objective (1) by seizing the opportunity to monitor ARGs in the Cache
la Poudre River in Northern Colorado before and after historic flooding, as well as after 10 months
of recovery post-flood. In addition, antibiotics and metals were also monitored to investigate the
role of such compounds in potential selection for ARB and ARGs. Horizontal gene transfer was
also explored as a potential mechanism contributing to dissemination of ARGs. Shotgun
metagenomic sequencing was again used to surpass the limitations of traditional molecular
analysis and allow identification of all known ARGs in collected samples.
This manuscript has been published:
Garner, E., Wallace, J. S., Argoty, G. A., Wilkinson, C., Fahrenfeld, N., Heath, L., Zhang,
L., Arabi, M., Aga, D. S., Pruden, A. (2016). Metagenomic profiling of historic
Colorado Front Range flood impact on distribution of riverine antibiotic resistance
genes. Scientific Reports. 6:38432.
Attributions: I coordinated collection of samples, conducted all molecular analyses, analyzed data,
and led the writing of this chapter. Joshua Wallace and Diana Aga conducted analysis of antibiotics
and metals. Gustavo Argoty, Lenwood Heath, and Liqing Zhang assisted with shotgun
metagenomic data analysis. Caitlin Wilkinson and Nicole Fahrenfeld contributed to sample
collection and analysis. Mazdak Arabi supervised sample collection. Amy Pruden provided
guidance on experimental design and data interpretation, and assisted in manuscript preparation
and review.
Chapter 5: Metagenomic characterization of antibiotic resistance genes in full-scale reclaimed
water distribution systems and corresponding potable systems
Chapter 5 addresses research objective (2) and describes a survey of four full-scale non-potable
reclaimed water distribution systems. In addition to monitoring ARGs both at the treatment plant
and at five points of use in each system, potential for selection by antibiotics and metals was
explored. Horizontal gene transfer was also considered as a mechanism for propagation of ARGs
in reclaimed water distribution systems. This manuscript is currently being reviewed for
publication in Environmental Science & Technology.
Attributions: I managed coordination among utilities for this project, planned and facilitated
sample collections conducted by utilities, conducted all molecular analysis of samples, analyzed
data, and led the writing of this chapter. Co-authors for this manuscript are Chaoqi Chen, Kang
Xia, Jolene Bowers, David Engalthaler, Jean McLain, Marc Edwards, and Amy Pruden. Chen and
Xia conducted analysis of antibiotics. Bowers, Engalthaler, McLain, Edwards, and Pruden
contributed to the experimental design and data interpretation, as well as manuscript preparation
and review.
Chapter 6: Microbial ecology and water chemistry impact regrowth of opportunistic pathogens
in full-scale reclaimed water distribution systems

6
This manuscript describes an investigation focused on objective (3). In this study, the samples
collected in the study described in chapter 5 were further analyzed for the presence of OP gene
markers. The role of the microbial interactions between OPs and the rest of the microbial
community was investigated, as was the role of water chemistry in contributing to regrowth of OPs
during distribution. This manuscript is currently being prepared for submission to Environmental
Science & Technology.
Attributions: I managed coordination among utilities for this project, planned and facilitated
sample collections conducted by utilities, conducted all molecular analysis of samples, analyzed
data, and led the writing of this chapter. Co-authors for this manuscript are Jean McLain, Jolene
Bowers, David Engalthaler, Marc Edwards, and Amy Pruden. McLain, Bowers, Engalthaler,
Edwards, and Pruden contributed to the experimental design and data interpretation, as well as
manuscript preparation and review.
Chapter 7: Impact of blending for direct potable reuse on premise plumbing microbial ecology
and regrowth of opportunistic pathogens and antibiotic resistant bacteria
This manuscript further explores objectives (2) and (3) by investigating OPS and ARGs in
simulated premise plumbing for direct potable reuse systems. This chapter outlines a study of the
abundance of ARGs and OPs after simulated use of premise plumbing with water derived from
direct potable reuse. Four utilities exploring potential application of DPR provided treated
wastewater for bench- or pilot-scale treatment simulated direct potable reuse. DPR waters were
blended with each utility’s traditional potable water (surface or groundwater) prior to simulated
premise plumbing use. The role of microbial ecology and water chemistry in contributing to
regrowth of OPs and ARB/ARGs were also considered. This manuscript is currently being
prepared for submission to Water Research.
Attributions: I coordinated collection of samples, conducted all chemical, culture-based and
molecular-based analyses, analyzed data, and led the writing of this chapter. Co-authors for this
chapter are Mandu Inyang, Elisa Garvey, Jeffrey Parks, Eric Dickerson, Justin Sutherland, Andrew
Salveson, Marc Edwards, and Amy Pruden. Inyang and Dickerson operated premise plumbing rigs
and collected on-site data. Parks constructed the rigs. Garvey, Sutherland, and Salveson
contributed to the experimental design and coordinated management of the project. Edwards and
Pruden contributed to the experimental design, data interpretation, and preparation of the
manuscript.
Chapter 8: Whole genome sequence comparison of clinical and drinking water Legionella
pneumophila isolates associated with the Flint Water Crisis
This manuscript addresses objective (4) by studying a full-scale potable water distribution system
experiencing microbial upset leading to propagation of an OP, Legionella pneumophila. This
chapter details a genomic characterization of clinical and water Legionella isolates obtained from
the city of Flint, Michigan following the Flint Water Crisis, in which use of an alternative water
source likely created conditions favorable for growth of Legionella. This manuscript is currently
being prepared for submission to Environmental Health Perspectives.

7
Attributions: I coordinated all sequencing, conducted data analysis, and led the writing of this
chapter. Co-authors for this chapter are Connor Brown, David Otto Schwake, William J. Rhoads,
Gustavo Arango-Argoty, Liqing Zhang, Guillaume Jospin, David Coil, Jonathan Eisen, Marc
Edwards, and Amy Pruden. Brown and Schwake contributed to sample collection and isolation of
L. pneumophila. Arango-Argoty, Zhang, Jospin, Coil, and Eisen contributed to the bioinformatics
analysis. Edwards and Pruden contributed to the experimental design and data interpretation, as
well as manuscript preparation and review.
Chapter 9: Conclusions and Recommendations for Future Work
This chapter synthesizes findings and summarizes the contribution of this research to the field of
environmental engineering. Recommendations for future research are also presented.
REFERENCES
(1) Cutler, D.; Miller, G. The Role of Public Health Improvements in Health Advances: The
Twentieth-Century United States Demography 2018, 42 (1), 1–22.
(2) USEPA, Guidelines for Water Reuse, United States Environmental Protection Agency,
2012.
(3) Gosling, S. N.; Arnell, N. W. A global assessment of the impact of climate change on water
scarcity. Clim. Change 2016, 134 (3), 371–385.
(4) Rice, J.; Wutich, A.; Westerhoff, P. Assessment of de facto wastewater reuse across the
U.S.: Trends between 1980 and 2008. Environ. Sci. Technol. 2013, 47, 11099–11105.
(5) Water Research Foundation. Blueprint for One Water; 2017.
(6) Pruden, A.; Pei, R. T.; Storteboom, H.; Carlson, K. H. Antibiotic resistance genes as
emerging contaminants: Studies in northern Colorado. Environ. Sci. Technol. 2006, 40 (23),
7445–7450.
(7) Wellington, E. M. H.; Boxall, A. B.; Cross, P.; Feil, E. J.; Gaze, W. H.; Hawkey, P. M.;
Johnson-Rollings, A. S.; Jones, D. L.; Lee, N. M.; Otten, W.; et al. The role of the natural
environment in the emergence of antibiotic resistance in gram-negative bacteria. Lancet
Infect. Dis. 2013, 13 (2), 155–165.
(8) Ashbolt, N. J.; Amezquita, A.; Backhaus, T.; Borriello, P.; Brandt, K. K.; Collignon, P.;
Coors, A.; Finley, R.; Gaze, W. H.; Heberer, T.; et al. Human Health Risk Assessment
(HHRA) for Environmental Development and Transfer of Antibiotic Resistance. Environ.
Health Perspect. 2013, 121 (9), 993–1001.
(9) US CDC, Antibiotic Resistance Threats in the United States, 2013.
(10) Graham, D. W.; Olivares-Rieumont, S.; Knapp, C. W.; Lima, L.; Werner, D.; Bowen, E.
Antibiotic Resistance Gene Abundances Associated with Waste Discharges to the
Almendares River near Havana, Cuba. Environ. Sci. Technol. 2011, 45 (2), 418–424.
(11) Lupo, A.; Coyne, S.; Berendonk, T. U. Origin and evolution of antibiotic resistance: the
common mechanisms of emergence and spread in water bodies. Front. Microbiol. 2012, 3,
1–13.
(12) Kristiansson, E.; Fick, J.; Janzon, A.; Grabic, R.; Rutgersson, C.; Weijdegard, B.;
Soderstrom, H.; Larsson, D. G. J. Pyrosequencing of Antibiotic-Contaminated River
Sediments Reveals High Levels of Resistance and Gene Transfer Elements. PLoS One
2011, 6 (2), e17038.

8
(13) Von Wintersdorff, C. J. H.; Penders, J.; Van Niekerk, J. M.; Mills, N. D.; Majumder, S.;
Van Alphen, L. B.; Savelkoul, P. H. M.; Wolffs, P. F. G. Dissemination of antimicrobial
resistance in microbial ecosystems through horizontal gene transfer. Frontiers in
Microbiology. 2016, 7 (173).
(14) Dodd, M. C. Potential impacts of disinfection processes on elimination and deactivation of
antibiotic resistance genes during water and wastewater treatment. J. Environ. Monit. 2012,
14 (7), 1754–1771.
(15) Sörme, L.; Lagerkvist, R. Sources of heavy metals in urban wastewater in Stockholm. Sci.
Total Environ. 2002, 298, 131–145.
(16) Brar, S. K.; Verma, M.; Tyagi, R. D.; Surampalli, R. Y. Engineered nanoparticles in
wastewater and wastewater sludge – Evidence and impacts. Waste Manag. 2010, 30 (3),
504–520.
(17) Karumathil, D. P.; Yin, H.-B.; Kollanoor-Johny, A.; Venkitanarayanan, K. Effect of
chlorine exposure on the survival and antibiotic gene expression of multidrug resistant
Acinetobacter baumannii in water. Int. J. Environ. Res. Public Health 2014, 11 (2), 1844–
1854.
(18) Shi, P.; Jia, S.; Zhang, X. X.; Zhang, T.; Cheng, S.; Li, A. Metagenomic insights into
chlorination effects on microbial antibiotic resistance in drinking water. Water Res. 2013,
47 (1), 111–120.
(19) Huang, J.-J.; Hu, H.-Y.; Wu, Y.-H.; Wei, B.; Lu, Y. Effect of chlorination and ultraviolet
disinfection on tetA-mediated tetracycline resistance of Escherichia coli. Chemosphere
2013, 90 (8), 2247–2253.
(20) Calomiris, J. J.; Armstrong, J. L.; Seidler, R. J. Association of Metal Tolerance with
Multiple Antibiotic Resistance of Bacteria Isolated from Drinking Water. Appl. Environ.
Microbiol. 1984, 47 (6), 1238–1242.
(21) Armstrong, J. L.; Calomiris, J. J.; Seidler, R. J. Selection of antibiotic-resistant standard
plate count bacteria during water treatment. Appl. Environ. Microbiol. 1982, 44 (2), 308–
316.
(22) Kurenbach, B.; Marjoshi, D.; Amábile-cuevas, C. F.; Ferguson, G. C.; Godsoe, W.; Gibson,
P.; Heinemann, J. a. Sublethal Exposure to Commercial Formulations of the Herbicides
Changes in Antibiotic Susceptibility in Escherichia coli and Salmonella enterica serovar
Typhimurium. MBio 2015, 6 (2), e0009-15.
(23) Zhang, P. Y.; Xu, P. P.; Xia, Z. J.; Wang, J.; Xiong, J.; Li, Y. Z. Combined treatment with
the antibiotics kanamycin and streptomycin promotes the conjugation of Escherichia coli.
FEMS Microbiol. Lett. 2013, 348 (2), 149–156.
(24) Xia, Z. J.; Wang, J.; Hu, W.; Liu, H.; Gao, X. Z.; Wu, Z. H.; Zhang, P. Y.; Li, Y. Z.
Improving conjugation efficacy of Sorangium cellulosum by the addition of dual selection
antibiotics. J. Ind. Microbiol. Biotechnol. 2008, 35 (10), 1157–1163.
(25) Song, B.; Wang, G. R.; Shoemaker, N. B.; Salyers, A. A. An Unexpected Effect of
Tetracycline Concentration: Growth Phase-Associated Excision of the Bacteroides
Mobilizable Transposon NBU1. J. Bacteriol. 2009, 191 (3), 1078–1082.
(26) Prudhomme, M.; Attaiech, L.; Sanchez, G.; Martin, B.; Claverys, J. P. Antibiotic stress
induces genetic transformability in the human pathogen Streptococcus pneumoniae.
Science. 2006, 313 (5783), 89–92.
(27) Úbeda, C.; Maiques, E.; Knecht, E.; Lasa, Í.; Novick, R. P.; Penadés, J. R. Antibiotic-
induced SOS response promotes horizontal dissemination of pathogenicity island-encoded

9
virulence factors in staphylococci. Mol. Microbiol. 2005, 56, 836–844.
(28) Beaber, J. W.; Hochhut, B.; Waldor, M. K. SOS response promotes horizontal
dissemination of antibiotic resistance genes. Nature 2004, 427, 72–74.
(29) Falkinham, J. Common Features of Opportunistic Premise Plumbing Pathogens. Int. J.
Environ. Res. Public Health 2015, 12 (5), 4533–4545.
(30) Yoder, J., Roberts, V., Craun, G.F., Hill, V., Hicks, L., Alexander, N.T., V.R., Calderon,
R.L., Beach, M.J., Carolina, N., 2008. Surveillance for Waterborne Disease and Outbreaks
Associated with Drinking Water and Water not Intended for Drinking --- United States,
2005--2006. Morb. Mortal. Wkly. Rep. 57, 39–62.
(31) Brunkard, J. M.; Ailes, E.; Roberts, V. A.; Hill, V.; Hilborn, E. D.; Craun, G. F.;
Rajasingham, A.; Kahler, A.; Garrison, L.; Hicks, L.; Carpenter, J.; Wade, T. J.; Beach, M.
J.; Yoder, M. Surveillance for waterborne disease outbreaks associated with drinking water–
United States, 2007–2008. Morb. Mortal. Wkly. Rep. 2008, 57 (SS-9), 1–38.
(32) Ashbolt, N. Environmental (Saprozoic) Pathogens of Engineered Water Systems:
Understanding Their Ecology for Risk Assessment and Management. Pathogens 2015, 4
(2), 390–405.
(33) Williams, K.; Pruden, A.; Falkinham, J.; Edwards, M. Relationship between Organic
Carbon and Opportunistic Pathogens in Simulated Glass Water Heaters. Pathogens 2015, 4
(2), 355–372.
(34) Wang, H.; Edwards, M. A.; Falkinham 3rd, J. O.; Pruden, A.; Falkinham, J. O.; Pruden, A.
Probiotic Approach to Pathogen Control in Premise Plumbing Systems? A Review. Env.
Sci. Technol. 2013, 47 (18), 10117–10128.
(35) Rhoads, W. J.; Garner, E.; Ji, P.; Zhu, N.; Schwake, D. O.; Pruden, A.; Edwards, M. A.
Distribution System Operational Deficiencies Coincide with Reported Legionnaires’
Disease Clusters in Flint, Michigan. Env. Sci. Technol. 2017. 51 (20), 11986-11995.
(36) Habicht, W.; Muller, H. E. Occurrence and parameters of frequency of Legionella in warm
water systems of hospitals and hotels in Lower Saxony. Zentralblatt fur Bakteriol.
Mikrobiol. und Hyg. 1988, 186 (1), 79−88.
(37) Bargellini, A.; Marchesi, I.; Righi, E.; Ferrari, A.; Cencetti, S.; Borella, P.; Rovesti, S.
Parameters predictive of Legionella contamination in hot water systems: Association with
trace elements and heterotrophic plate counts. Water Res. 2011, 45 (6), 2315–2321.
(38) Fraser, D. W.; Tsai, T. R.; Orenstein, W.; Parkin, W. E. Legionnaires’ Disease: Description
of an Epidemic of Pneumonia. N. Engl. J. Med. 1989, 297, 1189–1197.
(39) Peleg, A. Y.; Seifert, H.; Paterson, D. L. Acinetobacter baumannii: Emergence of a
Successful Pathogen. Clin. Microbiol. Rev. 2008, 21 (3), 538–582.
(40) Horsburgh, C. R. Mycobacterium avium complex infection in the acquired
immunodeficiency syndrome. N. Engl. J. Med. 1991, 324 (19), 1332–1338.
(41) Bodey, G. P.; Bolivar, R.; Fainstein, V.; Jadeja, L. Infections Caused by Pseudomonas
aeruginosa. Rev. Infect. Dis. 1983, 5 (2), 279–313.
(42) Marciano-Cabral, F.; Cabral, G. Acanthamoeba spp. as agents of disease in humans. Clin.
Microbiol. Rev. 2003, 16 (2), 273–307.
(43) Garner, E.; Zhu, N.; Strom, L.; Edwards, M.; Pruden, A. A human exposome framework
for guiding risk management and holistic assessment of recycled water quality. Environ.
Sci. Water Res. Technol. 2016, 2, 580-598.

10
CHAPTER 2 : A HUMAN EXPOSOME FRAMEWORK FOR GUIDING RISK
MANAGEMENT AND HOLISTIC ASSESSMENT OF RECYCLED WATER QUALITY
Emily Garner, Ni Zhu, Laurel Strom, Marc Edwards, Amy Pruden
ABSTRACT
Challenges associated with water scarcity and increasing water demand are leading many cities
around the globe to consider water reuse as a step towards water sustainability. Recycled water
may be used in a spectrum of applications, from irrigation or industrial use to direct potable reuse,
and thus presents a challenge to regulators as not all applications require the same level of
treatment. We propose that traditional drinking water standards identifying “safe” water quality
are insufficient for recycled water and that using the “human exposome” as a framework to guide
development of a risk management strategy offers a holistic means by which to base decisions
impacting water quality. A successful and comprehensive plan for water reuse must consider 1)
health impacts associated with both acute and chronic exposures, 2) all routes of exposure by which
individuals may encounter recycled water, and 3) water quality at the true point of use after storage
and transport through pipe networks, rather than at the point of treatment. Based on these principles
we explore key chemical differences between recycled and traditional potable water, implications
for distribution systems with respect to design and operation, occurrence of chronic contaminants,
and the presence of emerging and often underappreciated microbial contaminants. The unique
nature of recycled water has the potential to provide rapid regrowth conditions for certain microbial
contaminants in these systems, which must be considered to achieve safe water quality at the point
of use.
INTRODUCTION
Water reuse is essential for satisfying domestic and industrial water demand worldwide
and achieving water sustainability.1 Domestic wastewater can be treated to the necessary level of
quality and reused to reduce loss of treated effluent via discharge, relieve pressures on depleting
groundwater aquifers, and minimize extraction of water from fragile environments such as
drought-stricken surface waters. Treatment of wastewater for reuse is also cost effective compared
to alternative approaches, such as obtaining freshwater from desalination.2 Particularly when
wastewater is treated for direct or indirect potable reuse, a “multi-barrier” treatment framework is
typically used to ensure that multiple means of removing pathogens or harmful chemicals will
protect public health in the case of a process failure or other unexpected event that could
compromise water quality.3 However, while this approach is logical for controlling acute health
threats associated with water as it leaves the treatment facility, it does not address concerns with
respect to low-level chronic exposures or changes in water quality during distribution to the point
of use.4
A major concern for water reuse in general is the lack of federal regulations.5 Further, the
few nascent recycled water quality regulations and guidelines available, typically at the state and
local level, have been narrowly focused on fecal indicator bacteria (i.e., total and fecal coliforms).6–
8 This approach addresses traditional concerns regarding fecal-associated pathogens, but does not
necessarily provide insight into safeguarding microbial water quality during distribution.9,10 In

11
particular, microbial contaminants that are of concern due to their ability to grow within
distribution systems, such as opportunistic pathogens (OP), antibiotic resistant bacteria and their
associated antibiotic resistance genes (ARG), and free-living amoebae (FLA), have little or no
relationship with fecal indicator bacteria based standards. Alternative frameworks for assessing
and managing recycled water quality more holistically are emerging. For example, adaptations of
the Hazard Analysis and Critical Control Point (HACCP)11 paradigm, which originated in the food
safety industry, and the World Health Organization’s (WHO) Water Safety Plan (WSP)2,12 have
been proposed for use as risk management frameworks for recycled water. Application of these
adaptable frameworks could have the advantage of drawing attention to the entire treatment
process, rather than focusing solely on absence of indicator organisms as a proxy for safe water.
Still, we identify three key elements that should be taken into account for a truly comprehensive
consideration of public health concerns: 1) evaluation of health impacts associated with both acute
and chronic exposures; 2) accounting for all routes of exposure by which individuals may
encounter contaminants in recycled water; and 3) consideration of water quality at the true point
of use after storage and transport through pipe networks, rather than at the point of treatment.
A more holistic approach to characterizing the physical, chemical, and microbial
characteristics of recycled water, as well as the routes by which humans are exposed, can be
derived from the emerging concept of the “human exposome.” The exposome has been defined as
“the cumulative measure of environmental influences and associated biological responses
throughout the lifespan, including exposures from the environment, diet, behavior, and
endogenous processes.” 13 The exposome includes general (e.g., climate, urban environment),
specific (e.g., water, food, air), and internal (e.g., metabolism, gut/lung microbes) factors and their
role in disease.14 Clearly, water, and its corresponding chemical and microbial properties is a
fundamental component of the exposome. Water is fundamental to human health, survival, and
hygiene and is an integral part of daily life, including direct contact (i.e., drinking, cooking, and
showering) and indirect exposures via bioaerosols (i.e., cooling water, flush toilets, or lawn
irrigation). We propose that adopting the exposome paradigm as a model for recycled water quality
assessment can be used to guide development of an HACCP, WSP, or other comprehensive risk
management strategy that more accurately reflects the true risks and exposures associated with
water reuse and can strengthen implementation of existing risk management strategies.
In terms of safeguarding recycled water from the point of treatment to the point of use, we
note that there are important distinctions between potable and recycled water that should not be
ignored, particularly with respect to design, operation, and maintenance of recycled water
distribution systems (RWDS). In this critical review, we note key chemical differences between
recycled and potable waters, with a particular emphasis on organic matter, and explore
implications for RWDSs with respect to design, operation, and intended application. We also
discuss how these key differences impact the presence of chronic contaminants and emerging
concerns about the presence of OPs, ARGs, and other microbial contaminants (Figure 2-1). Our
goal is to proactively address plausible public health risks associated with practical realities of
recycled water use.

12
Figure 2-1: Key aspects of the exposome paradigm for managing RWDS. Aspects emphasize
holistic consideration of potential exposures to recycled water, including A) chemical distinctions
of recycled vs traditional potable water, such as enriched organic matter/nutrients, disinfectant
decay, critical reactive zones and chronic contaminants; B) emerging concerns about ARGs, OPs
and other microbial contaminants; C) nontraditional routes of exposure, including inhalation,
dermal contact.
UNIQUE ASPECTS OF RWDS DESIGN, OPERATION, AND WATER USE
There is a broad continuum of applications for water reuse, ranging from unintended de
facto reuse to direct potable reuse (DPR) produced by advanced treatment processes. De facto
reuse refers to a situation where reuse of treated wastewater occurs but is not planned, for example,
when a drinking water treatment plant intake is located downstream from a wastewater discharge.6
In the U.S., de facto reuse is widespread and becoming increasingly common in recent decades.
Rice et al. found that of the top 25 drinking water treatment plants most impacted by upstream
wastewater treatment plant (WWTP) discharges in the United States, the fraction of their water
source comprised of WWTP discharges increased from between 2 to 16% in 1980 to an average
of 68% under typical streamflow conditions in 2008.15 Some treatment plants received as much as
100% WWTP effluent under low flow conditions. Indirect potable reuse refers to the use of treated
wastewater to augment other potable source waters following retention in an environmental
buffer.6 Common environmental buffers include groundwater aquifer recharge and subsequent
withdrawal prior to drinking water treatment or intentional discharge of wastewater effluent
upstream or into a reservoir from which water is withdrawn for drinking water treatment. DPR
consists of treating wastewater for direct use as a source water for drinking water treatment. DPR
is currently limited in full scale application, with Windhoek, Namibia16 and Big Spring, Texas,

13
USA17 serving as prime examples, but there is growing interest in expanding DPR infrastructure
in the U.S.
Wastewater may also be treated for non-potable reuse when it can offset water demand
associated with landscape or recreation area irrigation, agricultural and food crop irrigation,
snowmaking, industrial use such as in cooling towers or in natural gas production, or to augment
environmental waters such as in groundwater aquifer recharge, river or stream flow augmentation,
or in wetlands.6 Though treatment requirements may reasonably be lower in these cases, all of
these non-potable reuse scenarios have relevant human exposures that should be taken into
consideration.
Table 2-1 illustrates that there is a wide range of observed recycled water quality
characteristics as a function of increasing levels of treatment. Unlike drinking water, where
consistent regulations are applied, recycled water is used for a wide spectrum of applications with
required treatment varying based on intended use. For example, the most stringent requirements
are applied to DPR, whereas residual nutrients can be viewed as a beneficial fertilizer in non-
potable reuse scenarios. Hence, efficient reuse treatments ideally match the intended purpose of
the recycled water. A number of U.S. states pioneering water reuse have recognized this concept
of “fit-for-purpose,” tailoring recycled water treatment regulatory guidelines based on end uses.
Determining the ideal configuration of treatment processes for different reuse scenarios would
greatly benefit from research integrating water treatment outcomes with the exposome paradigm
for more comprehensively considering chemical and microbial risks.
Table 2-1: Water quality as a function of treatment process
CAS
effluen
t
CAS
with
filtratio
n
CAS
with
BNR
CAS
with
BNR and
filtration
MBR
Filtration
with
chlorine
CAS with
filtration
and
chlorine
MBR
with
chlorin
e
MBR
with
UV/
ozone
Turbidity (NTU) 2-15 0.5-4 2-8 0.3-2 ≤1 1.5-8.7 3.6-6.3 1.7-4.3 0.2-0.5
Total suspended solids (mg/L) 5-25 2-8 5-20 1-4 <2
TOC (mg-C/L) 10-40 8-30 8-20 1-5 0.5-5 12-16 6-8 3-5 2-3
BDOC
(mg-C/L)
AOC (mg-C/L) 0.2-1.4 1-2 1-2 1-2 <1
Total nitrogen (mg-N/L) 15-35 15-35 3-8 2-5 <10 5-10 <1 1-3 5-6
Total phosphorus (mg-P/L) 4-10 4-8 1-2 ≤2 <0.3-5 3-5 1-2 5-9 <1
Volatile organic compounds (µg/L) 10-40 10-40 10-20 10-20 10-20
Total coliforms (CFU/100 mL) 104-10
510
3-10
510
4-10
510
4-10
5 <100 <1 1-10 1-10 1-10
Protozoa and cysts
(CFU/100 mL)
Viruses (CFU/100 mL) 10-103
10-103
101-10
310-10
31-10
3 present present present negative
Source29,192
; CAS = conventional activated sludge; BNR = biological nutrient removal; MBR = membrane bioreactor
43110 10-100 <1 ≤110-102 0-10 0-10 0-1 0-1
Water quality parameter (units)
Treatment processes
5-7 1-2 1-2 <1

14
Routes of Exposure
Stemming from the continuum of recycled water uses described above, there is also a range
of relevant exposure scenarios (Table 2-2). Use of a traditional water quality paradigm based on
monitoring of fecal indicator bacteria as a sole benchmark for establishing safe water quality
neglects risk associated with non-fecal pathogens and routes of exposure other than ingestion.
Though ingestion and aspiration are potential modes of exposure associated with DPR, inhalation
and dermal contact are important, yet often overlooked, exposure routes for potable water and even
more so for recycled water. Recycled water is commonly used for purposes that generate inhalable
aerosols, including use in cooling towers,18 spray irrigation,19,20 fire-fighting,21 toilet flushing,22 as
well as for aesthetic purposes, such as in decorative fountains.23–25 Importantly, relevant exposure
zones may be vast, with Legionnaire’s disease infection associated with inhalation of aerosols from
cooling towers located more than a mile away.18 There is also a strong likelihood of dermal contact
when recycled water is used for irrigation in public recreation areas. This may be particularly
relevant in irrigated parks, athletic fields, and snowmaking for recreational purposes. Dermal
abrasions or other lacerations that may be pre-existing or occur during use of these facilities create
an additional route of exposure for infection. When recycled water is used for food crop irrigation,
chemical and microbial constituents may also be transmitted to humans on or within crops via
ingestion.26 When recycled water is used for DPR, a number of often overlooked routes of
exposure should also be considered, for example, including use in humidifiers, ice machines, and
decorative water features. A more holistic characterization of human exposures to recycled water
constituents via such non-conventional routes is important for accurate assessment of health risk
associated with use of recycled water.
Physical and Operational Issues
Water and wastewater infrastructure degradation has become one of the leading threats to
public health and water security.27 Aging and poorly managed pipes can lead to a drastic decrease
in water quality of the transported water, arising from complex interactions among chemical,
physical, and microbial constituents. New design considerations are needed to ensure sustainable
management of recycled water infrastructure, considerate of their distinct physical and operational
characteristics relative to potable water systems.
In a recent survey of 71 recycled water systems in the US and Australia, Jjemba et al.
identified infrastructure issues as the most prevalent problem associated with managing and
maintaining water quality in RWDSs. Over 20% of recycled water facilities listed infrastructure
integrity as a water quality concern. The extensive list of infrastructure challenges revealed by the
survey includes infrastructure deterioration from high chlorine residual, maintenance of desired
pressure and flow during low and inconsistent usage, lack of redundant design and storage,
complicated branched distribution systems designed to supply multiple recycled applications from
a centralized treatment plant, high corrosivity of water damaging metal pipes, and effective
monitoring of the chemical and microbial quality.4 For example, to control microbial activity
resulting from nutrient-rich recycled water, up to 40 mg/L chlorine has been used in some systems,
which can potentially result in widespread damage to water infrastructure.28 Use of reservoirs as a
way to satisfy on-demand recycled water applications has also been observed to be a challenge,
with impaired water quality resulting from long stagnation time and proliferation of algae and

15
Table 2-2: Overview of non-traditional routes of exposure for recycled water and putative
risk of infection or exposure
aquatic vegetation.29 Experience from potable water systems has also shown that interaction of
iron pipes with water containing high organic content and oxygen tends to promote iron release,
producing unacceptable discolored water following stagnation.30 It is important to bear in mind
that a shift in water chemistry can have disastrous unintended consequences for corrosion,31–33 and
given the unique chemistry of recycled water (Table 2-3), it will be especially critical to bear this
in mind. For example, previous studies have documented cases where switching potable water
pipes to DPR pipes resulted in destabilization of the of existing corrosion scales and biofilms and
an undesirable degradation of water quality at the point of use.34 Despite the unresolved challenges
associated with transporting recycled water, this alternative type of water also presents a creative
opportunity for solving the challenging issue of leaking pipes. Tang et al. have successfully
demonstrated the autogenous repair phenomenon in copper and iron pipes in drinking water
distribution systems (DWDS) via beneficial corrosion deposition.35 Optimistically, with a more
Documented Concentrations in
Recycled Water
Documented
Concentrations in
Drinking Water
Staphylococcus aureus107
17%193
6.25%194
Pseudomonas aeruginosa108
108-10
9 colony forming
units (CFU)a; 195
88% (1±1 - 9±10 CFU/100
mL)b; 29
5.6% (up to 700.3±158.7
gene copies / mL)111
Acanthamoeba spp.169
104
trophozoitesc; 196
Not detected111
Cyanobacteria toxicity181
(up to ~140 µg/mL chlorophyll)197
Antibiotic resistant infections198
8% for MRSA of 17 % for
susceptible S. aureusd; 193
Legionella pneumophilae; 20
103 - 10
6 CFU
20081% (0.4x10
3±0.2x10
3 -
3.5x10³± 16x10
3CFU/100
5.6% (up to 219.4±23.8
gene copies / mL)111
Mycobacterium spp.201
104 - 10
7 CFU
ag; 19598.1% (2.1±104 - 4.2±103 gene
copies / mL)111
Pseudomonas aeruginosa202
108 - 10
9 CFU
a; 19588% (1±1 - 9±10 CFU/100 mL)
b; 295.6% (up to 700.3±158.7
gene copies / mL)111
Staphylococcus aureus19
17%193
6.25%194
Naegleria fowleri168,169
103
-105
trophozoites168,203
8-27%168
Cyanobacteria toxicity181
(up to ~140 µg/mL chlorophyll)197
Antibiotic resistant infections19
8% for MRSA of 17 % for
susceptible S. aureusd; 193
Fecal pathogens
Disinfection byproducts79
(9.70 - 399.37 µg TTHMh/L
79)
Opportunistic pathogen infection
Acanthamoeba keratitis169
104
trophozoi-tes196
Pseudomonas aeruginosa108
108 - 10
9 CFU
a; 19588% (1±1 - 9±10 CFU/100 mL)
b; 295.6% (up to 700.3±158.7
gene copies/ mL)111
Antibiotic resistant infections119–121
8% for MRSA of 17 % for
susceptible S. aureusd; 193
Pseudomonas aeruginosa108
108 - 10
9 CFU
a; 19588% (1±1 - 9±10 CFU/100 mL)
b; 29
Staphylococcus aureus107
17%193
6.25%194
Nasal
Aspiration
Eye and
Ear
Contact
Recreation,
Direct potable
reuse, Indirect
potable reuse
Opportunistic pathogen infection
Recreation,
Potable reuse
(sinus irrigation)Naegleria fowleri
168 8-27%168
aOral route of infection;
bBased on Pseudomonas spp.;
cBased on Acanthamoeba keratitis ;
dMRSA = Methicillin resistant Staphylococcus aureus ;
ePutative
hazards consider both Legionella pneumophila and other pathogenic Legionella ; fBased on detection of Legionella spp.;
gBased on Mycobacterium avium ;
hTTHM = Total trihalomethanes
Coloniz-
ation and
Delayed
Infection
Various Opportunistic pathogen infection
Dermal
Contact
Snowmaking,
Irrigation of
athletic and
recreation
facilities, Toilet
flushing22
Opportunistic pathogen infection of wounds
Inhalation
and
Aspiration
Cooling towers,
Spray irrigation,
Toilet flushing22
,
Fire suppress-
ion21
, Car
washing199
Opportunistic pathogen infection of lungs
[Percent Samples positive
(positive concentration range)]
Route of
Exposure
Recycled Water
Application (in
addition to
other potable
uses)
Putative Hazard Infectious Dose

16
diverse water chemistry profile, recycled water may be an even better candidate for protecting
aging pipes.
Temperature, as an overarching parameter, is another critical factor that could have
profound implications in designing and monitoring water reuse systems.36 Not only is temperature
directly related to microbial activity, disinfectant residual decay, corrosion rate, and dissolved
oxygen levels, it is also indirectly linked to consumption patterns, flow patterns and velocity, and
bulk water and biofilm interactions. Elevated recycled water temperatures may stem from extended
stagnation times, particularly during the day in cases where irrigation is conducted at night to limit
evaporation, as well as from use of above-ground pipelines, which facilitate transport of recycled
water over long distances.
For on-demand non-potable water reuse applications, such as agricultural irrigation,
landscaping, and toilet flushing, many studies have observed distinct consumption variations in
daily and seasonal demand patterns.37,38 For example, on a daily scale, the generation of
wastewater effluent usually peaks in the daytime when people are active, but the demand of
irrigation water usually occurs at night with an offset time of approximately 12 hours.
Discrepancies in user patterns makes water stagnation and storage, along with associated water
quality deterioration, a prominent concern in design and maintenance of recycled systems.
Multiple studies have also documented water quality deterioration during winter or high rainfall
periods in systems largely used for irrigation, due to low user frequency.39
True water age may differ substantially from the designed hydraulic residence time of the
recycled water systems based on the actual end-use applications. Emerging work in premise (i.e.,
building) plumbing systems, i.e. the water pipe networks within homes and buildings, has
highlighted unique systematic features in terms of longer stagnation time, elevated temperature,
and loss of disinfectant residual, which serve to stimulate microbial proliferation precisely at the
point of use, thus amplifying any potential exposure risk to end users.40,41 Similar investigations
are needed to quantify the risk of exposure associated with user-driven demand patterns in non-
potable reuse systems.
IMPORTANT CHEMICAL DIFFERENCES ANTICIPATED BETWEEN RECYCLED
AND POTABLE WATER DISTRIBUTION SYSTEMS
Organic Matter
One of the most distinctive characteristics of recycled water is the nature of dissolved
organic matter (DOM) and its occurrence at elevated levels. The organic matter in typical potable
waters consists of natural organic matter (NOM) derived mostly from oil, planktonic and
vegetative matter, and decay by-products in natural water sources. However, it is important to note
that DOM present in recycled waters may be quite distinct from that of potable water due to
different sources and treatment processes. In a recent review comparing organic matter data
published in the last 15 years for drinking water and recycled water systems, Hu et al. identified
four distinct classes of NOM in recycled water: recalcitrant DOM, soluble microbial products from

17
Table 2-3: Comparing water quality of typical drinking water vs different recycled water
applications
Private,
urban and
irrigation
Direct
Environ-
mental
reuse
Indirect
potable
recharge
Industrial
applica-
tions
6.5-8.5 6-9 6-9 7-9 7-8.5
Total
dissolved
solids (mg/L)
500
-Provides the most limiting nutrient
source for bacterial regrowth in
distribution systems;
Chemical
oxygen
demand
(mg/L)
100 70-100 70-100 70
-Consumption of carbons in the
distribution system is observed to relate
with increased bacterial activity 29,204
43393 43393 10
Near
saturation >0.5 >3 >8 >3
N/A 10 10 10
-Control bacterial growth in the
distribution system;
-Excess chlorine can cause carbon
fragmentation and DBPs formation
-Chlorine may exacerbate antibiotic
resistance 147,148
<10 15-20 10-20 10-Concerns for nitrification and
denitrification
< 0.2 a 2-20 1.5 0.2 1.5 -Concern for nitrification
2-5 0.2 0.2-Eutrophication and degradation of water
quality
-Caused “red water”
-Promote growth of corrosion bacteria
and damage pipe integrity
-May select for antibiotic resistant
bacteria205
-promote growth of certain corrosion
bacteria
-toxic to certain bacterial and aquatic
species at elevated levels
-May select for antibiotic resistant
bacteria143,206
5 0.5-2 0.5-2-May select for antibiotic resistant
bacteria143,206
0.05 0.05-May select for antibiotic resistant
bacteria207
Zero Zero < 200b
Zeroc
<200a Indicator bacteria for pathogenicity of
water
cBased on 7-day median with non > 14 per 100 mL
Zinc (mg/L)
Pesticide (mg/L)
Fecal coliforms
(CFU/100 mL)
(Source: 6,208,209
)aWHO guidelines for drinking water quality
b Based on 7-day median with none > 800 per 100 mL
Copper (mg/L) 1 0.2-1.0 0.2-1.0
Iron (mg/L) 0.3 2 2
0.05 0.05
Total Kjeldahl N
(mg/L)
Ammonia-N (mg/L)
Total phosphorus
(mg/L)
Biochemical oxygen
demand (mg/L)
DO (mg/L)
Total suspended solids
(mg/L)
Chlorine residual
(mg/L) <4 0.2-1.0
ParameterDrinking
Water
Recycled water applications
Implications for Distribution
pH
Carbon
source

18
biological wastewater treatment units, transformation products from advanced treatment, and
emerging contaminants associated with anthropogenic activities.42 It was concluded that DOM
composition differed significantly between recycled water and drinking water evaluated against
five critical chemical indicators: dissolved organic carbon (DOC), dissolved organic nitrogen,
assimilable organic carbon (AOC), estrogenic activity, and disinfection byproduct
(DBP) formation potential (Figure 2-2). DOC in drinking water ranged from 1.5-11.2 mg/L with
a median of 3.9 mg/L while that in recycled water ranged from 3.6-14.6 mg/L with a median of
7.5 mg/L, indicating recycled water as a much more nutrient rich environment for microbial
regrowth and byproduct formation. The heightened levels of biotoxicity, in terms of estrogenic
levels, is also widely reported in studies examining effluent organic matter compositions,
suggesting a potential health risk when used for recycling applications.43
Figure 2-2: Overview of typical normalized composition and potential magnitude of
dissolved organic matter (DOM) in drinking water sources compared to recycled water
sources. Presented in terms of dissolved organic carbon (DOC), dissolved organic nitrogen
(DON), assimilable organic carbon (AOC), estrogenic activity, total haloacetic acid formation
potential (THAAFP), and total trihalomethane formation potential (TTHMFP). (Reprinted from
Science of The Total Environment, 551-552, Hong-Ying Hu, Ye Du, Qian-Yuan Wu, Xin Zhao,
Xin Tang, Zhuo Chen, Differences in dissolved organic matter between reclaimed water source
and drinking water source, page 133-142, 2016, with permission from Elsevier.)
Biological stability, i.e., the ability of drinking water to suppress microbial growth in the
absence of disinfectants,44 is especially of concern for safe transport and storage of treated water.
Ideally, low nutrient water will limit growth in the distribution system, a strategy applied
successfully in some European countries for eliminating the need for secondary disinfectant in
DWDSs.45 The proportion of DOC that facilitates bacterial regrowth is typically measured by

19
either biodegradable dissolved organic carbon (BDOC) or AOC assays. An array of methods have
been used to best evaluate the bacterial growth potential of various types of water samples, with
established approaches generally being to measure the decrease in measured DOC over time or an
increase in indicator bacteria counts as a proxy for biologically available DOC. To date, there is
no widely accepted standardized method to quantify biostability. Reported threshold BDOC and
AOC values to achieve biostability in drinking water systems using different methods are
documented in Table 2-4. Existing surveys of recycled water systems have indicated orders of
magnitude higher levels of organic carbon than in typical U.S. drinking water systems.46,47 In
particular, biodegradable organic matter has been observed to be four or five times higher than that
of drinking water,29 while AOC can range from 505 to 918 µg/L in moderately treated recycled
water,48 compared to 18 to 189 µg/L in drinking water.49
Table 2-4: Proposed threshold values to achieve biostability in drinking water distribution
systems
Carbon source Threshold values Criteria Reference
BDOC
≤ 0.15 mg-C/L
Stable BDOC values
210,211,212
≤ 0.25 mg-C/L 213
≤ 0.30 mg-C/L at 15°C 210
≤ 0.15 mg-C/L No coliform growth 214
AOC
10 µg-C/L No heterotrophic plate count growth 215
50 µg-C /L No coliform growth 216
50 µg-C /L No V. cholerae growth 217
100 µg-C /L No E. Coli growth 49
The abundance and type of biodegradable carbon in recycled water calls into question the
extent to which the science of potable water delivery is directly translatable to recycled water
distribution. In the only available study of its kind, Jjemba et al. examined four RWDSs in the
U.S. and observed a trend of AOC and BDOC consumption with increasing residence time, with
an average reduction of 475 µg/L AOC and 370 µg/L BDOC from the distribution system point of
entry to the point of use.29 They concluded that the change in AOC and BDOC was due to enhanced
microbial activity, indicating significant changes in both the quantity and the quality of the
available carbon in the RWDSs. In parallel simulated RWDS loop studies, high organic carbon
was also observed to result in rapid consumption of disinfectant residuals in the distribution
systems.29 Up to 6 mg/L of chlorine was completely consumed within minutes in all systems,
leaving the remainder of the distribution system vulnerable to bacterial growth.29
Given the unique nature of organic matter and microbial composition of recycled water,
existing assays such as those for AOC or BDOC, may not be suitable. Only one study could be
found specifically aimed at adapting the AOC assay to recycled water.50 By including test strains
that are more ecologically representative of the sample waters, Zhao et al. concluded that the
standard P17 and NOX strains applied in the AOC assay largely underestimate levels in recycled
water.50 Khan et al. have similarly highlighted the need to optimize the BDOC method for recycled
water with their modified protocol improving repeatability and precision of results as verified by
independent biochemical oxygen demand and chemical oxygen demand measurements.51

20
Another negative consequence of NOM in distributed water is that it can accelerate
biocorrosion of pipes, which in turn can further stimulate AOC generation.39,52,53 BDOC is also
believed to play an important role in microbiologically induced corrosion.54,55 Recycled water, as
an abundant source of sulfate and nitrogen species, is likely to provide a nutrient-rich environment
for iron-oxidizing/reducing bacteria28,56,57 and sulfate-reducing bacteria34 to thrive in the DS,
further raising concerns about the potential for recycled water to accelerate damage to pipe
networks.
Redox zones and degradation of water quality
The distribution system can be thought of as a complex reactor with interrelated chemical
and biological reactions occurring spatially and temporally as the water passes through the pipes.58
The chemistry of treated potable water changes significantly during transport, with deteriorating
DWDS water quality documented since the early 1920s.59–64 Masters et al. illustrated the water
distribution system reaction phenomenon by demonstrating the formation of sequential redox
zones as a function of water age in simulated DWDS.65 Given greater physiochemical and
microbial complexity in RWDS, we speculate that they would foster development of even more
dramatic reactive zones, as a function of key physical and hydraulic design parameters such as
residence time, flow pattern, hydraulic surface to volume ratio, and pipe layout. Consistent with
this expectation, studies in lab and field-scale RWDS recently demonstrated elevated microbial
activity as indicated by rapid AOC/BDOC consumption, even at the earliest water age, and
attenuated organic carbon at higher water ages.29 Similarly in a 15 month monitoring study of
RWDSs, the general pattern observed was an initial reactive zone where rapid microbial regrowth
and chemical reactions occurred followed by relatively constant microbial and chemical reactivity
along the length of the pipes.66 Recognizing the reality of reactive zones in distribution systems
and more deliberately monitoring them may provide valuable insight into predicting and
preempting potential problems resulting from issues related to water chemistry.
Disinfectant residual
The intricate relationship between chlorine-based disinfectants and microbial and chemical
stability has been intensely studied in DWDSs. Due to its strong oxidizing power, chlorination is
generally the disinfectant of choice for microbial control in drinking water treatment. Chlorination
can greatly reduce general bacterial counts and help satisfy drinking water microbial regulations.
However, as a strong oxidizing agent, it is also known to interact with reductive species, metals,
organic matter and pipe materials and, as a result, significantly impact the downstream water
chemistry.67 The most widely noted issue with disinfectants is the fragmentation of complex
carbon compounds, thus increasing the fraction of biologically available carbon when high
concentrations of chlorine are used.29,46,47 Given the tendency to use fecal indicators as a
benchmark for assessing recycled water quality, it can be tempting for utilities to dose high
concentrations of chlorine. Due to a higher chlorine demand typical of recycled water, disinfectant
residual may be rapidly lost, leaving the rest of the RWDS vulnerable to microbial instability.66
Also important to note is that there is growing concern regarding the efficacy of chlorine-based
disinfectants against emerging resistant pathogens, which might be more abundant in recycled
water than traditional potable water.68–71 The potential for indiscriminate use of disinfectants to
inadvertently select disinfectant-resistant bacteria in the RWDS is worthy of exploring in future

21
research. Further, the ability of bacteria to repair and recover in the distribution system following
the shock of ultraviolet irradiation (UV), chlorine, or other disinfectant should be considered, as
exemplified by recovery of viable but non-culturable bacteria.72–74
Another issue worthy of consideration is the potential for enhanced DBP formation in
recycled waters.75,76 In a study comparing DBP formation between wastewater effluent and surface
water, Sirivedhin and Gray found that effluent-derived organic matter stimulated formation of
higher proportions of brominated DBPs.77 Nurizzo et al. evaluated the DBP formation potential
with various disinfection agents and concluded that hypochlorite yielded the greatest total
trihalomethanes, exceeding the Italian regulation for agricultural reuse, even when starting with
high quality recycled water.78 While DBPs tend to be ignored in recycled waters, particularly for
non-potable applications, it is important to recognize that inhalation is also a relevant exposure
route to consider, with one model characterizing the inhalation exposure to trihalomethanes of
irrigation workers using recycled water suggesting that there was a 13% risk of exceeding
acceptable exposure levels for cancer risk.79 The DBP issue illustrates that there can be tradeoffs
between microbial control and chemical risks and that clearer guidance and alternative approaches
are needed for recycled water to avoid negative consequences of blindly over-chlorinating.
CHRONIC CONTAMINANTS
The exposome highlights the importance of considering exposures over the course of one’s
lifetime, and thus, chronic contaminants are an important hazard worthy of consideration during
risk assessment of recycled water. WWTPs are generally not designed with the intention of
removing micro-constituents, such as pharmaceuticals and personal care products, recalcitrant
organic compounds, heavy metals, nanomaterials, and industrial agricultural additives.80–84 Jelic
et al. was able to detect 29 pharmaceutical products in the final effluent of one WWTP, versus 32
in the influent.83 Even when discharged at micro-concentrations, up to hundreds of nanograms per
liter of targeted micropollutants can still be consistently detected in receiving water bodies and
levels can accumulate.80 In a study that monitored 15 different WWTPs generating recycled water
for groundwater recharge, detectable levels of all 20 most commonly used antibiotics were still
found at elevated concentrations of 212-4,035 ng/L in recycled water and 19-1,270 ng/L in
groundwater.85 Several studies have also observed seasonal patterns of higher discharge of
pharmaceuticals and personal care products in wastewater effluent during low flow and less during
high flow periods.86,87
While increasing research attention and regulatory efforts have been devoted to
understanding prevalence of non-conventional chemical constituents in WWTPs and in receiving
environments,88 studies specifically focusing on characterization and risk assessment of emerging
chemical constituents of concern in the context of recycled water applications are limited.89–91
Advanced oxidation processes are particularly promising for removal of these pharmaceuticals and
other organic compounds (Table 2-5).92,93 Negative ecological effects of chemical constituents on
the aquatic environment have received much attention.94,95 Although a multi-barrier approach
consisting of sequential treatment processes has promise, questions remain regarding the ideal
treatment for various contaminant types and reasonable end point concentrations that are protective
of human and ecological health. Given the diverse applications of recycled water, relevant,
accurate and comprehensive risk models are needed considerate of the various environmental

22
spheres of influence. Wastewater effluent discharged to surface water has resulted in detection of
emerging pharmaceutical products in 80% of surface water samples.96 Thus, the science and
practice of distributing recycled water should proceed with a comprehensive approach to
understanding of the fate and impacts of these emerging contaminants in relevant environments.
Table 2-5: Case studies of existing application of advanced treatment processes for intended
reuse purposes. Treatment trains rely on use of biological activated carbon (BAC), reverse
osmosis (RO), ultrafiltration, and UV.
Advanced
treatment
processes
Intended
reuse Key Results Reference
Ozone/H2O2 +
BAC
Piloted
indirect
potable reuse
· H2O2/ozone process demonstrated
higher than 90% average removal rate in 21
of 31 targeted trace organic contaminants
and hormonal products
218
· BAC unit achieved higher than 95%
removal for all targeted contaminant except
benzophenone
· High degree microbial inactivation
· Raised concerns on elevated AOCs
and microbial regrowth potential after
H2O2/ozone treatment and
· Fluorescence excitation-emission
matrix showed distinctively transformed
organic matter footprints after treatment
Standalone BAC
DOC and
nitrogen
removal
· Diminishing DOC removal rate after
breakthrough is reached 219 · More than 50% of total nitrogen
removal rate
Ozone/peroxide +
RO
General reuse
applications
· Ozone and ozone/peroxide showed
similar trace organic contaminant removal
performance, likely due to inherently high
hydroxyl radicals in wastewater effluent. 220 · Formation of up to 48ng/L NDMA is
observed in wastewater effluent ozone
systems, raising concern for future reuse
applications
Ultrafiltration+
RO+UV
Groundwa-ter
recharge
· 13 out of 291 targeted compounds are
detected in post-UV and post-RO water 89 · Calculated risk quotient for detected
chemicals indicates safe reuse

23
ARGS, OPS, AND OTHER EMERGING MICROBIAL CONCERNS
It is important to recognize the complexity of RWDSs as an ecological habitat and that
microbial concerns reach beyond traditional indicator organism paradigms. Here we consider these
emerging microbial concerns within a comprehensive microbiome/exposome framework. Several
recent studies have utilized DNA sequencing to provide new insight into the composition of the
drinking water microbiome, but few have attempted to characterize the recycled water
microbiome. Recycled water, and even potable water, both represent surprisingly complex
microbial niches, housing a vast array of microbial species about which little is known. Normal
fecal indicator bacterial monitoring fails to provide information about the broader microbiome,
particularly with respect to oligotrophic organisms residing in distribution systems. Thus, a more
holistic approach for characterizing water quality is needed to accurately describe the water quality
at the point of use. Here we elaborate on microbial aspects of the exposome that are generally
unrecognized in the regulatory landscape and are particularly relevant to RWDSs. While
occurrence of fecal-associated pathogens is also of importance in recycled water systems, we have
limited the scope of this review to emerging microbial concerns.
Epidemiological studies examining associations between recycled water exposure and
disease have been limited and are crucial to identifying potential for disease transmission,
determining suitability for public use, and informing effective risk mitigation strategies. For
example, Durand and Schwebach did not find an association of gastrointestinal illness when
irrigating public parks with non-potable recycled water versus potable water (6% versus 7% of
park users reporting symptoms associated with recycled wastewater irrigation versus potable water
irrigation, respectively), though wet grass conditions during park usage were associated with an
increased rate of illness.97 A study of food crop irrigation with recycled water over a five year
period found no undesirable consequences to the quality of vegetables or soil, thus exposure
restrictions for farm workers were not deemed necessary.98 In one study conducted in the U.S.,
even irrigation using trickling filter effluent wastewater was not associated with an increased rate
of infection of rotavirus for residents of surrounding areas.99 A study that examined occurrence of
methicillin resistant Staphylococcus aureus (MRSA) in spray irrigation workers using recycled
water did not find the presence of the resistant organism in nasal swabs from any workers tested,
though the odds of carrying a non-resistant strain of the organism were slightly higher among spray
irrigation workers than among office workers.19 While isolated reports of disease stemming from
exposure to recycled water are helpful, rigorous, long-term epidemiological studies are needed to
more precisely determine sources of disease and accurately characterize risk and to address
emerging concerns.
Of rising interest is the influence of the distinct physiochemical nature of recycled water
on the regrowth or attenuation of emerging pathogens and contaminants, particularly considering
exposures relevant to non-conventional water reuse applications. Especially when organic carbon
is no longer a growth-limiting resource, conventional fecal bacterial indicators are likely to be even
less relevant to shifts in microbial ecology during distribution and the associated health risk.
Efforts are underway to recognize the importance of microbial ecological interactions in
distribution systems and the potential to harness them to foster a distribution system that favors
the growth of non-pathogenic bacteria over pathogenic ones.63 For example, Egli has identified the
survival and growth strategies of various microbes in low-nutrient and stressed environments and

24
competition between pathogens and the indigenous microbiota.100 A strategy of capitalizing upon
specific ecological interactions, such as nutritional competition, antagonist growth, and symbiotic
relationships for improved water quality and human health has been previously proposed for
drinking water.101 This presents a potentially transformative and highly relevant approach for
guiding RWDS management.
Opportunistic Pathogens
RWDSs offer several unique characteristics that make them particularly well-suited for
supporting regrowth of OPs. OPs in DWDSs are thought to be the primary source of waterborne
disease in developed countries, including the U.S.102,103 Unlike most fecal pathogens, OPs do not
typically impact the gastrointestinal system but rather they infect via alternative routes. To name
a few, Legionella pneumophila, Acinetobacter baumanni, Mycobacterium avium, Burkholderia
pseudomallei, Stenotrophomonas maltophilia, and Aspergillus fumigatus can infect hosts’ lungs
via inhalation;104–106 S. aureus infects via broken skin or mucus membranes;107 Pseudomonas
aeruginosa can infect hosts via the bloodstream, eyes, ears, skin, or lungs;108 and Acanthamoeba
spp. can cause infection of the eyes or central nervous system when inhaled or upon penetration
of skin lesions.109 These alternative routes of infection make OPs of particular interest for recycled
water, where exposure routes other than simple ingestion are more relevant. Inhalation of aerosols
from cooling towers or spray irrigation and dermal contact with irrigated surfaces, are important
routes of exposure that should be accounted for when considering risks associated with OPs in
recycled water.
OPs possess several distinct properties that make them particularly well suited for growth
in RWDSs (Figure 2-3). OPs tend to be resistant to disinfection, ranging from 21-658 times as
resistant to chlorine as Escherichia coli, as in the cases of P. aeruginosa and A. baumanii,
respectively.110 Many OPs are also resistant to phagocytosis by amoebae, becoming enclosed
within an amoebic cyst, where they can be further protected from disinfectants and other harsh
environmental conditions. Biofilms, where OPs tend to reside, offer protection from similar
environmental assaults, in addition to acidic and alkaline conditions and shear force from high
flow velocities.101,110 OPs also tend to grow at low organic carbon concentrations, which is
pertinent to both DWDSs and RWDSs.110 Stagnation is a notorious risk factor for OP outbreak,
and is common in RWDSs due to intermittent demand and seasonal shutdown.111
Antibiotic Resistance Genes
Antibiotic resistance among human pathogens is a major public health concern. In the U.S.,
the Centers for Disease Control has estimated that antibiotic resistant bacteria cause at least two
million infections and 23,000 deaths each year.112 ARGs are now well-known to be elevated in
human-contaminated surface waters,113–116 however with respect to human pathogens, specifically,
there is reasonable evidence that they can gain ARGs from environmental bacteria via horizontal
gene transfer (Figure 2-3).117,118 Therefore, all members of the microbiome carrying ARGs are
potentially of concern, particularly those that are common in human pathogens. In addition to the
possibility of infection by antibiotic resistant bacteria upon exposure, human hosts may also
become colonized and infected later.119–121 Similarly, it is possible that horizontal gene transfer
may occur from colonized non-pathogenic bacteria to pathogenic ones, leading to antibiotic

25
resistant infection. Thus, infection by antibiotic resistant bacteria may occur at a time and place
separate from that of the initial exposure, which complicates traditional dose-response risk
assumptions. ARGs or bacteria expressing ARGs corresponding to resistance to aminoglycoside,
beta-lactam, chloramphenicol, fluoroquinolone, lincomycide, linezolid, lipopeptide, macrolide,
sulfonamide, tetracyclines, and vancomycin antibiotics have been previously identified in recycled
water or environments directly impacted by irrigation, infiltration, or groundwater recharge using
recycled water.122–128 Since antibiotic resistance is a natural phenomenon inherent among many
bacteria, studies that compare these abundances to relevant control environments, such as
corresponding potable water or environments unimpacted by recycled water are of particular value.
While the nature of reusing human wastewater means that prior to treatment, human pathogens or
other bacteria carrying ARGs will be enriched compared to other source waters, multiple studies
have demonstrated that ARGs are often not removed during treatment, and in some cases, are even
amplified.129–132 Additionally, a study by Fahrenfeld et al. found that ARGs may also increase
during distribution of recycled water as a broader range of monitored ARGs were present in point
of use samples than in samples leaving the treatment plant.122
Figure 2-3: Processes by which antibiotic resistant bacteria and opportunistic pathogens
(OPs) can re-grow in RWDSs and relevant exposure routes.
Various features of recycled water potentially make it a prime medium for the growth of
antibiotic resistant bacteria and propagation of their associated ARGs during distribution. In
particular, residual antibiotics that escape removal during treatment can exert selective pressure
and encourage persistence of ARG-carrying bacteria. Though antibiotics will likely be found in
recycled water at sub-lethal concentrations, this low level exposure has actually been shown to
encourage the persistence of bacteria that carry ARGs via several mechanisms.133–135 Gullberg et
al. found that bacteria maintained plasmids carrying beta-lactam resistance genes even at
concentrations of antibiotics and heavy metals nearly 140 times below the compound’s minimum
inhibitory concentration.136 Other studies have also demonstrated that sublethal antibiotics can

26
stimulate propagation of ARGs by activating horizontal gene transfer.137–142 Prudhomme et al.
demonstrated that intermediate concentrations of streptomycin induced genetic transformation in
Streptococcus pneumoniae.140 Beaber et al. demonstrated that ‘SOS response’ among Vibrio
cholerae induced by the presence of ciprofloxacin enhances transfer of resistance genes via
conjugation.142 Low levels of antibiotics or other selective agents also act to encourage adaptive
evolution including development of resistance mutants.135
Antibiotics are not the only antimicrobials with potential to select for ARGs in recycled
water systems. Heavy metals, such as copper and iron (which are commonly used in distribution
systems), have long been suspected to select for ARGs in a variety of environments.143 Metal-
driven selection of ARGs is also of concern due to the presence of various heavy metals capable
of ARG selection common in many wastewaters, such as copper, zinc, nickel, mercury, and even
nanosilver.144,145 Disinfectants have also been known to select for ARGs.146–148 Following
chlorination, E. coli carrying the tetA tetracycline resistance gene were found to be even more
tolerant to tetracycline than non-chlorinated E. coli.148 Chlorination has also been reported to
concentrate a variety of ARGs in potable water.147
In addition to increasing ARGs via mutations, natural selection, and horizontal gene
transfer, presence of residual antibiotics can enhance biofilm formation.149 Studies of
Staphylococcus aureus, E. coli, and P. aeruginosa have all indicated that sub-inhibitory
concentrations of various antibiotics induce biofilm formation.150–152 Extensive biofilm formation
provides a fertile environment for the transfer of ARGs via horizontal gene transfer. Dense
microbial communities existing in biofilms with extensive cell to cell contact facilitate transfer via
conjugation.153,154 Notably, a key component of biofilms, extracellular polymeric substances, is
partially comprised of DNA expelled from cells.155 This may provide a reservoir of free DNA-
based ARGs, which have been shown to be available for uptake into cells via transformation.156,157
Biofilms themselves offer protection from antibiotics or other antimicrobial agents via the
principle of collective resistance, where cells are physically shielded from exposure to the
antimicrobial.158
While transmission of antibiotic resistant bacteria is an acute public health threat, the
possibility that water reuse may exacerbate the overall spread of antibiotic resistance has been
suggested.159 The water cycle as a whole has recently been subject to scrutiny as a potentially
important, yet understudied, route for the spread of antibiotic resistance.160–162 Given the gravity
of the antibiotic resistance problem and several lines of reasoning that water reuse can contribute
to its spread, additional research is urgently needed to determine whether consideration of
antibiotic resistance should be of central concern to comprehensive long-term risk management
strategies.
Viruses
Though removal of viruses in recycled water is of great importance, the presence of viruses
in recycled water is rarely monitored. Treatment goals and regulations regarding virus removal are
typically presented in the form of expected log-removal achieved through treatment such as
disinfection, largely due to the analytical difficulty of direct virus detection.6 Low recovery rates,
complex and time-consuming laboratory culture procedures, slow turn-around time for culture
results, and inability of molecular techniques to differentiate viable from non-viable viruses are

27
major challenges. Problems with the indirect monitoring paradigm may arise, however, because
viruses may be resistant to some modes of disinfection. For example, adenoviruses are known to
resist ultraviolet irradiation.6
A recent study of the viral metagenome (i.e., total DNA extracted from viral component)
revealed approximately 108 virus-like particles (VLP) per mL in non-potable recycled water, 1,000
times more than that measured in potable water.163 Further, genetic markers corresponding to
viruses targeting eukaryotes were non-detectable in potable water, while two percent of the viruses
in recycled water corresponded to eukaryotic hosts. This is logical, indicating that recycled water
is more susceptible to carrying viruses associated with humans than traditional potable water.
Bacteriophages, which represent the vast majority of viruses in both potable and recycled
waters, have their own relevance to human health as they act as agents of transfer for ARGs among
bacteria via transduction. Bacteriophages have been largely neglected as constituents in potable
and recycled water, though they have been found to be highly abundant in both raw wastewater
(108 VLP/mL) and in potable water (105-106 VLP/mL).163 Though transduction is generally
considered a rare transfer event, occurring only once in every 107-109 phage infections,164 the shear
abundance of bacteriophages documented in wastewater and potable water suggests that it is likely
a significant phenomenon in recycled water.
Amoebae
FLA are of growing concern in drinking water plumbing. Many FLA, such as
Acanthamoeba spp. and Vermameoba spp., graze on bacterial biofilms, and in doing so, can serve
as an important vector for amplifying and disseminating OPs.165 For example, Legionella,
Mycobacterium, and Pseudomonas spp. can amplify within FLA when grazed upon, which
enhances their dissemination and virulence.165
FLA themselves can sometimes be pathogenic, as is the case with keratitis or primary
amoebic meningoencephalitis (PAM).165 Similar to other OPs, non-ingestion routes of exposure
are important for pathogenic FLA. PAM is contracted when N. fowleri is forced into the nasal
cavity and migrates to the brain, while keratitis occurs when pathogenic Acanthamoeba spp. infect
the eye.166 Such exposures have been documented both in recreational and drinking water.109,167,168
However, relevant to recycled water, inhalation is under investigation as a primary transmission
method.168,169
The design of RWDSs can instigate the growth of biofilm, providing a reservoir for FLA
and an environment to promote interactions with amoeba-resisting bacteria. Recycled waters have
complex microbial communities and high availability of nutrients and other organic matter,
creating optimal conditions for biofilm establishment.170 Recent studies have also shown increased
chlorine resistance of FLA in the presence of naturally established biofilm171,172 and even non-
biofilm Vermamoeba spp. have been observed to resist chlorination.173
The relationship between L. pneumophila and FLA has been the most closely studied.
Resistance to amoebae can provide protection from disinfection, competition, environmental stress
and predation for L. pneumophila.174–176 Additionally, different FLA have been shown to survive

28
a wide range of temperatures, from 10-45°C, with some cases indicating survival near 0°C,
potentially allowing for protection of Legionella spp. and other amoeba-resisting bacteria during
winter, while amoeba are encysted.165,177–179 Little is still known about the diversity and abundance
of amoebae and their interactions with amoeba-resisting bacteria in drinking water, let alone
recycled water. Gaining a better understanding of the interactions between these microorganisms
and the ways in which this may aid the growth of pathogenic bacteria is essential for better
understanding the exposome associated with recycled water.
Algae
Algae are a common nuisance in recycled water systems. Though algal growth frequently
occurs in systems that use open storage rather than in distribution system pipes, algal cells can
persist throughout distribution systems where they have been found to correlate with AOC and
BDOC.29 Decaying algal cells can even be a source of BDOC, contributing to the regrowth of
other microbial constituents. Increased regrowth resulting from organic carbon made available
from decaying algal cells has also been linked with a loss of oxygen and dissipation of chlorine
residual.29 Elevated concentrations of algae may carry potential for the production of harmful algal
toxins. Cyanobacteria toxins have been linked to liver damage, neurotoxicity, gastroenteritis,
pneumonia, and even death.180 Though these symptoms primarily arise from ingestion of the
toxins, skin irritations and allergic reactions have been noted following dermal contact with
cyanobacteria toxins and respiratory disease has been documented following suspected inhalation
of the toxins.181 In cases where non-potable reuse occurs, these problems may be particularly
challenging to identify as taste and odor complaints from consumers will be unlikely.
CONCLUSION
Given the increasing trend of water reuse across the globe, it is important that all aspects,
including end-users, treatment plant management and operation, regulation, and public health
protection are taken into consideration in the planning and implementation of water reuse risk
management strategies. In this paper, we summarized the inherently different biochemistry of
recycled water in the distribution system as a function of various usage and operational factors.
We also discussed acute and long-term risks from the chemical and microbial contaminants that
may result from multi-dimensional usage routes and the associated exposure risks associated with
various end use of the recycled waters.
Increased awareness of traditionally underappreciated routes of exposure is key to the safe
use of recycled water. The history of drinking water epidemiology provides numerous examples
of infection via atypical routes of exposure. For example, in 2015 an outbreak of Legionnaire’s
disease that killed 12 people in New York City was linked to infection via aerosolized bacteria
from cooling towers sourced from potable drinking water.182 N. fowleri infection from drinking
water has occurred from use for nasal irrigation and in children via bathing or playing on an
outdoor water slide.168 Prevention of infection as a result of unintended exposures with recycled
water requires proactive action when planning for treatment and distribution of recycled water.
One key “critical control point” that must be considered in this planning is the distribution system
to avoid degradation of water quality during distribution. Treating recycled water to remove
nutrients and achieve biostability is one promising approach to help ensure safe water at the point

29
of use, but additional treatment at the point of use may also be necessary in some cases, as both
the physiochemical and microbial water quality change significantly during distribution and in
premise plumbing systems. A key research gap exists regarding the most effective approaches for
achieving biostability of recycled water during distribution. Specific and cost-effective
engineering controls for nutrient recycling and limiting regrowth during distribution must be
identified for respective intended uses. Identification of emerging chronic contaminants and
microbial contaminants is also important in minimizing potentially harmful exposures. Rigorous
studies that examine the health implications of non-traditional routes of exposure are quite limited
and are challenging to design given the lack of available knowledge about infectious doses
(particularly based on non-oral routes of exposure), magnitude of exposure via non-traditional
routes, and concentrations of emerging contaminants that are typical of recycled water. In addition,
virulence and individual susceptibility varies widely for many of the microbial constituents
discussed, making it important to consider exposure of immunocompromised populations when
assessing risk. In addition to these research gaps, development of quantitative microbiological risk
assessments (QMRA) would be extremely valuable for assessing the risk associated with the
presence OPs, ARGs, FLA, and viruses in recycled water. Epidemiological studies are also critical
for linking actual human illness and associated microbial sources with recycled water. Finally,
research is needed to tailor treatment processes to serve specific intended end uses (e.g. Table 2-
1), along with addressing emerging concerns identified here, while also developing best
management practices for distribution systems and premise plumbing for preventing re-growth
and deterioration of water quality in RWDSs.
While overarching regulations that consider the comprehensive implications and scope of
water recycling are currently lacking in many places, there are also practical lessons we can learn
from international leaders on adopting a comprehensive risk management approach towards water
reuse, notably the Australian Guidelines for Water Recycling, the WHO’s framework of WSP, and
the HACCP paradigm. Complementing these strategies with a holistic approach focused on the
human exposome creates a framework in which consideration of user exposures drives
establishment of water quality standards. Though a regulatory framework that addresses the
exposure risks and potential for regrowth associated with use of recycled water is an ideal long
term goal, an interim approach of more basic best management practices, as suggested by Jjemba
et al., are a reasonable starting place to enable municipalities utilizing recycled water to proactively
act to limit bacterial regrowth and preserve water quality at the point of use.29 Best management
practices should continually be revised as knowledge gaps are addressed, to ensure that the most
meaningful water quality indicators are targeted.
Adoption of the human exposome paradigm aims to ensure comprehensive understanding
of the risks and uncertainties regarding alternative recycled water sources. Enhanced knowledge
could provide critical guidance on safe management and inform much-needed regulations as the
use of recycled water expands. However, while this exposome approach highlights the multi-
dimensional risks and uncertainties regarding use of recycled water, it also must be recognized
that water reuse plays an integral role in addressing the grand challenge of water scarcity. It is
estimated that a third of the world’s population is currently living with moderate to high levels of
water stress183 and approximately 50% will suffer water shortages by 2025.184 Implementing water
reuse projects is imperative to meet water needs in drought-stricken areas, despite potential risks
and concerns. As estimated by Brown, current groundwater sources, serving more than half of the

30
world’s population, are largely overdrafted.185 Lack of new alternative water supplies,
compounded with increasing water demand, would further intensify water scarcity stress.
Schoreder et al. has estimated that the potential benefits of reuse could offset water supply for a
community of 1 million people by 75 million gallons per day.186 In cases where water scarcity
lends to the likelihood of de facto reuse, then it is better to have intentional reuse guided by best
management practices to minimize risks.
Equally important to the exposure risk from recycled water is lack of access to traditional
potable water sources and poor water quality due to degraded source water. Globally, there are
over five million deaths associated with poor water quality every year.187 Achieving an
environmentally sustainable and socially beneficially water demand management plan requires
proactive evaluation of the highest priority needs and identification of the key drivers and barriers
to the implementation of water recycling projects. Positive associations between information
availability and the acceptance of water reuse have been noted.188–190 As end users become more
educated about this alternative water source, their willingness to use recycled water increases.191
Nonetheless, comprehensively addressing all possible public health concerns will be an essential
pillar to advancing water sustainability.
ACKNOWLEDGEMENTS
This work was supported by The Alfred P. Sloan Foundation Microbiology of the Built
Environment Program, the National Science Foundation Award # 1438328, the Water
Environment Research Foundation Paul L. Busch Award, and Graduate Research Fellowship
Program Grant # DGE 0822220. We would like to thank Owen Strom for assistance creating
figures.
REFERENCES
1 J. Anderson, Water Sci. Technol. Water Supply, 2003, 3, 1–10.
2 D. Goodwin, M. Raffin, P. Jeffrey and H. M. Smith, Environ. Sci. Water Res. Technol.,
2015, 1, 709–722.
3 D. Gerrity, B. Pecson, R. S. Trussell and R. R. Trussell, J. Water Supply Res. T., 2013, 62,
321-338.
4 P. Jjemba, W. Johnson, Z. Bukhari and M. LeChevallier, J. Water Reuse Desalin., 2014, 4,
209.
5 F. Digiano and M. Aitkin, Workshop on Water Reuse and Dual Systems for Potable and
Non‐Potable Water Supply. U.S. Environmental Protection Agency, Final Report for
Cooperative Agreement: 83422201‐0, 2010, 51 pp.
6 USEPA, Guidelines for Water Reuse, United States Environmental Protection Agency,
2012.
7 NRMMC EPHC & AHMC, Australian Guidelines for Water Recycling: Managing Health
and Environmental Risks (Phase 1), Natural Resource Ministerial Management Council,
Environment Protection and Heritage Council and Australian Health Ministers, 2006.
8 J. Lahnsteiner and G. Lempert, Water Sci. Technol., 2007, 55, 441-448.
9 M. Agulló-Barceló, F. Oliva and F. Lucena, Environ. Sci. Pollut. Res., 2013, 20, 4448–
4454.

31
10 V. J. Harwood, A. D. Levine, T. M. Scott, V. Chivukula, J. Lukasik, S. R. Farrah and J. B.
Rose, Appl. Environ. Microbiol., 2005, 71, 3163–3170.
11 J. Swierc, D. Page, J. Van Leeuwen and P. J. Dillon, CSIRO L. Water Tech. Rep., 2005, 20.
12 J. Bartram, L. Corrales, A, Davison, D. Deere, D. Drury, B. Gordon, G. Howard, A.
Rinehold and M. Stevens, Water safety plan manual: step-by-step risk management for
drinking-water suppliers, World Health Organization, Geneva, 2009.
13 G. W. Miller and D. P. Jones, Toxicol. Sci., 2014, 137, 1–2.
14 C. P. Wild, Cancer Epidemiol. Biomarkers Prev., 2005, 14, 1847–1850.
15 J. Rice, A. Wutich and P. Westerhoff, Environ. Sci. Technol., 2013, 47, 11099–11105.
16 M. Lafforgue and V. Lenouvel, Environ. Sci. Water Res. Technol., 2015, 1, 622–631.
17 J. Sutherland, E. Steinle-Darling, A. Salveson and E. Mancha, presented in part at Water
Quality Technology Conference, Fort Worth, July, 2015.
18 D. G. Addiss, J. P. Davis, M. LaVenture, P. J. Wand, M. A. Hutchinson and R. M.
McKinney, Am. J. Epidemiol., 1989, 130, 557–568.
19 R. E. Rosenberg Goldstein, S. a Micallef, S. G. Gibbs, X. He, A. George, A. A. R. Sapkota,
S. W. Joseph and A. A. R. Sapkota, Int. J. Environ. Res. Public Health, 2014, 11, 4340–
4355.
20 F. Brissaud, E. Blin, S. Hemous and L. Garrelly, Water Sci. Technol., 2008, 57, 781–787.
21 K. E. Borboudaki, N. V. Paranychianakis and K. P. Tsagarakis, Environ. Manage., 2005,
36, 610–623.
22 C. P. Gerba, C. Wallis and J. L. Melnick, Appl. Microbiol., 1975, 30, 229–237.
23 W. G. Hlady, R. C. Mullen, C. S. Mintz, B. G. Shelton, R. S. Hopkins and G. L. Daikos,
Am. J. Epidemiol., 1993, 138, 555–562.
24 T. E. Haupt, R. T. Heffernan, J. J. Kazmierczak, H. Nehls-Lowe, B. Rheineck, C. Powell,
K. K. Leonhardt, A. S. Chitnis and J. P. Davis, Infect. Control Hosp. Epidemiol., 2012, 33,
185–191.
25 T. N. Palmore, F. Stock, M. White, M. Bordner, A. Michelin, J. E. Bennett, P. R. Murray
and D. K. Henderson, Infect Control Hosp Epidemiol, 2009, 30, 764–768.
26 J. B. Rose and C. S. Clark, Crit. Rev. Environ. Control, 1986, 16, 231–256.
27 ASCE 2013 Report Card for America's Infrastructure,
http://infrastructurereportcard.org/a/#p/home, (accessed December 2015).
28 H. Wang, C. Hu, X. Hu, M. Yang and J. Qu, Water Res., 2012, 46, 1070–1078.
29 P. K. Jjemba, L. a. Weinrich, W. Cheng, E. Giraldo and M. W. LeChevallier, Appl. Environ.
Microbiol., 2010, 76, 4169–4178.
30 P. Sarin, V. L. Snoeyink, J. Bebee, K. K. Jim, M. A. Beckett, W. M. Kriven and J. A.
Clement, Water Res., 2004, 38, 1259–1269.
31 USEPA, http://archive.epa.gov/region03/dclead/web/html/index-3.html (accesed January
2016).
32 Mlive,
http://www.mlive.com/news/flint/index.ssf/2015/09/new_testing_shows_flint_water.html
(accessed January 2016)
33 MATCOR, http://www.matcor.com/water-line-break-corrosion-a-headache-for-tucson-
water/ (accessed January 2016)
34 F. Yang, B. Shi, Y. Bai, H. Sun, D. a. Lytle and D. Wang, Water Res., 2014, 59, 46–57.
35 M. Tang, S. Triantafyllidou and M. A. Edwards, Environ. Sci. Technol., 2015, 49, 8697-
8703.

32
36 M. V. Story and C. E. Kaucner, Water Quality Research Australia: Research Report 79,
2009, 122 pp.
37 H. Rufenacht and H. Guibentif, J. Water Supply Res. Technol., 1997, 46, 196–201.
38 R. M. Willis, R. A. Stewart, P. R. Williams, C. H. Hacker, S. C. Emmonds and G. Capati,
Desalination, 2011, 272, 201–211.
39 J. Nawrocki, U. Raczyk-Stanisławiak, J. Świetlik, A. Olejnik and M. J. Sroka, Water Res.,
2010, 44, 1863–1872.
40 P. Ji, J. Parks, M. A. Edwards and A. Pruden, PLoS One, 2015, 10, e0141087.
41 W. J. Rhoads, A. Pruden and M. A. Edwards, Environ. Sci. Water Res. Technol., 2016, 2,
164–173.
42 C. Z. Hu H-Y, Du Y, Wu Q-Y, Zhao X, and Tang X, Sci Total Env., 2016, 551-552, 133–
142.
43 H. K. Shon, S. Vigneswaran and S. A. Snyder, Crit. Rev. Environ. Sci. Technol., 2006, 36,
327–374.
44 B. Rittman and V. Snoeyink, J. Am. Water Works Assoc., 1984, 76, 106–114.
45 P. W. J. J. van der Wielen and D. van der Kooij, Water Res. , 2010, 44 , 4860–4867.
46 P. Thayanukul, F. Kurisu, I. Kasuga and H. Furumai, Water Res., 2013, 47, 225–232.
47 L. A. Weinrich, P. K. Jjemba, E. Giraldo and M. W. LeChevallier, Water Res., 2010, 44,
5367–75.
48 M. Karim and M. W. LeChevallier, Microbiological quality of reuse water; Internal Report,
Voorhees, NJ, 2005.
49 M. W. LeChevallier, N. J. Welsh and D. B. Smith, Appl. Envir. Microbiol., 1996, 62, 2201–
2221.
50 X. Zhao, H. Hu, S. Liu, F. Jiang, X. Shi, M. Li and X. Xu, Front. Environ. Sci. Eng., 2013,
7, 483–491.
51 E. Khan, R. W. Babcock Jr., I. H. Suffet and M. K. Stenstrom, Water Environ. Res., 1998,
70, 1025–1032.
52 L. S. McNeill and M. Edwards, J. Am. Water Works Assoc., 2014, 93, 88–100.
53 M. Edwards and N. Sprague, Corros. Sci., 2001, 43, 1–18.
54 A. K. Camper, Int. J. Food Microbiol., 2004, 92, 355–64.
55 M. W. LeChevallier, C. D. Lowry, R. G. Lee and D. L. Gibbon, J. Am. Water Works Assoc.,
1993, 85, 111–123.
56 H. Wang, C. Hu, L. Zhang, X. Li, Y. Zhang and M. Yang, Water Res., 2014, 65, 362–370.
57 Y. Zhu, H. Wang, X. Li, C. Hu, M. Yang and J. Qu, Water Res., 2014, 60, 174–181.
58 A. K. Camper and P. Dircks, Distribution system as reactor, 1996,
https://www.biofilm.montana.edu/resources/images/industrial-systems-
processes/distribution-system-reactor.html, (accessed January 2016).
59 S. T. Powell, J. Am. Water Works Assoc., 1921, 8, 522–529.
60 A. M. Buswell, J. Am. Water Works Assoc., 1938, 30, 1651–1654.
61 N. J. Howard, J. Am. Water Works Assoc., 1940, 32, 1501–1506.
62 J. Hall, A. D. Zaffiro, R. B. Marx, P. C. Kefauver, E. R. Krishnan, R.C. Haught and J. G.
Herrmann, J. Am. Water Works Assoc., 2007, 99, 66–77.
63 D. Berry, C. Xi and L. Raskin, Curr. Opin. Biotechnol., 2006, 17, 297–302.
64 P. Piriou, B. E. Rittmann and J. E. Woolschlager, Urban water J., 2005, 2, 69–79.
65 S. Masters, H. Wang, A. Pruden and M. A. Edwards, Water Res., 2015, 68, 140–149.
66 O. M. Ajibode, C. Rock, K. Bright, J. E. T. Mclain, C. P. Gerba and I. L. Pepper, J. Water

33
Reuse Desalin., 2013, 3, 185–196.
67 M. K. Ramseier, A. Peter, J. Traber and U. von Gunten, Water Res., 2011, 45, 2002–2010.
68 K. A. Steed and J. O. Falkinham, Appl. Environ. Microbiol., 2006, 72, 4007–4011.
69 R. H. Taylor, J. O. Falkinham, C. D. Norton and M. W. LeChevallier, Appl. Environ.
Microbiol., 2000, 66, 1702–1705.
70 I. Marchesi, P. Marchegiano, A. Bargellini, S. Cencetti, G. Frezza, M. Miselli and P.
Borella, J. Hosp. Infect., 2011, 77, 47–51.
71 M. Dupuy, S. Mazoua, F. Berne, C. Bodet, N. Garrec, P. Herbelin, F. Ménard-Szczebara,
S. Oberti, M.-H. Rodier, S. Soreau, F. Wallet and Y. Héchard, Water Res., 2011, 45, 1087–
94.
72 J.-J. Huang, H.-Y. Hu, F. Tang, Y. Li, S.-Q. Lu and Y. Lu, Water Res., 2011, 45, 2775–
2781.
73 M. Guo, J. Huang, H. Hu and W. Liu, Biomed. Environ. Sci., 2011, 24, 400–407.
74 J. Süss, S. Volz, U. Obst and T. Schwartz, Water Res., 2009, 43, 3705–16.
75 R. M. Clark and M. Sivaganesan, J. Environ. Eng., 1998, 124, 1203–1210.
76 S. W. Krasner, Philos. Trans. A. Math. Phys. Eng. Sci., 2009, 367, 4077–4095.
77 T. Sirivedhin and K. A. Gray, Water Res., 2005, 39, 1025–1036.
78 C. Nurizzo, M. Antonelli, M. Profaizer and L. Romele, Desalination, 2005, 176, 241–253.
79 C. C. Wang, Z. G. Niu and Y. Zhang, J. Hazard. Mater., 2013, 262, 179–188.
80 C. M. Coetsier, S. Spinelli, L. Lin, B. Roig and E. Touraud, Environ. Int., 2009, 35, 787–
792.
81 S. Mompelat, B. Le Bot and O. Thomas, Environ. Int., 2009, 35, 803–814.
82 M. Gros, M. Petrović, A. Ginebreda and D. Barceló, Environ. Int., 2010, 36, 15–26.
83 A. Jelic, M. Gros, A. Ginebreda, R. Cespedes-Sánchez, F. Ventura, M. Petrovic and D.
Barcelo, Water Res., 2011, 45, 1165–1176.
84 M. Huerta-Fontela, M. T. Galceran and F. Ventura, Water Res., 2011, 45, 1432–1442.
85 Y. Ma, M. Li, M. Wu, Z. Li and X. Liu, Sci. Total Environ., 2015, 518-519, 498–506.
86 D. W. Kolpin, M. Skopec, M. T. Meyer, E. T. Furlong and S. D. Zaugg, Sci. Total Environ.,
2004, 328, 119–30.
87 G. A. Loraine and M. E. Pettigrove, Environ. Sci. Technol., 2006, 40, 687–695.
88 J. D. Peterson, R. R. Murphy, Y. Jin, L. Wang, M. B. Nessl and K. Ikehata, Water Environ.
Res., 2011, 83, 1853–1875.
89 F. Busetti, M. Ruff and K. L. Linge, Environ. Sci. Water Res. Technol., 2015, 1, 659–667.
90 S. Weber, S. Khan and J. Hollender, Desalination, 2006, 187, 53–64.
91 S. Khan, in Sustainable Water, ed. R. Hester and R. Harrison,The Royal Society of
Chemistry, London, 2011, ch. 6, pp. 114–137.
92 M. M. Huber, S. Canonica, G. Y. Park and U. Von Gunten, Environ. Sci. Technol., 2003,
37, 1016–1024.
93 I. H. Kim, N. Yamashita, Y. Kato and H. Tanaka, Water Sci. Technol., 2009, 59, 945–955.
94 L. H. M. L. M. Santos, A. N. Araújo, A. Fachini, A. Pena, C. Delerue-Matos and M. C. B.
S. M. Montenegro, J. Hazard. Mater., 2010, 175, 45–95.
95 C. R. Tyler, S. Jobling and J. P. Sumpter, Crit. Rev. Toxicol., 2008, 28, 319–361.
96 D. W. Kolpin, E. T. Furlong, M. T. Meyer, E. M. Thurman, S. D. Zaugg, L. B. Barber and
H. T. Buxton, Environ. Sci. Technol., 2002, 36, 1202–1211.
97 R. Durand and G. Schwebach, Am. J. Public Health, 1989, 79, 1659–1660.
98 B. Sheikh, R. P. Cort, W. R. Kirkpatrick, R. S. Jaques and T. Asano, 1990, 62, 216–226.

34
99 R. L. Ward, D. R. Knowlton, J. Stober, W. Jakubowski, T. Mills, P. Graham and D. E.
Camann, Water Res., 1989, 23, 1503–1509.
100 T. Egli, Water Res., 2010, 44, 4826–37.
101 H. Wang, M. A. Edwards, J. O. Falkinham 3rd and A. Pruden, Env. Sci Technol, 2013, 47,
10117–10128.
102 A. Pruden, M. A. Edwards, J. O. Falkinham III, M. Arduino, J. Bird, R. Birdnow, E. Bedard,
A. Camper, J. Clancy, E. Hilborn, V. Hill, A. Martin, S. Masters, N. R. Pace, M. Prevost,
A. Rosenblatt, W. Rhoads, J. E. Stout and Y. Zhang, State of the Science and Research
Needs for Opportunistics Pathogens in Premise Plumbing: Methodology, microbial
ecology, and epidemiology, Water Research Foundation, Denver, CO, 2013.
103 J. M. Brunkard, E. Ailes, V. A. Roberts, V. Hill, E. D. Hilborn, G. F. Craun, A.
Rajasingham, A. Kahler, L. Garrison, L. Hicks, J. Carpenter, T. J. Wade, M. J. Beach and
J. S. Yoder, Morb. Mortal. Wkly. Rep., 2008, 57, 1–38.
104 D. W. Fraser, T. R. Tsai, W. Orenstein and W. E. Parkin, N. Engl. J. Med., 1989, 297.
105 A. Y. Peleg, H. Seifert and D. L. Paterson, Clin. Microbiol. Rev., 2008, 21, 538–582.
106 C. R. Horsburgh, N. Engl. J. Med., 1991, 324, 1332–1338.
107 F. D. Lowy, N. Engl. J. Med.,1998, 339, 520-532.
108 G. P. Bodey, R. Bolivar, V. Fainstein and L. Jadeja, Rev. Infect. Dis., 1983, 5, 279–313.
109 F. Marciano-Cabral and G. Cabral, Clin. Microbiol. Rev., 2003, 16, 273–307.
110 J. Falkinham, Int. J. Environ. Res. Public Health, 2015, 12, 4533–4545.
111 H. Wang, M. Edwards, J. O. Falkinham, and A. Pruden, Appl Environ Microbiol., 2012, 78,
6285-6294.
112 US CDC, Antibiotic Resistance Threats in the United States, 2013.
113 A. Pruden, M. Arabi and H. N. Storteboom, Environ. Sci. Technol., 2012, 46, 11541–11549.
114 D. W. Graham, S. Olivares-Rieumont, C. W. Knapp, L. Lima, D. Werner and E. Bowen,
Environ. Sci. Technol., 2011, 45, 418–424.
115 G. C. A. Amos, P. M. Hawkey, W. H. Gaze and E. M. Wellington, J. Antimicrob.
Chemother., 2014, 69, 1785–1791.
116 E. Marti, J. Jofre and J. L. Balcazar, PLoS One, 2013, 8, e78906.
117 R. Benveniste and J. Davies, Proc. Natl. Acad. Sci. U. S. A., 1973, 70, 2276–2280.
118 K. J. Forsberg, A. Reyes, B. Wang, E. M. Selleck, M. O. A. Sommer and G. Dantas, Science,
2012, 337, 1107–1111.
119 K. A. Davis, J. J. Stewart, H. K. Crouch, C. E. Florez and D. R. Hospenthal, Clin. Infect.
Dis., 2004, 39, 776–782.
120 C. von Eiff, K. Becker, K. Machka, H. Stammer and G. Peters, N. Engl. J. Med., 2001, 344,
11–16.
121 D. Bogaert, R. De Groot and P. W. M. Hermans, Lancet Infect. Dis., 2004, 4, 144–154.
122 N. L. Fahrenfeld, Y. J. Ma, M. O’Brien and A. Pruden, Front. Microbiol., 2013, 4, 1-10.
123 F. Barker-Reid, E. M. Fox and R. Faggian, J. Water Health, 2010, 8, 521–531.
124 J. McLain and C. Williams, Sustainability, 2014, 6, 1313–1327.
125 R. E. R. Goldstein, S. A. Micallef, S. G. Gibbs, A. George, E. Claye, A. Sapkota, S. W.
Joseph and A. R. Sapkota, Sci. Total Environ., 2014, 466, 404–411.
126 F. H. Wang, M. Qiao, Z. E. Lv, G. X. Guo, Y. Jia, Y. H. Su and Y. G. Zhu, Environ. Pollut.,
2014, 184, 247–253.
127 F. Wang, M. Qiao, J. Su, Z. Chen, X. Zhou and Y. Zhu, Environ. Sci. Technol., 2014, 48,
9079–9085.

35
128 U. Bockelmann, H. H. Dorries, M. N. Ayuso-Gabella, M. S. de Marcay, V. Tandoi, C.
Levantesi, C. Masciopinto, E. Van Houtte, U. Szewzyk, T. Wintgens and E. Grohmann,
Appl. Environ. Microbiol., 2009, 75, 154–163.
129 L. Rizzo, C. Manaia, C. Merlin, T. Schwartz, C. Dagot, M. C. Ploy, I. Michael and D. Fatta-
Kassinos, Sci. Total Environ., 2013, 447, 345–360.
130 Y. L. Zhang, C. F. Marrs, C. Simon and C. W. Xi, Sci. Total Environ., 2009, 407, 3702–
3706.
131 A. Schlüter, R. Szczepanowski, A. Pühler and E. M. Top, FEMS Microbiol. Rev., 2007, 31,
449–477.
132 M. Munir, K. Wong and I. Xagoraraki, Water Res., 2011, 45, 681–693.
133 A. Liu, A. Fong, E. Becket, J. Yuan, C. Tamae, L. Medrano, M. Maiz, C. Wahba, C. Lee,
K. Lee, K. P. Tran, H. Yang, R. M. Hoffman, A. Salih and J. H. Miller, Antimicrob. Agents
Chemother., 2011, 55, 1204–1210.
134 G. McVicker, T. K. Prajsnar, A. Williams, N. L. Wagner, M. Boots, S. a Renshaw and S. J.
Foster, PLoS Pathog., 2014, 10, e1003959.
135 D. I. Andersson and D. Hughes, Nat. Rev. Microbiol., 2014, 12, 465–478.
136 E. Gullberg, L. M. Albrecht, C. Karlsson, L. Sandegren and D. I. Andersson, MBio, 2014,
5, 19–23.
137 P. Y. Zhang, P. P. Xu, Z. J. Xia, J. Wang, J. Xiong and Y. Z. Li, Fems Microbiol. Lett.,
2013, 348, 149–156.
138 Z. J. Xia, J. Wang, W. Hu, H. Liu, X. Z. Gao, Z. H. Wu, P. Y. Zhang and Y. Z. Li, J. Ind.
Microbiol. Biotechnol., 2008, 35, 1157–1163.
139 B. Song, G. R. Wang, N. B. Shoemaker and A. A. Salyers, J. Bacteriol., 2009, 191, 1078–
1082.
140 M. Prudhomme, L. Attaiech, G. Sanchez, B. Martin and J. P. Claverys, Science, 2006, 313,
89–92.
141 C. Úbeda, E. Maiques, E. Knecht, Í. Lasa, R. P. Novick and J. R. Penadés, Mol. Microbiol.,
2005, 56, 836–844.
142 J. W. Beaber, B. Hochhut and M. K. Waldor, Nature, 2004, 427, 72–74.
143 C. Baker-Austin, M. S. Wright, R. Stepanauskas and J. V. McArthur, Trends Microbiol.,
2006, 14, 176–182.
144 L. Sörme and R. Lagerkvist, Sci. Total Environ., 2002, 298, 131–145.
145 S. K. Brar, M. Verma, R. D. Tyagi and R. Y. Surampalli, Waste Manag., 2010, 30, 504–
520.
146 D. P. Karumathil, H.-B. Yin, A. Kollanoor-Johny and K. Venkitanarayanan, Int. J. Environ.
Res. Public Health, 2014, 11, 1844–1854.
147 P. Shi, S. Jia, X. X. Zhang, T. Zhang, S. Cheng and A. Li, Water Res., 2013, 47, 111–120.
148 J. J. Huang, H.-Y. Hu, Y.-H. Wu, B. Wei and Y. Lu, Chemosphere, 2013, 90, 2247–2253.
149 A. Boehm, S. Steiner, F. Zaehringer, A. Casanova, F. Hamburger, D. Ritz, W. Keck, M.
Ackermann, T. Schirmer and U. Jenal, Mol. Microbiol., 2009, 72, 1500–1516.
150 M. Blickwede, R. Goethe, C. Wolz, P. Valentin-Weigand and S. Schwarz, J. Antimicrob.
Chemother., 2005, 56, 315–323.
151 D. Li, A. Renzoni, T. Estoppey, C. Bisognano, P. Francois, W. L. Kelley, D. P. Lew, J.
Schrenzel and P. Vaudaux, Antimicrob. Agents Chemother., 2005, 49, 916–924.
152 L. R. Hoffman, D. A. D’Argenio, M. A. MacCoss, Z. Zhang, R. A. Jones and S. I. Miller,
Nature, 2005, 436, 1171–1175.

36
153 M. Hausner and S. Wuertz, Appl. Environ. Microbiol., 1999, 65, 3710–3713.
154 S. Molin and T. Tolker-Nielsen, Curr. Opin. Biotechnol., 2003, 14, 255–261.
155 T. Das, S. Sehar and M. Manefield, Environ. Microbiol. Rep., 2013, 5, 778–786.
156 Y. Li, P. C. Y. Lau, J. H. Lee, R. P. Ellen and D. G. Cvitkovitch, Society, 2001, 183, 897–
908.
157 S. Hannan, D. Ready, A. S. Jasni, M. Rogers, J. Pratten and A. P. Roberts, FEMS Immunol.
Med. Microbiol., 2010, 59, 345–349.
158 N. M. Vega and J. Gore, Curr. Opin. Microbiol., 2014, 21, 28–34.
159 A. Pruden, Environ. Sci. Technol., 2014, 48, 5–14.
160 N. J. Ashbolt, A. Amezquita, T. Backhaus, P. Borriello, K. K. Brandt, P. Collignon, A.
Coors, R. Finley, W. H. Gaze, T. Heberer, J. R. Lawrence, D. G. J. Larsson, S. A. McEwen,
J. J. Ryan, J. Schonfeld, P. Silley, J. R. Snape, C. Van den Eede and E. Topp, Environ.
Health Perspect., 2013, 121, 993–1001.
161 E. M. H. Wellington, A. B. Boxall, P. Cross, E. J. Feil, W. H. Gaze, P. M. Hawkey, A. S.
Johnson-Rollings, D. L. Jones, N. M. Lee, W. Otten, C. M. Thomas and a P. Williams,
Lancet Infect. Dis., 2013, 13, 155–165.
162 H. K. Allen, J. Donato, H. H. Wang, K. a Cloud-Hansen, J. Davies and J. Handelsman, Nat.
Rev. Microbiol., 2010, 8, 251–259.
163 K. Rosario, C. Nilsson, Y. W. Lim, Y. Ruan and M. Breitbart, Environ. Microbiol., 2009,
11, 2806–2820.
164 M. Muniesa, M. Colomer-lluch and J. Jofre, Future Microbiol., 2013, 8, 739–752.
165 J. M. Thomas, N. J. Ashbolt, N. Exposure, U. States, E. P. Agency, J. M. Thomas and N. J.
Ashbolt, Environ. Sci. Technol., 2011, 45, 860–869.
166 US CDC, Antibiotic Resistance Threats in the United States, 2013, 114 pp.
167 B. Blair, P. Sarkar, K. R. Bright, F. Marciano-Cabral and C. P. Gerba, Emerg. Infect. Dis.,
2008, 14, 1498–1499.
168 T. A. Bartrand, J. J. Causey and J. L. Clancy, J. Am. Water Works Assoc., 2014, 106, E418–
E432.
169 A. J. Martinez and G. S. Visvesvara, Brain Pathol., 1997, 7, 583–598.
170 M. C. Liang, Z. G. Ning and Y. K. Li, Environ. Earth Sci., 2015, 73, 4325–4338.
171 V. Thomas, J. Loret, M. Jousset and G. Greub, Environ. Microbiol., 2008, 10, 2728–2745.
172 H. C. Miller, J. Wylie, G. Dejean, A. H. Kaksonen, D. Sutton, K. Braun and G. J. Puzon,
Environ. Sci. Technol., 2015, 49, 11125–11131.
173 J. M. Thomas and N. J. Ashbolt, Environ. Sci. Technol., 2011, 45, 860–869.
174 J. Lu, H. Y. Buse, V. Gomez-Alvarez, I. Struewing, J. Santo Domingo and N. J. Ashbolt, J.
Appl. Microbiol., 2014, 117, 905–918.
175 M. T. García, S. Jones, C. Pelaz, R. D. Millar and Y. Abu Kwaik, Environ. Microbiol., 2007,
9, 1267–1277.
176 P. K. Jjemba, W. Johnson, Z. Bukhari, and M. W. LeChevallier. Pathogens, 2015, 4, 470-
502.
177 J. L. Griffin, Science, 1972, 178, 869–870.
178 H. Y. Buse and N. J. Ashbolt, Lett. Appl. Microbiol., 2011, 53, 217–224.
179 M. A. Söderberg, J. Dao, S. R. Starkenburg and N. P. Cianciotto, Appl. Environ. Microbiol.,
2008, 74, 5583–5588.
180 B. C. Hitzfeld, S. J. Höger and D. R. Dietrich, Environ. Health Perspect., 2000, 108, 113–
122.

37
181 G. Codd, S. Bell, K. Kaya, C. Ward, K. Beattie and J. Metcalf, Eur. J. Phycol., 1999, 34,
405–415.
182 Mueller B. New York Times. http://www.nytimes.com/2015/10/02/nyregion/legionnaires-
bacteria-regrew-in-bronx-cooling-towers-that-were-disinfected.html?_r=0, (accessed
January 2016).
183 B. E. Hatt, A. Deletic and T. D. Fletcher, J. Environ. Manage., 2006, 79, 102–113.
184 Austrailian Government National Health and Medical Research Council, 2004.
185 L. R. Brown, Full Planet, Empty Plates: The New Geopolitics of Food Scarcity, 2012.
186 E. Schroeder, G. Tchobanoglous, H. L. Leverenz and T. Asano, Natl. Water Resesearch
Inst. White Pap., 2012, 1–20.
187 D. S. Adapa S, Bhullar N, J Clean Prod, 2016.
188 D. Baumann, Appl. Geogr., 1983, 3, 79–84.
189 J. G. Lohman, L.C., Milliken, U.S. Dep. Inter. Denver, 1985.
190 S. Dolnicar, A. Hurliman, and L. D. Nghiem, J. Environ. Manage., 2010, 91, 1288–1293.
191 K. P. Tsagarakis, A. N. Menegaki, K. Siarapi and F. Zacharopoulou, J. Risk Res., 2013, 16,
133–144.
192 T. Asano, F. L. Burton, H. L. Leverenz, R. Tsuchihashi, and G. Tchobanoglous, Water
Reuse: Issues, Technologies, and Applications, McGraw-Hill, New York City, 2016.
193 R. E. Rosenberg Goldstein, S. A. Micallef, S. G. Gibbs, J. A. Davis, X. He, A. George, L.
M. Kleinfelter, N. A. Schreiber, S. Mukherjee, A. Sapkota, S. W. Joseph and A. R. Sapkota,
Environ. Health Perspect., 2012, 120, 1551–1558.
194 M. W. LeChevallier and R. J. Seidler, Appl. Environ. Microbiol., 1980, 30, 739–742.
195 P. Rusin, J. Rose, C. Haas and C. Gerba, Rev Env. Contam Toxicol, 1997, 152, 57–83.
196 F. Xianmin, Z. Wenyu, W. Yuehua, Z. Donghai, J. Xiaoming and L. Shijie, Anat. Rec.,
2015, 298, 1509–1517.
197 P. K. Jjemba, L. Weinrich, W. Cheng, E. Giraldo and M. W. LeChevallier, Guidance
Document on the Microbiological Quality and Biostability of Reclaimed Water Following
Storage and Distribution, 2010.
198 L. Macmillian, New York Times Green Blog,
http://green.blogs.nytimes.com/2012/10/10/do-not-publish-on-the-slopes-gliding-on-
wastewater/?_r=0, (accessed January 2016).
199 Q. Y. Wu, Y. Y. Li and H. Y. Hu, Acta Sci. Circumstantiae, 2013, 33, 844–849.
200 T. W. Armstrong and C. N. Haas, Risk Anal., 2007, 27, 1581–1596.
201 T. P. Primm, C. A. Lucero and J. O. Falkinham, Clin. Microbiol. Rev., 2004, 17, 98–106.
202 B. J. Williams, J. Dehnbostel and T. S. Blackwell, Respirology, 2010, 15, 1037–1056.
203 Y. J. Lee, J. H. Kim, H. J. Sohn, J. Lee, S. Y. Jung, Y. J. Chwae, K. Kim, S. Park and H. J.
Shin, Parasite Immunol., 2011, 33, 382–389.
204 H. Ryu, A. Alum and M. Abbaszadegan, Environ. Sci. Technol., 2005, 39, 8600–8605.
205 C. W. Knapp, S. M. McCluskey, B. K. Singh, C. D. Campbell, G. Hudson and D. W.
Graham, PLoS One, 2011, 6, e27300.
206 M. J. Mohammad Rusan, S. Hinnawi and L. Rousan, Desalination, 2007, 215, 143–152.
207 B. Kurenbach, D. Marjoshi, C. F. Amábile-cuevas, G. C. Ferguson, W. Godsoe, P. Gibson
and J. A. Heinemann, mBio, 2015, 6, 1–9.
208 M. Salgot, E. Huertas, S. Weber, W. Dott and J. Hollender, Desalination, 2006, 187, 29–
40.
209 J. K. Edzwald, Water Quality & Treatment: A Handbook on Drinking Water, Sixth Edition,

38
McGraw-Hill, New York City, 2011.
210 C. Volk, C. Renner, C. Robert and J. C. Joret, Environ. Technol., 1994, 15, 545–556.
211 P. Servais, P. Laurent and D. Gatel, presented in part at Proc. of the Annual AWWA Water
Qual. Technol. Conf., New Orleans, 1995.
212 P. Laurent, M. Prévost, J. Cigana, P. Niquette and P. Servais, Water Res., 1999, 33, 1387–
1398.
213 P. Niquette, P. Servais and R. Savoir, Water Res., 2001, 35, 675–682.
214 C. J. Volk and M. W. LeChevallier, J. Am. Water Works Assoc., 2000, 92, 64–76.
215 D. van der Kooij, A. Visser and W. A. M. Hijnen, J. Am. Water Works Assoc., 1982, 74,
540–545.
216 M. W. LeChevallier, W. Schulz and R. G. Lee, Appl. Envir. Microbiol., 1991, 57, 857–862.
217 M. Vital, H. P. Fuchslin, F. Hammes and T. Egli, Microbiology, 2007, 153, 1993–2001.
218 D. Gerrity, S. Gamage, J. C. Hola dy, D. B. Mawhinney, O. Quiñones, R. A. Trenholm and
S. A. Snyder, Water Res., 2011, 45, 2155–65.
219 Ç. Kalkan, K. Yapsakli, B. Mertoglu, D. Tufan and A. Saatci, Desalination, 2011, 265, 266–
273.
220 A. N. Pisarenko, B. D. Stanford, D. Yan, D. Gerrity and S. A. Snyder, Water Res., 2012,
46, 316–26.

39
CHAPTER 3 : STORMWATER LOADINGS OF ANTIBIOTIC RESISTANCE GENES
IN AN URBAN STREAM
Emily Garner, Romina Benitez, Emily von Wagoner, Richard Sawyer, Erin Schaberg, W. Cully
Hession, Leigh-Anne H. Krometis, Brian D. Badgley, and Amy Pruden
ABSTRACT
Antibiotic resistance presents a critical public health challenge and the transmission of antibiotic
resistance via environmental pathways continues to gain attention. Factors driving the spread of
antibiotic resistance genes (ARGs) in surface water and sources of ARGs in urban stormwater
have not been well-characterized. In this study, five ARGs (sul1, sul2, tet(O), tet(W), and erm(F))
were quantified throughout the duration of three storm runoff events in an urban inland stream.
Storm loads of all five ARGs were significantly greater than during equivalent background
periods. Neither fecal indicator bacteria measured (E. coli or enterococci) was significantly
correlated with sul1, sul2, or erm(F), regardless of whether ARG concentration was absolute or
normalized to 16S rRNA levels. Both E. coli and enterococci were correlated with the tetracycline
resistance genes, tet(O) and tet(W). Next-generation shotgun metagenomic sequencing was
conducted to more thoroughly characterize the resistome (i.e., full complement of ARGs) and
profile the occurrence of all ARGs described in current databases in storm runoff in order to inform
future watershed monitoring and management. Between 37-121 different ARGs were detected in
each stream sample, though the ARG profiles differed among storms. This study establishes that
storm-driven transport of ARGs comprises a considerable fraction of overall downstream loadings
and broadly characterizes the urban stormwater resistome to identify potential marker ARGs
indicative of impact.
INTRODUCTION
The World Health Organization has deemed the emergence and spread of antibiotic
resistance a crisis that “threatens the very core of modern medicine” (World Health Organization,
2015). Though concerns first centered on nosocomial patterns of resistance, the potential role of
environmental pathways in facilitating the spread of antibiotic resistance among bacteria has
gained considerable attention. Multiple studies have documented the contamination of surface
waters with antibiotic resistance genes (ARGs) originating from wastewater treatment plants
(Garcia-Armisen et al., 2011; Graham et al., 2011; Munir et al., 2011), agricultural runoff (Chee-
Sanford et al., 2009; Fahrenfeld et al., 2014; Joy et al., 2013), and urban stormwater (McLellan et
al., 2007; Zhang et al., 2016). Though numerous studies have documented increased loadings of
pathogens and fecal indicator bacteria to surface water following rainfall (Hathaway and Hunt,
2010; Liao et al., 2015; McCarthy et al., 2012; Sidhu et al., 2012; Surbeck et al., 2006), potentially
associated increases in loadings of antibiotic resistant bacteria and their associated ARGs have not
been considered.
Given that soil bacteria represent a natural reservoir of ARGs, simple detection in
environmental matrices is not necessarily of concern. However, point and non-point source
pollution can serve as anthropogenic sources of ARGs to the environment (Pruden et al., 2012),
thus the potential for dissemination of ARGs to waterborne and/or opportunistic environmental

40
pathogens via horizontal gene transfer calls for consideration. The ability of bacteria to acquire
ARGs horizontally between live cells (conjugation), via bacteriophage infection (transduction), or
via assimilation from the extracellular environment (natural transformation) necessitates
consideration of the total abundance of ARGs in an environmental sample (i.e., the resistome) (von
Wintersdorff et al., 2016). The potential risk of transfer of extracellular ARGs and ARGs carried
by non-pathogenic bacteria to pathogens in aquatic environments is largely uncharacterized at this
point. For example, recent work demonstrated that the plasmid-mediated colistin resistance gene
MCR-1 can easily pass between strains of Escherichia coli, Klebsiella pneumoniae, and
Pseudomonas aeruginosa (Liu et al., 2016), which are common intestinal/environmental species.
Consequently, tracking resistance risks requires inclusion not only of known pathogens or
microorganisms currently expressing resistance, but also resistance encoding genetic material that
may be incorporated by pathogens.
Surface water has been identified as a reservoir of diverse and even novel ARGs (Amos et
al., 2014a; Bengtsson-Palme et al., 2014; Garner et al., 2016; Kristiansson et al., 2011; Port et al.,
2012). Stormwater in particular possesses many characteristics that may lead to the selection and
amplification of these genes. Stormwater can be contaminated from an array of point and non-
point sources, including land-applied manure, septic tanks, combined sewer overflows and leaky
sewers (Kelsey et al., 2004; Parker et al., 2010; Sauer et al., 2011). It also frequently contains
substantial quantities of heavy metals (Sansalone and Buchberger, 1997) and antibiotics (Davis et
al., 2006; Joy et al., 2013; Xu et al., 2013), which are both well-known to select bacteria that
possess ARGs, even at sub-inhibitory concentrations (Andersson and Hughes, 2014; Gullberg et
al., 2014; Liu et al., 2011; McVicker et al., 2014). Sub-inhibitory concentrations are of great
interest given that they are generally more environmentally-relevant, but also because “inhibitory”
concentrations are only defined in limited strain, and/or media-specific contexts. At low levels,
heavy metals and antibiotics have also been observed to stimulate horizontal gene transfer (Beaber
et al., 2004; Klümper et al., 2016; Prudhomme et al., 2006; Song et al., 2009; Úbeda et al., 2005;
Xia et al., 2008; Zhang et al., 2013), increasing the potential for resistant native aquatic bacteria to
transfer ARGs to pathogenic bacteria introduced by stormwater.
While urban stormwater and associated runoff have been thoroughly documented as a
source of pathogens (Cizek et al., 2008; Qureshi, 1979; Selvakumar and Borst, 2006; Sidhu et al.,
2012), the role of storms in propagating ARGs has received little attention. Although patterns of
incidence have been examined in several watersheds to date (Amos et al., 2014a; Chen et al.,
2013a; Graham et al., 2011; Luo et al., 2010; Marti et al., 2013), the sources and mechanisms
contributing to these observations, and their connections to various anthropogenic inputs are
poorly understood. Thus, the identification of likely sources and transport processes of ARGs
during storms represents an important knowledge gap.
The objectives of this study were to: (1) characterize the abundance of five ARGs (two
sulfonamide: sul1 and sul2; two tetracycline: tet(O) and tet(W); and one macrolide: erm(F)) in an
inland urban stream throughout the duration of three rainfall events and during baseline conditions;
(2) identify physicochemical and hydrometeorological factors related to the occurrence or
abundance of ARGs in stormwater runoff; and (3) investigate the breadth of the resistome
detectable during storms relative to baseline levels using next-generation high-throughput DNA

41
sequencing. Understanding the incidence and movement of ARGs within urban streams will better
inform watershed management strategies to mitigate downstream risks.
MATERIALS AND METHODS
Site and storm descriptions
Samples were collected from Stroubles Creek in Blacksburg, Virginia, USA at the Stream
Research, Education, and Management Laboratory (StREAM Lab;
http://www.bse.vt.edu/site/streamlab/). The Stroubles Creek watershed has been extensively
described in previous studies (Liao et al., 2015, 2014; VADEQ, 2006); the 14.4 km2 drainage area
above the study’s sampling point is 84% urban/residential land use (served by municipal sanitary
sewers), 13% agricultural land use (primarily pasture and cropland), and 3% forested land. On-site
instrumentation stations record a suite of physicochemical variables (temperature, specific
conductivity, pH, turbidity, dissolved oxygen) via multiparameter water quality sondes (YSI Inc.)
as well as streamflow (stage) via a gauge (Campbell Scientific, Inc.) (Liao et al., 2014).
Samples were collected during three summer storms occurring on June 27, July 2, and July
10 2013 and are herein referred to as storms 1, 2, and 3, respectively. Rainfall depths of 6, 17, and
12 mm were recorded for the three storms, respectively, and total event runoff volumes were
calculated to be 8,100 m3, 37,000 m3, and 70,000 m3 (Liao et al., 2015). Additional
hydrometeorological characteristics of the studied storms have been previously published (Liao et
al., 2014, 2015).
Sample collection and DNA extraction
Water samples were collected automatically in sterile 750 mL bottles every 15 (storm 1)
or 30 (storms 2 and 3) minutes using a 6712 ISCO sampler (Teledyne, Lincoln, NE) over each
storm’s duration. Three baseline samples were also collected from the sample site during dry
weather periods (e.g., no appreciable precipitation or change in stream stage for the previous 24
hours). Samples were transported on ice and stored at 4ºC prior to processing. Within 24 hours of
collection, samples were thoroughly shaken to mix and 50 mL aliquots were filter-concentrated
onto 0.4 µm pore size polycarbonate membrane filters (Millipore, Billerica, MA). Filters were
transferred to 2 mL sterile tubes and stored at -80ºC. Filters were cut into approximately 1 cm2
fragments using a flame-sterilized blade and transferred to DNA extraction tubes. DNA was
extracted from the filters using a PowerSoil DNA Isolation Kit (MO BIO Laboratories, Inc.,
Carlsbad, CA) according to manufacturer instructions.
Molecular analysis and high throughput sequencing
ARGs were quantified in triplicate reactions from DNA extracts using qPCR with previously
published protocols for 16S rRNA genes (Suzuki et al., 2000) and five ARGs: sul1, sul2 (Pei et al.,
2006), tet(O), tet(W) (Aminov et al., 2001), and erm(F) (Chen et al., 2007). A subset of samples
was initially analyzed at dilutions of 1:10, 1:20, 1:50, and 1:100 to determine the minimum dilution
required to minimize inhibition (results not shown); ultimately, a dilution factor of 1:10 was
selected and applied to all extracts. Triplicate standard curves of ten-fold serial diluted standards

42
of each target gene ranging from 102 to 108 gene copies/µl for 16S rRNA and 101 to 107 gene
copies/µl for ARGs were included on each 96-well plate, along with a triplicate negative control.
The minimum acceptable qPCR standard curve R2 was 0.978. The limit of quantification was
established as the lowest standard that amplified in triplicate in each run, and was equivalent to
104 gene copies per L of sampled bulk water for sul1, sul2, tet(O), tet(W), and 16S rRNA genes,
and 105 gene copies per L of sampled bulk water for erm(F).
Shotgun metagenomics were conducted on the sample representing the maximum stream
stage (i.e., peak flow) during each storm, as well a composite of the three baseline samples,
combined by equal DNA mass. Samples were prepared using the Nextera XT library preparation
(Illumina, San Diego, CA) and sequenced on an Illumina HiSeq 2500 using a 100-cycle paired-
end protocol at the Biocomplexity Institute of Virginia Tech Genomics Research Lab. Paired end
reads were merged using FLASH (Magoč and Salzberg, 2011). Quality filtering was conducted
using Trimmomatic (Bolger et al., 2014) according to default parameters. 16S rRNA genes were
annotated using BLASTN (Altschul et al., 1997) against the GreenGenes ribosomal RNA database
(DeSantis et al., 2006). ARGs were annotated using the DIAMOND protein aligner (Buchfink et
al., 2014) against the subset download of the Comprehensive Antibiotic Resistance Database
(McArthur et al., 2013) that excludes genes that confer resistance via specific mutations (accessed
August 2015). A minimum amino acid identity of 90% and a minimum e-value of 10-5 were
required. Metagenomes were uploaded to the metagenomics RAST server (MG-RAST) (Meyer et
al., 2008) and are publicly available under the accession numbers 4628882.3 – 4628885.3.
Data analysis
All statistical comparisons were conducted using R (v. 3.2.1) with a significance cutoff of
α=0.05 unless otherwise noted. Normality of ARG datasets was assessed using a Shapiro-Wilk
test. All ARG datasets failed to meet normality requirements, with the exception of sul1, thus non-
parametric statistical analyses were applied for all ARG comparisons. ARG abundances during
various storm phases were compared using a Kruskal-Wallis rank sum test, followed by a pairwise
Wilcoxon rank sum test. Spearman’s rank correlation coefficients were calculated to assess
correlations between ARG abundances, fecal indicator bacteria, water quality parameters, and
hydrometeorological parameters. Storm ARG event loads (EL; gene copies / event) and equivalent
background period loads (EBP; gene copies / EBP) were calculated as previously described for
fecal indicator bacteria (Liao et al., 2015):
𝐸𝐿 = ∑ 𝑄𝑖𝑁𝑖=1 𝐶𝑖∆𝑡 (1)
𝐸𝐵𝑃 = 𝐸𝐿𝐷𝐿⁄ (2)
where Qi = ith discrete discharge (L/s); Ci = ith discrete ARG concentration (gene copies/L); ∆t =
sampling interval (s); N = number of discrete samples collected; and DL = mean dry-weather loads
in the duration of the storm event (gene copies). Event ARG loads were compared to equivalent
background period loads using a Wilcoxon rank sum test.

43
RESULTS AND DISCUSSION
Selection of ARG Targets for Characterizing Storm Loadings
Five ARGs representing three classes of resistance (two sulfonamide: sul1 and sul2; two
tetracycline: tet(O) and tet(W); and one macrolide: erm(F)) were selected for quantification in all
samples via qPCR to characterize how loads of ARGs change throughout the course of each storm
(Figure 3-1). The five target ARGs were selected due to their documented prevalence in
watersheds impacted by anthropogenic and agricultural runoff (Fahrenfeld et al., 2014; Pruden et
al., 2006; Storteboom et al., 2010a). Macrolides and tetracyclines are among the most widely used
antibiotics globally for both human and agricultural applications (Van Boeckel et al., 2014).
Sulfonamides were the first synthetically produced antibiotic for widespread use beginning in the
1930s and extensive resistance has since emerged among clinical isolates (Sköld, 2000). sul1 and
sul2 have been widely detected in municipal wastewater (Laht et al., 2014; Munir et al., 2011;
Pruden et al., 2012) and sul1 is of particular interest as it has been identified as a strong indicator
of anthropogenic influence in surface water (Pruden et al., 2012). tet(O) and tet(W) have been
commonly found in wastewater, but are also common targets found in agricultural waste streams
(Auerbach et al., 2007; Koike et al., 2007; McKinney et al., 2010). Additionally, all five of these
genes were among those identified as candidate indicators of the extent of the impact of antibiotic
resistance in the environment by the European Cooperation in Science and Technology Action
(Berendonk et al., 2015).
Figure 3-1: ARG abundance with respect to Stroubles Creek discharge. Absolute abundances
of ARGs and 16S rRNA genes (gene copies / L; left axis) and stream discharge (m3/s; right axis)
for (A) storm 1, (B) storm 2, and (C) storm 3.
Gene loading rates and intra-storm variability
Absolute concentrations of sulfonamide ARGs responded most consistently during storm
events, with sul1 elevated above baseline concentrations during storms 1 and 3 (p=0.0070; 0.0060),
and sul2 was significantly elevated above baseline concentrations during all three storms
(p=0.0141; 0.0122; 0.0077). In contrast, tetracycline and macrolide ARGs were not consistently
elevated, with tet(W) only significantly greater than the baseline during storm 2 (p=0.1412) and
erm(F) during storm 3 (p=0.0493). Absolute concentrations of tet(O) were not significantly
different from baseline concentrations during any storms. Total 16S rRNA genes were
significantly elevated across all storms (p=0.0070; 0.0110; 0.0060).

44
ARG concentrations were also compared among defined portions of each storm: rising
limb, peak flow, falling limb, and established baseline (Figure 3-2). While absolute abundances
are important for determining total loading of ARGs, changes in the abundance of total bacteria
can obscure patterns of ARG enrichment with respect to the overall microbial community.
Therefore, both absolute (gene copies/L) and relative (gene copies/16S rRNA gene copies)
abundances are considered. During storm 1, the absolute concentration (gene copies per L) of sul1,
sul2, tet(W), and 16S rRNA genes all trended higher during the peak and rising limb of the storm
compared to the baseline, but were only significantly greater during the rising limb (p=0.0119;
0.0138; 0.0138; 0.0119). In terms of relative abundance, only tet(W) and erm(F) were greater
during the rising limb (p=0.0138; 0.0138), while sul2 fell below the baseline (p=0.0138) (Figure
3-2). In contrast, during storm 2, only absolute concentrations of sul2 and 16S rRNA genes were
significantly elevated relative to the baseline during the falling limb of the storm (p=0.0053;
0.0030). Notably, absolute concentrations of sul2 trended above the baseline by greater than 1-log
during all phases of the storm. During storm 3, the absolute concentration of all five ARGs and
16S rRNA genes were elevated above the baseline during the falling limb (p≤0.0140), which is a
remarkable contrast to storm 1, where concentrations were elevated during the rising limb. sul2
again trended above the baseline on average during each phase of the storm, by greater than 1.5-
log. 16S rRNA genes were elevated above the baseline during each phase of the storm by greater
than 1-log.
Figure 3-2: ARG relative abundances during storm phases. Relative abundances of ARGs
(ARG copies / 16S rRNA gene copies) during baseline sample collection, storm rising limb, storm
crest, and storm falling limb across all storms.
The unique profile of the five target ARGs that occurred during various phases of the storm
suggest point and non-point sources of ARGs may vary both over the duration of each storm and
among individual storm events. The non-uniform concentration of ARGs throughout each storm
suggests that certain urban and agricultural sources influenced the sampling point at different times
throughout the sampling scheme. This is similar to the observation that fecal indicator bacteria in
general can exhibit large variations during intra-storm sampling, with greater than 0.5-log variation
in E. coli and enterococci concentrations documented during a single storm (Liao et al., 2015;
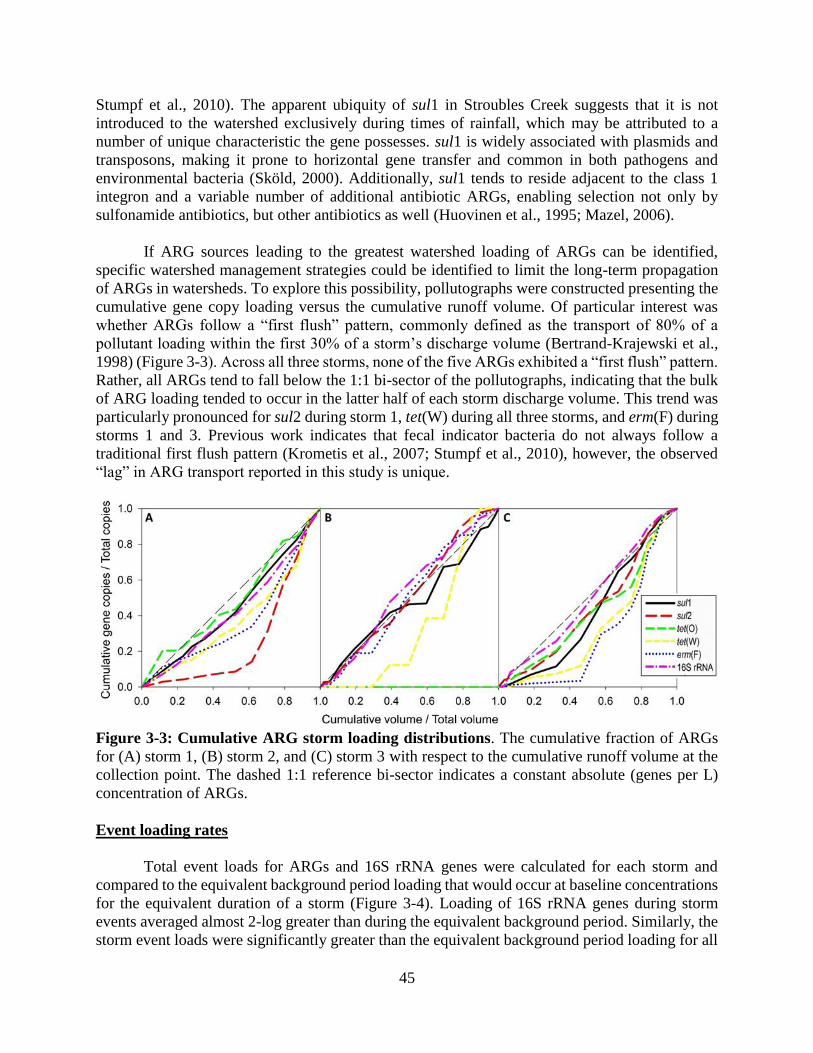
45
Stumpf et al., 2010). The apparent ubiquity of sul1 in Stroubles Creek suggests that it is not
introduced to the watershed exclusively during times of rainfall, which may be attributed to a
number of unique characteristic the gene possesses. sul1 is widely associated with plasmids and
transposons, making it prone to horizontal gene transfer and common in both pathogens and
environmental bacteria (Sköld, 2000). Additionally, sul1 tends to reside adjacent to the class 1
integron and a variable number of additional antibiotic ARGs, enabling selection not only by
sulfonamide antibiotics, but other antibiotics as well (Huovinen et al., 1995; Mazel, 2006).
If ARG sources leading to the greatest watershed loading of ARGs can be identified,
specific watershed management strategies could be identified to limit the long-term propagation
of ARGs in watersheds. To explore this possibility, pollutographs were constructed presenting the
cumulative gene copy loading versus the cumulative runoff volume. Of particular interest was
whether ARGs follow a “first flush” pattern, commonly defined as the transport of 80% of a
pollutant loading within the first 30% of a storm’s discharge volume (Bertrand-Krajewski et al.,
1998) (Figure 3-3). Across all three storms, none of the five ARGs exhibited a “first flush” pattern.
Rather, all ARGs tend to fall below the 1:1 bi-sector of the pollutographs, indicating that the bulk
of ARG loading tended to occur in the latter half of each storm discharge volume. This trend was
particularly pronounced for sul2 during storm 1, tet(W) during all three storms, and erm(F) during
storms 1 and 3. Previous work indicates that fecal indicator bacteria do not always follow a
traditional first flush pattern (Krometis et al., 2007; Stumpf et al., 2010), however, the observed
“lag” in ARG transport reported in this study is unique.
Figure 3-3: Cumulative ARG storm loading distributions. The cumulative fraction of ARGs
for (A) storm 1, (B) storm 2, and (C) storm 3 with respect to the cumulative runoff volume at the
collection point. The dashed 1:1 reference bi-sector indicates a constant absolute (genes per L)
concentration of ARGs.
Event loading rates
Total event loads for ARGs and 16S rRNA genes were calculated for each storm and
compared to the equivalent background period loading that would occur at baseline concentrations
for the equivalent duration of a storm (Figure 3-4). Loading of 16S rRNA genes during storm
events averaged almost 2-log greater than during the equivalent background period. Similarly, the
storm event loads were significantly greater than the equivalent background period loading for all

46
genes, except tet(O) (Wilcoxon Rank Sum test; α=0.10; p=0.1000; 0.0765; 0.0765; 0.0765; and
0.1000 for sul1, sul2, tet(W), erm(F) and 16S genes, respectively). On average, the total load of
each ARG across a storm event was greater than 1-log above the equivalent background load. This
increased loading was most dramatic in the cases of sul2 and tet(W), which each increased at least
2-log above the equivalent background loading for each storm. Total bacterial DNA markers also
increased during this time by greater than 1-log in all cases. This increased event loading is critical
because, despite the relatively short storm duration (i.e., a few hours of precipitation) there is real
potential for lasting surface water quality impacts. For example, once ARGs enter the watershed
environment, they are subject to a number of complex fate and transport mechanisms by which
they may persist or propagate throughout the aquatic environment via bulk water or by partitioning
to sediments (Pruden et al., 2012). ARGs may be transferred to or taken up by native aquatic
bacteria, augmenting reservoirs of resistance that have the potential to be subsequently transferred
to pathogenic bacteria (Forsberg, et al., 2012; Wright, 2010). Residual antibiotics and metals can
create selective pressure for ARGs. Studies have also suggested that the presence of pesticides and
herbicides can select for bacteria possessing ARGs (Bordas et al., 1997; Kurenbach et al., 2015).
Figure 3-4: Average ARG storm event loading and corresponding equivalent background
period loading. Error bars represent standard deviation of the gene load of the storms (n=3) or the
equivalent background periods (n=3).
Although no significant correlations were identified between total ARG load and
hydrometeorological characteristics of the storms (event rainfall depth, event duration, time to
peak flow, and event runoff volume), a few patterns are worth noting. sul1 was present at the
greatest absolute abundances during storm 1, the storm with the shortest duration (7 hours) and

47
least runoff volume (8,100 m3). sul1 was present at markedly consistent relative concentrations
throughout all storm and baseline samples (Figure 3-2), suggesting that sul1 is present in Stroubles
Creek during various meteorological conditions and subject to dilution under intense storm
conditions. By contrast, tet(O) and erm(F) reached highest absolute concentrations during storm
3. Storm 3 was characterized by the greatest duration (23 hours), a relatively short time to peak
flow (3 hours), and the highest event runoff volume (70,000 m3), suggesting that tet(O) and erm(F)
are mobilized from contaminant sources under periods of high runoff volume.
Association with fecal indicator bacteria and environmental variables
Monitoring of fecal indicator bacteria, such as E. coli and enterococci, is widely used in
regulatory monitoring as a proxy for probable fecal pathogen contamination and associated human
health risk. Culturable E. coli and enterococci concentrations have previously been published for
the storms of interest (Liao et al., 2015). Weak correlations existed between several of the
monitored ARGs and fecal indicator bacteria (Table 3-1). E. coli concentrations correlated
significantly with absolute (Spearman’s ρ=0.3627; p=0.0026) and relative concentrations of tet(O)
(ρ=0.3411; p=0.0047). E. coli also correlated with absolute abundances of tet(W) (ρ=0.3301;
p=0.0064). Enterococci correlated weakly, but significantly, with absolute abundances of sul2
(ρ=0.2436; p=0.0488), tet(W) (ρ=0.3208; p=0.0086), and erm(F) (ρ=0.3144; p=0.0101).
Enterococci exhibited strong significant correlations with absolute tet(O) (ρ=0.5218; p<0.0001)
concentrations and relative tet(O) (ρ=0.4753; p<0.0001). Enterococci also significantly correlated
with concentrations of 16S rRNA genes (ρ=0.2505; p=0.0425). These results suggest that fecal
indicator bacteria are not consistently an accurate proxy for ARGs resulting from stormwater
runoff. E. coli, in particular, was not well suited as an indicator for sources of the monitored
sulfonamide or macrolide ARGs. Enterococci appear to be a more accurate indicator of
contamination by all of the monitored genes, with the exception of sul1. Interestingly, tet(O) and
tet(W) were the only ARGs significantly correlated with E. coli and the genes with the strongest
correlation to enterococci, suggesting that they are likely to be associated with fecal contamination.
This is consistent with previous studies that have found tet(O) and tet(W) to be abundant in
environments impacted by swine waste streams, dairy manure-treated agricultural soils, and beef,
swine, and dairy waste lagoons (Fahrenfeld et al., 2014; Koike et al., 2007; McKinney et al., 2010).
tet(O) and tet(W) are known to be carried by a relatively diverse range of bacterial hosts, having
been previously identified in at least 20 and 25 genera, respectively, including both Gram-positive
and -negative bacteria as well as both pathogens and environmental bacteria (Roberts, 2011). Both
genes may be carried chromosomally or within conjugative plasmids, and have been associated
with mobile elements, such as transposons (Chopra and Roberts, 2001; Roberts, 2012).
Enterococci have been known to carry tet(O) while neither E. coli nor enterococci typically carry
tet(W) (Chopra and Roberts, 2001), suggesting that while tet(W) may be associated with other
fecal-associated bacteria, the correlations are likely not due to direct carriage by E. coli or
enterococci.

48
Table 3-1: Spearman’s rank correlation coefficients between ARGs, fecal indicator bacteria,
and physicochemical water quality parameters. Statistically significant correlations (α=0.05)
indicated in bold and with an asterisk.
E. co
li
ente
roco
cci
tem
per
ature
turb
idit
y
dis
solv
ed
oxygen
conduct
ivit
y
pH
sul1 0.123 0.167 0.279* 0.392* -0.188 -0.206 -0.285*
sul2 0.165 0.244* 0.327* 0.467* -0.221 -0.165 -0.251*
tet(O) 0.363* 0.522* 0.446* 0.753* -0.397* 0.316* -0.063
tet(W) 0.330* 0.321* 0.312* 0.542* -0.266* -0.138 -0.274*
erm(F) 0.150 0.314* 0.324* 0.619* -0.508* 0.271* -0.339*
Stream water temperature also correlated significantly with absolute abundances of all
ARGs, as well as total 16S rRNA genes (R=0.2790; 0.3272; 0.4460; 0.3116; 0.3242; 0.2795;
p=0.0222; 0.0069; 0.0002; 0.0103; 0.0074; 0.0220 for sul1, sul2, tet(O), tet(W), erm(F), and 16S
genes respectively). Elevated temperatures in urban stormwater are often associated with runoff
from impervious surfaces (Jones et al., 2012) and fecal sources of contamination (Paule-Mercado
et al., 2016). Turbidity was also significantly correlated with absolute concentrations of all ARGs
and 16S rRNA genes (R=0.3915; 0.4671; 0.7525; 0.5417; 0.6187; 0.4904; p=0.0011; <0.0001;
<0.0001; <0.0001; <0.0001; <0.0001 for sul1, sul2, tet(O), tet(W), erm(F), and 16S genes
respectively). Though elevated turbidity may be associated with fecal contamination in freshwater
streams, stream bed sediment disturbance as well as particulate matter in runoff from impervious
surfaces can also contribute significantly to elevated turbidity. Dissolved oxygen was negatively
correlated with absolute concentrations of tet(O), tet(W), and erm(F) (R=-0.3967; -0.2663; -
0.5084; p=0.0009; 0.0294; <0.0001). Deficient dissolved oxygen concentrations are widely
associated with urban storm runoff (Keefer et al., 1980), suggesting that it is a source of input to
Stroubles Creek for these genes.
Diversity and richness of the resistome
While sul1, sul2, tet(O), tet(W), and erm(F) are all well-documented as frequently detected
in surface waters impacted by agricultural runoff and treated wastewater, application of next-
generation sequencing technologies to samples collected from similar environments have revealed
the presence of diverse ARGs beyond these key genes of interest. Therefore, we applied shotgun
metagenomic sequencing to a subset of samples to gain insight into the broader resistome present
during peak storm conditions as compared to baseline conditions in order to inform ARG selection
for future surface water monitoring efforts. Shotgun metagenomic high-throughput DNA
sequencing produced 13.6–18.4 million paired 100-bp reads per sample. Between 409–1157 reads
per sample (0.003–0.009% of reads) were identified as probable ARG sequences via annotation
against the Comprehensive Antibiotic Resistance Database (McArthur et al., 2013). Abundances
of ARGs are presented normalized to abundance of 16S rRNA genes, as well as target gene length
and 16S rRNA gene length as described previously (Li et al., 2015). Normalized abundance of
total ARGs ranged from 0.17 to 0.30 ARGs per 16S rRNA gene. A total of 162 different ARG
were annotated across the dataset, with 57, 37, 100, and 121 ARGs annotated in the baseline

49
sample and storms 1, 2, and 3, respectively. Across the dataset, trimethoprim was the most
abundant class of antibiotic resistance (35.8% of total ARGs), followed by multidrug (33.8%),
beta-lactam (6.8%), polymyxin (6.7%), aminoglycoside (5.6%), and glycopeptide resistance
(3.1%) (Figure 3-5). As many as 155 ARGs have been detected in a single sample in previous
studies, as well as ARGs capable of conferring resistance to all major classes of antibiotics (Amos
et al., 2014b; Bengtsson-Palme et al., 2014; Chen et al., 2016, 2013b; Garner et al., 2016). The
relative prevalence of multidrug resistance among detected ARGs is comparable to the findings of
other metagenomic studies characterizing ARGs in surface water and associated sediments (Chen
et al., 2013a; Garner et al., 2016; Li et al., 2015) and is likely due to the prevalence of multidrug
efflux pumps among environmental bacteria (Martinez, 2009). Elevated trimethoprim resistance
is less common among comparable metagenomic studies, but trimethoprim ARGs have been
detected in environments heavily impacted by aquaculture and agriculture (Byrne-Bailey et al.,
2009; Muziasari et al., 2014), making the source of abundant trimethoprim ARGs unclear in this
urban watershed.
Notably, multidrug, beta-lactam, peptide, and tetracycline resistance (0.14, 0.030, 0.0083,
and 0.0022 ARGs per 16S rRNA genes, respectively) were more prevalent during storm 3
compared to other storms and baseline concentrations. In the baseline sample, however, rifampin,
aminocoumarin, fluoroquinolone, and glycopeptide resistance (0.0070, 0.00029, 0.0011, and 0.013
ARGs per 16S rRNA genes, respectively) were more abundant than levels observed during the
storms.
Only 14 ARGs were consistently present during the baseline as well as all three storms:
one trimethoprim resistance gene (dfrE), two polymyxin ARGs (PmrE, rosB), one nalidixic acid
ARG (emrB), and ten genes that are components of multidrug efflux pumps or involved in the
modulation of multidrug efflux (acrF, ceoB, mdtB, mdtC, mexB, mexC, mexD, phoP, smeR, smeB).
Each storm contained a unique profile of ARGs, with 8, 25, and 38 ARGs annotated uniquely to
storms 1, 2, and 3, respectively. There was not a conserved ARG profile across the storms;
however, ten ARGs were detected in all storms but were absent in baseline samples: two
aminoglycoside resistance genes (aadA, ANT(2”)-Ia), one beta-lactam (OXA-12), one peptide
(bacA), one polymyxin (arnA), and five genes related to multidrug efflux pumps (baeS, mdtD,
mdtF, mdtL, phoQ). These ten ARGs could be considered as targets for future storm monitoring
efforts, though ARGs unique to storm events may vary among different watersheds.

50
Figure 3-5: Distribution of ARGs by class in baseline (composite n=3) and peak (n=1) runoff
storm samples determined by shotgun metagenomic sequencing. Length of bars around the
plot circumference indicate ARG copies normalized to 16S rRNA genes. Figure produced using
the circlize package in R (v. 3.2.1).
While the association of ARGs with common fecal indicator bacteria and physicochemical
parameters offers insight into the possible sources of ARG contamination in Stroubles Creek, the
tendency of certain ARG patterns to be conserved based upon runoff source could provide the
basis for ARG source tracking. Several studies have demonstrated the feasibility of profiling the
antibiotic resistance of fecal streptococci to identify likely sources of fecal pollution in surface
water and groundwater (Hagedorn, et al., 1999; Wiggins, 1996; Wiggins et al., 1999). Though
widely used for over a decade, current source-tracking strategies generally focus on the detection
of source-specific genetic markers (i.e. library-independent strategies), given the labor-intensive
nature of antibiotic resistance profiling. Patterns of occurrence of tetracycline ARGs have been
used to identify urban and agricultural sources of ARGs in surface water (Chen et al., 2013a;
Storteboom et al., 2010a). Storteboom et al. (2010a) demonstrated that certain tetracycline ARGs
were more frequently associated with agriculture runoff (tet(H), tet (Q), tet (S), and tet (T)), while
others were more frequently associated with wastewater treatment plant (WWTP) effluent (tet(C),
tet (E), tet (O)). Phylogenetic variations in tet(W) have been used to track sources of ARG
contamination in groundwater and surface water (Koike et al., 2007; Storteboom et al., 2010b).
Storteboom et al. (2010b) utilized restriction fragment length polymorphism analysis to

51
demonstrate that certain tet(W) phylotypes were associated with environments impacted by
agricultural runoff, while different tet(W) phylotypes were indicative of WWTP influence. In
future work, such library-independent microbial source tracking methods combined with storm
profiling of ARGs could be used to identify waste streams that contribute to the highest watershed
loadings of ARGs. Next-generation sequencing offers a powerful tool to be used for examining
genetic variation in ARGs and can facilitate the identification of genetic phylotypes associated
with specific ARG sources. Management of these ARG sources can help to limit watershed-scale
ARG dissemination and potential downstream uptake by pathogenic bacteria.
CONCLUSIONS
Identification of strategies to limit inputs of clinically-relevant ARGs, along with other
initiatives to improve storm water quality, can help alleviate the risk of antibiotic resistance spread.
This study tracked the effects of storm events on the loadings of ARGs in an affected stream and
provided insight into mechanisms involved in transport as well as the behavior of various
indicators of antibiotic resistance. Specific conclusions include the following:
Storm-driven transport of ARGs contributed significant loadings to surface waters. Loadings
of certain ARGs (sul2 and tet(W)) were more than two orders of magnitude greater during
storm conditions than during equivalent background periods.
Key differences were noted in the behavior of different ARGs during storm runoff, yielding
new insight into the processes governing the fate and transport of ARGs in watersheds. For
example, the tetracycline resistance genes, tet(O) and tet(W) were correlated with the fecal
indicator bacteria, E. coli and enterococci, but sul1, sul2, and erm(F) were not.
Further research is needed to understand the seasonal and geographic variation in behavior
among ARGs in stormwater runoff as well as to identify key “indicator” ARGs or other
genetic elements that are associated with risk of downstream transfer to pathogens and
antibiotic resistance.
ACKNOWLEDGEMENTS
This work is supported by the National Science Foundation (NSF) Graduate Research Fellowship
Program Grant (DGE 0822220) and RAPID grant (1402651), Virginia Water Resources Research
Center Student Grant, Virginia Tech Institute for Critical Technology and Applied Science Center
for Science and Engineering of the Exposome, the Virginia Tech College of Agriculture and Life
Sciences Integrated Grants Program, the American Water Works Association Abel Wolman
Doctoral Fellowship, and NSF Partnership for International Research and Education Award
1545756.
REFERENCES
Altschul, S., Madden, T., Schaffer, A., Zhang, J., Zhang, Z., Miller, W., Dj, L., 1997. Gapped
BLAST and PSI- BLAST: a new generation of protein database search programs. Nucleic
acids Res. 25(17), 3389–3402.
Aminov, R.I., Garrigues-Jeanjean, N., Mackie, R.I., 2001. Molecular ecology of tetracycline
resistance: Development and validation of primers for detection of tetracycline resistance
genes encoding ribosomal protection proteins. Appl. Environ. Microbiol. 67(1), 22–32.

52
Amos, G.C.A., Zhang, L., Hawkey, P.M., Gaze, W.H., Wellington, E.M., 2014a. Functional
metagenomic analysis reveals rivers are a reservoir for diverse antibiotic resistance genes.
Vet. Microbiol. 171, 441–7.
Amos, G.C.A., Hawkey, P.M., Gaze, W.H., Wellington, E.M., 2014b. Waste water effluent
contributes to the dissemination of CTX-M-15 in the natural environment. J. Antimicrob.
Chemother. 69, 1785–1791.
Andersson, D.I., Hughes, D., 2014. Microbiological effects of sublethal levels of antibiotics. Nat.
Rev. Microbiol. 12, 465–478.
Auerbach, E.A., Seyfried, E.E., McMahon, K.D., 2007. Tetracycline resistance genes in activated
sludge wastewater treatment plants. Water Research 41, 1143–1151.
Beaber, J.W., Hochhut, B., Waldor, M.K., 2004. SOS response promotes horizontal dissemination
of antibiotic resistance genes. Nature 427, 72–74.
Bengtsson-Palme, J., Boulund, F., Fick, J., Kristiansson, E., Larsson, D.G.J., 2014. Shotgun
metagenomics reveals a wide array of antibiotic resistance genes and mobile elements in a
polluted lake in India. Front. Microbiol. 5, 1–14.
Berendonk, T.U., Manaia, C.M., Merlin, C., Fatta-Kassinos, D., Cytryn, E., Walsh, F., Bürgmann,
H., Sørum, H., Norström, M., Pons, M.-N., Kreuzinger, N., Huovinen, P., Stefani, S.,
Schwartz, T., Kisand, V., Baquero, F., Martinez, J.L., 2015. Tackling antibiotic resistance:
the environmental framework. Nat. Rev. Microbiol. 13, 310–317.
Bertrand-Krajewski, J.-L.L., Chebbo, G., Saget, A., 1998. Distribution of pollutant mass vs
volume in stormwater discharges and the first flush phenomenon. Water Research 32, 2341–
2356.
Bolger, A.M., Lohse, M., Usadel, B., 2014. Trimmomatic: a flexible trimmer for Illumina
sequence data. Bioinformatics 30, 2114–2120.
Bordas, A.C., Brady, M.S., Siewierski, M., Katz, S.E., 1997. In vitro enhancement of antibiotic
resistance development - Interaction of residue levels of pesticides and antibiotics. J. Food
Prot. 60, 531–536.
Buchfink, B., Xie, C., Huson, D.H., 2014. Fast and sensitive protein alignment using DIAMOND.
Nat. Methods 12, 59–60.
Byrne-Bailey, K.G., Gaze, W.H., Kay, P., Boxall, A.B.A., Hawkey, P.M., Wellington, E.M.H.,
2009. Prevalence of sulfonamide resistance genes in bacterial isolates from manured
agricultural soils and pig slurry in the United Kingdom. Antimicrob. Agents Chemother. 53,
696–702.
Chee-Sanford, J.C., Mackie, R.I., Koike, S., Krapac, I.G., Lin, Y.F., Yannarell, A.C., Maxwell, S.,
Aminov, R.I., 2009. Fate and Transport of Antibiotic Residues and Antibiotic Resistance
Genes following Land Application of Manure Waste. J. Environ. Qual. 38, 1086–1108.
Chen, B., Liang, X., Huang, X., Zhang, T., Li, X., 2013a. Differentiating anthropogenic impacts
on ARGs in the Pearl River Estuary by using suitable gene indicators. Water Research 47,
2811–2820.
Chen, B., Yang, Y., Liang, X., Yu, K., Zhang, T., Li, X., 2013b. Metagenomic Profiles of
Antibiotic Resistance Genes (ARGs) between Human Impacted Estuary and Deep Ocean
Sediments. Environ. Sci. Technol. 47, 12753–12760.
Chen, B., Yuan, K., Chen, X., Yang, Y., Zhang, T., Wang, Y., Luan, T., Zou, S., Li, X., 2016.
Metagenomic Analysis Revealing Antibiotic Resistance Genes (ARGs) and Their Genetic
Compartments in the Tibetan Environment. Environ. Sci. Technol. 50, 6670-9.
Chen, J., Yu, Z.T., Michel, F.C., Wittum, T., Morrison, M., 2007. Development and application

53
of real-time PCR assays for quantification of erm genes conferring resistance to macrolides-
lincosamides-streptogramin B in livestock manure and manure management systems. Appl.
Environ. Microbiol. 73, 4407–4416.
Chopra, I., Roberts, M., 2001. Tetracycline Antibiotics : Mode of Action , Applications , Molecular
Biology , and Epidemiology of Bacterial Resistance Tetracycline Antibiotics : Mode of
Action , Applications , Molecular Biology , and Epidemiology of Bacterial Resistance.
Microbiol. Mol. Biol. Rev. 65, 232–260.
Cizek, A.R., Characklis, G.W., Krometis, L.A., Hayes, J.A., Simmons, O.D., Di Lonardo, S.,
Alderisio, K.A., Sobsey, M.D., 2008. Comparing the partitioning behavior of Giardia and
Cryptosporidium with that of indicator organisms in stormwater runoff. Water Research 42,
4421–4438.
Davis, J.G., Truman, C.C., Kim, S.C., Ascough, J.C., Carlson, K., 2006. Antibiotic Transport via
Runoff and Soil Loss. J. Environ. Qual. 35, 2250–60.
DeSantis, T.Z., Hugenholtz, P., Larsen, N., Rojas, M., Brodie, E.L., Keller, K., Huber, T., Dalevi,
D., Hu, P., Andersen, G.L., 2006. Greengenes, a chimera-checked 16S rRNA gene database
and workbench compatible with ARB. Appl. Environ. Microbiol. 72, 5069–5072.
Fahrenfeld, N., Knowlton, K., Krometis, L.A., Hession, W.C., Xia, K., Lipscomb, E., Libuit, K.,
Green, B.L., Pruden, A., 2014. Effect of Manure Application on Abundance of Antibiotic
Resistance Genes and Their Attenuation Rates in Soil: Field-Scale Mass Balance Approach.
Environ. Sci. Technol. 48, 2643–2650.
Forsberg, K.J., Reyes, A., Wang, B., Selleck, E.M., Sommer, M.O.A, Dantas, G., 2012. The
Shared Antibiotic Resistome of Soil Bacteria and Human Pathogens. Science 337:1107-1111.
Garcia-Armisen, T., Vercammen, K., Passerat, J., Triest, D., Servais, P., Cornelis, P., 2011.
Antimicrobial resistance of heterotrophic bacteria in sewage-contaminated rivers. Water
Research 45, 788–796.
Garner, E., Wallace, J.S., Argoty, G.A., Wilkinson, C., Fahrenfeld, N., Heath, L.S., Zhang, L.,
Arabi, M., Aga, D.S., Pruden, A., 2016. Metagenomic profiling of historic Colorado Front
Range flood impact on distribution of riverine antibiotic resistance genes. Sci. Rep. 6, 38432.
Graham, D.W., Olivares-Rieumont, S., Knapp, C.W., Lima, L., Werner, D., Bowen, E., 2011.
Antibiotic Resistance Gene Abundances Associated with Waste Discharges to the
Almendares River near Havana, Cuba. Environ. Sci. Technol. 45, 418–424.
Gullberg, E., Albrecht, L.M., Karlsson, C., Sandegren, L., Andersson, D.I., 2014. Selection of a
Multidrug Resistance Plasmid by Sublethal Levels of Antibiotics and Heavy Metals. MBio
5, 19–23.
Hagedorn, C., Robinson, S.L., Filtz, J.L., Grubbs, S.M., Angier, T.A., Reneau, R.B., 1999.
Determining Sources of Fecal Pollution in a Rural Virginia Watershed with Antibiotic
Resistance Patterns in Fecal Streptococci. Appl. Environ. Microbiol. 65(12):5522-531.
Hathaway, J.M., Hunt, W.F., 2010. Evaluation of First Flush for Indicator Bacteria and Total
Suspended Solids in Urban Stormwater Runoff. Water, Air, Soil Pollut. 217, 135–147.
Huovinen, P., Sundstrom, L., Swedberg, G., Skold, O., 1995. Trimethoprim and sulfonamide
resistance. Antimicrob. Agents Chemother. 39, 279–289.
Jones, M.P., Hunt, W.F., Winston, R.J., 2012. Effect of Urban Catchment Composition on Runoff
Temperature. J. Environ. Eng. 138, 1231–1236.
Joy, S.R., Bartelt-Hunt, S.L., Snow, D.D., Gilley, J.E., Woodbury, B.L., Parker, D.B., Marx, D.B.,
Li, X., 2013. Fate and Transport of Antimicrobials and Antimicrobial Resistance Genes in
Soil and Runoff Following Land Application of Swine Manure Slurry. 47, 12081-8.

54
Keefer, T.N., Simons, R.K., McQuivey, R.S., 1980. Dissolved Oxygen Impact from Urban Storm
Runoff, in: Urban Stormwater and Combined Sewer Overflow Impact on Recieving Water
Bodies. pp. 223–244.
Kelsey, H., Porter, D.E., Scott, G., Neet, M., White, D., 2004. Using geographic information
systems and regression analysis to evaluate relationships between land use and fecal coliform
bacterial pollution. J. Exp. Mar. Bio. Ecol. 298, 197–209.
Klümper, U., Dechesne, A., Riber, L., Brandt, K.K., Gülay, A., Sørensen, S., Smets, B.F., 2016.
Metal stressors consistently modulate bacterial conugal plasmid uptake potential in a
phylogenetically conserved manner. ISME J. 1-14.
Koike, S., Krapac, I.G., Oliver, H.D., Yannarell, A.C., Chee-Sanford, J.C., Aminov, R.I., Mackie,
R.I., 2007. Monitoring and source tracking of tetracycline resistance genes in lagoons and
groundwater adjacent to swine production facilities over a 3-year period. Appl. Environ.
Microbiol. 73, 4813–4823.
Kristiansson, E., Fick, J., Janzon, A., Grabic, R., Rutgersson, C., Weijdegard, B., Soderstrom, H.,
Larsson, D.G.J., 2011. Pyrosequencing of Antibiotic-Contaminated River Sediments Reveals
High Levels of Resistance and Gene Transfer Elements. PLoS One 6, 7.
Krometis, L.-A.H., Characklis, G.W., Simmons, O.D., Dilts, M.J., Likirdopulos, C.A, Sobsey,
M.D., 2007. Intra-storm variability in microbial partitioning and microbial loading rates.
Water Research 41, 506–16.
Kurenbach, B., Marjoshi, D., Amábile-cuevas, C.F., Ferguson, G.C., Godsoe, W., Gibson, P.,
Heinemann, J.A, 2015. Sublethal Exposure to Commercial Formulations of the Herbicides
Changes in Antibiotic Susceptibility in Escherichia coli and Salmonella enterica serovar
Typhimurium 6, 1–9.
Laht, M., Karkman, A., Voolaid, V., Ritz, C., Tenson, T., Virta, M., Kisand, V., 2014. Abundances
of tetracycline, sulphonamide and beta-lactam antibiotic resistance genes in conventional
wastewater treatment plants (WWTPs) with different waste load. PLoS One 9, e103705.
Li, B., Yang, Y., Ma, L., Ju, F., Guo, F., Tiedje, J.M., Zhang, T., 2015. Metagenomic and network
analysis reveal wide distribution and co-occurrence of environmental antibiotic resistance
genes. ISME J. 9, 1–13.
Liao, H., Krometis, L.A.H., Cully Hession, W., Benitez, R., Sawyer, R., Schaberg, E., von
Wagoner, E., Badgley, B.D., 2015. Storm loads of culturable and molecular fecal indicators
in an inland urban stream. Sci. Total Environ. 530–531, 347–356.
Liao, H., Krometis, L.-A.H., Hession, W.C., House, L.L., Kline, K., Badgley, B.D., 2014.
Hydrometeorological and Physicochemical Drivers of Fecal Indicator Bacteria in Urban
Stream Bottom Sediments. J. Environ. Qual. 43, 2034.
Liu, A., Fong, A., Becket, E., Yuan, J., Tamae, C., Medrano, L., Maiz, M., Wahba, C., Lee, C.,
Lee, K., Tran, K.P., Yang, H., Hoffman, R.M., Salih, A., Miller, J.H., 2011. Selective
advantage of resistant strains at trace levels of antibiotics: a simple and ultrasensitive color
test for detection of antibiotics and genotoxic agents. Antimicrob. Agents Chemother. 55,
1204–10.
Liu, Y.Y., Wang, Y., Walsh, T.R., Yi, L.X., Zhang, R., Spencer, J., Doi, Y., Tian, G., Dong, B.,
Huang, X., Yu, L.F., Gu, D., Ren, H., Chen, X., Lv, L., He, D., Zhou, H., Liang, Z., Liu, J.H.,
Shen, J., 2016. Emergence of plasmid-mediated colistin resistance mechanism MCR-1 in
animals and human beings in China: A microbiological and molecular biological study.
Lancet Infect. Dis. 16, 161-8.
Luo, Y., Mao, D., Rysz, M., 2010. Trends in Antibiotic Resistance Genes Occurrence in the Haihe

55
River, China. Environ. Sci. Technol. 44, 7220–7225.
Magoč, T., Salzberg, S.L., 2011. FLASH: fast length adjustment of short reads to improve genome
assemblies. Bioinformatics 27, 2957–2963.
Marti, E., Jofre, J., Balcazar, J.L., 2013. Prevalence of Antibiotic Resistance Genes and Bacterial
Community Composition in a River Influenced by a Wastewater Treatment Plant. PLoS One
8, e78906.
Martinez, J.L., 2009. The role of natural environments in the evolution of resistance traits in
pathogenic bacteria. Proc. Biol. Sci. 276, 2521–2530.
Mazel, D., 2006. Integrons: agents of bacterial evolution. Nat. Rev. Microbiol. 4, 608–620.
McArthur, A.G., Waglechner, N., Nizam, F., Yan, A., Azad, M. a., Baylay, A.J., Bhullar, K.,
Canova, M.J., De Pascale, G., Ejim, L., Kalan, L., King, A.M., Koteva, K., Morar, M.,
Mulvey, M.R., O’Brien, J.S., Pawlowski, A.C., Piddock, L.J. V, Spanogiannopoulos, P.,
Sutherland, A.D., Tang, I., Taylor, P.L., Thaker, M., Wang, W., Yan, M., Yu, T., Wright,
G.D., 2013. The comprehensive antibiotic resistance database. Antimicrob. Agents
Chemother. 57, 3348–3357.
McCarthy, D.T., Hathaway, J.M., Hunt, W.F., Deletic, A., 2012. Intra-event variability of
Escherichia coli and total suspended solids in urban stormwater runoff. Water Research 46,
6661–70.
McKinney, C.W., Loftin, K.A., Meyer, M.T., Davis, J.G., Pruden, A., 2010. tet and sul Antibiotic
Resistance Genes in Livestock Lagoons of Various Operation Type, Configuration, and
Antibiotic Occurrence. Environ. Sci. Technol. 44, 6102–6109.
McLellan, S.L., Hollis, E.J., Depas, M.M., Dyke, M. Van, Harris, J., Scopel, C.O., 2007.
Distribution and Fate of Escherichia coli in Lake Michigan Following Contamination with
Urban Stormwater and Combined Sewer Overflows. J. Great Lakes Res. 33, 566–580.
McVicker, G., Prajsnar, T.K., Williams, A., Wagner, N.L., Boots, M., Renshaw, S.A., Foster, S.J.,
2014. Clonal expansion during Staphylococcus aureus infection dynamics reveals the effect
of antibiotic intervention. PLoS Pathog. 10, e1003959.
Meyer, F., Paarmann, D., D’Souza, M., Olson, R., Glass, E.M., Kubal, M., Paczian, T., Rodriguez,
A., Stevens, R., Wilke, A., Wilkening, J., Edwards, R.A., 2008. The metagenomics RAST
server - a public resource for the automatic phylogenetic and functional analysis of
metagenomes. BMC Bioinformatics 9.
Munir, M., Wong, K., Xagoraraki, I., 2011. Release of antibiotic resistant bacteria and genes in
the effluent and biosolids of five wastewater utilities in Michigan. Water Research 45, 681–
693.
Muziasari, W.I., Managaki, S., Pärnänen, K., Karkman, A., Lyra, C., Tamminen, M., Suzuki, S.,
Virta, M., 2014. Sulphonamide and trimethoprim resistance genes persist in sediments at
Baltic Sea aquaculture farms but are not detected in the surrounding environment. PLoS One
9, 1–7.
Parker, J.K., McIntyre, D., Noble, R.T., 2010. Characterizing fecal contamination in stormwater
runoff in coastal North Carolina, USA. Water Research 44, 4186–94.
Paule-Mercado, M.A., Ventura, J.S., Memon, S.A., Jahng, D., Kang, J.H., Lee, C.H., 2016.
Monitoring and predicting the fecal indicator bacteria concentrations from agricultural, mixed
land use and urban stormwater runoff. Sci. Total Environ. 550, 1171–1181.
Pei, R.T., Kim, S.C., Carlson, K.H., Pruden, A., 2006. Effect of River Landscape on the sediment
concentrations of antibiotics and corresponding antibiotic resistance genes (ARG). Water
Research 40, 2427–2435.

56
Port, J.A., Wallace, J.C., Griffith, W.C., Faustman, E.M., 2012. Metagenomic Profiling of
Microbial Composition and Antibiotic Resistance Determinants in Puget Sound. PLoS One
7, 13.
Pruden, A., Arabi, M., Storteboom, H.N., 2012. Correlation Between Upstream Human Activities
and Riverine Antibiotic Resistance Genes. Environ. Sci. Technol. 46, 11541–11549.
Pruden, A., Pei, R.T., Storteboom, H., Carlson, K.H., 2006. Antibiotic resistance genes as
emerging contaminants: Studies in northern Colorado. Environ. Sci. Technol. 40, 7445–7450.
Prudhomme, M., Attaiech, L., Sanchez, G., Martin, B., Claverys, J.P., 2006. Antibiotic stress
induces genetic transformability in the human pathogen Streptococcus pneumoniae. Science
313, 89–92.
Qureshi, A., 1979. Microbiological studies on the quality of urban stormwater runoff in Southern
Ontario, Canada. Water Research 13, 977–985.
Roberts, M.C., 2012. Acquired Tetracycline Resistance Genes, Antibiotic Discovery and
Development, Vols 1 and 2. Springer, New York.
Roberts, M.C., 2011. Environmental macrolide-lincosamide-streptogramin and tetracycline
resistant bacteria. Front. Microbiol. 2, 8.
Sansalone, J.J., Buchberger, S.G., 1997. Partitioning and First Flush of Metals in Urban Roadway
Storm Water. J. Environ. Eng. 123, 134–143.
Sauer, E.P., VandeWalle, J.L., Bootsma, M.J., McLellan, S.L., 2011. Detection of the human
specific Bacteroides genetic marker provides evidence of widespread sewage contamination
of stormwater in the urban environment. Water Research 45, 4081–4091.
Selvakumar, A., Borst, M., 2006. Variation of microorganism concentration in urban stormwater
runoff with land use and seasons. J. Water Health 4, 109–124.
Sidhu, J.P.S., Hodgers, L., Ahmed, W., Chong, M.N., Toze, S., 2012. Prevalence of human
pathogens and indicators in stormwater runoff in Brisbane, Australia. Water Research 46,
6652–6660.
Sköld, O., 2000. Sulfonamide resistance: mechanisms and trends. Drug Resist. Updat. 3, 155–160.
Song, B., Wang, G.R., Shoemaker, N.B., Salyers, A.A., 2009. An Unexpected Effect of
Tetracycline Concentration: Growth Phase-Associated Excision of the Bacteroides
Mobilizable Transposon NBU1. J. Bacteriol. 191, 1078–1082.
Storteboom, H., Arabi, M., Davis, J.G., Crimi, B., Pruden, A., 2010a. Identification of Antibiotic-
Resistance-Gene Molecular Signatures Suitable as Tracers of Pristine River, Urban, and
Agricultural Sources. Environ. Sci. Technol. 44, 1947–1953.
Storteboom, H., Arabi, M., Davis, J.G., Crimi, B., Pruden, A., 2010b. Tracking antibiotic
resistance genes in the south platte river basin using molecular signatures of urban,
agricultural, and pristine sources. Environ. Sci. Technol. 44, 7397–7404.
Stumpf, C.H., Piehler, M.F., Thompson, S., Noble, R.T., 2010. Loading of fecal indicator bacteria
in North Carolina tidal creek headwaters: Hydrographic patterns and terrestrial runoff
relationships. Water Research 44, 4704–4715.
Surbeck, C.Q., Jiang, S.C., Ahn, J.H., Grant, S.B., 2006. Flow Fingerprinting Fecal Pollution and
Suspended Solids in Stormwater Runoff from an Urban Coastal Watershed. Environ. Sci.
Technol. 40, 4435–4441.
Suzuki, M.T., Taylor, L.T., DeLong, E.F., 2000. Quantitative analysis of small-subunit rRNA
genes in mixed microbial populations via 5 ’-nuclease assays. Appl. Environ. Microbiol. 66,
4605–4614.
Úbeda, C., Maiques, E., Knecht, E., Lasa, Í., Novick, R.P., Penadés, J.R., 2005. Antibiotic-induced

57
SOS response promotes horizontal dissemination of pathogenicity island-encoded virulence
factors in staphylococci. Mol. Microbiol. 56, 836–844.
VADEQ, VADCR, 2006. Upper Stroubles Creek Watershed TMDL Implementation Plan,
Montgomery County, Virginia. http://www.deq.virginia.gov/Portals/0/DEQ/Water/
TMDL/ImplementationPlans/stroubip.pdf (accessed 9 May 2015).
Van Boeckel, T.P., Gandra, S., Ashok, A., Caudron, Q., Grenfell, B.T., Levin, S.A.,
Laxminarayan, R., 2014. Global antibiotic consumption 2000 to 2010: An analysis of national
pharmaceutical sales data. Lancet Infect. Dis. 14, 742–750.
von Wintersdorff, C.J.H., Penders, J., van Niekerk, J.M., Mills, N.D., Majumder, S., van Alphen,
L.B., Savelkoul, P.H.M., Wolffs, P.F.G., 2016. Dissemination of Antimicrobial Resistance in
Microbial Ecosystems through Horizontal Gene Transfer. Front. Microbiol. 7, 1–10.
Wiggins, B.A., 1996. Discriminant analysis of antibiotic resistance patterns in fecal streptococci,
a method to differentiate human and animal sources of fecal pollution in natural waters. Appl.
Environ. Microbiol. 62, 3997–4002.
Wiggins, B.A., Andrews, R.W., Conway, R.A., Corr, C.L., Dobratz, J., Dougherty, D.P., Eppard,
J.R., Knupp, S.R., Mettenburg, J.M., Rinehardt, J.M., Sonsino, J., Zimmerman, M.E.,
Dobratz, E.J., Limjoco, M.C., Torrijos, R.L., 1999. Use of antibiotic resistance analysis to
identify nonpoint sources of fecal pollution. Appl Env. Microbiol 65, 3483–6.
World Health Organization, 2015. Global action plan on antimicrobial resistance. Geneva: World
Health Organization.
Wright, G.D., 2010. Antibiotic resistance in the environment: a link to the clinic? Curr. Opin.
Biotechnol., 23(5), 589-94.
Xia, Z.J., Wang, J., Hu, W., Liu, H., Gao, X.Z., Wu, Z.H., Zhang, P.Y., Li, Y.Z., 2008. Improving
conjugation efficacy of Sorangium cellulosum by the addition of dual selection antibiotics. J.
Ind. Microbiol. Biotechnol. 35, 1157–1163.
Xu, W., Yan, W., Li, X., Zou, Y., Chen, X., Huang, W., Miao, L., Zhang, R., Zhang, G., Zou, S.,
2013. Antibiotics in riverine runoff of the Pearl River Delta and Pearl River Estuary, China:
concentrations, mass loading and ecological risks. Environ. Pollut. 182, 402–7.
Zhang, P.Y., Xu, P.P., Xia, Z.J., Wang, J., Xiong, J., Li, Y.Z., 2013. Combined treatment with the
antibiotics kanamycin and streptomycin promotes the conjugation of Escherichia coli. Fems
Microbiol. Lett. 348, 149–156.
Zhang, S., Pang, S., Wang, P., Wang, C., Han, N., Liu, B., Han, B., Li, Y., Anim-Larbi, K., 2016.
Antibiotic concentration and antibiotic-resistant bacteria in two shallow urban lakes after
stormwater event. Environ. Sci. Pollut. Res. 23, 9984–9992.

58
CHAPTER 4 : METAGENOMIC PROFILING OF HISTORIC COLORADO FRONT
RANGE FLOOD IMPACT ON DISTRIBUTION OF RIVERINE ANTIBIOTIC
RESISTANCE GENES
Emily Garner, Joshua S. Wallace, Gustavo Arango Argoty, Caitlin Wilkinson, Nicole
Fahrenfeld, Lenwood S. Heath, Liqing Zhang, Mazdak Arabi, Diana S. Aga, and Amy Pruden
ABSTRACT
Record-breaking floods in September 2013 caused massive damage to homes and infrastructure
across the Colorado Front Range and heavily impacted the Cache La Poudre River watershed.
Given the unique nature of this watershed as a test-bed for tracking environmental pathways of
antibiotic resistance gene (ARG) dissemination, we sought to determine the impact of extreme
flooding on ARG reservoirs in river water and sediment. We utilized high-throughput DNA
sequencing to obtain metagenomic profiles of ARGs before and after flooding, and investigated
23 antibiotics and 14 metals as putative selective agents during post-flood recovery. With 277
ARG subtypes identified across samples, total bulk water ARGs decreased following the flood but
recovered to near pre-flood abundances by ten months post-flood at both a pristine site and at a
site historically heavily influenced by wastewater treatment plants and animal feeding operations.
Network analysis of de novo assembled sequencing reads into 52,556 scaffolds identified ARGs
likely located on mobile genetic elements, with up to 11 ARGs per plasmid-associated scaffold.
Bulk water bacterial phylogeny correlated with ARG profiles while sediment phylogeny varied
along the river’s anthropogenic gradient. This rare flood afforded the opportunity to gain deeper
insight into factors influencing the spread of ARGs in watersheds.
INTRODUCTION
In September 2013, historic flooding impacted the Colorado Front Range, with some
locations experiencing a rare 1-in-1,000 year rainfall event1. A record-setting flood peak of 3.3 m
was recorded for the Cache La Poudre (Poudre) River in Fort Collins, resulting in a major
transformation of the watershed landscape and massive transport of sediment throughout the
basin2. Since 2002, the Poudre River has served as a field observatory for characterizing the impact
of urban and agricultural activities on antibiotics and antibiotic resistance genes (ARGs)3–7. The
distinct gradient of anthropogenic influence as the Poudre River flows from its pristine origin in
the Rocky Mountains to areas heavily impacted by animal feedings operations (AFOs) and
wastewater treatment plants (WWTPs) has previously served to demonstrate that human activities
significantly alter ARG occurrence in river bed sediment and bulk water7. In particular, the
upstream capacity of AFOs and WWTPs, weighted to account for the inverse distance of these
facilities from riverine sampling sites, strongly correlated (R2=0.92) with sul1, marking it as a key
indicator of human influence.
Antibiotic resistance presents a critical challenge to public health. While antibiotic
resistance is a natural capability among many bacteria, with diverse ARGs profiled even in remote
and ancient soils and caves8–12, widespread use of antibiotics both in livestock and humans is linked
with increased frequency of resistant infections reported in clinical settings and increased ARG
abundance in aquatic and terrestrial environments9,13–17. Through comparison of DNA sequence

59
similarity, instances have been identified in which pathogens likely obtained ARGs from
environmental reservoirs18,19. Though gene transfer events of ARGs from environmental bacteria
to human pathogens are thought to be rare20, the consequences can be devastating. For example,
the recent emergence and spread of blaNDM-1, which is frequently found on a genetic element
carrying several genes conferring resistance to multiple antibiotics, is thought to have originated
via horizontal transfer from a plant pathogen to a human pathogen21.
Surface water is now well-documented as a receiving environment for anthropogenic
sources of ARGs and also represents a critical linkage back to humans both as a recreational and
drinking water resource7,22–25. The factors governing the dissemination of ARGs in watersheds are
complex and not well understood. In particular, transport of resistant bacteria and ARGs from
human sources, such as WWTPs and AFOs, selection of allochthonous and authochthonous
resistant bacteria by antibiotics and other agents, and horizontal gene transfer have been cited as
key mechanisms governing the proliferation of ARGs in watersheds22,26,27. Contamination with
antibiotics is of particular interest as they could exert direct or co-selective pressures on ARGs of
different classes and also stimulate horizontal gene transfer28–32. Likewise, various metals can also
stimulate the latter two processes14,33–36, though few studies have elucidated the relationship
between occurrence of ARGs and antibiotics or metals in surface water. Understanding the relative
roles of antibiotics and metals in proliferating antibiotic resistance in the environment is important
for developing effective management guidelines for antimicrobial use and management of urban
and agricultural waste streams.
In the wake of unprecedented rainfall in the Poudre River basin, we sought to characterize
the impact of flooding and subsequent recovery on the occurrence of ARGs and examine the
influence of antibiotics and metals. We annotated shotgun metagenomic reads against existing
ARG and heavy metal resistance gene (MRG) databases to profile the resistome of pristine and
heavily impacted sites before and after the flood. Correlations of select ARGs, quantified by
quantitative polymerase chain reaction (qPCR), with antibiotics and heavy metals were examined.
Amplicon sequencing of 16S rRNA genes enabled comparison of the resistome with the microbial
phylogenetic composition as an indicator of the relative importance of vertical gene transfer and
physical transport of bacteria. To explore the role of horizontal gene transfer in shaping the
resistome, metagenomic reads were annotated against a mobile genetic element database. Network
analysis of de novo assembled metagenomic scaffolds revealed ARGs exhibiting physical genetic
linkages to mobile genetic elements, MRGs, and other ARGs. Comprehensive profiling of ARGs
and factors hypothesized to contribute to their selection, proliferation, and spread in the
environment before and after an extreme flooding event provided unique insight into the
mechanisms governing the dissemination of ARGs in the water environment. This knowledge will
be particularly important in upcoming decades when the frequency and severity of storms is
expected to increase as a consequence of climate change37.
MATERIALS AND METHODS
Sample Collection and Preservation
Bulk water, including the suspended sediment therein, and bed sediment samples were
collected from five previously described river sites, representing a gradient of anthropogenic

60
influence, as well as from a WWTP that discharges into the river5. Briefly, site 1 is a pristine
location near the river’s origin in the Rocky Mountains, site 2 is upstream of Fort Collins and
receives light agricultural runoff, site 3 is within Fort Collins and receives agricultural and urban
stormwater runoff, site 4 is downstream of two WWTPs, (combined average effluent: 42,000
m3/d), and site 5 is downstream of Fort Collins and Greeley and is heavily impacted by adjacent
agricultural and urban land use and a 28,000 m3/d WWTP (Figure 4-1). Bulk water was collected
from the center of the flow channel in sterile 1-L polypropylene containers for molecular analysis
and in 1-L amber glass bottles pretreated as described by Tso et al.38 for antimicrobial analysis.
Duplicate bulk water samples for metal analysis were collected in 50-mL metal-free polypropylene
centrifuge tubes. Triplicate sediment samples (~30 g) were collected from the top 5 cm of bed
sediment using a sterile spade for molecular analysis. Water quality information was collected
using a Hydrolab MS5 multiparameter sonde (OTT Hydromet, Loveland, CO). Samples were
transported to the lab on ice and preserved within 24 hours of collection.
Figure 4-1: Poudre River sampling sites. Contributing wastewater treatment plants (WWTPs)
and animal feeding operations (AFO) are indicated with their respective capacities in million
gallons per day (MGD) and animal counts. The figure was created by co-author Mazdak Arabi
using the ArcGIS software by ESRI, Release 10.1 (ESRI, Redlands, CA)
(http://www.esri.com/software/arcgis).
Bulk water samples for molecular analysis were concentrated onto 0.22 µm mixed cellulose
esters membrane filters (Millipore, Billerica, MA). Filters were folded into quarters and cut into 1
cm2 pieces using a sterile blade and transferred to extraction tubes. Sediment was homogenized
and 0.5 g was transferred to extraction tubes. DNA was extracted using a FastDNA SPIN Kit for
Soil (MP Biomedicals, Solon, OH). A filter blank and DNA extraction blank were also extracted.
Samples for antimicrobial analysis were preserved according to Tso et al38. The method was
modified to use a surrogate solution containing d4-sulfamethoxazole, 13C6-sulfamethazine, 13C-
erythromycin, and demeclocycline (500 ng/mL). Samples for metal analysis were acidified to 2%
(v/v) with fuming nitric acid and filtered through a 0.45 μm polypropylene syringe filter. A 10-mL

61
aliquot was transferred to two 15-mL metal-free polypropylene centrifuge tubes. One aliquot was
spiked with 50 uL of 1000 ng/mL spiking solution made from certified metal standards (BDH
Aristar® PLUS 82026-108, 82026-100, respectively, VWR, Inc. Radnor, PA, USA). An equal
volume of 2% nitric acid in water (v/v) was added to the remaining aliquot for quantification by
single-point standard addition.
Quantification of ARGs
Gene markers were quantified in triplicate reactions from DNA extracts using qPCR, with
previously published protocols for 16S rRNA genes39 and five ARGs: sul16, sul26, tet(O)40,
tet(W)40, and ermF41. Extracts were diluted between 1:10-1:50 to minimize inhibition. Triplicate
standard curves of ten-fold serial diluted standards of each target gene ranging from 108 to 102
gene copies/µl for 16S rRNA and 107 to 101 gene copies/µl for ARGs were included for each run,
along with a triplicate negative control. The limit of quantification was established as the lowest
standard that amplified in triplicate in each run, ranging from 0.7 to 3.3 log gene copies/ml for
bulk water and 3.6 to 6.0 log gene copies/g for sediment, depending on the gene assay and the
measured volume or mass of sample.
Quantification of Antibiotics and Metals
Antibiotics were quantified by liquid chromatography-tandem mass spectrometry (LC-
MS/MS) as previously described for sulfonamides and tetracyclines38. A separate LC-MS/MS
method was adapted from Wallace and Aga42 for macrolide antibiotics to enhance sensitivity. All
analytes were normalized to the internal standard d10-carbamazepine (sulfonamides and
macrolides) or minocycline (tetracyclines). Metals were quantified by inductively coupled plasma
mass spectrometry (ICP-MS) on an X-Series 2 instrument (Thermo Scientific, Waltham, MA)
using collision cell technology to reduce polyatomic interferences. Analytes were quantified using
single-point standard addition and confirmed by external calibration curve (0.5 to 1000 ng/mL).
The concentrations of Cr, Mn, Cu, As, Sr, Ag, and Cd were quantified using the most abundant
isotope, normalized to the internal standard 115In. Barium, Ce, Gd, Pt, Pb, Th, and U were
quantified analogously via a separate injection to maximize scan time for accurate quantification,
normalized to internal standard, 159Tb.
16S rRNA Gene Amplicon Sequencing and Metagenomic Analysis
To explore the composition of the bacterial communities in bulk water and bed sediment,
gene amplicon sequencing was conducted using barcoded primers (515f/806r) designed to target
the V4 region of the 16S rRNA gene43,44. Triplicate PCR products were composited, and 240 ng
of each composite was combined and purified using a QIAquick PCR Purification Kit (Qiagen,
Valencia, CA). Sequencing was conducted at the Virginia Bioinformatics Institute (VBI)
Genomics Research Laboratory (Blacksburg, VA) on an Illumina MiSeq using a 250-cycle paired-
end protocol. Processing of reads was conducted using the QIIME pipeline45 and annotation
against the Greengenes database46 (May 2013 release). After quality filtering, between 37,150 -
444,433 reads were obtained per sample and all samples were rarefied to 37,150 randomly selected
reads.

62
Shotgun metagenomics were conducted on water samples collected at sites 1 and 5, 12
months pre-flood and 3 and 10 months post-flood. Samples were prepared using the Nextera XT
library prep (Illumina, San Diego, CA) and sequenced on an Illumina HiSeq 2500 using a 100-
cycle paired-end protocol at VBI. Paired ends reads were merged using FLASH47. Quality filtering
was conducted using Trimmomatic48 according to default parameters. Relative abundances were
calculated by normalizing gene counts to abundance of 16S rRNA genes, as well as target gene
and 16S rRNA gene length as proposed by Li et al49. Absolute abundances were calculated by
multiplying relative abundance of ARGs by total abundance of 16S rRNA genes, quantified by
qPCR, as noted above. 16S rRNA genes were annotated using BLASTN50 against the Silva
ribosomal RNA database51 (version 123). ARGs were annotated against the subset download of
the Comprehensive Antibiotic Resistance Database52, which excludes genes that confer resistance
via specific mutations (accessed August 2015). MRGs were annotated from the BacMet
antibacterial biocide and metal resistance genes database53 (version 1.1), and proteins specific to
the mobile genetic elements plasmids and prophages were annotated from the ACLAME
database54 (version 0.4). Annotations made against the ACLAME database were manually
screened to ensure known ARGs were not included. Functional gene annotation was performed
using the DIAMOND protein aligner55 with a best hit approach using an amino acid identity cutoff
of 90%, minimum alignment length of 25 amino acids, and 1e-5 e-value cutoff. Sequences were
assembled prior to network analysis using the IDBA-UD de novo assembler56 and annotated using
DIAMOND with a 1e-5 e-value cutoff. Unassembled sequences were uploaded to MG-RAST57
and are publicly available under accession numbers 462880.3-4628878.3 (Table S1).
Statistical Analyses
Spearman’s Rank Correlation Coefficients were calculated in JMP to assess correlations
between ARGs and metals, antibiotics, and water quality parameters using a significance cutoff of
α=0.05. UniFrac distances generated in QIIME were imported into PRIMER-E (version 6.1.13)
for one-way analysis of similarities (ANOSIM). Metagenomic ARG relative abundances were
imported into PRIMER-E and Bray-Curtis distances were used to generate multidimensional
scaling plots. This distance matrix was compared with weighted UniFrac similarities for 16S rRNA
gene amplicon sequencing using 2STAGE in PRIMER-E. Network analysis visualization was
conducted using Gephi (version 0.8.2).
RESULTS AND DISCUSSION
Metagenomic analysis reveals shift in ARG profile following extreme flooding event
Annotation of shotgun metagenomic reads from bulk water samples against the
Comprehensive Antibiotic Resistance Database52 indicated that total ARGs per mL bulk water
decreased from pre- to post-flood and then increased to near pre-flood abundances by ten months
post-flood at both sites 1 and 5 (Figure 4-2A). This decrease and subsequent increase suggests that
the flood acted to “dilute” ARGs at both the pristine and impacted sites. Ten months of recovery,
however, allowed sufficient time for ARG abundances to return to approximately pre-flood
abundances.

63
A total of 277 ARG subtypes were identified across all samples, ranging from 77 to 155
subtypes per site (Figure 4-2B,C). On average, trimethoprim resistance was the most common
resistance type (39%), followed by multidrug (30%), polymyxin (11%), aminocoumarin (4%),
peptide (4%), and tetracycline resistance (3%). The most common mechanism of resistance was
efflux (46%), followed by antibiotic target replacement (39%), cell wall charge alteration (8%),
antibiotic inactivation (5%), and molecular bypass (2%; Figure S1).
Figure 4-2: Metagenomic characterizations of ARGs in Poudre River samples. (A) Absolute
abundance of ARGs by class per mL bulk water identified from metagenomic sequencing reads
annotated against the Comprehensive Antibiotic Resistance Database. ARGs conferring resistance
to two or more of the classes macrolide, lincosamide, and streptogramin are denoted as MLS. Venn
diagrams represent number of ARGs unique and shared amongst sample dates indicated in number
of months relative to flood at (B) site 1 and (C) site 5. (D) Nonmetric multidimensional scaling
(NMDS) plot generated from Bray-Curtis similarity matrix of metagenomic ARG composition by
date at site 1 (historically pristine) and site 5 (historically impacted). Months indicated are time
scale relative to the flooding event.
The profile of individual ARG subtypes varied at both sites, indicating shifts in response
to flooding and recovery, as illustrated by nonmetric multidimensional scaling (NMDS) analysis
generated from a Bray-Curtis (BC) similarity matrix (Figure 4-2D). Remarkably, NMDS analysis
of ARGs indicated bulk water at both sites 1 and 5 shifted three months post-flood (site 1 BC =
58.3, site 5 BC = 58.9) but continued to shift to a unique profile by ten months post-flood (site 1
BC = 60.9, site 5 BC = 61.7). Interestingly, the shift observed at site 5 three months post-flood
indicated similarity with site 1 pre-flood, though not statistically significantly (BC = 65.56),
suggesting that the flood acted to “dilute” ARGs from the impacted site such that it resembled the
pristine site, as is consistent with the decrease in total abundance of ARGs in post-flood samples
(Figure 4-2A). Surprisingly, while ARGs returned to pre-flood abundances, the ARG profile did
not return to a pre-flood state, suggesting that the flooding may have disseminated new sources of
ARGs that persisted at each site. While seasonal variation may also have contributed to the
observed fluctuations, the overall stability of the bacterial community at each site across sample

64
dates, relative to notable community variation across sites (Figure 4-3), suggests that seasonal
impact on biological variation was minimal.
Figure 4-3: Beta Diversity plots of microbial community phylogenetic composition. Based on
16S rRNA gene amplicon sequencing of Poudre River bulk water (n=1) and bed sediment (n=3)
samples coded by sample site and collection date based on distance matrixes generated using a
jackknifed unweighted UniFrac metric.
Potential for selection pressure indicated by co-occurrence of ARGs and antibiotics
The potential role of antibiotics as selective agents influencing the re-establishment of
ARGs during post-flood recovery was investigated by examining correlations between
sulfonamide (sul1, sul2), tetracycline (tet(O), tet(W)), and macrolide (ermF) ARGs in bed
sediment and bulk water, quantified using qPCR (Figure S3), and 23 antibiotics (Table S2) in bulk
water at all sites (Figure 4-4). Due to the tendency of some antibiotics to lose antibacterial activity
if they become sorbed to sediments or form complexes with substances such as humic acids58-60,
analysis of antibiotics was limited to the bulk water. Correlations between antibiotics and ARGs
in bulk water are hypothesized to be indicative of potential selective pressure while correlations
between antibiotics in the bulk water and ARGs in sediment are likely to be indicative of deposition
of bacteria that may have been subject to selection in the bulk water.
All ARGs demonstrated significant Spearman’s rank correlations with at least one
antibiotic against which they conferred resistance, suggesting direct selection may be a key
pressure shaping the resistome (Figure 4-4). Bed sediment sul1 exhibited moderate correlations
with sulfamethoxazole and sulfadiazine (Spearman ρ=0.4972, 0.4575; p=0.0028, 0.0065), while
bulk water sul2 was moderately correlated with sulfamethoxazole (ρ=0.401.; p=0.023). Bulk water
tet(O) exhibited a moderate correlation with anhydrotetracycline and a strong correlation with

65
tetracycline (ρ=0.4133, 0.5764; p=0.0187, 0.0006), while bulk water tet(W) was moderately
correlated with tetracycline (ρ=0.4657; p=0.0072). ermF in bed sediment correlated weakly with
azithromycin and moderately with tylosin (ρ=0.3528, 0.4764; p=0.0407, 0.0044) and in bulk water
weakly with clarithromycin and moderately with erythromycin (ρ=0.3999, 0.4172; p=0.0234,
0.0175).
All ARGs identified were also found to significantly correlate with certain antibiotics
against which they do not confer resistance (Figure 4-4; p-values in Table S3), indicating potential
for co-selection, which results from co-location of ARGs on the same genetic element, such as a
plasmid, transposon, or integron; cross-resistance, which occurs when a single cellular response is
capable of combatting multiple chemicals, such is the case with multidrug resistance pumps; or
co-regulation, which occurs when two resistance regulation systems are transcriptionally linked34.
Notably, numerous correlations were observed between antibiotics and sul1 and tet(O) ARGs. Bed
sediment sul1 exhibited a strong correlation with azithromycin, moderate correlation with
clarithromycin, and weak correlation with erythromycin. Bulk water tet(O) exhibited a strong
correlation with clarithromycin and erythromycin, moderate correlation with sulfamethoxazole,
and sulfamethazine, and a weak correlation with azithromycin, while bed sediment tet(O)
exhibited a strong correlation with azithromycin and erythromycin, and a moderate correlation
with clarithromycin, sulfamethoxazole, and tylosin.
It is challenging to determine whether observed correlations are truly indicative of selective
pressure or simply co-transport of antibiotics and ARGs from the same source. Covariation among
antibiotics may also obscure true causative relationships of selection between genes and
antimicrobial agents. Based on metagenomic data, positive correlations were observed between
MLS, rifampin, and fosfomycin ARGs and the antibiotics sulfamethazine (ρ=0.8452, 0.8452,
0.8262, p=0.0341, 0.0341, 0.0427) and clarithromycin (ρ=0.8452, 0.8452, 0.8262, p=0.0341,
0.0341, 0.0427).
While the concentrations of antibiotics observed in the Poudre River samples appear to be
below minimum inhibitory concentrations, previous work has indicated that sublethal
concentrations may aid in the dissemination of ARGs, via selection and other mechanisms.
Gullberg et al.61 found that bacteria carrying plasmids with beta-lactam resistance genes were
selected at concentrations of antibiotics and heavy metals nearly 140 times below reported
minimum inhibitory concentration. Other studies have indicated that sublethal antibiotics may
promote the dissemination of ARGs by stimulating horizontal gene transfer29,30.

66
Figure 4-4: Spearman’s Rank Correlation Coefficient between abundance of ARGs and
antibiotics or metals. Correlations in bed sediment (sed) and bulk water (wat) normalized to 16S
rRNA genes, as determined by qPCR, and antibiotics or heavy metals. Statistically significant
(p<0.05) correlations indicated in bold. Blue shading indicates negative correlation and red
shading indicates positive correlation. Antibiotics detected and included in the analysis were:
anhydrotetracycline (ATC), azithromycin (AZI), clarithromycin (CLA), chlorotetracycline (CTC),
doxycycline (DOX), erythromycin (ERY), 4-epitetracycline (ETC), oxytetracycline (OTC),
sulfadimethoxine (SDM), sulfamethoxazole (SMX), sulfamethazine (SMZ), sulfadiazine (SPD),
tetracycline (TC), and tylosin (TYL).

67
Potential for co-selective pressures exerted by heavy metals
All three mechanisms of co-selection described above also pertain to heavy metals. A
previous study demonstrated that input of tetracycline resistant bacteria to the Poudre River and
selection by tetracycline antibiotics was insufficient to explain the level of resistant bacteria
present in the river, and identified co-selection by heavy metals as a likely source of resistant
bacteria62. Therefore, the possibility of co-selection by heavy metals was investigated by
examining correlations between 14 heavy metals (Table S4) and ARGs quantified by qPCR. sul1
exhibited strong Spearman’s rank correlations with several heavy metals. In bulk water and bed
sediment, sul1 was positively correlated with silver (Spearman ρ=0.6435, 0.4671; p=0.0004,
0.0140) and negatively with both barium (ρ=-0.6315, -0.4804; p=0.0005, 0.0112) and copper (ρ=-
0.4806, -0.4229; p=0.0.130, 0.0280). Strontium was positively correlated with bulk water and
sediment sul2 (ρ=0.5890, 0.4347; p=0.0015, 0.0234) and bulk water tet(O), tet(W), and ermF
(ρ=0.4756, 0.4870, 0.4812; p=0.0141, 0.0116, 0.0128). Uranium also exhibited positive
correlations with sul2, tet(O), tet(W), and ermF in bulk water (ρ=0.5123, 0.5092, 0.4695, 0.4825;
p=0.0075, 0.0079, 0.0155, 0.0125). Such robust correlations indicate a potential for co-selection
by heavy metals, namely, by silver for sul1 and by strontium and uranium for sul2, tet(O), tet(W),
and ermF. The unique behavior of sul1 compared to the other genes may result from the tendency
for sul1 to be located on mobile genetic elements, such as class 1 integrons63–65. This characteristic
may enable sul1 to become associated with various other ARGs and MRGs, making sul1 a prime
candidate for co-selection. Copper has been previously identified as a metal that is likely to select
for certain ARGs14,66, therefore its strong negative correlation with sul1 was unexpected and may
be indicative that copper selects for ARGs through mechanisms highly specific to certain
conditions. Such negative correlations are not unprecedented, however, as a significant negative
correlation was also observed previously between copper and sulfonamide ARGs in livestock
lagoon water67. Though no significant positive correlations existed between copper and the five
ARGs quantified by qPCR, copper was correlated with total resistance genes derived from the
metagenomic data set for peptide (ρ=0.8, p=0.2), tetracycline (ρ=0.8, p=0.2), and sulfonamide
(ρ=0.6, p=0.4) classes, though trends were not significant.
Metagenomic scaffold associations reveals probable ARGs susceptible to co-resistance
Network analysis was conducted to explore de novo assembled scaffolds for ARGs and
MRGs physically co-located on DNA strands in order to identify genes that are likely candidates
for co-resistance as a mechanism of co-selection (Figure 4-5). Of a total of 52,556 scaffolds
generated from all samples, 2,707 (5.2%) scaffolds contained more than one ARG and 347 (0.7%)
scaffolds contained both ARGs and MRGs. Assembled scaffolds averaged 794 base pairs (bp) and
reached a maximum length of 215,852 bp, ranging from 66,797 to 131,397 scaffolds per sample
(Table S1). The most abundant ARG class associated with other ARGs revealed by the network
analysis corresponded to efflux pumps (26.2%), multidrug resistance (12.3%), and
macrolide/lincosamide/streptogramin (10.8%) resistance, while the most abundant co-located
MRGs corresponded to copper and arsenic. The most frequent associations observed between
genes were macB and bcrA (0.16% of scaffolds), otrC and bcrA (0.06%), PmrA and PmrB
(0.05%), and sav1866 and bcrA (0.04%) (Figure 4-5). The ARGs that were subject to qPCR
analysis, sul1, sul2, tet(O), tet(W), and ermF, were not found on any scaffolds with other ARGs

68
or MRGs, which may stem from their relatively low abundance in the pool of metagenomic reads,
which reduces likelihood of assembly (20% total reads were assembled).
Figure 4-5: Co-occurrence of ARGs, MRGs, and genetic markers linked to mobile genetic
elements on assembled scaffolds. Figure provides insight into which ARGs are candidates for
co-selection or horizontal gene transfer. Network analysis indicating genetic proximity of ARGs,
MRGs, plasmid sequences, and prophage sequences, based on co-occurrence of genes on scaffolds
constructed using de novo assembly of shotgun metagenomic sequencing reads. Proximity of
nodes and width of lines indicate frequency of associations between genes. Genetic markers with
20 or fewer instances of co-occurrence with other genes of interest were excluded from the network
analysis rendering.
Role of horizontal gene transfer in shaping the resistome
Metagenomic data were searched for two families of mobile genetic elements, plasmids
and prophages, as a proxy for potential for conjugation and transduction, respectively. Genes
belonging to 32 different known plasmids were identified, along with genes corresponding to 65
different prophage genomes. A total of 3,912 (7.4%) scaffolds contained both ARGs and plasmid
gene markers. Multiple ARGs were frequently found associated with plasmid markers on a single
scaffold, with up to 11 ARGs found together on a single plasmid-associated scaffold. Four hundred
and ninety-seven (0.9%) scaffolds contained one or more ARGs and prophage genetic markers.
Network analysis revealed that the ARGs most frequently found on plasmid scaffolds were macB
(16.4% of plasmid scaffolds), sav1866 (5.2%), mdtC (3.1%), otrC (2.9%), novA (2.5%), arnA
(1.9%), and mexS (1.8%), while genes associated with copper (7.4%) and arsenic (2.3%) were the
most common MRGs. macB (20.5% of prophage scaffolds), dfrE (12.7%), and arnA (5.2%), were
the ARGs most frequently found on prophage-associated scaffolds. The five ARGs examined by
qPCR were not identified on any scaffolds associated with plasmids or prophages.

69
Although horizontal gene transfer is known to be an important mechanism in the spread of
antibiotic resistance and provides an opportunity for pathogenic bacteria to acquire resistance from
environmental bacteria19, it has been reported that it is a relatively rare event among soil bacteria
and may be a relatively minor influence in shaping the resistome compared to phylogeny20,68.
However, it has also been noted that plasmids carrying ARGs are significantly more likely to be
conjugative than non-ARG carrying plasmids69 and broad host range plasmids were found to be
capable of uptake by a highly diverse portion of the microbiome in a soil bacterial community
study70. Although we could not precisely quantify the extent to which horizontal gene transfer
shaped the resistome based on the present study, the numerous associations of plasmids and
prophages with ARGs were striking, suggesting that it is a significant phenomenon in the riverine
environment.
Role of phylogeny in shaping the resistome
Based on jackknifed unweighted UniFrac distance, the microbial community composition
observed in the bulk water of each site was distinct from that of the bed sediment (ANOSIM,
R=0.868, p=0.001). Beta diversity plots, in which distance between samples is inversely
proportional to similarity in phylogenetic composition, revealed that a clear shift in microbial
community structure occurs along the anthropogenic gradient of the Poudre River. Sites clustered
distinctly from each other, in bulk water (Figure 4-3, ANOSIM, R=0.488, p=0.001) and more
strongly in sediment (ANOSIM, R=0.607, p=0.001), but did not exhibit a discernible pattern when
plotted based on sampling date for water (ANOSIM, R=0.159, p=0.033) or sediment (ANOSIM,
R=0.166, p=0.001). The strong grouping by sample site indicates that anthropogenic influence on
phylogeny is likely a more dominant controlling variable than seasonal variation, as well as for
ARGs, as documented in previous studies of the Poudre River7, or even variation observed as a
result of the flooding. This strong trend of microbial community variation along the anthropogenic
gradient of the Poudre River suggests that adjacent land use is a key driver of sediment and bulk
water microbial community. Another study also highlighted that watershed land use also plays a
role in shaping the sediment microbial community of the Tongue River in Montana, USA71. The
resilience of the microbial community in quickly rebounding to pre-flood conditions is consistent
with another study that observed that following a whole-ecosystem mixing disturbance of a
freshwater lake, the microbial community returned to pre-mixing composition and diversity in
only 11 days72. Site 1 community composition was highly distinct from site 5 (ANOSIM, R=0.929,
p=0.001) and WWTP effluent was dissimilar to all river sites (ANOSIM, R≥0.947, p=0.001). Site
based similarity was less pronounced using weighted UniFrac distance (ANOSIM, R=0.39,
p=0.001), which takes into account not only number of unique operational taxonomic units (OTUs)
present, as with unweighted UniFrac, but abundance of each OTU. This weaker correlation
indicates that rare species were particularly important in defining observed distinctions in
microbial community among sites. Proteobacteria, Bacteroidetes, and Cyanobacteria were the
most abundant phyla in the bulk water, with Actinobacteria, and Verrucomicrobia also
contributing to more than 1% of phyla, on average (Figure S4). Similarly, Proteobacteria,
Bacteroidetes, Cyanobacteria, and Verrucomicrobia were the most dominant phyla in the
sediment, with Acidobacteria, Actinobacteria, Plantomycetes, Chloroflexi, Firmicutes,
Nitrospirae, and Gemmatimonadetes all contributing to greater than 1% of phyla (Figure S5).
Interestingly, the overall bulk water phylogeny was not correlated with ARG profiles (2STAGE,
weighted UniFrac: Spearman’s ρ=-0.1) indicating that phylogeny alone may not be the most

70
important factor controlling the profile of ARGs. This finding conflicts with previous studies that
highlight host phylogeny as a key factor influencing antibiotic resistance in soil, sewage sludge,
or agricultural environments20,73,74.
CONCLUSIONS
This study uniquely characterized the impact of an extreme rainfall and flooding event on a riverine
resistome using next-generation DNA sequencing. Following the flood, total bulk water ARGs
decreased following the flood but recovered to near pre-flood abundances by ten months post-
flood at both the pristine and impacted sites. Bulk water phylogeny did not correlate with ARG
profiles, but sediment phylogeny varied according to the river’s anthropogenic gradient.
Quantitative monitoring of ARGs and two classes of selective agents, antibiotics and heavy metals,
was suggestive of selective pressure in the reestablishment of the resistome following the flood.
Additionally, we identified ARGs found on assembled metagenomic scaffolds associated with
other ARGs, MRGs, and mobile genetic element genes as likely candidates for co-selection or
horizontal gene transfer. The results of this study help elucidate the mechanisms contributing to
proliferation of ARGs in surface water and inform management strategies limiting anthropogenic
contributions of ARGs to the environment.
ACKNOWLEDGEMENTS
This work was supported by the National Science Foundation under RAPID Grant No. 1402651
and Graduate Research Fellowship Program Grant DGE0822220. Additional support was
provided by a Virginia Water Resources Research Center Student Grant and the Alfred P. Sloan
Foundation Microbiology of the Built Environment program. We acknowledge the NSF Major
Research Instrumentation Program CHE0959565 for the ICP-MS instrument. We would like to
thank Tyler Dell and Douglas Gossett for assistance collecting samples.
REFERENCES
1. National Weather Service, National Oceanic and Atmospheric Administration.
Exceedance Probability Analysis for the Colorado Flood Event. (2013).
2. CIRES Western Water Assessment at the University of Colorado, NOAA ESRL Physical
Science Division, and the CSU Colorado Climate Center. Severe Flooding on the
Colorado Front Range. (2013). http://wwa.colorado.edu/resources/front-range-
floods/assessment.pdf.
3. Yang, S. & Carlson, K. Evolution of antibiotic occurrence in a river through pristine,
urban and agricultural landscapes. Water Res 37: 4645–4656. (2003).
4. Storteboom, H., Arabi, M., Davis, J.G., Crimi, B. & Pruden, A. Tracking antibiotic
resistance genes in the South Platte River basin using molecular signatures of urban,
agricultural, and pristine sources. Environ Sci Technol 44: 7397–7404. (2010).
5. Pruden, A., Pei, R.T., Storteboom, H. & Carlson, K.H. Antibiotic resistance genes as
emerging contaminants: Studies in northern Colorado. Environ Sci Technol 40: 7445–
7450. (2006).
6. Pei, R.T., Kim, S.C., Carlson, K.H. & Pruden, A. Effect of River Landscape on the
sediment concentrations of antibiotics and corresponding antibiotic resistance genes

71
(ARG). Water Res 40: 2427–2435. (2006).
7. Pruden, A., Arabi, M. & Storteboom, H.N. Correlation Between Upstream Human
Activities and Riverine Antibiotic Resistance Genes. Environ Sci Technol 46: 11541–
11549. (2012).
8. Perron, G.G., et al. Functional Characterization of Bacteria Isolated from Ancient Arctic
Soil Exposes Diverse Resistance Mechanisms to Modern Antibiotics. PLoS One 10:
e0069533. (2015).
9. D’Costa, V.M., et al. Antibiotic resistance is ancient. Nature 477: 457–461. (2011).
10. Mindlin, S.Z., Soina, V.S., Petrova, M.A. & Gorlenko, Z.M. Isolation of antibiotic
resistance bacterial strains from Eastern Siberia permafrost sediments. Russ J Genet 44:
27–34. (2008).
11. Bhullar, K., et al. Antibiotic resistance is prevalent in an isolated cave microbiome. PLoS
One 7: e34953. (2012).
12. Allen, H.K., Moe, L.A., Rodbumrer, J., Gaarder, A. & Handelsman, J. Functional
metagenomics reveals diverse beta-lactamases in a remote Alaskan soil. ISME J 3: 243–
251. (2009).
13. Zhu, Y.G., et al. Diverse and abundant antibiotic resistance genes in Chinese swine
farms. Proc Natl Acad Sci USA 110: 3435–3440. (2013).
14. Knapp, C.W., et al. Antibiotic Resistance Gene Abundances Correlate with Metal and
Geochemical Conditions in Archived Scottish Soils. PLoS One 6: e27300. (2011).
15. Udikovic-kolic, N., Wichmann, F., Broderick, N.A. & Handelsman, J. Bloom of resident
antibiotic-resistant bacteria in soil following manure fertilization. Proc Natl Acad Sci
USA 111: 15202–15207. (2014).
16. Allen, H.K., et al. Call of the wild: antibiotic resistance genes in natural environments.
Nat Rev Microbiol 8: 251–259. (2010).
17. McArthur, J.V., Fletcher, D.E., Tuckfield, R.C. & Baker-Austin, C. Patterns of Multi-
Antibiotic-Resistant Escherichia Coli from Streams with No History of Antimicrobial
Inputs. Microb Ecol. e-pub ahead of print, doi: 10.1007/s00248-015-0678-4. (2015).
18. Benveniste, R. & Davies, J. Aminoglycoside antibiotic-inactivating enzymes in
actinomycetes similar to those present in clinical isolates of antibiotic-resistant bacteria.
Proc Natl Acad Sci USA 70: 2276–2280. (1973).
19. Forsberg, K.J., et al. The Shared Antibiotic Resistome of Soil Bacteria and Human
Pathogens. Science 337: 1107–1111. (2012).
20. Forsberg, K.J., et al. Bacterial phylogeny structures soil resistomes across habitats.
Nature 509: 612–616. (2014).
21. Sekizuka, T., et al. Complete sequencing of the blaNDM-1-positive IncA/C plasmid from
Escherichia coli ST38 isolate suggests a possible origin from plant pathogens. PLoS One
6: e25334. (2011).
22. Graham, D.W., et al. Antibiotic Resistance Gene Abundances Associated with Waste
Discharges to the Almendares River near Havana, Cuba. Environ Sci Technol 45: 418–
424. (2011).
23. Amos, G.C., Hawkey, P.M., Gaze, W.H. & Wellington, E.M. Waste water effluent
contributes to the dissemination of CTX-M-15 in the natural environment. J Antimicrob
Chemother 69: 1785–1791. (2014).
24. Czekalski, N., Gascón Díez, E. & Bürgmann, H. Wastewater as a point source of
antibiotic-resistance genes in the sediment of a freshwater lake. ISME J 8:1381–1390.

72
(2014).
25. Amos, G.C., et al. Validated predictive modelling of the environmental resistome. ISME
J 9: 1467–1476. (2015).
26. Lupo, A., Coyne, S. & Berendonk, T.U. Origin and evolution of antibiotic resistance: the
common mechanisms of emergence and spread in water bodies. Front Microbiol 3: 1-13.
(2012).
27. Kristiansson, E., et al. Pyrosequencing of Antibiotic-Contaminated River Sediments
Reveals High Levels of Resistance and Gene Transfer Elements. PLoS One 6: e17038.
(2011).
28. Andersson, D,I. & Hughes, D. Microbiological effects of sublethal levels of antibiotics.
Nat Rev Microbiol 12: 465–478. (2014).
29. Zhang, P.Y., et al. Combined treatment with the antibiotics kanamycin and streptomycin
promotes the conjugation of Escherichia coli. Fems Microbiol Lett 348: 149–156. (2013).
30. Prudhomme, M., Attaiech, L., Sanchez, G., Martin, B. & Claverys, J.P. Antibiotic stress
induces genetic transformability in the human pathogen Streptococcus pneumoniae.
Science 313: 89–92. (2006).
31. Beaber, J.W., Hochhut, B. & Waldor, M.K. SOS response promotes horizontal
dissemination of antibiotic resistance genes. Nature 427: 72–74. (2004).
32. Xia, Z.J., et al. Improving conjugation efficacy of Sorangium cellulosum by the addition
of dual selection antibiotics. J Ind Microbiol Biotechnol 35: 1157–1163. (2008).
33. Stepanauskas, R., et al. Coselection for microbial resistance to metals and antibiotics in
freshwater microcosms. Environ Microbiol 8: 1510–1514. (2006).
34. Baker-Austin, C., Wright, M.S., Stepanauskas, R. & McArthur, J.V. Co-selection of
antibiotic and metal resistance. Trends Microbiol 14: 176–182. (2006).
35. Gullberg, E., et al. Selection of resistant bacteria at very low antibiotic concentrations.
PLoS Pathog 7: e1002158. (2011).
36. Seiler, C. & Berendonk, T.U. Heavy metal driven co-selection of antibiotic resistance in
soil and water bodies impacted by agriculture and aquaculture. Front Microbiol 3: 1–10.
(2012).
37. Trapp, R.J., et al. Changes in severe thunderstorm environment frequency during the 21st
century caused by anthropogenically enhanced global radiative forcing. Proc Natl Acad
Sci USA 104: 19719–19723. (2007).
38. Tso, J., Dutta, S., Inamdar, S. & Aga, D.S. Simultaneous analysis of free and conjugated
estrogens, sulfonamides, and tetracyclines in runoff water and soils using solid-phase
extraction and liquid chromatography-tandem mass spectrometry. J Agric Food Chem
59:2213–2222. (2011).
39. Suzuki, M.T., Taylor, L.T. & DeLong, E.F. Quantitative analysis of small-subunit rRNA
genes in mixed microbial populations via 5 ’-nuclease assays. Appl Environ Microbiol
66: 4605–4614. (2000).
40. Aminov, R.I., Garrigues-Jeanjean, N. & Mackie, R.I. Molecular ecology of tetracycline
resistance: Development and validation of primers for detection of tetracycline resistance
genes encoding ribosomal protection proteins. Appl Environ Microbiol 67: 22–32.
(2001).
41. Chen, J., Yu, Z.T., Michel, F.C., Wittum, T. & Morrison, M. Development and
application of real-time PCR assays for quantification of erm genes conferring resistance
to macrolides-lincosamides-streptogramin B in livestock manure and manure

73
management systems. Appl Environ Microbiol 73: 4407–4416. (2007).
42. Wallace, J.S. & Aga, D.S. Enhancing Extraction and Detection of Veterinary Antibiotics
in Solid and Liquid Fractions of Manure. J Environ Qual 45: 471-479. (2016).
43. Caporaso, J.G., et al. Global patterns of 16S rRNA diversity at a depth of millions of
sequences per sample. Proc Natl Acad Sci USA 108: 4516–4522. (2011).
44. Caporaso, J.G., et al. Ultra-high-throughput microbial community analysis on the
Illumina HiSeq and MiSeq platforms. ISME J 6: 1621–1624. (2012).
45. Caporaso, J.G., et al. QIIME allows analysis of high-throughput community sequencing
data. Nat Methods 7: 335–336. (2010).
46. DeSantis, T.Z., et al. Greengenes, a chimera-checked 16S rRNA gene database and
workbench compatible with ARB. Appl Environ Microbiol 72: 5069–5072. (2006).
47. Magoč, T. & Salzberg, S.L. FLASH: fast length adjustment of short reads to improve
genome assemblies. Bioinformatics 27: 2957–2963. (2011).
48. Bolger, A.M., Lohse, M., & Usadel, B. Trimmomatic: a flexible trimmer for Illumina
sequence data. Bioinformatics 30: 2114–2120. (2014).
49. Li, B., et al. Metagenomic and network analysis reveal wide distribution and co-
occurrence of environmental antibiotic resistance genes. ISME J 1–13. (2015).
50. Altschul, S., et al. Gapped BLAST and PSI- BLAST: a new generation of protein
database search programs. Nucleic acids Res 25: 3389–3402. (1997).
51. Quast, C., et al. The SILVA ribosomal RNA gene database project: improved data
processing and web-based tools. Nucleic Acids Res 41: D590–D596. (2013).
52. McArthur, A.G., et al. The comprehensive antibiotic resistance database. Antimicrob
Agents Chemother 57: 3348–3357. (2013).
53. Pal, C., Bengtsson-Palme, J., Rensing, C., Kristiansson, E. & Larsson, D.G.J. BacMet:
antibacterial biocide and metal resistance genes database. Nucleic Acids Res 42: D737–
D743. (2014).
54. Leplae, R., Lima-Mendez, G. & Toussaint, A. ACLAME: a CLAssification of Mobile
genetic Elements, update 2010. Nucleic Acids Res 38: D57–D61. (2010).
55. Buchfink, B., Xie, C. & Huson, D.H. Fast and sensitive protein alignment using
DIAMOND. Nat Methods 12: 59–60. (2014).
56. Peng, Y., Leung, H.C.M., Yiu, S.M. & Chin, F.Y.L. IDBA-UD: a de novo assembler for
single-cell and metagenomic sequencing data with highly uneven depth. Bioinformatics
28: 1420–1428. (2012).
57. Meyer, F., et al. The metagenomics RAST server - a public resource for the automatic
phylogenetic and functional analysis of metagenomes. BMC Bioinformatics 9. (2008).
58. Gu, C. & Karthikeyan, K.G. Sorption of the antimicrobial ciprofloxacin to aluminum and
iron hydrous oxides. Environ. Sci. Technol. 39: 9166–9173. (2005).
59. Gu, C. & Karthikeyan, K.G. Sorption of the antibiotic tetracycline to humic mineral
complexes. J. Environ. Qual. 37: 704–711. (2008).
60. Lunestad, B.T. & Goksøyr, J. Reduction in the antibacterial effect of oxytetracycline in
sea water by complex formation with magnesium and calcium. Dis. Aquat. Organ. 9: 67–
72. (1990).
61. Gullberg, E., Albrecht, L.M., Karlsson, C., Sandegren, L. & Andersson, D.I. Selection of
a Multidrug Resistance Plasmid by Sublethal Levels of Antibiotics and Heavy Metals.
MBio 5: 19–23. (2014).
62. Hellweger, F.L. Simple Model of Tetracycline Antibiotic Resistance in Aquatic

74
Environment : Accounting for Metal Coselection. J Environ Eng 139: 913–921. (2013).
63. Gillings, M.R., et al. Using the class 1 integron-integrase gene as a proxy for
anthropogenic pollution. ISME J 1–11. (2014).
64. Engelstädter, J., Harms, K. & Johnsen, P.J. The evolutionary dynamics of integrons in
changing environments. ISME J 1–12. (2016).
65. Gaze, W.H., et al. Impacts of anthropogenic activity on the ecology of class 1 integrons
and integron-associated genes in the environment. ISME J 5: 1253–1261. (2011).
66. Berg, J., et al. Cu exposure under field conditions coselects for antibiotic resistance as
determined by a novel cultivation-independent bacterial community tolerance assay.
Environ Sci Technol 44: 8724–8728. (2010).
67. McKinney, C.W., Loftin, K.A., Meyer, M.T., Davis, J.G. & Pruden, A. tet and sul
Antibiotic Resistance Genes in Livestock Lagoons of Various Operation Type,
Configuration, and Antibiotic Occurrence. Environ Sci Technol 44: 6102–6109. (2010).
68. Gibson, M.K., Forsberg, K.J. & Dantas, G. Improved annotation of antibiotic resistance
determinants reveals microbial resistomes cluster by ecology. ISME J 1–10. (2014).
69. Pal, C., Bengtsson-palme, J., Kristiansson, E. & Larsson, D.G.J. Co-occurrence of
resistance genes to antibiotics, biocides and metals reveals novel insights into their co-
selection potential. BMC Genomics 16. (2015).
70. Klümper, U., et al. Broad host range plasmids can invade an unexpectedly diverse
fraction of a soil bacterial community. ISME J 9: 934–945. (2014).
71. Gibbons, S.M., et al. Human and Environmental Impacts on River Sediment Microbial
Communities. PLoS One 9: e97435. (2014).
72. Shade, A., et al. Lake microbial communities are resilient after a whole-ecosystem
disturbance. ISME J 6: 2153–2167. (2012).
73. Durso, L.M., Miller, D.N. & Wienhold, B.J. Distribution and Quantification of Antibiotic
Resistant Genes and Bacteria across Agricultural and Non-Agricultural Metagenomes.
PLoS One 7: 1–12. (2012).
74. Ju, F., et al. Antibiotic Resistance Genes and Human Bacterial Pathogens: Co-
occurrence, Removal, and Enrichment in Municipal Sewage Sludge Digesters. Water Res
91: 1–10. (2015)

75
SUPPLEMENTARY INFORMATION FOR CHAPTER 4
Figure S1: Relative abundance of ARGs as determined by metagenomic analysis of site 1 and site
5 Poudre River bulk water samples. (A) Mechanisms of antibiotic resistance and (B) classes of
ARGs determined by metagenomic analysis and annotation against the Comprehensive Antibiotic
Resistance Database.
Figure S2: Relative abundance (ARG copies / 16S rRNA gene copies) of ARGs as determined by
metagenomic analysis of site 1 and site 5 Poudre River bulk water samples

76
Figure S3: Quantification of select ARGs by quantitative polymerase chain reaction (qPCR) in
Poudre River sediment (bars) and bulk water (points), normalized to 16S rRNA genes at 12 months
(-12) before the flooding occurred and at five time points following the flooding. X-axis indicates
sites and months relative to the flooding event. (*) indicates gene detected below quantification
limit in sediment and (+) in water. Error bars represent standard deviation of triplicate qPCR
measurements in water and standard deviation of triplicate samples in sediment.

77
Figure S4: Phyla accounting for greater than 1% of the total OTUs in bulk water, determined by
16S rRNA gene sequencing.

78
Figure S5: Phyla accounting for greater than 1% of the total OTUs in bulk water, determined by
16S rRNA gene sequencing. Triplicate sediment samples were sequenced separately and results
averaged.
Figure S6: Spearman’s Rank Correlation Coefficient between abundance of ARGs normalized to
16S rRNA genes, as determined by qPCR, and water quality paramters. Statistically significant
(p<0.05) correlations are indicated in bold.

79
Figure S7: Rarefaction curves for metagenomic samples.
Figure S8: ARG copies determined by qPCR in WWTP effluent, normalized to 16S rRNA gene
copies.

80
Table S1: Characteristics of metagenomic data. All sequences have been deposited in MG-RAST
under project name “Fate and Transport of Antibiotics and Antibiotic Resistance Genes during
Historic Colorado Flood.”
Sample Name MG-RAST ID
(unassembled)
# Reads
(unassembled)
#
scaffolds
Average
scaffold
length
(bp)
Maximum
scaffold
length
(bp)
Poudre_WSite1_Sept2012 4628878.3 1,397,640 131,397 1005 137,041
Poudre_WSite1_Dec2013 4628876.3 1,182,555 81,537 644 35,373
Poudre_WSite1_July2014 4628877.3 1,460,502 66,797 794 78,321
Poudre_WSite5_Sept2012 4628881.3 1,320,893 86,492 625 153,801
Poudre_WSite5_Dec2013 4628879.3 2,232,495 96,292 751 91,128
Poudre_WSite5_July2014 4628880.3 1,860,238 97,413 829 215,852

81
Table S2: Antibiotic concentrations in Poudre River bulk water (ng/L). Standard deviation of replicate samples denoted in parentheses
and months indicate months post-flood. “W” denotes Wastewater Treatment Plant samples. Antibiotics abbreviations are denoted as
follows: anhydrotetracycline (ATC), azithromycin (AZI), clarithromycin (CLA), chlorotetracycline (CTC), doxycycline (DOX),
erythromycin (ERY), 4-epitetracycline (ETC), oxytetracycline (OTC), sulfamerazine (SMR), sulfamethoxazole (SMX), sulfamethazine
(SMZ), sulfadiazine (SPD), tetracycline (TC), and tylosin (TYL). Sulfameter, sulfamethiazole, sulfamerazine, sulfachloropyridazine,
sulfathiazole, roxithromycin, spiramycin, 4-epichlorotetracycline, anhydrochlorotetracycline, demeclocycline (surrogate), minocycline
(internal standard), phenyl-13C6-sulfamethazine (13C6-SMZ), d4-sulfamethoxazole (d4-SMX), N-methyl 13C-erythromycin, and d10-
carbamazepine (internal standard) were not detected in any samples. Site ATC AZI CLA CTC DOX ERY ETC OTC SMR SMX SMZ SPD TC TYL
3 m
on
ths
1 ND ND ND ND ND 6.7(1.5) ND ND ND 1.1(0.0) ND ND ND ND
2 2.1(0.1) ND ND 3.6(2.0) ND 3.3(0.9) ND ND ND 17(0.3) 0.7(0.0) ND 4.6(1.2) ND
3 5.7(0.0) ND ND 6.7(0.0) ND 7.7(0.0) ND ND 0.9(0.0) 29 (0.0) 0.5(0.0) ND ND ND
4 ND 3.7(0.1) 3.2(1.3) ND ND 11.(3.8) ND ND ND 154(9.5) 3.5(0.2) ND 6.4(1.0) ND
5 ND 15.(0.6) 11.(4.0) ND ND 16.(0.7) ND ND ND 223(21.) 9.1(1.0) ND ND ND
6 m
on
ths
1 ND ND ND ND ND 1.8(0.0) ND ND ND 0.6(0.1) 0.2(0.0) ND ND ND
2 2.6(0.7) ND ND ND ND 1.6(0.0) 3.2(0.2) ND ND 0.5(0.0) 0.4(0.0) ND 59.(2.0) ND
3 ND 1.9(0.2) 1.6(0.1) ND ND 3.0(0.2) ND ND ND 21 (4.9) ND ND ND ND
4 ND 2.5(0.3) 2.8(1.1) ND ND 10.(4.2) ND ND ND 93(10) ND 5.8(0.9) ND ND
5 ND 9.3(2.4) 15.(1.0) ND ND 20.(0.0) ND ND ND 55.(1.0) 2.0(0.5) 1.8(0.1) ND ND
8 m
on
ths
1 ND ND ND ND ND 1.5(0.1) ND ND ND ND ND ND ND ND
2 ND ND ND ND ND 1.5(0.0) ND 6.6(0.8) ND ND ND ND ND ND
3 ND ND ND ND ND 1.6(0.0) ND 5.1(0.2) ND 19.(1.6) ND ND ND ND
4 ND ND 0.6(0.0) ND ND 3.5(0.1) ND ND ND 127(6.3) ND 6.5(0.4) ND ND
5 ND ND 1.0(0.0) ND ND 5.0(0.2) ND ND ND 113(7.9) 2.4(0.1) 1.7(0.2) ND ND
W ND 510(55) 18.(1.1) ND 72(6.5) 5.1(0.4) ND ND ND 68.(3.8) ND ND ND 2.1(0.0)
10
mon
ths 1 ND ND ND ND ND 2.3(0.1) ND ND ND ND ND ND ND ND
3 ND ND 1.0(0.0) ND ND 3.6(0.3) ND ND ND 20.(0.2) ND ND ND ND
4 ND ND 0.6(0.1) ND ND 9.8(0.2) ND ND ND 44.(0.1) ND ND ND ND
5 ND ND 1.9(0.0) ND ND 12.(0.0) ND ND ND 36.(2.9) 1.1(0.0) ND ND ND
W ND 651(4.8) 67.(1.7) ND ND 58.(0.4) ND ND ND 770(41.) ND ND 9.0(1.5) 6.0(0.3)
18
mo
nth
s
1 ND ND ND ND ND 1.7(0.1) ND ND ND ND ND ND ND ND
2 ND ND ND ND ND 2.8(0.0) ND ND ND 0.7(0.2) ND ND ND ND
3 ND 16.(0.5) 3.5(0.6) ND ND 4.1(0.1) ND ND ND 12.(0.2) ND ND ND ND
4 ND 17.(0.2) 12.(0.1) ND ND 18.(1.0) ND ND ND 231(1.7) 1.1(0.0) 3.5(0.6) ND ND
5 ND 60.(2.2) 52.(0.2) ND ND 53.(1.1) ND ND ND 58.(3.5) 2.1(0.1) 3.5(0.1) ND 4.3(0.6)
W 4.4(0.2) 250(100) 620(20) ND ND 41.(1.7) ND 18.(0.2) ND 137(0.3) ND 2.2(0.2) 59.(3.2) 7.9(0.1)

82
Table S3: p-values for Kruskal-Wallis rank sum tests for correlations between ARGs and
antibiotics of metals. Significant (p<0.05) values indicated in bold.
sul1 sul2 tet(O) tet(W) ermF
sed wat sed wat sed wat sed Wat sed wat
Ag 0.014 0.0004 0.6488 0.2661 0.7732 0.7897 0.2197 0.4207 0.2595 0.2864
As 0.6341 0.5165 0.9109 0.0875 0.9925 0.0004 0.156 0.0775 0.8686 0.0428
ATC 0.1385 0.8748 0.3638 0.8283 0.5209 0.0187 0.1604 0.0787 0.8122 0.7852
AZI 0.0028 0.6716 0.084 0.0996 0.0021 0.0328 0.0194 0.048 0.0407 0.1402
Ba 0.0112 0.0005 0.5486 0.3738 0.6882 0.0048 0.0608 0.1501 0.9313 0.1457
Ce 0.3905 0.5377 0.4453 0.0968 0.0681 0.473 0.1171 0.3863 0.5664 0.9147
CLA 0.0155 0.588 0.1651 0.0297 0.0079 0.0037 0.0555 0.0078 0.064 0.0234
Cr 0.6204 0.9468 0.4608 0.4307 0.755 0.5655 0.6454 0.8458 0.3712 0.8841
CTC 0.4515 0.7914 0.6364 0.7108 0.8723 0.0898 0.2462 0.558 0.7566 0.3645
Cu 0.028 0.013 0.7977 0.4164 0.2552 0.2459 0.4342 0.7183 0.1263 0.8276
DOX 0.1705 0.1176 0.113 0.1173 0.0574 0.1578 0.0813 0.1444 0.0853 0.1305
ERY 0.0229 0.5509 0.7548 0.0437 0.0022 0.0005 0.0049 0.0088 0.1496 0.0175
ETC 0.9601 0.1176 0.6514 0.5595 0.9109 0.3604 0.7836 0.4882 0.4126 0.3099
Gd 0.316 0.4792 0.2073 0.1049 0.342 0.4617 0.1058 0.5577 0.4561 0.8529
Mn 0.3192 0.8286 0.3449 0.6604 0.1302 0.5455 0.2354 0.5222 0.7028 0.9192
OTC 0.1641 0.0787 0.5761 0.5217 0.4081 0.9698 0.1389 0.9953 0.2185 0.5687
Pb 0.5159 0.8011 0.1292 0.7052 0.805 0.8663 0.6834 0.8715 0.371 0.5374
Pt 0.7491 0.2577 0.3006 0.2252 0.7462 0.7887 0.4012 0.8433 0.0203 0.7661
SDM 0.1138 0.6336 0.7255 0.425 0.9109 0.9574 0.7836 0.9577 0.4126 0.9577
SMX 0.0028 0.6148 0.1742 0.023 0.0097 0.0046 0.0227 0.0095 0.0307 0.0008
SMZ 0.11 0.5533 0.8296 0.4429 0.4746 0.0081 0.9784 0.0424 0.6661 0.0557
SPD 0.0065 0.2857 0.3429 0.1065 0.3866 0.4074 0.6908 0.102 0.8154 0.1641
Sr 0.1884 0.905 0.0234 0.0015 0.4179 0.0141 0.6493 0.0116 0.1652 0.0128
TC 0.5532 0.7814 0.5392 0.2495 0.1464 0.0006 0.3646 0.0072 0.4571 0.1517
Th 0.0878 0.0038 0.8713 0.5892 0.7505 0.4899 0.3679 0.8272 0.082 0.1872
TYL 0.0884 0.6962 0.0207 0.185 0.0054 0.3075 0.0017 0.1436 0.0044 0.7039
U 0.4071 0.9181 0.0858 0.0075 0.8281 0.0079 0.2449 0.0155 0.3516 0.0125

83
Table S4: Metal concentrations in Poudre River bulk water (µg/L). Standard deviation of replicate samples denoted in parentheses.
Site Ag As Ba Cd Ce Cr Cu Gd Mn Pt Pb Sr Th U
3 m
on
ths
1 ND 0.6(0.0) 41.(0.4) ND 0.7(0.0) ND 0.5(0.0) ND 22.(0.2) ND ND 89.(0.6) ND 1.6(0.0)
2 ND 0.7(0.0) 46.(0.9) ND 1.0(0.0) 0.3(0.1) 0.6(0.1) ND 39.(0.2) ND 0.3(0.0) 136(0.7) ND 1.9(0.0)
3 ND 0.8(0.2) 47.(0.9) ND 1.1(0.0) 0.4(0.0) 0.9(0.0) ND 47.(0.4) ND 0.3(0.0) 224(2) ND 2.1(0.0)
4 ND 1.1(0.2) 44.(0.6) ND 0.7(0.0) ND 0.7(0.0) ND 42.(0.0) ND ND 395(0.6) ND 3.2(0.0)
5 ND 2.3(0.2) 42(1) ND ND ND 0.8(0.0) ND ND ND ND 730(14) ND 6.3(0.3)
6 m
on
ths
1 ND 0.5(0.0) 39.(0.5) ND ND ND 0.4(0.0) ND 15.(0.0) ND ND 94.(0.8) ND 1.6(0.0)
2 ND 0.4(0.0) 61(1) ND 4.3(0.0) 2.3(0.0) 2.0(0.0) 0.3(0.0) 100(0.6) ND 1.6(0.0) 116(0.6) ND 1.6(0.0)
3 ND 1(0.1) 50.(0.7) ND 0.3(0.0) ND 1.1(0.0) ND 53.(0.5) ND ND 626(8) ND 3.9(0.1)
4 ND 2(0.3) 51.(0.8) ND ND ND 0.9(0.0) ND 67.(0.6) ND ND 123(3) ND 8.1(0.0)
5 ND 4.1(0.7) 57(1) ND 0.6(0.0) ND 1.8(0.0) ND 176(0.4) ND 0.3(0.0) 147(6) ND 18.(0.2)
8 m
on
ths
1 ND ND 43(2) ND 5.4(0.3) 2.5(0.0) 2.0(0.0) 0.3(0.0) 76.(0.3) ND 1.7(0.0) 44(0.4) ND 0.7(0.0)
2 ND ND 35.(0.4) ND 3.0(0.0) 1.3(0.0) 1.4(0.0) ND 46(0.4) ND 0.8(0.0) 55.(0.3) ND 0.7(0.0)
3 ND ND 28(1) ND 2.6(0.1) 1.1(0.0) 1.1(0.0) ND 42.(0.1) ND 0.9(0.0) 48.(0.1) ND 0.3(0.0)
4 ND ND 42(2) ND 1.1(0.0) 0.4(0.0) 0.5(0.0) ND 38.(0.9) ND 0.4(0.0) 235(0.5) ND 1.8(0.1)
5 ND ND 45(1) ND 2.2(0.1) 0.6(0.0) 0.8(0.0) ND 149(0.3) ND 0.9(0.0) 410(20) ND 6(0.3)
W ND ND 30.(0.9) ND ND ND 1.6(0.0) ND 19.(0.1) ND ND 318(0.5) ND 1.1(0.0)
10
mon
ths
1 ND ND 51(2) ND ND ND 3.6(0.0) ND 5.9(0.1) ND ND 33.(0.4) ND 0.3(0.0)
3 ND ND 49(1) ND ND ND 3.2(0.0) ND 19.(0.1) ND ND 292(3) ND 1.2(0.0)
4 ND 1.9(0.1) 54(0.5) ND ND ND 2.7(0.0) ND 11.(0.0) ND ND 723(2) ND 4.3(0.1)
5 ND 3.7(0.2) 70(2) ND ND ND 2.3(0.0) ND 57.(0.8) ND ND 105(10) ND 12.(0.6)
W ND 0.6(0.2) 57(2) ND ND ND 5.2(0.1) ND 12.(0.0) ND ND 846(3) ND 3.5(0.1)
18
mon
ths
1 0.7(0.1) 0.2(0.0) 31.(0.8) ND ND ND 1.2(0.0) ND 7(0.1) 0.5(0.1) ND 84(3) 0.7(0.0) 0.6(0.0)
2 0.7(0.1) 0.3(0.0) 34(1) ND ND ND 0.7(0.0) ND 14.(0.5) ND ND 150(30) 0.3(0.0) 0.6(0.0)
3 0.5(0.0) 0.3(0.1) 32.(0.5) ND ND ND 0.6(0.1) ND 26(0.5) ND ND 350(50) ND 2.2(0.2)
4 0.8(0.1) 0.6(0.0) 44(1) ND ND ND 0.7(0.0) ND 66(5) ND ND 160(300) 0.2(0.0) 7.7(0.0)
5 0.5(0.0) 0.7(0.9) 38.(0.2) ND ND ND 1.4(0.0) ND 64(2) ND ND 120(300) ND 14.(0.0)
W 0.5(0.0) 0.2(0.0) 33.(0.1) ND ND 0.3(0.0) 1.9(0.0) ND 30(1) ND 0.3(0.0) 388(30) ND 2.4(0.0)

84
CHAPTER 5 : METAGENOMIC CHARACTERIZATION OF ANTIBIOTIC
RESISTANCE GENES IN FULL-SCALE RECLAIMED WATER DISTRIBUTION
SYSTEMS AND CORRESPONDING POTABLE SYSTEMS
Emily Garner, Chaoqi Chen, Kang Xia, Jolene Bowers, David M. Engelthaler, Jean McLain,
Marc A. Edwards, Amy Pruden
ABSTRACT
Water reclamation provides a valuable resource for meeting non-potable water demands.
However, little is known about the potential for wastewater reuse to disseminate antibiotic
resistance genes (ARGs). Here, samples were collected seasonally in 2014-2015 from four U.S.
utilities’ reclaimed and potable water distribution systems before treatment, after treatment, and
at five points of use (POU). Shotgun metagenomic sequencing was used to profile the resistome
(i.e., full contingent of ARGs) of a subset (n=38) of samples. Four ARGs (qnrA, blaTEM, vanA,
sul1) were quantified by quantitative polymerase chain reaction. Bacterial community
composition (via 16S rRNA gene amplicon sequencing), horizontal gene transfer (via
quantification of intI1 integrase and plasmid genes), and selection pressure (via detection of
metals and antibiotics) were investigated as potential factors governing the presence of ARGs.
Certain ARGs were elevated in all (sul1; p≤0.0011) or some (blaTEM, qnrA; p≤0.0145) reclaimed
POU samples compared to corresponding potable samples. Bacterial community composition
was weakly correlated with ARGs (Adonis, R2=0.1424-0.1734) and associations were noted
between 193 ARGs and plasmid-associated genes. This study establishes that reclaimed water
conveys greater abundances of certain ARGs than potable waters and provides observations
regarding factors that likely control ARG occurrence in reclaimed water systems.
INTRODUCTION
Reclamation and reuse of municipal wastewater effluent is increasingly relied on to offset
demand on traditional potable water sources. Water reuse can help address challenges such as
water shortages, groundwater depletion, surface water contamination, increasing demand due to
population growth, and exacerbated water stress due to climate change.1 However, even as its
application expands worldwide, there are technical challenges and public health concerns that must
be assessed, such as trace contaminants, including antibiotics and personal care products,1 and
microbial constituents, such as viruses2,3 and antibiotic resistance elements.4
The potential of water reuse to contribute to the spread of antibiotic resistance has drawn
attention.4,5 Antibiotic resistance is a critical public health challenge, with over two million
antibiotic resistant bacterial infections documented in the U.S. each year6 and even more globally.7
Strategies to mitigate the spread of antibiotic resistance have primarily focused on optimizing
clinical use, limiting application in agriculture, and improving hygiene in hospitals.7–10 While such
efforts are vital, they are limited in effectiveness due to difficulty of implementation and because
they do not take into consideration broader sources and routes of resistance dissemination
associated with natural and built environments.8 Correspondingly, there is now growing movement
towards identifying comprehensive mitigation strategies to prevent the evolution and spread of
antibiotic resistance as an environmental “contaminant”.8,11,12 In this context, water reuse and the

85
water cycle in general have the potential to contribute to the proliferation of antibiotic resistant
bacteria (ARB) and antibiotic resistance genes (ARGs). Numerous studies have now documented
the abundance of ARB and ARGs in wastewater, which like many microorganisms, are not always
removed completely by traditional wastewater treatment.13–18 Previous studies have indicated that
a diverse range of ARB and ARGs are present in reclaimed (i.e., non-potable) water,19–21 but, given
that antibiotic resistance is a natural phenomenon occurring in many aquatic and soil bacteria, it is
important to move towards advancing understanding of which ARB and ARGs actually pose risk
to human health. For example, samples collected from ancient permafrost and unexplored caves
contain a surprisingly diverse array of ARGs.22–24 To address the presence of ARGs in even pristine
environments, benchmarking the presence of ARGs in water reuse treatment and distribution
systems to that of corresponding potable water systems can help provide a frame of reference for
assessing potential risks associated with water reuse compared to water derived from surface and
groundwater. Discriminating amongst various classes of ARGs and their location in the genome
is also important, with ARGs that encode resistance to clinically-important antibiotics and that are
capable of disseminating resistance via horizontal gene transfer being of greatest concern.25,26
Municipal sewage represents a composite reservoir of excreted bacteria and associated
DNA, where its collection and treatment will likely select for certain strains and, in some cases,
could create conditions ideal for horizontal transfer of clinically-important ARGs.27,28 Wastewater
treatment plants (WWTP) have been proposed as potential “hot spots” for ARB proliferation.15
Correspondingly, poor efficiency of ARB and ARG removal has been noted with some
conventional WWTPs.5,15,29 In particular, antibiotics, and other potential selective agents; such as
heavy metals, herbicides, and disinfectants, have been associated with the loading of ARGs in
water and soil environments30–33 and their presence in wastewater is expected to play a similar
role. Further, shotgun metagenomic approaches and tracking of plasmids and other gene transfer
elements have revealed evidence of high rates of horizontal transfer of ARGs among densely
populated activated sludge bacteria core to the WWTP biological treatment process.34–37
While considerable research has been devoted to understanding these phenomena in
WWTPs and receiving environments, few studies have explored the potential for dissemination of
ARB and ARGs via subsequent water reuse. While some studies have examined the implications
of irrigation38–40 or groundwater recharge41,42 with reclaimed water for ARG dissemination, only
recently has the potential for bacterial regrowth of ARG-carrying bacteria during reclaimed water
distribution been reported in the peer-reviewed literature.19 Given that indicator organisms43 and
opportunistic pathogens44 have both exhibited patterns of regrowth during distribution in reclaimed
water systems, the potential for regrowth of ARG-carrying bacteria warrants consideration.
Distribution system biofilms are also worthy of investigation given that biofilms have been
identified as reservoirs for pathogenic bacteria in drinking water systems45 and supportive
environments for horizontal gene transfer.46
Here we used quantitative polymerase chain reaction (qPCR) to survey four ARGs; blaTEM,
qnrA, vanA, and sul1, and the intI1 integrase gene, known to facilitate horizontal gene transfer, in
full-scale reclaimed water distribution systems located in four U.S. cities that implement non-
potable reuse. Shotgun metagenomic sequencing was applied towards profiling the broader
“resistome” (i.e., full contingent of ARGs)47 in a cross-section of samples and the bacterial
community composition was tracked using 16S rRNA amplicon sequencing to explore potential

86
microbial ecological drivers of ARG occurrence. The specific objectives of this work were to: 1)
characterize the resistome of reclaimed water distribution systems relative to corresponding
potable systems; 2) quantify abundances of ARGs inhabiting the water versus the biofilm; 3)
measure removal of ARGs during treatment and any subsequent increases during transport of
reclaimed water to the point of use (POU); 4) explore associations between ARG occurrence and
the bacterial community composition; 5) investigate potential for ARG dissemination via
horizontal gene transfer; and 6) examine associations between water chemistry, particularly
potential selective agents, and the abundance of ARGs. Realization of the objectives of this work
will provide context for understanding the potential for water reuse to disseminate ARB and ARGs
and inform development of management strategies for limiting dissemination of ARB and ARGs
via distribution system operation.
METHODS
Site description, sample collection, and preservation
Four water utilities utilizing tertiary wastewater treatment to produce reclaimed water
participated in sampling and are described in Table 5-1. Details about the four seasonal collection
dates conducted for each utility are provided in Table S1. For each reclaimed system, samples
were collected of raw wastewater influent, following treatment at the point of entry (POE) to the
distribution system, and at five POUs. For each potable system, samples were collected of source
water, at the POE, and at five POUs. After flushing for 30 seconds, water samples for molecular
analysis were collected via distribution system sampling ports in sterile one liter polypropylene
containers. Samples for organic carbon analysis were collected in acid-washed, baked 250
milliliter amber glass bottles. All bottles were prepared with 48 milligrams sodium thiosulfate per
liter to quench chlorine, and bottles for molecular analysis were also prepared with 292 milligrams
ethylenediaminetetraacetic acid per liter to chelate metals. Water was collected in acid-washed
250 milliliter bottles for chemical analyses. For Utilities A and B, after collecting water samples,
biofilm samples were collected at each POU by inserting a sterile cotton-tipped applicator (Fisher
Scientific, Waltham, MA) into the distribution system pipe and swabbing the upper 180º of the
circumference of the pipe in a single pass. The sample end of the swab was transferred directly to
a sterile DNA extraction lysing tube.
Samples were shipped overnight on ice and processed immediately upon arrival, within
approximately 24 hours of sample collection. Samples for molecular analysis were concentrated
onto 0.22 micron mixed cellulose esters membrane filters (Millipore, Billerica, MA) until the
entire one liter sample passed or until the filter became clogged. Filters were folded into quarters,
torn into 1 cm2 pieces using sterile forceps, transferred to lysing tubes, and preserved at -20ºC.
DNA was extracted from filters and biofilm swabs using a FastDNA SPIN Kit (MP Biomedicals,
Solon, OH).

87
Table 5-1: Overview of surveyed potable and reclaimed systems
U.S. Region
(Climate)a
Potable Reclaimed
Utility Disinfectant Source Summary of Treatment Disinfectant
A
Southeast
(Humid
Subtropical;
Cfa)
NH2Cl Surface and
Groundwater
Plant #1b – 5-stage
Bardenphoc Cl2
(NH2Cl)e
Plant #2b - Activated
sludge, dentirification
B
Southwest
(Mediterran;
Csb)
Cl2;
occasional
ClO2
Surface and
Groundwater
Plant #1d – 4-stage
Bardenphoc
Cl2
(NH2Cl)e
Plant #2d - Biofiltration
UV
C
Southwest
(Mid-
Latitude
Steppe and
Desert; Bsh)
Cl2 Surface and
Groundwater
Dual membrane filters or
membrane bioreactors NH2Cl
D
West
(Mediterran;
Csb)
Cl2 Surface and
Groundwater Dual media filters
Cl2
(NH2Cl)e
aKöppen climate classification: Cfa = mild temperate, fully humid, hot summer; Csb = mild
temperate, dry summer, warm summer; Bsh = dry, dry summer, hot arid
bUtility A plants feed into two isolated distribution systems (A1 and A2) cBardenpho refers to activated sludge process modified to optimize biological nutrient removal dUtility B plants feed into 1 combined distribution system eFree chlorine was dosed but water chemistry data indicates that total chlorine >> free chlorine,
thus free chlorine reacted with ambient ammonia and resulted in NH2Cl as the primary form of
disinfectant residual (Table S5)
Water chemistry
Free chlorine (4500Cl G), total chlorine (4500Cl G), temperature (2550 B), dissolved
oxygen (4500-O G), pH (4500-H+ B), turbidity (2130 B), and electrical conductivity (2510 B)
were measured on-site according to standard methods.48 Upon return to the lab, one 30 milliliter
aliquot was taken for total organic carbon (TOC) and a second aliquot was filtered through pre-
rinsed 0.22 micron pore size mixed cellulose esters membrane filters (Millipore, Billerica, MA)
for dissolved organic carbon (DOC). Biodegradable dissolved organic carbon (BDOC) was
measured as previously described by Servais et al.49 with an incubation time extended to 45 days.
Samples were analyzed on a Sievers 5310C portable TOC analyzer (GE, Boulder, CO) according
to Standard Method 5310C.48 A host of 28 metals, including sodium, magnesium, phosphorus,
chloride, calcium, iron, copper, zinc, and lead were measured using an Electron X-Series
inductively coupled plasma mass spectrometer (ThermoFisher, Waltham, MA) according to
Standard Method 3125B.48 Nitrate, nitrite, phosphate, and sulfate were quantified via a Dionex-
500 ion chromatography system (ThermoFisher, Waltham, MA) according to Standard Method
4110B.48 Antibiotics were extracted from samples using solid phase extraction according to Sui et
al.50 with minor modifications described in the supporting information. The following antibiotics
were analyzed using an ultra-performance liquid chromatography-tandem mass spectrometer

88
(UPLC-MS/MS; Agilent 1290 UPLC/Agilent 6490 Triple Quad tandem MS, Agilent
Technologies Inc., Santa Clara, CA): cefotaxime, chlorotetracycline, erythromycin, flumequine,
nalidixic acid, ormetoprim, ornidazole (anti-protozoan), oxolinic acid, sulfamethazine,
sulfamethoxazole, tetracycline, and tylosin.
Quantification of antibiotic resistance genes
Gene copies were quantified on a CFX96 Real Time System (BioRad, Hercules, CA) from
DNA extracts in triplicate reactions using qPCR with previously published protocols for 16S
rRNA,51 blaTEM,52 qnrA,53 vanA,54 sul1,55 and intI156 genes. These genes were selected based on
relevance to human health and environmental transmission of ARGs. The genes represent a
spectrum of typical documented prevalence in the environment. For example, sul1 has been widely
documented in wastewater impacted environments19,57 and the gene corresponds to a class of
antibiotics (sulfonamides) for which resistance of human pathogens has become commonplace.58
In contrast, vanA encodes resistance to a “last resort” drug and is less common in wastewater
impacted environments.4,19 A subset of samples was initially analyzed at 5, 10, 20, and 50 fold
dilutions to determine the optimal dilution effective for minimizing inhibition. A ten-fold dilution
was selected and applied to all extracts. A triplicate negative control and triplicate standard curves
of ten-fold serially diluted standards, constructed as described in the supporting information, of
each target gene ranging from 101 to 107 gene copies/µl were included on each 96-well plate. The
limit of quantification was 10 gene copies per milliliter of sampled water and 103 gene copies per
biofilm swab.
Shotgun metagenomics and 16S rRNA amplicon sequencing
To profile the resistome, shotgun metagenomic sequencing was conducted on DNA
extracted from the POE and greatest water age POU samples from each reclaimed system on each
collection date as previously described,59 with sequencing conducted on an Illumina HiSeq with
2x100-cycle paired end reads at the Biocomplexity Institute of Virginia Tech Genomics
Sequencing Center (BI; Blacksburg, VA). One source water sample, the POE, and the greatest
water age POU sample from the potable system of each utility (all collected during the summer
collection from each utility) were also submitted for sequencing. All potable samples from Utilities
C and D and a subset of samples from Utility A yielded insufficient DNA to conduct metagenomic
sequencing.
Functional genes were annotated via the MetaStorm platform60 according to default
parameters (amino acid identity≥80%; e-value cutoff=1e-10; minimum alignment length=25
amino acids) using annotation to the Comprehensive Antibiotic Resistance Database (CARD,
version 1.0.6) for ARGs,61 the Silva ribosomal RNA database for 16S rRNA genes (version 123),62
the BacMet database (version 1.1) for metal resistance genes,63 and the ACLAME database
(version 0.4) for plasmids.64 Functional genes were normalized to 16S rRNA genes as previously
described by Li et al.65 Absolute abundances were calculated by multiplying relative abundance of
target functional genes by total abundance of 16S rRNA genes quantified by qPCR (Figure S1).
All metagenomes generated in this study are publicly available via MG-RAST66 under project
number 12943 (see Table S2 for sample IDs and read and assembly statistics). Reads were

89
assembled de novo in MetaStorm according to default parameters and scaffolds were annotated as
described above for reads.
Bacterial communities were profiled using gene amplicon sequencing targeting the V4
region of the 16S rRNA gene with barcoded primers (515F/806R).67 Some archaea are also
detected by these primers. Triplicate PCR products were combined and 240 ng of each composite
was pooled and purified using a QIAquick PCR Purification Kit (Qiagen, Valencia, CA).
Sequencing was conducted at BI on an Illumina MiSeq using a 2x250-cycle paired-end protocol.
Processing of reads was conducted using the QIIME pipeline68 with phylogenetic inference based
on alignment against the Greengenes database (May 2013 release).69 Samples were rarefied to
10,000 randomly selected reads (Table S3). Field, filtration, DNA extraction blanks, and a least
one PCR blank per lane were included in the analysis.
Statistical Analysis
A Wilcoxon rank sum test for multiple comparisons was applied in JMP (version 13, SAS,
Cary, NC) to determine differences between abundances of ARGs across groups of samples.
Spearman’s rank sum correlation coefficients were calculated in JMP to assess correlations
between ARGs, phyla, Gram-stain type (identified from the literature for each phyla to the extent
possible), and water quality parameters. Canonical correspondence analysis was conducted in R
(version 3.4.1) using the Adonis function from the vegan package70 to identify ARGs that are
significantly correlated with the bacterial community structure. Abundance of ARGs based on
metagenomic data were imported into PRIMER-E (version 6.1.13) for Bray-Curtis resemblance
matrix construction and one-way analysis of similarities (ANOSIM) to compare profile differences
across groups of samples. A significance cutoff of α=0.05 was used for all analyses. Co-
occurrences of annotated genes on scaffolds were characterized via network analysis visualization
using Gephi (version 0.8.2).
RESULTS AND DISCUSSION
Metagenomic characterization of the resistome in reclaimed versus potable water
Shotgun metagenomic sequencing was used to investigate the abundance of known ARGs
by annotating reads against the CARD database. Seventeen classes of antibiotic resistance, as well
as multidrug resistance, were identified across all samples (n=38, Figure 5-1). Across the dataset,
590 different ARGs were annotated, with between 16 and 372 different ARGs detected in each
sample. The top 25 most abundant ARGs overall included four aminoglycoside (aadA23, ant(2”)-
la, aadA, aadA17), one sulfonamide (sul1), one trimethoprim (dfrE), one polymyxin (pmrE), one
rifampin (rbpA), two beta-lactam (blaOXA-256, blaOXA-129), two tetracycline (tetC, tetQ), one
fluoroquinolone (qnrS6), one macrolide (ereA2), and eight multidrug (msrE, mtrA, mexF, mexK,
CRP, adeG, mexW, acrB) ARGs. The average number of sequencing reads aligning to different
ARGs per sample was 26.8±9.2 per ten million reads in the potable water and 69.0±42.7 per ten
million reads in the reclaimed water, though differences were not significant (Wilcoxon;
p=0.0891).

90
Among the potable samples that were successfully sequenced, multidrug ARGs were
common (8.4-33.4% of total ARGs) and the most abundant classes of ARGs were trimethoprim
(10.6-49.7%), aminocoumarin (0-18.5%), beta lactam (1.3-38.5%), polymyxin (0.4-11.1%), and
aminoglycoside (0.9-9.8%) resistance. The abundance of total ARGs in potable water ranged from
3.93–6.83 log gene copies per milliliter and 4.33–5.32 log gene copies per swab in the biofilm.
Reclaimed water ARG profiles were distinct from that of potable samples (ANOSIM;
R=0.705, p=0.001; Figure 5-1; Figure S2). In the reclaimed water, Utility A’s ARG profile stood
out from that of other utilities (R=0.695-0.932, p=0.001), dominated by aminoglycoside (34.5-
66.8% of total ARGs) and sulfonamide (29.2-51.9%) ARGs, whereas Utilities B, C, and D were
generally dominated by multidrug (10.0-40.8%), trimethoprim (8.4-50.5%), sulfonamide (0-38.3),
tetracycline (0.97-13.2%), and beta-lactam (1.07-16.9%) ARGs. The biofilms of Utilities A and B
exhibited patterns that were more similar to the respective water samples of those utilities than to
each other, dominated by aminoglycoside (44.3%), sulfonamide (22.3%), and trimethoprim ARGs
(13.8%) for Utility A and multidrug (44.6%), rifampin (24.0%), and trimethoprim (17.9%) for
Utility B. The abundance of total ARGs in the reclaimed water ranged from 5.24–6.53 log gene
copies per milliliter and 4.82–6.14 log gene copies per biofilm swab.
The resistance profile of the treated water at the POE was markedly different from that of
the influent wastewater for each utility (ANOSIM; R=0.971, p=0.002), consistent with the
expectation that the treatment process shifts the types and numbers of ARGs relative to raw
sewage. As expected, the greatest abundances of total ARGs were generally found in the raw
wastewater influent samples (6.81–7.88 log gene copies per milliliter). Influent wastewater tended
to be dominated by multidrug (16.1-35.4% of total ARGs), aminoglycoside (12.7-30.8%), beta-
lactam (3.1-21%), tetracycline (6.3-16.7%), macrolide (2.4-10.4%), and sulfonamide resistance
(1.2-19.5%), though there was variation across utilities (Figure 5-1).
While metagenomic analysis provides tremendous potential for characterizing the
resistome and allowing broad detection of all known ARGs, the approach is cost-prohibitive,
limiting the number of samples that can be analyzed, as well as being only semi-quantitative. In
addition, the lack of sufficient DNA from many samples in this study was a critical limitation to
being able to fully compare reclaimed water samples to potable samples, which were much lower
in biomass. This consequentially limited sample size for many of the categories (Figure 5-1) and
correspondingly limited the ability to draw statistically significant conclusions about the data. The
metagenomic analysis completed herein should be viewed as an exploratory characterization,
particularly with respect to the potable water resistome.

91
Figure 5-1: Metagenomic characterization of ARGs by antibiotic class. Abundance of ARGs
by antibiotic class (stacked bars) and plasmids (diamonds) per mL of water sampled or per biofilm
swab as determined by annotation of reads from shotgun metagenomic sequencing of samples
collected at the point-of-entry (POE) and point-of-use (POU) of four potable water utilities (A, B,
C, D). Reads were annotated against the Comprehensive Antibiotic Resistance Database for ARGs
and the ACLAME database for plasmids. Sufficient DNA for analysis of potable water samples
was only possible at Utilities A and B, the remaining samples were from reclaimed water
distribution systems. Error bars indicate standard deviation of total abundance of ARGs or
plasmids when statistical power was sufficient (n value indicated for each sample category). This
data is also presented as relative abundances normalized to 16S rRNA genes (Figure S6).
Abundance of target ARGs in water and biofilms
To precisely quantify a selection of ARGs corresponding to a range of critically and highly
important classes, as defined by the World Health Organization,71 across the full dataset, qPCR
was utilized. Important to note is that qPCR, as applied in this study, does not directly distinguish
live and dead organisms or intracellular versus extracellular DNA. However, tracking numbers of
ARGs through the water systems represents an indicator of net amplification and decay of the
target genes, via horizontal transfer and/or growth or death and degradation, respectively.57
1
2
3
4
5
6
7
8
9
10
PO
U: w
ate
r (n
=1
)
PO
U: b
iofilm
(n=
1)
PO
E: w
ate
r (n
=1)
PO
U: w
ate
r (n
=1
)
PO
U: b
iofilm
(n=
1)
PO
E: w
ate
r (n
=4)
PO
U: w
ate
r (n
=4
)
PO
U: b
iofilm
(n=
1)
Influ
en
t (n
=1)
PO
E: w
ate
r (n
=4)
PO
U: w
ate
r (n
=4
)
PO
U: b
iofilm
(n=
1)
Influ
en
t (n
=1)
PO
E: w
ate
r (n
=2)
PO
U: w
ate
r (n
=2
)
Influ
en
t (n
=1)
PO
E: w
ate
r (n
=3)
PO
U: w
ate
r (n
=4
)
Influ
en
t (n
=1)
UtilityA
Utility B Utility A Utility B Utility C Utility D
Potable Reclaimed
log (
ge
ne
co
pie
s / m
L)
multidrug
other
trimethoprim
tetracycline
sulfonamide
streptothricin
streptogramin
rifampin
polymyxin
peptide
macrolide
lincosamide
glycopeptide
fosfomycin
fluoroquinolone
chloramphenicol
beta-lactam
aminoglycoside
aminocoumarin
plasmids
total

92
Several significant differences were noted in target gene numbers when comparing the
paired reclaimed and potable distribution systems (Table 5-2). A consistent difference noted across
all four utilities was that both 16S rRNA (a proxy for total bacterial cells) and sul1 gene copies per
milliliter were more abundant in the reclaimed than potable distribution system samples
(Wilcoxon; p≤0.0011). Further, blaTEM was more abundant in the reclaimed than the potable
distribution system of Utility D (p<0.0001), and qnrA was greater in the reclaimed water of
Utilities B, C, and D (p≤0.0145). vanA was not significantly different in any of the reclaimed
versus potable distribution system waters (p≥0.0952). Where it was possible to collect biofilm
samples, at Utilities A and B, 16S rRNA genes and sul1 gene copies per swab were all greater in
the reclaimed compared to the potable biofilm at Utility A (p≤0.0017), while only sul1 was
significantly elevated in the reclaimed biofilm for Utility B (p=0.0018).
sul1 was generally the most abundant ARG in reclaimed water at the POE, with 50–100%
of samples positive, averaging from 4.0–5.3 log gene copies per milliliter. blaTEM was present in
14–75% of reclaimed POE samples, averaging from 1.3–1.9 log gene copies per milliliter. qnrA
was only detected at the reclaimed POE of Utility D (75% positive; 1.3±0.1 log gene copies per
milliliter, on average) while vanA was only detected at the reclaimed POE of Utility A (14%
positive; 2.7±0.0 log gene copies per milliliter).
Although sul1 was nearly ubiquitous in reclaimed water, it was only detected at the POE
in the potable water of Utility B, with 25% of samples positive at an average of 2.3±0.0 log gene
copies per milliliter. qnrA was only detected at the potable POE of Utility D (25% positive; 1.1±0.0
log gene copies per milliliter, on average) and vanA was only detected at the potable POE of Utility
B (50% positive; 2.0±0.6 log gene copies per milliliter, on average). blaTEM was detected at the
potable POE of Utilities A (33% positive; 1.0±0.0 log gene copies per milliliter) and C (25%
positive; 1.4±0.0 log gene copies per milliliter). Similar trends were observed when ARG
abundances were normalized to 16S rRNA gene abundances (Table S4).
Interestingly, there were no significant differences between the abundance of ARGS (i.e.,
gene copies per milliliter) in the potable source water (e.g., reservoirs, groundwaters) and in the
corresponding treated water at the POE (Wilcoxon; p≥0.1859). This suggests that ARGs
essentially “pass-through” the drinking water treatment process, with the finished water
representative of background natural waters. When comparing the raw wastewater influent to the
reclaimed POE, reductions in some target genes were observed. 16S rRNA genes were decreased
at Utilities A and B (p≤0.0298), and qnrA decreased at Utility B (p=0.0404). With these
exceptions, treatment of reclaimed water did not consistently result in a significant reduction in
ARGs on a unit volume basis, even when the water was collected post-disinfection. It is surprising
to find that 16S rRNA genes were significantly reduced during treatment only at two of the utilities
(A and B). Previous studies by Czekalski et al.72 and Mao et al.73 reported similar findings, with
minuscule differences between 16S rRNA gene abundances in WWTP raw influent and final
effluent. Czekalski reported that larger reductions in viable cell counts were observed using
methods such as heterotrophic plate count,72 thus it is possible that 16S rRNA genes are present as
extracellular DNA or associated with inactivated cells in final effluent. The lack of removal of
ARGs during wastewater treatment adds to the body of evidence that typical biological treatment
processes, and even media filtration, do not result in consistent broad-scale removal of ARGs.74–
76 In contrast, other studies have reported successful reductions in ARG abundances during

93
conventional wastewater treatment,14,74 so further research into the efficacy of various treatment
processes for removing ARGs is needed. Advanced oxidative processes (AOPs), which employ
hydroxyl radicals to more aggressively break down residual organic matter, are of interest and
have shown promise for removal of both ARB and ARGs from wastewater.77,78 However, it is
important to recognize that not all studies have indicated that AOPs achieve substantial removal
of ARGs. In particular, effectiveness appears to vary widely based on the target microorganism
and ARG studied,78,79 calling for further research to effectively optimize AOPs for the purpose of
minimizing antibiotic resistance risk in reclaimed water.
With the exception of vanA, which decreased from the POE to the POU in Utility A’s
reclaimed water (Wilcoxon; p=0.0338), abundances did not change significantly between the POE
and the POU for any other ARGs measured by qPCR in potable or reclaimed water (p≥0.2021).
Metagenomic analysis revealed that in the potable water, samples averaged 20.1 different ARGs
per ten million reads at the POE and 30.2 different ARGs per ten million reads at the POU. In the
reclaimed water, POE samples averaged 81.4 ARGs per ten million reads, but only 49.1 ARGs per
ten million reads at the POU. In the reclaimed water, this represents a significant decrease in ARG
diversity from the POE to the POU (p=0.0272). A previous study found that pipeline transport
significantly increased beta-lactam ARGs in potable water at the tap.80 In a study of a reclaimed
water distribution system, Fahrenfeld et al. found that the ARGs sul1 and tet(A) were more
abundant at the POU than at the POE, while no difference was observed for vanA, ermF, sul2, and
tet(O), suggesting that regrowth can occur from the POE to the POU for some ARGS in some
reclaimed water distribution systems.19 While the results of the current study did not suggest
significant regrowth of ARG-carrying bacteria in the surveyed potable and reclaimed distribution
systems, ARGs did generally persist following distribution system transport in both potable and
reclaimed systems.
Associations between ARG abundance and microbial ecological factors
Canonical correspondence analysis (Figure S3) indicated that all five target genes had
significant, though weak, associations with the overall bacterial community composition (Adonis,
R2=0.1424-0.1734; p≤0.001). The target ARGs were each significantly correlated with several
phyla and Proteobacteria classes. The strongest correlations between ARGs and various bacterial
phyla (or Proteobacteria classes) were between blaTEM and Fibrobacteres, WWE1, Synergistetes,
SR1, OD1, and Euryarchaeota (Spearman; ρ=0.2595-0.2767; p<0.0001) qnrA and SR1, TM7,
Lentisphaerae, WWE1, Synergistetes, and Fibrobacteres (ρ=0.3797-0.5044; p<0.0001); sul1 and
NKB19, WPS-2, TA18 Proteobacteria, TM7, TM6, and Alphaproteobacteria (ρ=0.2917-0.4890;
p<0.0001); and between vanA and Actinobacteria, Cyanobacteria, Proteobacteria (unclassified at
the class level), GN04, Firmicutes, and AncK6 (ρ=0.1226-0.1797; p≤0.0415). The presence of
statistically significant correlations between the bacterial community composition and ARGs
indicates that at least some of the shifts in ARG abundances noted within the distribution systems
may actually be indicative of shifts in numbers and types of bacteria carrying them. In other words,
vertical transfer of ARGs via relative selection pressures on existing bacteria carrying these genes
is possibly a key contributor to the patterns observed, as reported by others.81,82 Previous studies
have demonstrated that ARG abundances are associated with community phylogenetic
composition in many environments, including soil,82,83 the human gut,83 and sewage sludge.84

94
Table 5-2: Frequency of qPCR detection and abundance of ARGs. 16S rRNA and ARGs in
potable and reclaimed water (log10 gene copies per milliliter) and biofilm (log10 gene copies per
swab) samples in the influent or source water, at the point of entry (POE), and point of use (POU);
average (standard deviation) of values above the limit of quantification. Values for each sampling
location include four sampling events. Biofilm swab samples were collected by the same
individual at each utility and in the same manner, so comparisons within one utility may be made,
but biofilm abundances should be compared across utilities with caution. Relative abundances
(normalized to 16S rRNA genes) are provided in Table S4.
16S rRNA blaTEM intI1 qnrA vanA sul1
Influent / Source
Potable
A (n=6) 100%; 3.6(0.8) 17%; 1.8(0.0) ND ND 33%; 1.5(0.4) ND
B (n=4) 100%; 3.8(0.5) 25%; 2.2(0.0) ND ND 25%; 1.2(0.0) 25%; 1.2(0.0)
C (n=9) 100%; 3.7(1.5) 11%; 1.2(0.0) 11%; 4.2(0.0) ND ND 22%; 1.7(0.8)
D (n=3) 100%; 4.2(2.1) 33%; 2.8(0.0) 33%; 6.2(0.0) 67%; 1.9(0.5) ND 33%; 5.8(0.0)
Reclaimed
A (n=6) 100%; 7.3(0.3) 50%; 2.4(0.9) 67%; 5.7(1.2) 33%; 3.0(0.2) ND 50%; 4.9(1.4)
B (n=7) 100%; 7.5(1.5) 71%; 3.2(0.4) 71%; 6.7(0.4) 71%; 2.6(0.5) ND 71%; 6.5(0.2)
C (n=4) 100%; 6.9(0.4) 75%; 1.6(0.1) 50%; 6.8(2.5) 50%; 1.4(0.1) ND 75%; 5.8(1.2)
D (n=3) 100%; 7.2(0.2) 100%; 2.9(0.3) 100%; 6(0.5) 100%; 2.9(0.5) ND 100%; 5.8(0.4)
POE - water
Potable
A (n=3) 100%; 4.6(0.5) 33%; 1.0(0.0) 33%; 5.6(0.0) ND ND ND
B (n=4) 100%; 4.6(2.2) ND 25%; 4.0(0.0) ND 50%; 2.0(0.6) 25%; 2.3(0.0)
C (n=4) 100%; 2.6(0.7) 25%; 1.4(0.0) 25%; 4.3(0.0) ND ND ND
D (n=4) 100%; 2.8(0.8) ND ND 25%; 1.1(0.0) ND ND
Reclaimed
A (n=7) 100%; 5.7(0.7) 14%; 1.9(0.0) 57%; 5.6(1.2) ND 14%; 2.7(0.0) 100%; 5.0(1.0)
B (n=7) 100%; 5.5(1.0) 43%; 1.5(0.5) 29%; 5.0(2.1) ND ND 100%; 4.0(1.0)
C (n=4) 100%; 5.4(2.1) 50%; 1.3(0.1) 50%; 6.6(0.2) ND ND 50%; 5.3(0.1)
D (n=4) 100%; 5.2(1.8) 75%; 1.5(0.3) 25%; 5.2(0.0) 75%; 1.3(0.1) ND 100%; 4.1(1.4)
POU - water
Potable
A (n=44) 100%; 4.2(0.9) 23%; 1.8(0.8) 25%; 4.7(0.9) 2%; 1.2(0.0) 11%; 1.4(0.3) 18%; 2.7(2.0)
B (n=21) 100%; 3.3(1.0) 19%; 1.7(0.7) 19%; 4.9(0.5) ND 14%; 1.9(1.0) 19%; 1.7(0.7)
C (n=15) 95%; 2.3(0.6) ND ND ND ND 47%; 1.6(0.5)
D (n=20) 85%; 2.4(0.6) ND ND ND ND 5%; 1.2(0.0)
Reclaimed
A (n=38) 100%; 6.4(0.4) 18%; 1.8(0.8) 71%; 5.7(0.8) ND ND 92%; 5.5(0.8)
B (n=17) 100%; 5.8(1.3) 12%; 1.6(0.4) 53%; 5.8(0.6) ND 6%; 1.5(0.0) 88%; 4.8(1.2)
C (n=17) 100%; 5.7(2.0) 18%; 1.9(1.1) 53%; 5.1(1.5) 6%; 1.5(0.0) ND 59%; 5.2(2.0)
D (n=20) 100%; 5.7(0.8) 80%; 1.5(0.4) 55%; 4.8(0.3) 45%; 1.2(0.2) ND 100%; 4.6(0.9)
POU – biofilm
Potable
A (n=40) 100%; 4.2(0.7) 18%; 1.5(0.4) 20%; 4.2(0.9) ND 5%; 1.5(0.5) 15%; 3.2(1.5)
B (n=21) 100%; 3.5(0.8) 10%; 1.6(0.7) ND 5%; 2.1(0.0) 10%; 1.3(0.1) 24%; 2.1(1.6)
Reclaimed
A (n=33) 100%; 6.0(0.4) 6%; 1.8(1.0) 55%; 4.5(0.8) 3%; 1.6(0.0) ND 85%; 4.6(1.0)
B (n=15) 100%; 4.2(0.5) 13%; 1.4(0.1) 20%; 3.5(2.7) 7%; 1.2(0.0) 20%; 1.4(0.1) 80%; 2.7(1.0)
In the absence of ARGs, most sulfonamides, beta-lactams, and fluoroquinolones are
effective against both Gram-positive and -negative bacteria, while vancomycin is primarily only
effective against Gram-positive bacteria. To the extent that information was available, phyla were
sorted by Gram stain type and correlations with ARGs were examined. blaTEM correlated
negatively with the abundance of Gram-negative bacteria (Spearman; ρ=-0.1562, p=0.0092). qnrA
correlated positively with Gram-positive bacteria (ρ=0.2450, p<0.0001) and negatively with

95
Gram-negative bacteria (ρ=-0.2340, p<0.0001). sul1 correlated negatively with Gram-positive
bacteria (ρ=-0.1919, p=0.0013) and positively with Gram-negative bacteria (ρ=0.1747, p=0.0035).
vanA correlated positively with Gram-positive bacteria (ρ=0.1807, p=0.0025) and negatively with
Gram-negative bacteria (ρ=-0.1353, p=0.0243), which is consistent with the activity of
vancomycin against Gram-positive bacteria. While vertical transfer of ARGs appears to be an
important factor, the identification of only weak correlations (Adonis R2≤0.1734; Spearman
|ρ|≤0.5044) between ARGs and overall bacterial community composition, occurrence of individual
phyla, and Gram-stain type indicates that vertical transfer explains only a portion of the variation
in ARGs documented in this study. The presence of weak correlations indicates that it is possible
that environmental bacteria, such as those inhabiting reclaimed and potable distribution systems,
may serve as potential reservoirs of resistance that can become mobilized to pathogenic bacteria.
This possible mobilization of ARGs from innocuous to pathogenic bacteria has the potential to
occur at several points: 1) in the distribution system, 2) following irrigation or other industrial
application, or 3) following human exposure and potential colonization by these commensal
bacteria. Further research is needed to confirm that such mobilization occurs in each of these
compartments and determine corresponding rates.
Potential for horizontal gene transfer
As was the case in this study, it is commonly observed that the ARG profile correlates with
phylogenetic composition. However, this does not necessarily explain the full extent of factors
influencing abundance of ARGs.82–84 Horizontal gene transfer has been established as an important
mechanism for the dissemination of ARGs between species and particularly in the mobilization of
ARGs from non-pathogenic environmental flora to pathogens.85–88
The class 1 integron-integrase gene, intI1, is important for gene acquisition as it allows
capture of exogenous genes into a cell’s genome and subsequent expression. The gene also has a
tendency to acquire a wide range of gene cassettes, including several ARGs, and is well suited for
horizontal gene transfer among a variety of environmental and pathogenic organisms.89 intI1 was
more abundant in the reclaimed than potable water of Utilities A, C, and D (Wilcoxon; p<0.0001)
as well as in the reclaimed compared to the potable biofilm at Utility A (p=0.0017). The ubiquity
of intI1 in reclaimed water compared to potable water (Table 5-2) suggests that reclaimed water
may be a particularly rich environment for horizontal gene transfer and incorporation of transferred
genes into a cell’s genome. The abundance of intI1 in reclaimed biofilms further indicates that
their high cellular density may be well suited for horizontal gene transfer. Correlations between
sul1 and intI1 were examined, given that sul1 is commonly found on intI1 gene cassettes.89 In
potable water, these two gene were correlated in biofilm (Spearman; ρ=0.3061, p=0.0164), but not
in water (ρ=0.0502, p=0.6165). In reclaimed water, the genes were correlated in both the water
(ρ=0.6422, p<0.0001) and biofilm (ρ=0.4991, p=0.0003). intI1 was also correlated with blaTEM in
potable water (ρ=0.5038, p<0.0001) and biofilm (ρ=0.3485, p=0.0059), and reclaimed water
(ρ=0.3597, p<0.0001) and biofilm (ρ=0.3935, p=0.0051). intI1 was only correlated with qnrA in
reclaimed water (ρ=0.3018, p=0.0012).
Potential for conjugation (i.e., transfer of plasmid DNA via cell-to-cell contact) was
explored by identifying genes associated with plasmids via annotation of metagenomic sequence
reads against the ACLAME plasmid database. Owing to the unique ecosystem created by the

96
biofilm environment and a high level of contact between microorganisms, biofilms have been
documented to facilitate relatively high rates of gene transfer.90 While biofilm samples tended to
have relatively high abundances of plasmid-associated genes in the present study (Figure 5-1), the
abundances were not significantly different from those of the water for the potable (Wilcoxon;
p=0.7728) or the reclaimed (p=0.1412) water systems. There were no significant differences in
abundance of metagenomic reads annotated as plasmid associated genes between potable and
reclaimed water (p=0.1144), or among utilities for reclaimed water (p≥0.2301). For reclaimed
water samples, the abundance of plasmid-associated genes detected at the POU was greater than
at the POE (p=0.0004), suggesting that conjugation or selection for plasmid-carrying bacteria may
be occurring within the distribution system.
Network analysis of de novo assembled scaffolds derived from metagenomics sequence
data was conducted to identify ARGs associated with plasmid gene markers as well as to examine
associations between ARGs co-located on the same DNA strand (Figure 5-2, Figure S4). In
particular, ARGs present on the same mobile element or DNA strand may be subject to co-
selection. Across all samples analyzed, 193 different ARGs were found to be associated with
plasmid markers. Those with at least three instances of co-location with plasmid gene markers are
highlighted in Figure 5-2. The ARGs most frequently associated with plasmid scaffolds included
several multidrug ARGs; acrE, acrA, adeF, mexB, mexK, sav1866, and ceoA (684, 156, 146, 135,
128, 109, and 100 scaffolds, respectively), the trimethoprim ARG dfrE (339 scaffolds), the
aminoglycoside ARG amrA (222 scaffolds), and the cationic antibiotic ARG rosA (198 scaffolds).
Other notable ARGs that mapped to plasmid scaffolds were sul1 (34 scaffolds), NDM-13 (18
scaffolds), and several extended spectrum beta-lactamases: CTX-M-9 (1 scaffold), PER-7 (1
scaffold), GES-5 (2 scaffolds), 2 SHV gene variants (2 scaffolds), 4 TEM gene variants (7
scaffolds), and 12 OXA gene variants (18 scaffolds). Detection of sul1 and blaTEM occurring
together with plasmid-associated genes and correlated with intI1, as noted above, suggests that
these genes might be particularly noteworthy candidates as indicators of horizontal gene transfer
potential. Detection of the New Delhi metallo-beta-lactamase, NDM-13, on several plasmid
scaffolds is also particularly concerning as it is an exemplar of an ARG that is both mobile and
encodes resistance to several critically-important antibiotics, including nearly all beta-lactam
antibiotics.91
Although horizontal gene transfer rates in the environment are thought to be low,37,92 even
rare transfer incidence of ARGs that are of concern to public health, such as NDM-13, merit further
consideration in terms of beginning to better understand and predict how occurrence of ARGs may
translate to actual risk. Little is known about rates of horizontal gene transfer in wastewater or
aquatic environments, and to the authors’ knowledge, no study has quantified these rates
specifically in the reclaimed water environment.

97
Figure 5-2: Network analysis depicting co-occurrence of ARGs among each other as well as
with plasmid gene markers on assembled scaffolds. Constructed using de novo assembly of
shotgun metagenomic sequencing reads from all samples. This analysis highlights ARGs that are
the probable candidates for potential horizontal gene transfer (co-occurrences with plasmid
associated genes) or co-selection (co-occurrences with ARGs of different classes). Proximity of
nodes and width of lines is proportional to numbers of association between genes. Node diameter
is proportional to the number of co-occurrences for that gene. A minimum of three co-occurrences
were required for inclusion in the graphic. All ARG nodes depicted share a connection with the
plasmid node, with the exception of EreA2, indicated by an asterisk. MLS indicates resistance to
macrolide, lincosamide, and streptogramin antibiotics.This analysis has also been provided for
reclaimed and potable samples individually (Figure S4).
Associations between water chemistry and ARGs
This study comparing ARG occurrence in reclaimed and potable water systems presents
an opportunity to examine how ARG occurrence may be shaped by water chemistry. Here we
observe that water chemistry can influence the resistome via several mechanisms. For example,
nutrients, pH, dissolved oxygen, temperature, disinfectant, and other physicochemical parameters

98
may select the type of bacterial community inhabiting water systems, including taxonomic
structure and potential for horizontal gene transfer. In addition, certain agents, such as
antimicrobials, disinfectants, and heavy metals, may be present that directly select for bacteria
carrying ARGs. Many of these agents have even been shown to select for ARGs or stimulate
horizontal gene transfer at sub-inhibitory concentrations, thus even the presence of low abundances
of these selective agents merits consideration of their potential to influence the resistome.93–103
Water chemistry data is presented in Table S5. Total chlorine was negatively correlated
with sul1 (Spearman; ρ=-0.3117, p=0.0003) and intI1 (ρ=-0.3030, p=0.0007) in reclaimed water,
but positively correlated with blaTEM (ρ=0.2799, p=0.0165) and qnrA (ρ=0.2410, p=0.0400) in the
potable water. This suggests that the relatively higher levels of chlorine maintained in the potable
water may have actually selected for bacteria carrying blaTEM and qnrA. Previous studies have
demonstrated that chlorine can sometimes select for ARG-carrying bacteria. Huang et al. found
that inactivation of E. coli carrying the tetracycline ARG tetA using chlorine was significantly
lower than tetracycline-sensitive E. coli.31 Karumathil et al. found that exposure of Acinetobacter
baumannii to chlorine resulted in up-regulation of ARGs.30 Alternatively, maintaining a total
chlorine residual above 1.3 mg/L appears to have aided in the control of sul1 and intI1 in the
reclaimed water. Several heavy metals that could potentially co-select ARGs located on the same
genetic element or be subject to cross-resistance (i.e., same gene and corresponding cellular
function combats multiple chemicals, such as multidrug efflux pumps) or co-regulation (i.e., two
resistance regulation systems that are transcriptionally linked) were correlated with ARGs in
reclaimed water in the distribution system. Iron, copper, zinc, manganese, silver, and cobalt were
all positively correlated with qnrA (ρ=0.2546-0.4449; p≤0.0023). Cobalt, silver, and manganese
were correlated with blaTEM (ρ=0.3392-0.4184; p≤0.0018), while cobalt, arsenic, silver, and
manganese were correlated with sul1 (ρ=0.2489-0.3429; p≤0.0208). Forty-seven different ARGs
were identified from the data set that were co-located on de novo assembled scaffolds together
with metal resistance genes (Figure S5) and therefore identified to be candidates for co-selection.
The most frequent associations were between acrE and zinc resistance genes (421 scaffolds), acrA
and mexB with genes conferring resistance to copper and zinc (122, 99 scaffolds, respectively),
amrA and gold resistance genes (119 scaffolds), and AAC(6’)-Iaa, adeF, and ceoA with gold
resistance genes (90, 67, and 49 scaffolds, respectively).
A subset of potable source water, raw wastewater influent, and treated potable and
reclaimed POE samples were also screened for the presence of 14 antimicrobials using UPLC-
MS/MS. While 12 of the antibiotics were not detectable in any samples, vancomycin and
trimethoprim were both detectable in the wastewater influent of all utilities, with the exception of
Utility C, where only trimethoprim was detectable (Table S6). Vancomycin was widely removed
during treatment, with the antibiotic only detectable in the treated effluent of one of the Utility B
plants. Trimethoprim was detectable in 50% of reclaimed plant effluents. Surprisingly, both
antibiotics were detectable in the treated potable water of Utility B and trimethoprim was
detectable in that of Utility C. In samples where antibiotic concentrations were quantifiable,
trimethoprim was correlated with abundances of sul1, blaTEM, and qnrA (ρ=0.5991-0.7922,
p≤0.0121) and vancomycin was correlated with sul1, intI1, qnrA, and blaTEM (ρ=0.5894-8241,
p≤0.0128). These results suggest that there is potential for co-selection, cross-selection, or co-
regulation to select for the presence of ARGs by antibiotics of different classes in the studied
systems, though further research is needed to understand this phenomenon further.

99
Little is known about how other “non-antimicrobial” water chemistry parameters might
affect ARGs in water systems. In particular, organic carbon has been identified as a key parameter
for controlling the re-growth of bacteria in distribution systems.104,105 BDOC was positively
correlated with both blaTEM (ρ=0.3075, p=0.0023) and qnrA (ρ=0.3874, p<0.0001) in reclaimed
water, but was not correlated with any ARGs in potable water. This suggests that limiting BDOC
may be an important factor in controlling certain ARGs in distribution systems. Similarly, another
key nutrient for bacterial growth, phosphorus, was correlated with both blaTEM (ρ=0.1989-0.2977,
p≤0.0150) and qnrA (ρ=0.2423-0.2948, p≤0.0035) in both potable and reclaimed water. Together
these results suggest that limiting key growth nutrients may be an important factor for limiting
propagation of some clinically-relevant ARGs. Since not all ARGs were similarly affected by
nutrient availability, it is likely that blaTEM and qnrA are more frequently associated with bacteria
that lack the oligotrophic advantage typical of bacteria that are known to prosper in potable and
highly treated reclaimed water systems.
Implications for ARG dissemination via reclaimed water
This study provides a head-to-head comparison of ARGs in full-scale reclaimed water
distribution systems with corresponding potable water systems operated in the same communities
in the United States. Presently there is no means to directly translate ARG numbers to human
health risks, such as increased likelihood of acquiring an antibiotic resistant infection. Traditional
pathogen risk models do not factor in the dimension of microbes sharing ARGs or consider
antibiotic resistant infections as a treatment outcome.25 A significant challenge is that ARGs exist
naturally in the background of any aquatic system, with further research needed to identify ARG
targets and levels that truly pose a health risk. Profiling the occurrence of ARGs in reclaimed water
systems and benchmarking them relative to corresponding potable water systems helps to address
a key question: Do reclaimed water systems pose any greater risk than traditional potable water
systems in terms of their potential to spread antibiotic resistance? If the resistome of both
reclaimed and potable systems are comparable, then this shifts attention to broader ARG
management strategies that also encompass potable water, such as the “One Water” concept.106
sul1 was consistently elevated in reclaimed water compared to potable water, while blaTEM,
qnrA, and intI1 were each elevated in the reclaimed water of some utilities, compared to the
corresponding potable water samples. While wastewater treatment at Utility B reduced qnrA
abundances, no other ARGs were significantly removed at any treatment plants, consistent with
the notion that WWTPs are not generally designed to minimize antibiotic resistance levels and that
this has implications for water reuse. Further, association of 193 different ARGs mapped with
plasmid-associated genes suggests that there is potential for proliferation of ARGs via horizontal
gene transfer. Correlations between several ARGs and antibiotics, metals, and disinfectant
concentrations in distribution systems suggest that selection pressures are worthy of consideration
in reclaimed water. However, in contrast with a prior study of a single reclaimed distribution
system,19 this more comprehensive analysis of multiple distribution systems over several time
points did not indicate a significant trend towards increasing abundance from POE to POU of any
of the ARGs analyzed. Overall, while there were indications that horizontal gene transfer and
selection of resistant bacteria could occur in the distribution system, this did not seem to result in
a net increase in total ARGs (Figure 5-1) or the ARGs specifically targeted by qPCR (Table 5-2)
at the POU of the surveyed systems. Further, while a general pattern in reduction of diversity of

100
ARGs during distribution was noted, total abundances did not change significantly. Further
research is needed via controlled laboratory conditions to determine quantitatively the relative
contribution of selection by antibiotics and other compounds, horizontal gene transfer, microbial
community structure, and water chemistry in shaping the resistome of reclaimed water systems.
Overall, this study demonstrates that reclaimed water is distinct in its ARG content, or
“resistome,” relative to corresponding potable waters. When statistical differences were noted for
various target genes, levels were higher in samples from the reclaimed water systems. Indicators
of gene transfer, including plasmids and integrons, were also more prevalent in the reclaimed
systems. Altogether, the results indicate that further research is warranted to determine to what
extent, if any, the distinct resistome of reclaimed water may translate to human health risk.
Exposure routes relevant to non-potable water worthy of consideration include dermal contact
resulting from uses such as irrigation of athletic and recreation facilities and snowmaking, and
inhalation resulting from use of reclaimed water in cooling towers, spray irrigation, toilet flushing,
and fire suppression.107 Additional research is needed to characterize the extent to which human
exposures to reclaimed water are associated with the transmission of resistant commensal or
pathogenic microorganisms. It is also important to acknowledge that this study was molecular-
based and it cannot be discerned precisely which ARGs were present in viable microbial hosts.
Given the potential for naked DNA to be taken up downstream via transformation, the
precautionary principle advises to continue to seek economical water treatment and management
options that minimize the levels of ARGs, particularly clinically-relevant ARGs subject to
horizontal gene transfer.
ACKNOWLEDGEMENTS
We thank the participating utilities for conducting sampling and on-site data collection. This work
is supported by the National Science Foundation (NSF) Graduate Research Fellowship Program
and NSF Collaborative Research grant (CBET 1438328) and Partnership in International Research
and Education (OISE 1545756), The Alfred P. Sloan Foundation Microbiology of the Built
Environment program, the Water Environment & Research Foundation Paul L. Busch award, the
Virginia Tech Institute for Critical Technology and Applied Science Center for Science and
Engineering of the Exposome, and the American Water Works Association Abel Wolman Doctoral
Fellowship.
REFERENCES
(1) Guidelines for Water Reuse; United States Environmental Protection Agency: 2012.
(2) Jjemba, P. K.; Weinrich, L. A.; Cheng, W.; Giraldo, E.; LeChevallier, M. W. Guidance
document on the microbiological quality and biostability of reclaimed water and
distribution systems (WRF‐05‐002), WateReuse Research Foundation: Alexandria, VA,
2010.
(3) Rosario, K.; Nilsson, C.; Lim, Y. W.; Ruan, Y.; Breitbart, M. Metagenomic analysis of
viruses in reclaimed water. Environ. Microbiol. 2009, 11 (11), 2806–2820.
(4) Pruden, A. Balancing water sustainability and public health goals in the face of growing
concerns about antibiotic resistance. Environ. Sci. Technol. 2014, 48 (1), 5–14.
(5) Hong, P.-Y.; Al-Jassim, N.; Ansari, M.; Mackie, R. Environmental and Public Health

101
Implications of Water Reuse: Antibiotics, Antibiotic Resistant Bacteria, and Antibiotic
Resistance Genes. Antibiotics 2013, 2 (3), 367–399.
(6) Antibiotic Resistance Threats in the United States; U.S. Department of Health and Human
Services Centers for Disease Control and Prevention: Atlanta, GA, 2013.
(7) Global action plan on antimicrobial resistance; World Health Organization: Geneva,
Switzerland, 2015.
(8) A European One Health Action Plan against Antimicrobial Resistance; European
Commission, 2017.
(9) National Action Plan for Combating Antibiotic-Resistant Bacteria; U.S. White House:
Washington, DC, 2015.
(10) National Action Plan on Antimicrobial Resistance; Government of India, 2017.
(11) Zhu, B. Y.; Gillings, M.; Simonet, P.; Stekel, D.; Banwart, S.; Penuelas, J. Microbial mass
movements. Science 2017, 357 (6356), 1099–1100.
(12) Allen, H. K.; Donato, J.; Wang, H. H.; Cloud-Hansen, K. A; Davies, J.; Handelsman, J. Call
of the wild: antibiotic resistance genes in natural environments. Nat. Rev. Microbiol. 2010,
8 (4), 251–259.
(13) Munir, M.; Wong, K.; Xagoraraki, I. Release of antibiotic resistant bacteria and genes in
the effluent and biosolids of five wastewater utilities in Michigan. Water Res. 2011, 45 (2),
681–693.
(14) Laht, M.; Karkman, A.; Voolaid, V.; Ritz, C.; Tenson, T.; Virta, M.; Kisand, V. Abundances
of tetracycline, sulphonamide and beta-lactam antibiotic resistance genes in conventional
wastewater treatment plants (WWTPs) with different waste load. PLoS One 2014, 9 (8),
e103705.
(15) Rizzo, L.; Manaia, C.; Merlin, C.; Schwartz, T.; Dagot, C.; Ploy, M. C.; Michael, I.; Fatta-
Kassinos, D. Urban wastewater treatment plants as hotspots for antibiotic resistant bacteria
and genes spread into the environment: a review. Sci. Total Environ. 2013, 447, 345–360.
(16) Auerbach, E. A.; Seyfried, E. E.; McMahon, K. D. Tetracycline resistance genes in activated
sludge wastewater treatment plants. Water Res. 2007, 41 (5), 1143–1151.
(17) LaPara, T. M.; Burch, T. R.; McNamara, P. J.; Tan, D. T.; Yan, M.; Eichmiller, J. J. Tertiary-
treated municipal wastewater is a significant point source of antibiotic resistance genes into
Duluth-Superior Harbor. Environ. Sci. Technol. 2011, 45 (22), 9543–9549.
(18) Szczepanowski, R.; Linke, B.; Krahn, I.; Gartemann, K. H.; Gutzkow, T.; Eichler, W.;
Puhler, A.; Schluter, A. Detection of 140 clinically relevant antibiotic-resistance genes in
the plasmid metagenome of wastewater treatment plant bacteria showing reduced
susceptibility to selected antibiotics. Microbiology 2009, 155, 2306–2319.
(19) Fahrenfeld, N. L.; Ma, Y. J.; O’Brien, M.; Pruden, A. Reclaimed water as a reservoir of
antibiotic resistance genes: distribution system and irrigation implications. Front.
Microbiol. 2013, 4 (130).
(20) Barker-Reid, F.; Fox, E. M.; Faggian, R. Occurrence of antibiotic resistance genes in
reclaimed water and river water in the Werribee Basin, Australia. J. Water Health 2010, 8
(3), 521–531.
(21) Goldstein, R. E. R.; Micallef, S. A.; Gibbs, S. G.; George, A.; Claye, E.; Sapkota, A.;
Joseph, S. W.; Sapkota, A. R. Detection of vancomycin-resistant enterococci (VRE) at four
US wastewater treatment plants that provide effluent for reuse. Sci. Total Environ. 2014,
466–467, 404–411.
(22) Perron, G. G.; Whyte, L.; Turnbaugh, P. J.; Goordial, J.; Hanage, W. P.; Dantas, G.; Desai,

102
M. M. Functional Characterization of Bacteria Isolated from Ancient Arctic Soil Exposes
Diverse Resistance Mechanisms to Modern Antibiotics. PLoS One 2015, 10 (3), e0069533.
(23) Mindlin, S. Z.; Soina, V. S.; Petrova, M. A.; Gorlenko, Z. M. Isolation of antibiotic
resistance bacterial strains from Eastern Siberia permafrost sediments. Russ. J. Genet. 2008,
44 (1), 27–34.
(24) Bhullar, K.; Waglechner, N.; Pawlowski, A.; Koteva, K.; Banks, E. D.; Johnston, M. D.;
Barton, H. a; Wright, G. D. Antibiotic resistance is prevalent in an isolated cave
microbiome. PLoS One 2012, 7 (4), e34953.
(25) Ashbolt, N. J.; Amezquita, A.; Backhaus, T.; Borriello, P.; Brandt, K. K.; Collignon, P.;
Coors, A.; Finley, R.; Gaze, W. H.; Heberer, T.; et al. Human Health Risk Assessment
(HHRA) for Environmental Development and Transfer of Antibiotic Resistance. Environ.
Health Perspect. 2013, 121 (9), 993–1001.
(26) Martínez, J. L.; Coque, T. M.; Baquero, F. What is a resistance gene ? Ranking risk in
resistomes. Nat. Rev. Microbiol. 2014, 13 (2), 116–123.
(27) Zhang, Y. L.; Marrs, C. F.; Simon, C.; Xi, C. W. Wastewater treatment contributes to
selective increase of antibiotic resistance among Acinetobacter spp. Sci. Total Environ.
2009, 407 (12), 3702–3706.
(28) Schlüter, A.; Szczepanowski, R.; Pühler, A.; Top, E. M. Genomics of IncP-1 antibiotic
resistance plasmids isolated from wastewater treatment plants provides evidence for a
widely accessible drug resistance gene pool. FEMS Microbiol. Rev. 2007, 31 (4), 449–477.
(29) Czekalski, N.; Gascón Díez, E.; Bürgmann, H. Wastewater as a point source of antibiotic-
resistance genes in the sediment of a freshwater lake. ISME J. 2014, 8, 1381–1390.
(30) Karumathil, D. P.; Yin, H.-B.; Kollanoor-Johny, A.; Venkitanarayanan, K. Effect of
chlorine exposure on the survival and antibiotic gene expression of multidrug resistant
Acinetobacter baumannii in water. Int. J. Environ. Res. Public Health 2014, 11 (2), 1844–
1854.
(31) Huang, J.-J.; Hu, H.-Y.; Wu, Y.-H.; Wei, B.; Lu, Y. Effect of chlorination and ultraviolet
disinfection on tetA-mediated tetracycline resistance of Escherichia coli. Chemosphere
2013, 90 (8), 2247–2253.
(32) Kurenbach, B.; Marjoshi, D.; Amábile-cuevas, C. F.; Ferguson, G. C.; Godsoe, W.; Gibson,
P.; Heinemann, J. a. Sublethal Exposure to Commercial Formulations of the Herbicides
Changes in Antibiotic Susceptibility in Escherichia coli and Salmonella enterica serovar
Typhimurium. mBio 2015, 6 (2), e00009-15.
(33) Baker-Austin, C.; Wright, M. S.; Stepanauskas, R.; McArthur, J. V. Co-selection of
antibiotic and metal resistance. Trends Microbiol. 2006, 14 (4), 176–182.
(34) Yang, Y.; Li, B.; Zou, S.; Fang, H. H. P.; Zhang, T. Fate of antibiotic resistance genes in
sewage treatment plant revealed by metagenomic approach. Water Res. 2014, 62, 97–106.
(35) Yang, Y.; Li, B.; Ju, F.; Zhang, T. Exploring Variation of Antibiotic Resistance Genes in
Activated Sludge over a Four-Year Period through a Metagenomic Approach. Environ. Sci.
Technol. 2013, 47 (18), 10197–10205.
(36) Zhang, T.; Zhang, X. X.; Ye, L. Plasmid Metagenome Reveals High Levels of Antibiotic
Resistance Genes and Mobile Genetic Elements in Activated Sludge. PLoS One 2011, 6
(10), e26041.
(37) Kim, S.; Yun, Z.; Ha, U.-H.; Lee, S.; Park, H.; Kwon, E. E.; Cho, Y.; Choung, S.; Oh, J.;
Medriano, C. A.; et al. Transfer of antibiotic resistance plasmids in pure and activated
sludge cultures in the presence of environmentally representative micro-contaminant

103
concentrations. Sci. Total Environ. 2014, 468–469, 813–820.
(38) Wang, F. H.; Qiao, M.; Lv, Z. E.; Guo, G. X.; Jia, Y.; Su, Y. H.; Zhu, Y. G. Impact of
reclaimed water irrigation on antibiotic resistance in public parks, Beijing, China. Environ.
Pollut. 2014, 184, 247–253.
(39) Wang, F.; Qiao, M.; Su, J.; Chen, Z.; Zhou, X.; Zhu, Y. High Throughput Profiling of
Antibiotic Resistance Genes in Urban Park Soils with Reclaimed Water Irrigation. Environ.
Sci. Technol. 2014, 48, 9079-9085.
(40) Han, X. M.; Hu, H. W.; Shi, X. Z.; Wang, J. T.; Han, L. L.; Chen, D.; He, J. Z. Impacts of
reclaimed water irrigation on soil antibiotic resistome in urban parks of Victoria, Australia.
Environ. Pollut. 2016, 211, 48–57.
(41) McLain, J. E.; Williams, C. F. Sustainability of Water Reclamation: Long-Term Recharge
with Reclaimed Wastewater Does Not Enhance Antibiotic Resistance in Sediment Bacteria.
Sustainability 2014, 6 (3), 1313–1327.
(42) Bockelmann, U.; Dorries, H. H.; Ayuso-Gabella, M. N.; de Marcay, M. S.; Tandoi, V.;
Levantesi, C.; Masciopinto, C.; Van Houtte, E.; Szewzyk, U.; Wintgens, T.; et al.
Quantitative PCR Monitoring of Antibiotic Resistance Genes and Bacterial Pathogens in
Three European Artificial Groundwater Recharge Systems. Appl. Environ. Microbiol. 2009,
75 (1), 154–163.
(43) Ryu, H.; Alum, A.; Abbaszadegan, M. Microbial Characterization and Population Changes
in Nonpotable Reclaimed Water Distribution Systems. Environ. Sci. Technol. 2005, 39 (22),
8600–8605.
(44) Jjemba, P. K.; Weinrich, L. a.; Cheng, W.; Giraldo, E.; LeChevallier, M. W. Regrowth of
potential opportunistic pathogens and algae in reclaimed-water distribution systems. Appl.
Environ. Microbiol. 2010, 76 (13), 4169–4178.
(45) Wingender, J.; Flemming, H.-C. Biofilms in drinking water and their role as reservoir for
pathogens. Int. J. Hyg. Environ. Health 2011, 214 (6), 417–423.
(46) Hausner, M.; Wuertz, S. High rates of conjugation in bacterial biofilms as determined by
quantitative in situ analysis. Appl. Environ. Microbiol. 1999, 65 (8), 3710–3713.
(47) Costa, V. M. D.; Mcgrann, K. M.; Hughes, D. W.; Gerard, D.; Science, S.; Series, N.; Jan,
N. Sampling the Antibiotic Resistome. Science 2014, 311, 374–377.
(48) American Public Health Association (APHA). Standard Methods for the Examination of
Water and Wastewater; American Water Works Association, Water Environment
Federation, 2005.
(49) Servais, P.; A. Anzil; Ventresque, C. Simple method for determination of biodegradable
dissolved organic carbon in water. Appl. Environ. Microbiol. 1989, 55 (10), 2732–2734.
(50) Sui, Q.; Huang, J.; Deng, S.; Chen, W.; Yu, G. Seasonal Variation in the Occurrence and
Removal of Pharmaceuticals and Personal Care Products in Different Biological
Wastewater Treatment Processes. Environ. Sci. Technol. 2011, 45, 3341–3348.
(51) Suzuki, M. T.; Taylor, L. T.; DeLong, E. F. Quantitative analysis of small-subunit rRNA
genes in mixed microbial populations via 5’-nuclease assays. Appl. Environ. Microbiol.
2000, 66 (11), 4605–4614.
(52) Bibbal, D.; Dupouy, V.; Ferre, J. P.; Toutain, P. L.; Fayet, O.; Prere, M. F.; Bousquet-
Melou, A. Impact of three ampicillin dosage regimens on selection of ampicillin resistance
in Enterobacteriaceae and excretion of bla(TEM) genes in swine feces. Appl. Environ.
Microbiol. 2007, 73 (15), 4785–4790.
(53) Colomer-Lluch, M.; Jofre, J.; Muniesa, M. Quinolone resistance genes (qnrA and qnrS) in

104
bacteriophage particles from wastewater samples and the effect of inducing agents on
packaged antibiotic resistance genes. J. Antimicrob. Chemother. 2014, 69 (5), 1265–1274.
(54) Dutka-Malen, S.; Evers, S.; Courvalin, P. Detection of glycopeptide resistance genotypes
and identification to the species level of clinically relevant enterococci by PCR. J. Clin.
Microbiol. 1995, 33 (1), 24–27.
(55) Pei, R. T.; Kim, S. C.; Carlson, K. H.; Pruden, A. Effect of River Landscape on the sediment
concentrations of antibiotics and corresponding antibiotic resistance genes (ARG). Water
Res. 2006, 40 (12), 2427–2435.
(56) Hardwick, S. A.; Stokes, H. W.; Findlay, S.; Taylor, M.; Gillings, M. R. Quantification of
class 1 integron abundance in natural environments using real-time quantitative PCR.
FEMS Microbiol. Lett. 2008, 278 (2), 207–212.
(57) Pruden, A.; Arabi, M.; Storteboom, H. N. Correlation Between Upstream Human Activities
and Riverine Antibiotic Resistance Genes. Environ. Sci. Technol. 2012, 46 (21), 11541–
11549.
(58) Huovinen, P.; Sundstrom, L.; Swedberg, G.; Skold, O. Trimethoprim and sulfonamide
resistance. Antimicrob. Agents Chemother. 1995, 39 (2), 279–289.
(59) Garner, E.; Benitez, R.; Wagoner, E. Von; Sawyer, R.; Schaberg, E.; Hession, W. C.;
Krometis, L. H.; Badgley, B. D.; Pruden, A. Stormwater loadings of antibiotic resistance
genes in an urban stream. Water Res. 2017, 123, 144–152.
(60) Arango-Argoty, G.; Singh, G.; Heath, L. S.; Pruden, A.; Xiao, W.; Zhang, L. MetaStorm:
A public resource for customizable metagenomics annotation. PLoS One 2016, 11 (9), 1–
13.
(61) McArthur, A. G.; Waglechner, N.; Nizam, F.; Yan, A.; Azad, M. a.; Baylay, A. J.; Bhullar,
K.; Canova, M. J.; De Pascale, G.; Ejim, L.; et al. The comprehensive antibiotic resistance
database. Antimicrob. Agents Chemother. 2013, 57 (7), 3348–3357.
(62) Quast, C.; Pruesse, E.; Yilmaz, P.; Gerken, J.; Schweer, T.; Yarza, P.; Peplies, J.; Glockner,
F. O. The SILVA ribosomal RNA gene database project: improved data processing and
web-based tools. Nucleic Acids Res. 2013, 41, D590–D596.
(63) Pal, C.; Bengtsson-Palme, J.; Rensing, C.; Kristiansson, E.; Larsson, D. G. J. BacMet:
antibacterial biocide and metal resistance genes database. Nucleic Acids Res. 2014, 42,
D737–D743.
(64) Leplae, R.; Hebrant, A.; Wodak, S. J.; Toussaint, A. ACLAME: a CLAssification of Mobile
genetic Elements. Nucleic Acids Res. 2004, 32, D45-D49.
(65) Li, B.; Yang, Y.; Ma, L.; Ju, F.; Guo, F.; Tiedje, J. M.; Zhang, T. Metagenomic and network
analysis reveal wide distribution and co-occurrence of environmental antibiotic resistance
genes. ISME J. 2015, 1–13.
(66) Meyer, F.; Paarmann, D.; D’Souza, M.; Olson, R.; Glass, E. M.; Kubal, M.; Paczian, T.;
Rodriguez, A.; Stevens, R.; Wilke, A.; et al. The metagenomics RAST server - a public
resource for the automatic phylogenetic and functional analysis of metagenomes. BMC
Bioinformatics 2008, 9 (386).
(67) Caporaso, J. G.; Lauber, C. L.; Walters, W. A.; Berg-Lyons, D.; Huntley, J.; Fierer, N.;
Owens, S. M.; Betley, J.; Fraser, L.; Bauer, M.; et al. Ultra-high-throughput microbial
community analysis on the Illumina HiSeq and MiSeq platforms. ISME J. 2012, 6 (8),
1621–1624.
(68) Caporaso, J. G.; Kuczynski, J.; Stombaugh, J.; Bittinger, K.; Bushman, F. D.; Costello, E.
K.; Fierer, N.; Pena, A. G.; Goodrich, J. K.; Gordon, J. I.; et al. QIIME allows analysis of

105
high-throughput community sequencing data. Nat. Methods 2010, 7 (5), 335–336.
(69) DeSantis, T. Z.; Hugenholtz, P.; Larsen, N.; Rojas, M.; Brodie, E. L.; Keller, K.; Huber, T.;
Dalevi, D.; Hu, P.; Andersen, G. L. Greengenes, a chimera-checked 16S rRNA gene
database and workbench compatible with ARB. Appl. Environ. Microbiol. 2006, 72 (7),
5069–5072.
(70) Kindt, R.; Legendre, P.; Hara, B. O.; Simpson, G. L.; Stevens, M. H. H.; Wagner, H. The
vegan Package. 2008.
(71) Critically Important Antimicrobials for Human Medicine; World Health Organization:
Geneva, Switzerland, 2017.
(72) Czekalski, N.; Berthold, T.; Caucci, S.; Egli, A.; Bürgmann, H. Increased levels of
multiresistant bacteria and resistance genes after wastewater treatment and their
dissemination into Lake Geneva, Switzerland. Front. Microbiol. 2012, 3 (106).
(73) Mao, D.; Yu, S.; Rysz, M.; Luo, Y.; Yang, F.; Li, F.; Hou, J.; Mu, Q.; Alvarez, P. J. J.
Prevalence and proliferation of antibiotic resistance genes in two municipal wastewater
treatment plants. Water Res. 2015, 85, 458–466.
(74) Yuan, Q.; Guo, M.; Wei, W.; Yang, J. Reductions of bacterial antibiotic resistance through
five biological treatment processes treated municipal wastewater. Environ. Sci. Pollut. Res.
2016, 19495–19503.
(75) Lee, J.; Hun, J.; Shin, J.; Min, H.; Kim, S.; Seok, M.; Mo, Y. Quantitative and qualitative
changes in antibiotic resistance genes after passing through treatment processes in
municipal wastewater treatment plants. Sci. Total Environ. 2017, 605–606, 906–914.
(76) Xu, J.; Xu, Y.; Wang, H.; Guo, C.; Qiu, H.; He, Y.; Zhang, Y.; Li, X.; Meng, W. Occurrence
of antibiotics and antibiotic resistance genes in a sewage treatment plant and its effluent-
recieving river. Chemosphere 2015, 119, 1379–1385.
(77) Yoon, Y.; Jung, H.; Yoong, D.; Di, W.; Dodd, M. C.; Hur, H.; Lee, Y. Inactivation
efficiency of plasmid-encoded antibiotic resistance genes during water treatment with
chlorine, UV, and UV/H2O2. Water Res. 2017, 123, 783-793.
(78) Alexander, J.; Knopp, G.; Dötsch, A.; Wieland, A.; Schwartz, T. Ozone treatment of
conditioned wastewater selects antibiotic resistance genes, opportunistic bacteria , and
induce strong population shifts. Sci. Total Environ. 2016, 559, 103–112.
(79) Ferro, G.; Guarino, F.; Castiglione, S.; Rizzo, L. Antibiotic resistance spread potential in
urban wastewater effluents disinfected by UV/H2O2 process. Sci. Total Environ. 2016, 560–
561, 29–35.
(80) Xu, L.; Ouyang, W.; Qian, Y.; Su, C.; Su, J.; Chen, H. High-throughput profiling of
antibiotic resistance genes in drinking water treatment plants and distribution systems.
Environ. Pollut. 2016, 213, 119–126.
(81) Durso, L. M.; Miller, D. N.; Wienhold, B. J. Distribution and Quantification of Antibiotic
Resistant Genes and Bacteria across Agricultural and Non-Agricultural Metagenomes.
PLoS One 2012, 7 (11), e48325.
(82) Forsberg, K. J.; Patel, S.; Gibson, M. K.; Lauber, C. L.; Knight, R.; Fierer, N.; Dantas, G.
Bacterial phylogeny structures soil resistomes across habitats. Nature 2014, 509, 612–616.
(83) Gibson, M. K.; Forsberg, K. J.; Dantas, G. Improved annotation of antibiotic resistance
determinants reveals microbial resistomes cluster by ecology. ISME J. 2014, 1–10.
(84) Su, J.; Ouyang, W.; Wei, B.; Huang, F.; Zhao, Y.; Xu, H.; Zhu, Y.-G. Antibiotic resistome
and its association with bacterial communities during sewage sludge composting. Environ.
Sci. Technol. 2015, 7356-7363.

106
(85) Aminov, R. I. Horizontal gene exchange in environmental microbiota. Front. Microbiol.
2011, 2, 1-19.
(86) Sekizuka, T.; Matsui, M.; Yamane, K.; Takeuchi, F.; Ohnishi, M.; Hishinuma, A.; Arakawa,
Y.; Kuroda, M. Complete sequencing of the blaNDM-1-positive IncA/C plasmid from
Escherichia coli ST38 isolate suggests a possible origin from plant pathogens. PLoS One
2011, 6 (9), e25334.
(87) Wright, G. D. Antibiotic resistance in the environment: a link to the clinic? Curr. Opin.
Microbiol. 2010, 13 (5), 589–594.
(88) Forsberg, K. J.; Reyes, A.; Wang, B.; Selleck, E. M.; Sommer, M. O. A.; Dantas, G. The
Shared Antibiotic Resistome of Soil Bacteria and Human Pathogens. Science 2012, 337,
1107–1111.
(89) Gillings, M. R.; Gaze, W. H.; Pruden, A.; Smalla, K.; Tiedje, J. M.; Zhu, Y.-G. Using the
class 1 integron-integrase gene as a proxy for anthropogenic pollution. ISME J. 2014, 1–11.
(90) Madsen, J. S.; Burmolle, M.; Hansen, L. H.; Sorensen, S. J. The interconnection between
biofilm formation and horizontal gene transfer. FEMS Immunol. Med. Microbiol. 2012, 65
(2), 183–195.
(91) Shrestha, B.; Tada, T.; Miyoshi-Akiyama, T.; Shimada, K.; Ohara, H.; Kirikae, T.; Pokhrel,
B. M. Identification of a novel NDM variant, NDM-13, from a multidrug-resistant
Escherichia coli clinical isolate in Nepal. Antimicrob. Agents Chemother. 2015, 59 (9),
5847–5850.
(92) Shakibaie, M. R.; Jalilzadeh, K. A.; Yamakanamardi, S. M. Horizontal transfer of antibiotic
resistance genes among gram negative bacteria in sewage and lake water and influence of
some physico-chemical parameters of water on conjugation process. J. Environ. Biol. 2009,
30 (1), 45–49.
(93) Liu, A.; Fong, A.; Becket, E.; Yuan, J.; Tamae, C.; Medrano, L.; Maiz, M.; Wahba, C.; Lee,
C.; Lee, K.; et al. Selective advantage of resistant strains at trace levels of antibiotics: a
simple and ultrasensitive color test for detection of antibiotics and genotoxic agents.
Antimicrob. Agents Chemother. 2011, 55 (3), 1204–1210.
(94) McVicker, G.; Prajsnar, T. K.; Williams, A.; Wagner, N. L.; Boots, M.; Renshaw, S. a;
Foster, S. J. Clonal expansion during Staphylococcus aureus infection dynamics reveals the
effect of antibiotic intervention. PLoS Pathog. 2014, 10 (2), e1003959.
(95) Andersson, D. I.; Hughes, D. Evolution of antibiotic resistance at non-lethal drug
concentrations. Drug Resist. Updat. 2012, 15 (3), 162–172.
(96) Gullberg, E.; Cao, S.; Berg, O. G.; Ilbäck, C.; Sandegren, L.; Hughes, D.; Andersson, D. I.
Selection of resistant bacteria at very low antibiotic concentrations. PLoS Pathog. 2011, 7
(7), e1002158.
(97) Gullberg, E.; Albrecht, L. M.; Karlsson, C.; Sandegren, L.; Andersson, D. I. Selection of a
Multidrug Resistance Plasmid by Sublethal Levels of Antibiotics and Heavy Metals. mBio
2014, 5 (5), 19–23.
(98) Zhang, P. Y.; Xu, P. P.; Xia, Z. J.; Wang, J.; Xiong, J.; Li, Y. Z. Combined treatment with
the antibiotics kanamycin and streptomycin promotes the conjugation of Escherichia coli.
FEMS Microbiol. Lett. 2013, 348 (2), 149–156.
(99) Xia, Z. J.; Wang, J.; Hu, W.; Liu, H.; Gao, X. Z.; Wu, Z. H.; Zhang, P. Y.; Li, Y. Z.
Improving conjugation efficacy of Sorangium cellulosum by the addition of dual selection
antibiotics. J. Ind. Microbiol. Biotechnol. 2008, 35 (10), 1157–1163.
(100) Song, B.; Wang, G. R.; Shoemaker, N. B.; Salyers, A. A. An Unexpected Effect of

107
Tetracycline Concentration: Growth Phase-Associated Excision of the Bacteroides
Mobilizable Transposon NBU1. J. Bacteriol. 2009, 191 (3), 1078–1082.
(101) Úbeda, C.; Maiques, E.; Knecht, E.; Lasa, Í.; Novick, R. P.; Penadés, J. R. Antibiotic-
induced SOS response promotes horizontal dissemination of pathogenicity island-encoded
virulence factors in staphylococci. Mol. Microbiol. 2005, 56 (3), 836–844.
(102) Prudhomme, M.; Attaiech, L.; Sanchez, G.; Martin, B.; Claverys, J. P. Antibiotic stress
induces genetic transformability in the human pathogen Streptococcus pneumoniae. Science
2006, 313 (5783), 89–92.
(103) Beaber, J. W.; Hochhut, B.; Waldor, M. K. SOS response promotes horizontal
dissemination of antibiotic resistance genes. Nature 2004, 427, 72–74.
(104) Kooij, D. Van Der. Assimilable Organic Carbon as an Indicator of Bacterial Regrowth. J.
Am. Water Work. Assoc. 1992, 57–65.
(105) Williams, K.; Pruden, A.; Falkinham, J.; Edwards, M. Relationship between Organic
Carbon and Opportunistic Pathogens in Simulated Glass Water Heaters. Pathogens 2015, 4
(2), 355–372.
(106) Blueprint for One Water; Water Research Foundation; 2017.
(107) Garner, E.; Zhu, N.; Strom, L.; Edwards, M.; Pruden, A. A human exposome framework
for guiding risk management and holistic assessment of recycled water quality. Environ.
Sci. Water Res. Technol. 2016, 2, 580-598.

108
SUPPLEMENTARY MATERIAL FOR CHAPTER 5
Antibiotic Analysis
Antibiotics were extracted from water samples using solid phase extraction according to
Sui et al.,1 with minor modifications. A volume of 500 mL water sample filtered through glass
microfiber filter paper (Whatman grade GF/F, GE Healthcare Bio-Sciences, PA) was first adjusted
to pH=7 and then introduced to a solid phase extraction cartridge (Oasis HLB Cartridges, 60 mg
sorbent; Waters, Milford, MA), pre-conditioned with 3 mL of methanol and 3 mL of MilliQ water.
The water was passed through a cartridge at an approximate rate of 5 mL min-1. After loading a
water sample, the cartridge was first washed with MilliQ water and then vacuum dried for 10
minutes. The target analytes were eluted off each cartridge with 3 mL methanol at a flow rate of 5
mL min-1. Each eluent was dried at 40°C under N2 gas (RapidVap N2 Evaporation Systems,
Labconco Corp., MO), reconstituted with 1 mL 90% acetonitrile, filtered through a 0.2 µm PTFE
syringe filter (Fisher, Pittsburgh, PA) into a 2 mL amber glass HPLC vial, and then analyzed using
an ultra-performance liquid chromatography-tandem mass spectrometer (UPLC/MS/MS) (Agilent
1290 UPLC/Agilent 6490 Triple Quad tandem mass spectrometry, Agilent Technologies Inc.,
Santa Clara, CA).
Each antibiotic was identified and its peak area quantified under multiple reaction
monitoring mode (MRM), which is achieved by specifying the precursor and two product ions
formed after fragmentation with particular collision energies.2 A Zorbax Extend C18 analytical
column (4.6 × 50 mm, 5 µm particle size) coupled with a Zorbax Extend C18 guard column (4.6
× 12 mm, 5 µm particle size) was used for chromatographic separation. The temperature of the
column oven was kept at 40 °C. Separation was achieved with a gradient elution consisting of two
mobile phases (A: 0.1% formic acid in water; B: 0.1% formic acid in 95% acetonitrile) at a flow
rate of 0.5 mL min-1. The mobile phase gradient was programed as: 0-4.5 min (Isocratic elution):
90% of A and 10% of B; 4.6-10.0 min (Gradient elution): change from 90% of A and 10% of B to
0% A and 100% of B; 10.1-14.0 min (Purging): 0% of A and 100% of B, and 14.1-18 min (Re-
equilibration): 90% of A and 10% of B.
The sample injection volume was 10 µL. Each sample was analyzed three times. Mill-Q
water was extracted, as a laboratory system blank control, using the same procedure and no
antibiotics were detected in these blanks. All water samples were extracted, cleaned up, and
analyzed on the UPLC/MS/MS within the same batch, making it possible to compare the relative
quantity of each antibiotic across different samples using the peak area of each analyte. This
approach enables fast screening of a large set of antibiotics and eliminates the need of costly
absolute quantification of each analyte using expensive standards. The use of UPLC-MS/MS for
screening was reported in a semi-quantitative screening method for the 14 antibiotics in the
collected wastewater. Any measurements that fell below a signal-to-noise ratio of 3 was
considered non-detect.
Quantification of antibiotic resistance genes
To construct standards for each gene, wastewater samples were amplified with each primer
set via PCR and analyzed via gel electrophoresis. The sequence of target gene amplicons of the

109
appropriate length were confirmed via Sanger Sequencing conducted at the Biocomplexity
Institute of Virginia Tech Genomics Sequencing Center (Blacksburg, VA). Confirmed amplicons
were cloned into plasmids using a TOPO TA cloning kit (Thermo Fisher Scientific, Waltham,
MA). Standards were then generated and quantified as described previously.3 The specificity of
all assays in wastewater or fecal samples has been previously documented3–8 and, when
appropriate, melt curves were closely monitored to ensure that melt temperature of amplicons
corresponded with standards. Standard curve R2 values and efficiencies are presented for each
gene assay in Table S7.
References
(1) Sui, Q.; Huang, J.; Deng, S.; Chen, W.; Yu, G. Seasonal Variation in the Occurrence and
Removal of Pharmaceuticals and Personal Care Products in Different Biological
Wastewater Treatment Processes. Env. Sci. Technol. 2011, 45, 3341–3348.
(2) Naegele, E. Detection of Trace Level Pharmaceuticals in Drinking Water by Online SPE
Enrichment with the Agilent 1200 Infinity Series Online-SPE Solution. 2013.
(3) Pei, R. T.; Kim, S. C.; Carlson, K. H.; Pruden, A. Effect of River Landscape on the sediment
concentrations of antibiotics and corresponding antibiotic resistance genes (ARG). Water
Res. 2006, 40 (12), 2427–2435.
(4) Suzuki, M. T.; Taylor, L. T.; DeLong, E. F. Quantitative analysis of small-subunit rRNA
genes in mixed microbial populations via 5 ’-nuclease assays. Appl. Environ. Microbiol.
2000, 66 (11), 4605–4614.
(5) Bibbal, D.; Dupouy, V.; Ferre, J. P.; Toutain, P. L.; Fayet, O.; Prere, M. F.; Bousquet-
Melou, A. Impact of three ampicillin dosage regimens on selection of ampicillin resistance
in Enterobacteriaceae and excretion of bla(TEM) genes in swine feces. Appl. Environ.
Microbiol. 2007, 73 (15), 4785–4790.
(6) Dutka-Malen, S.; Evers, S.; Courvalin, P. Detection of glycopeptide resistance genotypes
and identification to the species level of clinically relevant enterococci by PCR. J. Clin.
Microbiol. 1995, 33 (1), 24–27.
(7) Colomer-Lluch, M.; Jofre, J.; Muniesa, M. Quinolone resistance genes (qnrA and qnrS) in
bacteriophage particles from wastewater samples and the effect of inducing agents on
packaged antibiotic resistance genes. J. Antimicrob. Chemother. 2014, 69 (5), 1265–1274.
(8) Hardwick, S. A.; Stokes, H. W.; Findlay, S.; Taylor, M.; Gillings, M. R. Quantification of
class 1 integron abundance in natural environments using real-time quantitative PCR. FEMS
Microbiol. Lett. 2008, 278 (2), 207–212.

110
Table S1: Seasonal sample collection dates for each utility
Utility
A B C D
Spring May 11-21,
2015
June 2-3, 2015
June 4-11,
2015
May 18-19,
2015
Summer August 11-20,
2014
July 30-August
11, 2014
September 30-
October 1,
2015
August 10-11,
2015
Fall October 27-
November 5,
2014
September 29-
30, 2015
October 7-9,
2014
October 20,
2015
Winter February 2-11,
2015
October 20-22,
2014*
February 12-
19, 2015
February 23-
24, 2015
*Utility B’s reclaimed system is shut down for the winter, so a winter collection was not
possible. Samples were collected just before the system was shut down for the winter
Figure S1: Comparison of absolute abundances (normalized to milliltiers of water or biofilm swab)
of the sul1 gene determined by two methods: qPCR versus shotgun metagenomics modified by
multiplication of 16S rRNA gene abundances (determined by qPCR). This analysis demonstrates
that the modified metagenomic method results in sul1 gene abundances that are strongly correlated
with the highly quantitative values produced by qPCR Spearman’s ρ = 0.6411, p<0.001). Sample
labels represent Utility - System type (D=potable; R=reclaimed) - Sample (POE=point of entry;
POU=point of use; INF=raw wastewater influent) - Season (Sp=Spring; Su=Summer; F=Fall;
W=Winter) - Matrix (W=water; B=biofilm)

111
Table S2: List of shotgun metagenomic sequenced samples, MG-RAST sample IDs, and assembly information
System
Type Matrix Utility
Sample
Type Season Sample Name
Paired-
end reads
MG-
RAST
Sample ID
N50 Number
scaffolds
Average
scaffold
length
Drinking biofilm A POU Su Drinkingwater_biofilm_ UtilityA_S5_L1S10
5,412,528 mgs295574 4,760 94,299 1,465
Drinking bulk water A POU Su Drinkingwater_bulkwater_ UtilityA_S5_L1S6
5,887,968 mgs295565 7,474 121,193 1,439
Drinking bulk water B POE Su Drinkingwater_bulkwater_ UtilityB_S0_1
38,668,577 mgs458886 22,674 43,273 1,360
Drinking bulk water B POE Su Drinkingwater_bulkwater_ UtilityB_S0_1_duplicate
32,868,754 mgs458889 4,585 54,477 1,262
Reclaimed bulk water A Influent Su Reclaimedwater_bulkwater_UtilityA_-1_1
7,132 mgs458922 927 351,988 748
Reclaimed bulk water A POE F Reclaimedwater_bulkwater_UtilityA_S0_2
51,423,687 mgs458874 2,687 63,023 971
Reclaimed bulk water A POE W Reclaimedwater_bulkwater_UtilityA_S0_3
12,036,240 mgs458865 1,530 56,797 982
Reclaimed bulk water A POE Sp Reclaimedwater_bulkwater_UtilityA_S0_4
4,274,193 mgs458868 32,255 43,020 2,244
Reclaimed bulk water A POE Su Reclaimedwater_bulkwater_UtilityA_S0_L1S2
742,276 mgs295556 2,453 18,883 1,159
Reclaimed biofilm A POU Su Reclaimedwater_biofilm_ UtilityA_S5_L1S9
32,082,202 mgs466972 1,324 162,693 929
Reclaimed bulk water A POU F Reclaimedwater_bulkwater_UtilityA_S5_2
40,816,121 mgs458880 2,376 83,117 1,118
Reclaimed bulk water A POU W Reclaimedwater_bulkwater_UtilityA_S5_3
43,183,835 mgs458907 2,276 143,562 1,116
Reclaimed bulk water A POU Sp Reclaimedwater_bulkwater_UtilityA_S5_4
43,580,278 mgs458913 2,322 213,956 1,209
Reclaimed bulk water A POU Su Reclaimedwater_bulkwater_UtilityA_S5_L1S5
3,827,661 mgs295562 2,260 170,551 1,179
Reclaimed bulk water B Influent Su Reclaimedwater_bulkwater_UtilityB_-1_1
39,243,688 mgs458937 1,024 206,090 775
Reclaimed bulk water B POE W Reclaimedwater_bulkwater_UtilityB_S0_2
24,153,588 mgs458940 993 101,493 770
Reclaimed bulk water B POE Sp Reclaimedwater_bulkwater_UtilityB_S0_3
20,416,825 mgs458943 1,073 68,192 814
Reclaimed bulk water B POE F Reclaimedwater_bulkwater_UtilityB_S0_4
48,463,674 mgs458931 1,334 187,500 894
Reclaimed bulk water B POE Su Reclaimedwater_bulkwater_UtilityB_S0_L1S1
4,726,224 mgs295553 1,000 99,628 794
Reclaimed biofilm B POU Su Reclaimedwater_biofilm_ UtilityB_S5_L1S7
191,192 mgs295568 837 6,656 700
Reclaimed bulk water B POU W Reclaimedwater_bulkwater_UtilityB_S5_2
28,668,559 mgs458925 9,297 56,227 1,952
Reclaimed bulk water B POU Sp Reclaimedwater_bulkwater_UtilityB_S5_3
39,378,131 mgs458871 1,383 9,782 890
Reclaimed bulk water B POU F Reclaimedwater_bulkwater_UtilityB_S5_4
18,232,136 mgs458877 2,887 83,141 1,124
Reclaimed bulk water B POU Su Reclaimedwater_bulkwater_UtilityB_S5_L1S3
4,530,935 mgs295559 3,170 104,347 1,331
Reclaimed bulk water C Influent Sp Reclaimedwater_bulkwater_UtilityC_-1_3
20,146,190 mgs458934 958 66,992 755

112
Reclaimed bulk water C POE Sp Reclaimedwater_bulkwater_UtilityC_S0_3
33,224 mgs458892 1,314 241,370 864
Reclaimed bulk water C POE Su Reclaimedwater_bulkwater_UtilityC_S0_4
32,079,119 mgs458883 1,691 123,451 892
Reclaimed bulk water C POE F Reclaimedwater_bulkwater_UtilityC_S0_L1S11
5,300,338 mgs295577 5,659 12,092 946
Reclaimed bulk water C POU Sp Reclaimedwater_bulkwater_UtilityC_S5_3
40,009,882 mgs458904 1,293 240,845 908
Reclaimed bulk water C POU Su Reclaimedwater_bulkwater_UtilityC_S5_4
33,917,149 mgs458895 1,455 152,566 906
Reclaimed bulk water D Influent Su Reclaimedwater_bulkwater_UtilityD_-1_3
36,097,736 mgs458916 877 192,239 728
Reclaimed bulk water D POE W Reclaimedwater_bulkwater_UtilityD_S0_1
40,363,707 mgs458919 1,046 216,558 795
Reclaimed bulk water D POE Sp Reclaimedwater_bulkwater_UtilityD_S0_2
35,768,857 mgs458910 1,207 188,909 831
Reclaimed bulk water D POE Su Reclaimedwater_bulkwater_UtilityD_S0_3
37,816,330 mgs458898 1,133 227,064 807
Reclaimed bulk water D POU W Reclaimedwater_bulkwater_UtilityD_S5_1
44,493,192 mgs458901 2,169 190,094 1,116
Reclaimed bulk water D POU Sp Reclaimedwater_bulkwater_UtilityD_S5_2
35,693,403 mgs458946 1,142 174,840 810
Reclaimed bulk water D POU Sp Reclaimedwater_bulkwater_UtilityD_S5_2_duplicate
21,616,266 mgs458949 983 119,681 769
Reclaimed bulk water D POU Su Reclaimedwater_bulkwater_UtilityD_S5_3
5,181 mgs458862 4,275 66,607 1,316
Reclaimed bulk water D POU F Reclaimedwater_bulkwater_UtilityD_S5_4
24,947,026 mgs458928 990 150,711 791

113
Table S3: List of samples analyzed via 16S rRNA sequencing and included in the analysis of
correlations between ARGs and the overall microbial community or individual phyla. All samples
collected in this study were prepared for sequencing. Some samples were excluded from
sequencing if insufficient DNA could be obtained or if other QA/QC requirements (i.e. excessive
negative control amplification) were not met after three amplification attempts. Samples produced
an average of 63,864±43,264 reads.
Utility Type Season Site Matrix Number samples sequenced
A
Potable
Su
POE W 1
POU W 10
B 10
S W 2
W
POE W 1
POU W 7
B 8
W POE W 1
POU W 10
Sp POE W 1
POU W 9
Reclaimed
Su
INW W 2
POE W 2
POU W 10
B 10
W
POE W 2
POU W 10
B 2
W
POE W 2
POU W 9
B 10
Sp POE W 2
POU W 10
B
Potable
Su
POE W 1
POU W 6
B 5
S W 2
W
POE W 1
POU W 5
B 4
Sp POU W 2
W POU W 3
Reclaimed
Su
INW W 2
POE W 2
POU W 6
B 4
W POE W 2
POU W 5

114
B 4
So
POE W 2
POU W 5
POU B 4
W
POE W 2
POU W 4
B 3
C
Potable
W
POE W 1
POU W 5
S W 3
Sp POE W 1
SU POU W 3
Reclaimed
W
INW W 1
POE W 1
POU W 7
W POU W 1
Sp POE W 1
POU W 5
Su POE W 1
POU W 5
D
Potable
Sp POU W 4
Su POE W 1
POU W 4
W POE W 1
POU W 5
Reclaimed
W POE W 1
POU W 5
Sp POE W 1
POU W 5
Su POE W 1
POU W 5
W POU W 5
Field Blank 9
DNA Extraction Blank 2
PCR Blank 5
Abbreviations: Season (Sp=Spring; Su=Summer; F=Fall; W=Winter), Sample (POE=point of
entry; POU=point of use; INF=raw wastewater influent; S=source water), Matrix (W=water;
B=biofilm)

115
Figure S2: Nonmetric multidimensional scaling (NMDS) plot generated from Bray-Curtis
similarity matrix of all metagenomic ARG abundances by utility and system type.

116
Table S4: Frequency of qPCR detection and relative abundance of ARGs (normalized to 16S
rRNA genes; log(ARG copies/16S rRNA gene copies)) in potable and reclaimed water and biofilm
samples at the point of entry (POE) and point of use (POU); average (standard deviation) of values
above the limit of quantification. Values for each sampling location include four sampling events.
blaTEM intI1 qnrA vanA sul1
POE - water
Potable
A (n=3) 33%; -3.0(0.0) 33%; 1.5(0.0) ND ND ND
B (n=4) ND 25%; -2.2(0.0) ND 50%; -4.6(-4.9) 25%; -4.0(0.0)
C (n=4) 25%; -1.7(0.0) 25%; 1.2(0.0) ND ND ND
D (n=4) ND ND 25%; -1.6(0.0) ND ND
Reclaimed
A (n=7) 14%; -3.9(0.0) 57%; 0.8(1.1) ND 14%; -3.0(0.0) 100%; 0.2(0.4)
B (n=7) 43%; -4.0(-3.9) 29%; -0.2(-0.1) ND ND 100%; -1.6(-1.6)
C (n=4) 50%; -4.3(-4.9) 50%; 1.0(0.6) ND ND 50%; -0.4(-0.8)
D (n=4) 75%; -4.4(-4.4) 25%; -0.8(0.0) 75%; -4.8(-5.3) ND 100%; -1.0(-1.0)
POU - water
Potable
A (n=44) 23%; -0.6(-0.2) 25%; 1.6(1.9) 2%; -2.8(0.0) 11%; -2.1(-2.1) 18%; 1.5(1.9)
B (n=21) 19%; -1.9(-1.7) 19%; 1.0(1.0) ND 14%; -1.4(-1.2) 19%; -0.9(-0.7)
C (n=15) ND ND ND ND 47%; -0.4(-0.5)
D (n=20) ND ND ND ND 5%; -0.8(0.0)
Reclaimed
A (n=38) 18%; -3.4(-3.0) 71%; -0.1(0.1) ND ND 92%; -0.1(0.2)
B (n=17) 12%; -2.2(0.0) 53%; -0.7(-0.6) ND 6%; -2.6(0.0) 88%; 4.8(5.3)
C (n=17) 18%; -4.7(-4.6) 53%; -0.2(-0.2) 6%; -6.0(0.0) ND 59%; -0.2(-0.3)
D (n=20) 80%; -4.1(-4.1) 55%; -0.8(-0.8) 45%; -4.7(-4.7) ND 100%; -0.7(-0.4)
POU - biofilm
Potable
A (n=40) 18%; -2.3(-2.4) 20%; 1(1.3) ND 5%; -3.1(-3.2) 15%; 0.6(0.9)
B (n=21) 10%; -2.4(-2.3) ND 5%; -2.3(0.0) 10%; -1.9(-2.2) 24%; -0.2(0.1)
Reclaimed
A (n=33) 6%; -2.8(-2.7) 55%; -0.4(0.1) 3%; -3.5(0.0) ND 85%; -0.7(-0.4)
B (n=15) 13%; -2.9(0.0) 20%; 1.4(1.6) 7%; -3.0(0.0) 20%; -2.4(-2.4) 80%; 0.0(0.5)

117
Figure S3: Canonical correspondence analysis comparing ARG and microbial community profiles.
Points represent gene profiles based on the abundance of sul1, qnrA, vanA, blaTEM, and intI1
determined by qPCR. Triangles represent operational taxonomic units as determined by 16S rRNA
gene amplicon sequencing.

118
Figure S4: Network analysis depicting co-occurrence of ARGs among each other as well as with
plasmid gene markers on assembled scaffolds constructed using de novo assembly of shotgun
metagenomic sequencing reads from (A) reclaimed samples and (B) potable samples. Proximity
of nodes and width of lines is proportional to numbers of association between genes. Node
diameter is proportional to the number of co-occurences for that gene. A minimum of three co-
occurrences were required for inclusion in the graphic. All ARG nodes depicted share a connection
with the plasmid node, with the exception of EreA2, indicated by an asterisk. MLS indicates
resistance to macrolide, lincosamide, and streptogramin antibiotics.

119
Table S5: Water chemistry data for potable and reclaimed distribution system samples
temperature
(oC)
total Cl
(mg/L)
free Cl
(mg/L) pH
turbidity
(NTU)
conductivity
(S/m)
dissolved
oxygen
(mg/L)
total organic
carbon (µg/L)
dissolved
organic
carbon (µg/L)
biodegradable
dissolved
organic
carbon (µg/L)
Po
tab
le A (n=44) 25.5 ± 3.3 3.5 ± 1.1 -- 7.9 ± 0.2 1.5 ± 2.7 505.8 ± 119.5 5.6 ± 1 2470 ± 762 2748 ± 1002 465 ± 758
B (n=16) 18.1 ± 3.1 0.7 ± 0.3 0.7 ± 0.3 7.8 ± 0.2 0.3 ± 0.2 361.9 ± 97.2 7.7 ± 0.6 1120 ± 1422 1439 ± 1133 548 ± 564
C (n=20) 28.4 ± 4.4 -- 0.9 ± 0.1 7.9 ± 0.2 0.2 ± 0.2 727.4 ± 49.4 7.2 ± 0.5 188 ± 62 1252 ± 1980 1522 ± 1683
D (n=40) 19.4 ± 1.9 -- 0.2 ± 0.1 7.7 ± 0.1 1.3 ± 0.8 957.5 ± 416.5 5.5 ± 1.2 BDa BDa BDa
Rec
laim
ed A (n=20) 26.7 ± 4.3 0.4 ± 0.4 0.2 ± 0.2 7.7 ± 0.3 5.4 ± 10.8 1354.4 ± 215.4 6.5 ± 1.3 5714 ± 2564 6351 ± 2761 2137 ± 2321
B (n=19) 19.6 ± 2.9 2.3 ± 3.1 1.1 ± 2.1 7.3 ± 0.2 2.5 ± 2.6 736.9 ± 80.3 4 ± 1.4 10123 ± 6173 11087 ± 7014 6094 ± 8777
C (n=20) 26.2 ± 3.7 0.3 ± 0.1 0.4 ± 0.4 7.3 ± 0.1 0.6 ± 0.3 1195.8 ± 17.3 4.3 ± 2.8 2791 ± 1810 2944 ± 1646 2191 ± 2244
D (n=20) 20 ± 1.8 2.7 ± 2.3 0.2 ± 0.2 7.2 ± 0.1 2 ± 1 1542.9 ± 283.1 6.8 ± 2.4 3961 ± 2120 4333 ± 2069 2621 ± 1238
BD = below limit of detection a19/20 samples below limit of detection (4 µg/L)

120
Figure S5: Network analysis depicting co-occurrence of ARGs and metal resistance genes on
assembled scaffolds constructed using de novo assembly of shotgun metagenomic sequencing
reads in (A) reclaimed samples, (B) potable samples, and (C) all samples. Proximity of nodes and
width of lines is proportional to numbers of association between genes. Node diameter is
proportional to the number of co-occurences for that gene. A minimum of three co-occurrences
were required for inclusion in the graphic. MLS indicates resistance to macrolide, lincosamide,
and streptogramin antibiotics.

121
Table S6: Antibiotics detectable in a subset of potable and reclaimed water samples. Values refer
to peak area. Ornidazole (anti-protozoan), nalidixic acid, sulfamethoxazole (class: sulfonamide),
oxolinic acid (quinolone), flumequine (fluoroqinolone), ormetoprim, sulfamethazine
(sulfonamide), tetracycline, cefotaxime (beta-lactam), chlorotetracycline (tetracycline),
erythromycin (macrolide), and tylosin (macrolide) were screened but not detectable in any
samples. N.D. indicates compound not detectable.
Vancomycin Trimethoprim
Utility A Reclaimed
Influent Plant 1 22072 3628247
Influent Plant 2 41236 1537909
POE Plant 1 N.D. N.D.
POE Plant 2 N.D. N.D.
Utility B
Potable Source N.D. N.D.
POE 41236 1537909
Reclaimed
Influent Plant 1 6359 2351518
Influent Plant 2 13582 1211878
POE Plant 1 N.D. N.D.
POE Plant 2 89515 1294057
Utility C
Potable Source N.D. N.D.
POE N.D. 2410
Reclaimed Influent N.D. 719542
POE N.D. 75082
Utility D
Potable Source N.D. N.D.
POE N.D. N.D.
Reclaimed Influent 3636 698209
POE N.D. 813197

122
Figure S6: Relative abundance of ARGs (normalized to 16S rRNA gene copies) by antibiotic class (stacked bars) and plasmids
(diamonds) per mL of water sampled or per biofilm swab as determined by annotation of reads from shotgun metagenomic sequencing
of samples collected at the point-of-entry (POE) and point-of-use (POU) of four potable water utilities (A, B, C, D). Reads were
annotated against the Comprehensive Antibiotic Resistance Database for ARGs and the ACLAME database for plasmids. Sufficient
DNA for analysis of potable water samples was only possible at Utilities A and B, the remaining samples were from reclaimed water
distribution systems. Error bars indicate standard deviation of total abundance of ARGs or plasmids when statistical power was sufficient
(n value indicated for each sample category).

123
Table S7: qPCR standard curve R2 and efficiency values for each gene assay (average ± standard
deviation)
R2 efficiency
16S rRNA 0.989±0.010 101.982±14.255
sul1 0.995±0.004 100.227±8.986
intI1 0.980±0.006 95.46±12.74
vanA 0.988±0.007 99.75±7.278
qnrA 0.993±0.006 100.45±7.85
blaTEM 0.998±0.002 95.48±5.445

124
CHAPTER 6 : MICROBIAL ECOLOGY AND WATER CHEMISTRY IMPACT
REGROWTH OF OPPORTUNISTIC PATHOGENS IN FULL-SCALE RECLAIMED
WATER DISTRIBUTION SYSTEMS
Emily Garner, Jean McLain, Jolene Bowers, David M. Engelthaler, Marc A. Edwards, Amy
Pruden
ABSTRACT
Need for global water security has spurred growing interest in wastewater reuse to offset demand
for municipal water. While reclaimed (i.e., non-potable) microbial water quality regulations target
fecal indicator bacteria, opportunistic pathogens (OPs), which are subject to regrowth in
distribution systems and spread via aerosol inhalation and other non-ingestion routes, may be more
relevant. This study compares the occurrences of five OP gene markers (Acanthamoeba spp.,
Legionella spp., Mycobacterium spp., Naegleria fowleri, Pseudomonas aeruginosa) in reclaimed
versus potable water distribution systems and characterizes factors potentially contributing to their
regrowth. Samples were collected over four sampling events at the point of compliance for water
exiting treatment plants and at five points of use at four U.S. utilities bearing both reclaimed and
potable water distribution systems. Reclaimed water systems harbored unique water chemistry
(e.g. elevated nutrients), microbial community composition, and OP occurrence patterns compared
to potable systems examined here and reported in the literature. Legionella spp. genes,
Mycobacterium spp. genes, and total bacteria, represented by 16S rRNA genes, were more
abundant in reclaimed than potable water distribution system samples (p≤0.0001). This work
suggests that further consideration should be given to managing reclaimed water distribution
systems with respect to non-potable exposures to OPs.
INTRODUCTION
Growing need for sustainable water sources has spurred interest in direct and indirect
potable reuse to supplement traditional surface and groundwater supplies. Approximately 1.6
billion people globally live in watersheds impacted by water scarcity and, by 2050, it is projected
that due to climate change and population increase, the number of people affected will roughly
double.1 In these areas, wastewater reuse is particularly attractive to meet both potable and non-
potable water demand. Non-potable reuse is already common in the U.S. for irrigation of
agricultural and urban areas, groundwater recharge, and industrial reuse.2 While advanced
treatments enable production of high-quality water, maintaining microbial water quality as water
is transported to the point of use may present a greater challenge than that recognized for potable
water and premise (i.e., building) plumbing, due to the unique qualities of reclaimed water,
including high levels of growth-promoting nutrients, rapid decay of disinfectant residual,
stagnation, and elevated distribution system retention times.3
Where regulations exist, typically at the state level in the U.S., microbial water quality in
reclaimed systems is typically characterized via monitoring of E. coli, Enterococci, or fecal or total
coliforms.2 While these parameters track contamination from fecal bacteria, they are not good
surrogates for opportunistic pathogens (OPs), which are non-fecal, such as Legionella
pneumophila, Mycobacterium avium, Pseudomonas aeruginosa, Acanthamoeba spp., and
Naegleria fowleri.4 Although waterborne disease related to fecal pathogens has nearly been

125
eradicated in most developed countries, OPs are now among the primary sources of tap water-
related outbreak in the U.S. and elsewhere with developed water systems.5,6 OPs can infect humans
via inhalation of aerosols or dermal, eye, or ear contact,7–10 which are more relevant than ingestion
for non-potable reuse applications. L. pneumophila and M. avium are the causative agents of severe
lung infections characterized by Legionnaires’ disease and M. avium complex, respectively.11,12 P.
aeruginosa can infect hosts via the bloodstream, eyes, ears, skin, or lungs,8 while Acanthamoeba
spp. can cause infection of the eyes or central nervous system via inhalation or penetration of skin
lesions.13 N. fowleri can infect the brain following entrance of water into the nasal cavity, with
infections having been linked to nasal irrigation with neti pots and other hygienic or recreational
activities where water can “get up the nose”.14 Exposure via aerosol inhalation could result from
use of reclaimed water in cooling towers, spray irrigation, toilet flushing, fire suppression, and car
washing.15–17 Further, dermal or eye and ear contact is feasible from use of reclaimed water for
irrigation of athletic and recreational facilities, snowmaking, and toilet flushing.4,17 Presently, little
is known about the occurrence of OPs in reclaimed water distribution systems, with one field
survey having documented their occurrence at the point-of-use.18
While OPs are expected to be present at relatively low concentrations following treatment
of recycled water, they are known to thrive in pipe biofilms and are generally tolerant of chlorine
and other disinfectants, especially when residing in amoebae.19,20 OPs are also capable of growth
under the extremely low organic carbon and nutrient concentrations characteristic of potable
water.19 Stagnant conditions, which are common in reclaimed water systems due to seasonal
shutdowns and intermittent demand, are also thought to trigger OP regrowth.21
In addition to improved documentation of occurrence patterns of OPs in reclaimed
distribution systems, fundamental understanding of how various physicochemical conditions relate
to their regrowth potential during transport to the point of use is needed. The role of biostability
(i.e., bioavailable nutrient content) of the water and other factors potentially stimulating regrowth
of OPs in reclaimed water is of particular interest. Here we surveyed gene markers for Legionella
spp., Mycobacterium spp., P. aeruginosa, Acanthamoeba spp., and N. fowleri in the distribution
system point of entry (POE) and at five points of use (POU) at four U.S. utilities distributing
reclaimed water for non-potable reuse and compared occurrences to corresponding municipal
potable water systems over four sampling events. Quantitative polymerase chain reaction (qPCR)
was employed to quantify specific OP gene markers of interest, while 16S rRNA amplicon
sequencing and shotgun metagenomic sequencing provided broader context of microbial
community structure and a means to explore other potential microbes of concern. The specific
objectives were to 1) quantify regrowth in distribution systems by comparing OP gene copy
numbers at the POE versus various POUs, 2) examine partitioning of OPs between bulk water and
biofilms, 3) identify associations between water chemistry, water age and regrowth of OPs, and 4)
characterize the relationship between the occurrence of OPs and the microbial community
composition of the distribution system.

126
METHODS
Site description, sample collection, and preservation
Four U.S. utilities participated in this study (Table 6-1), with both the reclaimed and potable
water distribution systems sampled in each city. Utilities were selected based on similar intended
reclaimed water use (i.e. all utilities produced non-potable water for use primarily as irrigation
water). For each potable or reclaimed system, samples were collected of freshly treated water at
the point of compliance/POE to the distribution system and at five locations representing a range
of water ages throughout the distribution system at the POU. Flushed bulk water samples were
collected from POUs via distribution system sampling ports in sterile 1-L polypropylene
containers prepared with 292 mg ethylenediaminetetraacetic acid (EDTA) and 48 mg sodium
thiosulfate per liter sampled, to chelate metals and quench chlorine, which could kill cells, damage
DNA, or otherwise inhibit or interfere with downstream molecular analyses. Samples for organic
carbon analysis were collected in 250 mL amber glass bottles that were acid-washed and baked
for five hours at 550ºC. Additional water was collected in separate acid-washed 250 mL bottles
for other chemical analyses. For Utilities A and B, after collecting bulk water samples, biofilm
samples were collected by inserting a sterile cotton-tipped applicator into the distribution system
pipe (Fisher Scientific, Waltham, MA), pressing it to the pipe’s surface, and in a single pass,
swabbing the upper 180º of the circumference of the pipe. The swab was transferred directly to a
sterile DNA extraction lysing tube and the stem snapped and severed to preserve only the sample
end of the swab.
Samples were shipped overnight on ice and processed within approximately 24 hours of
sample collection. Samples for molecular analysis were concentrated onto 0.22 µm mixed
cellulose esters membrane filters (Millipore, Billerica, MA). Filters were folded into quarters, torn
into 1 cm2 pieces using sterile forceps, transferred to lysing tubes, and stored at 20ºC for later
analysis. DNA was subsequently extracted using a FastDNA SPIN Kit (MP Biomedicals, Solon,
OH). Biological activity reaction tests (BART; Hach, Loveland, CO) were used to examine the
presence of active nitrifying, denitrifying, and sulfate-reducing bacteria.
Water Chemistry
Free chlorine, total chlorine, temperature, dissolved oxygen, pH, turbidity, and electrical
conductivity were measured on-site using in-house resources used routinely by each participating
utility. Upon receipt in the lab, 30 mL was subject to total organic carbon (TOC) analysis and 30
mL was filtered through pre-rinsed 0.22 µm pore size mixed cellulose esters membrane filters
(Millipore, Billerica, MA) for dissolved organic carbon (DOC) analysis. Biodegradable dissolved
organic carbon (BDOC) was measured as previously described by Servais et al.22 but with the
incubation time extended to 45 days. Samples were analyzed on a Sievers 5310C TOC analyzer
(GE, Boulder, CO) according to Standard Method 5310C.23 Metals were measured using an
Electron X-Series inductively coupled plasma mass spectrometer (Thermo Fisher, Waltham, MA)
according to Standard Method 3125B.23 Nitrate, nitrite, phosphate, and sulfate were quantified via
a Dionex DX-500 ion chromatographer (Thermo Fisher, Waltham, MA) according to Standard
Method 4110B.23

127
Table 6-1: Overview of surveyed potable and reclaimed systems
U.S. Region
(Climate)a
Potable Reclaimed
Utility Disinfectant Source Summary of Treatment Disinfectant
A
Southeast
(Humid
Subtropical;
Cfa)
NH2Cl Surface and
Groundwater
Plant #1b - Bardenpho Cl2
(NH2Cl)d Plant #2b - Activated
sludge, dentirification
B
Southwest
(Mediterran;
Csb)
Cl2;
occasional
ClO2
Surface and
Groundwater
Plant #1c - Bardenpho
Cl2
(NH2Cl)d
Plant #2c - Biofiltration
UV
C
Southwest
(Mid-
Latitude
Steppe and
Desert; Bsh)
Cl2 Surface and
Groundwater
Secondary treatment
followed by dual
membrane filters or
membrane bioreactors
NH2Cl
D
West
(Mediterran;
Csb)
Cl2 Surface and
Groundwater
Secondary treatment
followed by dual media
filters
Cl2
(NH2Cl)d
aKöppen climate classification: Cfa = mild temperate, fully humid, hot summer; Csb = mild
temperate, dry summer, warm summer; Bsh = dry, dry summer, hot arid
bUtility A reclaimed water treatment plants feed into two isolated distribution systems (A1 and A2),
while the entire municipality is serviced by a single potable water distribution system cUtility B plants feed into 1 combined distribution system dFree chlorine was dosed but water chemistry data indicates that total chlorine >> free chlorine, thus
free chlorine reacted with ambient ammonia and resulted in NH2Cl as the primary form of
disinfectant residual (Table S2)
Quantification of OPs
OP gene copy numbers were quantified in triplicate reactions from DNA extracts using
qPCR with published protocols for 16S rRNA genes,24 Legionella spp. (23S rRNA),25
Mycobacterium spp. (16S rRNA),26 P. aeruginosa (ecfX and gyrB),27 Acanthamoeba spp. (18S
rRNA),28 and N. fowleri (internal transcribed spacer region).29 With the exception of N. fowleri,
all protocols were validated for specificity in environmental matrices in a prior study.21 The
specificity of the N. fowleri assay was confirmed by cloning and sequencing of qPCR products
from a cross-section of positive samples (Table S1). In order to identify an optimized dilution for
consistently minimizing the effect of PCR inhibition, a subset of DNA extracts was initially
analyzed at dilutions of 1:5, 1:10, 1:20, and 1:50, with a dilution factor of 1:10 found to yield
optimum quantitation across extracts and qPCR assays. A triplicate negative control and triplicate
standard curves of ten-fold serial diluted standards of each target gene ranging from 101 to 107
gene copies/µl were included on each 96-well plate. Plates that yielded quantifiable data for
negative wells were reanalyzed to exclude any results possibly impacted by contamination. The
limit of quantification was established as the lowest standard that amplified in triplicate in each
run, and was equivalent to 10 gene copies per milliliter of bulk water and 103 gene copies per
biofilm swab.

128
16S rRNA gene amplicon sequencing
Bacterial community compositions were profiled using gene amplicon sequencing with
barcoded primers (515F/806R) targeting the V4 region of the 16S rRNA gene.30,31 Triplicate PCR
products were composited and 240 ng of each composite was combined and purified using a
QIAquick PCR Purification Kit (Qiagen, Valencia, CA). Sequencing was conducted at the
Genomics Research Laboratory at the Biocomplexity Institute of Virginia Tech (BI; Blacksburg,
VA) on an Illumina MiSeq using a 250-cycle paired-end protocol. Reads were processed using the
QIIME pipeline32 and annotated against the Greengenes database33 (May 2013 release). Samples
were rarefied to 10,000 randomly selected reads. Field, filtration, DNA extraction blanks, and a
least one PCR blank per lane were included in the analysis.
Shotgun metagenomic sequencing
Shotgun metagenomic sequencing was conducted on the POE and greatest water age POU
samples from each system on each collection date. Select potable samples were also sequenced.
Libraries were prepared using Nextera XT (Illumina, San Diego, CA) and sequenced on an
Illumina HiSeq 2500 using a 100-cycle paired-end protocol at BI. Samples were uploaded to the
metagenomics RAST server (MG-RAST) and annotated against the RefSeq database using default
parameters.34 Metagenomes are publicly accessible under the sample IDs listed in Table S2.
Statistical Analyses
Spearman’s rank sum correlation coefficients were calculated in JMP (SAS, Cary, NC) to
assess correlations between OPs, water quality parameters, phyla, and corrosion bacteria using a
significance cutoff of α=0.05. A Wilcoxon rank sum test for multiple comparisons was applied in
JMP to determine differences between abundances of OPs across groups of samples. Unweighted
UniFrac distances generated in QIIME were imported into PRIMER-E (version 6.1.13) for one-
way analysis of similarities (ANOSIM) to determine taxonomic differences between groups of
samples.
RESULTS AND DISCUSSION
Overview of surveyed distribution systems
The four reclaimed water distribution systems represented a range of U.S. geographic
regions, climate zones, treatment schemes, and disinfectant types (Table 6-1). All utilities are
located in climate zones that are warm seasonally or year-round and thus were candidates for
potential regrowth of OPs, which generally prefer warmer water.19 Utility A used monochloramine
as disinfectant residual, while all other utilities primarily used free chlorine. All potable water was
derived from a combination of surface and groundwater sources. All utilities utilized advanced
wastewater treatment to produce a relatively high quality finished product for distribution for the
purposes of non-potable reuse.

129
Physicochemical water characteristics
The physicochemical water quality characteristics of distribution system samples (Table S3)
suggested that, with the exception of Utility C, water in the reclaimed systems was warmer than
the corresponding potable system, but only Utilities A and B were significantly warmer
(p≤0.0321). TOC, DOC, and BDOC were consistently greater in reclaimed water than potable
water (p≤0.0038). Average BDOC concentrations ranged from 2,137 to 6,094 ppb in reclaimed
water and 15 to 1,522 ppb in potable water. The BDOC concentrations in reclaimed water were
comparable to those reported in previous surveys of reclaimed water distribution systems, which
ranged from 400 to 6,300 ppb BDOC.18,35
Turbidity and conductivity were also elevated in reclaimed systems (p≤0.0002). Dissolved
oxygen ranged from 5.5 to 7.7 mg/L on average in potable systems and 4.0 to 6.8 mg/L in
reclaimed systems. Average total chlorine ranged from 0.7 to 3.5 mg/L in potable systems and 0.3
to 2.7 mg/L in reclaimed systems. In reclaimed systems, where free chlorine was typically dosed
for the purpose of serving as a secondary disinfectant residual, in reality it was susceptible to
conversion to ambient chloramine residual because of reaction with elevated ammonia in the
water. Total chlorine was significantly lower at POU sites than at the POE for all systems except
Utility B (p≤0.0380), indicating decay of disinfectant residual. Distance from the POE to the POU,
temperature, and TOC have all been identified as important factors contributing to enhanced decay
of disinfectant residual in reclaimed systems.36
Occurrence of OP Gene Markers
The copy numbers of gene markers corresponding to five target OPs that are commonly
problematic in potable water distribution systems;37–40 Legionella spp., Mycobacterium spp., P.
aeruginosa, Acanthamoeba spp., and N. fowleri and 16S rRNA genes were determined via qPCR
(Table 2). Given that qPCR provides an upper bound estimate of actual viable OPs, qPCR
measurements are hereafter referred to in terms of abundance of their corresponding marker genes
(i.e., gene copy numbers). Legionella spp., Mycobacterium spp., and 16S rRNA genes were more
abundant in reclaimed than potable water distribution systems (p≤0.0001). In particular,
Legionella spp. genes were widely detected in reclaimed water, ranging from 76-89% of samples
from each utility being positive at an average of 3.4-4.4 log gene copies per milliliter. Legionella
spp. genes were also widespread in Utility A’s potable water distribution system, with 80% of
samples positive, though the average abundance was only 1.7 log gene copies per milliliter.
Mycobacterium spp. genes were abundant in reclaimed water, with 59-79% of samples positive
and average levels ranging from 2.5-3.7 log gene copies per milliliter. P. aeruginosa genes were
more abundant in potable systems (p=0.0003), with up to 15% of samples positive from Utility B,
but no more than 5% of samples positive from any reclaimed systems. N. fowleri genes were also
notably widespread in Utility A’s potable (41% positive) and reclaimed (45% positive) distribution
system samples, as well as Utility D’s potable samples (45% positive), though at relatively low
abundances (2.1, 1.8, 1.3 log gene copies per milliliter on average, respectively). Although N.
fowleri has been previously isolated from tap water, information is not available about the numbers
of N. fowleri present in municipal water systems.41,42 It is notable that the frequency of detection
of Legionella spp., Mycobacterium spp. and N. fowleri genes was generally highest in Utility A’s
potable system, which was the sole utility employing monochloramine as the secondary

130
disinfectant residual, whereas the others all utilized free chlorine. Maintaining a free chlorine
residual of at least 0.2 mg/L has been proposed as a key strategy for control of N. fowleri.14
Disinfectant residual type may be an important factor influencing regrowth of these OPs.
In a culture-based survey of four reclaimed distribution systems, Jjemba et al. found
average log colony forming units per milliliter ranging from 0.6-1.9 for Legionella spp., 0.16-3.21
for Mycobacterium spp., and 0.001-0.009 for Pseudomonas spp.18 Though Jjemba et al. also found
Legionella and Mycobacterium to be widespread in reclaimed water systems, concentrations were
notably lower than those observed in the present study. However, it is to be expected that molecular
tools provide an upper end estimate of pathogens, since they do not directly differentiate viable
versus non-viable cells, while culture-based methods provide a lower end estimate, given that they
do not capture viable but non-culturable (VBNC) cells. Legionella spp. commonly enter a VBNC
state in water systems, which may relate to their characteristic oligotrophic status, given that
VBNC is commonly induced by nutrient starvation.43 Previous studies have demonstrated that
Legionella spp., Mycobacterium spp., and P. aeruginosa are all capable of entering a VBNC state,
while culturable Legionella spp. CFU can be as much as two orders of magnitude less than
corresponding viable cell estimates.44–46
While there were no significant correlations among the different OPs in potable bulk water,
Legionella spp. and Mycobacterium spp. genes were positively correlated with each other in
reclaimed bulk water (ρ=0.4581, p<0.0001), as were N. fowleri and Acanthamoeba spp. genes
(ρ=0.3357, p=0.0011). Legionella spp. were negatively correlated with both N. fowleri and
Acanthamoeba spp. genes in reclaimed bulk water (ρ=-0.3771, -0.2517; p≤0.0155).
Occurrence of OP Gene Markers in Biofilms
Assuming a pipe diameter of 4 in, within each 1 ft length of pipe, the potable systems
harbored on average 7.89–8.59 log 16S rRNA genes in the biofilm and 5.69–7.59 log 16S rRNA
genes in the bulk water. The same pipe segment in the reclaimed systems on average harbored
8.49–10.39 log 16S rRNA genes in the biofilm and 8.99–9.79 log 16S rRNA genes copies in the
bulk water. Therefore, biofilms harbored the majority of the microbial community compared to
bulk water in both potable and reclaimed systems. Based on qPCR, Legionella spp. and 16S rRNA
genes were more abundant in reclaimed than potable biofilms (p<0.0003). Legionella spp. genes
were nearly ubiquitous in Utility A’s reclaimed system biofilm, with 97% of samples positive at
an average of 3.6 log gene copies per swab. Legionella spp. genes were also prevalent in Utility
B’s reclaimed system, with 83% of swabs positive. Mycobacterium spp. genes were frequently
detected in the reclaimed biofilms with 50-55% of samples positive, compared to 25-53% in
potable systems. N. fowleri-specific genes were present in 6-33% of samples in reclaimed systems
and 20-28% of potable samples. Acanthamoeba spp. genes were present in 12-22% reclaimed
biofilm samples and 5-23% of potable samples.

131
Table 6-2: Frequency of qPCR detectiona for 16S rRNA and opportunistic pathogen genes in potable and reclaimed bulk water and biofilm samples at the point of entry (POE) and point of
use (POU); average (standard deviation) of values above the limit of quantification
It is generally thought that biofilms are critical to proliferation of OPs in potable distribution
and domestic plumbing systems.37,50,51 OPs are rarely a concern in water exiting the treatment
plant, but are believed to grow and accumulate in biofilms. Biofilms provide protection from
physical and chemical disruption, such as chlorine disinfection, and can facilitate ecological
interactions, such as predator-prey-parasitic relationships between bacteria and amoebae.19
Though biofilms can be protective to its inhabitants, monochloramine has been found in some
studies to be more effective at penetrating iron pipe biofilms and scales than free chlorine, thus the
unintentional formation of ambient chloramine observed in this study could actually have positive
consequences for biofilm control.36,52,53 However, chloramine can also sometimes undergo more
rapid decay than chlorine because of nitrification, which can be especially problematic in warmer
climates.54
The higher nutrient content of the reclaimed waters studied herein is a key difference relative
to potable water systems and could hypothetically increase OPs regrowth. Consistent with these
higher nutrient levels, Legionella spp. genes were more widespread in the biofilms of reclaimed
systems compared to corresponding potable systems. On the other hand, Mycobacterium spp. gene
markers were frequently, but similarly detected both in Utility A’s potable (53%) and reclaimed
(55%) biofilms, though they were more common in Utility B’s reclaimed (50%) biofilm than

132
potable (25%) biofilm, suggesting that other factors could be at play or that a very low nutrient
threshold applies to mycobacteria. Gene markers for P. aeruginosa, which is often thought of as a
“model” biofilm organism, were relatively rare in both the potable and reclaimed biofilms. Little
is known about the role of biofilms in supporting N. fowleri growth in pipe systems, but it has been
hypothesized that the amoeba would be well suited for growth in biofilms due to the abundance of
bacteria and other particulate matter, which offer both a food source and protection from
disinfection.37 Neither N. fowleri nor Acanthamoeba spp. gene copy numbers were significantly
different in the reclaimed relative to the other potable systems, suggesting that these amoebae were
not particularly sensitive to the differing nutrient levels of these two water types.
In potable water biofilms, Mycobacterium spp. genes were positively correlated with both
Legionella spp. and Acanthamoeba spp. genes (ρ=-0.2944, -0.4098; p≤0.0213). In reclaimed
biofilms, there were no significant positive correlations among the OPs, but Legionella spp. genes
were negatively correlated with Acanthamoeba spp. and P. aeruginosa genes (ρ=-0.4719, -0.3010;
p≤0.0356).
The negative correlations between Legionella spp. and amoebae genes in both reclaimed bulk
water and biofilms were surprising, since it is widely understood that infection of free-living
amoeba hosts is essential for L. pneumophila replication in potable water systems.47 The digestive
vacuole environment inside the amoebae is rich in amino acids, such as L-cysteine, which is a
critical carbon source for L. pneumophila.48,49 Free-living amoebae are further thought to enhance
virulence of L. pneumophila and protect it from disinfection, though they can survive for extended
periods of time in absence of amoebae.47 It is possible that L. pneumophila is less dependent on
amoebae hosts for replication under the higher nutrient environment of reclaimed water.
Legionella spp. and Acanthamoeba spp. genes were also not correlated in the potable water
distribution system biofilms (ρ=0.2173, p=0.0925). Overall, these results are suggestive of
complex relationships among Legionella and free-living amoebic hosts, such as predator-prey
cycling, deposition of persistent Legionella spp. from the bulk water, or alternate free-living
amoebic hosts that were not monitored in these systems.
Exploration of other potential OPs using Shotgun Metagenomics
While five OPs were targeted for quantification across all samples, shotgun metagenomics
was applied to a subset of samples to explore the occurrence of other potential OPs of concern
(Figure 6-1). Genes annotated as Acanthamoeba castellanii, Acinetobacter baumannii, Aeromonas
hydrophila, Burkholderia pseudomallei, L. pneumophila, M. avium, Staphylococcus aureus, and
Stenotrophomonas maltophilia were detected in all potable and reclaimed systems from which
DNA sequence data was available, while Aspergillus fumigatus, Acanthamoeba polyphaga, and
N. fowleri were not annotated in any samples. The majority of Legionella spp. and Mycobacterium
spp. infections in the clinic are identified as L. pneumophila and M. avium,55,56 respectively,
species which were detected via metagenomics in all samples. The only species of Acanthamoeba
spp. detected in the metagenomic analysis was A. castellanii, a species of the amoeba capable of
causing an eye infection known as amebic keratitis.13 The absence of detection of N. fowleri in the
metagenomics data may indicate that abundances were too low for detection, that the DNA
extraction method was not optimal for these amoebae, or that the reference databases are poorly
suited for characterization of amoebae. DNA fragments identified as matching with S. aureus were

133
consistently present at low relative abundances in both potable and reclaimed water, ranging from
-4.35 – -3.22 log hits per total reads. A. baumannii (-3.41 – -1.75 log hits/reads), A. hydrophilia (-
3.65 – -1.65 log hits/reads), B. pseudomallei (-2.99 – -2.23 log hits/reads), and S. maltophilia (-
3.31 – -2.24 log hits/reads) gene fragments were also consistently detected. Where comparisons
were available, there was generally strong agreement in trends between qPCR and metagenomic
data. Significant correlations were noted when comparing the two methods for abundances of both
Legionella spp. (𝜌=0.7409, p<0.0001) and Mycobacterium spp. gene markers (𝜌=0.4809,
p=0.0062) (Figure S1).
Figure 6-1: Average relative abundance of DNA fragments matching additional OPs of
interest identified via shotgun metagenomic sequencing (hits / total reads). All samples are
from the POE and the POU with the greatest water age from each sampling event were submitted
for sequencing. Many samples, potable in particular, did not pass the library preparation step due
to low DNA yield. Those that passed library preparation and were successfully sequenced are
included here.
Relationship between abundance of OPs, water age, and related factors
Because distribution system models were not consistently available for the reclaimed
distribution systems, ranked water age estimated based on location in the distribution systems and
estimated flow paths was used as a proxy for water age. 16S rRNA genes were found to be more
abundant at the POU than the POE in reclaimed systems (p=0.0268), supporting the hypothesis of
general bacterial regrowth in these distribution systems. POE versus POU differences in 16S rRNA
gene abundances were not noted in the potable systems (p=0.8323). Significant regrowth from the
POE to the POU was observed for Legionella spp. genes in Utility A’s reclaimed system
(p=0.0089), but regrowth from the POE to the POU was not observed for any of the other OPs
(p≥0.0798) in any potable or reclaimed systems. Surprisingly, 16S rRNA genes, Acanthamoeba

134
Table 6-3: Spearman’s rank correlation coefficients for correlations between 16S rRNA or
opportunistic pathogen gene markers and physicochemical water quality parameters. Correlations are for all potable and reclaimed water samples. P-values indicated in parentheses.
Significant correlations indicated in bold.
spp., and Mycobacterium spp. genes decreased with ranked reclaimed water age (p≤0.0325) (Table
6-3).
While none of the OPs monitored consistently correlated with water age across the four
utilities, there were several notable instances where they did correlate in reclaimed systems (Figure
6-2A-2C). For example, samples collected from Utility A’s two reclaimed distribution systems
displayed regrowth of total bacteria, indicated by 16S rRNA genes, as well as Legionella spp. and
Mycobacterium spp. genes (Figures 6-2A-2B). 16S rRNA genes were consistently at least 1-log
higher in abundance at POU than at POE sites in both systems. In the A1 system, Legionella spp.
genes increased by at least 0.5-log at POU sites compared to the POE. In the A2 distribution
system, Legionella spp. genes were at least 1-log greater at all POU sites than at the POE and
Mycobacterium spp. genes also increased at all POU sites relative to the POE. Total bacterial
regrowth was observed for Utility C (Figure 6-2C) at some sites, particularly when total chlorine
dropped. OP regrowth was not observed from the POE to the POUs; however there was an apparent
inverse relationship between chlorine residual and Legionella spp. and Mycobacterium spp. gene
abundances at the fourth and fifth sites. While qPCR captures DNA from dead or lysed cells
together with that from live cells, the elevated gene markers from the POE to the POUs in these
examples are strongly indicative of regrowth. Regrowth was not observed for Utility D (Figure 6-
2D); however, chlorine residual decayed rapidly from 4.1 mg/L at the POE to 0.42 mg/L or less at
all POUs. This low disinfectant residual likely permitted both 16S rRNA and Legionella spp. genes
to remain abundant throughout the Utility D distribution system. While temperature was not
directly correlated with OP regrowth when considering the sample pool as a whole, there were

135
several spikes in temperature that also coincided with an increase in Legionella spp. and
Mycobacterium spp. gene abundance (Figure 6-2A-2B).
Figure 6-2: Temperature, free chlorine, and abundances of 16S rRNA genes, Legionella spp.,
and Mycobacterium spp. in select distribution systems. Samples collected at the treatment plant
and throughout the reclaimed distribution systems for key examples of scenarios where Legionella
spp. or Mycobacterium spp. were observed. Examples are from (A) Utility A1 sampled August
2014, (B) Utility A2 sampled August 2014, (C) Utility B sampled August 2014, and (D) Utility C
sampled October 2014. When modeling data was available from utilities, water age was estimated.
In the absence of water age data, pipe distances from the treatment plant were used as a proxy for
relative water age. When neither metric was available, water utility staff provided ranked water
age data approximating relative water age between site
Relationship between water chemistry measurements and abundance of OPs
Correlations between OPs and physicochemical water quality parameters are presented in
Tables 3 and S4. Temperature appeared to be an important factor facilitating regrowth in reclaimed
water, as genes associated with 16S rRNA, Acanthamoeba spp., Mycobacterium spp., and N.
fowleri were all positively correlated with temperature in bulk water samples (p≤0.0130). In
reclaimed biofilms, genes associated with 16S rRNA, Legionella spp., and N. fowleri all correlated

136
with temperature (p≤0.0032). Total chlorine appeared to have a controlling effect on total bacteria
in reclaimed water, as indicated by a negative correlation between total chlorine and 16S rRNA
genes (p≤0.0185) in both the bulk water and biofilm. With the exception of Legionella spp. and
Mycobacterium spp. genes in Utility B’s reclaimed water (Table S4), this correlation did not
consistently apply to any OPs, however, suggesting that the tendency of OPs to resist chlorine
disinfection is an important factor in providing a selective advantage over the general bacterial
community. In reclaimed systems, BDOC was only significantly correlated with Acanthamoeba
spp. genes (p<0.0001) in the bulk water. Previous studies of potable water have indicated that
concentrations well below 10 ppb are required in order for organic carbon to be a limiting nutrient
and constrain regrowth of bacteria in distribution systems,57,58 which may be an unrealistic goal
for reclaimed water distributors. Mycobacterium spp. and Legionella spp. genes in reclaimed
systems were both positively correlated with phosphorus, while Legionella spp. and 16S rRNA
genes were correlated with ammonia, further suggesting that nutrients other than carbon are worthy
of future examination as alternative limiting nutrients.
Microbial ecology – OP associations
Based on jackknifed unweighted UniFrac distances (a measure of beta diversity), the
microbial community composition of the potable distribution system was distinct from that of
reclaimed systems for both bulk water (ANOSIM, R=0.426, p≤0.001) and biofilm samples
(R=0.317, p≤0.001) (Figure 6-3). At the POEs, potable and reclaimed bulk water were also unique
(R=0.396, p=0.002). The bulk water versus biofilm communities were distinct for both potable
(R=0.167, p≤0.001) and reclaimed systems (R=0.364, p≤0.001). Alphaproteobacteria,
Deltaproteobacteria, TM6, Verrucomicrobia, and Chlamydiae were enriched in the reclaimed
systems (Wilcoxon multiple comparisons, p≤0.0474), while Epsilonproteobacteria,
Gammaproteobacteria, Actinobacteria, Cyanobacteria, Firmicutes, and Nitrospirae were enriched
in potable samples (p≤0.0032). Gammaproteobacteria, Planctomycetes, and [Thermi] were
enriched in potable bulk water samples (p≤0.0191), while Betaproteobacteria and Chlamydiae
were enriched in the biofilm (p≤0.0007). In reclaimed systems, Epsilonproteobacteria, Firmicutes,
OD1, TM6, and Fusobacteria were enriched in the bulk water (p≤0.0093), while
Deltaproteobacteria, Acidobacteria, Gemmatimonadetes, Nitrospirae, Planctomycetes, and
Verrucomicrobia were enriched in the biofilm (p≤0.0129).
OPs, such as Legionella, are known to competitively, antagonistically, and even
symbiotically interact with other microbes.59–61 To identify potential microbial interactions of
interest, correlations were examined between OPs and the phyla detected (Table S5). Several phyla
exhibited strong positive correlations with Legionella spp. gene markers: WPS-2, TM7, NKB19,
SR1, Lentisphaerae, Tenericutes, and OP11 (Spearman’s ρ=0.3108-0.4913, p≤0.0001).
Cyanobacteria, NC10, Nitrospirae, Caldithrix, and [Parvarchaeota] (ρ=-0.1499-(-0.2158),
p≤0.0125) exhibited the strongest negative correlations with Legionella spp. gene markers.
Tenericutes, SR1, Lentisphaerae, NKB19, WWE1, WPS-2, Euryarchaeota, OP11, TM6, and OP8
(ρ=0.2304-0.2992, p≤0.0001) exhibited the strongest positive correlations with Mycobacterium
spp. genes, while no phyla significantly negatively correlated with the gene. Weak correlations
were also noted between P. aeruginosa, Acanthamoeba spp., and N. fowleri genes and various
phyla (Table S5). Microbial communities were also characterized in PCR blanks (n=5), field
blanks (n=8), extraction blanks (n=2), and a filtration blank (n=1) (Figure S2). Blanks yielded

137
microbial community phylum profiles that were significantly different from reclaimed samples
(ANOSIM, R=0.401, p=0.0050), but not potable samples (R=0.064, p=0.1540). PCR blanks
(p=0.0009), extraction blanks (p=0.0383), and filter blanks (n=1; statistical analysis not possible)
all yielded less reads than samples. While field blanks did not produce significantly less reads than
samples (p=0.0886), greater volumes of PCR product were pooled to achieve the minimum 240
ng mass from each sample from field blanks (median 15.1 µl) than from samples (median 12.3 µl).
Given that more product was pooled to achieve sufficient DNA for sequencing of negative
controls, it is likely that the inherent “noise” associated with this method did not overwhelm the
microbial communities profiled for samples, but these data should be interpreted with caution.
Additional research is needed to determine the accuracy of trends observed herein.
Figure 6-3: Microbial community composition of potable vs. reclaimed distribution system
samples. Phyla (and proteobacteria classes) comprising at least 1% of any sample from potable
and reclaimed water distribution system (POU) samples from utilities A, B, C, and D. Samples
appear in chronological order from left to right according to sample date.
Corrosion-Associated Microbial Activity Assays
BARTs can provide insight into activity of various functional groups of microbes of
interest and are commonly employed to assess microbially influenced corrosion (MIC).62–64 The
development of redox gradients in distribution systems can create a range of dissolved oxygen
levels, lack of chlorine residual, and varying nitrogen species that can create a range of microbial
niches in terms of available electron donors and acceptors and result in undesirable consequences
to water quality, including MIC.63 Corrosion of pipes may facilitate the growth of OPs by releasing
iron, an important micronutrient for the growth of Legionella,65 by increasing surface area where
biofilms may establish,66 and consuming chlorine.64,67 Additionally, corrosion tubercles have been
shown to harbor high densities of coliforms, with some indication that the same may be true of
OPs.64,68 The approximate abundances of nitrifying bacteria, denitrifying bacteria, and sulfate-
reducing bacteria were determined using BARTs (Table S6). Nitrifying bacteria were only

138
detected in potable water of Utility A, but were detected in the reclaimed water of utilities A, C,
and D, all systems that tended to contain ambient ammonia. Denitrifying bacteria were detected in
both the potable and reclaimed water of all utilities. Sulfate-reducing bacteria were only detected
in the potable water of Utility C, but were detected in all reclaimed waters.
Nitrifying bacteria were positively correlated with Legionella spp. genes in both bulk water
and biofilm as well as Mycobacterium spp. genes in bulk water (ρ=0.5652, 0.3786, 0.4498;
p≤0.0002). Nitrifying bacteria have been widely documented in potable and reclaimed water
systems due to the availability of ammonia in systems utilizing chloramines as a disinfectant
residual.54,62,69,70 Nitrification has been previously associated with regrowth of OPs due to rapid
decay of disinfectant residual, particularly chloramines.71 Denitrifying bacteria were correlated
with biofilm N. fowleri genes (ρ=0.3607, p=0.0034). Although denitrification has only rarely been
documented in potable distribution systems,72,73 denitrifying bacteria thrive under conditions of
low dissolved oxygen and high organic matter,74,75 which were often observed in the reclaimed
water systems surveyed in this study. Although N. fowleri typically prefer oxygen-rich
environments, other Naegleria species are able to survive under relatively low oxygen
concentrations,76 so they may find a potential niche in the low oxygen conditions required for
denitrification. One previous study noted a negative correlation between dissolved oxygen and N.
fowleri in surface water.77 Sulfate-reducing bacteria were positively correlated with Legionella
spp. genes in both bulk water and biofilm, and Mycobacterium spp. genes in bulk water (ρ=0.5307,
0.6991, 0.4152; p≤0.0001). Sulfate-reducing bacteria and mycobacteria have been previously
identified together as the dominant microbial groups inhabiting a biofilm in a chloraminated
potable water system.78
Implications for OP control in reclaimed distribution systems
While OP-related illnesses are likely largely underreported,50 exposures associated with
potable water are a leading cause of waterborne disease in developed countries.5 The potential
disease burden associated with OP exposure resulting from reclaimed water use has not been
characterized, with this study revealing that OP genes (specifically, Legionella spp. and
Mycobacterium spp.) were more abundant in the reclaimed water systems than corresponding
potable systems surveyed. This work demonstrates that growth of OPs in reclaimed water is
strongly tied to the unique water chemistry and microbial ecology of reclaimed water. However,
the vast majority of knowledge about regrowth of OPs in distribution systems and premise
plumbing is based on understanding of potable water systems, which, as suggested by this study,
are not likely directly translatable. This study clearly demonstrates that reclaimed water generally
differs from potable water in many aspects (nutrient concentration, temperature, etc.), with
differences in corresponding OP occurrence patterns. Additionally, the microbial community
composition in reclaimed distribution systems is unique from that of potable systems, with even
greater differences observed as the water is transported through the system. Differences in
associations between Legionella spp. genes and amoebic hosts demonstrate that interactions
between members of the microbial community are unique in potable versus reclaimed water.
Therefore, traditional knowledge about the behavior of OPs in potable distribution systems and
premise plumbing is not necessarily applicable to reclaimed water.

139
There were several key limitations of this study. Only four systems were studied with
highly variable treatment approaches, so the observed trends may not be representative of all
systems. In addition, given the complexities of studying full-scale systems, many factors that could
contribute to the occurrence of OPs could not be quantitatively considered, for example, usage
patterns, climate impacts, and historical treatment, disinfection, and operation patterns. Finally,
the large number of statistical comparisons made in this study warrant critical consideration of the
comparisons made. More research is needed to better document and ultimately understand the
complex factors governing OP behavior in reclaimed water systems. In potable water, there are no
regulatory requirements for monitoring OPs, with the focus primarily being on ingestion of fecal
pathogens. Thus, serious consideration is needed regarding regulatory and monitoring
requirements for OPs both in reclaimed and potable water systems, given that the most relevant
routes of exposure are overlooked in the current regulatory paradigm, or lack thereof.4 Research is
needed to further advance hazard identification, exposure assessment, and establish the infectious
dose of these pathogens. Comprehensive risk assessment is needed to better understand the
potential impact to public health associated with transmission of OPs via use of reclaimed water.
ACKNOWLEDGEMENTS
We thank the participating utilities for conducting sampling and on-site data collection. This work
is supported by the National Science Foundation (NSF) Graduate Research Fellowship Program
Grant (DGE 0822220) and NSF Collaborative Research grant (1438328), The Alfred P. Sloan
Foundation Microbiology of the Built Environment (MoBE) program, the Water Environment &
Research Foundation Paul L. Busch award, the Virginia Tech Institute for Critical Technology and
Applied Science Center for Science and Engineering of the Exposome, and the American Water
Works Association Abel Wolman Doctoral Fellowship.
REFERENCES
(1) Gosling, S. N.; Arnell, N. W. A global assessment of the impact of climate change on water
scarcity. Clim. Change 2016, 134 (3), 371–385.
(2) Guidelines for Water Reuse; United States Environmental Protection Agency: 2012.
(3) Jjemba, P.; Johnson, W.; Bukhari, Z.; LeChevallier, M. Review of the leading challenges
in maintaining reclaimed water quality during storage and distribution. J. Water Reuse
Desalin. 2014, 4 (4), 209–1237.
(4) Garner, E.; Zhu, N.; Strom, L.; Edwards, M.; Pruden, A. A human exposome framework
for guiding risk management and holistic assessment of recycled water quality. Environ.
Sci. Water Res. Technol. 2016, 2, 580–1598.
(5) Brunkard, J. M.; Ailes, E.; Roberts, V. A.; Hill, V.; Hilborn, E. D.; Craun, G. F.;
Rajasingham, A.; Kahler, A.; Garrison, L.; Hicks, L.; Carpenter, J.; Wade, T. J.; Beach, M.
J.; Yoder, M. Surveillance for waterborne disease outbreaks associated with drinking water
– United States, 2007–2008. Morb. Mortal. Wkly. Rep. 2008, 57 (SS-9), 1–38.
(6) Craun, G. F.; Brunkard, J. M.; Yoder, J. S.; Roberts, V. A.; Carpenter, J.; Wade, T.;
Calderon, R. L.; Roberts, J. M.; Beach, M. J.; Roy, S. L. Causes of outbreaks associated
with drinking water in the United States from 1971 to 2006. Clin. Microbiol. Rev. 2010,
23 (3), 507–528.

140
(7) Brissaud, F.; Blin, E.; Hemous, S.; Garrelly, L. Water reuse for urban landscape irrigation:
aspersion and health related regulations. Water Sci. Technol. 2008, 57 (5), 781–787.
(8) Bodey, G. P.; Bolivar, R.; Fainstein, V.; Jadeja, L. Infections Caused by Pseudomonas
aeruginosa. Rev. Infect. Dis. 1983, 5 (2), 279–313.
(9) Primm, T. P.; Lucero, C. A.; Falkinham, J. O. Health Impacts of Environmental
Mycobacteria. Clin. Microbiol. Rev. 2004, 17 (1), 98–106.
(10) Williams, B. J.; Dehnbostel, J.; Blackwell, T. S. Pseudomonas aeruginosa: Host defence
in lung diseases. Respirology 2010, 15 (7), 1037–1056.
(11) Fraser, D. W.; Tsai, T. R.; Orenstein, W.; Parkin, W. E.; Beecham, H. J.; Sharrar, R. G.;
Harris, J.; Mallison, G. F.; Martin, S. M.; McDade, J. E.; Shepard, C. C.; Brachman, P. S.
Legionnaires’ Disease: Description of an Epidemic of Pneumonia. N. Engl. J. Med. 1989,
297 (22), 1189–11197.
(12) Horsburgh, C. R. Mycobacterium avium complex infection in the acquired
immunodeficiency syndrome. N. Engl. J. Med. 1991, 324 (19), 1332–1338.
(13) Marciano-Cabral, F.; Cabral, G. Acanthamoeba spp. as agents of disease in humans. Clin.
Microbiol. Rev. 2003, 16 (2), 273–307.
(14) Bartrand, T. A.; Causey, J. J.; Clancy, J. L. Naegleria fowleri: An emerging drinking water
pathogen. J. Am. Water Works Assoc. 2014, 106 (10), E418–E432.
(15) Wu, Q. Y.; Li, Y. Y.; Hu, H. Y. Exposure dose of reclaimed water for car wash. Acta Sci.
Circumstantiae 2013, 33 (3), 844–849.
(16) Borboudaki, K. E.; Paranychianakis, N. V.; Tsagarakis, K. P. Integrated wastewater
management reporting at tourist areas for recycling purposes, including the case study of
Hersonissos, Greece. Environ. Manage. 2005, 36 (4), 610–623.
(17) Gerba, C. P.; Wallis, C.; Melnick, J. L. Microbiological hazards of household toilets:
droplet production and the fate of residual organisms. Appl. Microbiol. 1975, 30 (2), 229–
237.
(18) Jjemba, P. K.; Weinrich, L. A.; Cheng, W.; Giraldo, E.; LeChevallier, M. W. Regrowth of
Potential Opportunistic Pathogens and Algae in Reclaimed-Water Distribution Systems.
Appl. Environ. Microbiol. 2010, 76 (13), 4169–4178.
(19) Falkinham, J. Common Features of Opportunistic Premise Plumbing Pathogens. Int. J.
Environ. Res. Public Health 2015, 12 (5), 4533–4545.
(20) Thomas, J. M.; Ashbolt, N. J. Do free-living amoebae in treated drinking water systems
present an emerging health risk? Environ. Sci. Technol. 2011, 45 (3), 860–869.
(21) Wang, H.; Edwards, M.; Falkinham, J. O.; Pruden, A. Molecular Survey of the Occurrence
of Legionella spp., Mycobacterium spp., Pseudomonas aeruginosa, and Amoeba Hosts in
Two Chloraminated Drinking Water Distribution Systems. Appl. Environ. Microbiol.
2012, 78 (17), 6285–6294.
(22) Servais, P.; Billen, G.; Hascoet, M-C. Determination of the Biodegradable Fraction of
Dissolved Organic Matter in Waters. Water Res. 1995, 21 (4), 445 – 450.
(23) American Public Health Association (APHA). Standard Methods for the Examination of
Water and Wastewater; American Water Works Association, Water Environment
Federation, 2005.
(24) Suzuki, M. T.; Taylor, L. T.; DeLong, E. F. Quantitative analysis of small-subunit rRNA
genes in mixed microbial populations via 5’-nuclease assays. Appl. Environ. Microbiol.
2000, 66 (11), 4605–4614.

141
(25) Nazarian, E. J.; Bopp, D. J.; Saylors, A.; Limberger, R. J.; Musser, K. A. Design and
implementation of a protocol for the detection of Legionella in clinical and environmental
samples. Diagn. Microbiol. Infect. Dis. 2008, 62 (2), 125–132.
(26) Radomski, N.; Lucas, F. S.; Moilleron, R.; Cambau, E.; Haenn, S.; Moulin, L.
Development of a real-time qPCR method for detection and enumeration of
Mycobacterium spp. in surface water. Appl. Environ. Microbiol. 2010, 76 (21), 7348–7351.
(27) Anuj, S. N.; Whiley, D. M.; Kidd, T. J.; Bell, S. C.; Wainwright, C. E.; Nissen, M. D.;
Sloots, T. P. Identification of Pseudomonas aeruginosa by a duplex real-time polymerase
chain reaction assay targeting the ecfX and the gyrB genes. Diagn. Microbiol. Infect. Dis.
2009, 63 (2), 127–131.
(28) Rivière, D.; Szczebara, F. M.; Berjeaud, J.-M.; Frère, J.; Héchard, Y. Development of a
real-time PCR assay for quantification of Acanthamoeba trophozoites and cysts. J.
Microbiol. Methods 2006, 64 (1), 78–83.
(29) Mull, B. J.; Narayanan, J.; Hill, V. R. Improved Method for the Detection and
Quantification of Naegleria fowleri in Water and Sediment Using Immunomagnetic
Separation and Real-Time PCR. J. Parasitol. Res. 2013, 608367.
(30) Caporaso, J. G.; Lauber, C. L.; Walters, W. A.; Berg-Lyons, D.; Lozupone, C. A.;
Turnbaugh, P. J.; Fierer, N.; Knight, R. Global patterns of 16S rRNA diversity at a depth
of millions of sequences per sample. Proc. Natl. Acad. Sci. U.S.A. 2011, 108, 4516–4522.
(31) Caporaso, J. G.; Lauber, C. L.; Walters, W. A.; Berg-Lyons, D.; Huntley, J.; Fierer, N.;
Owens, S. M.; Betley, J.; Fraser, L.; Bauer, M.; Gormley, N.; Gilbert, J. A.; Smith, G.;
Knight, R. Ultra-high-throughput microbial community analysis on the Illumina HiSeq and
MiSeq platforms. ISME J. 2012, 6 (8), 1621–1624.
(32) Caporaso, J. G.; Kuczynski, J.; Stombaugh, J.; Bittinger, K.; Bushman, F. D.; Costello, E.
K.; Fierer, N.; Pena, A. G.; Goodrich, J. K.; Gordon, J. I.; Huttley, G. A.; Kelley, S. T.;
Knights, D.; Koenig, J. E.; Ley, R. E.; Lozupone, C. A.; McDonald, D.; Muegge, B. D.;
Pirrung, M.; Reeder, J.; Sevinsky, J. R.; Turnbaugh, P. J.; , Walters, W. A.; Widmann, J.;
Yatsunenko, T.; Zaneveld, J.; Knight, R. QIIME allows analysis of high-throughput
community sequencing data. Nat. Methods 2010, 7 (5), 335–336.
(33) DeSantis, T. Z.; Hugenholtz, P.; Larsen, N.; Rojas, M.; Brodie, E. L.; Keller, K.; Huber,
T.; Dalevi, D.; Hu, P.; Andersen, G. L. Greengenes, a Chimera-Checked 16S rRNA Gene
Database and Workbench Compatible with ARB. Appl. Environ. Microbiol. 2006, 72 (7),
5069–5072.
(34) Meyer, F.; Paarmann, D.; D’Souza, M.; Olson, R.; Glass, E. M.; Kubal, M.; Paczian, T.;
Rodriguez, A.; Stevens, R.; Wilke, A.; Wilkening, J.; Edwards, R. A. The metagenomics
RAST server - a public resource for the automatic phylogenetic and functional analysis of
metagenomes. BMC Bioinformatics 2008, 9 (386).
(35) Weinrich, L. A; Jjemba, P. K.; Giraldo, E.; LeChevallier, M. W. Implications of organic
carbon in the deterioration of water quality in reclaimed water distribution systems. Water
Res. 2010, 44 (18), 5367–5375.
(36) Jjemba, P. K.; Johnson, W.; Bukhari, Z.; LeChevallier, M. W. Occurrence and Control of
Legionella in Recycled Water Systems. Pathogens 2015, 4 (3), 470–502.
(37) Pruden, A.; Edwards, M. A.; Falkinham, J. O.; Arduino, M.; Bird, J.; Birdnow, R.; Bedard,
E.; Camper, A.; Clancy, J.; Hilborn, E.; et al. State of the Science and Research Needs for
Opportunistics Pathogens in Premise Plumbing: Methodology, microbial ecology, and
epidemiology, Final Report; Water Research Foundation: Denver, CO, 2013.

142
(38) Falkinham, J.; Pruden, A.; Edwards, M. Opportunistic Premise Plumbing Pathogens:
Increasingly Important Pathogens in Drinking Water. Pathogens 2015, 4 (2), 373–386.
(39) Falkinham, J. Common Features of Opportunistic Premise Plumbing Pathogens. Int. J.
Environ. Res. Public Health 2015, 12 (5), 4533–4545.
(40) Wang, H.; Bedard, E.; Prevost, M.; Camper, A. K.; Hill, V. R.; Pruden, A. Methodological
approaches for monitoring opportunistic pathogens in premise plumbing: A review. Water
Res. 2017, 117, 68–86.
(41) Puzon, G. J.; Lancaster, J. A.; Wylie, J. T.; Plumb, J. J. Rapid Detection of Naegleria
Fowleri in Water Distribution Pipeline Biofilms and Drinking Water Samples. Env. Sci.
Technol. 2009, 43 (17), 6691–6696.
(42) Esterman, A.; Dorsch, M.; Cameron, S.; Roder, D.; Robinson, B.; Lake, J.; Christy, P. The
association of Naegleria fowleri with the chemical, microbiological, and physical
characteristics of South Australian water supplies. Water Res. 1984, 18 (5), 549–553.
(43) Steinert, M.; Emody, L.; Amann, R.; Hacker, J. Resuscitation of Viable but Nonculturable
Legionella pneumophila\rPhiladelphia JR32 by Acanthamoeba castellanii. Appl. Env.
Microbiol. 1997, 63 (5), 2047–2053.
(44) Oliver, J. D. The viable but nonculturable state in bacteria. J. Microbiol. 2005, 43 (S), 93–
100.
(45) Oliver, J. D. Recent findings on the viable but nonculturable state in pathogenic bacteria.
FEMS Microbiol. Rev. 2010, 34 (4), 415–425.
(46) Moritz, M. M.; Flemming, H. C.; Wingender, J. Integration of Pseudomonas aeruginosa
and Legionella pneumophila in drinking water biofilms grown on domestic plumbing
materials. Int. J. Hyg. Environ. Health 2010, 213 (3), 190–197.
(47) Murga, R.; Forster, T. S.; Brown, E.; Pruckler, J. M.; Fields, B. S.; Donlan, R. M. Role of
biofilms in the survival of Legionella pneumophila in a model potable-water system.
Microbiology 2001, 147 (11), 3121–3126.
(48) Manske, C.; Hilbi, H. Metabolism of the vacuolar pathogen Legionella and implications for
virulence. Front. Cell. Infect. Microbiol. 2014, 4, 1–10.
(49) Ewann, F.; Hoffman, P. S. Cysteine Metabolism in Legionella pneumophila :
Characterization of an L-Cystine-Utilizing Mutant. Appl. Environ. Microbiol. 2006, 72 (6),
3993–4000.
(50) Ashbolt, N. Environmental (Saprozoic) Pathogens of Engineered Water Systems:
Understanding Their Ecology for Risk Assessment and Management. Pathogens 2015, 4
(2), 390–405.
(51) Wingender, J.; Flemming, H.-C. Biofilms in drinking water and their role as reservoir for
pathogens. Int. J. Hyg. Environ. Health 2011, 214 (6), 417–423.
(52) LeChevallier, M. W.; Cawthon, C. D.; Lee, R. G. Inactivation of biofilm bacteria. Appl.
Environ. Microbiol. 1988, 54 (10), 2492–2499.
(53) Samrakandi, M. M.; Roques, C.; Michel, G. Influence of trophic conditions on
exopolysaccharide production: bacterial biofilm susceptibility to chlorine and
monochloramine. Can. J. Microbiol. 1997, 43, 751–758.
(54) Zhang, Y.; Love, N.; Edwards, M. Nitrification in Drinking Water Systems. Crit. Rev.
Environ. Sci. Technol. 2009, 39, 153–208.
(55) Marston, B. J.; Lipman, H. B.; Breiman, R. F. Surveillance for Legionnaires’ Disease: Risk
Factors for Morbidity and Mortality. Arch Intern Med 1994, 154 (21), 2417–2422.
(56) Johnson, M. M.; Odell, J. A. Nontuberculous mycobacterial pulmonary infections. J.

143
Thorac. Dis. 2014, 6 (3), 210-220.
(57) Kooij, D. V. D. Assimilable Organic Carbon as an Indicator of Bacterial Regrowth. J. Am.
Water Work. Assoc. 1992, 57–65.
(58) Williams, K.; Pruden, A.; Falkinham, J.; Edwards, M. Relationship between Organic
Carbon and Opportunistic Pathogens in Simulated Glass Water Heaters. Pathogens 2015, 4
(2), 355–372.
(59) Declerck, P.; Behets, J.; Delaedt, Y.; Margineanu, A.; Lammertyn, E.; Ollevier, F. Impact
of non-Legionella bacteria on the uptake and intracellular replication of Legionella
pneumophila in Acanthamoeba castellanii and Naegleria lovaniensis. Microb. Ecol. 2005,
50 (4), 536–549.
(60) Guerrieri, E.; Bondi, M.; Sabia, C.; De Niederhäusern, S.; Borella, P.; Messi, P. Effect of
bacterial interference on biofilm development by Legionella pneumophila. Curr. Microbiol.
2008, 57 (6), 532–536.
(61) Wadowsky, R. M.; Yee, R. B. Satellite growth of Legionella pneumophila with an
environmental isolate of Flavobacterium breve. Appl. Environ. Microbiol. 1983, 46 (6),
1447–1449.
(62) Jjemba, P. K.; Weinrich, L. A.; Cheng, W.; Giraldo, E.; LeChevallier, M. W. Guidance
document on the microbiological quality and biostability of reclaimed water and
distribution systems (WRF‐05‐002), WateReuse Research Foundation: Alexandria, VA,
2010.
(63) Masters, S.; Wang, H.; Pruden, A.; Edwards, M. A. Redox gradients in distribution systems
influence water quality, corrosion, and microbial ecology. Water Res. 2015, 68, 140–149.
(64) Emde, K. M. E.; Smith, D. W.; Facey, R. Initial Investigation of Microbially Influenced
Corrosion (MIC) in a Low Temperature Water Distribution System. Wat. Res. 1992, 26 (2),
169–175.
(65) Ristroph, J. D.; Hedlund, K. W.; Gowda, S. Chemically defined medium for Legionella
pneumophila growth. J Clin Microbiol 1981, 13 (1), 115–119.
(66) Yang, F.; Shi, B.; Gu, J.; Wang, D.; Yang, M. Morphological and physicochemical
characteristics of iron corrosion scales formed under different water source histories in a
drinking water distribution system. Water Res. 2012, 46 (16), 5423–5433.
(67) Frateur, I.; Deslouis, C.; Kiene, L.; Levi, Y.; Tribollet, B. Free chlorine consumption
induced by cast iron corrosion in drinking water distribution systems. Water Res. 1999, 33
(8), 1781–1790.
(68) LeChevallier, M. W.; Babcock, T. M.; Lee, R. G. Examination and Characterization of
Distribution-System Biofilms. Appl. Environ. Microbiol. 1987, 53 (12), 2714–2724.
(69) Zhang, Y.; Edwards, M. Accelerated chloramine decay and microbial growth by
nitrification in premise plumbing. J. Am. Water Work. Assoc. 2009, 101 (11), 51–62.
(70) Narahimhan, R.; Brereton, J.; Abbaszadegan, M.; Ryu, H.; Butterfield, P.; Thompson, K.;
Werth, H. Characterizing Microbial Water Quality in Reclaimed Water Distribution
Systems, American Water Works Association Research Foundation and WateReuse
Foundation, 2005.
(71) Wang, H.; Masters, S.; Hong, Y. J.; Stallings, J.; Falkinham, J. O.; Edwards, M. A.; Pruden,
A. Effect of Disinfectant, Water Age, and Pipe Material on Occurrence and Persistence of
Legionella, mycobacteria, Pseudomonas aeruginosa, and Two Amoebas. Environ. Sci.
Technol. 2012, 46 (21), 11566–11574.
(72) Lee, S. H.; Connor, J. T. O.; Banerji, S. K. Biologically mediated corrosion and its effects

144
on water quality in distribution systems. J. Am. Water Work. Assoc. 2015, 72 (11), 636–
645.
(73) Nguyen, C.; Elfland, C.; Edwards, M. Impact of advanced water conservation features and
new copper pipe on rapid chloramine decay and microbial regrowth. Water Res. 2012, 46
(3), 611–621.
(74) Knowles, R. Denitrification. Microbiol. Rev. 1982, 46 (1), 43–70.
(75) Zumft, W. G. Cell biology and molecular basis of denitrification. Microbiol. Mol. Biol. Rev.
1997, 61 (4), 533 ff.
(76) Opperdoes, F. R.; De Jonckheere, J. F.; Tielens, A. G. M. Naegleria gruberi metabolism.
Int. J. Parasitol. 2011, 41 (9), 915–924.
(77) Tyndall, R. L.; Ironside, K. S.; Metler, P. L.; Tan, E. L.; Hazen, T. C.; Fliermans, C. B.
Effect of thermal additions on the density and distribution of thermophilic amoebae and
pathogenic Naegleria fowleri in a newly created cooling lake. Appl. Environ. Microbiol.
1989, 55 (3), 722–732.
(78) Gomez-Smith, C. K.; LaPara, T. M.; Hozalski, R. M. Sulfate Reducing Bacteria and
Mycobacteria Dominate the Biofilm Communities in a Chloraminated Drinking Water
Distribution System. Environ. Sci. Technol. 2015, 49 (14), 8432–8440.

145
SUPPLEMENTARY INFORMATION FOR CHAPTER 6
Figure S1: Spearman’s rank correlation coefficients were determined between gene marker abundances determined by qPCR (x-axes)
and shotgun metagenomic sequencing (y-axes) for (A) Legionella spp. and (B) Mycobacterium spp.

146
Figure S2 – A) Taxonomy and B) read counts for negative controls included in 16S rRNA amplicon sequencing, including read counts
for samples for comparison

147
Table S1: BLAST matches for cloned qPCR products for specificity confirmation of N. fowleri assay Sample %
Identity
Highest
Similarity
BLAST
match
(Accession
No.)
Highest Similarity BLAST match (description)
1 95% KT375442.1 Naegleria fowleri 18S ribosomal RNA gene, partial sequence; internal transcribed spacer 1, 5.8S ribosomal
RNA gene, and internal transcribed spacer 2, complete sequence; and 28S ribosomal RNA gene, partial
sequence
2 98% KT375442.1 Naegleria fowleri 18S ribosomal RNA gene, partial sequence; internal transcribed spacer 1, 5.8S ribosomal
RNA gene, and internal transcribed spacer 2, complete sequence; and 28S ribosomal RNA gene, partial
sequence
3 98% KT375442.1 Naegleria fowleri 18S ribosomal RNA gene, partial sequence; internal transcribed spacer 1, 5.8S ribosomal
RNA gene, and internal transcribed spacer 2, complete sequence; and 28S ribosomal RNA gene, partial
sequence
4 97% KT375442.1 Naegleria fowleri 18S ribosomal RNA gene, partial sequence; internal transcribed spacer 1, 5.8S ribosomal
RNA gene, and internal transcribed spacer 2, complete sequence; and 28S ribosomal RNA gene, partial
sequence
5 98% KT375442.1 Naegleria fowleri 18S ribosomal RNA gene, partial sequence; internal transcribed spacer 1, 5.8S ribosomal
RNA gene, and internal transcribed spacer 2, complete sequence; and 28S ribosomal RNA gene, partial
sequence
6 95% KT375442.1 Naegleria fowleri 18S ribosomal RNA gene, partial sequence; internal transcribed spacer 1, 5.8S ribosomal
RNA gene, and internal transcribed spacer 2, complete sequence; and 28S ribosomal RNA gene, partial
sequence
For all sequences, no BLAST matches were found for any other tested Naegleria species (species tested: gruberi, americana, RNG, australiensis,
lovaniensis, clarki, italica, polaris, pagei, AG-2012)

148
Table S2: Shotgun metagenomic sequenced samples
System
Type Matrix Utility
Sample
Type Sample Name
Paired-end
reads
MG-RAST
Sample ID
Drinking biofilm A POU Drinkingwater_biofilm_ UtilityA_S5_L1S10 5,412,528 mgs295574
Drinking bulk water A POU Drinkingwater_bulkwater_ UtilityA_S5_L1S6 5,887,968 mgs295565
Drinking bulk water B POE Drinkingwater_bulkwater_ UtilityB_S0_1 38,668,577 mgs458886
Drinking bulk water B POE Drinkingwater_bulkwater_ UtilityB_S0_1_duplicate 32,868,754 mgs458889
Reclaimed bulk water A Influent Reclaimedwater_bulkwater_UtilityA_-1_1 7,132 mgs458922
Reclaimed bulk water A POE Reclaimedwater_bulkwater_UtilityA_S0_2 51,423,687 mgs458874
Reclaimed bulk water A POE Reclaimedwater_bulkwater_UtilityA_S0_3 12,036,240 mgs458865
Reclaimed bulk water A POE Reclaimedwater_bulkwater_UtilityA_S0_4 4,274,193 mgs458868
Reclaimed bulk water A POE Reclaimedwater_bulkwater_UtilityA_S0_L1S2 742,276 mgs295556
Reclaimed biofilm A POU Reclaimedwater_biofilm_ UtilityA_S5_L1S9 32,082,202 mgs466972
Reclaimed bulk water A POU Reclaimedwater_bulkwater_UtilityA_S5_2 40,816,121 mgs458880
Reclaimed bulk water A POU Reclaimedwater_bulkwater_UtilityA_S5_3 43,183,835 mgs458907
Reclaimed bulk water A POU Reclaimedwater_bulkwater_UtilityA_S5_4 43,580,278 mgs458913
Reclaimed bulk water A POU Reclaimedwater_bulkwater_UtilityA_S5_L1S5 3,827,661 mgs295562
Reclaimed bulk water B Influent Reclaimedwater_bulkwater_UtilityB_-1_1 39,243,688 mgs458937
Reclaimed bulk water B POE Reclaimedwater_bulkwater_UtilityB_S0_2 24,153,588 mgs458940
Reclaimed bulk water B POE Reclaimedwater_bulkwater_UtilityB_S0_3 20,416,825 mgs458943
Reclaimed bulk water B POE Reclaimedwater_bulkwater_UtilityB_S0_4 48,463,674 mgs458931
Reclaimed bulk water B POE Reclaimedwater_bulkwater_UtilityB_S0_L1S1 4,726,224 mgs295553
Reclaimed biofilm B POU Reclaimedwater_biofilm_ UtilityB_S5_L1S7 191,192 mgs295568
Reclaimed bulk water B POU Reclaimedwater_bulkwater_UtilityB_S5_2 28,668,559 mgs458925
Reclaimed bulk water B POU Reclaimedwater_bulkwater_UtilityB_S5_3 39,378,131 mgs458871
Reclaimed bulk water B POU Reclaimedwater_bulkwater_UtilityB_S5_4 18,232,136 mgs458877
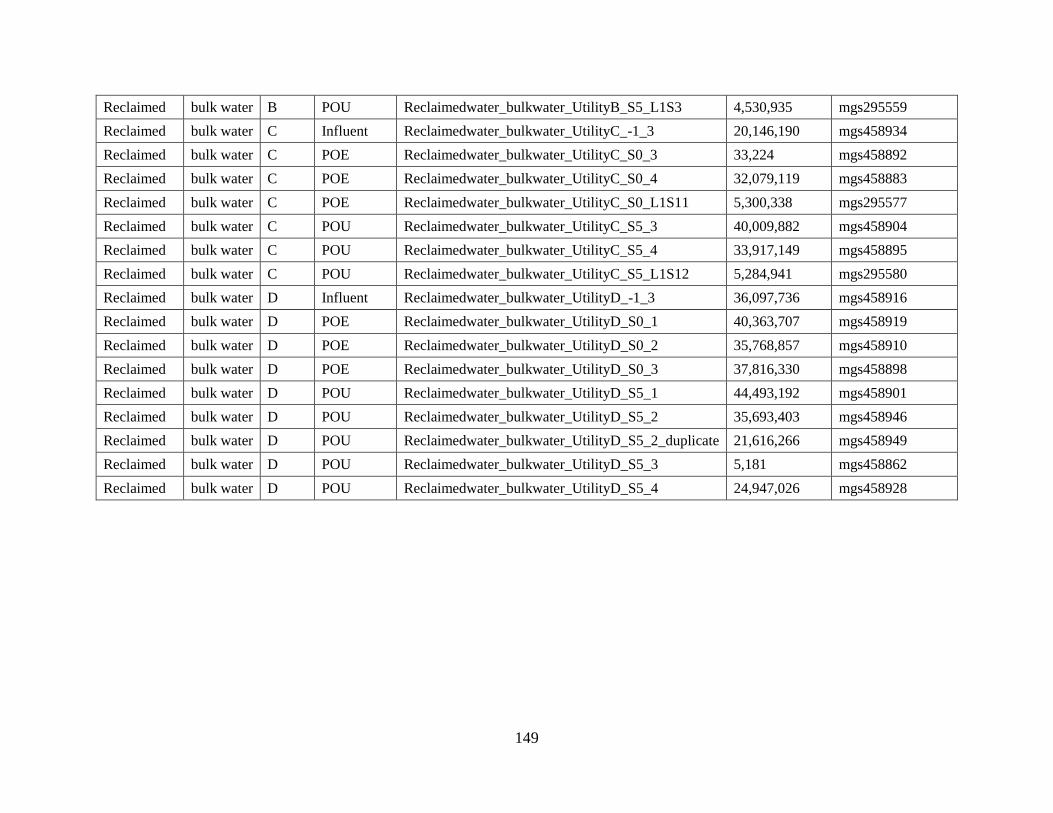
149
Reclaimed bulk water B POU Reclaimedwater_bulkwater_UtilityB_S5_L1S3 4,530,935 mgs295559
Reclaimed bulk water C Influent Reclaimedwater_bulkwater_UtilityC_-1_3 20,146,190 mgs458934
Reclaimed bulk water C POE Reclaimedwater_bulkwater_UtilityC_S0_3 33,224 mgs458892
Reclaimed bulk water C POE Reclaimedwater_bulkwater_UtilityC_S0_4 32,079,119 mgs458883
Reclaimed bulk water C POE Reclaimedwater_bulkwater_UtilityC_S0_L1S11 5,300,338 mgs295577
Reclaimed bulk water C POU Reclaimedwater_bulkwater_UtilityC_S5_3 40,009,882 mgs458904
Reclaimed bulk water C POU Reclaimedwater_bulkwater_UtilityC_S5_4 33,917,149 mgs458895
Reclaimed bulk water C POU Reclaimedwater_bulkwater_UtilityC_S5_L1S12 5,284,941 mgs295580
Reclaimed bulk water D Influent Reclaimedwater_bulkwater_UtilityD_-1_3 36,097,736 mgs458916
Reclaimed bulk water D POE Reclaimedwater_bulkwater_UtilityD_S0_1 40,363,707 mgs458919
Reclaimed bulk water D POE Reclaimedwater_bulkwater_UtilityD_S0_2 35,768,857 mgs458910
Reclaimed bulk water D POE Reclaimedwater_bulkwater_UtilityD_S0_3 37,816,330 mgs458898
Reclaimed bulk water D POU Reclaimedwater_bulkwater_UtilityD_S5_1 44,493,192 mgs458901
Reclaimed bulk water D POU Reclaimedwater_bulkwater_UtilityD_S5_2 35,693,403 mgs458946
Reclaimed bulk water D POU Reclaimedwater_bulkwater_UtilityD_S5_2_duplicate 21,616,266 mgs458949
Reclaimed bulk water D POU Reclaimedwater_bulkwater_UtilityD_S5_3 5,181 mgs458862
Reclaimed bulk water D POU Reclaimedwater_bulkwater_UtilityD_S5_4 24,947,026 mgs458928

150
Table S3: Water chemistry data for potable and reclaimed distribution system samples
temperature
(oC)
total Cl
(mg/L)
free Cl
(mg/L) pH
turbidity
(NTU)
conductivity
(S/m)
dissolved
oxygen
(mg/L)
total organic
carbon (µg/L)
dissolved
organic
carbon (µg/L)
biodegradable
dissolved
organic
carbon (µg/L)
Po
tab
le A (n=44) 25.5 ± 3.3 3.5 ± 1.1 -- 7.9 ± 0.2 1.5 ± 2.7 505.8 ± 119.5 5.6 ± 1 2470 ± 762 2748 ± 1002 465 ± 758
B (n=16) 18.1 ± 3.1 0.7 ± 0.3 0.7 ± 0.3 7.8 ± 0.2 0.3 ± 0.2 361.9 ± 97.2 7.7 ± 0.6 1120 ± 1422 1439 ± 1133 548 ± 564
C (n=20) 28.4 ± 4.4 -- 0.9 ± 0.1 7.9 ± 0.2 0.2 ± 0.2 727.4 ± 49.4 7.2 ± 0.5 188 ± 62 1252 ± 1980 1522 ± 1683
D (n=40) 19.4 ± 1.9 -- 0.2 ± 0.1 7.7 ± 0.1 1.3 ± 0.8 957.5 ± 416.5 5.5 ± 1.2 BDa BDa BDa
Rec
laim
ed A (n=20) 26.7 ± 4.3 0.4 ± 0.4 0.2 ± 0.2 7.7 ± 0.3 5.4 ± 10.8 1354.4 ± 215.4 6.5 ± 1.3 5714 ± 2564 6351 ± 2761 2137 ± 2321
B (n=19) 19.6 ± 2.9 2.3 ± 3.1 1.1 ± 2.1 7.3 ± 0.2 2.5 ± 2.6 736.9 ± 80.3 4 ± 1.4 10123 ± 6173 11087 ± 7014 6094 ± 8777
C (n=20) 26.2 ± 3.7 0.3 ± 0.1 0.4 ± 0.4 7.3 ± 0.1 0.6 ± 0.3 1195.8 ± 17.3 4.3 ± 2.8 2791 ± 1810 2944 ± 1646 2191 ± 2244
D (n=20) 20 ± 1.8 2.7 ± 2.3 0.2 ± 0.2 7.2 ± 0.1 2 ± 1 1542.9 ± 283.1 6.8 ± 2.4 3961 ± 2120 4333 ± 2069 2621 ± 1238
BD = below limit of detection a19/20 samples below limit of detection (4 µg/L)

151
Table S4: Spearman’s rank correlation coefficients and p-values for correlations between 16S rRNA or opportunistic pathogen gene
markers and physicochemical water quality parameters in potable and reclaimed water samples from each utility. Significant correlations
indicated in bold
Bulk Water
Temperature Total chlorine Ranked water age
Biodegradable Dissolved
oxygen Phosphorus Ammonia Potable dissolved
Utility A organic carbon
16S rRNA genes -0.0779 (0.6153) 0.1651 (0.2843) 0.4094 (0.0058) -0.4688 (0.0320) -0.5101 (0.0004) 0.1565 (0.3102) 0.0040 (0.9823)
Acanthamoeba spp. 0.0802 (0.6049) 0.0744 (0.6312) -0.2450 (0.1090) -0.0918 (0.6924) 0.2712 (0.0749) -0.1782 (0.2471) -0.0491 (0.7862)
Legionella spp. 0.2487 (0.1035) -0.0092 (0.9527) -0.0583 (0.7069) 0.1453 (0.5297) -0.0899 (0.5617) 0.0230 (0.8824) 0.0937 (0.6040)
Mycobacterium spp. 0.3774 (0.0116) -0.0208 (0.8932) 0.0261 (0.8663) -0.4282 (0.0528) -0.2158 (0.1595) 0.1349 (0.3828) -0.1676 (0.3512)
N. fowleri 0.4429 (0.0026) 0.1716 (0.2652) 0.2290 (0.1348) 0.3265 (0.1486) 0.2161 (0.1589) -0.3682 (0.0139) -0.0061 (0.9733)
P. aeruginosa 0.1984 (0.1966) -0.0149 (0.9233) 0.0088 (0.9550) 0.2344 (0.3064) 0.2090 (0.1734) -0.1372 (0.3745) 0.1825 (0.3095)
Utility B
16S rRNA genes 0.2412 (0.3682) -0.1030 (0.7042) -0.0722 (0.7558) -0.200 (0.6059) 0.1147 (0.6723) -0.696 (0.0005) NA
Acanthamoeba spp. 0.1444 (0.5938) 0.3831 (0.1431) -0.1433 (0.5353) 0.0685 (0.8611) -0.2644 (0.3224) -0.1784 (0.4392) NA
Legionella spp. 0.2851 (0.2845) -0.1031 (0.7040) 0.0711 (0.7594) -0.3105 (0.4160) 0.0731 (0.7878) -0.2645 (0.2465) NA
Mycobacterium spp. 0.2590 (0.3327) -0.3560 (0.1759) 0.0414 (0.8584) -0.6881 (0.0405) -0.5243 (0.0371) 0.6149 (0.0030) NA
N. fowleri -0.019 (0.9444) 0.5210 (0.0385) -0.1962 (0.3941) 0.3104 (0.4163) 0.1327 (0.6241) -0.4615 (0.0352) NA
P. aeruginosa 0.3342 (0.2058) 0.5897 (0.0162) -0.0232 (0.9205) -0.4108 (0.2721) -0.1565 (0.5627) -0.2661 (0.2436) NA
Utility C
16S rRNA genes 0.4147 (0.1243) NA -0.0475 (0.8664) -0.4286 (0.3965) -0.5929 (0.0198) 0.0966 (0.7320) -0.3000 (0.6238)
Acanthamoeba spp. 0.6299 (0.0067) NA 0.0380 (0.8848) -0.0546 (0.8979) -0.3413 (0.1800) 0.6144 (0.0087) -0.6669 (0.2189)
Legionella spp. -0.0319 (0.9034) NA 0.1868 (0.4728) 0.2182 (0.6036) -0.0372 (0.8874) -0.3222 (0.2072) 0.3000 (0.6238)
Mycobacterium spp. 0.2208 (0.3945) NA -0.4754 (0.0538) -0.5455 (0.1619) -0.3557 (0.1612) -0.1999 (0.4417) NA
N. fowleri -0.7911 (0.0002) NA -0.0807 (0.7583) 0.1690 (0.6891) 0.6588 (0.004) -0.2352 (0.3634) NA
P. aeruginosa -0.4085 (0.1035) NA 0.3384 (0.1840) 0.5774 (0.1340) 0.3572 (0.1592) -0.0911 (0.7280) NA
Utility D
16S rRNA genes 0.0837 (0.7256) NA -0.5527 (0.0115) NA -0.2515 (0.2848) -0.2949 (0.2068) NA
Acanthamoeba spp. 0.3251 (0.1620) NA -0.3281 (0.1579) NA -0.1344 (0.5721) 0.0023 (0.9925) NA
Legionella spp. 0.2677 (0.2539) NA -0.0987 (0.6788) NA 0.1082 (0.6499) -0.5835 (0.0069) NA
Mycobacterium spp. 0.1672 (0.4810) NA -0.0197 (0.9342) NA -0.3628 (0.1159) 0.4673 (0.0377) NA
N. fowleri 0.0290 (0.9035) NA 0.2031 (0.3905) NA 0.0474 (0.8427) -0.4118 (0.0712) NA
P. aeruginosa -0.2983 (0.2014) NA 0.0352 (0.8829) NA 0.0734 (0.7586) -0.2836 (0.2257) NA
Reclaimed

152
Utility A
16S rRNA genes 0.2805 (0.0880) 0.1004 (0.5486) 0.2479 (0.1334) -0.3981 (0.0397) 0.0708 (0.6772) 0.1841 (0.2685) 0.3313 (0.0851)
Acanthamoeba spp. 0.6373
(<0.0001) 0.0086 (0.9593) -0.0054 (0.9742) 0.2179 (0.2749) -0.0693 (0.6836) -0.0829 (0.6207) -0.3276 (0.0888)
Legionella spp. -0.0432 (0.7966) 0.0196 (0.907) 0.0608 (0.7171) -0.4332 (0.024) -0.1873 (0.2671) 0.0646 (0.7001) 0.0954 (0.6292)
Mycobacterium spp. 0.4968 (0.0015) 0.1771 (0.2874) -0.0897 (0.5924) -0.6943
(<0.0001) 0.2058 (0.2217) 0.1671 (0.3160) 0.2792 (0.1502)
N. fowleri 0.4753 (0.0026) -0.0248 (0.8827) 0.0046 (0.978) 0.195 (0.3298) -0.0701 (0.6803) 0.2766 (0.0927) -0.1281 (0.5159)
P. aeruginosa -0.3232 (0.0478) -0.1078 (0.5194) 0.0681 (0.6846) 0.2299 (0.2488) -0.0611 (0.7194) -0.2468 (0.1353) NA
Utility B
16S rRNA genes -0.3988 (0.1128) -0.7794 (0.0002) -0.329 (0.1972) 0.1958 (0.5419) -0.3007 (0.3423) -0.2426 (0.3480) NA
Acanthamoeba spp. 0.3313 (0.1939) 0.2032 (0.4341) 0.0500 (0.8490) 0.4421 (0.1501) 0.2797 (0.3786) -0.3117 (0.2233) NA
Legionella spp. -0.3616 (0.1538) -0.6536 (0.0044) -0.1498 (0.5660) 0.2465 (0.4399) -0.5429 (0.0682) -0.0934 (0.7215) NA
Mycobacterium spp. -0.1822 (0.4841) -0.7265 (0.0010) -0.0391 (0.8817) 0.5493 (0.0643) -0.0490 (0.8797) -0.4548 (0.0666) NA
N. fowleri 0.0983 (0.7074) -0.0304 (0.9077) -0.4598 (0.0633) NA -0.1404 (0.6633) 0.0346 (0.8952) NA
P. aeruginosa 0.3066 (0.2314) 0.2041 (0.4320) 0.3138 (0.2200) NA 0.1310 (0.6848) 0.0510 (0.8458) NA
Utility C
16S rRNA genes 0.3605 (0.1552) 0.2 (0.7471) -0.4134 (0.0991) 0.0727 (0.8317) -0.5172 (0.0335) 0.0723 (0.7903) 0.200 (0.7471)
Acanthamoeba spp. 0.3406 (0.1810) NA -0.2401 (0.3533) 0.3772 (0.2528) 0.2126 (0.4126) -0.1398 (0.6056) NA
Legionella spp. 0.2986 (0.2444) 0.4 (0.5046) -0.2099 (0.4189) -0.335 (0.314) -0.3502 (0.1682) -0.26 (0.3307) 0.600 (0.2848)
Mycobacterium spp. 0.5159 (0.0340) NA 0.0415 (0.8742) -0.4419 (0.1736) 0.1295 (0.6203) -0.7421 (0.001) NA
N. fowleri -0.7414 (0.0007) NA 0.0845 (0.747) -0.1706 (0.6161) 0.741 (0.0007) 0.4752 (0.0629) NA
P. aeruginosa NA NA NA NA NA NA NA
Utility D
16S rRNA genes -0.318 (0.1718) 0.3633 (0.1154) -0.2698 (0.2500) 0.4762 (0.2329) 0.1368 (0.5651) 0.0286 (0.9048) NA
Acanthamoeba spp. 0.0868 (0.7160) 0.3479 (0.1328) -0.4708 (0.0362) -0.2474 (0.5546) -0.0808 (0.7348) 0.1299 (0.5851) NA
Legionella spp. -0.0090 (0.9698) 0.1587 (0.5039) -0.0123 (0.9591) 0.7619 (0.0280) 0.3398 (0.1426) -0.3061 (0.1893) NA
Mycobacterium spp. -0.2081 (0.3787) -0.1023 (0.6677) -0.1411 (0.5530) -0.3095 (0.4556) 0.2482 (0.2913) -0.0026 (0.9912) NA
N. fowleri 0.1212 (0.6107) -0.0088 (0.9705) -0.1868 (0.4304) -0.4566 (0.2554) -0.2636 (0.2614) 0.2649 (0.2590) NA
P. aeruginosa NA NA NA NA NA NA NA
Biofilm
Potable
Utility A
16S rRNA genes 0.3259 (0.0401) 0.0527 (0.7466) 0.1271 (0.4345) -0.3281 (0.1703) -0.3448 (0.0293) -0.1363 (0.4016) -0.1102 (0.5621)
Acanthamoeba spp. 0.5396 (0.0003) 0.1106 (0.4969) 0.0784 (0.6305) 0.3444 (0.1487) 0.1849 (0.2533) -0.3819 (0.015) -0.1153 (0.544)
Legionella spp. 0.2526 (0.1159) 0.0124 (0.9395) 0.2325 (0.1488) 0.2125 (0.3825) -0.1524 (0.3478) -0.1468 (0.3659) -0.0127 (0.9471)

153
Mycobacterium spp. 0.4429 (0.0042) 0.0595 (0.7154) 0.1964 (0.2246) -0.1441 (0.5561) -0.0797 (0.6247) -0.0272 (0.8676) -0.1714 (0.365)
N. fowleri 0.0439 (0.7881) -0.2909 (0.0686) -0.0658 (0.6867) 0.5493 (0.0149) -0.1381 (0.3956) -0.0962 (0.5549) -0.1091 (0.5659)
P. aeruginosa 0.0615 (0.706) -0.2382 (0.1388) -0.0515 (0.7524) 0.3443 (0.1489) 0.2441 (0.1291) 0.0302 (0.8531) -0.2135 (0.2574)
Utility B
16S rRNA genes 0.4588 (0.0738) 0.3179 (0.2302) 0.2908 (0.201) 0.5 (0.1705) 0.3206 (0.226) -0.4779 (0.0284) NA
Acanthamoeba spp. 0.023 (0.9326) -0.2597 (0.3314) 0.4034 (0.0697) -0.3195 (0.402) -0.4551 (0.0765) 0.4298 (0.0518) NA
Legionella spp. 0.6801 (0.0037) 0.3388 (0.1993) 0.2383 (0.2982) 0.2609 (0.4978) 0.1197 (0.6589) -0.175 (0.4481) NA
Mycobacterium spp. 0.3499 (0.184) 0.0589 (0.8284) 0.279 (0.2207) -0.2739 (0.4758) 0.0065 (0.9808) 0.1948 (0.3974) NA
N. fowleri 0.2251 (0.4018) 0.2175 (0.4183) -0.1053 (0.6498) 0.7794 (0.0133) 0.1584 (0.558) -0.1213 (0.6005) NA
P. aeruginosa -0.4142 (0.1107) -0.095 (0.7264) -0.0285 (0.9023) 0.3651 (0.3339) -0.1812 (0.5018) -0.0615 (0.7911) NA
Reclaimed
Utility A
16S rRNA genes 0.1469 (0.4145) -0.1169 (0.517) 0.1727 (0.3366) 0.4439 (0.0385) -0.3586 (0.0439) -0.3062 (0.0831) -0.3989 (0.0535)
Acanthamoeba spp. 0.2881 (0.104) 0.0204 (0.9104) 0.012 (0.947) -0.1204 (0.5935) 0.3211 (0.0732) 0.0505 (0.7803) 0.0665 (0.7576)
Legionella spp. -0.2106 (0.2394) 0.0137 (0.9396) -0.0536 (0.7671) -0.1807 (0.4209) -0.066 (0.7197) 0.1641 (0.3615) 0.223 (0.2948)
Mycobacterium spp. 0.1046 (0.5623) -0.0023 (0.9899) 0.087 (0.6301) -0.4051 (0.0614) 0.4483 (0.0101) 0.1733 (0.3349) 0.4293 (0.0363)
N. fowleri 0.6008 (0.0002) -0.0608 (0.7369) -0.1304 (0.4696) 0.2197 (0.3259) -0.2785 (0.1227) 0.1647 (0.3598) -0.3607 (0.0833)
P. aeruginosa 0.1114 (0.537) 0.0929 (0.6071) 0.1327 (0.4617) -0.1204 (0.5935) 0.0876 (0.6337) 0.2612 (0.142) 0.1977 (0.3546)
Utility B
16S rRNA genes 0.5707 (0.0263) 0.3357 (0.2212) 0.2871 (0.281) 0.0636 (0.8525) -0.1841 (0.6354) -0.2964 (0.2834) NA
Acanthamoeba spp. 0.392 (0.1485) 0.6898 (0.0044) -0.1031 (0.7041) -0.3642 (0.2708) 0.2119 (0.5841) 0.0625 (0.8248) NA
Legionella spp. 0.1083 (0.7008) -0.1555 (0.58) 0.1053 (0.698) 0.5057 (0.1125) -0.4603 (0.2125) -0.4075 (0.1316) NA
Mycobacterium spp. 0.209 (0.4547) 0.1691 (0.5469) -0.1169 (0.6662) -0.2897 (0.3876) -0.0253 (0.9485) 0.2878 (0.2983) NA
N. fowleri -0.4186 (0.1205) -0.4393 (0.1013) -0.0462 (0.8651) 0.4781 (0.1369) 0.1558 (0.6889) -0.2455 (0.3778) NA
P. aeruginosa -0.4565 (0.0872) -0.1404 (0.6177) 0.1477 (0.5851) 0.1561 (0.6467) 0.6875 (0.0407) 0.0945 (0.7377) NA
NA indicates correlation not possile due to insufficient data points above detection or data not collected

154
Table S5: Spearman’s rank correlation coefficients and p-values for correlations between 16S rRNA genes or opportunistic pathogens
and phyla (or proteobacteria classes) determined by 16S rRNA sequencing. Brackets indicate suggested taxonomies.
phyla ρ p-value phyla ρ p-value phyla ρ p-value
Positive Legionella spp. Correlations Positive Mycobacterium spp.
Correlations Positive Acanthamoeba spp.
Correlations
WPS-2 0.4198 <.0001 WS5 0.1549 0.0098
TM7 0.4083 <.0001 Tenericutes 0.2992 <.0001 Firmicutes 0.1526 0.011
NKB19 0.3975 <.0001 SR1 0.2714 <.0001 Cyanobacteria 0.1385 0.0211
SR1 0.3718 <.0001 Lentisphaerae 0.2693 <.0001 Betaproteobacteria 0.1384 0.0212
Lentisphaerae 0.3429 <.0001 NKB19 0.2654 <.0001 Negative Acanthamoeba spp.
Correlations
Tenericutes 0.3207 <.0001 WWE1 0.2634 <.0001 SR1 -0.1455 0.0154
OP11 0.3108 <.0001 WPS-2 0.2575 <.0001 Positive N. fowleri
Correlations
Synergistetes 0.2752 <.0001
Euryarchaeota
(Archaea) 0.2571 <.0001
Crenarchaeota
(Archaea) 0.1537 0.0104
WWE1 0.2685 <.0001 OP11 0.2417 <.0001 Firmicutes 0.1188 0.0482
TM6 0.2546 <.0001 TM6 0.2417 <.0001 Negative N. fowleri
Correlations
BHI80-139 0.2232 0.0002 OP8 0.2304 0.0001 Alphaproteobacteria -0.1242 0.0389
BRC1 0.2082 0.0005 Fibrobacteres 0.2237 0.0002 SR1 -0.1271 0.0345
Bacteroidetes 0.2066 0.0005 TM7 0.2056 0.0006 Nitrospirae -0.1386 0.021
Chlamydiae 0.191 0.0014 Synergistetes 0.201 0.0008 [Thermi] -0.2231 0.0002
Thermotogae 0.182 0.0024 OD1 0.1988 0.0009 Positive P. aeruginosa
Correlations
Spirochaetes 0.1749 0.0035 GN02 0.1818 0.0024 Cyanobacteria 0.1829 0.0022
Fibrobacteres 0.1645 0.0061 Spirochaetes 0.1697 0.0046 AncK6 0.1546 0.01
OP8 0.1555 0.0095 OP3 0.1578 0.0085 Chloroflexi 0.1532 0.0107
Armatimonadetes 0.1472 0.0142 Chlamydiae 0.1523 0.0112 WS3 0.1291 0.0317
PAUC34f 0.1444 0.0162 Armatimonadetes 0.1447 0.016 Negative P. aeruginosa Correlations
Euryarchaeota
(Archaea) 0.1382 0.0214 Deferribacteres 0.1356 0.024 SBR1093 -0.1232 0.0405
GN02 0.1368 0.0228 Bacteroidetes 0.1309 0.0294 NKB19 -0.1439 0.0165
Fusobacteria 0.1322 0.0278 BRC1 0.1299 0.0306 TM7 -0.1496 0.0127
WS4 0.1288 0.0321 H-178 0.1237 0.0396 WPS-2 -0.1707 0.0044

155
Deferribacteres 0.1241 0.0391 Thermotogae 0.1194 0.0472 TM6 -0.1876 0.0017
Deltaproteobacteria 0.1193 0.0473
Negative Legionella spp. Correlations
Actinobacteria -0.1249 0.0378
Chloroflexi -0.1304 0.0301
FCPU426 -0.1398 0.0199
[Parvarchaeota]
(Archaea) -0.1499 0.0125
Caldithrix -0.1683 0.005
Nitrospirae -0.1931 0.0012
NC10 -0.1934 0.0012
Cyanobacteria -0.2158 0.0003
Table S6: Nitrifying bacteria, denitrifying bacteria, sulfate-reducing bacteria and heterotrophic aerobic bacteria in potable and reclaimed
bulk water samples determined by Biological Activity Reaction Test (Hach, Loveland, CO). Values indicate frequency of detection
(average ± standard deviation).
Potable Nitrifying Bacteria Denitrifying Bacteria Sulfate-reducing Bacteria
A (n=28) 18% (22400 ± 29760) 7% (50000 ± 0) ND
C (n=16) ND 75% (708333 ± 433188) 6% (1200 ± 0)
D (n=16) ND 6% (10000 ± 0) ND
Reclaimed
A (n=30) 27% (3125 ± 4249) 27% (143750 ± 66480) 93% (83800 ± 146471)
B (n=8) ND 63% (34000 ± 21909) 38% (73833 ± 48353)
C (n=15) 73% (26091 ± 23106) 67% (635000 ± 473198) 40% (402 ± 459)
D (n=14) 93% (73077 ± 20160) 14% (30000 ± 28284) 86% (61617 ± 138917)

156
CHAPTER 7 : IMPACT OF BLENDING FOR DIRECT POTABLE REUSE ON
PREMISE PLUMBING MICROBIAL ECOLOGY AND REGROWTH OF
OPPORTUNISTIC PATHOGENS AND ANTIBIOTIC RESISTANT BACTERIA
Emily Garner, Mandu Inyang, Elisa Garvey, Jeffrey Parks, Eric Dickerson, Justin Sutherland,
Andrew Salveson, Marc Edwards, Amy Pruden
ABSTRACT
Little is known about how introducing recycled water intended for direct potable reuse (DPR) into
distribution systems and premise (i.e., plumbing) will affect water quality at the point of use,
particularly with respect to effects on microbial populations and regrowth. The potential to trigger
growth of opportunistic pathogens (OPs) and the spread of antibiotic resistance genes (ARGs),
each representing serious and growing public health concerns, by introducing DPR water has not
previously been evaluated. In this study, the impact of blending DPR water with traditional potable
water sources was investigated with respect to treatment techniques, blending location, and
blending ratio. Water from four U.S. utilities was treated in bench- and pilot-scale treatment trains
to simulate DPR with blending. Water was incubated in simulated premise plumbing rigs made of
PVC pipe and brass coupons to measure regrowth of total bacteria (16S rRNA genes, heterotrophic
plate counts), OPs (Legionella spp., Mycobacterium spp.), ARGs (qnrA, vanA) and a marker of
horizontal gene transfer and multi-drug resistance (intI1). The microbial community composition
was profiled and the resistome (i.e., all ARGs present) was characterized in select samples. While
regrowth of 16S rRNA genes consistently occurred across tested scenarios (p≤0.0001), total
bacteria were not more abundant in the water or biofilm of any DPR scenario than in the
corresponding conventional potable condition (p≥0.0748). Regrowth of OPs and ARGs was not
significantly greater in water or biofilm for any DPR blends treated with advanced oxidation
compared to corresponding potable water (p≥0.1047). These results reveal no evidence that
blended DPR water will create unusual problems with either total bacteria, OPs, and ARGs in
premise plumbing.
INTRODUCTION
Population growth, urbanization, climate change, drought, and diminishing traditional
potable water sources have driven many municipalities to consider using alternative water sources
to meet future water demand (Gosling and Arnell, 2016; US EPA, 2012). One option for
augmenting traditional potable water sources is to implement direct potable reuse (DPR), or
advanced treatment of municipal sewage to achieve high-quality water suitable for potable use.
Advanced water treatment technologies typically applied for DPR include membrane filtration
(e.g., ultrafiltration, reverse osmosis) and advanced oxidation processes (AOPs; e.g., ozonation,
ultraviolet irradiation combined with hypochlorite or hydrogen peroxide) (Gerrity et al., 2013).
While these advanced treatment technologies have exhibited strong potential for removing
emerging contaminants, such as endocrine disrupting chemicals, pharmaceuticals, and personal
care products (Kim et al., 2007; Snyder et al., 2007; Wang et al., 2016; Watkinson et al., 2007),
their use also creates unique challenges. Reverse osmosis, for example, might alter corrosivity
(Applegate, 2017; Gerrity et al., 2013). To address this challenge, as well as the limitation that
wastewater reuse alone is likely insufficient to generate enough water to supply a municipality’s

157
potable water demand, recycled wastewater may be blended with a traditional potable source water
(Gerrity et al., 2013). However, little is known about how blending waters with such distinct water
chemistries might impact biological stability and microbial water quality in distribution systems
and premise plumbing.
While advanced water purification (AWP) is likely to be extremely effective at reducing
viable bacteria in DPR water, regrowth of bacteria is still likely to occur in distribution system
pipes and premise plumbing if the processed water does not achieve sufficient biological stability
(Chowdhury, 2012; Thayanukul et al., 2013). The U.S. Centers for Disease Control has identified
opportunistic pathogens (OPs), such as Legionella, to be a leading source of waterborne disease
outbreaks in the U.S. and called for awareness of the potential for water quality to degrade in pipe
systems (Centers for Disease Control and Prevention, 2011; Yoder et al., 2008). OPs are known to
thrive under the conditions typical of premise plumbing, including high water age, depleted
disinfectant residual, elevated water temperatures, the presence of plumbing materials that react
with disinfectant residuals or leach nutrients, high surface area to volume ratios, and highly
variable water flow conditions leading to long periods of stagnation (Falkinham, 2015; Nguyen et
al., 2012; Rhoads et al., 2016). Concerns are also emerging regarding the potential to spread
antibiotic resistance genes (ARG) via water reuse (Hong et al., 2013; Pruden, 2014), though to the
authors’ knowledge, the presence of ARGs in DPR water has never been studied. Reuse of
wastewater involves higher initial concentrations of antibiotics, antibiotic resistant bacteria (ARB),
and ARGs than are typical of most potable source waters, thus implementing treatment schemes
capable of removal of these contaminants is critical. While treatment trains typical of reuse have
shown promise for removing such contaminants more effectively than traditional wastewater
treatment, AOPs can result in incomplete removal of antibiotics (Watkinson et al., 2007), while
other advanced treatment approaches might fail to remove, and in some cases might even enrich,
certain ARGs (Alexander et al., 2016; Czekalski et al., 2016; Yoon et al., 2017). Incomplete
removal of ARB and ARGs during treatment creates potential for regrowth before water reaches
the consumer during distribution and in premise plumbing. Additionally, horizontal gene transfer
and uptake of extracellular ARGs (i.e., natural transformation) could facilitate dissemination of
antibiotic resistance within pipe systems (Garner et al., 2016b).
Here we evaluated the impact of blending water source type and quality, water treatment
methods, and blending ratio on bacterial regrowth potential in premise plumbing. Full-scale
wastewater treatment trains from each of four partner water utilities were supplemented with
bench- or pilot-scale AWP processes to achieve water quality suitable for DPR. DPR water was
blended with each municipality’s potable source water at ratios ranging from 0-50%, consistent
with utility projections for future DPR implementation, and incubated in pipe rigs with regular
water changes over eight weeks and compared to the corresponding potable water control. Rig
influent water (i.e., the simulated point of compliance; POC) and effluent water (i.e., simulated
point of use; POU) and biofilm samples were collected and analyzed for gene markers of total
bacteria (16S rRNA genes), OPs (Legionella spp., Mycobacterium spp., and P. aeruginosa), two
ARGs of clinical significance (vanA, qnrA), and a key horizontal gene transfer element (intI1),
along with culturing of common bacterial indicators (heterotrophic plate count, E. coli, and
enterococci), comprehensive microbial community profiling via 16S rRNA gene amplicon
sequencing, and shotgun metagenomic sequencing of select samples. Various biochemical
indicators of microbial regrowth potential, including biodegradable dissolved organic carbon

158
(BDOC) and biological activity reaction tests (BARTs), were also analyzed and compared. This
study provides valuable insight into potential microbial responses and public health concerns when
introducing blended DPR water to distribution systems.
MATERIALS AND METHODS
Rig design and operation
Simulated premise plumbing pipe rigs were constructed of polyvinylchloride (PVC) pipe
with brass inserts. Rigs were 1.5 m long with an inner diameter of 5 cm. Brass inserts were 46 cm
long, 1.3 cm in diameter, and comprised of standard yellow brass that is nominally 60% copper,
35% zinc, and 3% lead. Forty pipe rigs were constructed and pre-tested according to National
Sanitation Foundation (NSF) Standard 61 to remove outliers (NSF, 2007) as described in the
supplementary information. The test scenarios studied are summarized in Table 7-1. DPR water
was treated using either pilot- or bench-scale treatment as described in the supplementary
information. Treated waters were dosed with chlorine or chloramine residuals consistent with those
typically employed by each utility: chloramine at 1.8-2.2 mg/L total chlorine for Utility 1,
chloramine at 3.8 mg/L total chlorine for Utility 2, 1.5 mg/L free chlorine for Utility 3, and
chloramine at 2.6 mg/L total chlorine for Utility 4. To produce enough treated water for eight
weeks of rig operation, water was treated in two batches at weeks 1 and 4. After blending and
treatment, to preserve the physicochemical characteristics of treated water for long-term water
changes, water for use during the third and fourth weeks after each batch treatment was pasteurized
as described by Escobar and Randall (2000). To pasteurize, jugs of treated water were placed in a
water bath and heated until the inner temperature reached 72°C for 30 minutes. All treated water
was stored in one-gallon amber glass jugs at 4°C until use. After storage, chlorine and chloramine
residuals were dosed as needed to once again reach target concentrations. Premise plumbing
operation was simulated by replacing 100% of the volume in each rig with fresh stored, treated
water three times per week. Duplicate pipe rigs for each test scenario were incubated at room
temperature (~20°C) during eight weeks of this simulated operation.
Water was collected from the final two water changes during week eight in sterile one liter
polypropylene containers for molecular analysis and in acid-washed, baked 250 milliliter amber
glass bottles for carbon analysis. At the conclusion of each eight-week incubation, biofilm samples
were collected by swabbing once along the length of the brass insert with a sterile cotton-tipped
applicator. The sample end of the swab was transferred directly to a sterile DNA extraction lysing
tube. Water samples for molecular analysis were filter-concentrated immediately after collection
onto 0.2 µm cellulose nitrate filters in pre-packaged, sterile filter funnels (Nalgene, Rochester,
NY). Filters were folded into quarters, torn into 1 cm2 pieces using sterile forceps, transferred to
lysing tubes, and frozen at -20ºC. DNA was extracted using a FastDNA SPIN Kit (MP
Biomedicals, Solon, OH) according to manufacturer instructions.

159
Water chemistry
A 30 milliliter aliquot was taken for total organic carbon (TOC) analysis and a second
aliquot was filtered through pre-rinsed 0.22 µm pore size mixed cellulose esters membrane filters
(Millipore, Billerica, MA) for dissolved organic carbon (DOC) analysis. BDOC was measured as
previously described by Servais et al. (1989) with incubation time extended to 45 days. Samples
were analyzed on a Sievers 5310C portable TOC analyzer (GE, Boulder, CO) according to
Standard Method 5310C (APHA, 2005).
Culturing
The fraction of the total HPC capable of growth in the presence of antibiotics was
determined by plating POC and POU samples on R2A media (Hardy Diagnostics, Santa Maria,
CA) with and without one of nine antibiotics added. Media was supplemented separately with
ampicillin (4 µg/mL), ciprofloxacin (0.5 µg/mL), chloramphenicol (4 µg/mL), gentamicin (2
µg/mL), oxacillin (1 µg/mL), rifampin (0.5 µg/mL), sulfamethoxazole (128 µg/mL), tetracycline
(2 µg/mL), and vancomycin (0.5 µg/mL) (BD, Franklin Lakes, NJ). To select the antibiotic
concentrations used, a trial was conducted using local tertiary treated recycled water after
subsequent granular activated carbon filtration. The concentration of each antibiotic that produced
a 2-log reduction in plate count compared to the R2A agar without antibiotics was selected.
Culturing was performed according to standard method 9215C (APHA, 2005). Briefly, four ten-
fold serial dilutions of water sample were prepared and 0.1 milliliter of each was spread onto
prepared R2A agar. Plates were incubated for seven days at 37°C and enumerated, with an upper
and lower limit of quantification (LOQ) of 20 and 200 colonies per plate. E. coli and enterococci
were cultured from week eight simulated POC and POU water samples using Colilert and
Enterolert Quantitrays (IDEXX, Westbrook, ME). BART tests (Hach, Loveland, CO) were used
to approximate the presence of active nitrifying, denitrifying, sulfate-reducing, acid-producing,
slime-producing, and heterotrophic aerobic bacteria.
Quantitative polymerase chain reaction
OP gene markers and ARGs were quantified by quantitative polymerase chain reaction
(qPCR) using previously published primers and thermocycler conditions (Table S1). The
universial bacterial gene, 16S rRNA, genes associated with three OPs (Legionella spp.,
Mycobacterium spp., Pseudomonas aeruginosa), two ARGs (a quinolone resistance gene, qnrA,
and a vancomycin resistance gene, vanA), along with the class 1 integron integrase gene intI1 were
quantified via qPCR. Reaction components are described in detail in the supplementary
information. Prior to all analyses, 16S rRNA genes were quantified in a representative subset of
samples diluted ten-, 20-, 50-, and 100-fold as well as undiluted to identify the minimum
concentration at which inhibition was negligible. A ten-fold dilution was selected and applied to
all samples. All qPCR runs included a triplicate negative control and triplicate standard curves
consisting of ten-fold serial dilutions ranging from 107-101 gene copies/µl for all genes except 16S
rRNA, for which 108-102 gene copies/µl were used. The limit of quantification (LOQ) for all genes
was 10 gene copies per reaction.

160
Table 7-1: Blending scenarios, blending water source, treatment, disinfectants, and blending location tested for each utility
Utility Scenarioa Source of potable
water for blending
Reuse water treatmentc
performed prior to blending
Treatment
following blending Disinfectant
1
100% Surface water Treated potable water
derived from surface
waterf
-- O3, coagulation,
flocculation,
sedimentation,
filtrationb
NH2Cl 90% Surface/10% O3-BAC O3, BAFf
90% Surface/10% AWP MF, RO, UV/AOPf
50% Surface/50% AWP
2
100% Groundwater Treated potable water
derived from
groundwater (treated
with iron and
manganese removalf)
--
-- NH2Cl
90% Groundwater/10% AWP MF, RO, UV/AOPp
50% Groundwater/50% AWP
50% Groundwater/50%
AWP-Past
UF, RO, UV/AOP, and
pasteurizationp
3
100% Surface water
Treated potable water
derived from surface
water (treated with
O3 f)
--
Coagulation,
flocculation,
sedimentation,
filtrationb
Cl2
95% Surface/5% Tertiary Secondary treatment with
nitrification, partial
denitrification, and biological
phosphorus removalf 90% Surface/10% Tertiary
90% Surface/10% O3-BAC O3, BAFf
50% Surface/50% O3-BAC
4
100% Groundwater Treated potable water
derived from
groundwaterf
--
O3, coagulation,
flocculation,
sedimentation,
filtrationb
NH2Cl
90% Groundwater/10% AWP MF, RO, UV/AOPf
100% Surface Treated potable water
derived from surface
waterf
--
90% Surface/10% AWP MF, RO, UV/AOPf
90% Surface/10% Industrial
AWP Industrial treatmentf
aSurface water and Groundwater refer to treated potable water derived from the designated source cAll reuse water treatment is performed subsequent to secondary treatment unless specified otherwise fFull scale; pPilot scale; bBench scale
O3 = Ozonation; UV = ultraviolet irradiation, UV/AOP = ultraviolet irradiation with hypochlorite or hydrogen peroxide; MF =
membrane filtration; RO = reverse osmosis; UF = ultrafiltration; BAF = biologically active filtration

161
16S rRNA gene amplicon sequencing and shotgun metagenomics
Bacterial communities were profiled using gene amplicon sequencing with barcoded
primers (515F/806R) targeting the V4 region of the 16S rRNA gene (Caporaso et al., 2012).
Triplicate PCR products were composited, and 240 ng of each composite was combined and
purified using a QIAquick PCR Purification Kit (Qiagen, Valencia, CA). Sequencing was
conducted at the Biocomplexity Institute of Virginia Tech Genomics Sequencing Center (BI;
Blacksburg, VA) on an Illumina MiSeq using a 250-cycle paired-end protocol. Field, filtration,
DNA extraction blanks, and a least one PCR blank per lane were included in the analysis.
Shotgun metagenomic sequencing was conducted on the POC and week eight POU
samples from each system, on week eight POU water and biofilm samples from each potable
source water, and each 10% DPR blend scenario. Sequencing was conducted as previously
described (Garner et al., 2016a) on an Illumina HiSeq 2500 with 100-cycle paired end reads at BI.
Select source and potable samples were also sequenced.
Data analysis of 16S rRNA gene amplicon sequencing and shotgun metagenomic data was
conducted as previously described (Garner et al., 2016a), with details also provided in the
supplementary information.
Statistical Analysis
Statistical differences between BDOC, 16S rRNA genes, and HPC in samples were tested
by Tukey HSD in JMP (v. 13). For OPs and ARGs, which were non-normally distributed, a
Kruskal Wallis rank sum test with a posthoc pairwise Wilcoxon test was performed in JMP.
Spearman’s rank correlation was used to test for correlations between BDOC and 16S rRNA genes,
OPs, or ARGs, while a Pearson product-moment correlation was used to test for correlations
between HPC and 16S rRNA genes. Weighted UNIFRAC distance matrices generated in QIIME
were imported to PRIMER-E (version 6.1.13) for analysis of similarities (ANOSIM).
RESULTS AND DISCUSSION
Comparison of regrowth in simulated premise plumbing rigs
Treated blends of DPR water and each utility’s traditional potable water were incubated in
pipe rigs to simulate water use in premise plumbing to examine regrowth of bacteria. 16S rRNA
genes, a proxy for total bacteria, were measured in week eight at the simulated POC and POU
samples following eight weeks of simulated use in the pipe rigs to examine regrowth of total
bacteria (Figure 7-1). Across conditions, the abundance of 16SrRNA genes at the simulated POU
was greater than at the POC (paired Wilcoxon; p≤0.0001). The most regrowth was observed in
Utility 1 scenarios utilizing 90-100% Surface water (i.e., treated potable water derived from
surface water; 2.7-4.2 log increase), Utility 4’s 100% Groundwater scenario (i.e., treated potable
water derived from groundwater; 3.19 log increase), and Utility 3’s 90% Surface/10% Tertiary
blend (3.3 log increase). Only the 90% Surface/10% AWP condition from Utility 3 did not result
in regrowth of total bacteria (0.4 log decrease), while all other scenarios produced between 0.2 and
2.0 log increase in 16S rRNA genes. Thus, most conditions stimulated re-growth of bacteria, as

162
expected, but surprisingly, it was sometimes the 100% traditional potable water that yielded the
most re-growth.
Figure 7-1: qPCR abundances of 16S rRNA genes, OPs, and ARGs. Abundances of 16S rRNA
genes, opportunistic pathogen gene markers (Legionella spp., Mycobacterium spp., P.
aeruginosa), antibiotic resistance genes (vanA, qnrA), and the class 1 integron integrase gene intI1
from samples collected after eight weeks of pipe rig incubation at the simulated point of
compliance (POC), simulated point of use (POU), and in the biofilm (BF). Asterisks indicate the
gene was detected below the limit of quantification. Surface water and Groundwater conditions
refer to treated potable water derived from each source. AWP = advanced water purification using
membrane filtration, reverse osmosis and ultraviolet irradiation with the addition of hypochlorite
or hydrogen peroxide; O3-BAC = ozone followed by biologically active carbon filtration; Past =
refers to treatment using pasteurization; Industrial refers to wastewater derived from an industrial
source rather than municipal wastewater, as in all other cases. Refer to Table 7-1 for additional
details regarding treatment schemes.

163
Comparing within Utility 2 and Utility 3 scenarios, there were no differences in total
regrowth across the different treatments and blends (i.e., no difference in log increase in 16S rRNA
gene abundances), indicating that DPR scenarios did not produce more regrowth than the
corresponding potable source waters (Wilcoxon; p≥0.2996). For Utility 1, the DPR scenario with
the greatest blend ratio (50% Surface/50% AWP) resulted in more regrowth than the corresponding
lesser blend ratio (p=0.0490), but still produced less regrowth than the traditional potable source
water alone (p≥0.1632). For Utility 4, the 100% Surface water and 100% Groundwater scenarios
also produced more regrowth than some of the DPR blends, specifically 10% AWP DPR condition
(p≤0.0404). The 90% Surface/10% Industrial AWP blend produced an equivalent amount of
regrowth as the corresponding potable source water (p=0.426).
Biofilms are of interest given that they are thought to represent the primary reservoir for
microbial regrowth in distribution systems (Liu et al., 2014), though recent reports highlight that
substantial regrowth can occur in the bulk phase too (Proctor et al., 2016). In the present study,
there were no apparent effects of DPR blends on the biomass density of the biofilms after the eight-
week incubation. In the case of each of the four utilities, the 16S rRNA gene abundances in
biofilms were not significantly greater in DPR blend scenarios than the corresponding potable
source water scenarios (p≥0.0748).
Enumeration of 16S rRNA genes by qPCR captures genes from both live and dead cells,
thus relative differences were compared above to estimate regrowth. To compare the findings with
a standard culture-based method, heterotrophic plate counts were also enumerated for a subset of
scenarios. 16S rRNA gene copy numbers and HPCs were found to be significantly correlated
(Pearson, R2=0.5127, p=0.0053). While substantial regrowth of total bacteria was noted for the
majority of conditions, neither HPC nor 16S rRNA gene abundances indicated greater regrowth in
any DPR scenarios than in the corresponding potable water condition. These results are congruent
with expectations based on available literature, as regrowth of total bacteria (via proxys such as
HPC, total coliforms, and 16S rRNA genes) is well-documented in traditional potable water
distribution systems and premise plumbing (LeChevallier et al., 1991; Wang et al., 2012). Much
less information is available regarding regrowth during distribution of reuse water, though studies
of non-potable reclaimed water systems have similarly demonstrated substantial regrowth (Jjemba
et al., 2010; Narahimhan et al., 2005).
E. coli and enterocci were also cultured from the simulated POC and POU of each rig, but
no positives were detected. This was consistent with the expectation that fecal indicators do not
survive well in relatively cool, oligotrophic water systems; which represent a very different
environment than the mammalian gut, and therefore are not generally subject to regrowth.
Microbial community composition of regrowth
16S rRNA gene amplicon sequencing was carried out to gain insight into the kinds of
bacteria subject to regrowth under the various scenarios. Notably, the composition of the microbial
community typically shifted during pipe rig incubation. Within each scenario, the microbial
community composition of simulated POU water samples were significantly different from POC
samples (ANOSIM, R=0.706, p=0.001) (Figure 7-2). Also, the composition of POU samples
varied widely across utilities (R=0.450, p=0.001) and among scenarios within each utility

164
(R=0.430, p=0.001). Within each scenario, water and biofilm communities were not significantly
different (R=0.216, p=0.064), suggesting that there was interplay between the bulk water and
biofilm under these stagnant pipe rig conditions, leading to a high degree of similarity between the
two matrices. This contrasts previous studies of potable premise plumbing, in which bulk water
microbial communities were found to be largely unique compared to that of the corresponding
biofilm (Ji et al., 2017; Liu et al., 2014).
For Utility 1 water, all simulated POU samples were dominated by Alphaproteobacteria
(61.0-99.9%), though POC samples were dominated by a combination of Alphaproteobacteria,
Betaproteobacteria, and Gammaproteobacteria. Biofilms were also overwhelmingly dominated by
Alphaproteobacteria, with the exception of the 50% Surface/50% AWP scenario, which was
dominated by Gammaproteobacteria (37.5-65.9%) and Betaproteobacteria (22.4-32.1%). The vast
majority of Alphaproteobacteria detected in POU water and biofilm samples belonged to the
Methylobacteriaceace family (57.9-99.9% of total), while the 50% Surface/50% AWP scenario
biofilm samples included Sphingomonadaceae as the dominant Alphaproteobacteria,
Comamonadaceae as the dominant Betaprotebacteria, and Moraxellaceae as the dominant
Gammaproteobacteria. Of Utility 2 samples, the 100% Groundwater POU water and biofilm
samples were dominated by Alphaproteobacteria (51.7-98.0%), while the AWP blends were
typically dominated by Betaproteobacteria (6.4-30.9%) and Gammaproteobacteria (12.3-81.7%).
The 50% Groundwater/50% AWP-Past blend was dominated by Actinobacteria (62.7-75.9%).
Utility 3 POU water and biofilm samples were largely dominated by Gammaproteobacteria (16.2-
99.4%) and Alphaproteobacteria (12.8-81.6%) for the 100% Surface scenario and both tertiary
blends. The O3-BAC conditions were largely dominated by Actinobacteria, Betaproteobacteria,
Alphaproteobacteria and Bacilli. Utility 4 samples were largely dominated by
Alphaproteobacteria, Betaproteobacteria, and Actinobacteria across all scenarios.
While 16S rRNA amplicon sequencing does not have the resolution to confirm the presence
of pathogens, it is possible to screen for phylogenetic groups known to contain pathogenic strains.
Across scenarios, of the Actinobacteria present, 93% belonged to the genus Mycobacterium. Of
the Alphaproteobacteria, 41% belonged to the genus Methylobacterium, 23% belonged to the
genus Sphingomonas, and 14% belonged to Blastomonas. 21% of Betaproteobacteria belonged to
the Comomonadaceae family but could not be classified at the genus level. Ralstonia, Acidovorax,
and Limnohabitans were responsible for 15%, 15%, and 10% of Betaproteobacteria, respectively.
Gammaproteobacteria primarily belonged to the Nevskia, Acinetobacter, and Pseudomonas genera
(44%, 17%, and 10%, respectively) and no known enteric pathogens, which was consistent with
fecal indicator monitoring noted above. Thus, based on amplicon sequencing, only a few
potentially pathogenic groups were identified: Mycobacteria, Enterobacter, and Pseudomonas,
both of which contain several non-pathogenic strains as well.
The microbial community composition shifted markedly from the simulated POC to POU,
with samples collected at the POC having a greater alpha diversity (Simpson; 0.916±0.077) than
simulated POU (0.541±0.315) or biofilm samples (0.670±0.302) (p≤0.0006). This suggests that
the conditions present in the premise plumbing rigs selected for bacteria well-suited for regrowth,
rather than indiscriminately enriching all bacteria. Blended waters trended towards having a higher
alpha diversity than potable waters at the POC (0.930±0.067 vs. 0.882±0.097) as well as the

165
Figure 7-2: Microbial community profiles for simulated premise plumbing pipe rigs. Samples
profiled at the simulated point of compliance (POC), simulated point of use (POU), and in the
biofilm (BF) as determined by amplicon sequencing of using universal primers targeting V4 region
of Bacteria and Archaeae. (1) and (2) indicate experimental replicate premise plumbing rigs.
Surface water and Groundwater conditions refer to treated potable water derived from each source.
AWP = advanced water purification using membrane filtration, reverse osmosis and ultraviolet
irradiation with the addition of hypochlorite or hydrogen peroxide; O3-BAC = ozone followed by
biologically active carbon filtration; Past = refers to treatment using pasteurization; Industrial
refers to wastewater derived from an industrial source rather than municipal wastewater, as in all
other cases. Refer to Table 7-1 for additional details regarding treatment schemes.

166
simulated POU (0.582±0.320 vs. 0.435±0.291) and biofilm (0.681±0.300 vs. 0.646±0.323), though
differences were not significant (p≥0.1526).
Regrowth of OPPPs
The occurrence of OPs at the simulated POU versus POC was explored quantitatively via
qPCR targeting genes specific for Legionella spp., Mycobacterium spp., and P. aeruginosa. In
Utility 1 scenarios, there were no significant differences among scenarios for OPs at the POC
(Wilcoxon, p≥0.4533) or in the conditioned biofilm (p≥0.1859). There were no significant
differences at the simulated POU in Legionella spp. levels for Utility 1 scenarios (p≥0.1709) and
the gene was only detected at sub-quantifiable levels in the 90% Surface/10% O₃-BAC conditions
and 100% Surface conditions. Mycobacterium spp. genes were more abundant in the 90%
Surface/10% O₃-BAC scenario than the 90% Surface/10% AWP scenario (p=0.0044), indicating
that membrane filtration may offer benefits to limiting regrowth of this genus of bacteria compared
to biofiltration. The potable source water scenario resulted in more Mycobacterium spp. genes in
the rig POU than either AWP DPR blend condition (p=0.0013), suggesting that blending the
potable source water with highly treated DPR water actually offered benefits for limiting regrowth
of Mycobacteria spp.
While Legionella spp. genes were detected in all Utility 2 rig POU samples, there were no
significant differences in abundance of the gene among scenarios (p≥0.1047). Pasteurized water
also supported regrowth of Mycobacterium spp., while the corresponding non-pasteurized scenario
did not (p=0.0046). There were no significant differences in abundance of OP gene markers
detected in biofilms across scenarios (p≥0.2453). In Utility 3 scenarios, Legionella spp. gene
markers were not detected in any POU water or biofilm samples. Greater Mycobacterium spp.
regrowth was observed in the 90% Surface/10% O₃-BAC and the 50% Surface/50% O₃-BAC POU
water than in the potable source water POU (p≤0.0323). In the biofilm, Mycobacterium spp. was
detected in both the 90% Surface/10% Tertiary and 50% Surface/50% O₃-BAC rigs, but
concentrations were not significantly greater than scenarios where the gene was not detected
(p≥0.2207). There were no OP gene markers detected in any POC, POU, or biofilm samples from
Utility 4 scenarios. P. aeruginosa genes were not detected in POC, POU or biofilm samples
collected from any scenarios from any utilities. Thus, the Pseudomonadaceae detected by 16S
rRNA gene amplicon sequencing were likely non-pathogenic strains.
When compared to traditional potable source waters, DPR treatment schemes from Utilities
1, 2, and 4 all produced reuse waters that were successful at limiting regrowth of OPs. Membrane
filtration appears to be a particularly promising treatment approach for limiting regrowth of OPs,
as membrane filtered waters from Utility 1 tended to harbor less regrowth than biofiltered waters.
When treatment approach alone was not sufficient to limit OP regrowth, selection of an optimal
blend ratio appears to be a particularly promising approach for limiting regrowth, as more regrowth
was observed in greater blend ratios for Legionella spp. in Utility 2 and Mycobacterium spp. in
Utility 3.
Previous studies have indicated that both Legionella spp. and Mycobacterium spp. are
widespread in non-potable reclaimed water at the POU (Fahrenfeld et al., 2013; Jjemba et al.,
2010; Whiley et al., 2015), highlighting the importance of identifying AWP treatment approaches

167
that can produce finished water that effectively limits regrowth of OPs in distribution systems and
premise plumbing. Though regrowth of OPs has not been previously studied in DPR distribution
systems or the associated premise plumbing, results of this study indicate that AWP is highly
effective at producing biostable waters that do not support regrowth of OPs. The conditions in this
study represent a worst-case scenario for premise plumbing with long stagnation periods, however
further study examining the relevance of these trends in full-scale systems over longer time periods
and with mature biofilms would be valuable.
Occurrence of ARGs
While the presence of diverse ARGs belonging to the antibiotic classes glycopeptide,
macrolide, sulfonamide, tetracycline have been previously documented in non-potable reuse water
distribution systems (Fahrenfeld et al., 2013), to the authors’ knowledge, this study is the first to
examine the presence of ARGs in DPR waters. There are currently no standard methodologies for
monitoring antibiotic resistance in recycled water, but it is becoming common practice to quantify
a number of target ARGs as conservative indicators for assessing potential for selection and spread
of resistance in various aquatic reservoirs (Berendonk et al., 2015). Monitoring ARGs provides a
conservative indicator because, while bacteria may be killed, their DNA carrying ARGs still has
the potential to be taken up by downstream bacteria. Here, two ARGs, vanA and qnrA, which
encode resistance to critically-important antibiotics, vancomycin and quinolones, respectively,
were quantified via qPCR. The gene capture element intI1 was also measured as a broad indicator
for anthropogenic influence and potential for horizontal transfer of multi-antibiotic resistance
(Figure 7-1).
In Utility 1 samples, vanA was widely detected, but at sub-quantifiable concentrations,
with the 90% Surface/10% AWP scenario yielding the only quantifiable occurrence (Figure 7-1).
There were no significant differences between scenarios for vanA concentration in either the POU
water (Wilcoxon, p=0.1709) or the biofilm (p≥0.4142), and qnrA and intI1 were not detected in
any biofilm samples. In Utility 2 samples, ARGs and intI1 were detected sporadically at sub-
quantifiable levels and there were no differences between scenarios for the POU water (p≥0.0764)
or biofilm (p≥0.4795) for any of the genes. For Utility 3 scenarios, intI1 and qnrA were
occasionally detected but not quantifiable. There were no significant differences in gene
abundances between scenarios for either gene in the POU water (p≥0.3816) or biofilm samples
(p≥0.6171). No ARGs were detected in any samples from Utility 4 scenarios. Together, these
results are a promising preliminary indication that these highly treated DPR waters do not pose
added risk in terms of producing waters enriched in ARGs, relative to traditional potable water, or
in proliferating ARGs in the distribution system. However, this issue merits further monitoring,
particularly as more standardized tools for ARG monitoring become available and over longer
study periods.
A subset of samples representing the traditional potable source water and the 10% DPR
blend of each scenario were subject to shotgun metagenomic sequencing with annotation against
the Comprehensive Antibiotic Resistance Database (McArthur et al., 2013) to broadly profile
ARGs beyond those quantified by qPCR. A large portion of the samples (all samples from Utility
2 and a subset from Utilities 3 and 4) did not yield sufficient DNA to conduct metagenomic
sequencing. Of the scenarios that could be sequenced (Figure 7-3), annotation of shotgun

168
metagenomic reads against CARD revealed that total abundances of known ARGs ranged from
1.5 to 6.5 log gene copies per milliliter in bulk water and from 3.7 to 6.0 log gene copies per
biofilm swab in samples that were able to be sequenced. From the samples that were sequenced, a
total of 212 different ARGs were detected across the dataset, ranging from five to 94 different
ARGs per sample. ARG profiles varied strongly according to utility (Figure S1; ANOSIM,
R=0.789, p=0.001), but did not vary as strongly by scenario within each utility (R=0.307,
p=0.012). Multidrug, trimethoprim, and aminoglycoside resistance were abundant across all
utilities, while rifampin, tetracycline, and peptide resistance were notably abundant only in Utility
4 samples. Overall, the ten most abundant genes across the dataset included one trimethoprim
resistance gene (dfrE), two rifampin genes (RbpA, arr-1), one aminoglycoside gene (AAC(2')-Ib),
and five multidrug resistance genes (mtrA, mdtB, adeG, ceoB, acrB, mexF). Utility 4 samples
were largely dominated by dfrE, mtrA, RbpA, AAA(2')-Ib, and arr-1, while Utility 1 and 3 samples
were dominated by dfrE, mdtB, adeG, ceoB, and acrB. This strong grouping of ARGs by utility
in standardized premise plumbing rigs, suggests that overarching factors such as geography and
physicochemical and microbial characteristics of potable source water (e.g. the original source of
the vast majority of wastewater) are likely to be critical determinants influencing the resistome of
DPR water.
Regrowth of HPC bacteria capable of growth on antibiotic-supplemented media
While molecular methods are extremely powerful for detecting ARGs in viable cells,
irrespective of their culturability, molecular methods also capture DNA from dead cells,
extracellular DNA, and DNA incorporated into the biofilm in the form of extracellular polymeric
substances. To verify the presence of viable of phenotypically resistant heterotrophic bacteria,
water samples were plated onto R2A media amended with antibiotics (Table S2). While comparing
results across conditions can provide an indication of the potential for blending reuse waters with
traditional source waters to increase growth on antibiotic-supplemented media, there are important
limitations. Because R2A agar captures a variety of heterotrophic bacteria, it is impossible to
identify the minimum inhibitory concentration (MIC) for each present species. Growth may not
necessarily be indicative of resistance, but rather intrinsic resistance (for example, some antibiotics
are not effective against Gram positive bacteria), intermediate resistance, or sub-inhibitory
antibiotic concentrations. With these limitations in mind, we compared HPC growth in the
presence of a suite of antibiotics as further evidence to identify treatment schemes that potentially
limit resistant strains or community shifts favoring species with inherent resistance or higher
MICs. Such an approach has been previously applied for drinking water (Xi et al., 2009).

169
Figure 7-3: Shotgun metagenomic abundances of ARGs by antibiotic class. Abundance of
ARGs are reported per milliliter of water sampled or per biofilm swab as determined by shotgun
metagenomic sequencing of samples collected after eight weeks of conditioning at the point of
compliance (POC), point of use (POU), and in the biofilm (BF). Numbers in parentheses indicate
the replicate rig number. Sufficient DNA for analysis of potable water samples was only
recoverable for select samples from Utilities 1, 3, and 4. AWP = advanced water purification using
membrane filtration, reverse osmosis and ultraviolet irradiation with the addition of hypochlorite
or hydrogen peroxide; O3-BAC = ozone followed by biologically active carbon filtration; Past =
refers to treatment using pasteurization; Ind refers to wastewater derived from an industrial source
rather than municipal wastewater, as in all other cases. Refer to Table 7-1 for additional details
regarding treatment schemes.
Of the 100% Surface water and 50% Surface/50% AWP blend tested from Utility 1, the
50% Surface/50% AWP blend consistently produced less HPCs capable of growth on media
amended with antibiotics, indicating that blending with highly-treated AWP water might have
benefits for reducing microbial water quality problems in general. While neither condition had
detectable HPCs at the POC, regrowth of HPCs occurred during simulated use in both sets of
premise plumbing rigs. Particularly high levels of regrowth were noted from the 90% Surface/10%
AWP blend on media amended with sulfamethoxazole (240, 69% of total HPCs for rigs 1 and 2,
respectively) and vancomycin (65, 258%). Utility 2 did not produce any quantifiable HPCs capable
of growth on antibiotic-amended HPC agar. Utility 3’s 100% Surface condition did not produce
any quantifiable HPCs at the POC or POU, but regrowth of total and resistant HPCs occurred for
both tertiary blends. The 90% Surface/10% Tertiary blend rigs produced at least 1.8 log more total
HPCs than the 95% Surface/5% Tertiary blend, demonstrating that selection of the appropriate
blend ratio can effectively control regrowth of HPCs in premise plumbing. From Utility 4, only
the two potable waters (100% Surface and 100% Groundwater) produced quantifiable HPCs
capable of growth on antibiotic media. Again, these results suggest that blending traditional

170
potable source waters with highly treated reuse water can actually have benefits for limiting
regrowth of total HPCs and HPCs capable of growth on antibiotic media.
Microbially-influenced corrosion
Other nuisance bacteria may regrow during distribution that are of concern for maintaining
water infrastructure and aesthetics and can indirectly cause health concerns. BART tests were used
to identify bacteria associated with microbially-influenced corrosion following incubation in the
pipe rigs (Table 7-2). Heterotrophic aerobic bacteria were rarely detected, and when they were
present, they were present at low abundances, below approximately 7,000 colony forming units
(CFU) per milliliter. Sulfate-reducing bacteria were detected in all utilities at abundances up to
approximately 2,200,000 CFU per milliliter, indicating that anaerobic conditions likely developed
within rigs, regardless of utility or scenario. Acid-producing bacteria were only detected at a
quantifiable range in the 90% Surface/10% Tertiary blend from Utility 3, indicating that overall,
these bacteria can be controlled by AWP and selection of an appropriate blend ratio. Slime-
producing bacteria were ubiquitous, but were particularly abundant in in the 100% Surface and
tertiary blends of Utility 3. While nitrifying bacteria were not detected in any samples, denitrifying
bacteria were notably abundant in the tertiary blends of Utility 3 and all scenarios from Utility 4,
further suggesting that anaerobic conditions developed during simulated distribution. The
development of low dissolved oxygen conditions in premise plumbing is not uncommon, and has
been previously documented after elevated water age is reached in distribution systems (Masters
et al., 2015), especially in systems experiencing nitrification (Wilczak et al., 1996). Given that
Utilities 1, 2, and 4 all use a chloramine residual, nitrification is a particular concern given the
availability of nitrogen via ammonia (Zhang et al., 2009).
While bacteria associated with microbially-influenced corrosion are important because of
their ability to contribute to corrosion of distribution system pipes and plumbing materials, they
can also be detrimental to water aesthetics. Sulfate-reducing bacteria, slime-producing bacteria,
and denitrifying bacteria emerged as the primary concerns in the studies scenarios. Sulfate-
reducing bacteria can contribute to corrosion pitting and undesirable taste and odor problems, such
as the production of black slimes and rotten-egg odor (Jacobs and Edwards, 2000). The elevated
abundance of sulfate-reducing bacteria under nearly all conditions suggests that DPR waters may
be particularly susceptible to supporting the growth of these microorganisms. Slime-producing
bacteria are associated with the production of excessive biofilms and extracellular polymeric
substances that can corrode metal pipes, plug pipes, and cause undesirable taste and odor and water
cloudiness (Little et al., 2007). Denitrifying bacteria may be associated with increased pH,
corrosion of metal pipes, and undesirable taste and odor (Masters et al., 2015). Given that sulfate-
reducing and denitrifying bacteria can grow only in anaerobic conditions, distribution system
operation will be critical for limiting growth of these organisms in full-scale systems. Limiting
stagnation and minimizing water age at the POU can aid in the prevention of redox conditions
favorable to growth of these microorganisms (Masters et al., 2015). Additionally, maintaining a
disinfectant residual at the point-of-use can aid in control of these organisms and their undesirable
consequences.

171
Table 7-2: Abundnaces of microorganisms associated with microbially-influenced corrosion. Approximate abundances (CFU/mL) of bacteria associated with microbially-influenced corrosion
measured at the simulated point of compliance (POC) as determined using Biological Activity
Reactivity Tests. AWP = advanced water purification using membrane filtration, reverse osmosis
and ultraviolet irradiation with the addition of hypochlorite or hydrogen peroxide; O3-BAC =
ozone followed by biologically active carbon filtration; Past = refers to treatment using
pasteurization. Refer to Table 7-1 for additional details regarding treatment schemes.
HAB SRB APB SLYM N DN
Uti
lity
1 100% Surface ND Presenta ND Present ND NA
90% Surface/10% O₃-BAC ND Present ND Present ND NA
90% Surface/10% AWP ND Present ND Present ND NA
50% Surface/50% AWP ND Present ND Present ND NA
Uti
lity
2 100% Groundwater ND 2,200,000 ND 500 ND ND
90% Groundwater/10% AWP 6,500 2,200,000 ND 500 ND 3,000
50% Groundwater/50% AWP ND 2,200,000 ND 500 ND 3,000
50% Groundwater/50% Past.-AWP 6,500 2,200,000 ND 500 ND ND
Uti
lity
3
100% Surface ND 2,200,000 ND 1,750,000 ND 1,800,000
95% Surface/5% Tertiary ND 2,200,000 ND 1,750,000 ND 1,800,000
90% Surface/10% Tertiary 6,500 2,200,000 70,000 1,750,000 ND 1,800,000
90% Surface/10% O₃-BAC ND 2,200,000 ND 500 ND 3,000
50% Surface/50% O₃-BAC ND 2,200,000 <100 500 ND ND
Uti
lity
4 100% Groundwater ND 2,200,000 ND 440,000 ND 1,800,000
90% Groundwater/10% AWP ND 2,200,000 ND 440,000 ND 1,800,000
90% Surface/10% AWP ND 2,200,000 ND 440,000 ND 1,800,000
90% Finished/10% Industrial-AWP ND 6,000 ND 350,000 ND 215,000 aDue to a recording error, the approximate concentration cannot be accurately determined; ND = not detected, NA
= not tested, HAB = heterotrophic aerobic bacteria, SRB = sulfate-reducing bacteria, APB = acid-producing
bacteria, SLYM = slime-producing bacteria, N = nitrifying bacteria, DN = denitrifying bacteria
Water chemistry
Organic carbon is a critical nutrient supporting regrowth of microorganisms in treated
water. While TOC and DOC have long been used as correlates to the level of organic carbon in
the water during distribution, BDOC has been proposed as an alternative indicator that more
accurately reflects the biodegradable fraction and overall biostability of water (Servais et al.,
1987). Average TOC for each scenario ranged from 50.7 to 5790 ppb, average DOC ranged from
4.5 to 5710 ppb, and average BDOC ranged from sub-quantifiable to 1850 ppb (Figure 7-4).
Previous studies that have found BDOC in reclaimed water to range from 400 to 6200 ppb (Jjemba
et al., 2010) and from 20 to 930 ppb in potable water (Charnock and Kjønnø, 2000; Ribas et al.,
1991). With the exception of the 90% Surface/10% AWP and 100% O₃-BAC conditions from
Utility 1, all other reuse scenarios fell below 930 ppb BDOC, indicating that they are of comparable
biostability to potable waters documented in the literature.
With the exception of the 90% Surface/10% O₃-BAC scenario, all Utility 1 treatment
schemes yielded significantly higher concentrations of BDOC than the 100% surface condition

172
(Wilcoxon, p≤0.0452), indicating that all DPR treatment scenarios would result in a greater
potential for bacterial regrowth than the traditional potable treated water of that utility. Membrane
filtration appears particularly promising for reducing BDOC, as the 90% Surface/10% O3-BAC
treatment train resulted in less BDOC than the comparable 90% Surface/10% AWP treatment
(p=0.0031). Though blend ratio did not significantly affect BDOC concentrations for scenarios
utilizing biofiltration treatment, the blend ratio did affect BDOC in membrane-based treatment,
with the 90% Surface/10% AWP being greater than the 50% Surface/50% AWP scenario
(p=0.0034). Of Utility 2 and 4 scenarios, no DPR treatment schemes produced BDOC
concentrations greater than the respective potable scenario (p≥0.0998). Of Utility 3 scenarios, both
reuse schemes produced BDOC concentrations that were not significantly different from the
finished condition (p≥0.1503), though the 100% surface condition produced by pilot scale
treatment was greater than the BDOC concentration of the 100% finished condition produced by
the full-scale potable treatment plant (p=0.0241).
There were no significant positive correlations between BDOC and total bacteria, as
measured by 16S rRNA genes or HPC, or between BDOC and any OP or ARG gene markers for
any of the utilities (Spearman, p≥0.2188). This result suggests that in this highly treated DPR
water, organic carbon is not the limiting nutrient determining biostability of finished water.
Previous studies have demonstrated that in order for organic carbon to be the limiting nutrient
constraining bacterial regrowth, extremely low concentrations of below 10 ppb as AOC are
required (Kooij, 1992; Williams et al., 2015).
CONCLUSIONS
Advancements in treatment technologies have facilitated the ability to produce high-quality
water from wastewater suitable for potable purposes, but little is known about the biological
stability of this DPR water. This study simulated use of premise plumbing, where microbial
regrowth potential is anticipated to be the greatest, using blended DPR water from four U.S. water
utilities. To our knowledge, this study represents the first such simulation, and here we aimed to
be comprehensive in the approach, including five different baseline waters from four water utilities
along with comprehensive culture- and molecular-based characterization of the resident microbial
communities and factors influencing their regrowth. Results were compared to the regrowth
observed for traditional potable water currently in use at the same utilities. Across tested treatment
and blending scenarios, total bacteria (i.e., 16S rRNA genes) were more abundant at the POU and
the POC, for both DPR blends and traditional potable water. However, regrowth of total bacteria,
OPs, and ARGs was not significantly greater for any DPR blends treated with AOPs than in the
corresponding potable water. The one scenario in which OP regrowth exceeded the potable
condition was a 10% blend of tertiary treated DPR water, but this regrowth was effectively limited
by selecting an appropriate blend ratio (5%). The overall microbial community composition was
unique at the POU compared to the POC, with greater alpha diversity observed at the POC,
suggesting that simulated premise plumbing conditions selected for particular bacteria that were
well-suited for regrowth. Measurements of BDOC suggested that DPR water generally possessed
greater potential to facilitate regrowth of bacteria than the corresponding potable waters, though
the lack of corresponding regrowth under these conditions suggests that organic carbon was not
the limiting nutrient in these waters. Regrowth was observed for several microorganisms
associated with microbially-influenced corrosion. Sulfate-reducing bacteria, in particular, grew in

173
Figure 7-4: Organic carbon measurements in water prior to incubation in simulated premise
plumbing pipe rigs. Total organic carbon (TOC), dissolved organic carbon (DOC), and
biodegradable dissolved organic carbon (BDOC) concentrations measured at the point of
compliance (POC). When both a 100% Finished and 100% Surface condition are indicated, the
100% Finished condition represents the corresponding surface water treated at the full-scale
potable water treatment plant, as opposed to the bench-scale treatment simulated for the 100%
Surface condition. AWP = advanced water purification using membrane filtration, reverse osmosis
and ultraviolet irradiation with the addition of hypochlorite or hydrogen peroxide; O3-BAC =
ozone followed by biologically active carbon filtration; Past = refers to treatment using
pasteurization. Refer to Table 7-1 for additional details regarding treatment schemes.

174
all conditions, so control of these bacteria in DPR systems could present a critical challenge. It is
important to recognize; however, that this study was carried out over a short time period of only
eight weeks, which was aimed to capture key differences of the kinds of microbes expected to
colonize, proliferate, and establish in premise plumbing when DPR water is introduced. Given
that microbial communities undergo extensive, long-term succession patterns, additional longer-
term monitoring is recommended as DPR waters are integrated into potable water distribution
systems. Additional research is also needed to determine the applicability of these findings when
implementing DPR under less stringent treatment scenarios or when using higher blends of DPR
water.
ACKNOWLEDGEMENTS
We thank the utilities that participated in this study for their support. This work is supported by
the Water Research Foundation (WRF 4536) and National Science Foundation through the
Graduate Research Fellowship Program, CBET Award 1438328, and PIRE Award 1545756.
Additional support was provided by the Alfred P. Sloan Foundation Microbiology of the Built
Environment program, the Water Environment & Research Foundation Paul L. Busch award, the
Virginia Tech Institute for Critical Technology and Applied Science Center for Science and
Engineering of the Exposome, and the American Water Works Association Abel Wolman Doctoral
Fellowship.
REFERENCES
Alexander, J., Knopp, G., Dötsch, A., Wieland, A., Schwartz, T., 2016. Ozone treatment of
conditioned wastewater selects antibiotic resistance genes, opportunistic bacteria, and induce
strong population shifts. Sci. Total Environ. 559, 103–112.
American Public Health Association (APHA), 2005. Standard Methods for the Examination of
Water and Wastewater. American Water Works Association, Water Environment Federation.
Applegate, L.E., 2017. Posttreatment of Reverse Osmosis Product Waters. J. Am. Water Work.
Assoc. 78, 59–65.
Berendonk, T.U., Manaia, C.M., Merlin, C., Fatta-Kassinos, D., Cytryn, E., et al., 2015. Tackling
antibiotic resistance: the environmental framework. Nat. Rev. Microbiol. 13, 310–317.
Caporaso, J.G., Lauber, C.L., Walters, W.A., Berg-Lyons, D., Huntley, J., et al., 2012. Ultra-high-
throughput microbial community analysis on the Illumina HiSeq and MiSeq platforms. ISME
J. 6, 1621–1624.
Centers for Disease Control and Prevention, 2011. Surveillance for Waterborne Disease Outbreaks
and Other Health Events Associated with Recreational Water — United States, 2007–2008.
Morb. Mortal. Wkly. Rep. 60.
Charnock, C., Kjønnø, O., 2000. Assimilable organic carbon and biodegradable dissolved organic
carbon in Norwegian raw and drinking waters. Water Research 34, 2629–2642.
Chowdhury, S., 2012. Heterotrophic bacteria in drinking water distribution system: a review.,
Environmental monitoring and assessment. Environ. Monit. Assess. 184(10), 6087-6137.
Czekalski, N., Imminger, S., Salhi, E., Veljkovic, M., Kle, K., Drissner, D., Hammes, F., Bu, H.,
Gunten, U.V., 2016. Inactivation of Antibiotic Resistant Bacteria and Resistance Genes by
Ozone: From Laboratory Experiments to Full-Scale Wastewater Treatment. Environ. Sci.
Technol. 50, 11862-11871.

175
Escobar, I.C., Randall, A.A., 2000. Sample storage impact on the assimilable organic carbon
(AOC) bioassay. Water Research 34, 1680–1686.
Fahrenfeld, N.L., Ma, Y.J., O’Brien, M., Pruden, A., 2013. Reclaimed water as a reservoir of
antibiotic resistance genes: distribution system and irrigation implications. Front. Microbiol.
4, 10.
Falkinham, J., 2015. Common Features of Opportunistic Premise Plumbing Pathogens. Int. J.
Environ. Res. Public Health 12, 4533–4545.
Garner, E., Benitez, R., Wagoner, E. Von, Sawyer, R., Schaberg, E., Hession, W.C., Krometis,
L.H., Badgley, B.D., Pruden, A., 2017. Stormwater loadings of antibiotic resistance genes in
an urban stream. Water Research 123, 144–152.
Garner, E., Zhu, N., Strom, L., Edwards, M., Pruden, A., 2016. A human exposome framework
for guiding risk management and holistic assessment of recycled water quality. Environ. Sci.
Water Res. Technol. 2, 580-598.
Gerrity, D., Pecson, B., Trussell, R.S., Trussell, R.R., 2013. Potable reuse treatment trains
throughout the world. J. Water Supply Res. Technol. 62, 321–338.
Gosling, S.N., Arnell, N.W., 2016. A global assessment of the impact of climate change on water
scarcity. Clim. Change 134, 371–385.
Hong, P.-Y., Al-Jassim, N., Ansari, M., Mackie, R., 2013. Environmental and Public Health
Implications of Water Reuse: Antibiotics, Antibiotic Resistant Bacteria, and Antibiotic
Resistance Genes. Antibiotics 2, 367–399.
Jacobs, S., Edwards, M., 2000. Sulfide scale catalysis of copper corrosion. Water Research 34,
2798–2808.
Ji, P., Rhoads, W.J., Edwards, M.A., Pruden, A., 2017. Impact of water heater temperature setting
and water use frequency on the building plumbing microbiome. ISME J. 11, 1318–1330.
Jjemba, P.K., Weinrich, L.A., Cheng, W., Giraldo, E., LeChevallier, M.W., 2010. Regrowth of
potential opportunistic pathogens and algae in reclaimed-water distribution systems. Appl.
Environ. Microbiol. 76, 4169–4178.
Kim, S.D., Cho, J., Kim, I.S., Vanderford, B.J., Snyder, S.A., 2007. Occurrence and removal of
pharmaceuticals and endocrine disruptors in South Korean surface, drinking, and waste
waters. Water Research 41, 1013–1021.
Kooij, D. Van Der, 1992. Assimilable Organic Carbon as an Indicator of Bacterial Regrowth. J.
Am. Water Work. Assoc. 57–65.
LeChevallier, M.W., Schulz, W., Lee, R.G., 1991. Bacterial nutrients in drinking water. Appl.
Envir. Microbiol. 57, 857–862.
Little, B.J., Mansfeld, F.B., Arps, P.J., Earthman, J.C., 2007. Microbiologically Influenced
Corrosion, in: Corrosion in Special Environments. pp. 662–685.
Liu, G., Bakker, G.L., Li, S., Vreeburg, J.H.G., Verberk, J.Q.J.C., Medema, G.J., Liu, W.T., Van
Dijk, J.C., 2014. Pyrosequencing reveals bacterial communities in unchlorinated drinking
water distribution system: An integral study of bulk water, suspended solids, loose deposits,
and pipe wall biofilm. Environ. Sci. Technol. 48, 5467–5476.
Masters, S., Wang, H., Pruden, A., Edwards, M.A., 2015. Redox gradients in distribution systems
influence water quality, corrosion, and microbial ecology. Water Research 68, 140–149.
McArthur, A.G., Waglechner, N., Nizam, F., Yan, A., Azad, M.A., et al., 2013. The
comprehensive antibiotic resistance database. Antimicrob. Agents Chemother. 57, 3348–
3357.
Narahimhan, R., Brereton, J., Abbaszadegan, M., Ryu, H., Butterfield, P., Thompson, K., Werth,

176
H., 2005. Characterizing Microbial Water Quality in Reclaimed Water Distribution Systems.
AwwaRF Report.
National Sanitation Foundation, 2007. NSF International Standard/American National Standard
61: Drinking Water System Components-Health Effects. Ann Arbor, MI.
Nguyen, C., Elfland, C., Edwards, M., 2012. Impact of advanced water conservation features and
new copper pipe on rapid chloramine decay and microbial regrowth. Water Research 46, 611–
21.
Proctor, C.R., Gächter, M., Kötzsch, S., Rölli, F., Sigrist, R., Walser, J.-C., Hammes, F., 2016.
Biofilms in shower hoses – choice of pipe material influences bacterial growth and
communities. Environ. Sci. Water Res. Technol. 8–11.
Pruden, A., 2014. Balancing Water Sustainability and Public Health Goals in the Face of Growing
Concerns about Antibiotic Resistance. Environ. Sci. Technol. 48, 5–14.
Rhoads, W.J., Pruden, A., Edwards, M.A., 2016. Survey of green building water systems reveals
elevated water age and water quality concerns. Environ. Sci. Water Res. Technol. 2, 164-173.
Ribas, F., Frias, J., Lucena, F., 1991. A new dynamic method for the rapid determination of the
biodegradable dissolved organic carbon in drinking water. J. Appl. Bacteriol. 71, 371–378.
Servais, P., A. Anzil, Ventresque, C., 1989. Simple method for determination of biodegradable
dissolved organic carbon in water. Appl. Environ. Microbiol. 55(10), 2732–2734.
Servais, P., Billen, G., Hascoet, M.C., 1987. Determination of the Biodegradable Fraction of
Dissolved Organic Matter in Waters. Water Research 21, 445–450.
Snyder, S.A., Wert, E.C., Lei, H.D., Westerhoff, P., Yoon, Y., 2007. Removal of EDCs and
pharmaceuticals in drinking and reuse treatment processes. AwwaRF Report.
Thayanukul, P., Kurisu, F., Kasuga, I., Furumai, H., 2013. Evaluation of microbial regrowth
potential by assimilable organic carbon in various reclaimed water and distribution systems.
Water Research 47, 225–232.
US Environmental Protection Agency, 2012. Guidelines for Water Reuse.
Wang, H., Masters, S., Hong, Y.J., Stallings, J., Falkinham, J.O., Edwards, M.A., Pruden, A., 2012.
Effect of Disinfectant, Water Age, and Pipe Material on Occurrence and Persistence of
Legionella, mycobacteria, Pseudomonas aeruginosa, and Two Amoebas. Environ. Sci.
Technol. 46, 11566–11574.
Wang, W., Wu, Q., Huang, N., Wang, T., Hu, H., 2016. Synergistic effect between UV and
chlorine (UV/chlorine) on the degradation of carbamazepine: Influence factors and radical
species. Water Research 98, 190–198.
Watkinson, A.J., Murby, E.J., Costanzo, S.D., 2007. Removal of antibiotics in conventional and
advanced wastewater treatment: Implications for environmental discharge and wastewater
recycling. Water Research 41, 4164–4176.
Whiley, H., Keegan, A., Fallowfield, H., Bentham, R., 2015. The presence of opportunistic
pathogens, Legionella spp., L. pneumophila and Mycobacterium avium complex, in South
Australian reuse water distribution pipelines. J. Water Health 13, 553.
Wilczak, A., Jacangelo, J.G., Marcinko, J.P., Odell, L.H., Kirmeyer, G.J., Wolfe, R.L., 1996.
Occurrence of nitrification in chloraminated distribution systems. J. Am. Water Work. Assoc.
88, 74–85.
Williams, K., Pruden, A., Falkinham, J., Edwards, M., 2015. Relationship between Organic
Carbon and Opportunistic Pathogens in Simulated Glass Water Heaters. Pathogens 4, 355–
372.
Xi, C., Zhang, Y., Marrs, C.F., Ye, W., Simon, C., Foxman, B., Nriagu, J., 2009. Prevalence of

177
antibiotic resistance in drinking water treatment and distribution systems. Appl. Environ.
Microbiol. 75, 5714–5718.
Yoder, J., Roberts, V., Craun, G.F., Hill, V., Hicks, L., Alexander, N.T., V.R., Calderon, R.L.,
Beach, M.J., Carolina, N., 2008. Surveillance for Waterborne Disease and Outbreaks
Associated with Drinking Water and Water not Intended for Drinking --- United States, 2005-
-2006. Morb. Mortal. Wkly. Rep. 57, 39–62.
Yoon, Y., Jung, H., Yoong, D., Di, W., Dodd, M.C., Hur, H., Lee, Y., 2017. Inactivation efficiency
of plasmid-encoded antibiotic resistance genes during water treatment with chlorine, UV, and
UV/H2O2. Water Research 123, 783–793.
Zhang, Y., Love, N., Edwards, M., 2009. Nitrification in Drinking Water Systems, Critical
Reviews in Environmental Science and Technology.

178
SUPPLEMENTARY INFORMATION FOR CHAPTER 7
Pipe rig pre-testing
Forty pipe rigs were constructed and pre-tested according to National Sanitation
Foundation Standard (NSF) 61 to obtain the most reproducible lead and copper (NSF, 2007).
Briefly, rigs were rinsed three times with distilled water, followed by three times with NSF
extraction water (synthesized water with the following characteristics: pH = 8.0; alkalinity = 500
mg/L as CaCO3, dissolved inorganic carbon = 122 mg/L, free chlorine = 2 mg/L). Rigs were filled
with NSF extraction water and allowed to stagnate for one day. Water was discarded, then rigs
were treated with three consecutive 12-hour stagnation periods. The four rigs producing the
greatest lead and copper concentration variation from these three periods were excluded from the
study.
Simulated treatment
For Utility 1, following blending, all waters were subject to bench-scale treatment
consisting of O3 pretreatment (2 mg/L), coagulation with alum (38 mg/L), cationic polymer (1.5
mg/L), and non-ionic polymer (0.18 mg/L), flocculation, sedimentation, filtration (1.5 μm glass
fiber filter), and chlorination followed by the addition of aqua ammonia to form chloramines
(target of 1.8 to 2.2 mg/L total chlorine after 11 minutes). For Utility 2, recycled water was treated
prior to blending with pilot-scale treatment of pasteurization, ultrafiltration, reverse osmosis, and
ultraviolet irradiation with the addition of hydrogen peroxide. Following blending, waters were
subject to secondary disinfection with chlorine followed by ammonia to achieve a target residual
of 3.8 mg/L total chlorine. For Utility 3, for O3-BAC conditions, recycled water was treated with
ozone and biofiltration prior to blending. Tertiary waters were treated via secondary treatment with
nitrification, partial denitrification, and biological phosphorus removal via full-scale treatment.
After blending, water was treated at the bench-scale with coagulation with ferric chloride
(0.6 mg/L), flocculation, sedimentation, filtration (0.7 μm glass fiber filter), and chlorination
(target dose of 1.5 mg/L after 2 hours). For Utility 4, groundwater and surface water were each
blended with recycled water that had been previously treated with microfiltration, reverse osmosis,
ultraviolet irradiation with the addition of hydrogen peroxide, and stabilization via pH adjustment
and the addition of calcium chloride to achieve a Langelier saturation index between -0.5 and 0.5.
Following blending, blends were treated at the bench scale via O3 (0.5 mg/L), coagulation with
ferric chloride (1.5 mg/L) and cationic polymer (1.2 mg/L), flocculation, sedimentation, filtration
(1.5 μm glass fiber filter), and chlorine followed by aqua ammonia for chloramination (target dose
of 2.6 mg/L total chlorine after 16.5 minutes), and the additional of zinc orthophosphate for
corrosion inhibition. If disinfectant residuals degraded during storage, chlorine or chloramines
were spiked to bring concentrations back up to target concentrations described above before rig
incubation.
Quantitative polymerase chain reaction
All qPCR assays were conducted using previously published primers and thermocycler conditions
(Table S1). The following genes were targeted for quantification of OPs: a highly specific region
of the 23S rRNA gene for Legionella spp. (Nazarian et al., 2008), a highly specific region of the

179
16S rRNA gene for Mycobacterium spp. (Radomski et al., 2010), and the ecfX and gyrB genes for
Pseudomonas aeruginosa (Anuj et al., 2009). Two ARGs were also quantified: a quinolone
resistance gene, qnrA (Colomer-Lluch et al., 2014), and a vancomycin resistance gene, vanA
(Dutka-Malen et al., 1995), along with the class 1 integron integrase gene intI1 (Hardwick et al.,
2008). The universal bacterial gene, 16S rRNA, was also quantified (Suzuki et al., 2000). All non-
probe assays (16S rRNA genes, vanA, intI1) were performed in triplicate 10 µl reactions that
included 5 µl SsoFast EvaGreen SuperMix (Bio-Rad, Hercules, CA), 0.8 µl of forward and reverse
primers at 5 µM (Integrated DNA Technologies, Coralville, IA), 2.4 µl molecular grade water, and
1 µl sample. All probe assays (Legionella spp., Mycobacterium spp., P. aeruginosa, qnrA) were
performed in triplicate 10 µl reactions that included 5 µl SsoFast Probes SuperMix (Bio-Rad), 0.5
µl of each forward and reverse primer at 5 µM, 0.19 µl of each probe at 10 µM, 1 µl sample, and
molecular grade water to reach the total reaction volume.
Data analysis for 16S rRNA gene amplicon sequencing and shotgun metagenomics
Processing of 16S rRNA gene amplicon sequencing reads was conducted using the QIIME
pipeline (Caporaso et al., 2010) with annotation against the Greengenes database (May 2013
release; DeSantis et al., 2006). Samples were rarefied to 10,000 randomly selected reads. Alpha
diversity was calculated in QIIME using the Simpson index.
From shotgun metagenomic sequencing data, annotation of ARGs was conducted on the
MetaStorm platform (Arango-Argoty et al., 2016) according to default parameters using
annotation to the Comprehensive Antibiotic Resistance Database (CARD; version 1.0.6) for ARGs
(McArthur et al., 2013), Silva ribosomal RNA database (version 123) for 16S rRNA genes (Quast
et al., 2013), BacMet database (version 1.1) for metal resistance genes (Pal et al., 2014), and
ACLAME database (version 0.4) for plasmid-associated genes (Leplae et al., 2004). Relative
abundances were calculated by normalizing gene counts to abundance of 16S rRNA genes as well
as target gene and 16S rRNA gene length as proposed by Li et al. (2015). Absolute abundances
were calculated by multiplying relative abundance of ARGs by total abundance of 16S rRNA
genes, quantified by qPCR. All metagenomes generated in this study are publicly available via
MG-RAST (Meyer et al., 2008) under project number 12943. Reads were assembled de novo in
MetaStorm according to default parameters and scaffolds were annotated as described above for
reads. Co-occurrences of annotated genes on scaffolds were characterized via network analysis
visualization using Gephi (version 0.8.2).
References
Anuj, S.N., Whiley, D.M., Kidd, T.J., Bell, S.C., Wainwright, C.E., Nissen, M.D., Sloots, T.P.,
2009. Identification of Pseudomonas aeruginosa by a duplex real-time polymerase chain
reaction assay targeting the ecfX and the gyrB genes. Diagn. Microbiol. Infect. Dis. 63, 127–
131.
Arango-Argoty, G., Singh, G., Heath, L.S., Pruden, A., Xiao, W., Zhang, L., 2016. MetaStorm: A
public resource for customizable metagenomics annotation. PLoS One 11, 1–13.
Caporaso, J.G., Kuczynski, J., Stombaugh, J., Bittinger, K., Bushman, F.D., Costello, E.K., Fierer,
N., Pena, A.G., Goodrich, J.K., Gordon, J.I., Huttley, G.A., Kelley, S.T., Knights, D., Koenig,
J.E., Ley, R.E., Lozupone, C.A., McDonald, D., Muegge, B.D., Pirrung, M., Reeder, J.,

180
Sevinsky, J.R., Tumbaugh, P.J., Walters, W.A., Widmann, J., Yatsunenko, T., Zaneveld, J.,
Knight, R., 2010. QIIME allows analysis of high-throughput community sequencing data.
Nat. Methods 7, 335–336.
Colomer-Lluch, M., Jofre, J., Muniesa, M., 2014. Quinolone resistance genes (qnrA and qnrS) in
bacteriophage particles from wastewater samples and the effect of inducing agents on
packaged antibiotic resistance genes. J. Antimicrob. Chemother. 69, 1265–1274.
DeSantis, T.Z., Hugenholtz, P., Larsen, N., Rojas, M., Brodie, E.L., Keller, K., Huber, T., Dalevi,
D., Hu, P., Andersen, G.L., 2006. Greengenes, a chimera-checked 16S rRNA gene database
and workbench compatible with ARB. Appl. Environ. Microbiol. 72, 5069–5072.
Dutka-Malen, S., Evers, S., Courvalin, P., 1995. Detection of glycopeptide resistance genotypes
and identification to the species level of clinically relevant enterococci by PCR. J. Clin.
Microbiol. 33, 24–27.
Hardwick, S.A., Stokes, H.W., Findlay, S., Taylor, M., Gillings, M.R., 2008. Quantification of
class 1 integron abundance in natural environments using real-time quantitative PCR. FEMS
Microbiol. Lett. 278, 207–212.
Leplae, R., Hebrant, A., Wodak, S.J., Toussaint, A., 2004. ACLAME: a CLAssification of Mobile
genetic Elements. Nucleic Acids Res. 32, D45-9.
Li, B., Yang, Y., Ma, L., Ju, F., Guo, F., Tiedje, J.M., Zhang, T., 2015. Metagenomic and network
analysis reveal wide distribution and co-occurrence of environmental antibiotic resistance
genes. ISME J. 1–13.
McArthur, A.G., Waglechner, N., Nizam, F., Yan, A., Azad, M. a., Baylay, A.J., Bhullar, K.,
Canova, M.J., De Pascale, G., Ejim, L., Kalan, L., King, A.M., Koteva, K., Morar, M.,
Mulvey, M.R., O’Brien, J.S., Pawlowski, A.C., Piddock, L.J. V, Spanogiannopoulos, P.,
Sutherland, A.D., Tang, I., Taylor, P.L., Thaker, M., Wang, W., Yan, M., Yu, T., Wright,
G.D., 2013. The comprehensive antibiotic resistance database. Antimicrob. Agents
Chemother. 57, 3348–3357.
Meyer, F., Paarmann, D., D’Souza, M., Olson, R., Glass, E.M., Kubal, M., Paczian, T., Rodriguez,
A., Stevens, R., Wilke, A., Wilkening, J., Edwards, R.A., 2008. The metagenomics RAST
server - a public resource for the automatic phylogenetic and functional analysis of
metagenomes. BMC Bioinformatics 9(386).
National Sanitation Foundation, 2007. NSF International Standard/American National Standard
61: Drinking Water System Components-Health Effects. Ann Arbor, MI.
Nazarian, E.J., Bopp, D.J., Saylors, A., Limberger, R.J., Musser, K. a, 2008. Design and
implementation of a protocol for the detection of Legionella in clinical and environmental
samples. Diagn. Microbiol. Infect. Dis. 62, 125–132.
Pal, C., Bengtsson-Palme, J., Rensing, C., Kristiansson, E., Larsson, D.G.J., 2014. BacMet:
antibacterial biocide and metal resistance genes database. Nucleic Acids Res. 42, D737–
D743.
Quast, C., Pruesse, E., Yilmaz, P., Gerken, J., Schweer, T., Yarza, P., Peplies, J., Glockner, F.O.,
2013. The SILVA ribosomal RNA gene database project: improved data processing and web-
based tools. Nucleic Acids Res. 41, D590–D596.
Radomski, N., Lucas, F.S., Moilleron, R., Cambau, E., Haenn, S., Moulin, L., 2010. Development
of a real-time qpcr method for detection and enumeration of Mycobacterium spp. in surface
water. Appl. Environ. Microbiol. 76, 7348–7351.

181
Suzuki, M.T., Taylor, L.T., DeLong, E.F., 2000. Quantitative analysis of small-subunit rRNA
genes in mixed microbial populations via 5’-nuclease assays. Appl. Environ. Microbiol. 66,
4605–4614.
Table S1: Primer and probe sequences and annealing temperatures used for qPCR
Gene Primer/Probe Sequence (5’-3’) Annealing
temperature Reference
16S rRNA
(universal)
F: CGGTGAATACGTTCYCGG
R: GGWTACCTTGTTACGACTT 55.0
(Suzuki et
al., 2000)
23S rRNA
(Legionella spp.)
F: CCCATGAAGCCCGTTGAA
R: ACAATCAGCCAATTAGTACGAGTTAGC
Probe: HEX-
TCCACACCTCGCCTATCAACGTCGTAGT-BHQ
55.0 (Nazarian
et al., 2008)
16S rRNA
(Mycobacterium
spp.)
F: CCTGGGAAACTGGGTCTAAT
R: CGCACGCTCACAGTTA
Probe: FAM-TTTCACGAACAACGCGACAAACT-BHQ
55.0 (Radomski
et al., 2010)
ecfX
(Pseudomonas
aeruginosa)
F: CGCATGCCTATCAGGCGTT
R: GAACTGCCCAGGTGCTTGC
Probe: HEX-ATGGCGAGTTGCTGCGCTTCCT-BHQ
60.0 (Anuj et al.,
2009) gyrB
(Pseudomonas
aeruginosa)
F: CCTGACCATCCGTCGCCACAAC
R: CGCAGCAGGATGCCGACGCC
Probe: FAM-CCGTGGTGGTAGACCTGTTCCCAGACC-
BHQ
qnrA
F: AGGATTGCAGTTTCATTGAAAGC
R: TGAACTCTATGCCAAAGCAGTTG
Probe: FAM-TATGCCGATCTGCGCGA-BHQ
60.0
(Colomer-
Lluch et al.,
2014)
vanA
F: GGGAAAACGACAATTGC
R: GTACAATGCGGCCGTTA 54.0
(Dutka-
Malen et
al., 1995)
intI1 F: CTGGATTTCGATCACGGCACG
R: ACATGCGTGTAAATCATCGTCG 66.0
(Hardwick
et al., 2008)

182
Figure S1: Nonmetric multidimensional scaling (NMDS) plot generated from Bray-Curtis similarity matrix of all metagenomic ARG
abundances by utility and system type.

183
Table S2: Log-transformed colony-forming units per milliliter sample forming on R2A agar
supplemented with antibiotics from samples collected at the simulated point of compliance (POC)
and simulated point of use (POU) for each duplicate premise plumbing rig. Conditions tested
include R2A amended with no antibiotics (NONE), ampicillin (AMP; 4 µg/mL), ciprofloxacin
(CIP; 0.5 µg/mL), chloramphenicol (CHL; 4 µg/mL), gentamicin (GEN; 2 µg/mL), oxacillin
(OXA; 1 µg/mL), rifampin (RIF; 0.5 µg/mL), sulfonamide (SUL; 128 µg/mL), tetracycline (TET;
2 µg/mL), and vancomycin (VAN; 0.5 µg/mL). Abundances below the limit of quantification
(LOQ; 100 CFU/mL) are shown in gray while measurements above the LOQ are shown in black.
ND=no detection.
Utility Scenario Sample None AMP CIP CHL GEN OXA RIF SUL TET VAN
1
90% Surface/
10% AWP
POC ND ND ND ND ND ND ND ND ND ND
POU-1 3.9 ND 3.1 3.4 ND ND ND 4.3 ND 4.3
POU-2 6.1 6.1 6.0 5.5 ND 6.0 ND 5.9 6.0 5.9
50% Surface/
50% AWP
POC ND ND ND ND ND ND ND ND ND ND
POU-1 1.0 ND 0.5 ND ND 0.8 ND ND 0.5 ND
POU-2 2.4 2.1 1.7 ND ND 1.9 ND 1.8 2.0 1.7
2
100%
Groundwater
POC ND ND ND ND ND ND ND ND ND ND
POU-1 ND ND ND ND ND ND ND 0.5 0.5 ND
POU-2 ND ND ND ND ND ND ND ND ND ND
90%
Groundwater/
10% AWP
POC ND ND ND ND ND ND ND ND ND ND
POU-1 0.5 ND ND ND ND ND ND ND ND ND
POU-2 0.5 ND ND ND ND ND ND ND ND ND
50%
Groundwater/
50% AWP
POC ND ND ND ND ND ND ND ND ND ND
POU-1 ND ND ND ND ND ND ND ND ND ND
POU-2 1.5 ND ND ND ND ND ND ND ND ND
50%
Groundwater/
50% AWP-
Past
POC ND ND ND ND ND ND ND ND ND ND
POU-1 ND ND ND ND ND ND ND ND ND ND
POU-2 2.1 ND ND ND ND 1.9 ND 1.1 ND ND
3
100%
Surface
POC 0.5 ND ND ND ND 2.0 1.8 ND ND ND
POU-1 ND ND ND ND ND 2.0 1.8 ND ND ND
POU-2 0.8 ND ND ND ND 2.0 1.8 0.5 ND ND
95% Surface/
5% Tertiary
POC 0.5 ND ND ND ND 2.0 1.8 ND ND ND
POU-1 2.6 1.5 1.2 ND 2.2 2.5 2.1 2.0 ND 1.2
POU-2 1.9 0.5 ND ND 1.9 1.8 1.6 1.7 ND 0.8
90% Surface/
10% Tertiary
POC 1.1 0.5 ND ND ND 2.0 1.8 ND ND 0.5
POU-1 4.3 3.9 ND ND 4.3 4.2 4.1 ND 2.5 3.6
POU-2 4.4 3.2 3.2 2.2 4.3 4.4 4.2 4.1 1.9 4.0
4
100%
Groundwater
POC ND ND ND ND ND ND ND ND ND ND
POU-1 3.0 2.8 ND ND 0.5 2.6 2.6 ND ND ND
POU-2 3.2 2.2 ND ND ND 3.1 3.2 ND ND ND
100%
Surface
POC ND ND ND ND ND ND ND ND ND ND
POU-1 ND ND ND ND ND ND 0.5 ND ND ND
POU-2 ND 0.5 ND ND ND ND ND ND ND ND
POC ND ND ND ND ND ND ND ND ND ND
POU-1 2.8 2.2 ND ND ND 2.5 2.6 ND ND ND

184
90%
Groundwater/
10% AWP POU-2 3.1 2.8 ND ND ND 3.0 3.0 ND ND ND
90% Surface/
10% AWP
POC ND ND ND ND ND ND ND ND ND ND
POU-1 ND ND ND ND ND ND ND ND ND ND
POU-2 ND ND ND ND ND ND ND ND ND ND
90% Surface/
10%
Industrial
AWP
POC ND ND ND ND ND ND ND ND ND ND
POU-1 1.6 1.0 ND ND ND 0.8 1.0 ND ND ND
POU-2 2.8 ND ND ND ND 2.0 1.8 ND ND ND

185
CHAPTER 8 : WHOLE GENOME SEQUENCE COMPARISON OF CLINICAL AND
DRINKING WATER LEGIONELLA PNEUMOPHILA ISOLATES ASSOCIATED WITH
THE FLINT WATER CRISIS
Emily Garner, Connor Brown, David Otto Schwake, William J. Rhoads, Gustavo Arango-
Argoty, Liqing Zhang, Guillaume Jospin, David Coil, Jonathan A. Eisen, Marc A. Edwards,
Amy Pruden
ABSTRACT
Background: Two outbreaks of Legionnaires’ Disease (LD) occurred in Genesee County,
Michigan during 2014 and 2015. Previous work demonstrated that higher iron, depleted chlorine,
and warmer temperatures characteristic of use of Flint River as the potable source water coincided
with these outbreaks and were associated with elevated Legionella pneumophila genes in large
buildings using Flint tap water.
Objectives: Here we compare whole genome sequences of clinical and water L. pneumophila
isolates associated with the Flint LD outbreaks.
Methods: Whole genome sequences were obtained from 103 L. pneumophila isolates collected
from Flint area tap water between March and August 2016 and compared to ten clinical isolates
associated with the 2015 outbreak.
Results: A diverse range of L. pneumophila strains were documented over a cross-section of Flint
tap water samples. Three clinical isolates and four potable water isolates collected from a Flint
hospital and a Flint residence had a high degree of genomic similarity (average nucleotide
identity=99.16–99.971%), all belonging to L. pneumophila sequence type (ST) 1 and serogroup 1.
Serogroup 6 isolates belonging to the previously uncharacterized ST 2518 were widespread in
samples collected throughout a Flint hospital in March 2016. Genes associated with Shigella spp.,
Stenotrophomonas maltophilia, and 22 other putative pathogens were found to be no more
relatively abundant in Flint tap water samples than in other U.S. potable water systems.
Conclusions: Though few clinical isolates are available from the LD outbreaks, the high degree
of similarity demonstrated between select water and clinical isolates indicates that the Flint potable
water system was a probable source of some L. pneumophila infections.

186
INTRODUCTION
In January 2016, the Michigan Department of Health and Human Services (MDHHS) and
the Genesee County Health Department (GCHD) publicly announced that two outbreaks of
Legionnaires’ Disease (LD) had occurred in Genesee County, MI (MDHHS 2016a, 2016b). LD is
a severe form of pneumonia caused by inhalation of certain virulent species of aerosolized bacteria
belonging to the genus Legionella. The first outbreak occurred from June 2014 to March 2015
(n=45) and the second from May to October 2015 (n=47), with a known total of 92 cases and 12
deaths (MDHHS 2016a, 2016b). In Flint, MI, which is located in Genesee County, the corrosive
Flint River was in use as a new drinking water source from April 2014 to October 2015, a period
spanning that of the LD outbreaks, without implementation of federally-mandated corrosion
control. This resulted in systemic degradation of water quality, including elevated lead in the tap
water over a prolonged period now known as the “Flint Water Crisis” (Pieper et al. 2017). This
disruption in water quality also likely stimulated the growth of Legionella pneumophila, the
species that is most frequently the causative agent of LD and is responsible for over 90% of
reported outbreaks (Marston et al. 1994), in Flint’s distribution and plumbing systems (Rhoads et
al. 2017).
Our prior work highlighted coincidence of the LD outbreaks with elevated iron (a natural
consequence of corrosion of iron water mains), reduced levels of free chlorine disinfectant
residuals, and elevated water temperatures, all factors known to stimulate growth of Legionella
(Rhoads et al. 2017). Zahran et al. (2018) similarly reported that the odds of Flint residents being
diagnosed with LD during use of the Flint River increased 6.3 fold and noted associations with
low chlorine residuals. Further, 23S rRNA genes of Legionella spp. and macrophage infectivity
potentiator (mip) genes of L. pneumophila were found to be elevated towards the end of the second
outbreak in the tap water of large buildings in Flint, relative to levels reported for other U.S. water
systems not experiencing outbreak (Schwake et al. 2016). On the other hand, mip levels were
largely below detection in Flint single-family residences during the water crisis (Schwake et al.
2016). Large buildings, such as hospitals, are generally thought to be more susceptible to
Legionella regrowth relative to much simpler plumbing systems characteristic of single family
homes (Sabria and Yu 2002), and Legionella control often focuses on appropriate management of
risks in large buildings (ANSI/ASHRAE 2015).
In addition to the problems noted above occurring during the Flint Water Crisis, rampant
corrosion and unusually cold temperatures also compromised the integrity of drinking water mains.
The incidence of water main breaks was between 1.34-2.21 times higher during the crisis than
during 2010-2013 (Rhoads et al. 2017), creating the potential for increased contamination of
potable water by fecal or opportunistic pathogenic bacteria due to detachment of scale or intrusion
(Garrison et al. 2016). During this time, the water exceeded standards for fecal coliform bacteria
and E. coli, necessitating declaration of multiple boil water advisories (Fonger 2014a, 2014b).
Other health concerns drew attention, including increased incidence of rashes among Flint
residents throughout the duration of Flint River use (Unified Coordination Group 2016) and an
outbreak of Shigellosis in Genesee and Saginaw counties from March to December 2016 (CDC
and MDHHS 2016; Unified Coordination Group 2016), but no evidence has yet emerged to link
these concerns to transmission of waterborne pathogens (CDC and MDHHS 2016; Unified
Coordination Group 2016). Additionally, reportedly in response to concern circulating in the Flint

187
community via social media, the GCHD released a statement informing residents about health
conditions associated with infection by the multidrug-resistant pathogen, Stenotrophomonas
maltophilia (GCHD 2017; Young 2017).
Here we characterized L. pneumophila isolated from Flint tap water shortly after the the
2015 LD outbreaks subsided, and over the subsequent year as the water quality improved and no
LD outbreak was observed, using next-generation sequencing. Gene markers corresponding to 24
fecal and opportunistic pathogens were identified across a cross section of samples representing
hospitals and homes before and after switching back to Detroit water, and compared to data
available for other U.S. cities using shotgun metagenomic sequencing. Legionella isolates were
obtained from the tap water of a hospital and single family residences in Genesee County over
several months after switching back to Detroit water and subject to whole genome sequencing.
One hundred and three drinking water isolates were compared to ten clinical isolates collected
during the second outbreak in terms of sequence type (ST), average nucleotide identity (ANI), and
single nucleotide polymorphism (SNP) analysis.
MATERIALS AND METHODS
Study Site Description
Bulk water and biofilm samples were collected during five sampling campaigns: two while
the city was using the Flint River as the drinking water source (August 18-19, 2015 and October
15-16, 2015) and three approximately five (March 7-9, 2016), eight (June 21-27, 2016), and ten
months (August 2016) after the city resumed purchasing water with corrosion control from the
original Detroit Water and Sewer Department (DWSD) supplier. The August 2015 and August
2016 collections targeted samples from hot and cold water taps in single-story homes and
businesses to characterize water quality at the point of use, where corrosion impacts and regrowth
of bacteria were anticipated to be most problematic. The October 2015 sampling targeted hot and
cold water taps from the two largest hospitals in Flint, “Hospital #1” and “Hospital #2” as
designated in Schwake et al. (2016), where water quality is vulnerable to extensive plumbing
systems and there is potential for immunocompromised populations to be exposed. The March
2016 sampling consisted of repeat sampling from the homes, businesses, and Hospital #1 sampled
previously (Hospital #2 denied access the second time), while the June 2016 sampling focused on
sampling in homes (both hospitals denied access the third time). Control samples were also
collected from nearby Flint Township, which received DWSD water consistently throughout the
duration of the study, and from a nearby school using well water.
Sample Collection and Preservation
One or two liter samples were collected from all taps into sterile polypropylene bottles
(Nalgene, Rochester, NY) with 24 mg of sodium thiosulfate per liter added as a chlorine quenching
agent. Cold water samples were taken by collecting the first flush from the tap. Hot water samples
were collected after flushing for 30 seconds. Select biofilm samples were collected, after all bulk
water samples were collected from that tap, by removing the tap aerator, inserting a sterile swab
(Fisher, Hampton, NH) into the faucet, swabbing one full pass around the circumference of the
inner surface, and transferring to a sterile Lysing Matrix A tube (MP Biomedicals, Solon, OH). In

188
addition, in June 2016, homes were extensively sampled as part of a water heater cleaning
campaign, with the following samples collected before and after the cleaning protocol: hot and
cold stagnant samples from the kitchen tap, a stagnant shower or bathtub sample of blended hot
and cold taps, hot water flushed until constant temperature was reached from the kitchen tap, the
hot water heater drain valve, and a cold water sample collected after flushing for five minutes from
the outside hose bib or nearest tap to the service entry point to collect water before it is exposed to
home plumbing. Between 250 and 500 milliliters were aliquoted into sterile containers for
subsequent culture analysis. All samples were transported to the lab and processed within
approximately 30 hours of sampling. Samples for culture were transported at room temperature
while samples for molecular analysis were transported on ice.
Aliquots for culture were filter-concentrated onto a sterile 0.22 μm pore size mixed-
cellulose ester membrane (Millipore, Billerica, MA) and resuspended in 5 mL sterile tap water
prior to culturing Legionella according to standard methods (CDC 2005). For molecular analyses,
the remaining volume was filter-concentrated in the same manner onto a second filter, which was
subsequently fragmented using sterile forceps and stored at -20 °C until DNA could be extracted
using a FastDNA SPIN Kit (MP Biomedicals, Solon, OH) according to manufacturer instructions.
Biofilm samples were extracted in the same manner after transferring swabs directly to extraction
tubes. Quantities of Legionella spp. and L. pneumophila gene markers from these samples have
been published previously (Rhoads et al. 2017; Schwake et al. 2016). DNA was extracted from
Legionella cultures by resuspending colonies in 50 μl of molecular grade water, freezing at -20
°C, and rapidly thawing at 90°C for 10 minutes.
Whole genome sequencing of L. pneumophila isolates
Whole genome sequencing was conducted on DNA extracts from 103 water L.
pneumophila isolates and ten clinical isolates originating from patients in Genesee County
diagnosed with LD in 2015 (Table S1). Clinical isolates were provided by MDHHS without
identifying patient information. Two positive control strains of known identity and two negative
controls of non-Legionella isolates (selected from plates prepared according to the L. pneumophila
standard method but failing to be confirmed as L. pnuemophila due to irregular morphology) were
also sequenced. DNA extracts were quantified via a Qubit 2.0 Fluorometer (Thermo Fisher,
Waltham, MA) and analyzed via gel electrophoresis to verify DNA integrity. Sequencing was
conducted by MicrobesNG (Birmingham, United Kingdom) on a MiSeq platform (Illumina, San
Diego, CA) with 2 x 250 bp paired-end reads. Libraries were constructed using a modified Nextera
DNA library preparation kit (Illumina, San Diego, CA). Reads were trimmed using Trimmomatic
(Bolger et al. 2014) and de novo assemblies were generated using SPAdes (Bankevich et al. 2012).
Whole genome sequence analysis
16S rRNA gene sequences were extracted from sequence data using the Rapid Annotations
Using Subsystem Technology server (Aziz et al. 2008) and Legionella species assignments were
determined via BLASTn of the sequence against the NCBI nucleotide database via the web server.
Phylogenetic trees were generated using FastTree (Price et al. 2010) based on extracted 16S rRNA
gene sequences, and 37 single-copy housekeeping genes in nucleotide space and amino acid space
using PhyloSift (Darling et al. 2014). ANI was calculated as previously described (Goris et al.

189
2007) and SNPs were identified using kSNP3.0 (Gardner et al. 2015) with maximum likelihood
estimation. Nine known L. pneumophila genomes associated with previous LD outbreaks were
included in the analysis as reference strains for comparison (Table S2).
Serogroup analysis
L. pneumophila isolate genomes belonging to serogroup 1 were identified via detection of
the wzm gene (Mérault et al. 2011) in whole genomes using BLAST with a minimum nucleotide
identity of 98% and e-value of 1e-5. DNA sequence-based classifications were verified and
unknown serogroups were determined using direct fluorescent antibody (DFA) staining with
FITC-conjugated antibodies (m-TECH, Milton, GA). To address problems with non-specific
binding when stained cells were prepared according to manufacturer instructions, the protocol was
modified as follows: isolates grown in buffered yeast extract broth (per liter: 10 g yeast extract, 1
g alpha ketoglutaric acid, 10 g 2-(carbamoylmethylamino)ethanesulfonic acid, 0.4 g L-cystine
monohydrochloride, 0.25 g ferric pyrophosphate) were centrifuged at 5,000 x g and resuspended
in 1X phosphate buffered saline (PBS). To separate 25 µl aliquots of cells suspended in PBS, 5 µl
of each FITC-conjugated antibodies were added and the suspension was incubated at 20oC for 30
minutes. Cells were washed with 1X PBS three times, then viewed with an AxioSkop2 plus
fluorescence microscope (Carl Zeiss Microscopy, Oberkocken, Germany).
Shotgun metagenomic sequencing
Shotgun metagenomic sequencing was performed on DNA extracts from hot (n=3) and
cold (n=4) water samples collected in August and October 2015, while the Flint River water source
was online, and hot (n=4) and cold (n=3) water samples collected in March 2016, after the
municipality resumed purchasing water from DWSD. Additionally, control samples (n=8) were
collected, including one from Flint Township, which consistently received DWSD water, one from
a school that had consistently operated using well water, and two from taps in three additional U.S.
municipalities located in Virginia, Florida, and Arizona (Garner et al., in review; Ji et al., in
preparation). Sequencing was also performed on a biofilm sample (n=1) collected from a Flint
residential tap of particular interest, due to positive detection of Legionella based on quantitative
polymerase chain reaction (qPCR), and a sample collected from the Flint River (n=1). Samples
were multiplexed for shotgun metagenomic sequencing using the barcodes presented in Table S3.
Sequencing was conducted at the Biocomplexity Institute of Virginia Genomics Sequencing
Center (Blacksburg, VA) on an Illumina HiSeq 2500 platform using a 100-cycle paired-end
protocol and Accel-NGS 2S Plus DNA library preparation (Swift Biosciences, Ann Arbor, MI).
Shotgun metagenomic data was uploaded to MG-RAST (Meyer et al. 2008), where
merging of paired-end reads and quality filtering was performed according to default parameters.
Reads were annotated against the RefSeq database for taxonomic classification using the best hit
annotation approach with a stringent minimum amino acid identity cutoff of 90%, minimum
alignment length of 15 amino acids, and 1e-5 e-value cutoff to minimize the potential for
inaccurate annotations. Samples containing high relative abundances of reads annotated as
Shigella spp. and S. maltophilia were further analyzed via endpoint PCR for presence of the ipaH
and 23S rRNA genes specific to each species, respectively, using previously described protocols
(Hsu et al. 2010; Whitby et al. 2000). Metagenomes are publicly available on the MG-RAST server

190
under project mgp21599. Statistically significant differences between abundances of metagenomic
annotations (normalized to number of reads) were tested using a nonparametric Kruskal Wallis
rank sum test with a post-hoc pairwise Wilcoxon test performed in R (v3.3.2).
RESULTS
Legionella Isolate characterization
Across the 192 total samples collected across this study from which isolation was
attempted, 22 hospital samples were positive for culturable L. pneumophila in March 2016, 3
residence samples were positive in June 2016, and 3 residence samples were positive in August
2016. No isolates were obtained from businesses receiving DWSD water, but 3 cold and 3 hot taps
at the school serviced by well water were positive. Isolates were named according to the following
system: First letter indicates building type/location (H=hospital; R=residence; W=school using
well water; P=large public building), second letter indicates sample collection location (H=hot tap;
C=cold tap; D=water heater drain valve; S=shower), followed by a unique numeric identifier.
Clinical strains are denoted C1-10.
According to phylogenetic analysis of 16S rRNA genes mined from whole genome
sequences, all clinical and water isolates, except for eight of the nine well water isolates, were
identified as L. pneumophila. The positive control strain was correctly identified as L.
pneumophila, with SNP analysis further classifying it according to its known provenance (130b),
while the negative control strain was also confirmed to be non-Legionella (Stenotrophomonas
maltophilia). Serotyping via presence of the wzm gene for serogroup 1 and DFA staining for other
serogroups indicated that all L. pneumophila isolates belonged to serogroups 1 and 6 (Table 8-1).
L. pneumophila isolates obtained from clinical and water samples were found to belong to
several STs (Table 8-1). Of serogroup 1 isolates, all belonged to STs 1, 44, 159, 192, 211, 213,
222 or to a previously uncharacterized ST that we submitted to the EWGLI database and has now
been designated as ST 2513. Serogroup 6 isolates all belonged to a previously uncharacterized ST
that we submitted to the EWGLI database and has now been designated as ST 2518. The vast
majority of hospital isolates belonged to ST 2518, while isolates originating from residential tap
water belonged primarily to ST 192. Only ST 1 was represented by both clinical and water isolates,
specifically, three clinical isolates, three isolates from hospital tap water, and one isolate from
residential tap water.
The seven isolates classified as ST 1 were further found to share a high degree of genomic
similarity with each other, with ANI values ranging from 99.164 to 99.971%. In particular, clinical
isolate C3 shared the highest degree of similarity with Flint tap water isolates, with ANI values
ranging from 99.601 to 99.846%. Clinical isolate C3 was found to have the highest ANI similarity
to HH56. Clinical isolate C2 displayed the next highest degree of similarity to the water isolates,
with ANI values ranging from 99.175 to 99.218%. The only other clinical isolate exhibiting ANI
values >98% when compared to a water isolate was clinical isolate C8 when compared with several
of the ST2518 isolates recovered from hot and cold hospital lines, from the cold water line of a
large public building, and the hot water of a school using well water (HC01-14, HH01-16, HH18-
24, HH26-27, HH29-55, PC01, WH03).

191
Table 8-1: Summary of isolates by sequence type (ST), serogroup (SG), and sample origin
ST SG Isolate origin
1 1 3 hospital water (HH17, HH25, HH56), 1 residence water (RH08), 3 clinical (C2,
C3, C7)
44 1 1 clinical (C6)
159 1 1 clinical (C1)
192 1 19 residence water (RC01, RC02, RC03, RC04, RC06, RC07, RD01, RD02,
RD03, RD04, RD05, RH02, RH03, RH04, RH05, RH07 RH07, RS01, RS02)
211 1 1 clinical (C8)
213 1 2 clinical (C4, C5)
222 1 1 clinical (C9)
2513a 1 1 clinical (C10)
2518a 6 66 hospital water (HC01, HC02, HC03, HC04, HC05, HC06, HC07, HC08,
HC09, HC10, HC11, HC12, HC13, HC14, HH01, HH02, HH03, HH04, HH05,
HH06, HH07, HH08, HH09, HH10, HH11, HH12, HH13, HH14, HH15, HH16,
HH18, HH19, HH20, HH21, HH22, HH23, HH24, HH26, HH27, HH29, HH30,
HH31, HH32, HH33, HH34, HH35, HH36, HH37, HH38, HH39, HH40, HH41,
HH42, HH43, HH44, HH45, HH46, HH47, HH48, HH49, HH50, HH51, HH52,
HH53, HH54, HH55), 1 public building (PC01), 1 well water (WH03)
ND ND HH28, RC05, RH01, RS03, WC01, WC02, WC03, WC04, WH01, WH02,
WH04, WH05 aNew STs entered in EWGLI database; ND = could not be determined
When classified based on SNP similarity, calculated via maximum likelihood methods,
isolates formed distinct clades that were generally consistent with the ST classification (Figure 8-
1). The ST 1 clade varied by 2-1062 SNPs, with isolates varying from the reference Paris strain by
only 371-505 SNPs. Water isolates in this clade varied from clinical isolates by as few as 38 SNPs.
Several other distinct clades emerged in which water isolates were grouped primarily by building
type. A large clade of primarily ST 2518 isolates included the majority of the hospital samples,
one well water isolate, and one large public building isolate. Another clade contained only isolates
originating from Flint residence water samples belonging to ST 192. The SNP analysis results
were generally consistent with the phylogenetic results (Figure S1, Figure S2, Figure S3),
confirming the grouping of ST 1 isolates into one clade, with hospital water isolates and residential
water isolates generally forming two separate and larger clades.
The ST of eight isolates derived from well water could not be determined due to the absence
of L. pneumophila-specific alleles. We hypothesize that these isolates were mistakenly
phenotypically characterized as L. pneumophila based on colony morphology and actually belong
to a different species of Legionella. ANI values comparing these isolates with the positive control
L. pneumophila strain (130b) ranged from 62.645 to 62.969%. This indicates that these isolates
are not L. pneumophila, given that genomes belonging to a single species generally share ANI
values >95% (Rodriguez-R and Konstantinidis 2014). The eight well water strains that were not
L. pneumophila appear to be most closely related to L. taurinensis, L. rubrilucens, or L. erythra,
as the 16S rRNA genes extracted from these genomes shared greater than 99% nucleotide
similarity to all three species.

192
Figure 8-1: Single nucleotide polymorphism (SNP) analysis of Legionella pneumophila
isolates. Analysis conducted in kSNP3.0 and visualized using FigTree 14.3. Isolates originated
from clinical (yellow), hospital water (blue), residence water (red), public building water (purple),
or buildings supplied by well water (green). With the exception of buildings supplied by well
water, all buildings were serviced by Flint municipal water. Reference strains are detailed in Table
S2.
Annotation of Shotgun Metagenomic Sequences for Identification of Other Putative
Pathogens
The potential for presence of other waterborne fecal and opportunistic pathogens was
screened using shotgun metagenomic sequencing of water samples and annotation of reads
corresponding to 24 select pathogens using MG-RAST. A cross section of DNA extracts obtained
from Flint tap water during use of Flint River water (August 2015, October 2015) and 5 months
after return to DWSD water (March 2016) were analyzed. These included residences, businesses,
and hospitals in Flint, with comparison to raw Flint River water, a Flint Township business that
remained consistently on DWSD water, a school serviced by well water, and tap water from three
U.S. municipalities (AZ, FL, and VA) (Figure 8-2).
No genes annotated as potentially belonging to pathogens were found to be higher in
relative abundance in Flint tap water relative to water analyzed from four other municipal systems
and one well systems (p≥0.1032, Wilcoxon). Only Cryptosporidium spp. genes were more
abundant in non-Flint samples than Flint samples (p=0.0326). When broken down by date,

193
Legionella spp. and L. pneumophila genes were found at a greater relative abundance in October
2015 samples than in the samples collected from other municipalities and the well system
(p=0.0225), while Shigella spp. genes were more abundant in March 2016 Flint samples than in
the other municipal and well samples (p=0.0184).
Among Flint samples, several genes annotated as highly similar to those pertaining to the
24 selected pathogen genomes were more abundant in small buildings (residences and businesses)
than large buildings (hospitals). These included: Aeromonas hydrophilia (p=0.0043),
Campylobacter jejuni (p=0.0157), Helicobacter pylori (p=0.0481), Mycobacterium spp.
(p=0.0338), and Mycobacterium avium (p=0.0338). There were no significant differences between
putative pathogen gene abundances in hot versus cold Flint samples (p≥0.0741). Metagenomic
reads obtained were annotated as three different species of Legionella in Flint samples, with L.
pneumophila generally being the most abundant, followed by L. longbeachae and L. drancourtii.
Samples with the greatest relative abundance of Shigella spp. (Business 3 - cold, Hospital
#1 - tap iii - hot, and Hospital #1 - tap iii - cold) were further analyzed for the presence of the
Shigella-specific ipaH gene via PCR to confirm the metagenomic results; however, the gene was
not detected in any of the three samples (Figure 8-2B). Similarly, samples with the greatest
abundance of genes annotated as S. maltophilia were screened for the presence of the 23S rRNA
gene specific to this species, but the gene was not detected (Figure 8-2B). In contrast, there was a
strong correlation between the relative abundance of Legionella spp. genes determined by shotgun
metagenomics and the absolute abundance determined previously by qPCR (Schwake et al. 2016)
(Spearman’s rank sum correlation test; ρ=0.6687, p=0.0345).
DISCUSSION
Few clinical sputum isolates appear to have been collected or preserved from the outbreaks
in Flint, with only urine-antigen testing having been conducted in the majority of cases. This is
unfortunate given that the LD outbreak in Genesee County is among the largest in U.S. history
when considered per capita and how vitally important clinical isolates are for learning from past
outbreaks and preventing future outbreaks. Although 31 of 92 LD patients’ home residences were
serviced by Flint water (MDHHS 2016a, 2016b), no sputum isolates were preserved from patients
residing in homes serviced by Flint water (personal communication, MDHHS). Additionally,
given that the LD outbreaks were not announced until January 2016, three months following the
conclusion of the second outbreak, few environmental specimens were collected during the period
that the outbreaks actually occurred. Thus, a more definitive study of environmental sources of the
outbreaks is not possible. The present study is the only to our knowledge that includes shotgun
metagenomic DNA sequence analysis of Flint tap water collected during the actual Flint Water
Crisis, along with comprehensive analysis of Legionella isolates collected throughout the
distribution system within the following 6 months to 1 year as the system began to recover.
It has previously been demonstrated that a single strain of L. pneumophila can colonize
buildings and persist over multiple years (Perola et al. 2005; Rangel-Frausto et al. 1999; Scaturro
et al. 2007). Thus, it is reasonable to assume that water isolates collected in 2016 were likely
representative of any strains colonizing water systems over the previous months or even years.

194
Figure 8-2: Comparison of shotgun metagenomic DNA sequence reads obtained from a cross
section of Flint tap water samples. Samples collected during use of Flint River water (August
and October 2015) and after switch back to DWSD on October 16, 2015 (March 2016). Raw Flint
River source water, tap water from a residence in Flint Township that continually received DWSD
water (DWSD Residence), well water within Genesee County, and municipal tap water in three
other U.S. states (Virginia, Florida, and Arizona). Heatmap is based on annotation of reads
conducted in MG-RAST with a best hit approach, 90% identity cutoff, and 1e-5 e-value cutoff.

195
Interestingly, several strains of L. pneumophila were found to inhabit Flint tap water collected in
homes, hospitals, and businesses. Of the 10 clinical isolates provided, these also belonged to
several strains. However, only three of the clinical strains (C2, C3, C7) displayed high similarity
to any water isolates, all belonging to a single clade, as defined by SNP analysis, containing both
hospital water and residential water isolates. The remaining water isolates were generally
subdivided into two SNP-defined clades, one primarily dominated by residential tap water
samples, and the other by hospital tap water samples (Figure 8-1).
Based on this study, there is reasonable evidence that Flint tap water was a likely source of
L. pneumophila for LD patients infected with ST 1. High degrees of similarity (2-1,062 SNPs)
between three clinical isolates and four water isolates belonging to ST 1 were apparent and
consistent with phylogenetic and ANI analysis. Previous studies have documented that while some
outbreaks are characterized by clinical strains that differ by as few as <5 SNPs, other outbreaks
may differ by as many as 418 core SNPs (Raphael 2016). Thus, the SNP variability between water
and clinical strains of ST 1 in this study is comparable to the range of variation documented within
other outbreaks. Given that the ST 1 water isolates were collected from both hospital and
residential taps, this strain appears to be somewhat widespread in the water distribution system,
spanning multiple Flint buildings. However, the presence of several distinct phylogenetic clades
of L. pneumophila isolated from Flint water systems further demonstrates that a single strain of L.
pneumophila did not dominate the system citywide. We hypothesize that this is likely due to the
presence of conditions favorable to Legionella growth, which we previously documented in the
Flint system (Rhoads et al. 2017), facilitating the proliferation of multiple strains of L.
pneumophila in different buildings and parts of the system. Similarly, the broad distribution of
clinical isolates across eight STs supports the hypothesis that any waterborne exposures that
resulted in LD could hypothetically have originated from a diverse array of L. pneumophila strains.
The variety of STs associated with clinical isolates also suggests that the clinical cases profiled
here originated from a variety of different exposure sources. In addition, the markedly elevated
relative abundance of L. pneumophila gene markers annotated from the October 2015
metagenomic dataset is also consistent with previous surveys indicating elevated levels of
Legionella spp. and L. pneumophila specific gene markers in the Flint system during this period
based on qPCR (Schwake et al. 2016). Furthermore, the relatively low abundances of L.
pneumophila genes annotated from the metagenomic dataset (Figure 8-2A) in the Flint River
sample demonstrates that the potable source water was likely not the primary source of L.
pneumophila genes, but rather regrowth in the distribution system is likely the cause of L.
pneumophila genes in Flint tap water.
All clinical isolates characterized in this study belonged to L. pneumophila serogroup 1,
which is the cause of 57% of reported LD cases in the U.S., though this number is likely
underreported given that over 30% of cases are attributed to undetermined L. pneumophila
serogroups (Marston et al. 1994). The data are also largely skewed because the widely applied
urine antigen test for LD only confirms L. pneumophila serogroup 1. L. pneumophila of ST 1 has
been widely implicated in Legionnaires’ Disease outbreaks worldwide, including outbreaks in
France (Ginevra et al. 2012), China (Qin et al. 2016), Germany (Borchardt et al. 2007), Canada
(Reimer et al. 2010), and the U.S. (Kozak-Muiznieks et al. 2014). In the U.S., ST 1 is thought to
be both the most common cause of sporadic cases of LD, as well as the most common waterborne
ST found in potable and non-potable water alike (Kozak-Muiznieks et al. 2014).

196
Water isolates belonging to serogroup 6, all classified as ST 2518, were found to be
widespread in samples collected from Hospital #1 in March 2016. A study of L. pneumophila
isolates collected from Flint tap water in September and October of 2016 also found that serogroup
6 isolates were widespread in residential premise plumbing water samples, though these isolates
were all found to belong to STs 367 and 461 (Byrne et al. 2018). Serogroup 6 strains identified by
Byrne et al. (2018) were found to be at least as infectious of macrophages as a known virulent
laboratory strain, emphasizing the potential for LD to be caused by non-serogroup 1 strains.
Improved diagnostic tools are critically needed to address the potential for LD caused by non-
serogroup 1 strains, and more research is needed to confirm the relevance of serogroup 6 strains
for human infectivity.
It is also interesting to note that the vast majority of L. pneumophila isolates obtained from
taps serviced by Flint water in this study originated from hot water taps, 38% of which were
positive for culturable L. pneumophila, compared to only 16% of cold tap samples. While L.
pneumophila typically multiplies at temperatures between 25°C and 37°C (Wadowsky et al. 1985)
and prospers in hot water plumbing systems (Rhoads et al. 2015), it has also been widely
documented in cold water taps, with one study finding as many as 47% of surveyed taps positive
for genes specific to L. pneumophila serogroup 1 (Donohue et al. 2014).
In addition to the documented LD outbreaks and elevated levels of lead, several other
health concerns emerged in Flint, including known contamination of the potable water system with
E. coli and coliform bacteria, an outbreak of Shigellosis, and widespread occurrence of rashes
(CDC and MDHHS 2016; GCHD 2017; Fonger 2014a, 2014b; Unified Coordination Group 2016;
Young 2017). In particular, the cause of the rashes and source of the Shigella have never been
confirmed. Given that waterborne bacterial agents are capable of causing such afflictions,
metagenomic sequencing was applied to select water samples collected from August 2015 to
March 2016 to screen for the occurrence of DNA sequences corresponding to suspect agents. It is
important to note that shotgun metagenomics is an emerging methodology, with no standard
protocols yet available, and cannot directly confirm the presence or viability of an actual pathogen.
In particular, detection of some level of background DNA lingering in extracellular form or within
cells killed as a result of water treatment, especially for fecal contaminants that are non-native to
drinking water and do not readily flourish in the drinking water environment, is likely and not
necessarily representative of live organisms. Also important to note is that shotgun metagenomic
sequencing provides relative abundances of target genes (i.e., normalized to total reads) and thus
does not measure the total number of putative pathogens. In other words, a sample might be highly
enriched in a DNA sequence corresponding to a putative pathogen, but the total biomass may
actually be very low, suggesting abundance of the pathogen would also be correspondingly low.
Given that few water samples were collected or preserved during the time of the actual Flint Water
Crisis, shotgun metagenomics was applied as an exploratory screening tool to gain further insight
into the microbial water quality of Flint water during this period.
Shotgun metagenomic sequence data from Flint water were compared data from samples
collected from buildings located near Flint, but serviced by DWSD or well water, as well as
samples from three different U.S. cities’ potable water systems collected at the point of use. This
approach provided various local and national non-Flint samples as points of relative comparison

197
and provided context for understanding what was found in the Flint samples. No clear differences
between relative abundance of reads annotated as pathogens in Flint versus non-Flint samples
emerged, when comparing the two datasets as a whole. However, the March 2016 levels of Shigella
spp. gene markers were relatively more abundant compared to other cities. The Shigellosis
outbreak in Genesee County began in March 2016, which is consistent with the possibility of
contamination of water with the bacterium during this timeframe (CDC and MDHHS 2016).
However, endpoint PCR analysis indicated that Shigella-specific genes were undetectable in the
samples from which the species was annotated via metagenomics. Similarly, although S.
maltophilia was detected at high relative abundances in a portion of the metagenomic analyses,
when these same samples were analyzed via endpoint PCR, the species was not detected. Given
that PCR-based methods performed with well-validated assays would be expected to be far more
sensitive and specific than shotgun metagenomic sequencing and annotation, together, these results
suggest that shotgun metagenomic analysis likely resulted in false-positive annotations for some
pathogens. Because shotgun metagenomics captures a random subset of full genomes of a
microbial community, incorrect annotations are hypothesized to likely result from the detection of
genes belonging to a lineage that shares a common ancestor with the putative pathogens targeted
in this study. In contrast, the relative abundance of Legionella spp. genes determined via shotgun
metagenomics was well-correlated with abundances of the genus determined by qPCR. Thus, use
of such next-generation sequence technologies to broadly profile the microbial community and
identify putative pathogens of interest is does provide some value for screening the composition
of samples of interest. However, use of these methods needs to be refined and should be employed
with extreme caution and may be inappropriate for certain pathogens that are particularly difficult
to annotate with certainty.
This study characterizes clinical and water L. pneumophila isolates from Flint, Michigan
and the surrounding area and establishes a high degree of similarity between four water isolates
originating from Flint tap water and three clinical strains. This study also establishes that a variety
of L. pneumophila strains were culturable from the Flint system, demonstrating that multiple
strains were potentially transmitted via the drinking water. Still, the remaining seven clinical
strains analyzed in this study showed low similarity to the water isolates and remain of unknown
provenance. Given the widespread distribution of various strains of L. pneumophila throughout
the Flint water distribution system, it is also possible that the serogroup 1 ST 1 strain implicated
here as having the greatest degree of similarity between water and clinical isolates, could also
occur in other putative sources of transmission, such as cooling towers.
ACKNOWLEDGEMENTS
This study was partially supported by U.S. National Science Foundation RAPID Award
(1556258), Graduate Research Fellowship Program Grant (DGE 0822220) and supplementary
funding associated with grant 1336650. Additional support was provided by the Alfred P. Sloan
Foundation Microbiology of the Built Environment program, the State of Michigan for a study of
effects of flushing residential hot water heaters (summer 2016), the American Water Works
Association Abel Wolman Fellowship, and the Institute for Critical Technology and Applied
Science at Virginia Tech. We also thank the members of the Flint Water Study Team at Virginia
Tech, who volunteered their time to collect samples, and the Flint citizens and businesses that
supported this study, and we thank Joan Rose for allowing us to utilize her laboratory.

198
REFERENCES
American National Standards Institute / American Society of Heating, Refrigerating and Air-
Conditioning Engineers (ANSI/ASHRAE). 2015. Standard 188 Legionellosis: Risk
Management for Building Water Systems.
Aziz RK, Bartels D, Best AA, DeJongh M, Disz T, Edwards RA, et al. 2008. The RAST Server:
Rapid Annotations using Subsystems Technology. BMC Genomics 9:75.
Bankevich A, Nurk S, Antipov D, Gurevich AA, Dvorkin M, Kulikov AS, et al. 2012. SPAdes: a
new genome assembly algorithm and its applications to single-cell sequencing. J. Comput.
Biol. 19:455–477.
Bolger AM, Lohse M, Usadel B. 2014. Trimmomatic: a flexible trimmer for Illumina sequence
data. Bioinformatics 30:2114–2120.
Borchardt J, Helbig JH, Lück PC. 2007. Occurrence and distribution of sequence types among
Legionella pneumophila strains isolated from patients in Germany: common features and
differences to other regions of the world. Eur. J. Clin. Microbiol. Infect. Dis. 27:29–36.
Byrne, BG, McColm, S, McElmurry, SP, Kilgore, PE, Sobeck, J, Sadler, R, Love, NG, Swanson,
MS. 2018. Prevalence of Infection-Competent Serogroup 6 Legionella pneumophila within
Premise Plumbing in Southeast Michigan. 9:e00016-18.
Centers for Disease Control and Prevention (CDC). 2005. Procedures for the Recovery of
Legionella from the Environment.
Centers for Disease Control and Prevention (CDC), Michigan Department of Health & Human
Services (MDHHS). 2016. Interim Findings from the Shigellosis Outbreak Investigation
— Genesee and Saginaw Counties, Michigan, 2016. Available:
http://www.michigan.gov/documents/mdhhs/MI_Shigellosis_Dec_Update_CommunityPr
esentation_545873_7.pdf [accessed 6 December 2017].
Genesee County Health Department (GCHD). 2017. Media Release RE: Stenotrophomonas
maltophilia. Available: https://gchd.us/wp-content/uploads/2017/04/Stenotrophomonas-4-
19-17-1.pdf. [accessed 6 December 2017].
Darling AE, Jospin G, Lowe E, Matsen FA IV, Bik HM, Eisen JA. 2014. PhyloSift: phylogenetic
analysis of genomes and metagenomes. PeerJ 2:e243.
Donohue MJ, O’Connell K, Vesper SJ, Mistry JH, King D, Kostich M, et al. 2014. Widespread
molecular detection of Legionella pneumophila Serogroup 1 in cold water taps across the
United States. Environ. Sci. Technol. 48: 3145–3152.
Fonger R. 2014a. Flint expands boil water advisory area after more positive tests for total coliform
bacteria. MLive.com. Available:
http://www.mlive.com/news/flint/index.ssf/2014/09/flint_expands_boil_water.html
[accessed 6 December 2017].
Fonger R. 2014b. Flint issues boil water advisory for section of the city after positive test for total
coliform bacteria. MLive.com. Available:
http://www.mlive.com/news/flint/index.ssf/2014/09/flint_issues_boil_water_adviso.html
[accessed 6 December 2017].
Gaia V, Fry NK, Afshar B, Luck PC, Meugnier H, Etienne J, et al. 2005. Consensus Sequence-
Based Scheme for Epidemiological Typing of Clinical and Environmental Isolates of
Legionella pneumophila. J. Clin. Microbiol. 43:2047–2052.

199
Gardner SN, Slezak T, Hall BG. 2015. kSNP3.0: SNP detection and phylogenetic analysis of
genomes without genome alignment or reference genome. Bioinformatics 31:2877–2878.
Garner E, Chen C, Xia K, Bowers J, Engelthaler DM, McLain J, et al. Metagenomic
characterization of antibiotic resistance genes in full-scale reclaimed water distribution
systems and corresponding potable systems. Manuscript in review.
Garrison LE, Kunz JM, Cooley LA, Moore MR, Lucas C, Schrag S, et al. 2016. Vital Signs:
Deficiencies in Environmental Control Identified in Outbreaks of Legionnaires’ Disease -
North America, 2000-2014. Morb. Mortal. Wkly. Rep. 65:576–584.
Ginevra C, Jacotin N, Diancourt L, Guigon G, Arquilliere R, Meugnier H, et al. 2012. Legionella
pneumophila sequence type 1/Paris pulsotype subtyping by spoligotyping. J. Clin.
Microbiol. 50:696–701.
Gordon M, Yakunin E, Valinsky L, Chalifa-Caspi V, Moran-Gilad J, ESCMID Study Group for
Legionella Infections. 2017. A bioinformatics tool for ensuring the backwards
compatibility of Legionella pneumophila typing in the genomic era. Clin. Microbiol. Infect.
23:306–310.
Goris J, Konstantinidis KT, Klappenbach JA, Coenye T, Vandamme P, Tiedje JM. 2007. DNA-
DNA hybridization values and their relationship to whole-genome sequence similarities.
Int. J. Syst. Evol. Microbiol. 57:81–91.
Hsu B-M, Wu S-F, Huang S-W, Tseng Y-J, Ji D-D, Chen J-S, et al. 2010. Differentiation and
identification of Shigella spp. and enteroinvasive Escherichia coli in environmental waters
by a molecular method and biochemical test. Water Research 44:949–955.
Ji P, Rhoads WJ, Edwards MA, Pruden A. Metagenomic characterization of the hot water
plumbing microbiome and relationship with opportunistic pathogen occurrence.
Manuscript in preparation.
Kozak-Muiznieks NA, Lucas CE, Brown E, Pondo T, Taylor TH, Frace M, et al. 2014. Prevalence
of Sequence Types among Clinical and Environmental Isolates of Legionella pneumophila
Serogroup 1 in the United States from 1982 to 2012. 52:201-211.
Marston BJ, Lipman HB, Breiman RF. 1994. Surveillance for Legionnaires’ disease. Risk factors
for morbidity and mortality. Arch. Intern. Med. 154:2417–2422.
Mérault N, Rusniok C, Jarraud S, Gomez-Valero L, Cazalet C, Marin M, et al. 2011. Specific real-
time PCR for simultaneous detection and identification of Legionella pneumophila
serogroup 1 in water and clinical samples. Appl. Environ. Microbiol. 77:1708–1717.
Meyer F, Paarmann D, D’Souza M, Olson R, Glass EM, Kubal M, et al. 2008. The metagenomics
RAST server – a public resource for the automatic phylogenetic and functional analysis of
metagenomes. BMC Bioinformatics 9:386.
Michigan Department of Health and Human Services (MDHHS). 2016a. Legionellosis Outbreak-
Genesee County, June, 2014 – March, 2015, Full Analysis.
Michigan Department of Health and Human Services (MDHHS). 2016b. Legionellosis Outbreak-
Genesee County May, 2015 – October, 2015, Full Analysis.
Perola O, Kauppinen J, Kusnetsov J, Karkkainen U-M, Christian Luck P, Katila M-L. 2005.
Persistent Legionella pneumophila colonization of a hospital water supply: efficacy of
control methods and a molecular epidemiological analysis. APMIS 113:45–53.
Pieper KJ, Tang M, Edwards MA. 2017. Flint Water Crisis Caused By Interrupted Corrosion
Control: Investigating “Ground Zero” Home. Environ. Sci. Technol. 51:2007–2014.
Price, M.N., Dehal, P.S., and Arkin, A.P. (2010) FastTree 2 -- Approximately Maximum-
Likelihood Trees for Large Alignments. PLoS ONE, 5(3):e9490.

200
Qin T, Zhang W, Liu W, Zhou H, Ren H, Shao Z, et al. 2016. Population structure and minimum
core genome typing of Legionella pneumophila. Sci. Rep. 6:21356.
Rangel-Frausto MS, Sigfrido Rangel-Frausto M, Rhomberg P, Hollis RJ, Pfaller MA, Wenzel RP,
et al. 1999. Persistence of Legionella Pneumophila in a Hospital’s Water System: A 13-
Year Survey. Infect. Control Hosp. Epidemiol. 20:793–797.
Raphael BH, Baker DJ, Nazarian E, Lapierre P, Bopp D, Kozak-Muiznieks NA et al. 2016.
Genomic Resolution of Outbreak-Associated Legionella pneumophila Serogroup 1 Isolates
from New York State. Appl. Environ. Microbiol. 28:3582-3590.
Reimer AR, Au S, Schindle S, Bernard KA. 2010. Legionella pneumophila monoclonal antibody
subgroups and DNA sequence types isolated in Canada between 1981 and 2009:
Laboratory Component of National Surveillance. Eur. J. Clin. Microbiol. Infect. Dis.
29:191–205.
Rhoads WJ, Garner E, Ji P, Zhu N, Parks J, Schwake DO, et al. 2017. Distribution System
Operational Deficiencies Coincide with Reported Legionnaires’ Disease Clusters in Flint,
Michigan. Environ. Sci. Technol. 51:11986–11995.
Rhoads WJ, Ji P, Pruden A, Edwards MA. 2015. Water heater temperature set point and water use
patterns influence Legionella pneumophila and associated microorganisms at the tap.
Microbiome 3:67.
Rodriguez-R LM, Konstantinidis KT. 2014. Bypassing Cultivation To Identify Bacterial Species.
Microbe 9:111–118.
Sabria M, Yu VL. 2002. Hospital-acquired legionellosis: solutions for a preventable infection.
Lancet Infect. Dis. 2:368–373.
Scaturro M, Dell’Eva I, Helfer F, Ricci ML. 2007. Persistence of the Same Strain of Legionella
pneumophila in the Water System of an Italian Hospital for 15 Years. Infect. Control Hosp.
Epidemiol. 28:1089–1092.
Schwake DO, Garner E, Strom OR, Pruden A, Edwards MA. 2016. Legionella DNA Markers in
Tap Water Coincident with a Spike in Legionnaires’ Disease in Flint, MI. Environ. Sci.
Technol. Lett. 3:311–315.
Unified Coordination Group—Flint, Michigan. 2016. Flint Rash Investigation.
Wadowsky RM, Wolford R, McNamara AM, Yee RB. 1985. Effect of temperature, pH, and
oxygen level on the multiplication of naturally occurring Legionella pneumophila in
potable water. Appl. Environ. Microbiol. 49:1197–1205.
Whitby PW, Carter KB, Burns JL, Royall JA, LiPuma JJ, Stull TL. 2000. Identification and
detection of Stenotrophomonas maltophilia by rRNA-directed PCR. J. Clin. Microbiol.
38:4305–4309.
Young M. 2017. Social media scare prompts health department to release info on bacteria.
MLive.com. Available:
http://www.mlive.com/news/flint/index.ssf/2017/04/social_media_scare_prompts_hea.ht
ml [accessed 9 December 2017].
Zahran S, McElmurry SP, Kilgore, PE, Mushinski, D, Press, J, Love, et al. 2018. Assessment of
the Legionnaires’ disease outbreak in Flint, Michigan. Proc. Nat. Acad. Sci. Published
online ahead of print, Feb 5, 2018.

201
SUPPLEMENTARY INFORMATION FOR CHAPTER 8
Table S1: Summary of environmental and clinical L. pneumophila isolates subject to whole genome sequencing
SampleIDa Year
Collected
Month
Collected
Isolate
Type
Building
Typeb
Sample Tap or
Source
Flushed/
Stagnant
Water Source (April
2014-October 2015) ST SG
C1 2015 Clinical 159 1
C2* 2015 Clinical 1 1
C3* 2015 Clinical 1 1
C4 2015 Clinical 213 1
C5 2015 Clinical 213 1
C6 2015 Clinical 44 1
C7 2015 Clinical 1 1
C8 2015 Clinical 211 1
C9* 2015 Clinical 222 1
C10 2015 Clinical 2513 1
HC01 2016 March Water Hospital #1 Cold Stagnant Flint 2518 6d
HC02 2016 March Water Hospital #1 Cold Stagnant Flint 2518 6d
HC03 2016 March Water Hospital #1 Cold Stagnant Flint 2518 6d
HC04 2016 March Water Hospital #1 Cold Stagnant Flint 2518 6d
HC05 2016 March Water Hospital #1 Cold Stagnant Flint 2518 6d
HC06 2016 March Water Hospital #1 Cold Stagnant Flint 2518 6d
HC07 2016 March Water Hospital #1 Cold Stagnant Flint 2518 6d
HC08 2016 March Water Hospital #1 Cold Stagnant Flint 2518 6d
HC09 2016 March Water Hospital #1 Cold Stagnant Flint 2518 6d
HC10 2016 March Water Hospital #1 Cold Stagnant Flint 2518 6d
HC11 2016 March Water Hospital #1 Cold Stagnant Flint 2518 6d
HC12 2016 March Water Hospital #1 Cold Stagnant Flint 2518 6d
HC13 2016 March Water Hospital #1 Cold Stagnant Flint 2518 6d
HC14 2016 March Water Hospital #1 Cold Stagnant Flint 2518 6d
HH01 2016 March Water Hospital #1 Hot Stagnant Flint 2518 6d
HH02 2016 March Water Hospital #1 Hot Stagnant Flint 2518 6d
HH03 2016 March Water Hospital #1 Hot Stagnant Flint 2518 6d
HH04 2016 March Water Hospital #1 Hot Stagnant Flint 2518 6d

202
HH05 2016 March Water Hospital #1 Hot Stagnant Flint 2518 6d
HH06 2016 March Water Hospital #1 Hot Stagnant Flint 2518 6d
HH07 2016 March Water Hospital #1 Hot Stagnant Flint 2518 6d
HH08 2016 March Water Hospital #1 Hot Stagnant Flint 2518 6d
HH09 2016 March Water Hospital #1 Hot Stagnant Flint 2518 6d
HH10 2016 March Water Hospital #1 Hot Stagnant Flint 2518 6d
HH11 2016 March Water Hospital #1 Hot Stagnant Flint 2518 6d
HH12 2016 March Water Hospital #1 Hot Stagnant Flint 2518 6d
HH13 2016 March Water Hospital #1 Hot Stagnant Flint 2518 6d
HH14 2016 March Water Hospital #1 Hot Stagnant Flint 2518 6d
HH15 2016 March Water Hospital #1 Hot Stagnant Flint 2518 6d
HH16 2016 March Water Hospital #1 Hot Stagnant Flint 2518 6d
HH17 2016 March Water Hospital #1 Hot Stagnant Flint 1 1
HH18 2016 March Water Hospital #1 Hot Stagnant Flint 2518 6d
HH19 2016 March Water Hospital #1 Hot Stagnant Flint 2518 6d
HH20 2016 March Water Hospital #1 Hot Stagnant Flint 2518 6d
HH21 2016 March Water Hospital #1 Hot Stagnant Flint 2518 6d
HH22 2016 March Water Hospital #1 Hot Stagnant Flint 2518 6d
HH23 2016 March Water Hospital #1 Hot Stagnant Flint 2518 6d
HH24 2016 March Water Hospital #1 Hot Stagnant Flint 2518 6d
HH25 2016 March Water Hospital #1 Hot Stagnant Flint 1 1
HH26 2016 March Water Hospital #1 Hot Stagnant Flint 2518 6d
HH27 2016 March Water Hospital #1 Hot Stagnant Flint 2518 6d
HH28 2016 March Water Hospital #1 Hot Stagnant Flint ND ND
HH29 2016 March Water Hospital #1 Hot Stagnant Flint 2518 6d
HH30 2016 March Water Hospital #1 Hot Stagnant Flint 2518 6d
HH31 2016 March Water Hospital #1 Hot Stagnant Flint 2518 6d
HH32 2016 March Water Hospital #1 Hot Stagnant Flint 2518 6d
HH33 2016 March Water Hospital #1 Hot Stagnant Flint 2518 6d
HH34 2016 March Water Hospital #1 Hot Stagnant Flint 2518 6d
HH35 2016 March Water Hospital #1 Hot Stagnant Flint 2518 6d
HH36 2016 March Water Hospital #1 Hot Stagnant Flint 2518 6d
HH37 2016 March Water Hospital #1 Hot Stagnant Flint 2518 6d

203
HH38 2016 March Water Hospital #1 Hot Stagnant Flint 2518 6d
HH39 2016 March Water Hospital #1 Hot Stagnant Flint 2518 6d
HH40 2016 March Water Hospital #1 Hot Stagnant Flint 2518 6d
HH41 2016 March Water Hospital #1 Hot Stagnant Flint 2518 6d
HH42 2016 March Water Hospital #1 Hot Stagnant Flint 2518 6d
HH43 2016 March Water Hospital #1 Hot Stagnant Flint 2518 6d
HH44 2016 March Water Hospital #1 Hot Stagnant Flint 2518 6d
HH45 2016 March Water Hospital #1 Hot Stagnant Flint 2518 6d
HH46 2016 March Water Hospital #1 Hot Stagnant Flint 2518 6d
HH47 2016 March Water Hospital #1 Hot Stagnant Flint 2518 6d
HH48 2016 March Water Hospital #1 Hot Stagnant Flint 2518 6d
HH49 2016 March Water Hospital #1 Hot Stagnant Flint 2518 6d
HH50 2016 March Water Hospital #1 Hot Stagnant Flint 2518 6d
HH51 2016 March Water Hospital #1 Hot Stagnant Flint 2518 6d
HH52 2016 March Water Hospital #1 Hot Stagnant Flint 2518 6d
HH53 2016 March Water Hospital #1 Hot Stagnant Flint 2518 6d
HH54 2016 March Water Hospital #1 Hot Stagnant Flint 2518 6d
HH55 2016 March Water Hospital #1 Hot Stagnant Flint 2518 6d
HH56 2016 March Water Hospital #1 Hot Stagnant Flint 1 1
PC01 2016 March Water Public
building
Cold Stagnant Flint 2518 6e
RC01 2016 June Water Residence Cold Stagnant Flint 192 1
RC02 2016 June Water Residence Cold Flushed Flint 192 1
RC03 2016 August Water Residence Cold Stagnant Flint 192 1
RC04 2016 June Water Residence Cold Stagnant Flint 192 1
RC05 2016 June Water Residence Cold Stagnant Flint ND 1
RC06 2016 June Water Residence Cold Stagnant Flint 192 1
RC07 2016 June Water Residence Cold Flushed Flint 192 1
RD01 2016 June Water Residence HWHDV NA Flint 192 1
RD02 2016 June Water Residence HWHDV NA Flint 192 1
RD03 2016 June Water Residence HWHDV NA Flint 192 1
RD04 2016 June Water Residence HWHDV NA Flint 192 1
RD05 2016 June Water Residence HWHDV NA Flint 192 1

204
RH01 2016 June Water Residence Hot Flushed Flint NA 1
RH02 2016 June Water Residence Hot Stagnant Flint 192 1
RH03 2016 June Water Residence Hot Flushed Flint 192 1
RH04 2016 June Water Residence Hot Flushed Flint 192 1
RH05 2016 June Water Residence Hot Stagnant Flint 192 1
RH06 2016 June Water Residence Hot Stagnant Flint 192 1
RH07 2016 June Water Residence Hot Stagnant Flint 192 1
RH08 2016 August Water Residence Hot Stagnant Flint 1 1
RS01 2016 June Water Residence Shower Stagnant Flint 192 1
RS02 2016 August Water Residence Shower Stagnant Flint 192 1
RS03 2016 June Water Residence Shower Stagnant Flint ND ND
WC01 2016 March Water Well Water Cold Stagnant well ND ND
WC02 2016 March Water Well Water Cold Stagnant well ND ND
WC03 2016 March Water Well Water Cold Stagnant well ND ND
WC04 2016 March Water Well Water Cold Stagnant well ND ND
WH01 2016 March Water Well Water Hot Stagnant well ND ND
WH02 2016 March Water Well Water Hot Stagnant well ND ND
WH03 2016 March Water Well Water Hot Stagnant well 2518 6d
WH04 2016 March Water Well Water Hot Stagnant well ND ND
WH05 2016 March Water Well Water Hot Stagnant well ND ND
pos_con* + control 42 1
neg_con* - control NA NA aIsolates were named according to the following system: First letter indicates building type/location (H=hospital; R=residence; W=school using well water;
P=large public building), second letter indicates sample collection location (hot water tap (H), cold water tap (C),water heater drain valve (D), shower (S)),
followed by a unique numeric identifier. Clinical strains are denoted C1-10. bUnless otherwise indicated, all buildings were serviced by Flint municipal water derived from the Flint River during the Flint Water Crisis dPresumed serogroup 6 based on direct fluorescent antibody staining of a phylogenetically diverse subset of isolates belonging to serogroup 2518 eVerified serogroup 6 using direct fluorescent antibody staining
*indicates isolate was prepared and sequenced twice with consistent results as an additional control.
HWHDV= hot water heater drain valve; ST = sequence type; SG = serogroup; ND=could not be determined due to insufficient genome coverage; NA=not
applicable

205
Table S2: Clinical reference strains selected for comparison to water isolates.
Sample ID GenBank Accession
Number
Origin Serogroup Sequence Type
LP Philadelphia AE017354.1 USA 1 ST-136
LP ATCC 43290 CP003192.1 USA 12 ST-187
LP Alcoy CP001828.1 Spain 1 ST-578
LP Corby CP000675.2 UK 1 ST-51
LP Lens CR628337.1 France 1 ST-15
LP 130b FR687201.1 USA 1 ST-42
LP Paris CR628336.1 France 1 ST-1
LP Lorraine FQ958210.1 France 1 ST-47
LPHL06041035 FQ958211.1 France 1 ST-734
Legionella clemsonensis NZCP016397.1
Legionella fallonii NZLN614827.1
Legionella hackeliae NZLN681225.1
Legionella longbeachae NC013861.1
Legionella oakridgensis NZCP004006.1
Table S3: MG-RAST identifiers associated with each metagenome and barcodes used to multiplex
samples for shotgun metagenomic sequencing
Sample MG-RAST ID Barcode
Flint River mgm4735990.3 CGATGT
Residence A (cold) mgm4735991.3 TGACCA
Residence A (biofilm) mgm4735992.3 ACAGTG
DWSD Residence mgm4735993.3 GCCAAT
Business 1 (cold) mgm4735994.3 CAGATC
Hospital #1 - tap i (cold) mgm4735995.3 CTTGTA
Hospital #2 (cold) mgm4736011.3 AGTCAA
Hospital #2 (hot) mgm4736012.3 AGTTCC
Hospital #1 - tap ii (hot) mgm4736013.3 ATGTCA
Hospital #1 - tap iii (hot) mgm4736016.3 CCGTCC
Hospital #1 - tap i (cold) mgm4736014.3 GTCCGC
Business 2 (hot) mgm4736020.3 GTGAAA
Residence B mgm4736017.3 ATCACG
Well water mgm4736022.3 TTAGGC
Business 3 (cold) mgm4736023.3 ACTTGA
Hospital #1 - tap iii (cold) mgm4736029.3 TAGCTT
Hospital #1 - tap iii (hot) mgm4736028.3 GATCAG
Hospital #1 - tap i (cold) mgm4736027.3 GGCTAC

206
Figure S1: Phylogenetic tree generated using FastTree (Price et al. 2010) based on extracted 16S rRNA gene sequences using
PhyloSift (Darling et al. 2014).

207
Figure S2: Phylogenetic tree generated using FastTree (Price et al. 2010) based on 37 single-copy housekeeping genes in amino acid
space using PhyloSift (Darling et al. 2014)

208
Figure S3: Phylogenetic tree generated using FastTree (Price et al. 2010) based on 37 single-copy housekeeping genes in nucleotide
space using PhyloSift (Darling et al. 2014)

209
CHAPTER 9 : CONCLUSIONS AND RECOMMENDATIONS FOR FUTURE WORK
In order to protect public health and advance sustainability of society’s water resources, it
is imperative that research is conducted to characterize microbial contaminants throughout the
urban water cycle and identify strategies to limit their transmission to downstream populations.
While source water protection, filtration, and disinfection have all contributed tremendously to
improvements in public health and accessibility to safe drinking water in developed countries,
additional microbial challenges have emerged. Regrowth of opportunistic pathogens (OP) in
distribution systems and premise plumbing and the transmission of antibiotic resistant bacteria
(ARB) and their associated resistance genes (ARG) represent two key challenges for which
ongoing research is needed. This dissertation contributed to this need by characterizing the
occurrence of OPs and ARGs throughout the urban water cycle and identified potential strategies
by which control of these contaminants may be achieved, given further research and development.
Chapter 2 of this dissertation described the mechanisms by which these organisms can be
transmitted, particularly by recycled wastewater systems, and identified critical challenges with
respect to wastewater reuse and safeguarding public health. We proposed adoption of a “human
exposome” framework to guide development of risk management strategies for holistic assessment
of recycled water quality. Namely, this would require consideration of both acute and chronic
exposures to recycled water, consideration of all routes of exposure to recycled water, including
not only ingestion, but also inhalation and dermal contact, and assessment of water quality at the
point of use, rather than at the location of treatment.
In the third chapter of this dissertation, monitoring of an urban watershed during storm
flow conditions revealed that storm-driven transport of ARGs contributed significantly to surface
water loadings of ARGs, with loadings of certain ARGs being as high as two orders of magnitude
greater during storm conditions than during equivalent background periods. In addition, some
ARGs (e.g., tet(O) and tet(W)) were found to correlate with fecal indicator bacteria, while others
were not, suggesting that the processes governing fate and transport are not the same for all ARGs.
The fourth chapter of this dissertation identified a decrease in ARGs in a watershed as a
result of extreme rainfall and flooding, presumably due to dilution of ARGs suspended in surface
water and transport of sediment ARGs downstream. Within ten months of post-flood recovery,
however, the system had returned to pre-flood abundances of ARGs, suggesting that ARG sources
persisted after the flood. Bacterial phylogeny was not correlated with ARG in water or sediment
samples, but correlations were noted between ARGs and several antibiotics and metals, suggesting
they may have exerted selective pressure for ARB in post flood recovery. Identification of ARGs
on scaffolds assembled from metagenomics data co-occurring with mobile genetic element-
associated genes highlighted the potential for intercellular transmission of ARGs.
In Chapter 5, a survey of four paired full-scale non-potable reclaimed and potable water
distribution systems in the United States revealed that the ARG sul1 was consistently elevated in
reclaimed water compared to potable water, while other ARGs were elevated only at select utilities.
Of critical importance is the finding that ARGs were generally not significantly reduced by tertiary
wastewater treatment or drinking water treatment. A multitude of ARGs were found to be co-
located with plasmid gene markers on metagenomic scaffolds, again demonstrating potential for

210
intercellular transmission of ARGs to occur. Correlations between several ARGs and potential
selective agents (e.g., antibiotics, metals, and disinfectants) in distribution systems suggest that
these agents may select for ARGs or shape a microbial community that is pre-disposed to carriage
of ARGs. Weak correlations were also noted between ARGs and the overall microbial community,
as well as several key phyla.
In the sixth chapter, the survey of reclaimed and potable distribution systems was further
examined and genes associated with two genera containing OPs (Legionella spp., Mycobacterium
spp.) and total bacteria (16S rRNA genes) were found to be more abundant in reclaimed water
systems than corresponding potable systems. This study identified key characteristics of reclaimed
water that generally differ from potable water (i.e., nutrient concentration, temperature), that are
likely to contribute to the observed differences in OP occurrence. In addition, correlations were
observed between different amoebic hosts and Legionella spp. genes, suggesting that different
interactions between members of the microbial community may contribute to differences in OP
abundances between reclaimed and potable water.
The seventh chapter explored the role of pilot- or bench-scale direct potable reuse (DPR)
treatment at four U.S. utilities in producing biologically-stable water during distribution and
stagnation in premise plumbing. All utilities and treatment scenarios produced water that resulted
in regrowth of total bacteria (16S rRNA genes) during incubation in simulated premise plumbing
rigs. However, the regrowth of total bacteria, OPs, and ARGs was not significantly greater for any
DPR blends treated with advanced oxidative processes (AOP) than in corresponding traditional
potable waters. Biodegradable dissolved organic carbon, a measure of biological stability, was not
correlated with total bacteria, any OP gene markers, or any ARGs, suggesting that in this highly
treated water, organic carbon is likely not the limiting nutrient controlling regrowth.
In the eighth chapter, samples collected from the compromised Flint, Michigan drinking
water distribution system during the Flint Water Crisis revealed that strains of Legionella
pneumophila isolated from the hot water of three hospital taps and one residence tap had a high
degree of genomic similarity to a subset of outbreak associated strains collected from patients in
the area. In addition, a diverse variety of strains were found in the Flint municipal water system,
suggesting that the crisis contributed to the growth of multiple strains of L. pneumophila.
Together, these chapters describe an advancement in knowledge regarding the occurrence
of OPs and ARGs in a variety of water systems, and highlights trends that may be of value in
developing management strategies for limiting regrowth or transmission of these bacteria in
various compartments of the urban water cycle. The research described herein raises numerous
additional needs for research that are critical to the continued advancement of science in this realm.
In particular, numerous research needs exist regarding the behavior of ARGs in various
water systems. This research provides evidence that several key processes relevant to antibiotic
resistance (i.e., horizontal gene transfer; selection by antibiotics, metals, and disinfectants;
interactions with the microbial community; and influence of water chemistry) are likely to be
occurring throughout the urban water cycle, but additional research is needed to confirm the
occurrence of these phenomena in situ. It is also important to determine the rates at which these
processes occur in situ, as this information could offer valuable insight into which processes could

211
most effectively be targeted as potential strategies for control of the transmission of ARGs. In
addition, research is critically needed to develop approaches by which to quantify risk associated
with detection of ARGs in water systems. Traditional pathogen risk models are poorly suited to
characterize risk associated with ARGs because they fail to account for horizontal gene transfer
and selection of ARGs by chemical compounds. Accordingly, information is needed about what
the disease burden is associated with antibiotic resistant infections associated with the waterborne
transmission of ARB and ARGs
In addition, identification of key “indicator” ARGs or associated genetic elements that can
be used for monitoring of risk associated with antibiotic resistance would be a valuable
development that would enable utilities, governments, and researchers to characterize ARGs in
their systems or watersheds. Given that ARGs are naturally occurring and can be found even in
pristine environments, some level of background abundance of ARGs is likely to occur in nearly
all water systems. It is important to identify which genes and at what levels are acceptable
background concentrations, and which are cause for concern. Finally, strategies for intervention
are critically needed. Currently, the most effective treatment approaches and management
strategies for limiting spread of ARGs are unclear. For example, while AOPs have shown promise
for removing ARGs from wastewater, there are conflicting reports that indicate that removal is
dependent on the target microorganism and genes monitored. Further research is needed to
optimize the ability of AOPs or other treatment methods to remove ARGs.
Key research needs also exist regarding the occurrence of OPs, particularly in recycled
wastewater systems. Firstly, the disease burden associated with OP exposure via recycled water
needs to be characterized and research is needed to advance hazard identification, exposure
assessment, and even to establish the infectious dose for key OPs. Such advancements could serve
to inform decisions about management strategies and identify which routes of exposure can most
effectively be limited to minimize OP exposure. Research is needed to advance hazard
identification, exposure assessment The results described in this dissertation suggests that very
different processes may govern the occurrence and regrowth of OPs in reclaimed versus potable
water, so it may not be appropriate to assume that management strategies that are effective in
potable systems will also be effective in recycled water system. Additional research is needed to
determine the suitability of using traditional potable water control strategies in reclaimed systems,
and novel treatment and control strategies for these systems are needed. In addition, research is
needed to better discern the relative role of each of the complex factors identified as likely
contributors to influencing OP regrowth.


