Download - November 2017 Investor Presentation
Investor Presentation
November 2017
1) As of 12/31/14, unless otherwise noted, and does not include acreage or reserves associated with Sanish that were divested in March 2014
2) Guidance issued 2/26/15
2
Forward-Looking Statements
This presentation, including the oral statements made in connection herewith, contains forward-looking
statements within the meaning of Section 27A of the Securities Act of 1933 and Section 21E of the
Securities Exchange Act of 1934. All statements, other than statements of historical facts, included in
this presentation that address activities, events or developments that the Company expects, believes
or anticipates will or may occur in the future are forward-looking statements. Without limiting the
generality of the foregoing, forward-looking statements contained in this presentation specifically
include the expectations of plans, strategies, objectives and anticipated financial and operating results
of the Partnership, including the Partnership's drilling program, production, derivative instruments,
capital expenditure levels and other guidance included in this presentation. When used in this
presentation, the words "could," "should," "will,“ "believe," "anticipate," "intend," "estimate," "expect,"
"project," the negative of such terms and other similar expressions are intended to identify forward-
looking statements, although not all forward-looking statements contain such identifying words. These
statements are based on certain assumptions made by the Partnership based on management's
experience and perception of historical trends, current conditions, anticipated future developments and
other factors believed to be appropriate. Such statements are subject to a number of assumptions,
risks and uncertainties, many of which are beyond the control of the Partnership, which may cause
actual results to differ materially from those implied or expressed by the forward-looking statements.
When considering forward-looking statements, you should keep in mind the risk factors and other
cautionary statements described under the headings “Risk Factors” and “Cautionary Statement
Regarding Forward-Looking Statements” included in the filings. These include, but are not limited to,
the Partnership’s ability to integrate acquisitions into its existing business, changes in oil and natural
gas prices, weather and environmental conditions, the timing of planned capital expenditures,
availability of acquisitions, uncertainties in the estimates of proved reserves and forecasted production
results of the Partnership’s customers, operational factors affecting the commencement or
maintenance of producing wells, the condition of the capital markets generally, as well as the
Partnership's ability to access them, the proximity to and capacity of transportation facilities, and
uncertainties regarding environmental regulations or litigation and other legal or regulatory
developments affecting the Partnership's business and other important factors. Should one or more of
these risks or uncertainties occur, or should underlying assumptions prove incorrect, the Partnership's
actual results and plans could differ materially from those expressed in any forward-looking
statements.
Any forward-looking statement speaks only as of the date on which such statement is made and the
Partnership undertakes no obligation to correct or update any forward-looking statement, whether as a
result of new information, future events or otherwise, except as required by applicable law.
Cautionary Statement Regarding Oil and Gas Quantities
Reserve engineering is a process of estimating underground accumulations of hydrocarbons that cannot
be measured in an exact way. The accuracy of any reserve estimate depends on the quality of available
data, the interpretation of such data and price and cost assumptions made by reserve engineers. In
addition, the results of drilling, testing and production activities of the exploration and development
companies may justify revisions of estimates that were made previously. If significant, such revisions
could impact the Partnership’s strategy and future prospects. Accordingly, reserve estimates may differ
significantly from the quantities of oil and natural gas that are ultimately recovered. Any negative
revisions in the reserve estimates of the Partnership’s customers, including Oasis Petroleum Inc., could
have a negative impact on the Partnership’s business and future prospects.
Estimated Ultimate Recovery (“EUR”) refers to estimates of the sum of reserves remaining as of a given
date and cumulative production as of that date from a currently producing or hypothetical future well, as
applicable. These quantities do not necessarily constitute or represent reserves as defined by the SEC.
Type curves do not represent EURs of individual wells.
Non-GAAP Financial Measures
Adjusted EBITDA is a financial measure that is not presented in accordance with generally accepted
accounting principles in the United States (“GAAP”). Reconciliations of this non-GAAP financial measure
can be found in the Registration Statement. Amounts excluded from this non-GAAP measure in future
periods could be significant.
Industry and Market Data
This presentation has been prepared by the Partnership and includes market data and other statistical
information from sources believed by the Partnership to be reliable, including independent industry
publications, government publications or other published independent sources. Although the Partnership
believes these sources are reliable, it has not independently verified the information and cannot
guarantee its accuracy and completeness. Some data is also based on the Partnership’s good faith
estimates, which are derived from its review of internal sources as well as the independent sources
described above.
Trademarks and Trade Names
The Partnership owns or has rights to various trademarks, service marks and trade names that it uses
in connection with the operation of its business. This presentation also contains trademarks, service
marks and trade names of third parties, which are the property of their respective owners. The
Partnership’s use or display of third parties’ trademarks, service marks, trade names or products in this
presentation is not intended to, and does not imply, a relationship with the Partnership or an
endorsement or sponsorship by or of the Partnership. Solely for convenience, the trademarks, service
marks and trade names referred to in this presentation may appear without the ®, TM or SM symbols,
but such references are not intended to indicate, in any way, that the Partnership will not assert, to the
fullest extent under applicable law, its rights or the right of the applicable licensor to these trademarks,
service marks and trade names.
Forward-Looking / Cautionary Statements
3
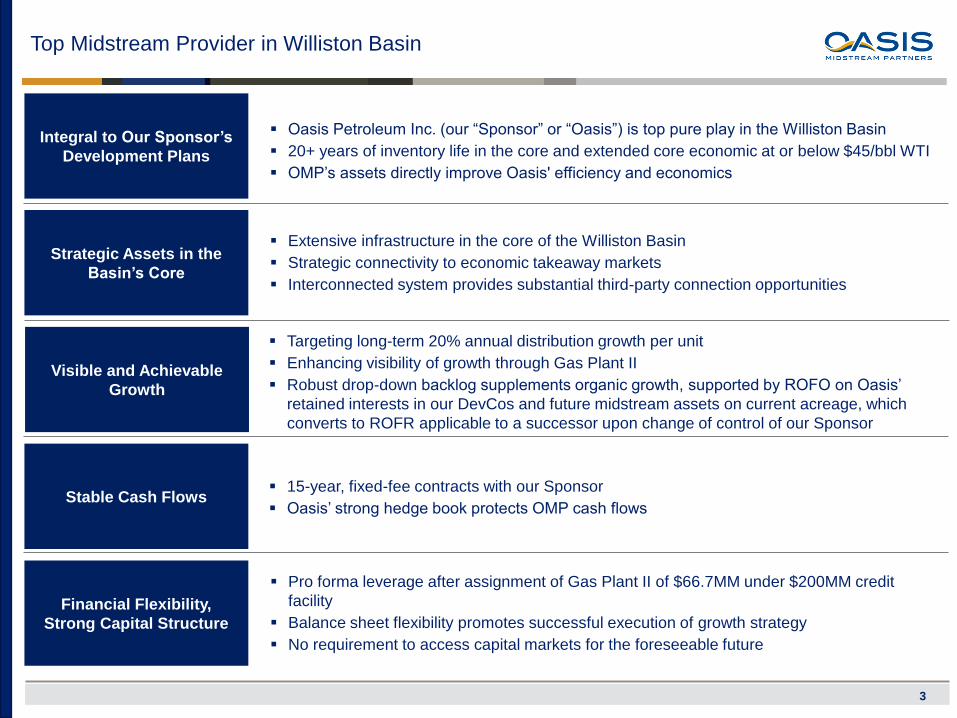
Oasis Petroleum Inc. (our “Sponsor” or “Oasis”) is top pure play in the Williston Basin
20+ years of inventory life in the core and extended core economic at or below $45/bbl WTI
OMP’s assets directly improve Oasis' efficiency and economics
Integral to Our Sponsor’s
Development Plans
Strategic Assets in the
Basin’s Core
Stable Cash Flows
Financial Flexibility,
Strong Capital Structure
Extensive infrastructure in the core of the Williston Basin
Strategic connectivity to economic takeaway markets
Interconnected system provides substantial third-party connection opportunities
15-year, fixed-fee contracts with our Sponsor
Oasis’ strong hedge book protects OMP cash flows
Pro forma leverage after assignment of Gas Plant II of $66.7MM under $200MM credit
facility
Balance sheet flexibility promotes successful execution of growth strategy
No requirement to access capital markets for the foreseeable future
Top Midstream Provider in Williston Basin
Visible and Achievable
Growth
Targeting long-term 20% annual distribution growth per unit
Enhancing visibility of growth through Gas Plant II
Robust drop-down backlog supplements organic growth, supported by ROFO on Oasis’
retained interests in our DevCos and future midstream assets on current acreage, which
converts to ROFR applicable to a successor upon change of control of our Sponsor
Oasis Midstream Partners LP
4
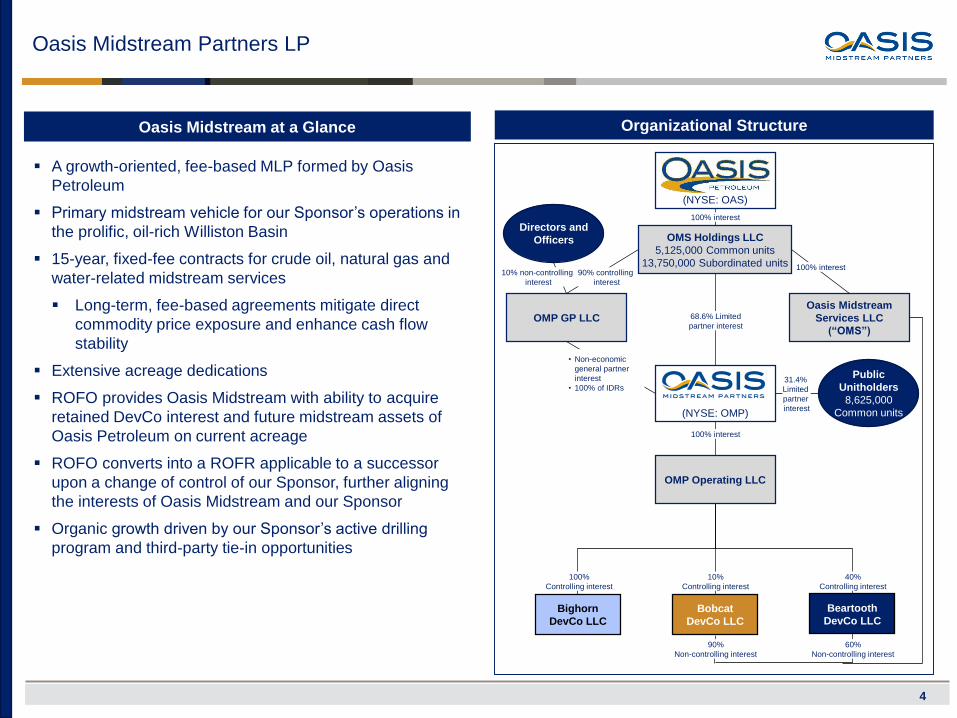
A growth-oriented, fee-based MLP formed by Oasis
Petroleum
Primary midstream vehicle for our Sponsor’s operations in
the prolific, oil-rich Williston Basin
15-year, fixed-fee contracts for crude oil, natural gas and
water-related midstream services
Long-term, fee-based agreements mitigate direct
commodity price exposure and enhance cash flow
stability
Extensive acreage dedications
ROFO provides Oasis Midstream with ability to acquire
retained DevCo interest and future midstream assets of
Oasis Petroleum on current acreage
ROFO converts into a ROFR applicable to a successor
upon a change of control of our Sponsor, further aligning
the interests of Oasis Midstream and our Sponsor
Organic growth driven by our Sponsor’s active drilling
program and third-party tie-in opportunities
Oasis Midstream at a Glance Organizational Structure
Bobcat
DevCo LLC
Beartooth
DevCo LLCBighorn
DevCo LLC
100% interest
90% controlling
interest
68.6% Limited
partner interest
100% interest
10%
Controlling interest
100%
Controlling interest
40%
Controlling interest
60%
Non-controlling interest
31.4%
Limited
partner
interest
OMS Holdings LLC
5,125,000 Common units
13,750,000 Subordinated units
(NYSE: OAS)
OMP GP LLC
Public
Unitholders
8,625,000
Common units
OMP Operating LLC
(NYSE: OMP)
Oasis Midstream
Services LLC
(“OMS”)
90%
Non-controlling interest
100% interest
• Non-economic
general partner
interest
• 100% of IDRs
Directors and
Officers
10% non-controlling
interest
55%
14%
31%
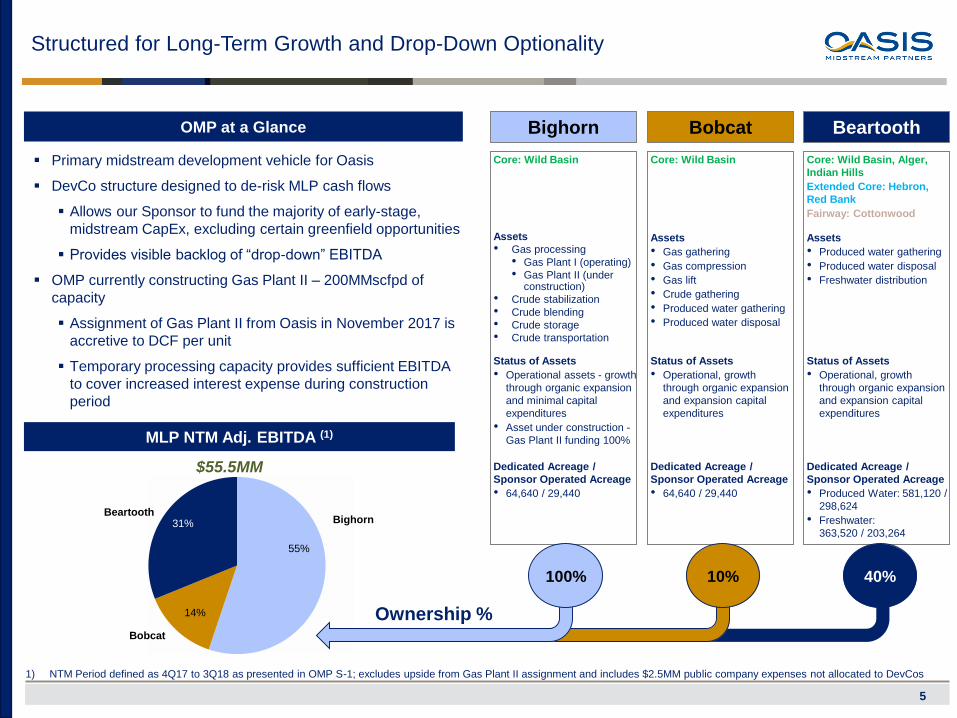
Structured for Long-Term Growth and Drop-Down Optionality
5
Primary midstream development vehicle for Oasis
DevCo structure designed to de-risk MLP cash flows
Allows our Sponsor to fund the majority of early-stage,
midstream CapEx, excluding certain greenfield opportunities
Provides visible backlog of “drop-down” EBITDA
OMP currently constructing Gas Plant II – 200MMscfpd of
capacity
Assignment of Gas Plant II from Oasis in November 2017 is
accretive to DCF per unit
Temporary processing capacity provides sufficient EBITDA
to cover increased interest expense during construction
period
Bighorn Bobcat Beartooth
40%
MLP NTM Adj. EBITDA (1)
$55.5MM
BeartoothBighorn
Bobcat
1) NTM Period defined as 4Q17 to 3Q18 as presented in OMP S-1; excludes upside from Gas Plant II assignment and includes $2.5MM public company expenses not allocated to DevCos
100% 10%
Assets
• Gas processing
• Gas Plant I (operating)
• Gas Plant II (under construction)
• Crude stabilization
• Crude blending
• Crude storage
• Crude transportation
Status of Assets
• Operational assets - growth
through organic expansion
and minimal capital
expenditures
• Asset under construction -
Gas Plant II funding 100%
Dedicated Acreage /
Sponsor Operated Acreage
• 64,640 / 29,440
Core: Wild Basin
Assets
• Gas gathering
• Gas compression
• Gas lift
• Crude gathering
• Produced water gathering
• Produced water disposal
Status of Assets
• Operational, growth
through organic expansion
and expansion capital
expenditures
Dedicated Acreage /
Sponsor Operated Acreage
• 64,640 / 29,440
Core: Wild Basin
Dedicated Acreage /
Sponsor Operated Acreage
• Produced Water: 581,120 /
298,624
• Freshwater:
363,520 / 203,264
Status of Assets
• Operational, growth
through organic expansion
and expansion capital
expenditures
Assets
• Produced water gathering
• Produced water disposal
• Freshwater distribution
Core: Wild Basin, Alger,
Indian Hills
Extended Core: Hebron,
Red Bank
Fairway: Cottonwood
Ownership %
OMP at a Glance
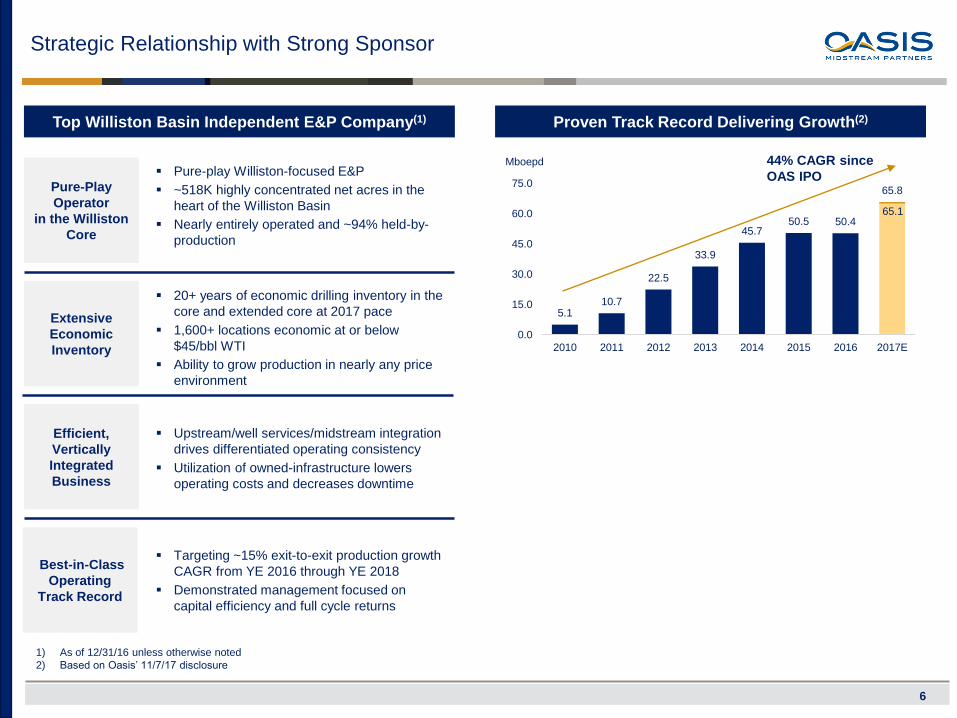
5.110.7
22.5
33.9
45.750.5 50.4
65.8
0.0
15.0
30.0
45.0
60.0
75.0
2010 2011 2012 2013 2014 2015 2016 2017E
Pure-play Williston-focused E&P
~518K highly concentrated net acres in the
heart of the Williston Basin
Nearly entirely operated and ~94% held-by-
production
6
Strategic Relationship with Strong Sponsor
Mboepd
Proven Track Record Delivering Growth(2)
Pure-Play
Operator
in the Williston
Core
Extensive
Economic
Inventory
Best-in-Class
Operating
Track Record
Efficient,
Vertically
Integrated
Business
20+ years of economic drilling inventory in the
core and extended core at 2017 pace
1,600+ locations economic at or below
$45/bbl WTI
Ability to grow production in nearly any price
environment
Targeting ~15% exit-to-exit production growth
CAGR from YE 2016 through YE 2018
Demonstrated management focused on
capital efficiency and full cycle returns
Upstream/well services/midstream integration
drives differentiated operating consistency
Utilization of owned-infrastructure lowers
operating costs and decreases downtime
Top Williston Basin Independent E&P Company(1)
65.1
44% CAGR since
OAS IPO
1) As of 12/31/16 unless otherwise noted
2) Based on Oasis’ 11/7/17 disclosure
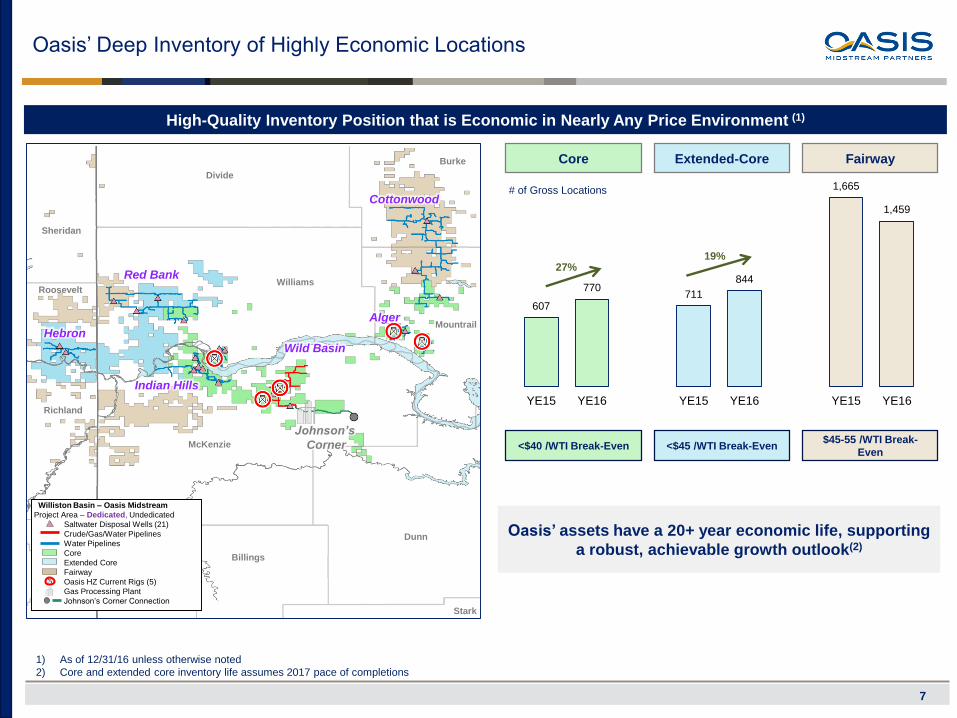
607
770711
844
1,665
1,459
YE15 YE16 YE15 YE16 YE15 YE16
Oasis’ Deep Inventory of Highly Economic Locations
7
<$40 /WTI Break-Even <$45 /WTI Break-Even$45-55 /WTI Break-
Even
Core Extended-Core Fairway
High-Quality Inventory Position that is Economic in Nearly Any Price Environment (1)
27%19%
# of Gross Locations
Oasis’ assets have a 20+ year economic life, supporting
a robust, achievable growth outlook(2)
1) As of 12/31/16 unless otherwise noted
2) Core and extended core inventory life assumes 2017 pace of completions
McKenzie
Dunn
Divide
Burke
Mountrail
Sheridan
RooseveltWilliams
Richland
Wild Basin
Stark
Billings
Alger
Cottonwood
Red Bank
Hebron
Indian Hills
Johnson’s
Corner
Williston Basin – Oasis Midstream
Project Area – Dedicated, Undedicated
Saltwater Disposal Wells (21)
Crude/Gas/Water Pipelines
Water Pipelines
Core
Extended Core
Fairway
Oasis HZ Current Rigs (5)
Gas Processing Plant
Johnson’s Corner Connection
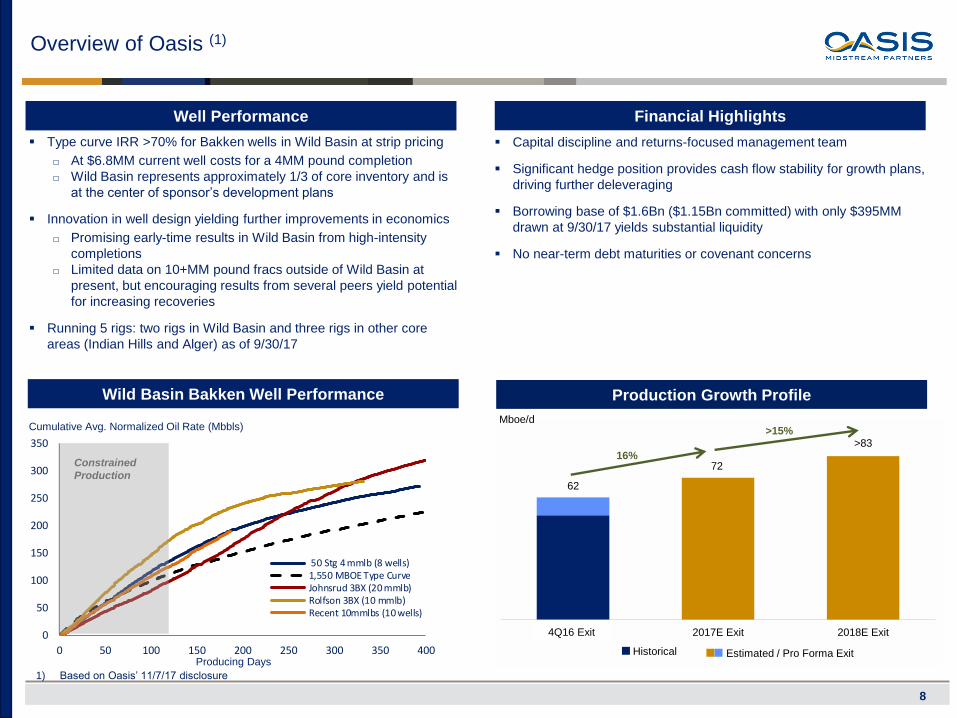
72
>83
62
4Q16 2017E Exit 2018E Exit0
50
100
150
200
250
300
350
0 50 100 150 200 250 300 350 400
50 Stg 4 mmlb (8 wells)1,550 MBOE Type CurveJohnsrud 3BX (20 mmlb)Rolfson 3BX (10 mmlb)Recent 10mmlbs (10 wells)
8
Overview of Oasis (1)
Type curve IRR >70% for Bakken wells in Wild Basin at strip pricing
□ At $6.8MM current well costs for a 4MM pound completion
□ Wild Basin represents approximately 1/3 of core inventory and is
at the center of sponsor’s development plans
Innovation in well design yielding further improvements in economics
□ Promising early-time results in Wild Basin from high-intensity
completions
□ Limited data on 10+MM pound fracs outside of Wild Basin at
present, but encouraging results from several peers yield potential
for increasing recoveries
Running 5 rigs: two rigs in Wild Basin and three rigs in other core
areas (Indian Hills and Alger) as of 9/30/17
Well Performance
Capital discipline and returns-focused management team
Significant hedge position provides cash flow stability for growth plans,
driving further deleveraging
Borrowing base of $1.6Bn ($1.15Bn committed) with only $395MM
drawn at 9/30/17 yields substantial liquidity
No near-term debt maturities or covenant concerns
Financial Highlights
Wild Basin Bakken Well Performance
Cumulative Avg. Normalized Oil Rate (Mbbls)
Producing Days
Constrained
Production
1) Based on Oasis’ 11/7/17 disclosure
Production Growth Profile
Historical Estimated / Pro Forma Exit
Mboe/d
4Q16 Exit
16%
>15%
Strategically Located Infrastructure in the Heart of the Williston
9
Williston Midstream Asset Footprint (1)
Mission-Critical Assets With a Focus on the Basin’s Core
McKenzie
Dunn
Divide
Burke
Mountrail
Sheridan
RooseveltWilliams
Richland
Wild Basin
Stark
Billings
Alger
Cottonwood
Red Bank
Hebron
Indian Hills
Johnson’s
Corner
Williston Basin – Oasis Midstream
Project Area – Dedicated, Undedicated
Saltwater Disposal Wells (21)
Crude/Gas/Water Pipelines
Water Pipelines
Core
Extended Core
Fairway
Beartooth Acreage Dedication
Bighorn / Bobcat Acreage Dedication
Gas Processing Plant
Johnson’s Corner Connection
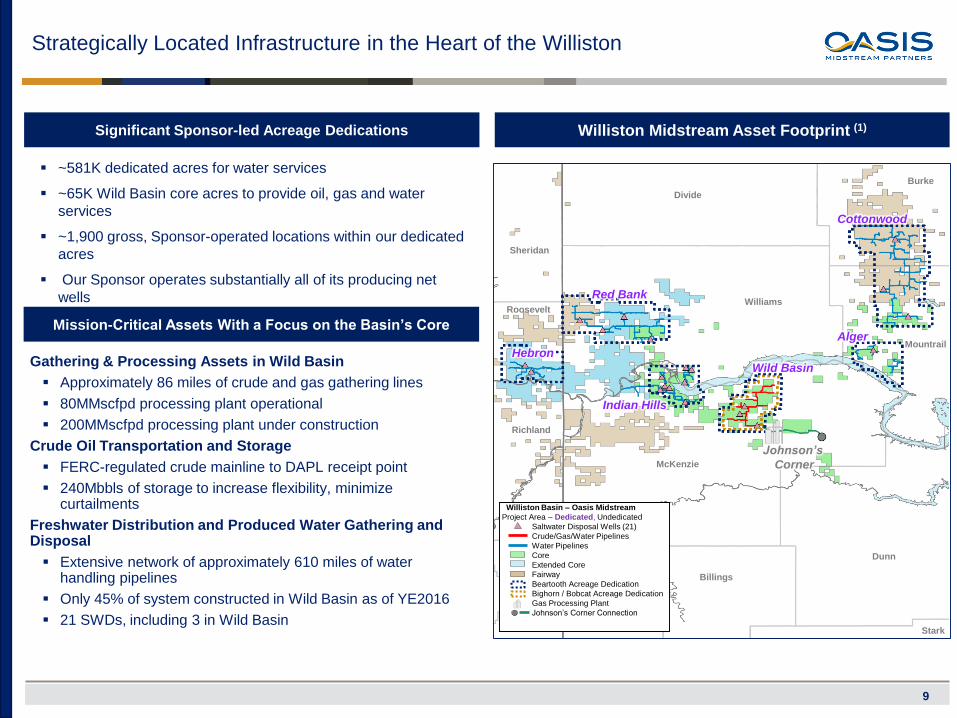
Gathering & Processing Assets in Wild Basin
Approximately 86 miles of crude and gas gathering lines
80MMscfpd processing plant operational
200MMscfpd processing plant under construction
Crude Oil Transportation and Storage
FERC-regulated crude mainline to DAPL receipt point
240Mbbls of storage to increase flexibility, minimize curtailments
Freshwater Distribution and Produced Water Gathering and Disposal
Extensive network of approximately 610 miles of water handling pipelines
Only 45% of system constructed in Wild Basin as of YE2016
21 SWDs, including 3 in Wild Basin
Significant Sponsor-led Acreage Dedications
~581K dedicated acres for water services
~65K Wild Basin core acres to provide oil, gas and water
services
~1,900 gross, Sponsor-operated locations within our dedicated
acres
Our Sponsor operates substantially all of its producing net
wells
Bighorn & Bobcat: Wild Basin Crude, Gas and Water Infrastructure
10
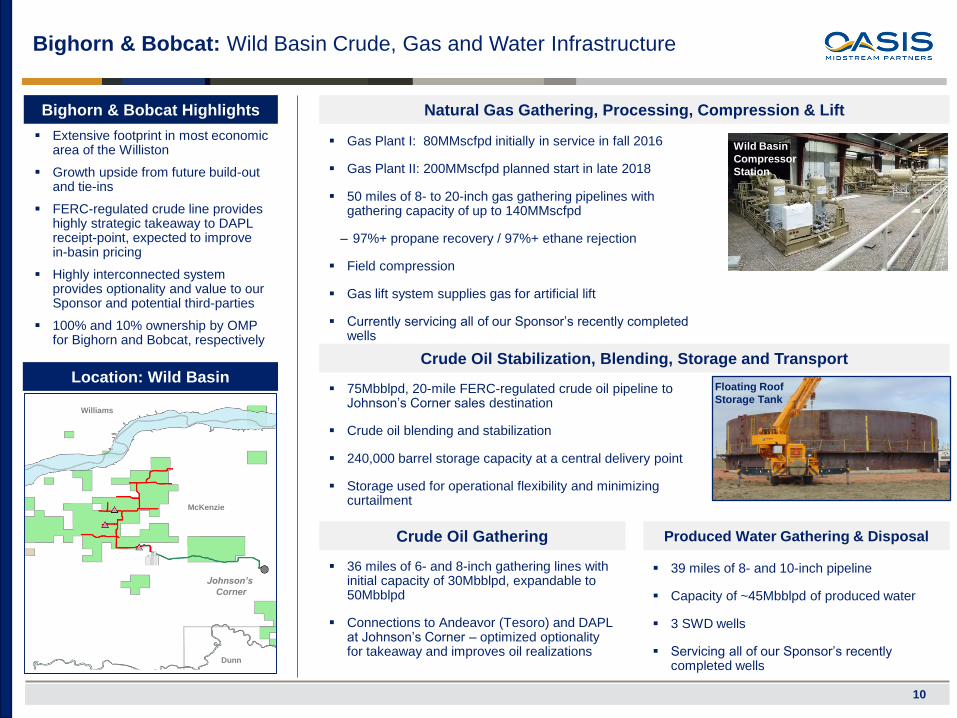
Bighorn & Bobcat Highlights
Extensive footprint in most economic area of the Williston
Growth upside from future build-out and tie-ins
FERC-regulated crude line provides highly strategic takeaway to DAPL receipt-point, expected to improve in-basin pricing
Highly interconnected system provides optionality and value to our Sponsor and potential third-parties
100% and 10% ownership by OMP for Bighorn and Bobcat, respectively
Natural Gas Gathering, Processing, Compression & Lift
Gas Plant I: 80MMscfpd initially in service in fall 2016
Gas Plant II: 200MMscfpd planned start in late 2018
50 miles of 8- to 20-inch gas gathering pipelines with gathering capacity of up to 140MMscfpd
– 97%+ propane recovery / 97%+ ethane rejection
Field compression
Gas lift system supplies gas for artificial lift
Currently servicing all of our Sponsor’s recently completed wells
Crude Oil Gathering
36 miles of 6- and 8-inch gathering lines with initial capacity of 30Mbblpd, expandable to 50Mbblpd
Connections to Andeavor (Tesoro) and DAPL at Johnson’s Corner – optimized optionality for takeaway and improves oil realizations
Produced Water Gathering & Disposal
39 miles of 8- and 10-inch pipeline
Capacity of ~45Mbblpd of produced water
3 SWD wells
Servicing all of our Sponsor’s recently completed wells
Wild Basin
Compressor
Station
McKenzie
Dunn
Williams
Johnson’s
Corner
Location: Wild BasinCrude Oil Stabilization, Blending, Storage and Transport
75Mbblpd, 20-mile FERC-regulated crude oil pipeline to Johnson’s Corner sales destination
Crude oil blending and stabilization
240,000 barrel storage capacity at a central delivery point
Storage used for operational flexibility and minimizing curtailment
Floating Roof
Storage Tank
Beartooth: Water Services Infrastructure in the Williston
11
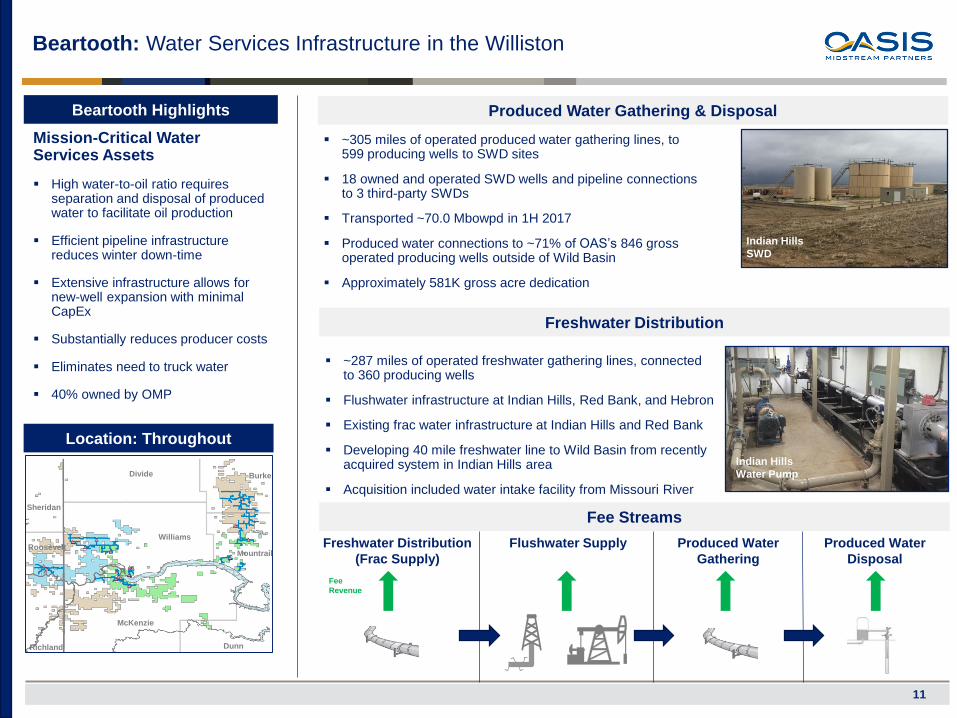
Beartooth Highlights
Mission-Critical Water Services Assets
High water-to-oil ratio requires separation and disposal of produced water to facilitate oil production
Efficient pipeline infrastructure reduces winter down-time
Extensive infrastructure allows for new-well expansion with minimal CapEx
Substantially reduces producer costs
Eliminates need to truck water
40% owned by OMP
Freshwater Distribution
~287 miles of operated freshwater gathering lines, connected to 360 producing wells
Flushwater infrastructure at Indian Hills, Red Bank, and Hebron
Existing frac water infrastructure at Indian Hills and Red Bank
Developing 40 mile freshwater line to Wild Basin from recently acquired system in Indian Hills area
Acquisition included water intake facility from Missouri River
Produced Water Gathering & Disposal
~305 miles of operated produced water gathering lines, to 599 producing wells to SWD sites
18 owned and operated SWD wells and pipeline connections to 3 third-party SWDs
Transported ~70.0 Mbowpd in 1H 2017
Produced water connections to ~71% of OAS’s 846 gross operated producing wells outside of Wild Basin
Approximately 581K gross acre dedication
Indian Hills
SWD
Fee Streams
Indian Hills
Water Pump
Fee
Revenue
Freshwater Distribution
(Frac Supply)
Flushwater Supply Produced Water
Gathering
Produced Water
Disposal
Location: Throughout
McKenzie
Dunn
Divide Burke
Mountrail
Sheridan
Roosevelt
Williams
Richland
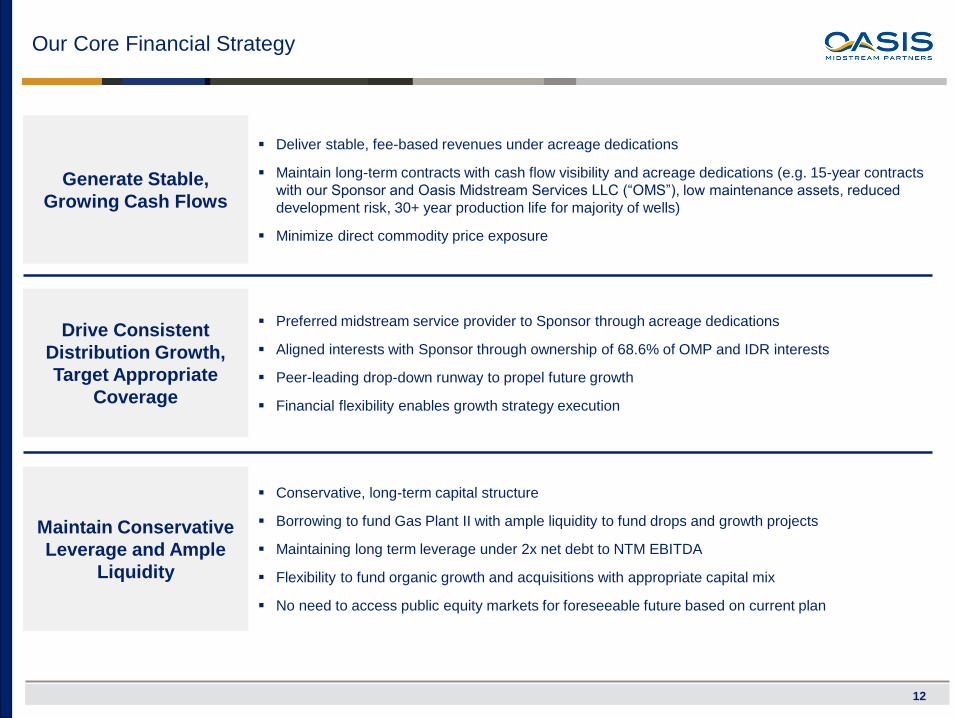
Our Core Financial Strategy
12
Generate Stable,
Growing Cash Flows
Drive Consistent
Distribution Growth,
Target Appropriate
Coverage
Maintain Conservative
Leverage and Ample
Liquidity
Deliver stable, fee-based revenues under acreage dedications
Maintain long-term contracts with cash flow visibility and acreage dedications (e.g. 15-year contracts
with our Sponsor and Oasis Midstream Services LLC (“OMS”), low maintenance assets, reduced
development risk, 30+ year production life for majority of wells)
Minimize direct commodity price exposure
Preferred midstream service provider to Sponsor through acreage dedications
Aligned interests with Sponsor through ownership of 68.6% of OMP and IDR interests
Peer-leading drop-down runway to propel future growth
Financial flexibility enables growth strategy execution
Conservative, long-term capital structure
Borrowing to fund Gas Plant II with ample liquidity to fund drops and growth projects
Maintaining long term leverage under 2x net debt to NTM EBITDA
Flexibility to fund organic growth and acquisitions with appropriate capital mix
No need to access public equity markets for foreseeable future based on current plan
Improving Well Performance and Increasing Gas Rates
13
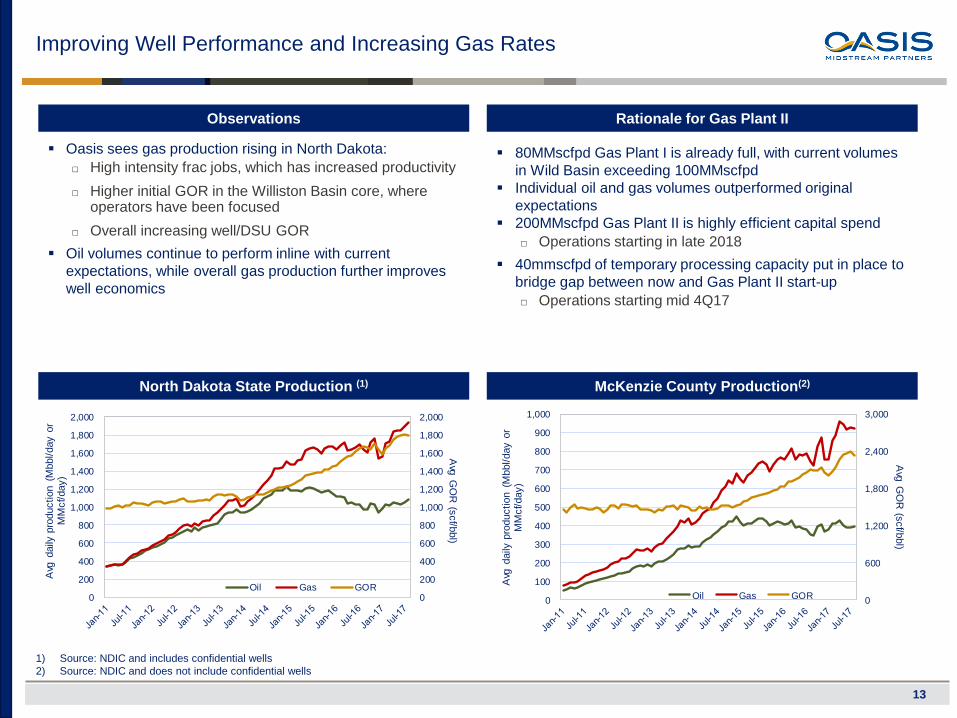
Observations Rationale for Gas Plant II
Oasis sees gas production rising in North Dakota:
□ High intensity frac jobs, which has increased productivity
□ Higher initial GOR in the Williston Basin core, where operators have been focused
□ Overall increasing well/DSU GOR
Oil volumes continue to perform inline with current
expectations, while overall gas production further improves
well economics
80MMscfpd Gas Plant I is already full, with current volumes
in Wild Basin exceeding 100MMscfpd
Individual oil and gas volumes outperformed original
expectations
200MMscfpd Gas Plant II is highly efficient capital spend
□ Operations starting in late 2018
40mmscfpd of temporary processing capacity put in place to
bridge gap between now and Gas Plant II start-up
□ Operations starting mid 4Q17
0
200
400
600
800
1,000
1,200
1,400
1,600
1,800
2,000
0
200
400
600
800
1,000
1,200
1,400
1,600
1,800
2,000
Avg
GO
R (s
cf/b
bl)
Avg
daily
pro
duction (
Mbbl/day o
r M
Mcf/day)
Oil Gas GOR
North Dakota State Production (1) McKenzie County Production(2)
1) Source: NDIC and includes confidential wells
2) Source: NDIC and does not include confidential wells
0
600
1,200
1,800
2,400
3,000
0
100
200
300
400
500
600
700
800
900
1,000
Avg
GO
R (s
cf/b
bl)
Avg
daily
pro
duction (
Mbbl/day o
r M
Mcf/day)
Oil Gas GOR
Gas Plant II Assignment
14
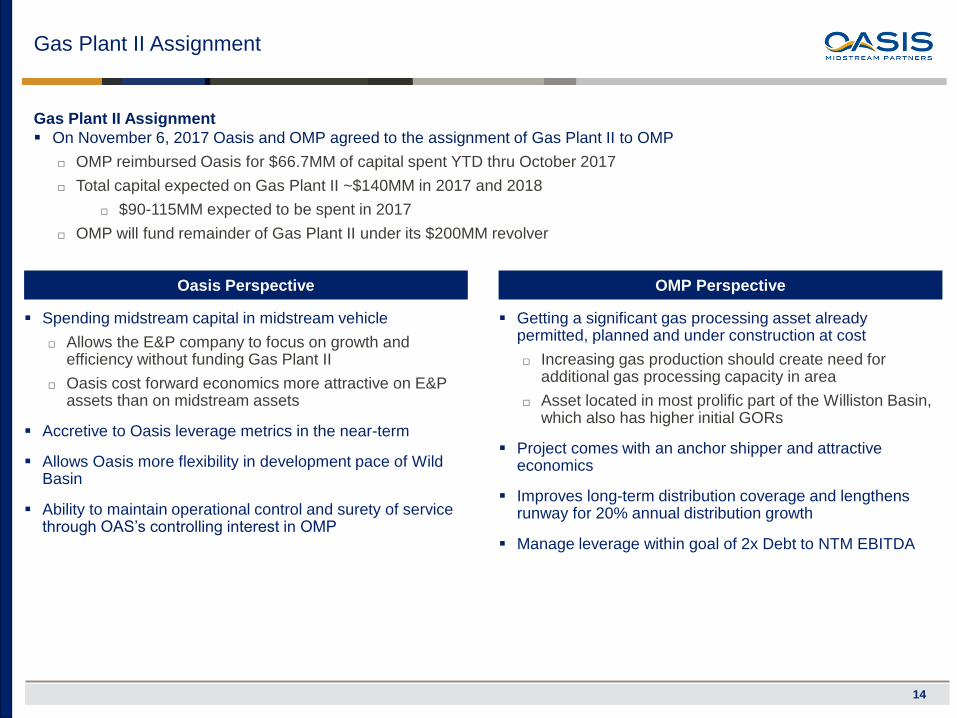
Gas Plant II Assignment
On November 6, 2017 Oasis and OMP agreed to the assignment of Gas Plant II to OMP
□ OMP reimbursed Oasis for $66.7MM of capital spent YTD thru October 2017
□ Total capital expected on Gas Plant II ~$140MM in 2017 and 2018
□ $90-115MM expected to be spent in 2017
□ OMP will fund remainder of Gas Plant II under its $200MM revolver
Oasis Perspective OMP Perspective
Getting a significant gas processing asset already permitted, planned and under construction at cost
□ Increasing gas production should create need for additional gas processing capacity in area
□ Asset located in most prolific part of the Williston Basin, which also has higher initial GORs
Project comes with an anchor shipper and attractive economics
Improves long-term distribution coverage and lengthens runway for 20% annual distribution growth
Manage leverage within goal of 2x Debt to NTM EBITDA
Spending midstream capital in midstream vehicle
□ Allows the E&P company to focus on growth and efficiency without funding Gas Plant II
□ Oasis cost forward economics more attractive on E&P assets than on midstream assets
Accretive to Oasis leverage metrics in the near-term
Allows Oasis more flexibility in development pace of Wild Basin
Ability to maintain operational control and surety of service through OAS’s controlling interest in OMP
15
Outlook for OMP
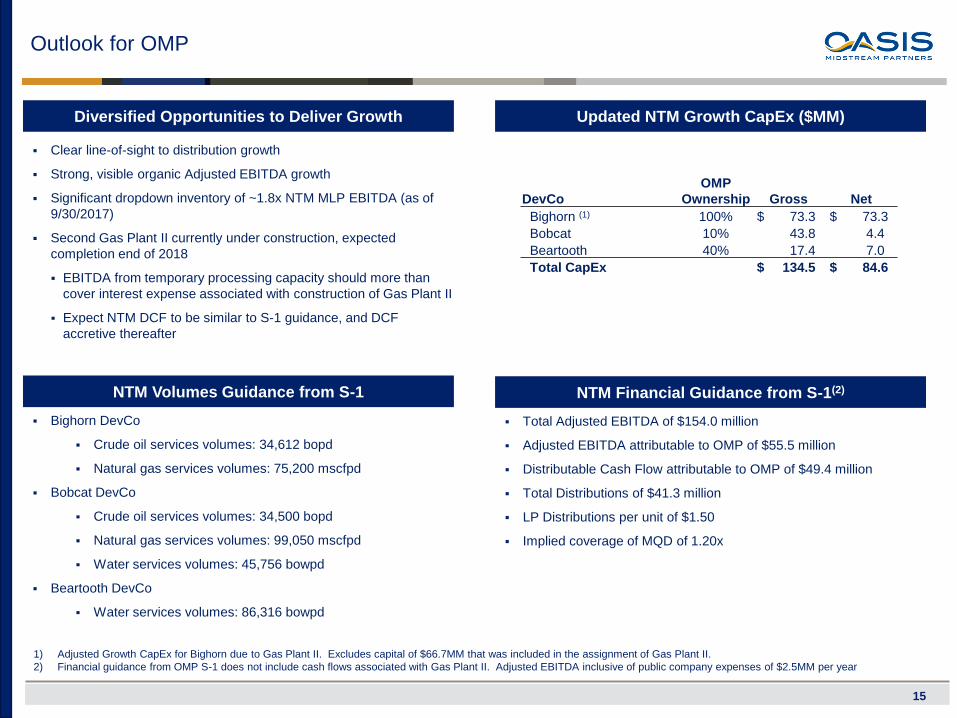
Clear line-of-sight to distribution growth
Strong, visible organic Adjusted EBITDA growth
Significant dropdown inventory of ~1.8x NTM MLP EBITDA (as of
9/30/2017)
Second Gas Plant II currently under construction, expected
completion end of 2018
EBITDA from temporary processing capacity should more than
cover interest expense associated with construction of Gas Plant II
Expect NTM DCF to be similar to S-1 guidance, and DCF
accretive thereafter
Diversified Opportunities to Deliver Growth
1) Adjusted Growth CapEx for Bighorn due to Gas Plant II. Excludes capital of $66.7MM that was included in the assignment of Gas Plant II.
2) Financial guidance from OMP S-1 does not include cash flows associated with Gas Plant II. Adjusted EBITDA inclusive of public company expenses of $2.5MM per year
NTM Volumes Guidance from S-1 NTM Financial Guidance from S-1(2)
Bighorn DevCo
Crude oil services volumes: 34,612 bopd
Natural gas services volumes: 75,200 mscfpd
Bobcat DevCo
Crude oil services volumes: 34,500 bopd
Natural gas services volumes: 99,050 mscfpd
Water services volumes: 45,756 bowpd
Beartooth DevCo
Water services volumes: 86,316 bowpd
Total Adjusted EBITDA of $154.0 million
Adjusted EBITDA attributable to OMP of $55.5 million
Distributable Cash Flow attributable to OMP of $49.4 million
Total Distributions of $41.3 million
LP Distributions per unit of $1.50
Implied coverage of MQD of 1.20x
Updated NTM Growth CapEx ($MM)
DevCo
OMP
Ownership Gross Net
Bighorn (1) 100% $ 73.3 $ 73.3
Bobcat 10% 43.8 4.4
Beartooth 40% 17.4 7.0
Total CapEx $ 134.5 $ 84.6
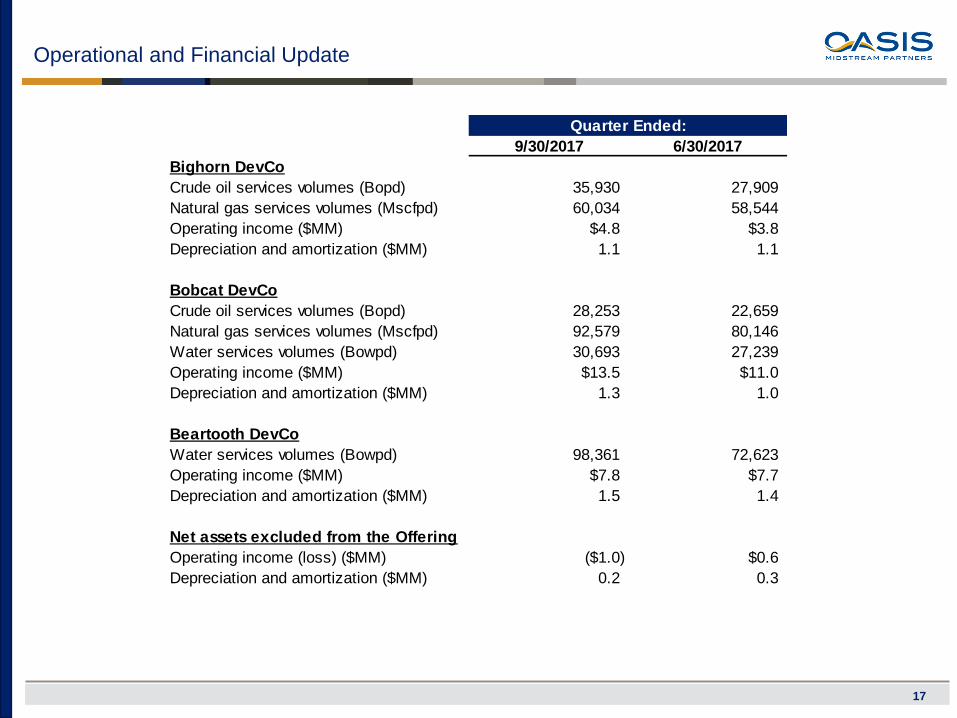
Operational and Financial Update
17
Quarter Ended:
9/30/2017 6/30/2017
Bighorn DevCo
Crude oil services volumes (Bopd) 35,930 27,909
Natural gas services volumes (Mscfpd) 60,034 58,544
Operating income ($MM) $4.8 $3.8
Depreciation and amortization ($MM) 1.1 1.1
Bobcat DevCo
Crude oil services volumes (Bopd) 28,253 22,659
Natural gas services volumes (Mscfpd) 92,579 80,146
Water services volumes (Bowpd) 30,693 27,239
Operating income ($MM) $13.5 $11.0
Depreciation and amortization ($MM) 1.3 1.0
Beartooth DevCo
Water services volumes (Bowpd) 98,361 72,623
Operating income ($MM) $7.8 $7.7
Depreciation and amortization ($MM) 1.5 1.4
Net assets excluded from the Offering
Operating income (loss) ($MM) ($1.0) $0.6
Depreciation and amortization ($MM) 0.2 0.3
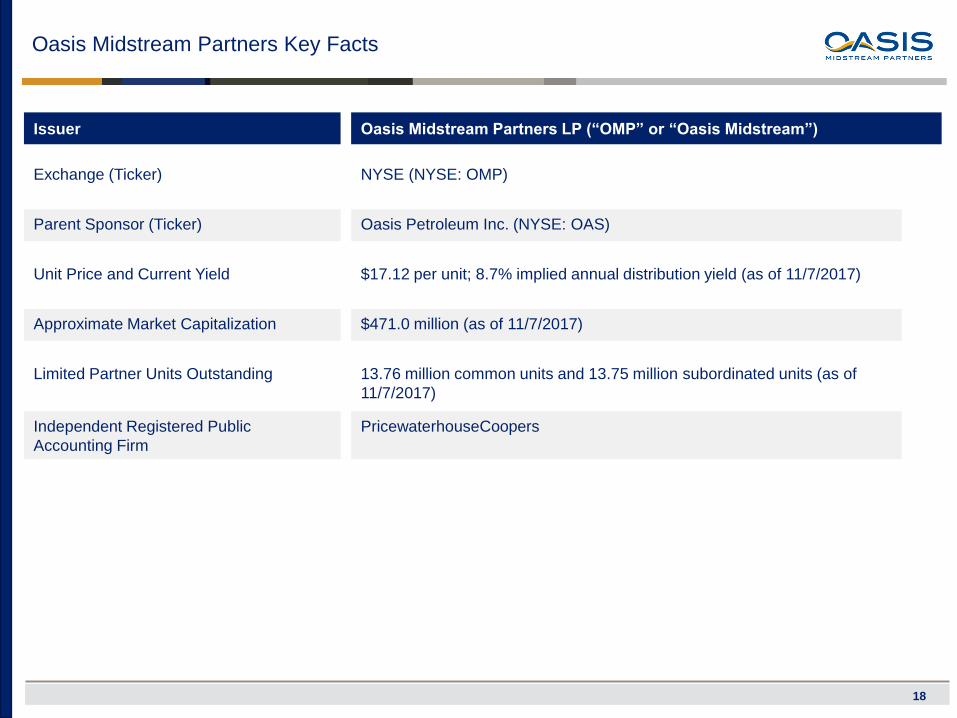
Oasis Midstream Partners Key Facts
18
Issuer
Exchange (Ticker)
Parent Sponsor (Ticker)
Unit Price and Current Yield
Approximate Market Capitalization
Limited Partner Units Outstanding
Oasis Midstream Partners LP (“OMP” or “Oasis Midstream”)
NYSE (NYSE: OMP)
Oasis Petroleum Inc. (NYSE: OAS)
$17.12 per unit; 8.7% implied annual distribution yield (as of 11/7/2017)
$471.0 million (as of 11/7/2017)
13.76 million common units and 13.75 million subordinated units (as of
11/7/2017)
Independent Registered Public
Accounting Firm
PricewaterhouseCoopers


