
NBER WORKING PAPER SERIES
SMALL FARMS, EXTERNALITIES,AND THE DUST BOWL OF THE 1930s
Zeynep K. HansenGary D. Libecap
Working Paper 10055http://www.nber.org/papers/w10055
NATIONAL BUREAU OF ECONOMIC RESEARCH1050 Massachusetts Avenue
Cambridge, MA 02138October 2003
Forthcoming, Journal of Political Economy, June 2004. The views expressed herein are those of the authorsand not necessarily those of the National Bureau of Economic Research.
©2003 by Zeynep K. Hansen and Gary D. Libecap. All rights reserved. Short sections of text, not to exceedtwo paragraphs, may be quoted without explicit permission provided that full credit, including © notice, isgiven to the source.

Small Farms, Externalities, and the Dust Bowl of the 1930sZeynep K. Hansen and Gary D. LibecapNBER Working Paper No. 10055October 2003JEL No. Q24, N52, O13, K11
ABSTRACT
We provide a new and more complete analysis of the origins of the Dust Bowl of the 1930s, one of
the most severe environmental crises in North America in the 20th Century. Severe drought and
wind erosion hit the Great Plains in 1930 and lasted through 1940. There were similar droughts in
the 1950s and 1970s, but no comparable level of wind erosion. We explain why. The prevalence
of small farms in the 1930s limited private solutions for controlling the downwind externalities
associated with wind erosion. Drifting sand from unprotected fields damaged neighboring farms.
Small farmers cultivated more of their land and were less likely to invest in erosion control than
were larger farmers. Soil Conservation Districts, established by government after 1937, helped
coordinate erosion control. This “unitized” solution for collective action is similar to that used in
other natural resource/environmental settings.
Zeynep K. HansenOlin School of BusinessWashington University in St. LouisCampus Box 1133, One Brookings DriveSt. Louis, MO [email protected]
Gary D. LibecapUniversity of ArizonaKarl Eller Center202 McClelland HallTucson, AZ 85721and [email protected]

3
“In the morning the dust hung like fog, and the sun was as red as ripe new blood.
All day the dust sifted down from the sky, and the next day it sifted down.
An even blanket covered the earth. It settled on the corn, piled up on the tops of the fence posts,
piled up on the wires; it settled on roofs, blanketed the weeds and trees.”
John Steinbeck, The Grapes of Wrath (1939, 6)
“One man cannot stop the dust from blowing but one man can start it.” Farm Security
Administration, September 12, 19371
I. Introduction. The Dust Bowl of the 1930s was one of the most severe environmental crises in North
America in the 20th Century.2 Severe drought and damaging wind erosion hit in the Great Plains
in 1930 and lasted through 1940. Strong winds blew away an average of 480 tons per acre of
topsoil, degrading soil productivity, harming health, and damaging air quality. The leading
historian of the Dust Bowl, Donald Worster (1979, 24), described it in the following way:
“In no other instance was there greater or more sustained damage to the American land, and
there have been few times when so much tragedy was visited on its inhabitants. Not even the
Depression was more devastating, economically…in the decade of the 1930s the dust storms of
the plains were an unqualified disaster.”
Similar droughts and wind occurred later in the 1950s and 1970s in the Great Plains, but
there is a general consensus among soil conservationists that there was no comparable level of
erosion.3 Excessive cultivation of land in the 1930s, exposing dry soil to the wind, is the standard
explanation for the Dust Bowl.4 The issue to be explained is why cultivation was more extensive
and use of erosion control techniques more limited in the 1930s than later in the 20th century.
Our contribution is to analyze wind erosion as a common-pool problem. We focus on the

4
effects of numerous small farms on the Great Plains in the 1930s for combating erosion during
the Dust Bowl. In contemporary erosion research, farm size is shown to be an important factor in
soil conservation.5 Small farms are associated with more intensive cultivation, less frequent use
of conservation practices, and greater soil erosion.6
We concentrate on the downwind externalities from a farmer’s failure to shield cultivated
fields. Blowing sand from an unprotected farm smothered the lands and crops of leeward farms,
lowering their productivity and reducing returns from their erosion-control investments. These
cross-farm effects were intensified by the presence of many small farms in an erosion-prone
region. There were differential incentives according to farm size for investing in conservation
practices, such as strip cropping and fallow. We examine the effect of cultivation intensity
associated with farm size on observed variation in erosion severity across the Great Plains. The
optimal farm size for productive efficiency was smaller than for wind erosion control, and hence,
coordination among farmers was necessary. The “unitized” solution for collective action was
provided by Soil Conservation Districts adopted after 1937.7 Our analysis provides a new and
more complete explanation for the origins of the Dust Bowl.8
II. The Dust Bowl.
A drought that was unprecedented in the 20th century began in the northern plains in 1930
and gradually spread south, covering the entire region through 1940. Strong winds, characteristic
of the area, blew across dry, cultivated soil, generating dust storms of unparalleled number,
duration, and scale. Many dust storms were local, defined by topographical boundaries, including
erodible soil texture, watersheds and hills, but very intense weather systems also brought huge
blasts that covered hundreds of miles and lasted 10 hours or more (Clements,1938).
Some figures illustrate the extent of wind damage in the Great Plains. Light, fertile

5
topsoil became airborne and was carried far away. This material was critical for dryland wheat
farming, which dominated the plains. Each loss of soil from successive windstorms removed
more plant nutrients, until the remaining ground was heavy and relatively sterile (Stallings, 1957,
203-4). Samples of soil carried 500 miles from Texas to Iowa had 10 times as much organic
matter, 9 times as much nitrogen, 19 times as much phosphoric acid, and 45 percent more potash
as compared to the soil that remained.9 In his book on the Dust Bowl, Vance Johnson (1947,
194-5) estimated that in 1935 alone, 850 million tons of topsoil had blown away from 4,340,000
acres. Soil erosion surveys by the Soil Conservation Service (SCS) in 1934 indicated that 65
percent of the total area of the Great Plains had been damaged by wind erosion and 15 percent
severely eroded. By 1938, the agency claimed that 80 percent of the land in the southern plains
had been subject to wind erosion, with 40 percent to a serious degree. 10,000,000 acres had lost
the upper five inches of topsoil, and 13,500,000 acres had lost 2.5 inches, with an average loss of
480 tons of topsoil per acre. Hugh Bennett (1939, 11) the first director of the SCS, estimated
productivity losses from erosion at $400 million annually.
Other costs of wind erosion included destruction of nearby crops and farmland from the
localized deposit of heavier eroded material (sand), damage to livestock, buildings, household
goods, merchandise, and health problems associated with inhalation of dust particles. Claims of
greater incidence of pneumonia, asthma, influenza, and eye infections were reported from Dust
Bowl counties in Colorado, Kansas, New Mexico, Oklahoma, and Texas.10 Similarly the
Chambers of Commerce of towns located in the region estimated that the costs of damage
wrought by blowing sand and dust from each storm ranged from $50,000 (Liberal, Kansas) to
$288,228 (Tucumcari, New Mexico).11
Figure 1

6
Figure 1 illustrates the range of wind erosion across the Great Plains in 1934, based on
soil erosion surveys conducted by the SCS. The figure also shows the extent of sheet erosion
from heavy rainfall. Efforts to combat water-based sheet erosion, however, did not involve the
broad externalities and coordination problems found in addressing wind erosion. As indicated on
the map, there was considerable variation in the severity of wind erosion across the region, with
bands of severe damage in the Texas and Oklahoma panhandles, southeastern Colorado and
southwestern Kansas, north central Nebraska, the eastern and central Dakotas, and parts of
Montana. We make use of this variation in our analysis of the effect of farm size on efforts to
combat wind erosion in the Dust Bowl.
III. Wind Erosion, Externalities, and Differential Incentives According to Farm Size. A. The Dynamics of Wind Erosion and Potential Externalities. Drought and extensive cultivation in the 1930s raised soil erodibility across the Great
Plains. Except in the far western plains where grass pasture was more common, providing some
ground cover, the soil was exposed, dry, and pulverized from repeated tillage. There was limited
moisture to make the soil cloddy and rough, and there were few obstacles to block the flow of
wind.12 We describe the dynamics of soil erosion in some detail in order to demonstrate the
nature of the externalities involved and the collective action problems encountered among
farmers in the 1930s in combating erosion.
There were three types of soil movement in wind erosion: suspension, saltation, and
creep, and each had different cross-farm effects. Suspension involved very fine topsoil particles,
less than 0.1 mm in diameter, that were blown high into the air as dust and could be carried
hundreds of miles if the storm were strong enough. Suspension accounted for 3 to 40 percent of
soil movement. A key benefit of any farmer’s erosion control investments was limiting the loss

7
of topsoil via suspension. In 1933 it was estimated that topsoil losses reduced annual
productivity from 15 to 25 percent, and when the soil was fully stripped, fields became
unproductive or “barren.”13 The external effects of suspended dust were felt quite a distance
from the source, and the topsoil could be beneficial for receiving farms. The negative effects
were damage to buildings and the health of livestock and people from inhaling blowing dust.
Saltation and creep involved larger particles, 0.1 to 0.5 mm in diameter for the former
and 0.5 to 1.0 mm for the latter. Saltation and creep brought the most localized externalities
through the formation of hummocks and sand drifts up to 40 feet high that smothered downwind
crops. Saltation accounted for 50 to 80 percent of total soil movement, and creep 7 to 25
percent. These heavier particles fanned out, destroying stable soil crusts and vegetation, and
exposing more soil to erosion. This type of erosion was compared to an epidemic disease or
avalanche that, if not contained at its source, would spread rapidly. The leeward area affected
depended on soil texture and moisture as well as wind speed. It could be several thousand acres
or more, but adjacent fields and farms were most vulnerable.14Limiting the damage from
blowing and drifting sand was the other major benefit of a farmer’s efforts to combat erosion.
The two leading erosion control methods in the 1930s were strip cropping with strip
fallow and windbreaks of trees or brush.15 Both provided barriers to lower surface wind velocity
and carrying capacity, but the former was more prevalent because trees could not be grown in
many parts of the plains. Strip fallow also had the advantage of building up soil moisture and
roughness, which reduced erodibility, whereas tree windbreaks actually absorbed moisture from
surrounding ground (Greb and Block, 1961). Strip fallow involved creating alternating bands,
placed perpendicular to the wind, of wheat and fallow (usually with wheat stubble) or bands of
wheat or cotton and drought-resistant crops like sorghum.16 Breaking fields into bands of

8
cultivated areas and stubble reduced the exposed area over which the wind passed. Fallow strips
were part of crop rotations, which at maximum involved one-third to one-half of a farm’s total
crop acreage in three or two-year rotations.
The barriers provided by tree windbreaks or wheat stubble could protect downwind fields
for distances 10 to 20 times their height depending on the porosity and shape of the obstruction,
wind speed, soil type, and moisture, especially if used in combination with other erosion control
methods, such as stubble mulch.17 Stubble mulch involved leaving plant residue in the cultivated
areas between fallow strips. If wheat stubble were 1 feet high, for example, then around 20 feet
downwind could be sheltered if the soil were very sandy, and over 300 feet, if the soil were
heavy, clay loam. In the 1930s recommended fallow strips ranged from 1 to10 rods or 16.5 to
165 feet.18 Through investment in erosion control a farmer could reduce topsoil losses and shield
downwind crops from being smothered by saltating and drifting particles. He also could
maintain the viability of fallow strips and windbreaks in combating erosion, which otherwise
would be covered by sand and made ineffective. A major externality in the 1930s occurred when
sand from one farmer’s unprotected fields drifted across the fallow strips and fields of his
downwind neighbor, eliminating any of the productive benefits of those investments.
Depending on the size of the unprotected area, wind speed, soil type, and amount of soil
moisture, the absence of erosion control on one field or farm could lead to the degeneration of all
erosion control in the region. Similarly, if an isolated farm were strip fallowed, but bordered
upwind by exposed land, the treated farm would gradually succumb as drifting and saltating soil
particles overwhelmed successive fallow strips and crops.
B. Wind Erosion, External Effects, Farm-Size, and Collective Action.
To completely combat regional erosion, all of the cultivated acreage in a topographical

9
area of similarly erodible soil would have to be included in a “wind erosion unit” of 50,000 to
500,000 acres or more. The optimal farm sizes for addressing wind erosion and production,
however, were not the same. Most estimates by agricultural economists and extension agents in
the 1930s of appropriate production sizes for the region suggested two sections of land, 1,280
acres, depending on location in the plains. Few scale economies could be realized beyond that
size.19 Nevertheless, in the 1930s, most farms were smaller than the prescribed levels for optimal
production. The Great Plains was covered by hundreds of thousands of small farms. This
condition was largely a legacy of the Homestead Act that limited claims to 160 to 320 acres
when the region was settled between1880 and 1925.
Table 1
Table 1 shows the prevalence of small farms in all 362 Great Plains counties in our
sample, as well as in the counties of the Great Plains where crop acres as a share of total
farmland were at least 40 percent. We make this distinction because the Great Plains included
areas that specialized in cattle raising with natural grass pasture, as well as areas of extensive
wheat cultivation. These croplands were the most vulnerable to wind erosion. Since available
farm-size categories in the agricultural census do not exactly match the 160 and 320 acres in
homesteads, we present census data on the share of farms below 180 and 500 acres.
Small farms were checker boarded across the land, surrounding somewhat larger farms, a
condition that increased the potential for externalities from those farms that failed to practice
erosion control.20 As shown, the share of small farms decreased dramatically between 1930 and
1964. Although approximately two-thirds of farms were below 500 acres in the 1930’s, only
about one third were that small by 1964.
Accordingly, collective action among farmers was necessary to address wind erosion. In

10
commenting on strip cropping and recognizing the externalities involved, Charles Kellogg of the
Bureau of Chemistry and Soils (1935, 5) stated: “Such a practice, to be most effective, must be
adopted on a community basis. Isolated farmers following this practice are not greatly benefited
if the adjoining land is allowed to blow badly.” The large number of small farms on the Great
Plains, however, raised the costs of coordination. Indeed, Roland Renne of the Montana
Agricultural Experiment Station (1935, 426-9) noted: “Dealing with thousands of different
owners slows up the adoption of a planned land use program…”
Private motivation to invest in strip fallow was reduced when farmers did not internalize
the externalities.21 The problem was accentuated for small farm owners. Each farmer had to
consider the benefits of strip fallow with the opportunity costs of lost production.22 Because
small farmers captured fewer of these leeward effects, they were less likely to have any fallow
rotation, leaving their land in cultivation and their fields exposed to wind.23
The excessive tillage practices of small farms were noted by the U.S. Great Plains
Committee (1936, 3, 40-6, 75), appointed by President Roosevelt, “…. although we now know
that in most parts of the Great Plains a farm of this size [homestead]….were required to put this
land under plow, regardless of whether or not it was suited to cultivation.” Cooper, et al, of the
Bureau of Agricultural Economics (1938, 146-8) claimed that farms “are so small that the
establishment of a system of farming that will conserve soil and produce a desirable family
income is practically impossible.” SCS geographer Warren Thornthwaite (1936, 242) concluded:
“…. the type of tillage which, because of its low cost, gives the farmer his only advantage is the
primary cause of wind erosion so destructive in nature that it eventually renders the land unfit for
cultivation.”
IV. Empirical Analysis of Farm Size, Investment in Erosion Control, and Wind Erosion.

11
In this section, we first summarize the parameters that influenced a farmer’s decision to
invest in erosion control in the 1930s. We then present quantitative evidence on the importance
of farm size and externalities in that decision. In the empirical analysis, we focus on the fallow
decision because it is the only soil conservation variable continuously reported in the agricultural
census, and strip fallow was the primary means of combating wind erosion recommended by the
SCS.
We assume that farmers sought to maximize profits by determining the share of their
cropland to place into strip fallow. Strip fallow increased productivity by conserving moisture
and reducing the losses of wind erosion. There were opportunity costs from lost production on
fallowed land. Farmers had to balance those costs with the productive benefits on land that
remained in crops. The productivity gain, however, depended upon the fallow actions of
neighboring farmers--on the aggregate fallow share of total cropland in a wind erosion zone, due
to cross-farm effects.
Elsewhere we show that when there is only one farm in an erosion-prone region, all
externalities are internalized and the socially-optimal fallow share is achieved.24 When there is
more than one farm, however, farmers will not adopt this share. Moreover, smaller farms have
even greater incentives to deviate from the optimal share because their opportunity costs from
lost production are higher relative to the productivity benefits from fallow.25 Accordingly, in the
presence of many small farms, the total fallow share is lower than socially optimal, and this in
turn, reduces the fallow share selected by every farmer, large and small alike.
This framework suggests the following implications for empirical analysis of wind
erosion on the Great Plains in the 1930s:
a. Small farms should have lower fallow shares.

12
b. The presence of many small farms in a region should reduce fallow incentives on
larger farms, implying that the greater the variation in farm size, the lower the fallow
share of cropland on all farms.
c. Regions with lower fallow shares of cropland (greater fully cultivated shares) should
have more intense wind erosion, controlling for natural factors.
In the following section we use these implications to guide our analysis of the effects of farm
size on fallow, cultivation, and the intensity of wind erosion damage across the Great Plains.
Three other testable implications are presented here for use in our analysis of collective action in
Section V.
d. The presence of many small farms and positive transaction costs should require
formal, coercive government institutions to promote rapid collective action to address
wind erosion.
e. Such government institutions should be adopted first in regions where wind erosion
was most severe.
f. Larger farmers should be the major advocates of collective action, and subsidies to
small farms would be required to offset the production losses of increased fallow
shares.
We now turn to examination of the relationships among farm size, fallow, cultivation, and the
intensity of erosion damage.
A. Farm Size and Fallow Share. There are very limited farm-level quantitative data that allow for comparison of the
fallow share of cropland for farms of different size. One data source that provides this
information is a 1936 Resettlement Administration survey of 263 farms in nine townships in

13
Morton, Slope, Bowman, and Hettinger Counties, North Dakota. This was a mixed
farming/ranching area where more of the land was in crop production, as indicated by 1935
agricultural census data. The percentage of total farmland devoted to crops in the four counties
ranged from 41 to 73 percent, with an average of 54 percent. The survey included mean crop and
mean fallow acres across eight farm-size categories. The calculated fallow shares of cropland are
shown in Table 2, and as predicted, the fallow shares generally increased with farm size.
Table 2
The shares can be placed into broader context by referring to the 1935 agricultural
census, which indicates that the mean fallow share of cropland for those four counties was
approximately 15 percent when the average farm size was 675 acres. As shown in the table,
farms that were larger than 880 acres had fallow shares above the county mean share and about
twice that of smaller farms. Further, the fallow shares for farms of all sizes were below the one-
third to one-half shares recommended by SCS officials. This finding is consistent with the
notion that the presence of small farms with their limited fallowing would have reduced the
fallow shares of larger farmers. It is instructive to note that as farm size grew over time and Soil
Conservation Districts were put into place in the Great Plains after 1937 to coordinate farmer
anti-erosion efforts, fallow shares in these North Dakota counties increased. By 1964, the mean
fallow share calculated from the census was 28 percent, closer to the range recommended by soil
conservation officials.26
In our econometric analysis we use county-level agricultural census data from 1930 to
1964. Discussion of the definitions and the comparability of the data across time are provided in
the Data Appendix. We examine the relationship among farm size and fallow share of cropland
using census data for the counties in the Great Plains most vulnerable to erosion, where the share

14
of crop acres was at least 40 percent of total farmland. This sample allows us to avoid including
ranching counties of mostly pastureland where neither crops nor fallow were major options due
to poor soil quality.
The relationship that we estimate is
fi = a + b1 si + b2 si2 + b3 di+ ei,
where fi is the share of strip-fallow acres of total crop acreage in each county i, si is average farm
size (land in farms divided by number of farms), si2 is farm size squared, and di is the estimated
standard deviation in farm size in each county. The share of fallow acres is expected to rise with
farm size, but decline with a greater deviation in farm size. The existence of both small and
larger farms in a county would raise cross-farm effects and weaken individual incentives to
invest in wind erosion control.
Table 3
Table 3 reports the regression results. Since we have data from each agricultural census
between 1930 and 1964, we estimated the fallow relationship separately for each census year, as
well as pooled across the entire period.27 As indicated in the table, the estimated coefficient on
the farm size variable is positive and statistically significant each year. The fallow share
increases with farm size at a decreasing rate, and the marginal effect of farm size on the fallow
share, calculated at the sample mean farm size (shown in italics in the table), are stable through
the years with largest impacts in 1935 and 1940. Further, during early census years, the standard
deviation of farm size in a county exerts a negative and statistically significant effect on fallow
share. Where there was a considerable range of sizes with failure of small farmers to invest in
wind erosion control, the overall use of strip fallow was reduced. As average farm size increased
over time, the variation in farm size tended to decline, and the effect of the standard deviation of

15
farm size diminished.
The last column in Table 3 shows the results from the estimation of a panel regression
model with county and time fixed effects. Time effects control for factors such as wheat and
cattle prices, federal farm programs, and other institutional and technological factors. The county
fixed effects allow us to use within county variation to estimate our model. The results of the
fixed-effects panel model further indicate the strong impact of farm size on the use of strip
fallow. The negative and significant coefficient on the farm size deviation variable points to the
role smaller farms played in inhibiting investment by all farms in strip fallow. Large, positive
coefficients on the census year fixed effect variables relative to 1930 (not reported in Table 3)
indicate the growing use of strip fallow over the period.
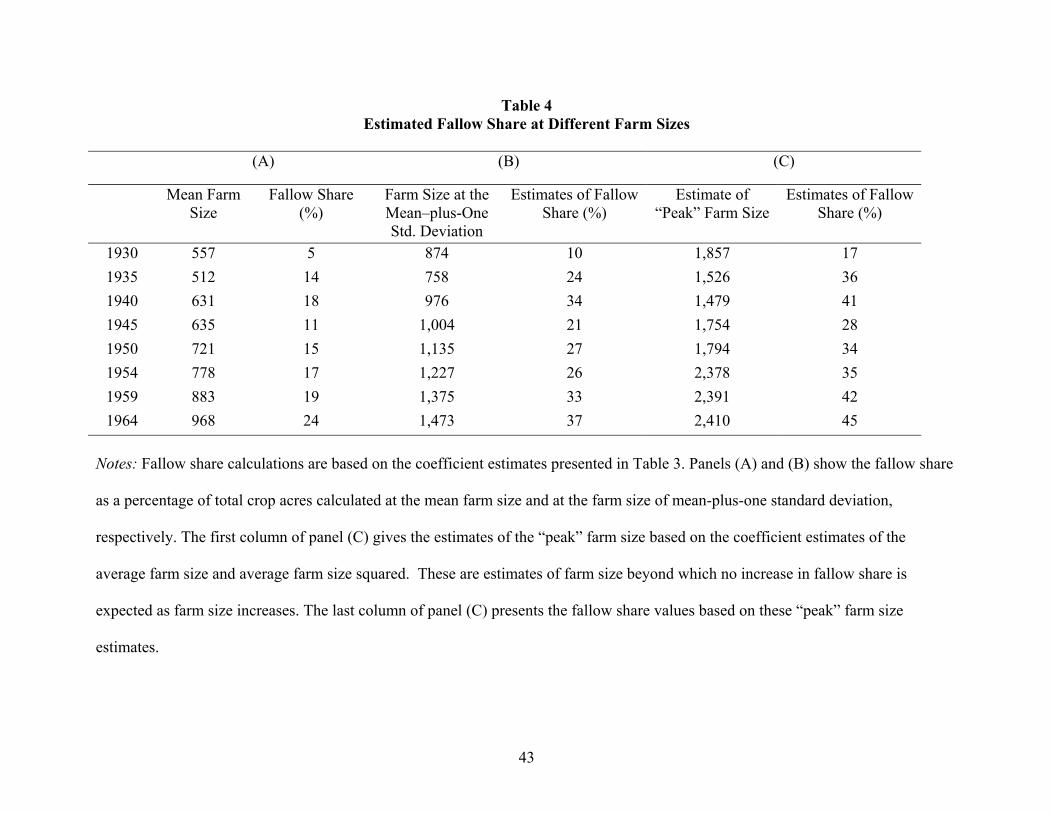
Table 4
Using the estimated coefficients for each year we can show the potential increase in
fallow share as farm size increased. The results are given in Table 4. Panel (A) shows the
change in the fallow share of cropland over time as mean farm size grows. Panel (B) reports the
estimated effect of a one standard deviation increase in average farm size on the fallow
percentage for each census year. In 1935, the fallow share is estimated to be 24 percent at a farm
size of 758 acres, but it is only 14 percent at the mean size of 512 acres. Since approximately
2/3’s of farmland was in cropland in 1935 in our sample, this one standard deviation increase in
farm size implies a 166-acre increase in cropland, of which an estimated 75 acres (or 45 percent
of the increase in cropland) would have been put in fallow, assuming no change in crop share.
The first column of panel (C) shows the estimated “peak” farm size based on the
coefficient estimates of average farm size and farm size squared. These “peak” farm size
estimates can be interpreted as the size beyond which no increase in fallow share is expected as

16
farm size increases. The second column of panel (C) displays the fallow share that corresponds
to this “peak” farm size. In 1935, the fallow share is estimated to be 36 percent at the peak size
of 1,526 acres. This difference of over 1,000 acres in farm size from the mean of 512 acres
implies an increase of 685 acres in cropland, based on the ratio of 2/3’s cropland to total
farmland. Of this increase in cropland, an estimated 323 acres (47 %) would be placed in fallow.
The last column also shows that for farm sizes closer to those recommended as optimal for
production by agricultural economists in 1930s, the fallow share estimates approach the
suggested 1/3 to 1/2 ratio for fallow share of cropland.
These estimates suggest that an increase in farm size from 512 acres to 1,526 acres in
1935 would have raised fallow shares to their recommended levels. Larger farmers had
approximately three times the cultivated acreage of average farmers and therefore, could
internalize more of the returns from investing in erosion control. Their farms were large enough
to better control the drift of heavier saltating and creeping soil particles that otherwise would
have smothered their fields and strip-fallow investments. Ignoring coordination problems and
assuming complete compliance by all farms in a wind unit, the results in Panel (C) for 1935
indicate that if all farms had been 1,526 acres, they would have internalized most of the
externalities of erosion control, especially those associated with the drift of heavier saltating and
creeping particles. Small farmers, however, captured fewer of these benefits and placed less of
their cropland in fallow. Where their cultivation practices prevailed, wind erosion damage
should have been more severe. We now examine this issue.
B. Farm Size, Cultivation Shares, and the Intensity of Wind Erosion across the Great Plains As indicated in Figure 1, the intensity of wind erosion varied across the counties of the
Great Plains. The literature on erosion and our analytical framework suggest that this variation

17
should be a function of differences in drought conditions, wind velocity, sand content of the soil
(erodibility), and the extent of cultivation (cropland – strip fallow) across the counties. The
effect of small farms on erosion control should be reflected in the cultivation measure.
In 1934, the Soil Conservation Service conducted reconnaissance erosion surveys
throughout the United States. State and national maps were prepared in 1934 and 1935 detailing
locations of wind and water erosion of different intensities, ranging from no erosion, slight,
moderate, severe, and very severe erosion. We use these maps to assign erosion index values to
each county in the Great Plains in 1934 and estimate the following relationship:
WEi = f (ri, ti, wi, ci,), where WEi is the wind erosion index measure for county i, ranging from 0 to 3 for no, light,
moderate, and severe erosion; ri is the deviation in rainfall from normal levels during 1930-35, ti
is percent sand in county soil; wi is average annual hourly wind velocity by county; and ci is
percent of total county farmland in cultivation (i.e. total cropland minus fallow divided by sum
of total cropland, including fallow or idle land, and pasture). The Data Appendix describes the
details of variable construction. Controlling for these variables, as well as state fixed effects, we
examine the impact of cultivation intensity as determined by farm size on wind erosion.
Table 5
Table 5 summarizes the results of the statistical analysis. Columns (1) and (2) report the
coefficient estimates of the OLS model with state fixed effects in the full and truncated samples
of Great Plains counties, respectively. The last two columns present ordered probit estimates,
utilizing the ordinal nature of the dependent variable. The regression results indicate that the
counties with higher cultivation shares of total farmland faced more severe wind erosion. The
coefficient estimates for the other variables have the expected signs, and most are statistically

18
significant.
Table 6
Table 6 shows the observed cell frequencies and the predicted probabilities for different
levels of wind erosion. The results are based on the coefficient estimates of the ordered probit
model at various cultivation share values from the truncated sample estimation. Column 2 reports
the predicted erosion probabilities that are calculated at the mean values for all of the variables.
The predicted probabilities of the model are similar to the observed cell frequencies, indicating
the model’s ability to predict correctly. The last two columns are calculated at the mean values
for the variables, except that in column 3, the cultivation share is assumed to be 50.8 percent, one
standard deviation below the mean share, while in column 4 the cultivation share is assumed to
be 100 percent of farmland. If the average county cultivation share is 50.8 percent, the predicted
probabilities of “no” or “light” wind erosion (i.e. Prob (WE = 0) and Prob (WE = 1)) increase
from those associated with the mean cultivation share, whereas the probabilities of “moderate”
and “severe” erosion decrease. In contrast, if we assume that farmers in a county put all of their
farmland into cultivation (cultivation share = 100 percent), which was not unlikely for very small
homesteads of 160 - 320 acres, the predicted probability of “severe” wind erosion jumps from
0.26 to 0.58 and the predicted probability of “no” wind erosion practically disappears. These
calculations indicate the important effect of cultivation intensity and farm size on the magnitude
of the wind erosion damage in a county.
V. A “Unitized” Response for the Control of Externalities: The Formation of Soil Conservation Districts.
A. Farm-Size Effects and Private Efforts to Address Wind Erosion.
With all farms in the 1930s below the size necessary to fully combat wind erosion and
internalize the externalities involved, coordinated actions were required. Private efforts to

19
contain the blowing and drifting of soil would have posed a formidable bargaining problem even
if farmer incentives had been aligned. Hence, a difficult collective action problem existed in the
Great Plains in the 1930s. And given the magnitude and severity of the problem, there were
important reasons for moving quickly to reduce the costs of wind erosion. Unfortunately, the
drought began in 1930, but an effective institutional response did not emerge until after 1937.
In the early 1930s, the expectation was that the drought would end and that short-term
private efforts to combat erosion would be sufficient. Even so, the challenge of coordinating
action among farmers was understood clearly. In a 1936 report to H.H. Bennett, Chief of the
SCS, J.T. Reece, Soil Conservation Supervisor in Littlefield, Texas, argued: “The premier
problem in establishing a constructive erosion control program in this camp is securing adequate
cooperation from the farmers and land owners, for without this, no conservation program is
possible.”28
To encourage coordinated investment in erosion control, the SCS, starting in 1934,
developed 79 demonstration areas to show farmers the benefits of various conservation
practices.29 Reflecting the size necessary to address regional erosion, these demonstration areas
were large, ranging from 24,960 to 169,000 acres in Colorado, 30,000 acres to114, 000 acres in
Kansas, and 30,000 to 114,000 acres in Nebraska.30Given the mixed incentives to participate in
erosion control, the response to calls for voluntary collective action was limited.31 Indeed, the
SCS noted a lack of voluntary farmer participation in the erosion control programs outlined in
the demonstration projects. In 1935, Bennett reprimanded F.L. Duley, Regional SCS Director in
Mankato, Kansas, stating, “Frankly, it is somewhat disappointing to note that such a small
portion of your project is being retired from cultivation and that you are not using any strip-

20
cropping measures whatsoever…we have been considering that strip-cropping would make up
one of our principal means of erosion control.”32
An examination of records for demonstration areas in Colorado, Kansas, New Mexico,
and Texas in 1936-37 reveals differential actions in erosion control among “cooperators” and
“non-cooperators.” Data on fallow and strip cropping across farms shows that for cooperators the
fallow and strip-cropping share of total cultivated land was 25 percent, whereas for non-
cooperators the share was 14 percent.33 Other evidence suggests that the smallest farmers in the
demonstration areas were the non-cooperators. Records from two erosion control projects in
Dalhart and Dublin, Texas in 1937 and 1939 identify cooperators and non-cooperators according
to farm size. Although the data set is small, in both cases cooperating farms were somewhat
larger than non-cooperating farms. In Dalhart, located in the Texas Panhandle, the mean size of
cooperating farms was 629 acres, whereas the mean size of non-cooperators was 418 acres. In
Dublin, located in central Texas, the mean size of cooperating farms was 145 acres, while the
average size of non-cooperating farms was118 acres.34
B. Government Intervention to Address the Collective Action Problem: Soil Conservation Districts. More direct and coercive government intervention came in 1937 with inauguration of
Soil Conservation Districts (SCDs) that had the authority to force farmer compliance and the
resources (subsidies) to cover the costs of erosion control. The SCDs were local government
units and required state legislation for establishment. A model statute was drafted by USDA
Assistant Secretary M.L. Wilson and Assistant Solicitor Philip M. Glick and submitted by
President Roosevelt to the state governors for legislative adoption in February 1937:
…for the discontinuance of land use practices contributing to erosion and the adoption and
carrying out of soil conservation practices and to provide for the enforcement of such programs

21
and regulations…The failure by any land occupier to conserve the soil and control the erosion
upon his lands causes a washing and blowing of soil, of water, from his lands on to other lands,
makes the conservation of soil and the control of erosion of the other lands difficult or
impossible.35
We expect the states with the greatest wind erosion problems to be the first to adopt
legislation to promote cooperation among farmers. Indeed, Kansas, Oklahoma, and Texas, at the
center of the Dust Bowl, enacted wind erosion laws in 1935, earlier than other Great Plains
states.36 In all three states, district officials were authorized to enter private property to combat
erosion and to fine non-complying owners.37 In Colorado, another central Dust Bowl state,
assessments were levied against farmlands to fund erosion control, and Soil Conservation
Districts had the power to block new cultivation plans with “sod land ordinances.”38
The conservation districts were even larger than the demonstration areas. For example,
districts in Kansas in 1941 ranged from about 250,000 acres to nearly 600,000 acres.39 The
district sizes reflected the areas necessary to encompass an erodible region or wind zones.
Districts typically covered entire counties, and they clearly focused on externalities. The land-use
ordinances applied only where neglect on one farm caused damage or hindered conservation
treatment “on adjacent lands.” The 1939 Extension Service Review noted:
Individual farmers have been practicing measures of erosion control for years, but they have
learned that it is a difficult if not a losing single-handed fight…As the forces of wind and water
are not halted by the section line or fence row, erosion becomes a community problem, and
community problems require community action (Partain, 1939, 357-8).
Within the districts, individual farmers entered into contracts with the SCS to cooperate
in reducing soil erosion for five years. The SCS provided equipment, seeds, fencing, and
22
personnel for erosion control. Erosion control ordinances imposing land use regulations on all
farmers could be adopted upon a favorable vote of a majority of the farmers in a district. Under
the statute, the district supervisors could occupy parts of farms and begin erosion control with the
costs plus 5 percent levied by court order against the farmer.40 Further, farmers who did not
comply were ineligible for SCS assistance. Moreover, beginning in 1938, the Agricultural
Adjustment Administration (AAA) required that “every cooperator handle his land by using
practices which are effective in preventing wind erosion.”
Subsidies were provided. 30 percent of AAA payments to a farm were to be earned by
carrying out soil conservation practices. AAA payments to the farmer, however, were to be
reduced by $1.00 per acre for each acre of land where approved practices were not implemented.
If it were deemed that the farmer’s land had become “a wind erosion hazard to surrounding
farmers in the community,” they would not receive any funds under the 1939 Agricultural
Conservation Program (ACP). These funds were significant to a farm family, amounting to $162
per applicant in 1939.41 Districts could acquire lands “for purposes of conservation” and receive
1939 Agricultural Conservation Program funds and loans from the Farm Security Administration
(FSA). Finally, the FSA was authorized to make loans for erosion control investments to be
repaid with ACP allocations. Other FSA loans were to assist farmers “obtain a proper-size
operating unit.”42
The available evidence also suggests that larger farmers, who bore more of the costs of
cross-farm erosion externalities, were the major proponents of Soil Conservation Districts. Data
from Farm Service Agency files in Helena, Montana include information on the size of farms
owned by individual farmers who petitioned for the establishment of three SCDs in Montana:
The Little Beaver SCD (formed January 27, 1942), the Cascade County SCD (approved June 17,
23
1946), and the Powder River County SCD (organized December 17, 1953). A comparison of the
average farm size of the petitioners with census data on the average farm size in the county
allows us to test the hypothesis that political support for SCDs would come from larger farmers.
As indicated in Table 7, the petitioning farmers had somewhat larger farms on average than the
mean farm size in the county. Especially in Fallon County, the average farm size of petitioners
was one standard deviation larger than the mean farm size in 1940.
Table 7
VII. Conclusion.
In this paper we re-examine a well-known environmental disaster, the Dust Bowl of the
1930s, and emphasize the important role that farm size and externalities played in both
contributing to severe wind erosion and inhibiting corrective action. Best possible wind erosion
control would have required farms that would have been productively inefficient. We argue that
farmers were more likely to adopt wind erosion control, such as putting part of their cropland to
strip fallow, if they were operating at sizes closer to recommended production levels. At those
sizes they internalized more of the benefits of fallow relative to the opportunity costs of lost
production. Farm-level data and our empirical analysis using county census data provide
evidence that larger farms had greater fallow shares. Further, our analysis shows that erosion
across the Great Plains was more severe in those counties where cultivation shares were greater.
Soil Conservation Districts, which could be as large as 600,000 acres, eventually were
implemented in order to coordinate and enforce farmer actions to combat regional wind erosion.
Within these districts, individual farmers entered into contracts with the SCS to cooperate in
more complete erosion control.

24
The results reported here are consistent with more contemporary analyses of the sources
of wind erosion that emphasize the importance of land use practices relative to natural geologic
and climatic conditions. Field personnel of the SCS recognized the problem of small farms in the
1930s, but this issue has been lost in subsequent work on the Dust Bowl by historians,
agricultural economists and engineers. Regulations within Soil Conservation Districts, along
with the gradual consolidation of farms, led to changes in cultivation practices that better
shielded the soil so that when droughts affected the Great Plains in the 1950 and 1970s, the
region was less vulnerable to wind erosion.43
The Dust Bowl illustrates a classic common-pool problem. Exacerbated by the existence
of many small farms in the Great Plains, it was not solved until larger units were created that
aligned the incentives of the individual parties. In this sense, addressing the problem of
widespread wind erosion required actions similar to those necessary to reduce losses in
competitive oil extraction, fishery exploitation, and aquifer drawdown.44

25
Data Appendix
The qualitative and quantitative evidence presented in the paper come from many sources as
indicated in the endnotes. This appendix describes the quantitative evidence presented in the
tables and used in the econometric analyses.45
Data Sources:
1. U.S. Agricultural Census Data, 1930 – 1964.
The census data are electronically available from the Great Plains Population and Environment
Database, 2001, Inter-University Consortium for Political and Social Research (ICPSR),
University Michigan, http://www.icpsr.umich.edu/plains, and from U.S. Historical Census Data
Browser, http://fisher.lib.virginia.edu/census/ . When necessary we supplemented these sources
using the print versions of Agricultural Census data.
Census Data Definitions, Data Construction and Comparability across Time:
A. Farmland: The land in farms includes all cropland harvested, all land on which crops failed,
all cropland idle or fallow, all cropland used only for pasture, all woodland, and all other land
including all wastelands, house yards, barnyards, feed lots, lanes, roads, ditches, etc. This
variable is quite comparable across years although there were changes in the inclusion of
“nonagricultural” land, which is only a small portion of farmland.
B. Total Crop Acres: Includes cropland harvested, land on which crops failed, cropland idle or
fallow and cropland used for pasture. This variable is consistent across years, but the specific
definition of “cropland for pasture” differs slightly in 1945.
C. Fallow Acres: Fallow or idle land as defined by the census during 1930-1945, and summer
fallow as defined during 1950-1964. This is the most comparable definition of fallow, although
the latter years’ fallow acres are more restricted than the years of 1930 – 1945.

26
C. Fallow Share (constructed variable) = 100*(Fallow Acres / Total Crop Acres).
D. Crop Share (constructed variable) = 100*(Total Crop Acres / Farmland).
E. Cultivation Share (constructed variable) = 100*(Total Crop Acres – Fallow Acres) /
Farmland.
F. Standard Deviation in Farm Size (constructed variable):
The agricultural census provides farm size categories and the number of farms in each category.
We constructed following categories that are comparable over the years and used these data to
calculate an approximate standard deviation: 0-49 acres, 50-99 acres, 100-179 acres, 180-259
acres, 260-499 acres, 500-999 acres and over 1,000 acres. The standard deviation of farm size
was calculated based on the difference between average farm size and the mid-point of each
category, weighted by the number of farms in each category. In order to choose the mid-point for
the open-ended category of farms over 1,000 acres, we first estimated the farmland in farms over
1,000 acres and calculated the average farm size in this category. We used this calculated
average size as the mid-point if it were between 1000 and 3000 acres. If the estimated average
farm size were smaller than 1000 acres, we used the lower limit of 1000 acres as the mid-point.
Otherwise, the upper-limit of 3,000 acres was used as the mid-point. The formula for weighted
variance is provided below:
2))(/( FMNNVariance iTi
i −=∑
where Ni = # of farms in a category for a county; NT= Total number of farms in a county;
Mi=Mid-point of a size category; and F =Average farm size in a county.
2. Data used in the Wind Erosion Analysis:
A. Wind Erosion Index: State Erosion Reconnaissance Survey maps prepared in 1934 by the
SCS for Montana, North and South Dakota, Nebraska, Kansas, Colorado, Oklahoma, Texas, and

27
New Mexico are available at the National Archives, Record Group 114, Cartographic Collection.
See Kifer and Stewart (1938, 9) for a 1934 map and a 1935 U.S. Erosion Reconnaissance Survey
map is available in Joel (1937). We consider only wind erosion as indicated on the maps and do
not assign values for water erosion. The maps are color coded and shaded to identify locations
of different erosion intensity. A county was assigned a value from 0 to 3 based on dominant
erosion conditions indicated in the maps. Generally, a county’s erosion index value was based
on the condition that characterized 50 percent or more of the county. In cases where severe
erosion conditions were widespread within the county, but the total appeared to cover less than
50 percent of the land area, the county was still assigned the severe index value, 3. The
indication that severe erosion was widespread and not localized warranted the higher value.
B. Rainfall Deviation: is average percent departure from normal by county, 1930-35, from
Cronin and Beers (1937, Table 8, 41-54).
C. Wind Velocity: Annual average hourly wind velocity in miles per hour 30 feet above the
ground is from Chepil, Siddoway, and Armbrust (1962, 163). They provide a map of the United
States with isobars of similar wind speeds. These are used to map onto county locations. For the
Great Plains, the minimum wind speed was 9 miles per hour and the maximum was 14. Each
county was assigned one of the following wind velocity values: 9 mph = 0, 10 mph =1, 11 mph
= 2, 12 mph =3, 13 mph = 4, 14 mph =5.
D. Percent Sand in Soils: Soil erodibility in a county is indicated by percent sand, since sandy
soils are highly erodible. % sand by county is from STATSGO data set graciously provided to
us by Geoff Cunfer from the Great Plains Population and Environment Database, 2001, Inter-
University Consortium for Political and Social Research (ICPSR), University of Michigan.
E. Definition of the Sample:

28
Our definition of the Great Plains is based on the map of the region in Kifer and Stewart’s (1937,
9) Works Progress Administration Report. Their designation of the Great Plains includes the 362
eastern counties of Montana, Colorado, and New Mexico, all of North Dakota, those west of the
97th meridian in South Dakota, most of those west of the 98th meridian in Nebraska, Kansas, and
Oklahoma, and west Texas counties in the Panhandle to 32 degrees latitude. The results
described in the text do not appear to be sensitive to our definition of the Great Plains. Dropping
far eastern counties in North and South Dakota, for example, do not change our results.
In our analyses, we also used a truncated sample of Great Plains counties where crop acres as a
share of total farmland were at least 40 percent (285 in 1930, variable after that). We make this
distinction because the Great Plains included areas that specialized in cattle raising with natural
grass pasture and areas of extensive wheat or cotton cultivation. Croplands were the most
vulnerable to wind erosion.

29
Bibliography
Allen, Douglas W. and Dean Lueck, “The Nature of the Farm,” Journal of Law and Economics,
41, (2, pt.1) October, 1998: 343-86.
_______________, “A Transaction Cost Primer on Farm Organization,” Canadian Journal of
Agricultural Economics, 48(4), 2000: 643-52.
Ashby, Jacqueline A., “The Social Ecology of Soil Erosion in a Colombian Farming System,”
Rural Sociology, 50(3), 1985: 377-96.
Barbarika, Alexander, Jr., “Costs of Soil Conservation Practices,” in Optimum Erosion Control
at Least Cost: Proceedings of the National Symposium on Conservation Systems, St.
Joseph, Michigan: American Society of Agricultural Engineers, 1987: 187-95.
Bennett, Hugh H., Soil Conservation, New York: McGraw-Hill, 1939.
Bennett, Hugh H. and Frederick H. Fowler, Report of the Great Plains Drought Area Committee,
Washington D.C.: Government Printing Office, 1936.
Bennett, John, B., F.R. Kenney, and W.R. Chapline, “The Problem: Subhumid Areas,” Soils and
Men, Yearbook of Agriculture, 1938, USDA, Washington D.C.: Government Printing
Office, 1938: 68-110.
Berry, Albert and William R. Cline, Agrarian Structure and Productivity in Developing
Countries, Baltimore: Johns Hopkins University Press, 1979.
Bilbro, J.D., D.W. Fryrear, and T.M. Zobeck, “Flexible Conservation Systems for Wind Erosion
Control in Semiarid Regions, in Optimum Erosion Control at Least Cost: Proceedings of
the National Symposium on Conservation Systems, St. Joseph, Michigan: American
Society of Agricultural Engineers, 1987: 114-20.
Boatright, William C., Erosion and Related Land Use Conditions on the Friod Demonstration

30
Project, Montana, USDA, Soil Conservation Service, Washington D.C., 1938.
Bonnifield, Paul, The Dust Bowl, Men, Dirt, and Depression, Albuquerque: University of New
Mexico Press, 1979.
Camboni, Silvana M. and Ted L. Napier, “Factors Affecting Use of Conservation Farming
Practices in East Central Ohio,” Agriculture, Ecosystems and Environment 45, 1993: 79-
94.
Chepil, W.S., “Width of Field Strips to Control Wind Erosion,” Kansas State Experiment Station
Technical Bulletin 92, 1957, Manhattan, Kansas.
_______________, “Wind Erodibility of Farm Fields,” Journal of Soil and Water Conservation,
14(5), 1959: 214-19.
Chepil, W.S., F.H. Siddoway, and Dean V. Armbrust, “Climatic Factor for Estimating Wind
Erodibility of Farm Fields,” Journal of Soil and Water Conservation, 17(4), 1962: 162-
65.
Chilcott, E.F., “Preventing Soil Blowing on the Southern Great Plains,” USDA Farmers’ Bulletin
No. 1771, Washington D.C.: Government Printing Office, 1937.
Clements, Frederic E., “Climatic Cycles and Human Populations in the Great Plains,” Scientific
Monthly, September, 1938: 193-210.
Cochrane, W.W., “Successful Montana Farms,” MS Thesis, Montana State College, Bozeman,
1938.
Cornia, G. A., “Farm Size, Land Yields, and the Agricultural Production Function: An Analysis
for Fifteen Developing Countries, World Development, 13, 1985: 513-34.
Coxhead, Ian, “Consequences of a Food Security Strategy for Economic Welfare, Income
Distribution and Land Degradation: The Philippine Case,” World Development, 28(1),

31
2000: 111-28.
Craig, D.G., “Control of Wind Erosion in the Great Plains,” Journal of Soil and Water
Conservation, 14(4), 1959: 147-51.
Cronin, Francis D. and Howard W. Beers, Areas of Intense Drought Distress, 1930-1936,
Research Bulletin, Washington D.C.: Works Progress Administration, 1937.
Crowder, B.M. and C.E. Young, “Bridging the Gap between Private Incentives and Public Goals
for Agricultural Nonpoint Pollution Control,” in Optimum Erosion Control at Least Cost:
Proceedings of the National Symposium on Conservation Systems, St. Joseph, Michigan:
American Society of Agricultural Engineers, 1987: 177-86.
Ervin, R.T. and J. A. Lee, “Impact of Conservation Practices on Airborne Dust in the Southern
High Plains of Texas,” Journal of Soil and Water Conservation, 49 (5), 1994: 430-37.
Feder, Gershon, “The Relation between Farm Size and Farm Productivity: The Role of Family
Labor, Supervision, and Credit Constraints,” Journal of Development Economics, 18,
August, 1985: 197-314.
Frey, John C., “Some Obstacles to Soil Erosion Control in Western Iowa,”
Iowa Agricultural Experiment Station Research Bulletin No. 391, Ames, Iowa, 1952.
Fryrear, Donald W., “Annual Crops as Wind Barriers,” Transactions of the ASAE, 6(4), 1963:
340-52.
Fryrear, D.W. and E.L. Skidmore, “Methods for Controlling Wind Erosion,” in R.F. Follett and
B. A. Stewart, ed., Soil Erosion and Crop Productivity, Madison: American Society of
Agronomy, Crop Science Society of America, Soil Science Society of America, 1985:
443-57.
Greb, B.W., and A. C. Block, “Effects of Windbreak Plantings on Adjacent Crops,” Journal of

32
Soil and Water Conservation, 16(5),1961: 223-226.
Gross, Neal and Marvin J. Taves, “Characteristics Associated with Acceptance of Recommended
Farm Practices, Rural Sociology, 17, 1952: 321-27.
Gutmann, Myron P. and Geoff Cunfer, “A New Look at the Causes of the Dust Bowl,” The
Charles L. Wood Agricultural History Lecture Series 99(1), 1999: 1-25.
Heady, Earl O. and Gary F. Vocke, “Trade-Offs Between Erosion Control and Production Costs
in U.S. Agriculture,” Journal of Soil and Water Conservation, 33 (5), 1978: 227-30.
Halcrow, Harold, “The Problem of the Unsuccessful Dry Farm in the Northern Great Plains,”
MS Thesis, Montana State College, Bozeman, 1938.
Hannah, W.H., “Soil Conservation and the Rule of Law,” Journal of Soil and Water
Conservation,” 5(3), 1950: 106-10.
Hansen, Zeynep K. and Gary D. Libecap, “The Allocation of Property Rights to Land: U.S. Land
Policy and Farm Failure in the Northern Great Plains,” forthcoming, Explorations in
Economic History, 2004.
Helms, Douglas, The Preparation of the Standard State Soil Conservation Districts Law,
Washington D.C.: USDA, Soil Conservation Service, Economics and Social Sciences
Division, 1990.
_______________, Readings in the History of the Soil Conservation Service, USDA SCS,
Historical Notes No. 1, Washington D.C., 1992.
Held, R. Burnell and Marion Clawson, Soil Conservation in Perspective, Baltimore: Resources
for the Future and Johns Hopkins University Press, 1965.
Hines, L. Gregory, “The Economics of Idle Resources,” Journal of Water and Soil Conservation,
7(1), 1952: 27-9.

33
Hockley, H.A. and Herman Walker, Jr., “1937 State Legislation for Control of Soil Erosion,”
Journal of Land and Public Utility Economics, XIV, 1938: 210-17.
Huffman, Roy E. and James L. Paschal, “Integrating the Use of Irrigated and Grazing Land in
the Northern Great Plains,” The Journal of Land and Public Utility Economics, 18, 1942:
17-27.
Hurt, R. Douglas, The Dust Bowl: An Agricultural and Social History, Chicago: Nelson-Hall,
1981.
Joel, Arthur H., “Soil Conservation Reconnaissance Survey of the Southern Great Plains Wind-
Erosion Area,” USDA Technical Bulletin No. 556, Washington D.C.: Government
Printing Office, 1937.
Johnson, Vance, Heaven’s Tableland: The Dust Bowl Story, New York: Farrar, Straus, and Co,
1947.
Kell, Walter V. and Grover F. Brown, “Strip Cropping for Soil Conservation,” USDA Farmers
Bulletin, No. 1776, Washington D.C.: Government Printing Office, 1938.
Kellogg, Charles E., “Soil Blowing and Dust Storms,” USDA Miscellaneous Publication No.
221, Washington D.C.: Government Printing Office, 1935.
Kifer, R.S. and H.L. Stewart, Farming Hazards in the Drought Area, WPA Research Monograph
XVI, Washington D.C.: Government Printing Office, 1938.
Kimmel, Roy I, “Unit Reorganization Program for the Southern Great Plains,” Journal of Farm
Economics, 22, 1940: 264-69.
Kislev, Yoav and Willis Peterson, “Prices, Technology, and Farm Size,” Journal of Political
Economy, 90 (3), 1982: 578-95.
Korsching, Peter F., Curtis W. Stofferahn, Peter J. Nowak, and Donald J. Wagener, “Adopter

34
Characteristics and Adoption Patterns of Minimum Tillage: Implications for Soil
Conservation Programs,” Journal of Soil and Water Conservation, 38 (5), 1983: 428-31.
Kraenzel, Carl F., “New Frontiers of the Great Plains,” Journal of Farm Economics, 2, 1942:
571-88.
Lee, Jeffrey A., Kenneth A. Wigner, and James M. Gregory, “Drought, Wind, and Blowing Dust
on the Southern High Plains of the United States,” Physical Geography 14(1), 1993: 56-
67.
Lee, Jeffrey A. and Vatche P. Tchakerian, “Magnitude and Frequency of Blowing Dust on the
Southern High Plains of the United States, 1947-1989,” Annals of the Association of
American Geographers, 85(4), 1995: 684-93.
Libecap, Gary D., ”Common Property,” The New Palgrave Dictionary of Economics and the
Law, Peter Newman, ed., New York: Macmillan, 1998: 317-24.
Libecap, Gary D. and James L. Smith, “The Self-Enforcing Provisions of Oil and Gas Unit
Operating Agreements: Theory and Evidence,” Journal of Law, Economics and
Organization, 15(2), 1999: 526-48.
Libecap, Gary D. and Zeynep K. Hansen, “’Rain Follows the Plow’ and Dryfarming Doctrine:
The Climate Information Problem and Homestead Failure in the Upper Great Plains,
1890-1925,” Journal of Economic History, 62(1), 2002: 86-120.
Marsh, C. Paul and A. Lee Coleman, “The Relation of Farmer Characteristics to the Adoption of
Recommended Farm Practices,” Rural Sociology, 20, 1955: 289-96.
Miller, Thomas A., Gordon E. Rodewald, and Robert G. McElroy, “Economics of Size in US
Field Crop Farming,” USDA Agricultural Economic Report No. 472, Washington D.C.,
1981.

35
Moldenhauer, W.C., G.W. Langdale, Wilbur Frye, D.K. McCool, R. I. Papendick, D. E. Smika,
and D. William Fryrear, Journal of Soil and Water Conservation, 38 (3), 1983: 144-51.
Morgan, Robert J., Governing Soil Conservation: Thirty Years of the New Decentralization,
Baltimore: Resources for the Future and Johns Hopkins University Press, 1965.
Nace, R.L. and E.J. Pluhowski, “Drought of the 1950’s with Special Reference to the
Midcontinent,” U.S. Geological Survey Water-Supply Paper 1804, Washington D.C.:
Government Printing Office, 1965.
Napier, Ted L. and Cameron S. Thraen, Akla Gore, and W. Richard Goe, “Factors Affecting
Adoption of Convention and Conservation Tillage Practices in Ohio,” Journal of Soil and
Water Conservation, 39(3), 1984: 205-209.
Napier, Ted L. and David G. Sommers, “Correlates of Plant Nutrient Use Among Ohio Farmers:
Implications for Water Quality Initiatives,” Journal of Rural Studies, 10(2), 1994: 159-
71.
Norris, Patricia E. and Sandra S. Batie, “Virginia Farmers’ Soil Conservation Decisions: An
Application of Tobit Analysis,” Southern Journal of Agricultural Economics, 19, July,
1987: 79-90.
Norwood, Charles A. and George M. Herron, “Use Stubble Mulch to Control Erosion in Western
Kansas,” Kansas State Experiment Station Circular 411, Manhattan, Kansas, 1977.
Nowak, Peter, J., “The Adoption of Agricultural Conservation Technologies: Economic and
Diffusion Explanations,” Rural Sociology, 52(2), 1987: 208-220.
Pampel, Fred, Jr. and J.C. van Es, “Environmental Quality and Issues of Adoption Research,”
Rural Sociology, 42(1), 1977: 57-71.

36
Papendick, Robert I, ed., Farming with the Wind: Best Management Practices for Controlling
Wind Erosion and Air Quality on Columbia Plateau Croplands, Pullman: Northwest
Columbia Plateau Wind Erosion Air Quality Project, 1997.
Parks, W. Robert, Soil Conservation Districts in Action, Ames: Iowa State College Press, 1952.
Partain, Lloyd E., “Community Attack on Erosion,” Journal of Land and Public Utility
Economics, XV, 1939: 354-58.
Rahm, Michael R. and Wallace E. Huffman, “The Adoption of Reduced Tillage: The Role of
Human Capital and Other Variables, American Journal of Agricultural Economics, 66,
1984: 405-13.
Renne, Roland R., “Significance of the Ownership Pattern To Land Use Planning,” Journal of
Farm Economics, 47(3), 1935: 423-32.
Simms, D. Harper, The Soil Conservation Service, New York: Praeger, 1970.
Stallings, J.H., Soil Conservation, Englewood Cliffs, N.J.: Prentice Hall, 1957.
Starch, E.A., “Type of Farming Modifications Needed in the Great Plains,” Journal of Farm
Economics, 21, 1939: 114-20.
Stephens, P.H., “Why the Dust Bowl?” Journal of Farm Economics, 19 (3),1937: 750-57.
Steinbeck, John, The Grapes of Wrath, New York: Viking, 1939.
Stults, Harold M. and Roger Strohbehn, “Economics of Conservation Systems,” in Optimum
Erosion Control at Least Cost: Proceedings of the National Symposium on Conservation
Systems, St. Joseph, Michigan: American Society of Agricultural Engineers, 1987: 227-
35.
Thornthwaite, C. Warren, “The Great Plains,” in Goodrich, Carter, et al, eds, Migration and
Economic Opportunity: Report of the Study of Population Distribution, Philadelphia:

37
University of Pennsylvania Press, 1936: 202-50.
Toy, Terrence J., George R. Foster, Kenneth G. Renard, Soil Erosion: Processes, Prediction,
Measurement, and Control, New York: John Wiley and Sons, 2002.
U.S. Great Plains Committee, The Future of the Great Plains, Washington D.C.: Government
Printing Office, 1936.
U.S. Department of Agriculture, Yearbook of Agriculture, “Soils and Men,” Washington D.C.:
Government Printing Office, 1938.
_______________, Yearbook of Agriculture, “Farmers in a Changing World,” Washington D.C.:
Government Printing Office, 1940.
U.S. Department of Agriculture, SCS, A Standard State Soil Conservation Districts Law,
Washington D.C.: Government Printing Office, 1936.
U.S. General Land Office, Annual Reports of the Commissioner, Washington D.C.: Government
Printing Office, selected years.
U.S. Soil Conservation Service, USDA, Soil Conservation Districts for Erosion Control,
Miscellaneous Publication No. 293, Washington D.C, 1937.
Wehrwein, George S., “Wind Erosion Legislation in Texas and Kansas,” Journal of Land and
Public Utility Economics, XII, 1936: 312-13.
Wiggins, Steven N., and Gary D. Libecap, “Oil Field Unitization: Contractual Failure in the
Presence of Imperfect Information,” American Economic Review, 75, 1985: 376-85.
Woodruff, N.P, Leon Lyles, F.H. Siddoway, and D.W. Fryrear, “How to Control Wind Erosion,”
Agriculture Information Bulletin No. 354, Agricultural Research Service, USDA,
Washington D.C, 1972.
Worster, Donald, Dust Bowl: The Southern Plains in the 1930s, New York: Oxford University

38
Press, 1979.
Zavoina, R. and W. McElvey, “A Statistical Model for the Analysis of Ordinal Level Dependent
Variables,” Journal of Mathematical Sociology, Summer, 1975: 103-20.

39
Table 1 Small Farm Proliferation in Great Plains Counties across Time
Percent of farms smaller than 180 acres Percent of farms smaller than 500 acres
All Great Plains
Counties Great Plains Counties
with Total Crop Share ≥ 40 %
All Great Plains Counties
Great Plains Counties with Total Crop Share ≥ 40 %
1930 27 26 65 68 1935 30 30 67 71 1940 28 27 62 66 1945 22 22 54 61 1950 20 19 51 56 1954 18 18 48 52 1959 15 15 42 46 1964 15 14 39 42 Source: U.S. Agricultural Census 1930-64. Notes: Great Plains counties includes the 362 eastern counties of Montana, Colorado, and New
Mexico, all of North Dakota, those west of the 97th meridian in South Dakota, most of those west
of the 98th meridian in Nebraska, Kansas, and Oklahoma, and west Texas counties in the
Panhandle to 32 degrees latitude.

40
Table 2 Fallow Share of Total Crop Acres, North Dakota 1936
Farm Size (Acres)
2,051 and over
1,041 to 2,050
881 to 1,040
721 to 880
561 to 720
401 to 560
241 to 400
240 and Less
Fallow Share .22 .18 .20 .11 .11 .13 .15 .09 Source: 1936 U.S. Resettlement Administration, Sample Surveys of Farms, USDA National
Agricultural Library.
Notes: The survey was done across 263 farms in nine townships in Morton, Slope, Bowman,
and Hettinger Counties, North Dakota. Fallow share is defined as idle or fallow land as a share of
total crop acres. This is the same definition used in the econometric analysis of fallow share.

41
Table 3 Analysis of the Relationship between Average Farm Size and Fallow Share in Great Plains Countiesa
Dependent Variable: Fallow Share (as a percentage of total crop acres) 1930 1935 1940 1945 1950 1954 1959 1964 1930-1964
Mean of dependent variable
5.42 14.13 17.75 11.32 14.87 16.58 19.32 24.06 15.14
Average Farm Size
0.023** (0.008)
0.062*** (0.104)
0.083*** (0.015)
0.043** (0.016)
0.051** (0.022)
0.033** (0.010)
0.043** (0.018)
0.043** (0.016)
0.020*** (0.004)
Average Farm Size Squared
-6.3E-6** (2.5E-6)
-2.0E-5*** (3.0E-6)
-2.8E-5*** (5.4E-6)
-1.2E-5** (3.7E-6)
-1.4E-5* (6.5E-6)
-6.8E-6 (3.9E-6)
-9.1E-6* (4.4E-6)
-8.9E-6* (4.3E-6)
-2.4E-6** (1.0E-6)
Marginal Effect of Farm Sizeb
0.016 0.041 0.048 0.027 0.031 0.022 0.027 0.026 0.017
Standard Deviation of Farm Size
-0.007 (0.004)
-0.026*** (0.007)
-0.033*** (0.008)
-0.003 (0.134)
-0.007 (0.016)
0.001 (0.020)
-0.011 (0.016)
-0.011 (0.015)
-0.005** (0.002)
No. of Observations R2
285
0.203
252
0.369
260
0.415
210
0.366
225
0.352
225
0.354
226
0.345
218
0.316
1901 0.409
* Statistically significant at 10 percent level; ** Significant at 5 percent level; ***Significant at 1 percent level
Source: U.S. Agricultural Census, 1930-1964
Notes: Ordinary least squares estimates are given for each census year and Huber-White robust standard errors allowing for clustered
errors by state are in parentheses. The panel regression includes county-fixed effects and time dummy variables. The county fixed-
effects are jointly significant at 1 percent level and time dummy variables are positive and statistically significant relative to the left-
out year dummy of 1930. The results are similar with statistically significant and larger coefficients on all variables when the pooled
model is estimated. Fallow share includes fallow and idle land during 1930-1945, and includes only summer fallow acres during 1950-

42
1964. Average farm size is defined as total farmland divided by total number of farms in a given county. For the construction of the
standard deviation of farm size and the discussion on comparability of variables over time see Data Appendix.
a Sample at each year includes Great Plains counties where county level total crop acre percentage is at least 40 percent of the total
farmland.
b The Marginal effect of farm size is calculated at mean farm size. Mean farm size for each year is reported in the first column of
Table 4.
43
Table 4 Estimated Fallow Share at Different Farm Sizes
(A) (B) (C)
Mean Farm Size
Fallow Share (%)
Farm Size at the Mean–plus-One Std. Deviation
Estimates of Fallow Share (%)
Estimate of “Peak” Farm Size
Estimates of Fallow Share (%)
1930 557 5 874 10 1,857 17 1935 512 14 758 24 1,526 36 1940 631 18 976 34 1,479 41 1945 635 11 1,004 21 1,754 28 1950 721 15 1,135 27 1,794 34 1954 778 17 1,227 26 2,378 35 1959 883 19 1,375 33 2,391 42 1964 968 24 1,473 37 2,410 45
Notes: Fallow share calculations are based on the coefficient estimates presented in Table 3. Panels (A) and (B) show the fallow share
as a percentage of total crop acres calculated at the mean farm size and at the farm size of mean-plus-one standard deviation,
respectively. The first column of panel (C) gives the estimates of the “peak” farm size based on the coefficient estimates of the
average farm size and average farm size squared. These are estimates of farm size beyond which no increase in fallow share is
expected as farm size increases. The last column of panel (C) presents the fallow share values based on these “peak” farm size
estimates.

44
Table 5
Wind Erosion Analysis across Great Plains Counties Dependent Variable: Wind Erosion Index (Ranges from 0 to 3, indicating no erosion to severe erosion)
OLS with State Fixed Effects Ordered Probit (1) All
(2) Crop Share ≥ 40 %
(3) All
(4) Crop Share ≥ 40
%
Cultivation Sharea
0.017** (0.006)
0.021*** (0.005)
0.023*** (0.009)
0.024*** (0.008)
Annual Wind Speed
0.201** (0.096)
0.327*** (0.090)
0.046 (0.149)
0.102 (0.175)
Deviation in Rainfall
-0.006 (0.005)
-0.006 (0.005)
-0.024** (0.010)
-0.025** (0.008)
Soil Sand Percentage
0.028*** (0.006)
0.027*** (0.006)
0.022*** (0.007)
0.029*** (0.012)
No. of Observations R2 χ2
362 0.510
285 0.559
362
71.6***
285
55.5*** ** Statistically significant at 5 percent level; *** Significant at 1 percent level.
Sources: Rainfall deviation is from Cronin and Beers (1937, Table 8, 41-54). Annual
average hourly wind velocity is from Chepil, Siddoway, and Armbrust (1962, 163). Sand
percentage by county is from STATSGO data set graciously provided to us by Geoff
Cunfer from the Great Plains Population and Environment Database, 2001, Inter-
University Consortium for Political and Social Research (ICPSR), University of
Michigan. Cultivation share is calculated from 1930 Agricultural Census county-level
measures of farmland, cropland and fallow acres.
Notes: Huber-White robust standard errors are in parentheses. Standard errors of ordered
probit specification are adjusted for clustered errors by state. The threshold parameters of
the ordered probit are correctly ordered and precisely estimated. Columns (1) and (3)
show estimates based on all of the Great Plains counties, and columns (2) and (4) show

45
results from Great Plains counties where county level total crop acre percentage is at least
40 percent of the total farmland. OLS models include state dummy variables, all of which
are positive and statistically significant relative to the left-out state of Oklahoma. For the
detailed descriptions of variable definitions and construction, see the Data Appendix.
a We use the term “cultivated” acres to describe crop acres that do not include fallow or
idle land. Cultivation share is the percent of total county farmland in cultivation (i.e. total
cropland minus fallow or idle land divided by sum of total cropland, including fallow or
idle land, and pasture).

46
Table 6
Predicted Probabilities at Different Values of Cultivation Sharea
Cell
Frequencies Predicted
Probabilities Predicted
Probabilities Predicted
Probabilities Cultivation Share =
65.7 % Cultivation Share =
50.8 % Cultivation Share =
100 % WE = 0 0.13 Prob (WE=0) 0.10 Prob (WE=0) 0.18 Prob (WE=0) 0.02 WE = 1 0.33 Prob (WE=1) 0.35 Prob (WE=1) 0.42 Prob (WE=1) 0.15 WE = 2 0.25 Prob (WE=2) 0.28 Prob (WE=2) 0.24 Prob (WE=2) 0.25 WE = 3 0.29 Prob (WE=3) 0.26 Prob (WE=3) 0.16 Prob (WE=3) 0.58 Notes: Predicted probabilities are based on coefficient estimates of the ordered probit
model for the truncated sample of 285 Great Plain counties as reported in Table 5.
a Cultivation share is the percent of total county farmland in cultivation (i.e. total
cropland minus fallow or idle land divided by sum of total cropland, including fallow or
idle land, and pasture).

47
Table 7 Farm Size Comparisons for SCD Petitioners with County Averages
Soil Conservation
District Average Size of Petitioners
(Acres) Average Farm Size in County
(Acres) Fallon County SCD 2,889 1,511 (1940)
Cascade County SCD 1,452 1,241 (1945) Powder River SCD 3,533 3,381 (1950)
Source: SCD petitioners, Farm Service Agency Files, Helena, Montana. U.S.
Agricultural Censuses, 1940-1950.

48
Figure 1
Wind Erosion in the Great Plains in the 1930s

49
Helpful comments were provided by the editor, the referees, Alban Thomas, Jason Long, Stan Reynolds, Dean Lueck, Dennis Yao, Lee Alston, Steve Salant, Ron Johnson, Joe Ferrie, Greg Crawford, Jackson Nickerson, Marc Law, and seminar participants at the NBER, DAE, Summer Institute, Toulouse Conference on Environment and Resource Economics, U.C. Santa Barbara, Berkeley, UCLA, Yale Law School, and Keio University, Tokyo. Research funding was provided by NSF Grant 9907139, the Earhart Foundation, and the International Center for Economic Research (ICER), Turin, Italy. 1 Farm Security Administration, “The Great Plains Yesterday, Today and Tomorrow,” M.L. Wilson Files, Merrill G. Burlingame Special Collections, 00002, Box 32, Montana State University, Bozeman. 2 Worster (1979), Bonnifield (1979), Hurt (1981) and especially, Gutmann and Confer (1999). Contemporary wind erosion is examined by Colacicco, et al (1989), Williams et al (1993),Ervin and Lee (1994), Pimmental et al (1995), and Smith et al (2000). 3 See Borchert (1971, 5), Hurt (1981, 145-54), Rosenberg (1981, 121), and Changery (1983, 1). Data analyzed by Stout (2001) for Lubbock, Texas indicate a long-term decline in wind erosion from 1961 through 1982 and 1999. 4 Johnson (1947, 135-54), Worster (1979), Kellogg (1935), and Bennett (1939, 729, 738-42). More generally, cultivation practices are viewed as important contributors to erosion (Lee, Wigner, and Gregory, 1993, Lee and Tchakerian,1995). 5 See Frey (1952), Korsching, Stofferahn, Nowak and Wagener (1983), Lee and Stewart (1983), Rahm and Huffman (1984), and Norris and Batie (1987). 6 Gross and Taves (1952), Marsh and Coleman (1955), Pampel and van Es (1977), Napier, Thraen, Gore, and Goe (1984), Nowak (1987), Camboni and Napier (1993), Napier and Sommers (1994), and Ashby (1985). See also the development literature (Berry and Cline, 1979, Feder, 1985, and Cornia, 1985). 7 The analogy is to oil field unitization (Wiggins and Libecap, 1985, and Libecap and Smith, 1999). 8 Economists have not examined the Dust Bowl as a common-pool problem. We use the term, Dust Bowl, to describe wind erosion throughout the Great Plains in the 1930s, rather than focusing on a particular area of intense erosion. 9 Thornthwaite (1936, 240), Bennett (1939, 118), USDA (1938, 71), Yearbook of Agriculture, “Soils and Men.” 10 Worster (1979, 21-23), “The District Program of the Western Baca County Soil Erosion District,” National Archives, Record Group 114, MLR 1176(A1), Box 93. 11 National Archives, Record Group 114, MLR 1, Box 72. 12 Soil erodibility is discussed in Johnson (1947, 193), Chepil (1959), and Woodruff, Lyles, Siddoway, and Fryrear (1972). 13 Memo to the Secretary of Agriculture, August 22, 1933, National Archives, Record Group 114, MLR 1, Box 74, and Memo to H.H. Bennett, Soil Erosion Service, June 5, 1934, Box 4. 14Toy, Foster, and Renard (2002, 44-70, 101, 229), Papendick (1997, 11-12), Hurt (1981, 18), Thornthwaite (1936, 237), and Stallings (1957, 71-83, 129-39, 195-219). 15 Erosion control is addressed in Duly (1951), Fryrear (1963), Heady and Vocke (1978), Moldenhauer, Langdale, Frye, McCool, Papendick, Smika, and Fryrear (1983), and Fryrear and Skidmore (1985), and Bilbro, Fryrear, and Zobeck (1987, 114-20). 16 Kell and Brown (1938, 30-32), Chepil (1959), Craig (1959) and Held and Clawson (1965, 25-7). 17 Stallings (1957, 238-65), Fryrear, (1963), and Woodruff, Lyles, Siddoway, and Fryrear (1972, 4, 13). 18 Chepil (1957, 5-11), Bennett (1939, 361, 763), Stallings (1957, 250-55), and Norwood and Herron (1977). 19 Starch (1939), Halcrow (1938), Cochran (1938), USDA, Bureau of Agricultural Economics, 1941, “Cheyenne Project, Roger Mills County, Oklahoma, National Archives, Southwest Division, Record Group 114, Sp.14, SCS, and Miller, Rodewald, and McElroy (1981, 20-22). Using more contemporary data, Allen and Lueck (1998, 2000) argued that labor monitoring costs rose rapidly in farm sizes beyond that which could be operated by family members. 20 For example, see the property distribution for Musselshell County, Montana in Renne (1935, 425). 21 Hannah (1950), Hines (1952) note a lack of farmer incentive to fallow lands to reduce soil erosion when there were off-site effects.

50
22 Costs are discussed in Barbarika (1987), Crowder and Young (1987, 177-87), and Stults and Strohbehn (1987). 23 See, Bennett and Fowler (1936, 4), Stephens (1937, 751), Boatright (1938), Bennett, Kenney, and Chapline (1938, 68-76), Kimmel (1940, 264), the USDA Yearbook of Agriculture (1940, 409), Huffman and Paschal (1942), and Kraenzel, (1942, 583-6) for complaints about small farmers. Very small farmers with mortgages or tenant payments also may have had less incentive to invest in erosion control because placing land in fallow may have placed them below their budget constraints. 24 A longer version includes a formal model, working paper, Karl Eller Center, University of Arizona 2002. 25 The model is flexible enough for zero fallow shares on some farms, most likely on very small farms. 26 Government commodity policies and other factors may have influenced fallowing decisions. As described later in the text, fallow shares increased generally after the Soil Conservation Districts were created. 27 We take farm size as exogeneous in examining the fallow decision and later in determining the effects of cultivation on wind erosion. Other productivity factors, such as relative factor prices, non-farm income and technology were the major determinants of farm size (Kislev and Peterson, 1982). Initial farm sizes largely were set by the Homestead Act. After 1937, SCDs, which subsidized and occasionally forced the adoption of erosion control, reduced any potential effect of wind erosion and erosion control investments on farm size. We tested for endogeneity of farm size using farm population per 1000 farm acres in 1930 as an instrument for the same sample used in the regression reported in Table 3. The result of the Durbin-Wu-Hausman test indicates no evidence of endogeneity or inconsistency in the OLS estimates. 28 Annual Report, July 1,1935-June 30, 1936, Erosion Control Work Camp, 15-T, Littlefield, Texas, J.T. Reece, Conservation Superintendent, National Archives, Record Group 114, MLR 1176 (A1), Box 28. 29 Chilcott (1937), Bennett (1939, 742, 747), and Simms (1970). 30 National Archives, Ft Worth, Record Group 114, WG 1(A) Box 1, August 1935. 31 For discussion of demonstration farms and the lack of farmer enthusiasm, see Bennett (1939, 361, 737) and Helms (1990, 13-15). 32 Record Group 114, Soil Conservation Service, Box 6, letter Bennett to Duley, August 20, 1935. Bennett (1939, 315-22). Held and Clawson (1965, 49) discuss the problem of non-cooperating farmers. 33 Files for Cheyenne Wells, Colorado; Liberal, Kansas; Clayton, New Mexico; Dalhart, Hereford, Stratford, and Vega Texas at the Southwest Regional National Archives, Ft. Worth, Record Group 114, SP 6 (0), Box 20. 34Green Creek Project, TEX-8, Dublin Texas, 1937, National Archives, Record Group 114, MLR 1001, Box 65, and Dalhart, Tx Project, TEX-3, 1939, National Archives, Record Group 114, MLR 1154, Box 1. There are no figures as to the size distribution of the farms. 35 U.S. Department of Agriculture (1936, 1) and Helms (1992). 36 U.S. Great Plains Committee (1936, 105-7), Wehrwein (1936), and Hockley and Walker (1938). 37 Letter to H.H. Bennett, Chief SCS, 9/4/35, National Archives, Record Group 114, MLR 1, Box 13, Hockley and Walker (1939), and Wehrwein (1936, 312-3). 38 Soil Conservation Service (1937, 14), Colorado Soil Conservation Act, Colorado Laws 1937, c. 241. 39 Soil Conservation District Records, National Archives, Record Group 114, MLR 1001, Box 12. See also, Morgan (1965, 45-51, 333-38, 358-70). 40 Parks (1952, 14-5), Held and Clawson (1965, 47-9), Hurt (1981, 74-7) and Helms (1990, 47, 49). 41 “AAA’s Part in Limiting Farm Family Migration,” National Agricultural Library. 42 “Aid Available to Farmers in Controlling Wind Erosion,” National Agricultural Library. 43 Nace and Pluhowski (1965, 15-21) report that the 1950s drought was as severe or more severe than that of the 1930s, but that wind erosion in the 1930s was much more extensive and damaging. 44 For a summary of common-pool problems, see Libecap (1998). 45 Data were provided by Geoffrey Cunfer and Myron Gutmann from the Great Plains Population and Environment Database. Erosion analysis was provided by Thomas E. Gill and Rick Zartman of Texas Tech University; Gary Tibke and Larry Hagan of Kansas State University; Kent Matsutani, District Conservationist, South Platte NRD; Dale Pekar, National Water Management Center, Little Rock, AR; Nebraska State Conservationist, Steve Chick; Donald Fryrear, Big Spring, Texas, and recommendations for archival sources provided by Douglas Helms, Senior Historian, Natural Resources Conservation Service, USDA.


