Download - Mobile Communications Systems GSM/UMTS/LTE
Mobile Communications Systems
G S M / U M T S / L T E
EEvvaalluuaattiioonn ooff QQuuaalliittyy ooff SSeerrvviiccee
Evaluation of the quality of GSM, UMTS and LTE voice services, data
services and radio network coverage in the Municipalities of Odemira and Vila Flor.
December 2014


Evaluation of Voice Services, Data Services and Network Coverage | Municipalities of Odemira and Vila Flor | September 2014 3
PRIOR NOTE
ANACOM HOLDS NO RESPONSIBILITY FOR ANY ANALYSIS, STUDY OR COMMENTARY
BASED ON THE RESULTS OF THIS REPORT.

Evaluation of Voice Services, Data Services and Network Coverage | Municipalities of Odemira and Vila Flor | September 2014 5
Contents
I Executive Summary ..........................................................................................Error! Bookmark not defined.
I.I General Framework ............................................................................................... Error! Bookmark not defined.
I.II Key Findings and Conclusions ............................................................................... Error! Bookmark not defined.

Evaluation of Voice Services, Data Services and Network Coverage | Municipalities of Odemira and Vila Flor | September 2014 7
I EXECUTIVE SUMMARY
I.I GENERAL FRAMEWORK
In September 2014, Autoridade Nacional de Comunicações (ANACOM) undertook an evaluation of the
quality of the voice and data services and GSM, UMTS and LTE radio network coverage provided by
the following operators in the main urban areas and along the main roads of the Municipalities of
Odemira and Vila Flor: MEO - Serviços de Comunicações e Multimédia, S.A. (MEO), NOS
Comunicações, S.A. (NOS) and VODAFONE PORTUGAL - Comunicações Pessoais, S.A. (Vodafone).
This study is based on field tests conducted with moving vehicles and outdoor antennas, using an
automatic measurement system, reflecting the various aspects that affect quality of services (end-to-end
measurements). Measurements were carried out simultaneously in the same locations and with the
same parameterization for the three operators.
Studies which seek to gauge the user´s perception of quality, such as the present study, are known as
Quality of Experience Studies (QoE), setting out to determine the user experience in terms, for example,
of service accessibility, retention and integrity. In contrast, analyses of Network Performance or Quality
of Service seek to assess the capacity of a network (or a part of a network) to provide a service with a
determined level of quality. This covers functions, mechanisms and procedures implemented by the
cellular network and by terminal equipment, which ensure the provision of the quality of service
negotiated between the terminal equipment and the core network infrastructure.
However, this does not mean that the results of a Quality of Experience Study represents quality as
perceived by an average user or by the majority of users, because such studies are always subject to
the conditions under which they were performed; so, for example, in the case of this study, it is
recognized that, in the most part, data services are not usually accessed outdoors using a laptop
computer connected to the network via a data card and an external antenna (as in the tests conducted).
Therefore, although the present study is a Quality of Experience Study, its analysis may not reflect, in
particular with regard to data services and respective coverage, the actual perception of the majority of
users.
Quality of Experience is usually expressed in terms of human feelings, such as "Excellent", "Good",
"Acceptable", "Poor" and "Bad", while Network Performance is a purely technical concept measured,
8 QoS-Mobile Networks and Services | GSM-UMTS-LTE
expressed and understood in the context of a network or network components, with little meaning as far
as the user is concerned.
To evaluate the voice service, capacity for call establishment and termination was measured, together
with the perceptibility of the communication.
In assessing the data service, an analysis was made of file transfer capacity (FTP upload / download),
Internet navigation (HTTP web browsing) and also transmission latency (ping).
To evaluate radio network coverage, measurements were made of the radio signal levels received by
the mobile terminal equipment (downlink) for each of the technologies used by the operators.
The main quality indicators analyzed for the services covered by the study were as follows:
1. Radio Network coverage - GSM, UMTS and LTE network availability;
2. Accessibility of the Voice Service - probability of success when establishing calls;
3. Voice Call Establishment Time - Length of time taken by the network to establish a
communication after correct submission of the request (destination telephone number);
4. Voice Call Termination Rate - Probability, after a call is successfully established, that it will
remain active for a period of time and terminate normally, i.e. as intended by the user;
5. Voice Call Audio Quality - Perceptibility of the conversation during a call;
6. Termination Rate of Sessions Using the Data Service - Probability that a session using the
data service - file transfer or Internet browsing - is established and is maintained successfully,
i.e., it remains active during the entire period required for the file transfer or to allow the transfer of
the entire web page;
7. Data Transfer Speed - Quantifies the average speed of data transfer during a file transfer
session;
8. Web Page Transfer Time - Quantifies the average time taken to download a reference web
page;
9. Data Transmission Latency - quantifies the time needed for an information packet to travel from
the user´s device to the Content Server or visa versa.
Evaluation of Voice Services, Data Services and Network Coverage | Municipalities of Odemira and Vila Flor | September 2014 9
Fieldwork was conducted, on working days and during normal working hours from 15 to 25 September
2014. 3,169 test calls were performed, 12,808 sessions using data services and 1,736,852
measurements taken of the radio network signal, which corresponds to about 54 hours of
measurements over approximately 2,242 kilometres.
Given the penetration rate of these services, the diversity of terminal equipment used and the very
subjectivity inherent to each user, it is impossible to accurately reproduce the conditions of each
consumer's interaction with the networks. A study of this type cannot be completed without adopting
certain compromises and estimates, within limits which ensure that the results obtained can be viewed
as a reliable indicator of the overall performance of mobile communication systems. The transposition or
extrapolation of the results to specific situations must be done with prudence, at the risk of drawing
conclusions that distort the reality of the situation.
The adopted technical and methodological options directly influence the results and should be taken into
account in their analysis. The following options are particularly relevant:
The testing was conducted exclusively using a technical solution (hardware and software) and
was processed completely automatically, allowing the homogeneous setting of measurement
conditions for the three operators and eliminating any subjectivity inherent to a human user;
The following terminal equipment was used: Nokia C7 and Huawei E392;
The tests were conducted with moving vehicles and outdoor antennas;
The duration of the conversation phase of voice calls was 120 seconds;
Voice and data tests were performed with automatic selection of GSM, UMTS and LTE
infrastructure;
The Servers, used in the data service tests, were hosted in Portugal, in a data centre at FCT -
Fundação para a Ciência e a Tecnologia, I.P. (Foundation for Science and Technology);
In data tests, stable content was used, i.e. web pages and files that had no quantitative or
qualitative changes over time;
File Transfer Tests (FTP upload / download) were performed according to the concept of fixed
data transfer time, i.e., data transfer is performed over a predefined period of time instead of the
full transfer of files of a fixed size;
10 QoS-Mobile Networks and Services | GSM-UMTS-LTE
Radio network coverage indicators, in particular, UMTS and LTE network coverage, did not take
network load into account (number of simultaneous users and type of services used);
The GSM, UMTS and LTE network coverage indicators presented in this study result from the
analysis of the radio channel provided by operators prior to the study´s performance. Due to an
omission by Vodafone, some of the LTE channels of this operator were not analyzed. According
to the operator, these channels were used on a local basis - Zambujeira do Mar, Guarda,
Bragança, Évora and Coimbra -, and this omission had a direct impact on the LTE network
coverage indicator reported for Vodafone in the urban centres of mainland Portugal and on the
statistical significance of this indicator;
In some parts of the Portuguese territory, especially near the Spanish border, performance of the
LTE networks of Portuguese operators was affected by Spanish DTT during the period of testing.
With the shutdown of Spanish transmitters, which occurred in early 2015, the performance of
Portuguese LTE networks in these locations is expected to improve;
The generic test scenario used by ANACOM in this study corresponds to a use of
communications services which is the most favourable given the strength of signal reception on
the mobile terminal device, due to the non-consideration of signal loss because of indoor
environments and due to use of mobile terminal equipment with outdoor antennas. This situation,
is not very significant as far as the Voice Service is concerned, but has significant impact on
Radio Network Coverage and on Data Services, resulting in higher levels of performances than
could be obtained indoors;
The servers used were dedicated exclusively to the performance of these tests, so that, in the context
of the study conducted, there are no limitations on processing power and information storage,
whereby availability and access bandwidth can have a positive influence on the results of the data
transmission speed (as opposed to the results that may be obtained by a general user accessing
conventional servers). Furthermore, the servers used, which function along the same lines as servers
available on the Internet, are identified by the respective IP addresses and not through their FQDN
(Fully Qualified Domain Name), ensuring that the measurements were not negatively affected by DNS
(Domain Name System) resolution problems or caching strategies;
The results of the study only reflect the behaviour of networks in the locations and at the times of
actual measurement;
Operators are continually improving their networks. The technical interventions necessary for
Evaluation of Voice Services, Data Services and Network Coverage | Municipalities of Odemira and Vila Flor | September 2014 11
these improvements can cause momentary degradations of the service in the geographical areas
were work is performed.

Evaluation of Voice Services, Data Services and Network Coverage | Municipalities of Odemira and Vila Flor | September 2014 13
I.II KEY FINDINGS AND CONCLUSIONS
In the municipalities of Odemira and Vila Flor, extensive geographic areas persist with poor or non-
existent radio network coverage, affecting the performance of electronic communications services
supported by the mobile communications systems of the operators MEO, NOS and Vodafone.
The levels of coverage and performance of the services reported in this study are much lower than in
study conducted in the main urban centres and along the main roads of mainland Portugal (conducted
from 30 September to 3 December 2014), with very significant differences observed in performance
between the different operators, technologies and services analyzed.
GSM, UMTS and LTE Radio Network Coverage
The municipalities of Odemira and Vila Flor include extensive geographic areas with poor or non-
existent network coverage.
In the municipality of Odemira (Figure 1), the GSM coverage provided by MEO and NOS is acceptable
overall, while Vodafone provides poor coverage. All operators provide bad UMTS network coverage.
The LTE coverage of MEO and Vodafone is very weak, especially Vodafone´s, while the coverage
provided by NOS is virtually non-existent.
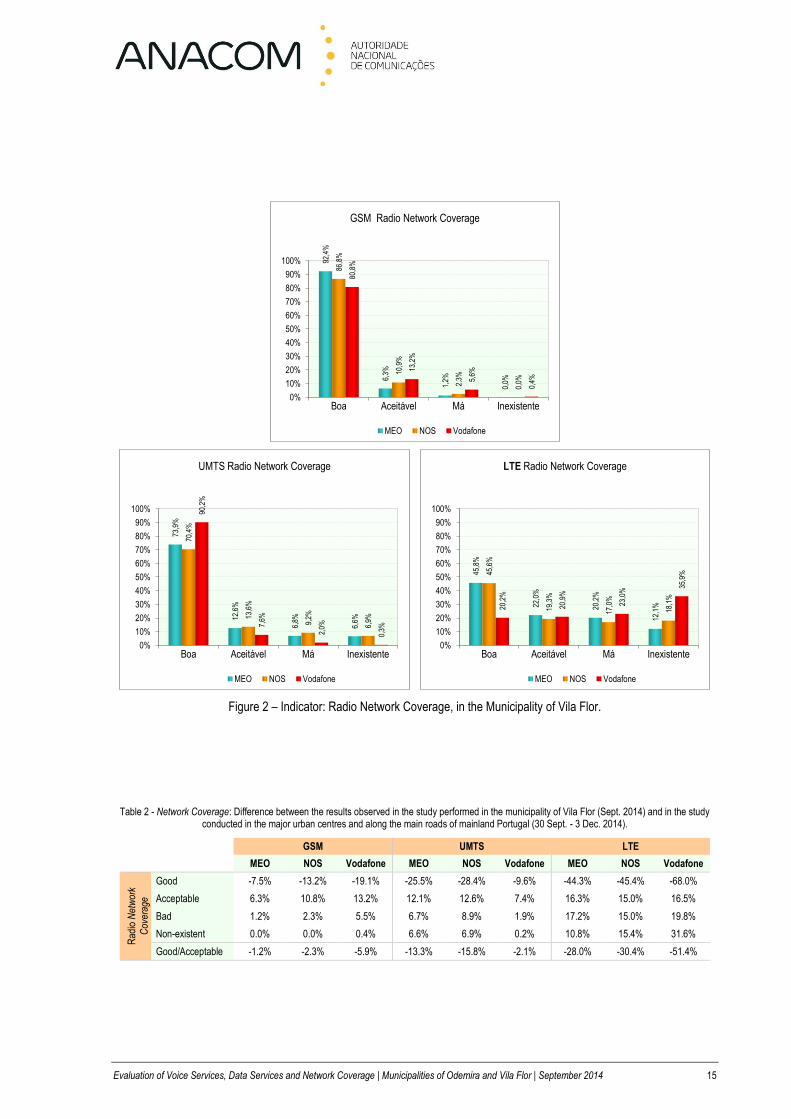
In the municipality of Vila Flor (Figure 2), the GSM coverage provided by MEO and NOS is generally
good and the coverage provided by Vodafone is acceptable. In terms of UMTS, Vodafone provides
good network coverage while MEO and NOS provide poor levels of coverage. LTE coverage is very
weak in this municipality, in particular as provided by Vodafone.
Comparing the results reported in these municipalities with the results obtained in the study conducted
in the main urban centres and along the main roads of mainland Portugal (Table 1 and Table 2), it is
noted that levels of good or acceptable coverage in these municipalities are much lower, especially
when it comes to UMTS and LTE technologies.

14 QoS-Mobile Networks and Services | GSM-UMTS-LTE
Figure 1 – Indicator: Radio Network Coverage, in the Municipality of Odemira.
Table 1 – Radio Network Coverage: Difference between the results observed in the study performed in Odemira (Sept. 2014) and in the study conducted in the major urban centres and along the main roads of mainland Portugal (30 Sept. - 3 Dec. 2014).
GSM UMTS LTE
MEO NOS Vodafone MEO NOS Vodafone MEO NOS Vodafone
Rad
io N
etw
ork
Cov
erag
e
Good -15.1% -18.5% -29.8% -28.7% -32.3% -31.8% -45.9% -86.9% -60.2%
Acceptable 9.9% 12.0% 15.7% 8.4% 11.2% 12.5% 10.7% 5.0% 8.5%
Bad 5.1% 6.1% 12.3% 6.2% 8.7% 9.0% 13.8% 16.0% 15.4%
Non-existent 0.2% 0.4% 1.8% 14.1% 12.4% 10.4% 21.4% 65.9% 36.3%
Good/Acceptable -5.3% -6.5% -14.1% -20.3% -21.1% -19.4% -35.2% -81.9% -51.6%
-------------------- -------------------- -------------------- -------------------- -------------------- -------------------- -------------------- -------------------- --------------------
84,8
%
9,9%
5,1%
0,2%
81,4
%
12,0
%
6,1%
0,4%
70,1
%
15,7
%
12,3
%
1,8%
0%
10%
20%
30%
40%
50%
60%
70%
80%
90%
100%
Boa Aceitável Má Inexistente
GSM Radio Network Coverage
MEO NOS Vodafone
70,7
%
8,9%
6,3%
14,1
%
66,4
%
12,2
%
9,0% 12
,4%
67,9
%
12,6
%
9,0% 10
,5%
0%
10%
20%
30%
40%
50%
60%
70%
80%
90%
100%
Boa Aceitável Má Inexistente
UMTS Radio Network Coverage
MEO NOS Vodafone
44,2
%
16,4
%
16,8
%
22,6
%
4,1% 9,
3%
18,0
%
68,6
%
28,0
%
12,8
%
18,6
%
40,5
%0%
10%
20%
30%
40%
50%
60%
70%
80%
90%
100%
Boa Aceitável Má Inexistente
LTE Radio Network Coverage
MEO NOS Vodafone
Evaluation of Voice Services, Data Services and Network Coverage | Municipalities of Odemira and Vila Flor | September 2014 15
Figure 2 – Indicator: Radio Network Coverage, in the Municipality of Vila Flor.
Table 2 - Network Coverage: Difference between the results observed in the study performed in the municipality of Vila Flor (Sept. 2014) and in the study conducted in the major urban centres and along the main roads of mainland Portugal (30 Sept. - 3 Dec. 2014).
GSM UMTS LTE
MEO NOS Vodafone MEO NOS Vodafone MEO NOS Vodafone
Rad
io N
etw
ork
Cov
erag
e
Good -7.5% -13.2% -19.1% -25.5% -28.4% -9.6% -44.3% -45.4% -68.0%
Acceptable 6.3% 10.8% 13.2% 12.1% 12.6% 7.4% 16.3% 15.0% 16.5%
Bad 1.2% 2.3% 5.5% 6.7% 8.9% 1.9% 17.2% 15.0% 19.8%
Non-existent 0.0% 0.0% 0.4% 6.6% 6.9% 0.2% 10.8% 15.4% 31.6%
Good/Acceptable -1.2% -2.3% -5.9% -13.3% -15.8% -2.1% -28.0% -30.4% -51.4%
-------------------- -------------------- -------------------- -------------------- -------------------- -------------------- -------------------- -------------------- --------------------
92,4
%
6,3%
1,2%
0,0%
86,8
%
10,9
%
2,3%
0,0%
80,8
%
13,2
%
5,6%
0,4%
0%
10%
20%
30%
40%
50%
60%
70%
80%
90%
100%
Boa Aceitável Má Inexistente
GSM Radio Network Coverage
MEO NOS Vodafone
73,9
%
12,6
%
6,8%
6,6%
70,4
%
13,6
%
9,2%
6,9%
90,2
%
7,6%
2,0%
0,3%
0%
10%
20%
30%
40%
50%
60%
70%
80%
90%
100%
Boa Aceitável Má Inexistente
UMTS Radio Network Coverage
MEO NOS Vodafone
45,8
%
22,0
%
20,2
%
12,1
%
45,6
%
19,3
%
17,0
%
18,1
%
20,2
%
20,9
%
23,0
%
35,9
%
0%
10%
20%
30%
40%
50%
60%
70%
80%
90%
100%
Boa Aceitável Má Inexistente
LTE Radio Network Coverage
MEO NOS Vodafone
16 QoS-Mobile Networks and Services | GSM-UMTS-LTE
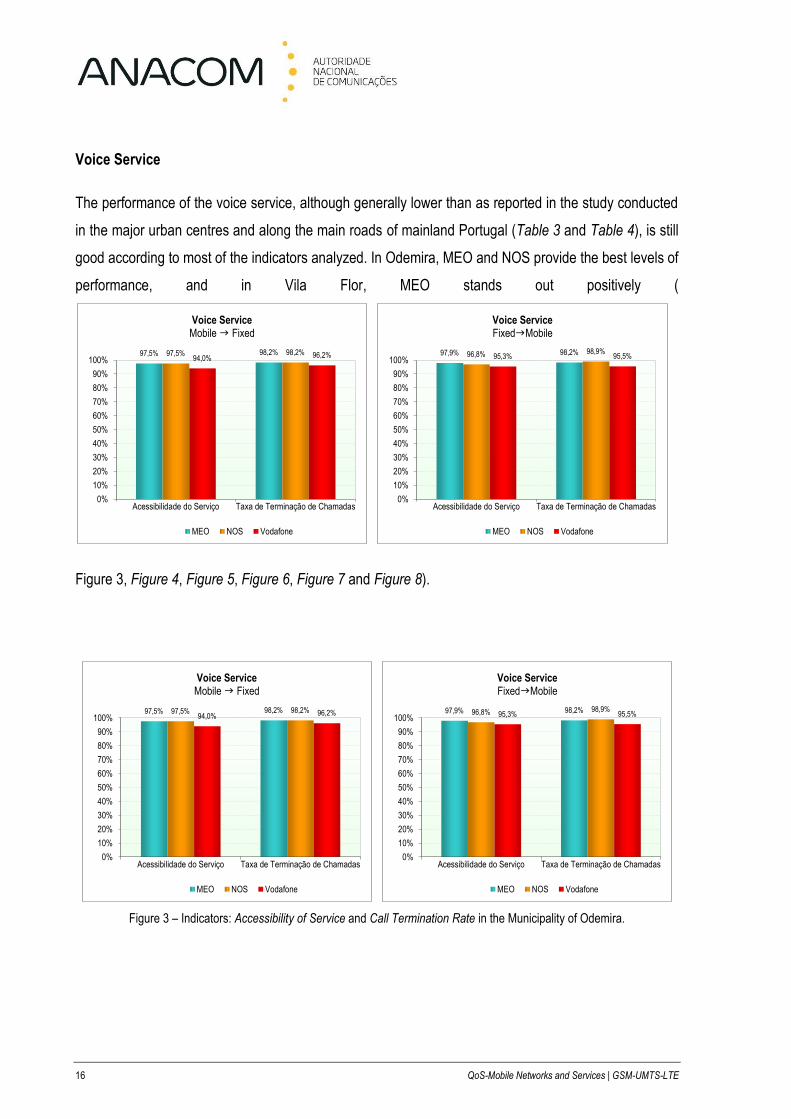
Voice Service
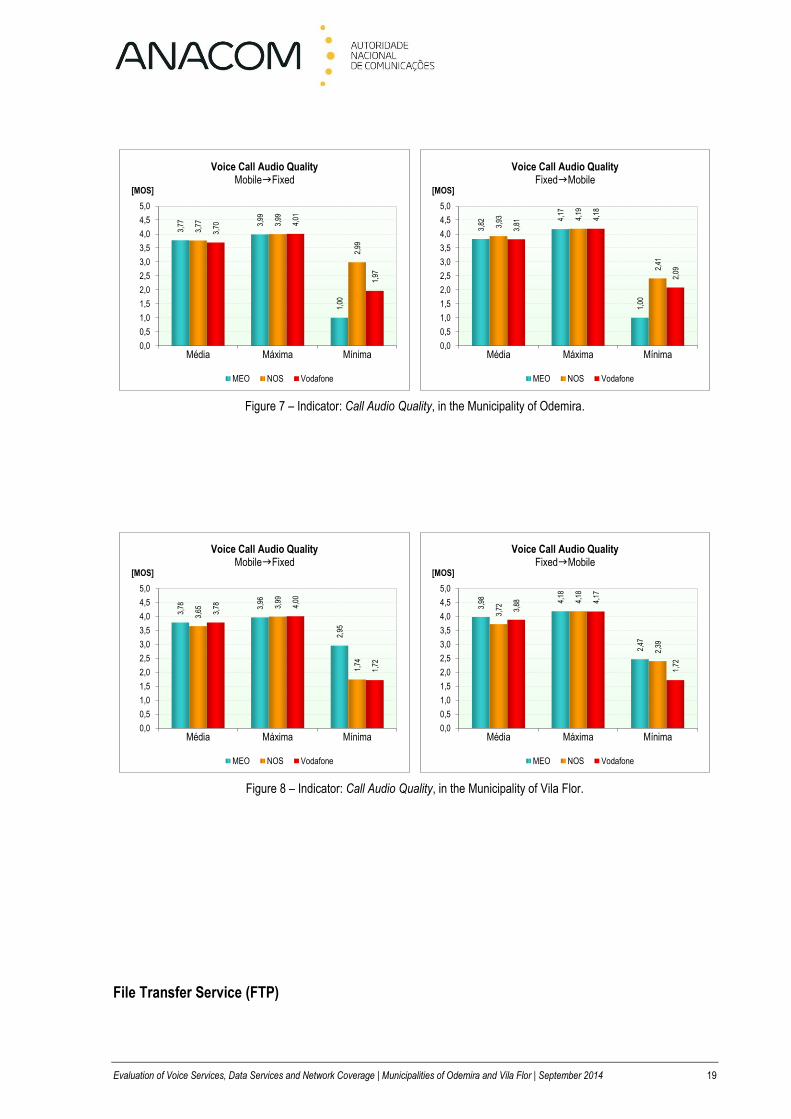
The performance of the voice service, although generally lower than as reported in the study conducted
in the major urban centres and along the main roads of mainland Portugal (Table 3 and Table 4), is still
good according to most of the indicators analyzed. In Odemira, MEO and NOS provide the best levels of
performance, and in Vila Flor, MEO stands out positively (
Figure 3, Figure 4, Figure 5, Figure 6, Figure 7 and Figure 8).
Figure 3 – Indicators: Accessibility of Service and Call Termination Rate in the Municipality of Odemira.
97,5% 98,2%97,5% 98,2%94,0% 96,2%
0%
10%
20%
30%
40%
50%
60%
70%
80%
90%
100%
Acessibilidade do Serviço Taxa de Terminação de Chamadas
Voice ServiceMobile g Fixed
MEO NOS Vodafone
97,9% 98,2%96,8% 98,9%95,3% 95,5%
0%
10%
20%
30%
40%
50%
60%
70%
80%
90%
100%
Acessibilidade do Serviço Taxa de Terminação de Chamadas
Voice ServiceFixedgMobile
MEO NOS Vodafone
Evaluation of Voice Services, Data Services and Network Coverage | Municipalities of Odemira and Vila Flor | September 2014 17
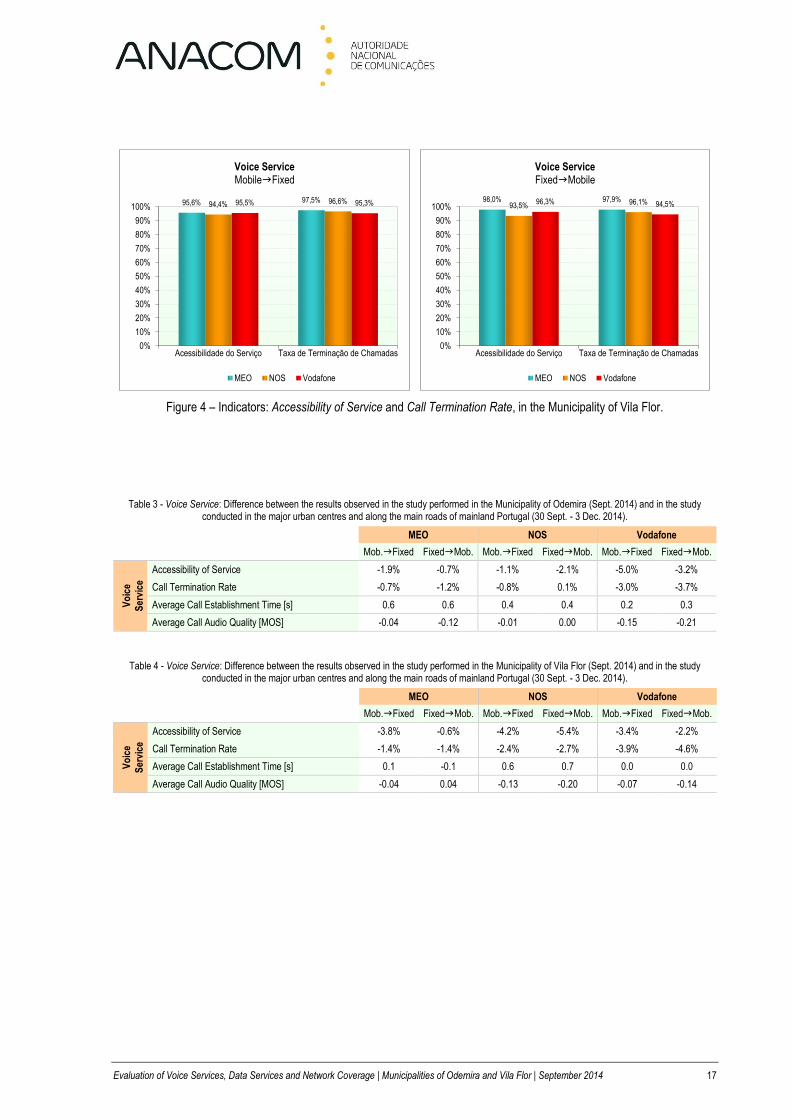
Figure 4 – Indicators: Accessibility of Service and Call Termination Rate, in the Municipality of Vila Flor.
Table 3 - Voice Service: Difference between the results observed in the study performed in the Municipality of Odemira (Sept. 2014) and in the study conducted in the major urban centres and along the main roads of mainland Portugal (30 Sept. - 3 Dec. 2014).
MEO NOS Vodafone
Mob.gFixed FixedgMob. Mob.gFixed FixedgMob. Mob.gFixed FixedgMob.
Vo
ice
Ser
vice
Accessibility of Service -1.9% -0.7% -1.1% -2.1% -5.0% -3.2%
Call Termination Rate -0.7% -1.2% -0.8% 0.1% -3.0% -3.7%
Average Call Establishment Time [s] 0.6 0.6 0.4 0.4 0.2 0.3
Average Call Audio Quality [MOS] -0.04 -0.12 -0.01 0.00 -0.15 -0.21
Table 4 - Voice Service: Difference between the results observed in the study performed in the Municipality of Vila Flor (Sept. 2014) and in the study conducted in the major urban centres and along the main roads of mainland Portugal (30 Sept. - 3 Dec. 2014).
MEO NOS Vodafone
Mob.gFixed FixedgMob. Mob.gFixed FixedgMob. Mob.gFixed FixedgMob.
Vo
ice
Ser
vice
Accessibility of Service -3.8% -0.6% -4.2% -5.4% -3.4% -2.2%
Call Termination Rate -1.4% -1.4% -2.4% -2.7% -3.9% -4.6%
Average Call Establishment Time [s] 0.1 -0.1 0.6 0.7 0.0 0.0
Average Call Audio Quality [MOS] -0.04 0.04 -0.13 -0.20 -0.07 -0.14
95,6% 97,5%94,4% 96,6%95,5% 95,3%
0%
10%
20%
30%
40%
50%
60%
70%
80%
90%
100%
Acessibilidade do Serviço Taxa de Terminação de Chamadas
Voice ServiceMobilegFixed
MEO NOS Vodafone
98,0% 97,9%93,5% 96,1%96,3% 94,5%
0%
10%
20%
30%
40%
50%
60%
70%
80%
90%
100%
Acessibilidade do Serviço Taxa de Terminação de Chamadas
Voice ServiceFixedgMobile
MEO NOS Vodafone
18 QoS-Mobile Networks and Services | GSM-UMTS-LTE
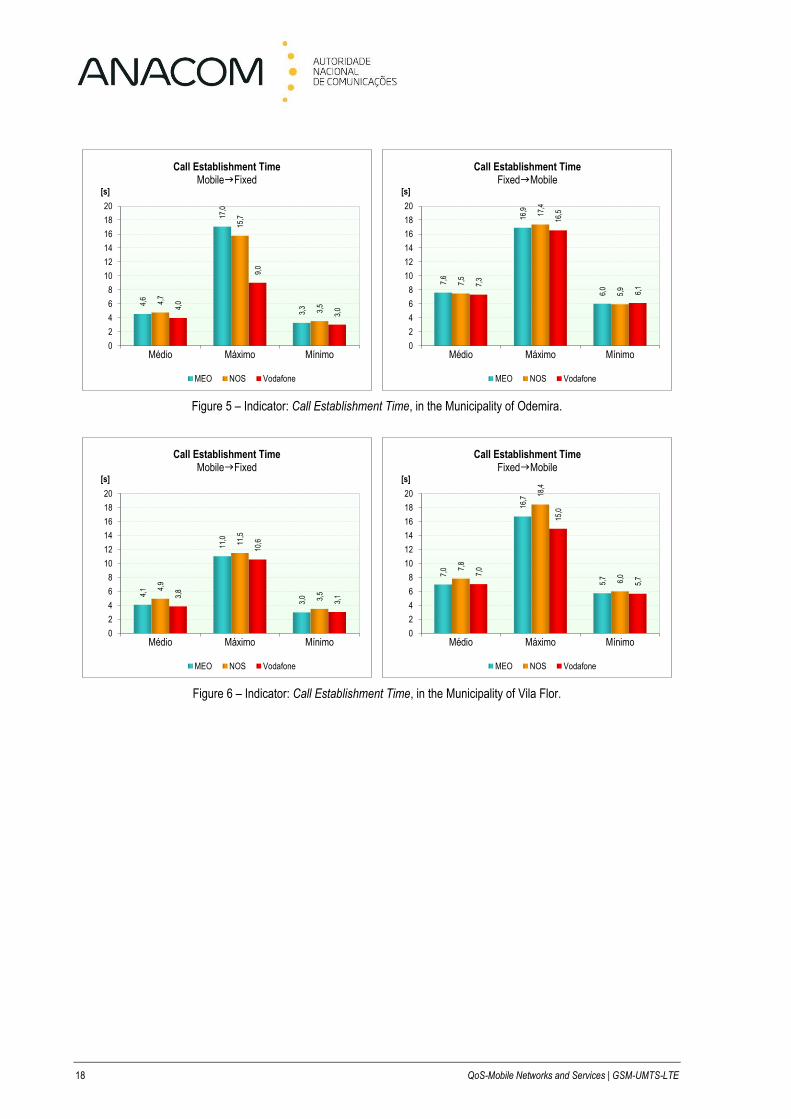
Figure 5 – Indicator: Call Establishment Time, in the Municipality of Odemira.
Figure 6 – Indicator: Call Establishment Time, in the Municipality of Vila Flor.
4,6
17,0
3,3
4,7
15,7
3,54,0
9,0
3,0
0
2
4
6
8
10
12
14
16
18
20
Médio Máximo Mínimo
Call Establishment Time MobilegFixed
MEO NOS Vodafone
[s]
7,6
16,9
6,0
7,5
17,4
5,9
7,3
16,5
6,1
0
2
4
6
8
10
12
14
16
18
20
Médio Máximo Mínimo
Call Establishment Time FixedgMobile
MEO NOS Vodafone
[s]
4,1
11,0
3,0
4,9
11,5
3,53,8
10,6
3,1
0
2
4
6
8
10
12
14
16
18
20
Médio Máximo Mínimo
Call Establishment Time MobilegFixed
MEO NOS Vodafone
[s]
7,0
16,7
5,7
7,8
18,4
6,07,
0
15,0
5,7
0
2
4
6
8
10
12
14
16
18
20
Médio Máximo Mínimo
Call Establishment Time FixedgMobile
MEO NOS Vodafone
[s]
Evaluation of Voice Services, Data Services and Network Coverage | Municipalities of Odemira and Vila Flor | September 2014 19
Figure 7 – Indicator: Call Audio Quality, in the Municipality of Odemira.
Figure 8 – Indicator: Call Audio Quality, in the Municipality of Vila Flor.
File Transfer Service (FTP)
3,77 3,
99
1,00
3,77 3,
99
2,99
3,70 4,
01
1,97
0,0
0,5
1,0
1,5
2,0
2,5
3,0
3,5
4,0
4,5
5,0
Média Máxima Mínima
Voice Call Audio QualityMobilegFixed
MEO NOS Vodafone
[MOS]
3,82
4,17
1,00
3,93 4,
19
2,41
3,81
4,18
2,09
0,0
0,5
1,0
1,5
2,0
2,5
3,0
3,5
4,0
4,5
5,0
Média Máxima Mínima
Voice Call Audio QualityFixedgMobile
MEO NOS Vodafone
[MOS]
3,78 3,
96
2,95
3,65
3,99
1,74
3,78 4,
00
1,72
0,0
0,5
1,0
1,5
2,0
2,5
3,0
3,5
4,0
4,5
5,0
Média Máxima Mínima
Voice Call Audio QualityMobilegFixed
MEO NOS Vodafone
[MOS]
3,98 4,
18
2,47
3,72
4,18
2,39
3,88 4,
17
1,72
0,0
0,5
1,0
1,5
2,0
2,5
3,0
3,5
4,0
4,5
5,0
Média Máxima Mínima
Voice Call Audio QualityFixedgMobile
MEO NOS Vodafone
[MOS]
20 QoS-Mobile Networks and Services | GSM-UMTS-LTE
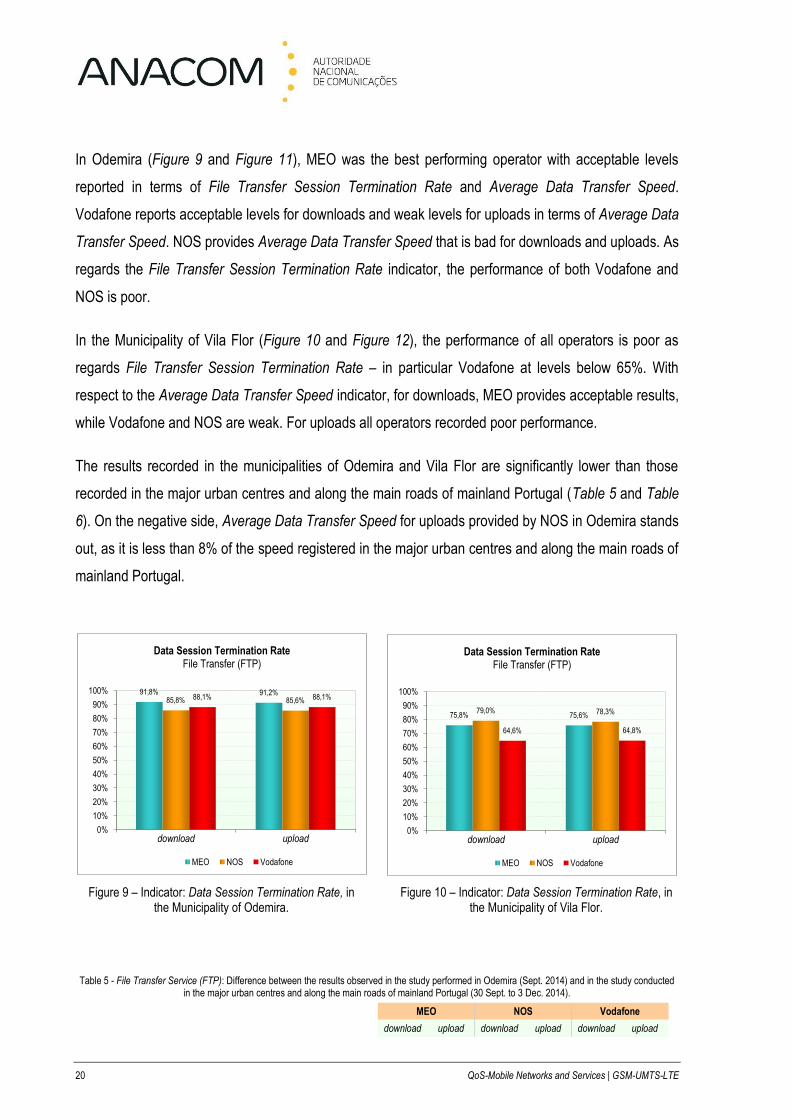
In Odemira (Figure 9 and Figure 11), MEO was the best performing operator with acceptable levels
reported in terms of File Transfer Session Termination Rate and Average Data Transfer Speed.
Vodafone reports acceptable levels for downloads and weak levels for uploads in terms of Average Data
Transfer Speed. NOS provides Average Data Transfer Speed that is bad for downloads and uploads. As
regards the File Transfer Session Termination Rate indicator, the performance of both Vodafone and
NOS is poor.
In the Municipality of Vila Flor (Figure 10 and Figure 12), the performance of all operators is poor as
regards File Transfer Session Termination Rate – in particular Vodafone at levels below 65%. With
respect to the Average Data Transfer Speed indicator, for downloads, MEO provides acceptable results,
while Vodafone and NOS are weak. For uploads all operators recorded poor performance.
The results recorded in the municipalities of Odemira and Vila Flor are significantly lower than those
recorded in the major urban centres and along the main roads of mainland Portugal (Table 5 and Table
6). On the negative side, Average Data Transfer Speed for uploads provided by NOS in Odemira stands
out, as it is less than 8% of the speed registered in the major urban centres and along the main roads of
mainland Portugal.
Figure 9 – Indicator: Data Session Termination Rate, in the Municipality of Odemira.
Figure 10 – Indicator: Data Session Termination Rate, in the Municipality of Vila Flor.
Table 5 - File Transfer Service (FTP): Difference between the results observed in the study performed in Odemira (Sept. 2014) and in the study conducted in the major urban centres and along the main roads of mainland Portugal (30 Sept. to 3 Dec. 2014).
MEO NOS Vodafone
download upload download upload download upload
91,8% 91,2%85,8% 85,6%88,1% 88,1%
0%
10%
20%
30%
40%
50%
60%
70%
80%
90%
100%
download upload
Data Session Termination Rate File Transfer (FTP)
MEO NOS Vodafone
75,8% 75,6%79,0% 78,3%
64,6% 64,8%
0%
10%
20%
30%
40%
50%
60%
70%
80%
90%
100%
download upload
Data Session Termination Rate File Transfer (FTP)
MEO NOS Vodafone
Evaluation of Voice Services, Data and Radio Coverage | Municipalities of Odemira and Vila Flor | September 2014 21
File Transfer (FTP)
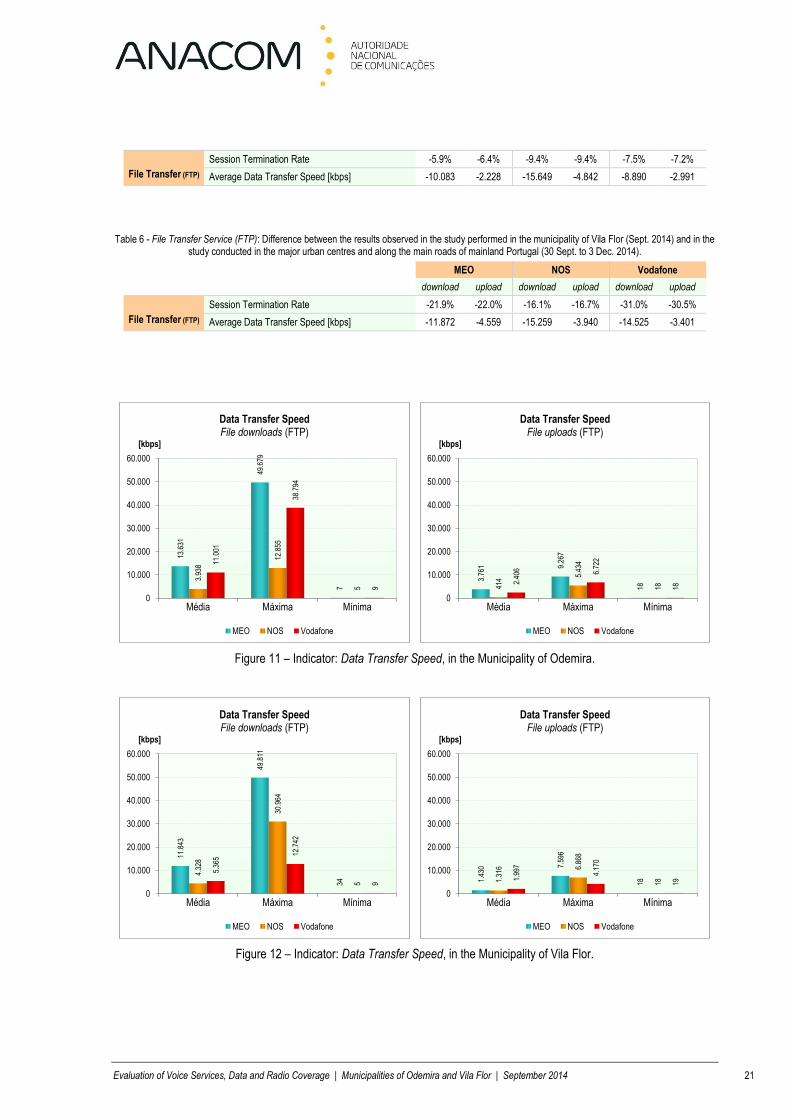
Session Termination Rate -5.9% -6.4% -9.4% -9.4% -7.5% -7.2%
Average Data Transfer Speed [kbps] -10.083 -2.228 -15.649 -4.842 -8.890 -2.991
-------------------- -------------------- -------------------- -------------------- -------------------- --------------------
Table 6 - File Transfer Service (FTP): Difference between the results observed in the study performed in the municipality of Vila Flor (Sept. 2014) and in the study conducted in the major urban centres and along the main roads of mainland Portugal (30 Sept. to 3 Dec. 2014).
MEO NOS Vodafone
download upload download upload download upload
File Transfer (FTP)
Session Termination Rate -21.9% -22.0% -16.1% -16.7% -31.0% -30.5%
Average Data Transfer Speed [kbps] -11.872 -4.559 -15.259 -3.940 -14.525 -3.401
-------------------- -------------------- -------------------- -------------------- -------------------- --------------------
Figure 11 – Indicator: Data Transfer Speed, in the Municipality of Odemira.
Figure 12 – Indicator: Data Transfer Speed, in the Municipality of Vila Flor.
13.6
31
49.6
79
7
3.93
8
12.8
55
5
11.0
01
38.7
94
9
0
10.000
20.000
30.000
40.000
50.000
60.000
Média Máxima Mínima
Data Transfer Speed File downloads (FTP)
MEO NOS Vodafone
[kbps]
3.76
1 9.26
7
18414
5.43
4
18
2.40
6 6.72
2
18
0
10.000
20.000
30.000
40.000
50.000
60.000
Média Máxima Mínima
Data Transfer Speed File uploads (FTP)
MEO NOS Vodafone
[kbps]
11.8
43
49.8
11
34
4.32
8
30.9
64
5
5.36
5
12.7
42
9
0
10.000
20.000
30.000
40.000
50.000
60.000
Média Máxima Mínima
Data Transfer Speed File downloads (FTP)
MEO NOS Vodafone
[kbps]
1.43
0 7.59
6
181.31
6 6.86
8
18
1.99
7
4.17
0
19
0
10.000
20.000
30.000
40.000
50.000
60.000
Média Máxima Mínima
Data Transfer Speed File uploads (FTP)
MEO NOS Vodafone
[kbps]
22 QoS-Mobile Networks and Services | GSM-UMTS-LTE
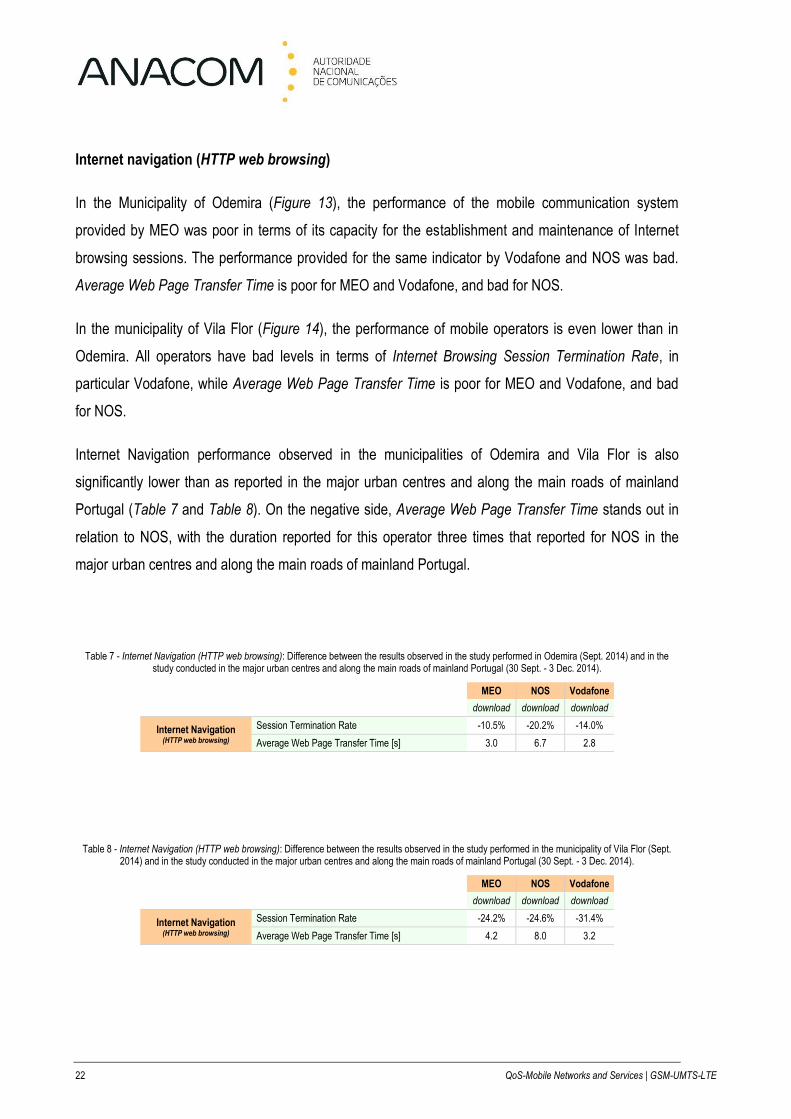
Internet navigation (HTTP web browsing)
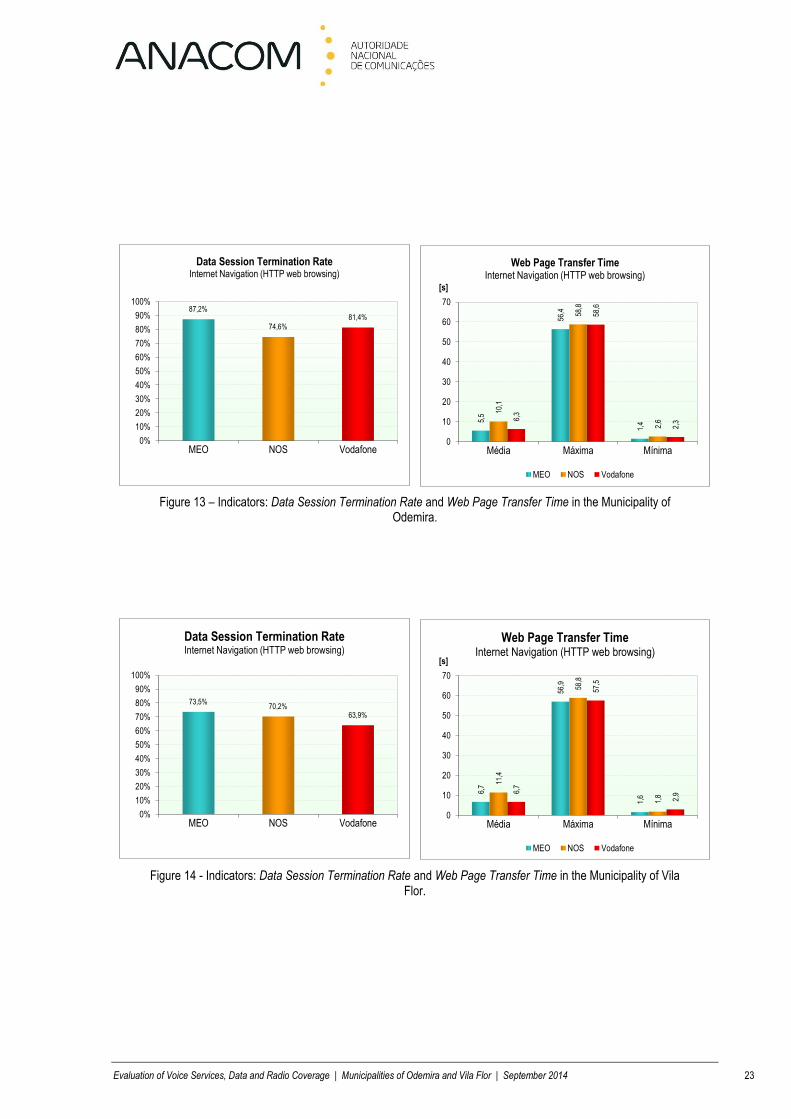
In the Municipality of Odemira (Figure 13), the performance of the mobile communication system
provided by MEO was poor in terms of its capacity for the establishment and maintenance of Internet
browsing sessions. The performance provided for the same indicator by Vodafone and NOS was bad.
Average Web Page Transfer Time is poor for MEO and Vodafone, and bad for NOS.
In the municipality of Vila Flor (Figure 14), the performance of mobile operators is even lower than in
Odemira. All operators have bad levels in terms of Internet Browsing Session Termination Rate, in
particular Vodafone, while Average Web Page Transfer Time is poor for MEO and Vodafone, and bad
for NOS.
Internet Navigation performance observed in the municipalities of Odemira and Vila Flor is also
significantly lower than as reported in the major urban centres and along the main roads of mainland
Portugal (Table 7 and Table 8). On the negative side, Average Web Page Transfer Time stands out in
relation to NOS, with the duration reported for this operator three times that reported for NOS in the
major urban centres and along the main roads of mainland Portugal.
Table 7 - Internet Navigation (HTTP web browsing): Difference between the results observed in the study performed in Odemira (Sept. 2014) and in the study conducted in the major urban centres and along the main roads of mainland Portugal (30 Sept. - 3 Dec. 2014).
MEO NOS Vodafone
download download download
Internet Navigation
(HTTP web browsing)
Session Termination Rate -10.5% -20.2% -14.0%
Average Web Page Transfer Time [s] 3.0 6.7 2.8
-------------------- -------------------- --------------------
Table 8 - Internet Navigation (HTTP web browsing): Difference between the results observed in the study performed in the municipality of Vila Flor (Sept. 2014) and in the study conducted in the major urban centres and along the main roads of mainland Portugal (30 Sept. - 3 Dec. 2014).
MEO NOS Vodafone
download download download
Internet Navigation
(HTTP web browsing)
Session Termination Rate -24.2% -24.6% -31.4%
Average Web Page Transfer Time [s] 4.2 8.0 3.2
-------------------- -------------------- --------------------
Evaluation of Voice Services, Data and Radio Coverage | Municipalities of Odemira and Vila Flor | September 2014 23
Figure 13 – Indicators: Data Session Termination Rate and Web Page Transfer Time in the Municipality of Odemira.
Figure 14 - Indicators: Data Session Termination Rate and Web Page Transfer Time in the Municipality of Vila Flor.
87,2%
74,6%
81,4%
0%
10%
20%
30%
40%
50%
60%
70%
80%
90%
100%
MEO NOS Vodafone
Data Session Termination Rate Internet Navigation (HTTP web browsing)
5,5
56,4
1,4
10,1
58,8
2,66,
3
58,6
2,3
0
10
20
30
40
50
60
70
Média Máxima Mínima
Web Page Transfer TimeInternet Navigation (HTTP web browsing)
MEO NOS Vodafone
[s]
73,5%70,2%
63,9%
0%
10%
20%
30%
40%
50%
60%
70%
80%
90%
100%
MEO NOS Vodafone
Data Session Termination Rate Internet Navigation (HTTP web browsing)
6,7
56,9
1,6
11,4
58,8
1,8
6,7
57,5
2,9
0
10
20
30
40
50
60
70
Média Máxima Mínima
Web Page Transfer TimeInternet Navigation (HTTP web browsing)
MEO NOS Vodafone
[s]
24 QoS-Mobile Networks and Services | GSM-UMTS-LTE
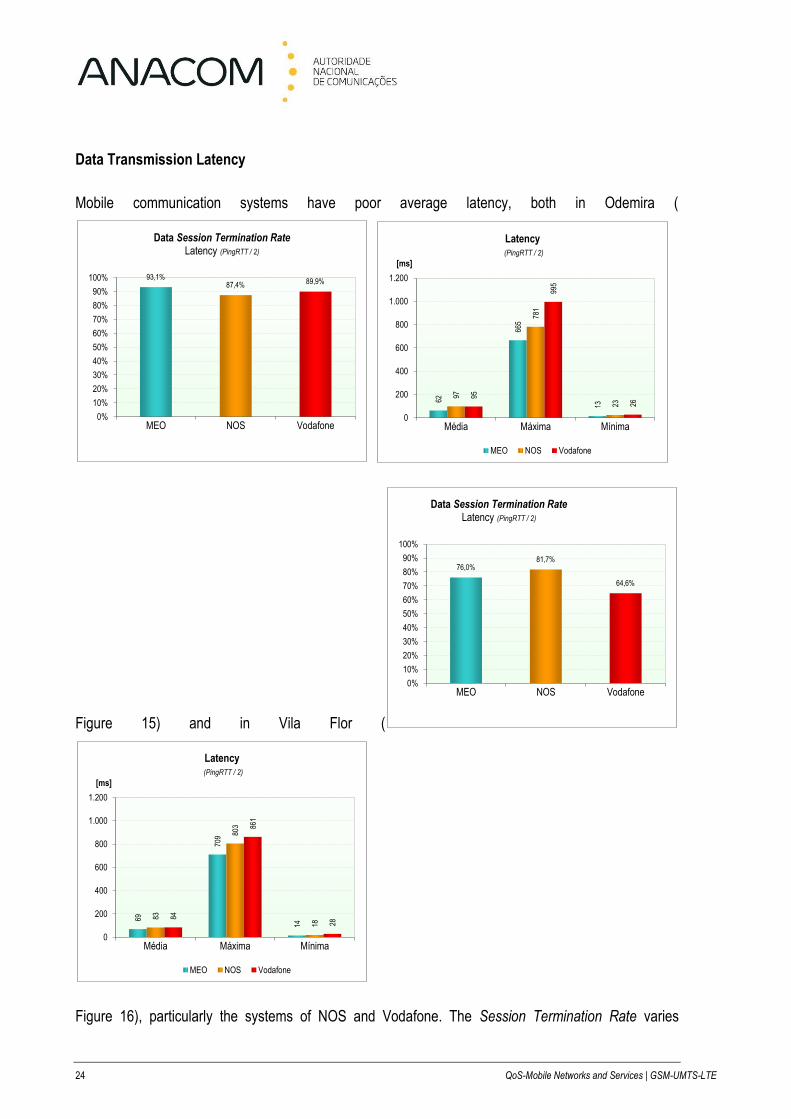
Data Transmission Latency
Mobile communication systems have poor average latency, both in Odemira (
Figure 15) and in Vila Flor (
Figure 16), particularly the systems of NOS and Vodafone. The Session Termination Rate varies
93,1%87,4% 89,9%
0%
10%
20%
30%
40%
50%
60%
70%
80%
90%
100%
MEO NOS Vodafone
Data Session Termination Rate Latency (PingRTT / 2)
62
665
13
97
781
23
95
995
26
0
200
400
600
800
1.000
1.200
Média Máxima Mínima
Latency(PingRTT / 2)
MEO NOS Vodafone
[ms]
76,0%81,7%
64,6%
0%
10%
20%
30%
40%
50%
60%
70%
80%
90%
100%
MEO NOS Vodafone
Data Session Termination Rate Latency (PingRTT / 2)
69
709
14
83
803
18
84
861
28
0
200
400
600
800
1.000
1.200
Média Máxima Mínima
Latency(PingRTT / 2)
MEO NOS Vodafone
[ms]
Evaluation of Voice Services, Data and Radio Coverage | Municipalities of Odemira and Vila Flor | September 2014 25
between acceptable (MEO in Odemira) and poor (NOS and Vodafone in Odemira), and bad (all
operators in Vila Flor).
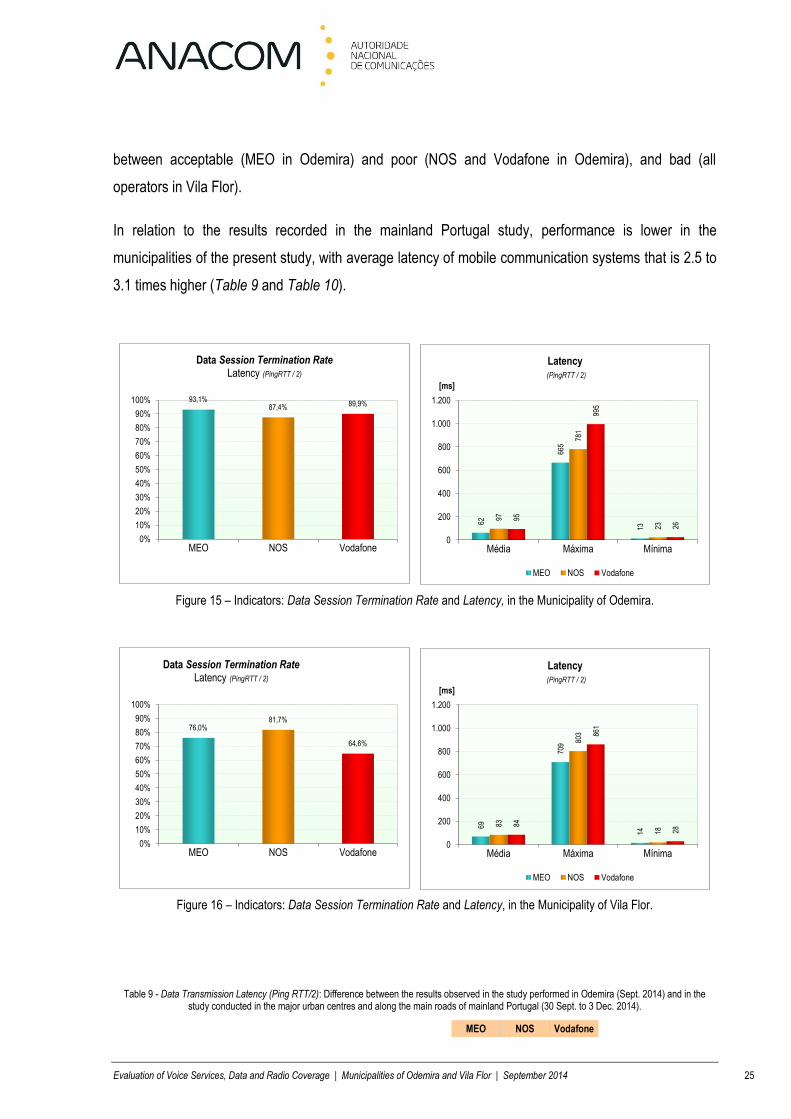
In relation to the results recorded in the mainland Portugal study, performance is lower in the
municipalities of the present study, with average latency of mobile communication systems that is 2.5 to
3.1 times higher (Table 9 and Table 10).
Figure 15 – Indicators: Data Session Termination Rate and Latency, in the Municipality of Odemira.
Figure 16 – Indicators: Data Session Termination Rate and Latency, in the Municipality of Vila Flor.
Table 9 - Data Transmission Latency (Ping RTT/2): Difference between the results observed in the study performed in Odemira (Sept. 2014) and in the study conducted in the major urban centres and along the main roads of mainland Portugal (30 Sept. to 3 Dec. 2014).
MEO NOS Vodafone
93,1%87,4% 89,9%
0%
10%
20%
30%
40%
50%
60%
70%
80%
90%
100%
MEO NOS Vodafone
Data Session Termination Rate Latency (PingRTT / 2)
62
665
13
97
781
23
95
995
26
0
200
400
600
800
1.000
1.200
Média Máxima Mínima
Latency(PingRTT / 2)
MEO NOS Vodafone
[ms]
76,0%81,7%
64,6%
0%
10%
20%
30%
40%
50%
60%
70%
80%
90%
100%
MEO NOS Vodafone
Data Session Termination Rate Latency (PingRTT / 2)
69
709
14
83
803
18
84
861
28
0
200
400
600
800
1.000
1.200
Média Máxima Mínima
Latency(PingRTT / 2)
MEO NOS Vodafone
[ms]
26 QoS-Mobile Networks and Services | GSM-UMTS-LTE
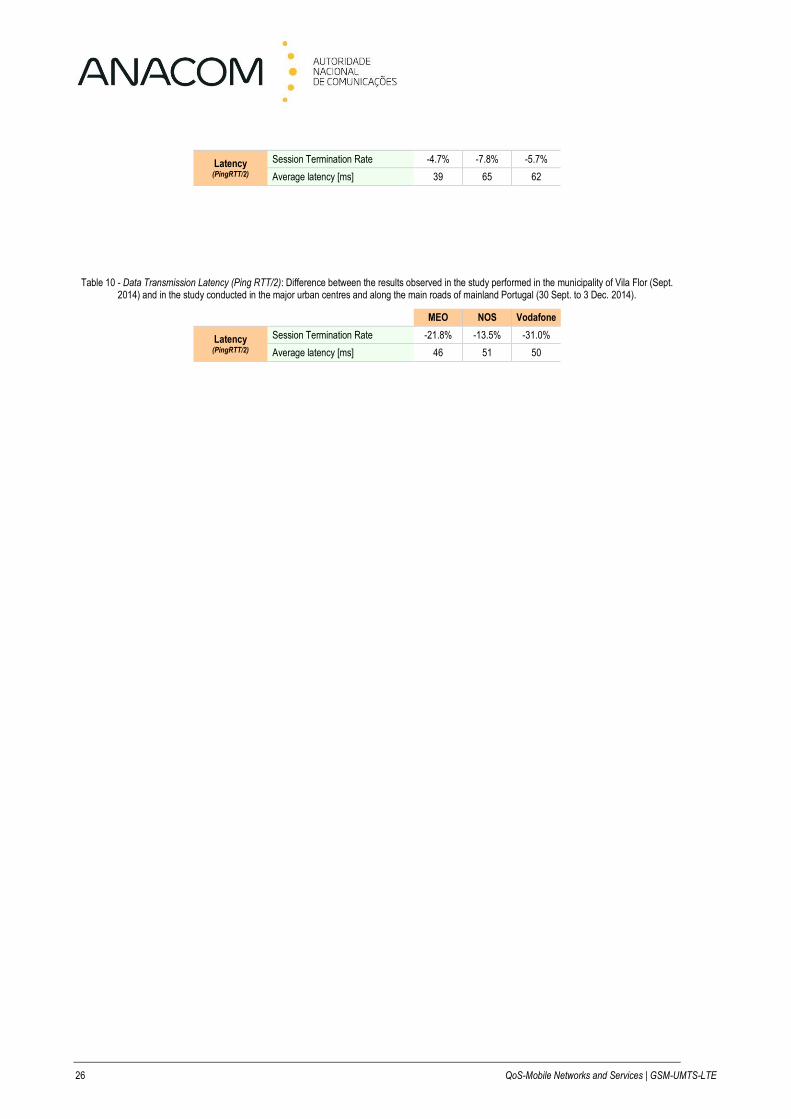
Latency
(PingRTT/2)
Session Termination Rate -4.7% -7.8% -5.7%
Average latency [ms] 39 65 62
-------------------- -------------------- --------------------
Table 10 - Data Transmission Latency (Ping RTT/2): Difference between the results observed in the study performed in the municipality of Vila Flor (Sept. 2014) and in the study conducted in the major urban centres and along the main roads of mainland Portugal (30 Sept. to 3 Dec. 2014).
MEO NOS Vodafone
Latency
(PingRTT/2)
Session Termination Rate -21.8% -13.5% -31.0%
Average latency [ms] 46 51 50
-------------------- -------------------- --------------------


