Market Report: British Columbia
Agrifood and Seafood Exports to
ASEAN
March 2017
Prepared by Corporate Statistics and Research, Ministry of Agriculture

Page | 2 Market Report: B.C. Agrifood and Seafood Exports to ASEAN
Table of Contents
Purpose, Background and Overview ...........................................................................................3
ASEAN and Top Market Profiles ...................................................................................................4
Agrifood and Seafood Exports to ASEAN, 2013-15 ($ Millions) .......................................................... 4
Vietnam .................................................................................................................................................... 6
Philippines ............................................................................................................................................... 6
Singapore……………………………………………………………………………………………………………………………………………7
Thailand……………………………………………………………………………………………………………………………………………..7
Indonesia……………………………………………………………………………………………………………………………………………8
Malaysia……………………………………………………………………………………………………………………………………………..8
Definitions and Notes ...................................................................................................................9

Page | 3 Market Report: B.C. Agrifood and Seafood Exports to ASEAN
Purpose
This report provides an overview of British Columbia’s domestic agrifood and seafood exports
to the Association of Southeast Asian Nations (ASEAN). This research and analysis will assist
the province’s Trade and Investment Representatives operating in ASEAN countries with their
market intelligence, inform British Columbians on the key agrifood and seafood products being
exported from B.C. to ASEAN nations, and will contribute to policy and operational decision
making in agrifood and seafood trade matters between the province and the association.
Background
ASEAN was formed in 1967 with 10 member countries: Thailand, Singapore, Indonesia,
Malaysia, Laos, the Philippines, Myanmar, Brunei, Cambodia, and Vietnam. It is a coveted
market for international business, with ASEAN’s nations exporting over USD $1.1 trillion and
importing over USD $1 trillion in 2015. In a slow-growth world where global GDP grew by 3.2
per cent in 2015, ASEAN’s economy grew by 4.7 per cent in both 2014 and 2015. ASEAN’s
nations as a whole are also home to one of the world’s largest populations, growing every year
since 2012 and reaching almost 629 million people in 2015.1
Canada has significant trade and investment ties to nations in ASEAN. It has Foreign
Investment Protection Agreements with both the Philippines and with Thailand, and has held
exploratory bilateral free trade agreement discussions with both countries as well.2
British Columbia’s agrifood and seafood businesses currently export to every country in
ASEAN and the provincial government has expressed interest in expanding further into these
markets. The Government of British Columbia currently has Trade and Investment
Representatives offices in Jakarta, Indonesia, and in Manila, the Philippines, with a third
planned for Johor Bahru, Malaysia in 2017. The Jakarta office also manages B.C.’s trade and
investment with Singapore.
Overview
B.C. exported CAD $3.5 billion worth of agrifood and seafood products to 159 markets in 2015.
Of this, $74.2 million was exported to ASEAN countries, comprising 2.1 per cent of all exports.
B.C.’s agrifood and seafood exports to ASEAN declined by 6.4 per cent in 2015 as increases in
agrifood exports (4.0%) were offset by declines in seafood exports (-25.2%). The top market in
the association was Vietnam ($29.4 million), followed by the Philippines ($14.1 million), and
Singapore ($13.7 million). The top product exported to any ASEAN nation was geoduck clams
exported to Vietnam, valued at $10.7 million—an increase of 109 per cent from 2014.

Page | 4 Market Report: B.C. Agrifood and Seafood Exports to ASEAN
ASEAN and Top Market Profiles
Agrifood and Seafood Exports to ASEAN, 2013-15 ($ Millions)
Agrifood and Seafood Exports by Value
Product Type 2013 2014 2015 14-15 Growth
Agrifood $52,455,280 $50,980,113 $53,041,166 4.0%
Seafood $9,619,873 $28,297,948 $21,172,412 -25.2%
Total $62,075,153 $79,278,061 $74,213,578 -6.4%
Source: Statistics Canada, CATSNET Analytics (December 2016)
62
79 74
53 51 53
10
28
21
0
10
20
30
40
50
60
70
80
90
2013 2014 2015
Total Agrifood Seafood

Page | 5 Market Report: B.C. Agrifood and Seafood Exports to ASEAN
British Columbia Agrifood and Seafood Exports to
ASEAN ($ Millions)
Rank Country Agrifood Exports
2015
Seafood Exports
2015
Total Agrifood
& Seafood
Exports 2015
2014-15
Growth
1 Vietnam $12,487,021 $16,874,637 $29,361,658 7.3%
2 Philippines $13,943,036 $148,324 $14,091,360 -7.9%
3 Singapore $11,479,881 $2,227,287 $13,707,168 30.0%
4 Thailand $5,687,577 $1,013,824 $6,701,401 -32.0%
5 Indonesia $5,388,221 $568,893 $5,957,114 0.6%
6 Malaysia $3,310,275 $274,543 $3,584,818 -63.0%
7 Myanmar $520,196 $0 $520,196 9.9%
8 Brunei $176,612 $0 $176,612 49.8%
9 Laos $0 $64,904 $64,904 100.0%
10 Cambodia $48,347 $0 $48,347 6.8%
Total $53,041,166 $21,172,412 $74,213,578 -6.4%
Source: Statistics Canada, CATSNET Analytics (December 2016)

Page | 6 Market Report: B.C. Agrifood and Seafood Exports to ASEAN
Vietnam__________________________________________________________
Agrifood and Seafood Exports by Value
Product Type 2013 2014 2015 14-15 Growth 2015 Share of
ASEAN Total
Agrifood $9,977,346 $8,835,375 $12,487,021 41.3% 23.5%
Seafood $5,091,440 $18,518,364 $16,874,637 -8.9% 79.7%
Total $15,068,786 $27,353,739 $29,361,658 7.3% 39.6%
Top Products in 2015 by Value
Product 2013 2014 2015 14-15 Growth
Geoduck Clams $2,861,189 $5,098,527 $10,653,685 109.0%
Tobacco $2,992,790 $1,629,860 $3,394,050 108.2%
Shrimp & Prawns $145,128 $7,182,884 $2,391,806 -66.7%
Apples $405,027 $1,034,754 $2,222,608 114.8%
Cherries $532,822 $1,290,486 $1,842,730 42.8%
Clams $134,959 $1,867,459 $654,967 -64.9%
Philippines___________________________________________________________________________
Agrifood and Seafood Exports by Value
Product Type 2013 2014 2015 14-15 Growth 2015 Share of
ASEAN Total
Agrifood $21,430,449 $15,196,674 $13,943,036 -8.3% 26.3%
Seafood $43,927 $100,308 $148,324 47.9% 0.7%
Total $21,474,376 $15,296,982 $14,091,360 -7.9% 19.0%
Top Products in 2015 by Value
Product 2013 2014 2015 14-15 Growth
Poultry $13,909,769 $9,736,180 $5,371,298 -44.8%
Food Preparations for
Manufacturing & Natural
Health Products
$860,631 $1,707,076 $2,473,056 44.9%
Pork $4,084,456 $2,060,624 $2,358,867 14.5%
Herring $0 $11,117 $8,775 -21.1%
Source: Statistics Canada, CATSNET Analytics (December 2016)

Page | 7 Market Report: B.C. Agrifood and Seafood Exports to ASEAN
Singapore _____ __
Agrifood and Seafood Exports by Value
Product Type 2013 2014 2015 14-15 Growth 2015 Share of
ASEAN Total
Agrifood $6,733,406 $7,813,974 $11,479,881 46.9% 21.6%
Seafood $2,408,460 $2,726,933 $2,227,287 -18.3% 10.5%
Total $9,141,866 $10,540,907 $13,707,168 30.0% 18.5%
Top Products in 2015 by Value
Product 2013 2014 2015 14-15 Growth
Food Preparations for
Manufacturing & Natural
Health Products
$2,785,912 $3,299,281 $3,194,306 -3.2%
Cherries $958,435 $1,410,840 $2,098,010 48.7%
Animal Feed Preparations $24,208 $31,255 $1,418,400 4438.2%
Oysters $1,452,309 $1,412,481 $1,247,436 -11.7%
Crabs $425,689 $875,081 $849,991 -2.9%
Sea Urchins $2,350 $1,321 $31,759 2304.2%
Thailand ___________________________________
Agrifood and Seafood Exports by Value
Product Type 2013 2014 2015 14-15 Growth 2015 Share of
ASEAN Total
Agrifood $2,013,486 $3,753,896 $5,687,577 51.5% 10.7%
Seafood $1,386,347 $6,100,482 $1,013,824 -83.4% 4.8%
Total $3,399,833 $9,854,378 $6,701,401 -32.0% 9.0%
Top Products in 2015 by Value
Product 2013 2014 2015 14-15 Growth
Cherries $995,465 $1,384,807 $2,898,586 109.3%
Food Preparations for
Manufacturing & Natural
Health Products
$197,667 $777,080 $753,157 -3.1%
Apples $0 $60,457 $610,118 909.2%
Pink Salmon $937,823 $1,657,482 $329,983 -80.1%
Herring $0 $476,148 $308,944 -35.1%
Sockeye Salmon $52,577 $3,934,780 $241,687 -93.9%
Source: Statistics Canada, CATSNET Analytics (December 2016)
Page | 8 Market Report: B.C. Agrifood and Seafood Exports to ASEAN
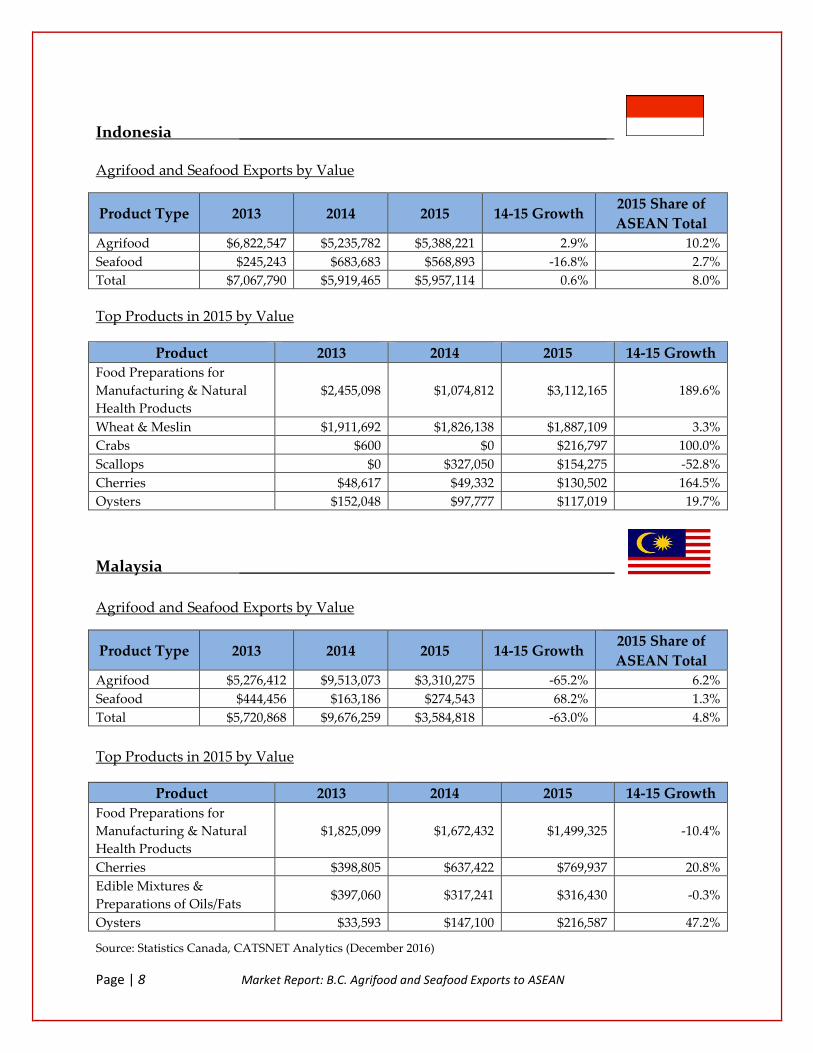
Indonesia ______________________________________________
Agrifood and Seafood Exports by Value
Product Type 2013 2014 2015 14-15 Growth 2015 Share of
ASEAN Total
Agrifood $6,822,547 $5,235,782 $5,388,221 2.9% 10.2%
Seafood $245,243 $683,683 $568,893 -16.8% 2.7%
Total $7,067,790 $5,919,465 $5,957,114 0.6% 8.0%
Top Products in 2015 by Value
Product 2013 2014 2015 14-15 Growth
Food Preparations for
Manufacturing & Natural
Health Products
$2,455,098 $1,074,812 $3,112,165 189.6%
Wheat & Meslin $1,911,692 $1,826,138 $1,887,109 3.3%
Crabs $600 $0 $216,797 100.0%
Scallops $0 $327,050 $154,275 -52.8%
Cherries $48,617 $49,332 $130,502 164.5%
Oysters $152,048 $97,777 $117,019 19.7%
Malaysia _______________________________________________
Agrifood and Seafood Exports by Value
Product Type 2013 2014 2015 14-15 Growth 2015 Share of
ASEAN Total
Agrifood $5,276,412 $9,513,073 $3,310,275 -65.2% 6.2%
Seafood $444,456 $163,186 $274,543 68.2% 1.3%
Total $5,720,868 $9,676,259 $3,584,818 -63.0% 4.8%
Top Products in 2015 by Value
Product 2013 2014 2015 14-15 Growth
Food Preparations for
Manufacturing & Natural
Health Products
$1,825,099 $1,672,432 $1,499,325 -10.4%
Cherries $398,805 $637,422 $769,937 20.8%
Edible Mixtures &
Preparations of Oils/Fats $397,060 $317,241 $316,430 -0.3%
Oysters $33,593 $147,100 $216,587 47.2%
Source: Statistics Canada, CATSNET Analytics (December 2016)

Page | 9 Market Report: B.C. Agrifood and Seafood Exports to ASEAN
Definitions and Notes
“Domestic exports” includes all goods grown, produced, extracted or manufactured in
British Columbia and leaving the province (through customs) for a foreign destination.
Exports of imported merchandise that have been substantially enhanced in value are
also included.
“Agrifood” includes agrifood products produced by farmers, growers and ranchers in
British Columbia, as well as products manufactured by B.C.’s food, beverage and
tobacco processors. Agrifood does not include any seafood, fish, shellfish or marine
plant products.
“Seafood” includes fish, shellfish and marine plants and their products harvested or
cultured in British Columbia marine and freshwater as well as seafood products
manufactured by B.C.’s food processors.
“Food Preparations for Manufacturing and Natural Health Products” includes pastes,
powders and flavourings used by food manufacturers, as well as natural health
products.
Note on the Export Data:
Export data provided in the “Agrifood” analysis has been revised from raw data released by
Statistics Canada to account for apparent discrepancies regarding exports of soya beans,
rapeseed/canola oil and oilcakes that are believed to come from other Canadian provinces.
Therefore, the total export values for B.C. “Agrifood” provided in this analysis have been
reduced by $28.0 million in 2013, $47.8 million in 2014 and $59.5 million in 2015. The Ministry of
Agriculture is working with Statistics Canada to investigate these discrepancies.

Page | 10 Market Report: B.C. Agrifood and Seafood Exports to ASEAN
ENDNOTES
1 “Selected basic ASEAN indicators”, ASEAN, http://asean.org/storage/2015/09/Summary-table_as-of-
Aug-2016-rev.pdf, accessed December, 2016.
2 “Canada-ASEAN Trade and Investment,” Global Affairs Canada,
http://www.international.gc.ca/asean/trade_investment-commerce_investissement.aspx?lang=eng,
accessed December, 2016.
CONTACT INFORMATION
For more information on B.C. agrifood and seafood please contact:
AgriService BC
Telephone: 1-888-221-7141
Email: [email protected]
March 2017


