Download - IPG - London Portfolio Analysis - 2016

LONDON PORTFOLIO ANALYSIS
2009-2013
UK MARKET UPDATE 2016

CONTENTSForeword 2
A shifting investment story 3
UK Market Overview 2005-2015 4
A look back 5
The world’s leading asset class 6
Capital outperformance 8
The London premium? 10
IP Global London Portfolio Analysis 2009-2013 12
Top 10 IP Global Projects 14
Leveraged vs unleveraged 17
Property location 18
Property size 18
Rental yield performance 19
Investment hotspot: Islington 20
Where next for IP Global? 22
Ripple effect 23
Outer London: flight to affordability 24
Investment hotspot: Sutton 25
Beyond London? 26
Investment hotspot: Manchester 28
Reflection 29
Methodology and disclaimer 30
Get in touch 31

A decade of success
This year marks a decade since IP Global was founded. In this time we have overcome a number of challenges, weathering a global recession to build our reputation as a trailblazing international property investment firm.
From the start, we have strived to change the way the world sees global property investment, putting it on a level footing with any other recognised asset class. Today we are proud to have supported our clients to invest USD2.3 billion across 30 markets.
Ten years since the journey began, we are reflecting on how it all started. This special report examines our history of investment activity in a key global investment market: London.
Today, the UK property market is top of many investors’ wish lists, but it wasn’t always this way. Our founders were bold, believing – in the dark days of 2008/2009 – that London’s property market presented a huge opportunity. Reflecting on the combined GBP116 million in capital appreciation that those who invested with us in London between 2009-2013 have achieved, we were right.
This report is based on an analysis of valuation data from all forty-five IP Global London projects launched between 2009-2013. From this, we have been able to draw conclusions about what has worked best in the UK capital over the past seven years and why. We have also examined the attributes that have made UK and London property so attractive to investors, as well as taking a look at our present and future investment strategy.
Please feel free to get in touch if you have any comments or questions,
Elizabeth ChuHead of Investment, IP Global
A SHIFTING INVESTMENT STORY
London zones 1 and 2 undervalued post-recession
ZONE 2
ZONE 1
Price growth pushes demand outwards
ZONE 2
ZONE 1
ZONE 3 AND REGIONAL CITIES
Flight to affordability drives investors to Outer London and regional UK cities
2009
20132014
2010201 12012
20152016
FOREWORD
20172018

4
The UK, and in particular London, has emerged in the past ten years as one of the world’s leading markets for residential real estate investment. A strong and stable economy, an increasing population and a systemic housing supply shortfall have driven up prices, particularly in the capital.
Whether measured against the performance of other world property markets or the performance of traditional investment assets, property in London and the UK has become the favoured asset for those seeking steady, sustainable growth over the medium-to-long term.
A LOOK BACK
UK MARKET OVERVIEW2005-2015

Property is one of the most secure and reliably-performing asset classes. Within this sector, residential real estate is often an under-exploited investment segment among traditional high-net-worth investors.
House prices around the world are currently growing at their fastest rate since before the global financial crisis, with average price growth hitting 3.7% in 2015, up from a low of -4.6% in 2009.
House prices in the UK moved back into positive growth territory in 2013, growing by 14.9% over the course of 2014/2015. This represents an acceleration that has firmly justified the confidence of investors who continued to pour capital into the UK property market in the wake of the recession.
The UK is part of a small selection of global property markets that have earned the status of “safe haven” among international property investors. The national economy has proven itself to be resilient and investors are rightly confident in the UK property market’s capacity to deliver steady rewards with a comparatively low level of risk.
THE WORLD’S LEADING ASSET CLASS
STEADYREWARD
The steady upward performance of the London property market over the past decade illustrates the stability of property over more traditional, and often more volatile assets such as stocks, bonds or commodities.
In the wake of the financial crisis, London property dipped less and rebounded more quickly than other asset classes. The
COMPARING ASSET CLASSES
market subsequently recorded steady growth to surpass it's previous high-point as early as 2012.
Meanwhile, commodity prices sank to their lowest levels in over a decade in 2015, while the FTSE 100 has only recently returned to its pre-financial crisis levels and is currently declining.
8
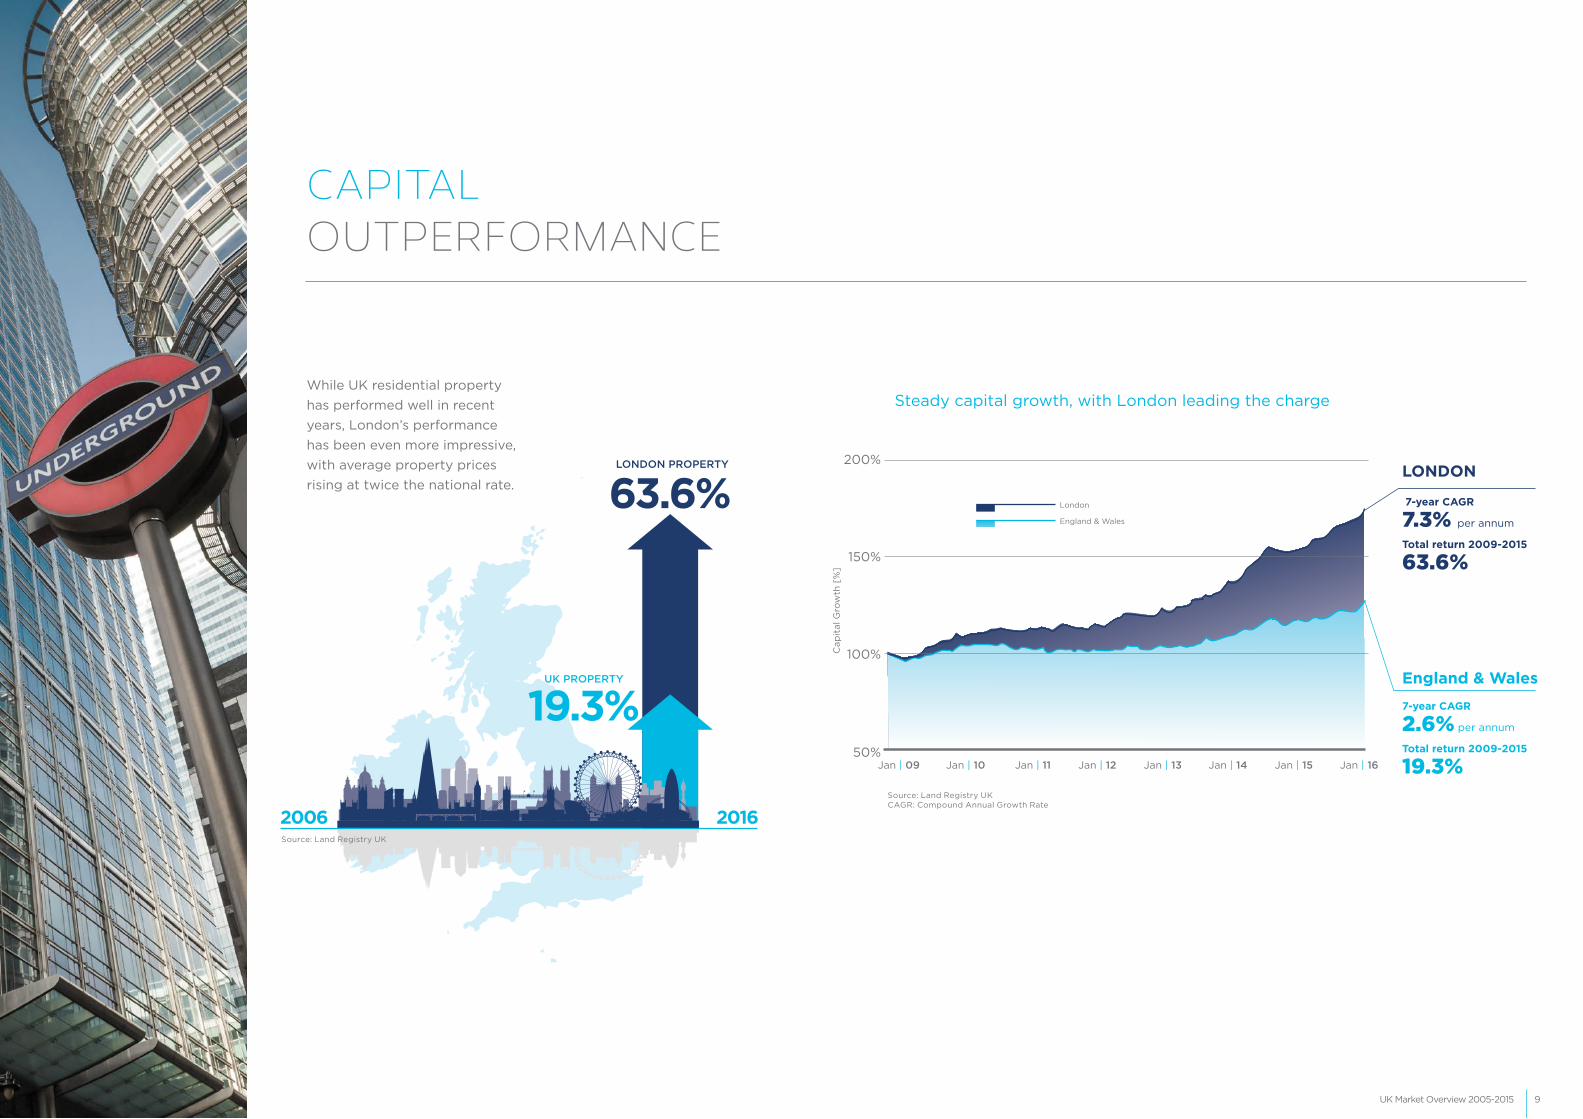
While UK residential property has performed well in recent years, London’s performance has been even more impressive,with average property pricesrising at twice the national rate.
CAPITAL OUTPERFORMANCE
2006
63.6%LONDON PROPERTY
2016
Steady capital growth, with London leading the charge
19.3%UK PROPERTY
LONDON
7-year CAGR
7.3% per annum
Total return 2009-2015
63.6%
England & Wales7-year CAGR
2.6% per annum
Total return 2009-2015
19.3%Source: Land Registry UKCAGR: Compound Annual Growth Rate
Source: Land Registry UK

This strong historic performance has turned London into the world’s second-most expensive housing market, behind only Hong Kong and now significantly ahead of third-placed New York. While the natural ebb and flow of market trends will no doubt influence this ranking in the years ahead, it remains highly unlikely that London will lose its position near the top of the table.
Yields on the rise?
This price escalation has been so extreme that the government has enacted several measures over recent years in an attempt to curb it and encourage first-time buyers, such as a Capital Gains Tax for foreign investors and the more recent implementation of a 3% Stamp Duty Land Tax surcharge for buy-to-let properties and second homes.
THE LONDON PREMIUM?
While at first glance these may appear to be contrary to investor interests, we believe these measures to be good for the long-term sustainability of the market. Furthermore, they may also drive yields up as landlords offset their higher taxes by raising rents.
Ripple effect
London housing remains one of the world’s most attractive
10 Most Expensive Residential Markets (Average Property Price in USD per square foot)
HONG KONG$1,411
LONDON
$1,025NEW YORK
$842PARIS
$827EDINBURGH
$512ROME
$528MILAN
$549LOS ANGELES
$671TOKYO
$771SINGAPORE
$817
Prices converted from GBP to USD. Exchange rates as of Q2 2015. Source: CBRE Living: A City-by-City Guide, 2015.
asset classes, continuing to record steady capital growth in spite of record-high prices. However, the search for value and affordability beyond prime central London is becoming increasingly important for investors.
In searching for affordability and future growth potential, investors have more recently focused
For the average Londoner:
26years to save a 10% deposit
of monthly salary is spent on rent
61.5%
on specific locations that present ‘pockets of value’. Created by strong micro-economies, regeneration and infrastructure investment and localised population growth, these narrowly defined parts of the city, typically found in Zones 3 and beyond, will continue to redefine property investment in London in the next few years.

12
The following pages reveal the performance of IP Global’s London Portfolio of forty-five projects launched between 2009 to 2013. The analysis is based on current indicative value data provided by Savills in April 2016, who undertook an independent study on our behalf using market evidence on comparable properties. For the purposes of this report we have focused on those projects that IP Global
ABOUT THIS ANALYSIS
IP GLOBALLONDON PORTFOLIO ANALYSIS2009-2013
launched between 2009 and 2013 so that our analysis is based on a minimum three-year hold period and there is sufficient data to analyse the performance.
The results are based on an assessment of indicative values for average unit types within a project, rather than on valuations of specific units.

TOP 10IP GLOBAL PROJECTS
THE FILAMENTSWANDSWORTH / SW18
2012
ANNUAL TOTAL RETURN

1716
ANNUAL RETURN ANALYSIS
The benefits of leveraging
Those who used leverage – i.e. borrowed money – to finance their IP Global investment during the analysis period, were not only able to purchase more property than they could otherwise afford. They also benefited from the leverage effect, which saw their returns magnified on average by up to 2.7 times. Leveraging works best for long-term investments with stable annual income.
Average annual total returns by 3 and 7-year holds:
1. LEVERAGED VS UNLEVERAGEDWe identified London as a market that was undervalued in the wake of the global financial crisis, and launched our first investment in the city in 2009.
AT A GLANCE
* Annual total return: capital appreciation + gross rental yield (at launch) **Based on a 70% LTV and 3.6% interest rate, capital appreciation only
IP Global's 2009-2013 London portfolio performance:
45 developments
805units
GBP383 million total investment
11.4%Average annual total return* across all projects:
29.5%leveraged**
4.6%average rental yields at launch
GBP499 million current indicative value
unleveraged
2.7x the leverage effect (on average)
11.6% for 3-year hold
12.3% for 7-year hold
30.3% for 3-year hold
32.8% for 7-year hold
UNLEVERAGED
LEVERAGED
GBP116 million total capital appreciation
21.4%**2-bedroom units grew the most
IP Global London Portfolio Analysis 2009-2013 IP Global London Portfolio Analysis 2009-2013

18
With significant capital appreciation comes yield compression in the UK, particularly in London. This has meant that rental income has taken on more of a supporting role to capital appreciation in terms
4. RENTAL YIELD PERFORMANCE
of overall returns. During the period of analysis, we saw stable rental income backed by low vacancy rates across our portfolio, consistently providing on average 4.6% rental yields.
Our investments in London Zones 1 and 2 between 2009 and 2013 performed particularly well. Average annual growth of Zone 1 properties was 20% across a sample size of 355 units, while average annual growth of Zone 2 properties was an even more impressive 26% across a sample size of 299 units.
2. PROPERTY LOCATION
3. PROPERTY SIZE
Over the course of the period analysed, average annual leveraged capital growth was greatest for two-bedroom properties, with growth recorded at 21.4%. One-bed properties performed similarly well over this period, with growth recorded at 20.7%.
Although the lower capital growth recorded for three-bed properties reinforces our strategy of focusing our investments on one-bed and two-bed apartments, the average 19.8% recorded returns for three-bed properties shows that these assets also deliver a high capacity for investment returns.
INVESTMENT RETURN ANALYSIS
IP Global London Portfolio Analysis 2009-2013
A number of cooling measures,
including stamp duty hikes, have
impacted UK buy-to-let investors
in recent months. These levers
are intended to support first-time
buyers onto the property ladder
but may have the effect of driving
up rental yields as landlords pass
on these costs to renters.
YIELDS ON THE RISE?

20 21
INVESTMENT HOTSPOT: ISLINGTON
The borough of Islington was one of the first areas of London we identified for investment. This previously undervalued area has been transformed into one of the capital’s most fashionable suburbs over the last decade, and IP Global investors were among the first to benefit from the high levels of property price growth recorded in the area over this time.
Islington Price Growth
House prices in Islington dipped slightly after the pre-recession peak of 2008, regaining their former value within only two years. The Islington Borough Price Index has been rising steadily since mid-2009, gaining 62% by early 2016. This compares to prime central London average growth over the same period quoted at 28%. [source: Land Registry]
The current annual price growth rate for Islington is 3.6%, and further growth of 10% is forecast through 2020. [source: Savills]
ELMORE STREET• Launched November 2012
• 12 units
• Affordable at GBP640 per square foot
• 18%• 53%• Success factors: 10 minutes’ walk to bustling Upper Street 5 minutes from Essex Road station Unique, quirky glass factory conversion – well suited to local renters and purchasers
• Total investment GBP4.2 MILLION• Current indicative value GBP6.4MILLION
2009-2013 Islington portfolio performance at a glance:
10developments
Success factors:
Investment Hotspot: Islington Investment Hotspot: Islington
PEGASO• Launched August 2009
• 45 units
• Affordable at GBP447 per square foot
• 19%• 54%• Success factors:
5 minutes’ walk from the Northern Line at Old Street Station 10 minutes from trendy Hoxton Square Cass Business School easily accessible
• Total investment
GBP15.6 MILLION• Current indicative value
GBP30.3 MILLION
annual unleveraged total return
Pegaso, one of our first UK investments
Elmore Street, glass factory conversion
Excellent
TRANSPORTlinks
Fantastic
QUALITYof life
POPULAR with
PROFESSIONALS
Previously
UNDERVALUEDCLOSE to the CITY
£
annual leveraged total return
annual unleveraged total return
annual leveraged total return
13.5%average annual leveraged total return36.6%
average annual unleveraged total return

23
PART
3
The past seven years have seen our UK investment strategy focus on opportunities in prime Central London and city fringe areas such as Mayfair, Fitzrovia and Islington. In recent years we have begun to shift this strategy in response to market pressures that have overheated the central London market and reduced potential for investment return in parts of the city that had previously offered good value.
This refocusing of our UK strategy began as early as 2012/2013, and since then we have continued to identify and secure investment opportunities for our clients in Outer London hotspots such as Deptford, Sutton and Croydon, and more recently in regional cities such as Manchester and Birmingham.
Image Place holder
WHERE NEXTFOR IP GLOBAL?
RIPPLE EFFECT
Where Next for IP Global?

2524
OUTER LONDON:FLIGHT TO AFFORDABILITY?
INVESTMENT HOTSPOT: OLD GAS WORKS, BLOCK B, SUTTON
High demand in these Outer London districts is driving significant price growth across the city’s commuter belt. Many Outer London boroughs, particularly those to the East and Southeast, are now expected to outperform prime Central London price growth.
This uplift is further enhanced in locations that will benefit from regeneration investment. As an example, areas such as Ilford and Woolwich, both on the eastern end of the forthcoming Crossrail line, have seen significant regeneration spending in recent years that is playing a key role in driving local property market growth.
Across London, continued population growth is placing extreme pressure on the city’s housing supply, with rising numbers looking to London’s outer commuter suburbs for better value. Due to this, the outer London population continues to grow at a faster rate than that of inner London.
• Launched January 2015
• 93 units
• Affordable at GBP414 per square foot
• Forecast population growth of 25% by 2030
• Established commuter hub, just 30 minutes by frequent train to London Victoria
• Economic hotspot: 85% of working-age population economically active, home to 6,600 businesses
• Regeneration zone: town centre renewal, transport upgrades underway
• Undersupply: 1,161 new units expected by 2017, representing a 2,289 unit shortfall
Flight to affordability in Sutton
Investment Hotspot: Old Gas Works, Block B, SuttonWhere Next for IP Global?

2726
BEYOND LONDON?
The London property market continues to be buoyant and Central London house prices are estimated to grow by 17.5% from 2016 to 2020. Even more impressive is the growth estimate for Outer London where property prices are expected to grow by 27% for the same time period. We remain focused on seeking out pockets of value in locations across the capital.
Undervalued regional cities such as Manchester, Birmingham and Liverpool are also on the agenda for our investment team, with the government-led Northern Powerhouse scheme and infrastructure investment such as High Speed 2 and TransNorth driving growth and opportunity across the North and Midlands.
As ever, we will be targeting pockets of value – locations that exhibit the following attributes:
• Population growth and rising housing demand
• Regeneration investment and infrastructure upgrades
• Strengthening economic and commercial activity
Here is where we see the most potential in the next 5-10 years:
26.4% price growth forecast between 2016-2020 [JLL]
GBP172,666 Average unit price:
[Mar 2016, Land Registry]
GBP7bn investment
NORTHERNPOWERHOUSE
Phase 1 full completion: 2019Over GBP14bn investment
10% boost to London’s rail capacity
30-40% capital growth in 2015-2020 for property close to Outer London stations [JLL]
CROSSRAIL 1
HIGH SPEED 3 &TRANSNORTHEnhancing road and rail connectivity across the North of England
GBP135,834Average unit price:
[Mar 2016, Land Registry]
GBP123,165Average unit price:
[Mar 2016, Land Registry]
HIGH SPEED 2 (Stage 1)
Full completion: 2026GBP14.8bninvestment
Connecting London via Birmingham to Sheffield/Leeds and Manchester
23Population of North London
only
2 hrsHigh
Speed 2
if approved, full completion:
CROSSRAIL 2
2030
Improving connectivity with North and South London
Over GBP19.7bn investment
Where Next for IP Global Where Next for IP Global
17.5%price growth forecast between 2016-2020
27%price growth forecast between 2016-2020
Average unit price:
GBP479,918 [Mar 2016, Land Registry]
GBP1,364,805Average unit price:
[City of London & Westminster, Cushman & Wakefield]
[Cushman & Wakefield]
[Cushman & Wakefield]

2928
INVESTMENT HOTSPOT THE ASSEMBLY, CENTRAL MANCHESTER
• Launched June 2015
• 157 units
• Estimated completion Q3 2016
• Affordable at GBP335 per square foot
• Regeneration: close to GBP500 million First Street scheme
• Population growth: 128,000 more residents due by 2025
• Economic growth: 3.5% per annum to 2020 – 25% higher than rest of UK
• Housing supply deficit: shortfall of 11,000 apartments per year up to 2033
REFLECTION
The past seven years have been an exciting time for investing in UK property, particularly on a rising London market that has delivered strong, low-risk capital return to investors.
The years ahead promise to be just as favourable for investors in the UK. Our shift in focus to Outer London pockets of value and regional city opportunities presents investors with strong yield and capital growth opportunities, and with projects such as the Old Gas Works in Sutton and The Assembly in Manchester, we are already seeing just that.
We will be launching many more such projects in the years ahead, and are confident we will continue to justify our investors’ trust when investing in UK property.
Prime central value in Manchester
Investment Hotspot: The Assembly, Central Manchester Reflection

METHODOLOGY AND DISCLAIMER GET IN TOUCH
HONG KONGT: +852 3965 9300
SINGAPORET: +65 6224 1992
SHANGHAIT: +86 21 6032 1525
KUALA LUMPURT: +603 6204 9196
DUBAIT: +971 4 503 4700
ABU DHABIT: +971 2 694 8636
CAPE TOWNT: +27 21 286 1476
LONDONT: +44 203 696 9630
E: [email protected]: www.ipglobal-ltd.com
METHODOLOGY
· IP Global Portfolio comprises projects launched between 2009 to 2013· Current Indicative Value of each project within the IP Global Portfolio is based on Savills’ valuation report dated 22 April 2016. The methodology is based on comparables and market evidence. The analysis was done on a project average basis rather than individual apartments· Total Investment is the purchase price at which the project has been acquired collectively by IP Global clients and excludes transaction costs· Capital Appreciation is Current Indicative Value less Total Investment· Average calculations are weighted by the Total Investment of projects· Leveraging is based on a loan-to-value of 70% and interest rate of 3.6%· Gross Rental Yield is based on estimates at time of project launch· Annual Total Return comprises both Capital Appreciation and Gross Rental Yield at project launch
DISCLAIMER
IP Global’s London Portfolio Analysis (2009-2013) was conducted by Savills in April 2016.
All Information contained in this Report is given purely as guidance unless otherwise explicitly stated. Savills’ views on price are not intended as formal valuation and the information in the Report should not be relied upon as the basis for any binding decision. They are given in the course of Savills’ estate agency role and the figures suggested are not provided as a formal ("Red Book") valuation, and neither IP Global nor Savills can accept any responsibility to any Interested Party who may seek to rely upon them. The Interested Party should seek their own independent advice in relation to the information contained in the Report.
While all effort has been taken to ensure the accuracy of the information in the Report, Savills owes no duty of care, nor accepts any responsibility, to the Interested Party and Savills shall not be liable for any loss, damage, cost or expense of whatsoever nature and howsoever arising which is caused by the Interested Party’s use of, or reliance on the Report or the output data from the Report.
IP Global is the trading name of IP Real Estate Investments Pte Ltd (CEA License Number: L3010023I) which is licensed under the Estate Agents Act 2010 of Singapore.
The IP Global Kuala Lumpur office is in conjunction with Complete Real Estate & Management Sdn Bhd (935131 P / VE (1) 0246).
You acknowledge that: (i) the information contained in this document and such other material issued in connection therewith (the “Content”) are provided for information purposes only and will not be regarded as advice on securities or collective investment schemes or other financial or investment advice; (ii) the Content is not intended for the purpose of advice, dealing or trading in securities or collective investment schemes; (iii) the Content may include certain information taken from property surveys, stock exchanges and other sources from around the world; (iv) the Content is provided on an “as is” basis and by way of a summary and we do not guarantee the accuracy, completeness, or timeliness of the Content; (v) the Content may be subject to the terms and conditions of other agreements to which we are a party; (vi) none of the information contained in the Content constitutes a solicitation, offer, opinion, or recommendation by us to buy or sell any security, or provision of legal, tax, accounting, or investment advice or services regarding the profitability or suitability of any security or investment; (vii) you should not rely on the Content as the sole means of making any investment decision relating thereto and you should seek professional, independent and specific advice on any such investment decision; (viii) the property market is volatile and illiquid and property prices and rental yields may fluctuate widely or be affected by a broad range of risk factors; (ix) all plans and specifications in the Content are intended as a guide only and are subject to such variations, modifications and amendments as may be required by the relevant authorities or the relevant developer’s consultants or architects; (x) all renderings and illustrations in the Content are artists’ impressions only and all measurements are approximate subject to final survey and confirmation; (xi) the Content is not intended for use by, or distribution to, any person or entity in any jurisdiction or country where such use or distribution would be contrary to law or regulation; and (xii) the Content has not been authorised or approved by the Securities and Futures Commission of Hong Kong or any regulatory body of competent authority whether in Hong Kong or elsewhere. Accordingly, you assume all responsibility and risk for reliance upon and the use of the Content and, we, our agents, directors, officers, employees, representatives, successors, and assigns expressly disclaim any and all responsibility for any direct or consequential loss or damage of any kind whatsoever arising directly or indirectly from: (i) the use of the Content, (ii) reliance on any information contained in the Content, (iii) any error, omission or inaccuracy in any such information including, without limitation, financial data, forecasts, analysis and trends, or (iv) any action or non-performance resulting from the foregoing. This exclusion clause shall take effect to the fullest extent permitted by applicable laws.
PROFESSIONAL ADVICE Any statement contained in the Content is made on a general basis and we have not given any consideration to nor have we made any investigation of the investment objective, financial situation or particular need of any user or reader, any specific person or group of persons. You are advised to make your own assessment of the relevance, accuracy and adequacy of the information contained in the Content and conduct independent investigations as may be necessary or appropriate for the purpose of such assessment including the investment risks involved. You should consult an appropriate professional advisor for legal, tax, accounting, or investment advice specific to your situation, as to whether any governmental or other consents are required or if any formalities should be observed for the purposes of making such investments as are mentioned in the Content. If you are unsure about the meaning of any of the information contained in the Content, please consult your financial or other professional advisor.
THIRD PARTY REFERENCES References to third party publications are provided for your information only. The content of these publications are issued by third parties. As such, we are not responsible for the accuracy of information contained in those publications, nor shall we be held liable for any loss or damage arising from or related to their use.

www.ipglobal-ltd.com
LONDON PORTFOLIO ANALYSIS
2009-2013
UK MARKET UPDATE 2016


