i
How research & development
adds value
- a business modelling method for R&D organisations -
Neill Sweet
ii
How research and development adds value -a business modelling method for R&D organisations-
Version 12-12-2012 PUBLIC Author Neill Sweet Study Program Master of Science in Industrial Engineering and
Management Specialisation Information Technology and Management School of Management and Governance University of Twente, Enschede, The Netherlands
Student number s0000434 Email [email protected] GRADUATION COMMITTEE
First supervisor Dr. M.E. (Maria-Eugenia) Iacob Assistant Professor Industrial Engineering and Business Information Systems University of Twente, Enschede, The Netherlands
Second supervisor M.Sc. L.O. (Lucas) Meertens
Ph. D. candidate Industrial Engineering and Business Information Systems University of Twente, Enschede, The Netherlands
SE Blades Technology supervisors Ing. Marcel Jasper Quality Manager SE Blades Technology, Hengelo, The Netherlands
Dr. ir. Klaas de Haas Head of department Composites, Materials and Processes SE Blades Technology, Hengelo, The Netherlands
iii
ABSTRACT
This research arose out of an interest in capturing the value of R&D. An interest which
brought the two areas R&D and Business Models together and led to the following research
question:
How to build a business model for a research and development organisation?
The quest for an answer did not only contribute by illuminating the shady grounds of value
creation within R&D, it strengthened the fundaments where this research is built upon as
well.
For this research, a generic method to build a business model in a structured and
reproducible manner (Meertens et al, 20011) is tailored to be applicable for R&D
organisations. The adjustments of the method based on typical R&D characteristics led to
the solution design which then was demonstrated and validated via a case study. To ensure
the quality of the validation an expert validation is done as well.
In section 2.1 the BMM is introduced based on the following business model definition: “A
business model is a simplified representation that counts for the known and inferred
properties of the business or industry as a whole...”
By a thorough literature study in section 2.2 the known and inferred properties of R&D were
classified as project oriented, managing activities, risk management, cost management,
value and external linkages. These characteristics were used in section 2.3 to research the
suitable techniques within the BMM.
The solution design which is built upon the outcomes of 2.3 is presented in chapter 3. First
the roles are identified using a stakeholder analysis which is especially designed for R&D
projects. Second, the relations are recognised by mapping the value exchanges with e3-value
modelling. Third, the activities are specified using Stage Gate Systems and the fourth step
quantification of the model is covered by job costing. The fifth and the sixth step are general
steps and outside the scope of this research. The solution design is based on two
assumptions:
o a R&D organisation is project oriented
o the business model of R&D is a portfolio of innovation processes
In chapter 4 is demonstrated by at SE Blades Technology with a case study on New Product
Development projects and a case study on Technology Projects.
iv
In the expert validation in chapter 5 the strengths, weaknesses, opportunities and
threads of the solution design were discussed. One of the strengths confirmed the results in
chapter 4, that the method appeared well structured and useable in practice. The lack of an
earning model was addressed as a weakness. However, the solution design is demonstrated
at a R&D organisation which is seen as a cost centre. Therefore this is not a weakness but a
limitation, as earning models are more useful for profit centres. This automatically leads to
the opportunity of doing further research on how to shift from a cost centre to a profit
centre. The threads of overlapping definitions which the experts warned for are taken into
account during the revision of this thesis.
In this research a BMM method is tailored and the solution design turned out to be
suitable for building the business model of a R&D organisation. It was not only suitable, it
encouraged continuous improvement as well when working with the method. The solution
design is validated by experts as well. Based on this validation the limitations of this research
have been cleared.
v
TABLE OF CONTENTS
ABSTRACT .................................................................................................................. iii
TABLE OF CONTENTS ................................................................................................... v
LIST OF FIGURES ....................................................................................................... viii
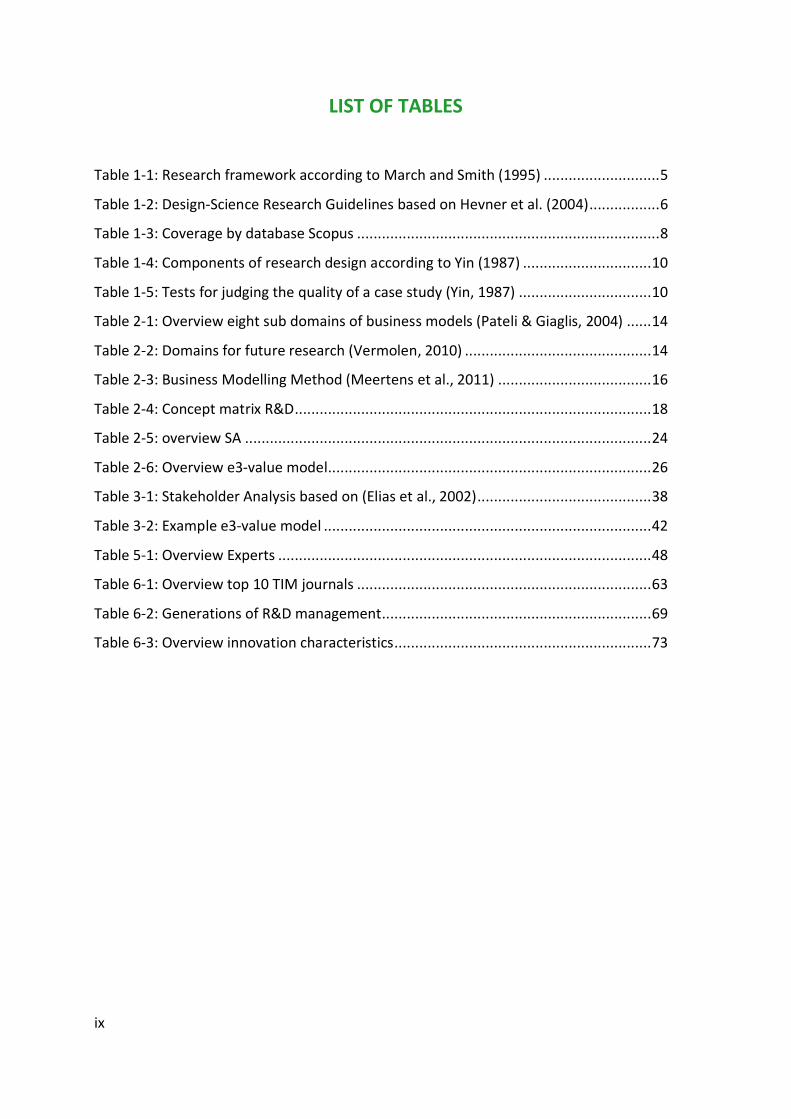
LIST OF TABLES ........................................................................................................... ix
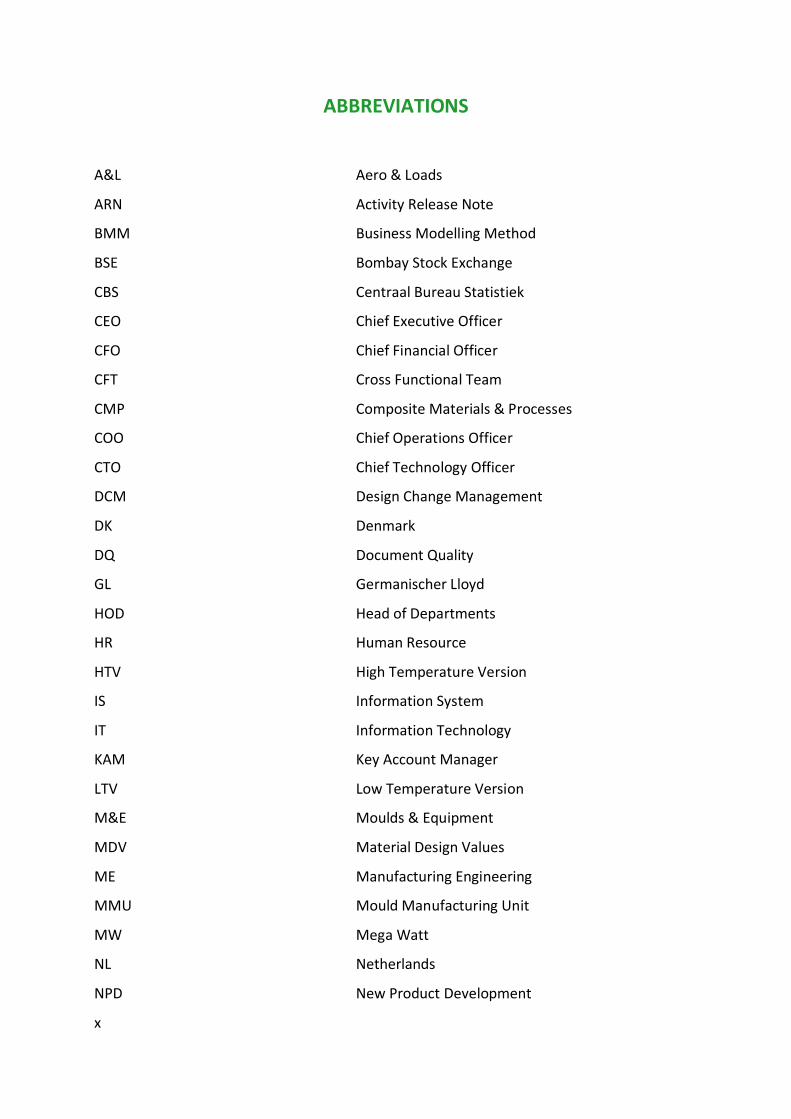
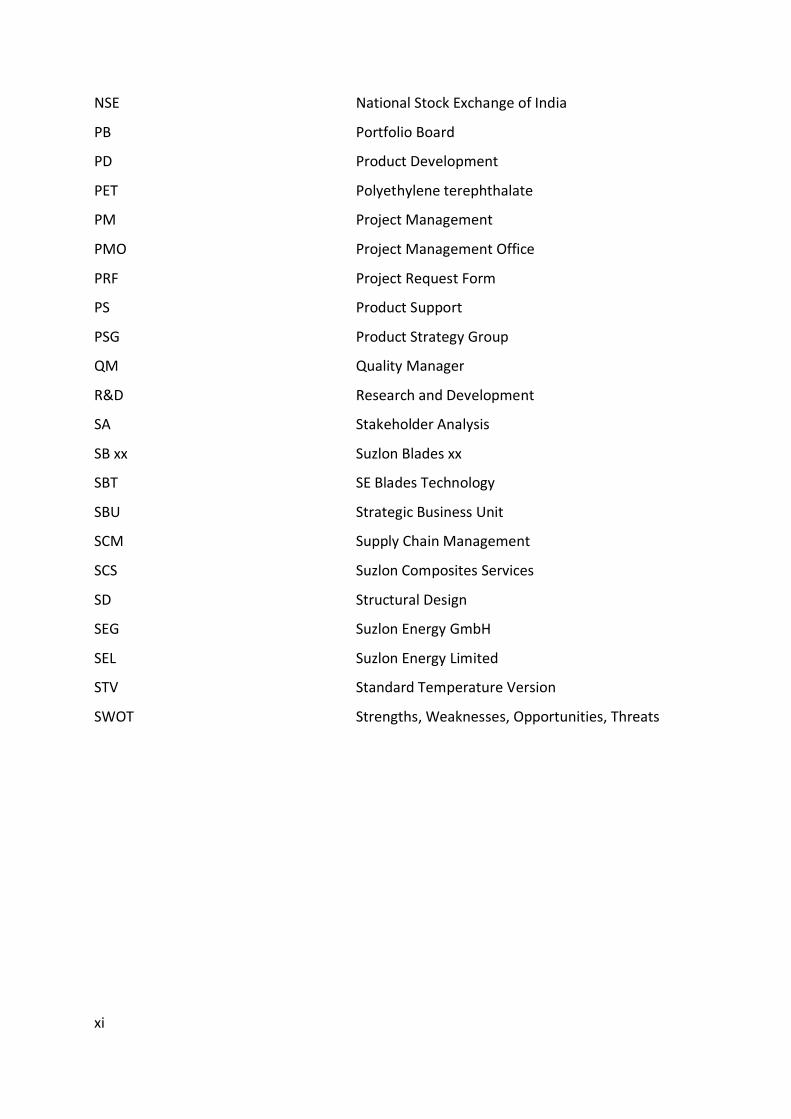
ABBREVIATIONS .......................................................................................................... x
ACKNOWLEDGEMENTS ............................................................................................. xii
CHAPTER 1. INTRODUCTION ..................................................................................................1
1.1 MOTIVATION FOR THE RESEARCH .....................................................................................1
1.2 RESEARCH AIM AND OBJECTIVES .......................................................................................3
1.3 METHODOLOGY ...........................................................................................................4
1.3.1 Design Science .....................................................................................................5
1.3.2 Literature research strategy ................................................................................7
1.3.3 Case Study .........................................................................................................10
1.3.4 Interviews..........................................................................................................11
CHAPTER 2. LITERATURE REVIEW ........................................................................................12
2.1 BUSINESS MODEL ......................................................................................................12
2.1.1 What is a business model? ................................................................................12
2.1.2 What is the status of business model research? .................................................13
2.1.3 Business Modelling Method (BMM) ...................................................................15
2.2 CHARACTERISTICS R&D ...............................................................................................17
2.3 CHALLENGES .............................................................................................................22
2.3.1 Identify roles .....................................................................................................22
2.3.2 Recognize relations ...........................................................................................24
2.3.3 Specify activities ................................................................................................27
2.3.4 Quantify model .................................................................................................32
2.4 CONCLUSION ............................................................................................................34
CHAPTER 3. SOLUTION DESIGN ............................................................................................35
3.1 IDENTIFY ROLES..........................................................................................................37
vi
3.1.1 Choice ...............................................................................................................37
3.1.2 Presenting the Stakeholder Analysis ..................................................................37
3.2 RECOGNISE RELATIONS ................................................................................................40
3.2.1 Choice ...............................................................................................................40
3.2.2 Presenting the e3-value model ..........................................................................40
3.3 SPECIFY ACTIVITIES .....................................................................................................42
3.3.1 Choice ...............................................................................................................42
3.3.2 Presenting the Stage Gates ...............................................................................43
3.4 QUANTIFY MODEL ......................................................................................................44
3.4.1 Choice ...............................................................................................................45
3.4.2 Presenting job-costing .......................................................................................45
3.5 CONCLUSION ............................................................................................................46
CHAPTER 4. SOLUTION DEMONSTRATION AND VALIDATION ..............................................47
CHAPTER 5. SOLUTION VALIDATION ....................................................................................48
5.1 PROTOCOL ...............................................................................................................48
5.2 SWOT ....................................................................................................................48
5.2.1 Strengths ...........................................................................................................49
5.2.2 Weaknesses ......................................................................................................49
5.2.3 Opportunities ....................................................................................................49
5.2.4 Threats ..............................................................................................................49
5.3 CONCLUSIONS ...........................................................................................................50
5.3.1 Strengths ...........................................................................................................50
5.3.2 Weaknesses ......................................................................................................50
5.3.3 Opportunities ....................................................................................................51
5.3.4 Threats ..............................................................................................................51
CHAPTER 6. CONCLUSIONS, DISCUSSION AND RECOMMENDATIONS .................................53
6.1 CONCLUSION ............................................................................................................53
6.2 DISCUSSION ..............................................................................................................54
6.2.1 Limitations ........................................................................................................54
6.2.2 Further research ................................................................................................54
vii
6.2.3 Contribution of research ....................................................................................55
6.3 RECOMMENDATIONS ..................................................................................................55
REFERENCES..............................................................................................................56
Appendix A: Top TIM Journals................................................................................. 63
Appendix B: Top IS Journals .................................................................................... 64
Appendix C: Top Accounting Journals ..................................................................... 66
Appendix D: Search terms chapter 2.1 .................................................................... 67
Appendix E: A peek into innovation ........................................................................ 69
Appendix F: Interview Guide .................................................................................. 75
viii
LIST OF FIGURES
Figure 1-1: R&D expenditure public sector (Kuipers, 2011) .............................................. 1
Figure 1-2: Research Model ............................................................................................. 4
Figure 1-3: Overview literature search methodology ....................................................... 7
Figure 1-4: Interview scheme based on Emans (1985) ................................................... 11
Figure 2-1: Search process chapter 2.1 .......................................................................... 17
Figure 2-2: Search process 2.3.1 .................................................................................... 22
Figure 2-3: Stakeholder literature map based on Elias et al. (2002)................................ 23
Figure 2-4: Search process 2.3.2 .................................................................................... 25
Figure 2-5: Search process 2.3.3 .................................................................................... 27
Figure 2-6: Example Stage-Gate system (Cooper, 1990) ................................................. 28
Figure 2-7: traditional model versus flexible model (Iansiti, 1995) ................................. 28
Figure 2-8: Radical innovation process (Veryzer Jr, 1998) .............................................. 29
Figure 2-9: Example (Iansiti, 1995) ................................................................................. 30
Figure 2-10: Scales of Stage-Gate Systems ..................................................................... 31
Figure 2-11: Technology Development Projects ............................................................. 31
Figure 2-12: Search process section 2.3.4 ...................................................................... 33
Figure 3-1: Overview steps BMM ................................................................................... 36
Figure 3-2: Step 1 BMM - Identify Roles ......................................................................... 37
Figure 3-3: Stakeholder Management Capability ........................................................... 39
Figure 3-4: Dynamics Stakeholders ................................................................................ 39
Figure 3-5: Step 2 - Recognise Relations ........................................................................ 40
Figure 3-6: Example e3-value model (Gordijn 2001) ...................................................... 41
Figure 3-7: Step 3 - Specify Activities ............................................................................. 42
Figure 3-8: Workflow of Step 3 ...................................................................................... 44
Figure 3-9: Step 4 - Quantify Model ............................................................................... 44
Figure 6-1: Classification, place of R&D, measuring R&D................................................ 71
Figure 6-2 Boundaries of technology-, innovation-, and R&D management ................... 74
ix
LIST OF TABLES
Table 1-1: Research framework according to March and Smith (1995) ............................ 5
Table 1-2: Design-Science Research Guidelines based on Hevner et al. (2004) ................. 6
Table 1-3: Coverage by database Scopus ......................................................................... 8
Table 1-4: Components of research design according to Yin (1987) ............................... 10
Table 1-5: Tests for judging the quality of a case study (Yin, 1987) ................................ 10
Table 2-1: Overview eight sub domains of business models (Pateli & Giaglis, 2004) ...... 14
Table 2-2: Domains for future research (Vermolen, 2010) ............................................. 14
Table 2-3: Business Modelling Method (Meertens et al., 2011) ..................................... 16
Table 2-4: Concept matrix R&D ...................................................................................... 18
Table 2-5: overview SA .................................................................................................. 24
Table 2-6: Overview e3-value model.............................................................................. 26
Table 3-1: Stakeholder Analysis based on (Elias et al., 2002) .......................................... 38
Table 3-2: Example e3-value model ............................................................................... 42
Table 5-1: Overview Experts .......................................................................................... 48
Table 6-1: Overview top 10 TIM journals ....................................................................... 63
Table 6-2: Generations of R&D management ................................................................. 69
Table 6-3: Overview innovation characteristics .............................................................. 73
x
ABBREVIATIONS
A&L Aero & Loads
ARN Activity Release Note
BMM Business Modelling Method
BSE Bombay Stock Exchange
CBS Centraal Bureau Statistiek
CEO Chief Executive Officer
CFO Chief Financial Officer
CFT Cross Functional Team
CMP Composite Materials & Processes
COO Chief Operations Officer
CTO Chief Technology Officer
DCM Design Change Management
DK Denmark
DQ Document Quality
GL Germanischer Lloyd
HOD Head of Departments
HR Human Resource
HTV High Temperature Version
IS Information System
IT Information Technology
KAM Key Account Manager
LTV Low Temperature Version
M&E Moulds & Equipment
MDV Material Design Values
ME Manufacturing Engineering
MMU Mould Manufacturing Unit
MW Mega Watt
NL Netherlands
NPD New Product Development
xi
NSE National Stock Exchange of India
PB Portfolio Board
PD Product Development
PET Polyethylene terephthalate
PM Project Management
PMO Project Management Office
PRF Project Request Form
PS Product Support
PSG Product Strategy Group
QM Quality Manager
R&D Research and Development
SA Stakeholder Analysis
SB xx Suzlon Blades xx
SBT SE Blades Technology
SBU Strategic Business Unit
SCM Supply Chain Management
SCS Suzlon Composites Services
SD Structural Design
SEG Suzlon Energy GmbH
SEL Suzlon Energy Limited
STV Standard Temperature Version
SWOT Strengths, Weaknesses, Opportunities, Threats
xii
ACKNOWLEDGEMENTS
This thesis is the result of twenty four weeks of research at SE Blades Technology. It was
educational, interesting and sometimes hard as well. During this period I have met a lot of
interesting people and learned a lot about all kind of the aspects of an international
organisation. This section offers me to thank everyone who has helped me to get where I am
now.
First of all, I would like to express my very great appreciation to Marcel Jasper, my supervisor
at SE Blades Technology, for his useful critiques. His willingness to give his time so
generously has been very much appreciated. My grateful thanks are also extended to Klaas
de Haas, my second supervisor at SE Blades Technology, for the support he offered when I
was stationed on his department. My special thanks are extended to everybody from the
department CMP as well, for the interesting internship and the weekly lunch trips to the
IKEA, McDonalds or the market.
Furthermore, I would like to express my deep gratitude to Maria Iacob and Lucas Meertens,
my research supervisors, for their advice and assistance in keeping my progress on schedule.
The two visits at Hengelo during my internship showed your involvement in my research. I
would also like to extend my thanks to Björn Kijl, Timber Haaker, Holger Schiele and Dick
Quartel for your expert opinion on the results of my research.
Finally, I wish to thank my family for their support and encouragement throughout my study
and Daisy Chong without whom I would not have achieved this. Let us now enjoy the fruits
of all the labour!
Enschede, December 2012
Neill Sweet
1
Chapter 1. Introduction
1.1 Motivation for the research
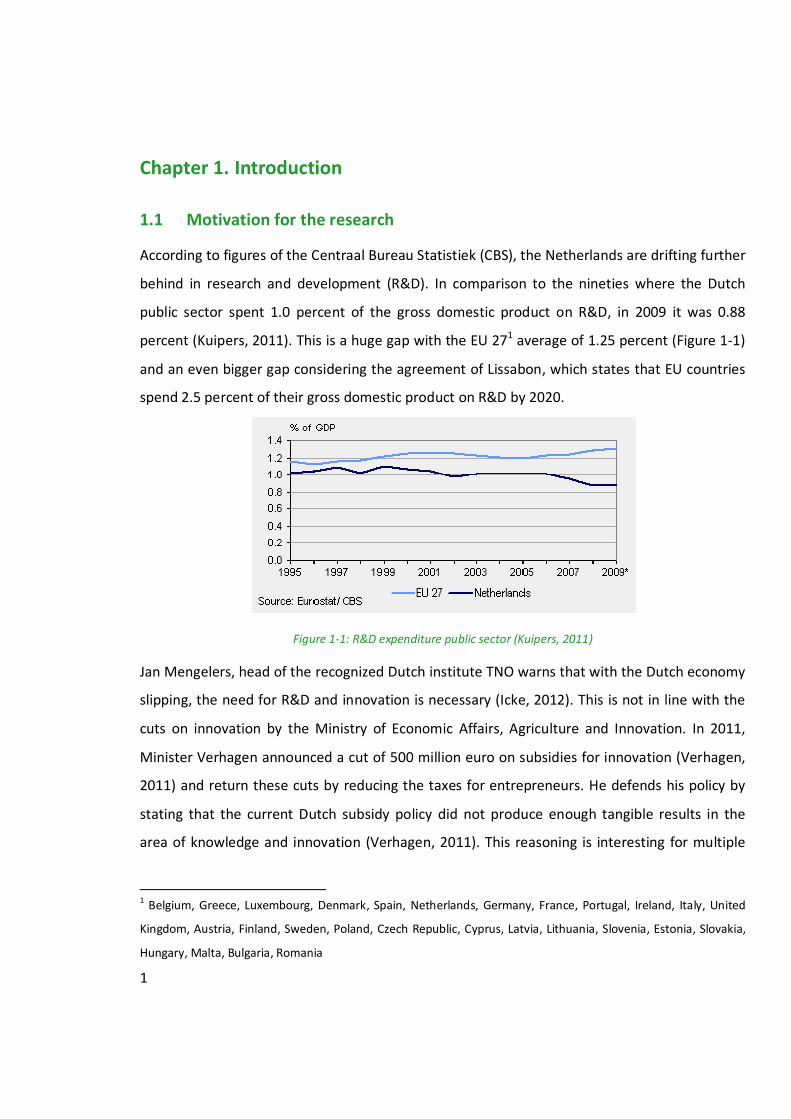
According to figures of the Centraal Bureau Statistiek (CBS), the Netherlands are drifting further
behind in research and development (R&D). In comparison to the nineties where the Dutch
public sector spent 1.0 percent of the gross domestic product on R&D, in 2009 it was 0.88
percent (Kuipers, 2011). This is a huge gap with the EU 271 average of 1.25 percent (Figure 1-1)
and an even bigger gap considering the agreement of Lissabon, which states that EU countries
spend 2.5 percent of their gross domestic product on R&D by 2020.
Figure 1-1: R&D expenditure public sector (Kuipers, 2011)
Jan Mengelers, head of the recognized Dutch institute TNO warns that with the Dutch economy
slipping, the need for R&D and innovation is necessary (Icke, 2012). This is not in line with the
cuts on innovation by the Ministry of Economic Affairs, Agriculture and Innovation. In 2011,
Minister Verhagen announced a cut of 500 million euro on subsidies for innovation (Verhagen,
2011) and return these cuts by reducing the taxes for entrepreneurs. He defends his policy by
stating that the current Dutch subsidy policy did not produce enough tangible results in the
area of knowledge and innovation (Verhagen, 2011). This reasoning is interesting for multiple
1 Belgium, Greece, Luxembourg, Denmark, Spain, Netherlands, Germany, France, Portugal, Ireland, Italy, United
Kingdom, Austria, Finland, Sweden, Poland, Czech Republic, Cyprus, Latvia, Lithuania, Slovenia, Estonia, Slovakia,
Hungary, Malta, Bulgaria, Romania
2
reasons. First question to answer is what are tangible results of innovation? This question
relates closely to what is the value of innovation? Both questions are very hard to answer and it
seems impossible to give an unambiguous answer. Even if an answer could be given, it still
would be a lot of guesswork to determine ‘enough’ tangible results.
The lacking R&D spending by the Netherlands (Kuipers, 2011) are even more painfully
considering that foreign stakeholders in Dutch industry are accountable for 33% of all R&D
spending (Icke, 2012). This is especially the case as the Netherlands like to present themselves
as a knowledge intensive economy.
Why is innovation this important?
For a company to grow, it must keep ahead of competitors whenever possible. To do this,
companies must innovate, which often depends on R&D. Following this reasoning, investing in
R&D would give you a competitive advantage, which would be a boost for your economy.
However, it is not that easy, a higher R&D spending does not automatically lead to more or
better innovation. R&D is very difficult to manage, while the success of your results is not
known in advance. In this light, the decision of Minister Verhagen can be argued.
Because the direct effect can hardly be measured, it is interesting to see how R&D does add
value. This question remains unanswered from the beginning of the research on R&D.
Nevertheless, a relative young but turbulent research field is trying to grasp the value creation
of organization, namely business model research. A business model is a simplified
representation of reality which tries to show how a company does business or creates value. It
would be very interesting to combine these two fields and expose the business model behind
R&D.
3
1.2 Research aim and objectives
As mentioned at the end of the introduction, it would be interesting to expose the business
model behind R&D. The translation of this interest to a scientific research leads to the main
research question of this thesis:
How to build a business model for a research and development organisation?
The research question combines two scientific areas, the one of business model research and
the one of R&D research. R&D research is closely related to innovation research and is
intertwined with various fields of expertise, like knowledge management, marketing,
production and so on. The business model research is a field with many changing factors in the
last two decades. The upcoming of information technology, the introduction of a new
distribution channel ‘the internet’, other new forms of communication and together with the
rise of globalization, makes business model research an interesting topic.
Because of the developments and viewpoints in both fields, this research has to be positioned
and delineated in order to find the area where the two areas overlap.
To tackle the main research question, it is separated in the following objectives and sub
questions.
Objective 1: Describe the choice for the business modelling method for R&D
- What is the status of the current business model research?
- What is the business modelling method (BMM)?
- What is the influence of the R&D characteristics on the steps of the BMM?
Objective 2: Describe the R&D characteristics
Objective 3: Tailor the method for a business model of a R&D organisation
- How to design a method?
- Which steps to tailor?
4
Objective 4: Demonstrate and validate the designed method by a case study
- What is the unit of analysis?
- Which projects are suitable for the case study?
Objective 5: Validate the designed method by interviewing business model experts
- What are the strengths of the designed method?
- What are the weaknesses of the designed method?
- What are the opportunities of the designed method?
- What are the threats of the designed method?
In the remaining part of this chapter, the methodologies used will be introduced.
1.3 Methodology
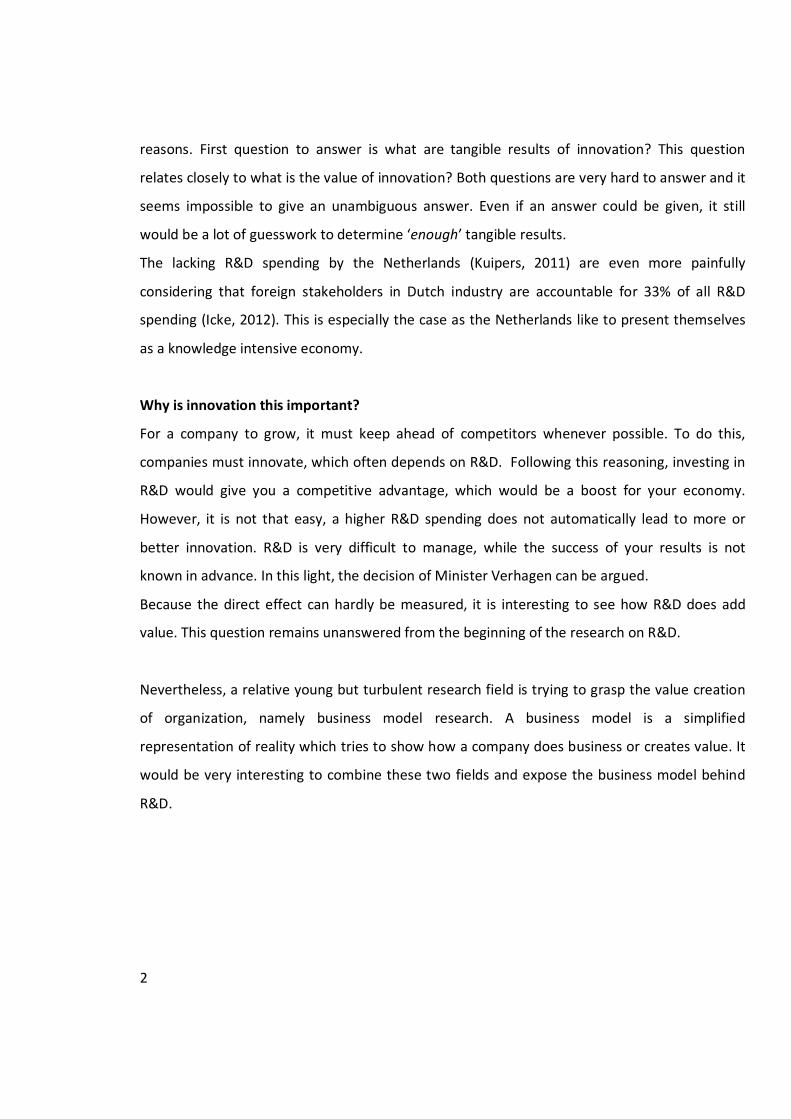
The research objectives are assigned to the problem analysis, solution design, solution
demonstration and validation (Figure 1-2).
Figure 1-2: Research Model
To reach the objectives certain research methods are used. First of all, design science is used
which largely determines the structure of this research (solution design and
demonstration/validation). Section 1.3.1 provides the guidelines for the design and positions
the research. But before a solution can be designed a problem analysis has to be performed.
Section 1.3.2 shows how the literature search is build up, to ensure the literature is
5
reproducible. Finally in sections 1.3.3 and 1.3.4 the validation methods, case study and
interview are described. These sections together represent the foundation of this research.
1.3.1 Design Science
The reach the objectives design science is used. Design science determines the structure of this
research (solution design and demonstration/validation). On the role of design science in
business model research, Osterwalder (2004) states in his introduction chapter:
“The reasoning behind business model research is not the understanding of a phenomenon,
rather it is a problem-solution finding approach”
In design science he finds a suitable research method for an accepted problem solution method
(Osterwalder, 2004). His understanding of design science research output follows March and
Smith (1995), who define IT artefacts as constructs, models, methods and instantiations.
However, Offermann, Blom, Levina, and Bub (2010) present in an overview, that this is not the
only view on design science research output. The lack of consensus in this field is noticed by
Gregor (2006) as well, where she discusses the terms design science and design theory.
This research follows the same approach as Meertens, Iacob, and Nieuwenhuis (2011), on
which shoulders this research stands. The reasons for this will become clear in section 2.1.3.
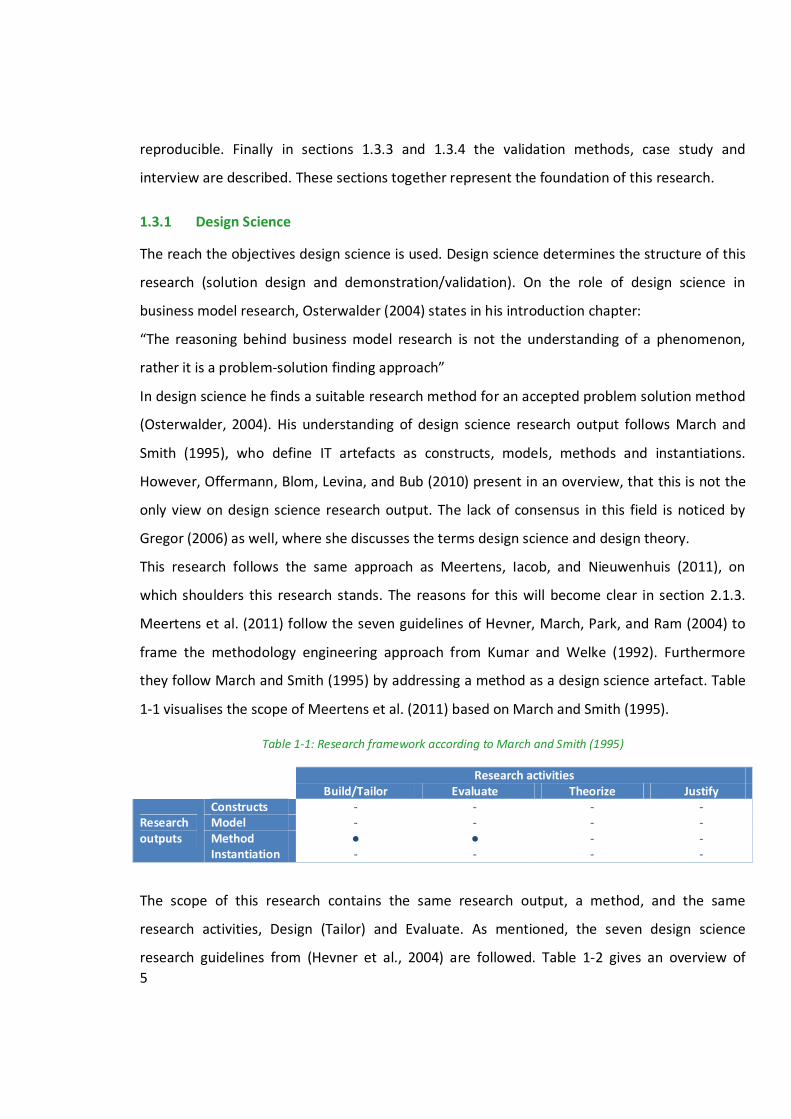
Meertens et al. (2011) follow the seven guidelines of Hevner, March, Park, and Ram (2004) to
frame the methodology engineering approach from Kumar and Welke (1992). Furthermore
they follow March and Smith (1995) by addressing a method as a design science artefact. Table
1-1 visualises the scope of Meertens et al. (2011) based on March and Smith (1995).
Table 1-1: Research framework according to March and Smith (1995)
Research activities Build/Tailor Evaluate Theorize Justify
Research outputs
Constructs - - - - Model - - - - Method ● ● - - Instantiation - - - -
The scope of this research contains the same research output, a method, and the same
research activities, Design (Tailor) and Evaluate. As mentioned, the seven design science
research guidelines from (Hevner et al., 2004) are followed. Table 1-2 gives an overview of
6
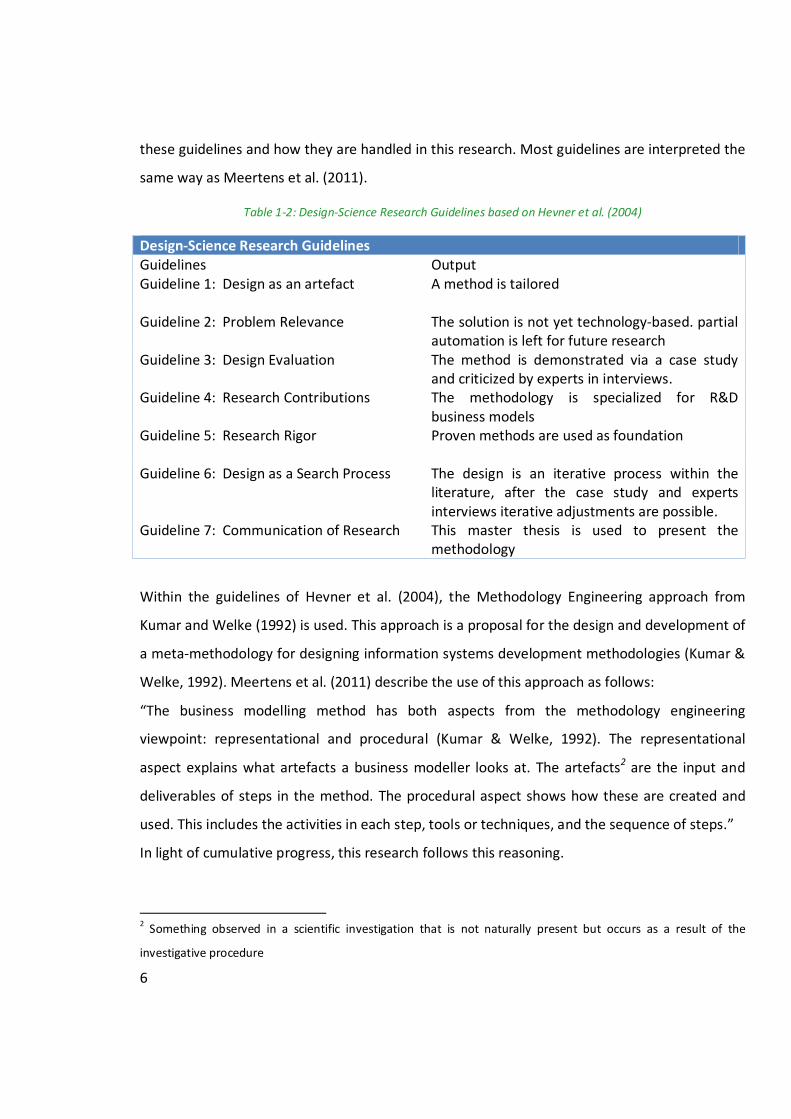
these guidelines and how they are handled in this research. Most guidelines are interpreted the
same way as Meertens et al. (2011).
Table 1-2: Design-Science Research Guidelines based on Hevner et al. (2004)
Design-Science Research Guidelines Guidelines Output Guideline 1: Design as an artefact
A method is tailored
Guideline 2: Problem Relevance The solution is not yet technology-based. partial automation is left for future research
Guideline 3: Design Evaluation
The method is demonstrated via a case study and criticized by experts in interviews.
Guideline 4: Research Contributions
The methodology is specialized for R&D business models
Guideline 5: Research Rigor
Proven methods are used as foundation
Guideline 6: Design as a Search Process
The design is an iterative process within the literature, after the case study and experts interviews iterative adjustments are possible.
Guideline 7: Communication of Research This master thesis is used to present the methodology
Within the guidelines of Hevner et al. (2004), the Methodology Engineering approach from
Kumar and Welke (1992) is used. This approach is a proposal for the design and development of
a meta-methodology for designing information systems development methodologies (Kumar &
Welke, 1992). Meertens et al. (2011) describe the use of this approach as follows:
“The business modelling method has both aspects from the methodology engineering
viewpoint: representational and procedural (Kumar & Welke, 1992). The representational
aspect explains what artefacts a business modeller looks at. The artefacts2 are the input and
deliverables of steps in the method. The procedural aspect shows how these are created and
used. This includes the activities in each step, tools or techniques, and the sequence of steps.”
In light of cumulative progress, this research follows this reasoning.
2 Something observed in a scientific investigation that is not naturally present but occurs as a result of the
investigative procedure
7
1.3.2 Literature research strategy
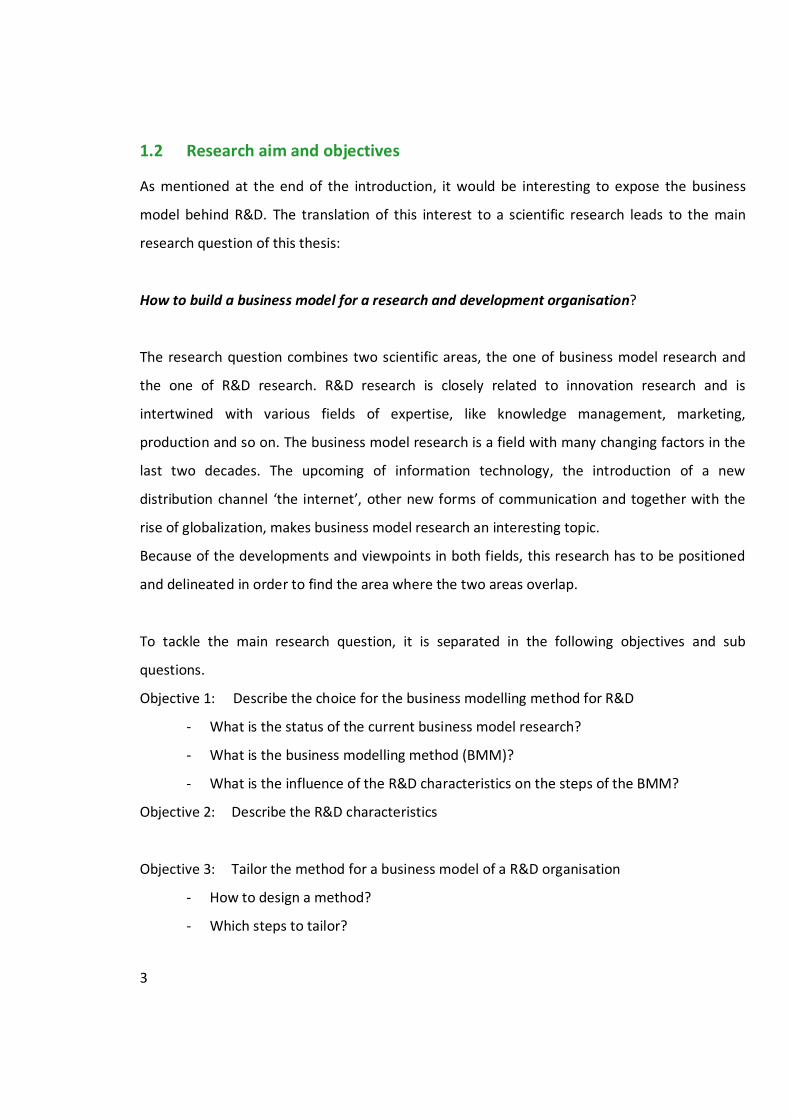
To reach the goals of objective 1 and 2 a literature review is needed. To conduct the literature
review an explicit and systematic methodology is followed. A well-defined methodology makes
it less likely that results are biased. Furthermore, it guards the quality and the completeness of
the review. And last, a search strategy allows replication and validation of the search process.
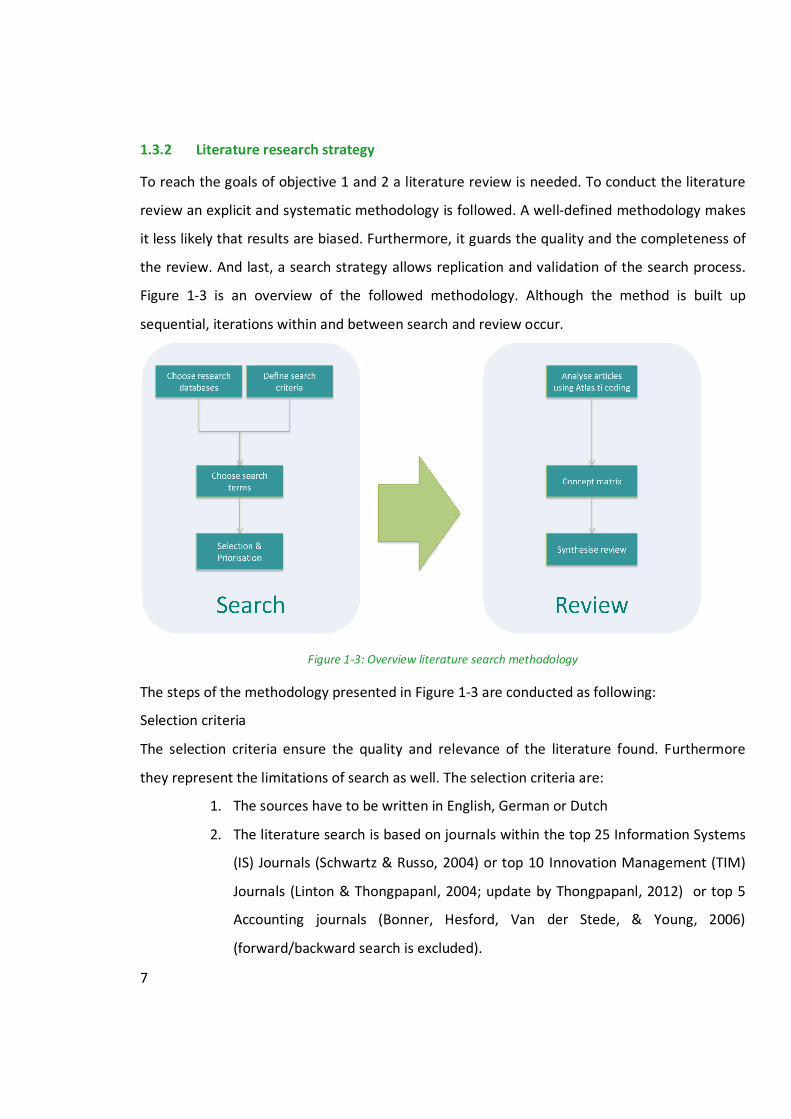
Figure 1-3 is an overview of the followed methodology. Although the method is built up
sequential, iterations within and between search and review occur.
Figure 1-3: Overview literature search methodology
The steps of the methodology presented in Figure 1-3 are conducted as following:
Selection criteria
The selection criteria ensure the quality and relevance of the literature found. Furthermore
they represent the limitations of search as well. The selection criteria are:
1. The sources have to be written in English, German or Dutch
2. The literature search is based on journals within the top 25 Information Systems
(IS) Journals (Schwartz & Russo, 2004) or top 10 Innovation Management (TIM)
Journals (Linton & Thongpapanl, 2004; update by Thongpapanl, 2012) or top 5
Accounting journals (Bonner, Hesford, Van der Stede, & Young, 2006)
(forward/backward search is excluded).
8
3. The sources need to be available using the University of Twente library account
4. Search terms have to occur in the title, in the abstract or in the keywords of the
articles
5. Date of search must be recorded for replication purposes
Choice of research databases
The choice of research databases determines the coverage and quality of the research. To
ensure high quality of the literature review, only articles from top 25 IS journals according to
Schwartz and Russo (2004) or from the top 5 accounting journals (Bonner et al., 2006) or from
top 10 TIM Journals according to Linton and Thongpapanl (2004) and the update by
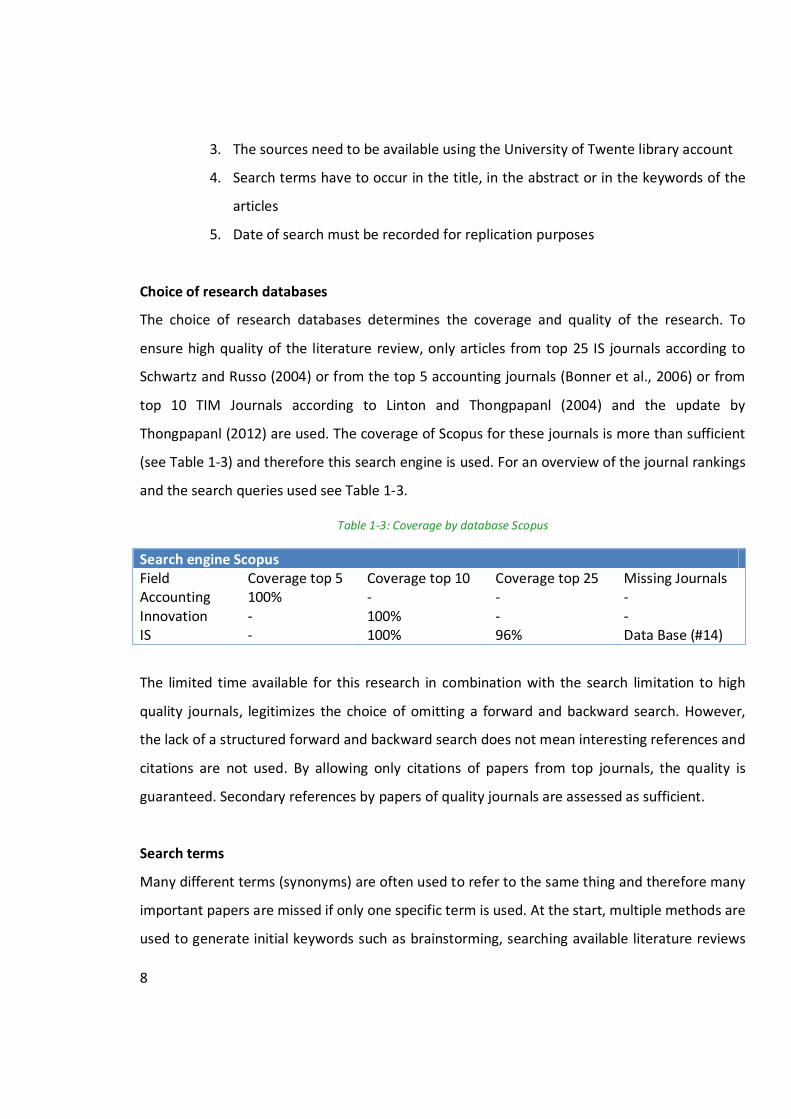
Thongpapanl (2012) are used. The coverage of Scopus for these journals is more than sufficient
(see Table 1-3) and therefore this search engine is used. For an overview of the journal rankings
and the search queries used see Table 1-3.
Table 1-3: Coverage by database Scopus
Search engine Scopus Field Coverage top 5 Coverage top 10 Coverage top 25 Missing Journals Accounting 100% - - - Innovation - 100% - - IS - 100% 96% Data Base (#14)
The limited time available for this research in combination with the search limitation to high
quality journals, legitimizes the choice of omitting a forward and backward search. However,
the lack of a structured forward and backward search does not mean interesting references and
citations are not used. By allowing only citations of papers from top journals, the quality is
guaranteed. Secondary references by papers of quality journals are assessed as sufficient.
Search terms
Many different terms (synonyms) are often used to refer to the same thing and therefore many
important papers are missed if only one specific term is used. At the start, multiple methods are
used to generate initial keywords such as brainstorming, searching available literature reviews
9
and author search. The final search terms are then checked for spelling alternatives and queries
are formed. This is an iterative process which has input from all the steps in the literature
search methodology. The final search terms and queries for this research can be found in
Chapter 2.
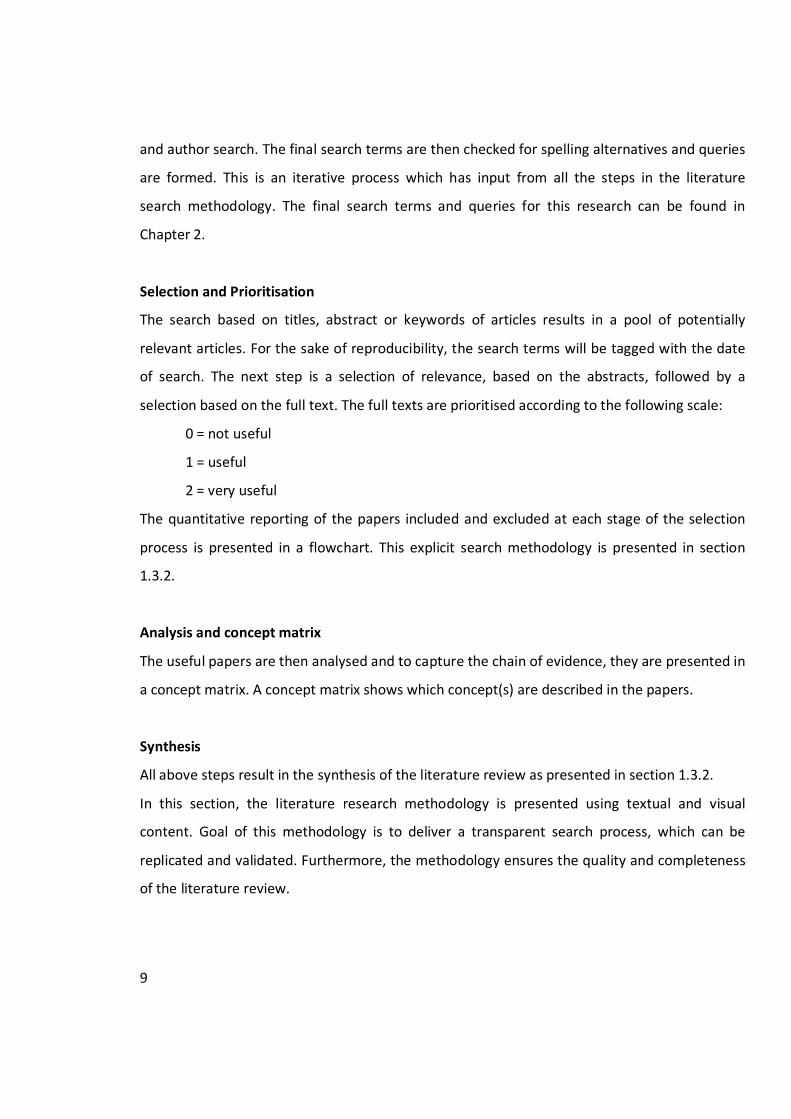
Selection and Prioritisation
The search based on titles, abstract or keywords of articles results in a pool of potentially
relevant articles. For the sake of reproducibility, the search terms will be tagged with the date
of search. The next step is a selection of relevance, based on the abstracts, followed by a
selection based on the full text. The full texts are prioritised according to the following scale:
0 = not useful
1 = useful
2 = very useful
The quantitative reporting of the papers included and excluded at each stage of the selection
process is presented in a flowchart. This explicit search methodology is presented in section
1.3.2.
Analysis and concept matrix
The useful papers are then analysed and to capture the chain of evidence, they are presented in
a concept matrix. A concept matrix shows which concept(s) are described in the papers.
Synthesis
All above steps result in the synthesis of the literature review as presented in section 1.3.2.
In this section, the literature research methodology is presented using textual and visual
content. Goal of this methodology is to deliver a transparent search process, which can be
replicated and validated. Furthermore, the methodology ensures the quality and completeness
of the literature review.
10
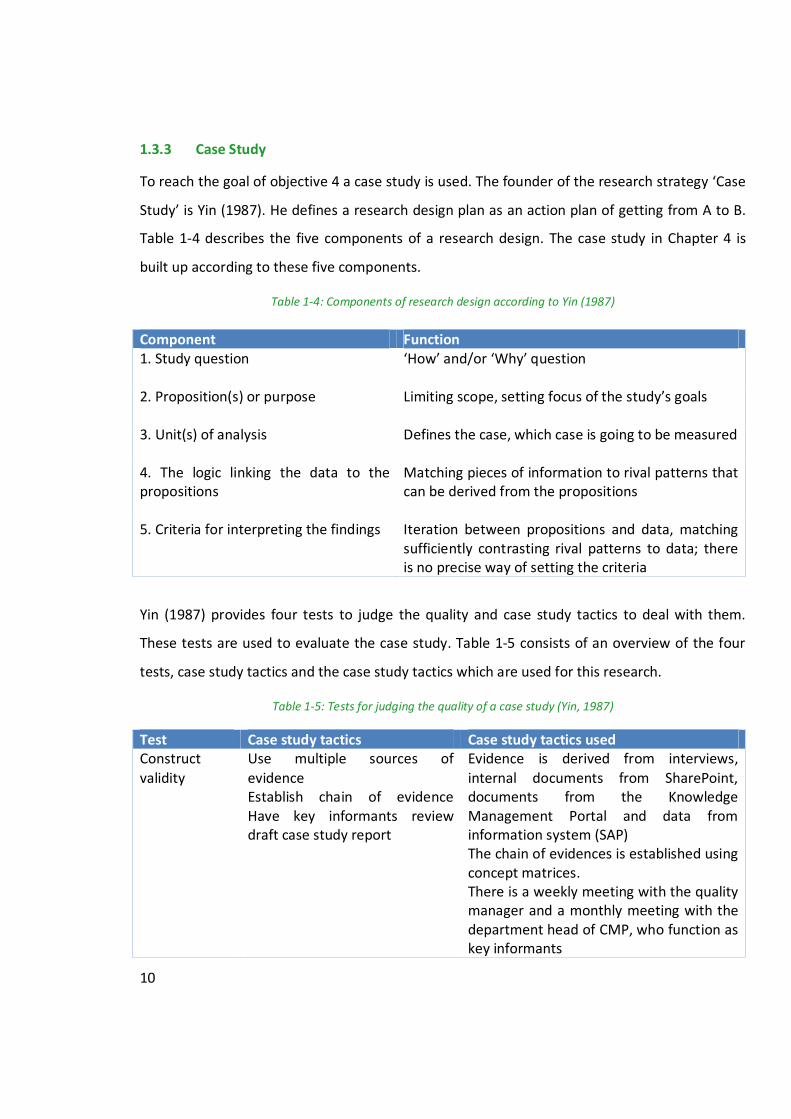
1.3.3 Case Study
To reach the goal of objective 4 a case study is used. The founder of the research strategy ‘Case
Study’ is Yin (1987). He defines a research design plan as an action plan of getting from A to B.
Table 1-4 describes the five components of a research design. The case study in Chapter 4 is
built up according to these five components.
Table 1-4: Components of research design according to Yin (1987)
Yin (1987) provides four tests to judge the quality and case study tactics to deal with them.
These tests are used to evaluate the case study. Table 1-5 consists of an overview of the four
tests, case study tactics and the case study tactics which are used for this research.
Table 1-5: Tests for judging the quality of a case study (Yin, 1987)
Test Case study tactics Case study tactics used Construct
validity
Use multiple sources of
evidence Establish chain of evidence Have key informants review draft case study report
Evidence is derived from interviews,
internal documents from SharePoint, documents from the Knowledge Management Portal and data from information system (SAP) The chain of evidences is established using concept matrices. There is a weekly meeting with the quality manager and a monthly meeting with the department head of CMP, who function as key informants
Component Function 1. Study question
‘How’ and/or ‘Why’ question
2. Proposition(s) or purpose
Limiting scope, setting focus of the study’s goals
3. Unit(s) of analysis
Defines the case, which case is going to be measured
4. The logic linking the data to the propositions
Matching pieces of information to rival patterns that can be derived from the propositions
5. Criteria for interpreting the findings Iteration between propositions and data, matching sufficiently contrasting rival patterns to data; there is no precise way of setting the criteria
11
Internal validity
Do pattern matching Do explanation building Do time-series analysis
With pattern matching the empirically collected data is compared with the predicted findings
External validity
Use replication logic in multiple-case studies
The scope of this research does not provide the time to multiple case studies
Reliability Use case study protocol Develop case study data base
Research design of a case study protocol is set up
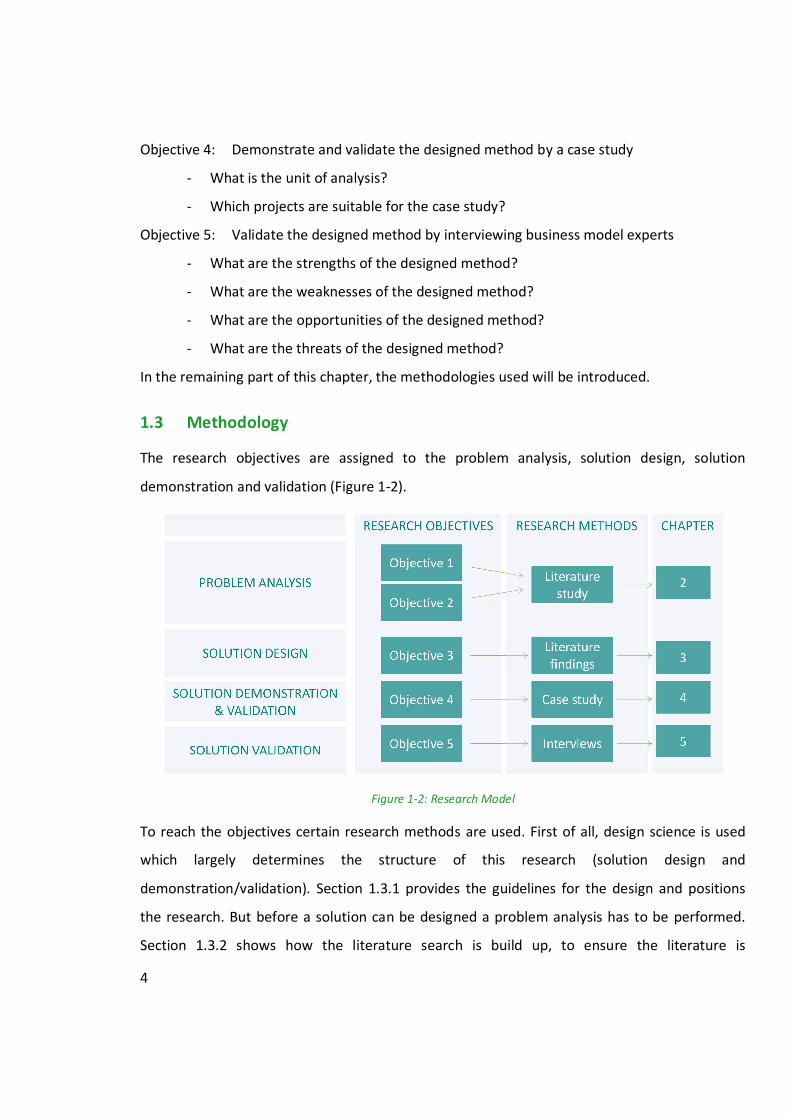
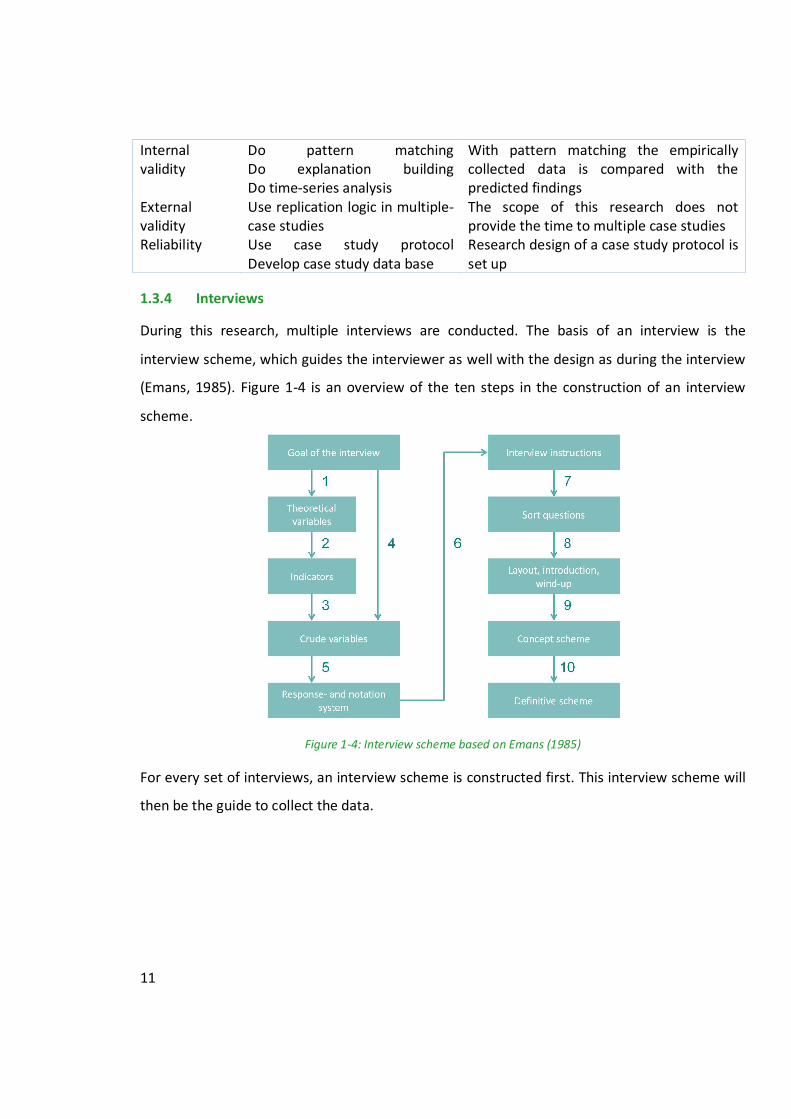
1.3.4 Interviews
During this research, multiple interviews are conducted. The basis of an interview is the
interview scheme, which guides the interviewer as well with the design as during the interview
(Emans, 1985). Figure 1-4 is an overview of the ten steps in the construction of an interview
scheme.
Figure 1-4: Interview scheme based on Emans (1985)
For every set of interviews, an interview scheme is constructed first. This interview scheme will
then be the guide to collect the data.
12
Chapter 2. Literature Review
This chapter is roughly divided in three parts, business models, R&D characteristics and
challenges. First, in the business model section (2.1) business modelling method is chosen and
presented. Then, in the of the R&D section (2.2), the R&D characteristics are discussed. In the
last section (2.3), the first two sections are combined. Based on literature reviews, the possible
techniques for the business modelling method are assessed against R&D characteristics.
2.1 Business Model
This section is an introduction into business models and its importance. Furthermore, it gives a
status on current business model research and the research gaps. Finally, it argues the choice
for the business modeling method of Meertens et al. (2011) in this research.
2.1.1 What is a business model?
A business model is basically a simplified representation of how a company works. The
simplified representation allows getting the grasp of an organisation instead of loosing yourself
into the complexity of all its internal processes, external relations and environmental
influences. Furthermore, a business model can be a supportive tool to act on possible
influences of changing factors. A few examples of this to get some feeling with the relevance:
In the nineties, in almost every home you could find a magazine of the Wehkamp, from which
you could order all kinds of products. The rise of the internet had a major influence on that
business model, a new distribution channel arrived.
Another business model change which resulted from the rise of the internet is the music
distribution industry. If you compare the business model behind CD’s and nowadays, for
example Spotify, a lot has changed.
Government regulations can be an influencing factor as well. What is, for example, the
influence of more government regulations for Banks after the crisis in 2008?
13
These are some examples from practice to show where a business model can be helpful in
times of change. Not only seems the importance of a business model intuitive logical, many
authors recognize the importance of the business model concept as well (see for overview
Vermolen, 2010). Nevertheless, no consensus concerning the definition of a business model
(Pateli & Giaglis, 2004; Vermolen, 2010) from an academic perspective has been reached. In
this research the definition given by Meertens et al. (2011) is followed:
“A business model is a simplified representation that counts for the known and inferred
properties of the business or industry as a whole, which may be used to study its characteristics
further...”
This definition will be the common denominator of this chapter.
In this section, the term business model is explained from a practical perspective as well as
from academic perspective. The next section will dig deeper into the business model research
from an academic point of view.
2.1.2 What is the status of business model research?
Business models traditionally belong to the field of organizational management (Pateli &
Giaglis, 2004), but developments in the global economy changed the traditional balance
between customer and supplier (Teece, 2010). The rise of information technology and its
impact on business models, has lead to an increase of business model research in the
Information System (IS) field (Pateli & Giaglis, 2004; Vermolen, 2010). Although this influence
led to more research on eBusiness models (for overview see Pateli & Giaglis, 2004; Vermolen,
2010), Vermolen (2010) concludes that a distinction between eBusiness models and business
models does not exist.
A literature review on business model research is already available in the existing literature.
Pateli and Giaglis (2004) researched the status of business model research and this is redone six
years later by Vermolen (2010). By summarising these papers a sufficient overview of the
current status of business model research is given.
14
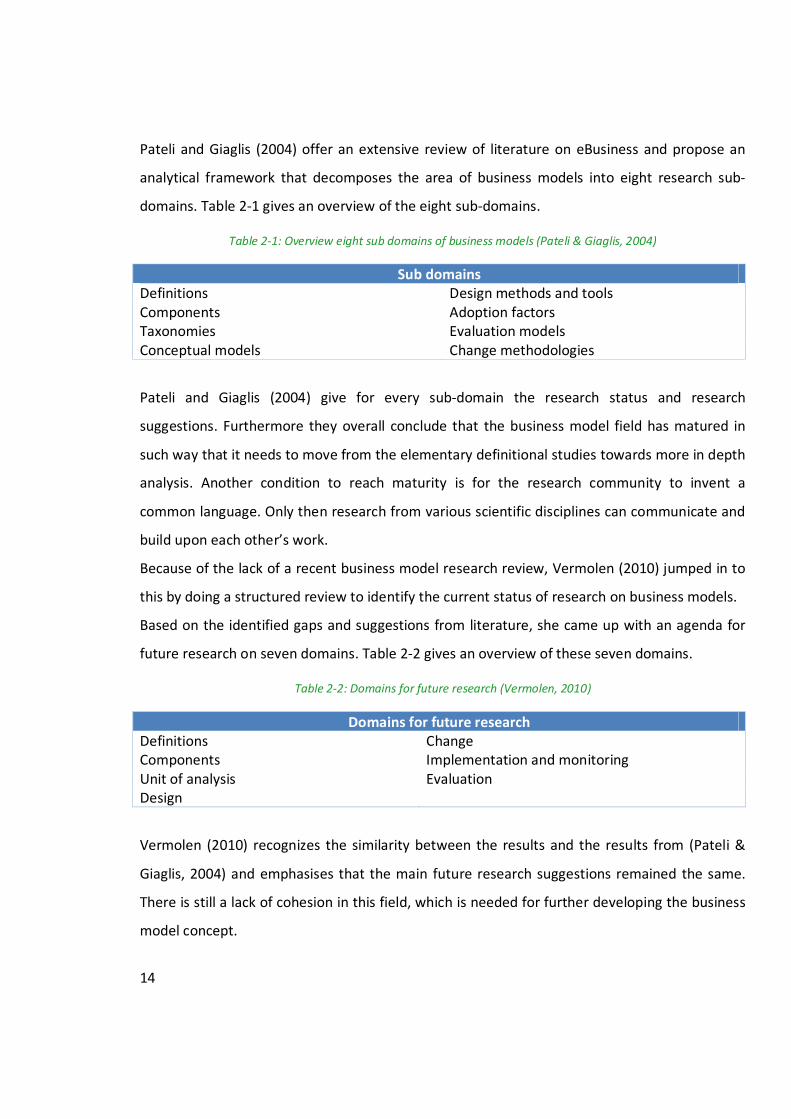
Pateli and Giaglis (2004) offer an extensive review of literature on eBusiness and propose an
analytical framework that decomposes the area of business models into eight research sub-
domains. Table 2-1 gives an overview of the eight sub-domains.
Table 2-1: Overview eight sub domains of business models (Pateli & Giaglis, 2004)
Sub domains Definitions Design methods and tools Components Adoption factors Taxonomies Evaluation models Conceptual models Change methodologies
Pateli and Giaglis (2004) give for every sub-domain the research status and research
suggestions. Furthermore they overall conclude that the business model field has matured in
such way that it needs to move from the elementary definitional studies towards more in depth
analysis. Another condition to reach maturity is for the research community to invent a
common language. Only then research from various scientific disciplines can communicate and
build upon each other’s work.
Because of the lack of a recent business model research review, Vermolen (2010) jumped in to
this by doing a structured review to identify the current status of research on business models.
Based on the identified gaps and suggestions from literature, she came up with an agenda for
future research on seven domains. Table 2-2 gives an overview of these seven domains.
Table 2-2: Domains for future research (Vermolen, 2010)
Domains for future research Definitions Change Components Implementation and monitoring Unit of analysis Evaluation Design
Vermolen (2010) recognizes the similarity between the results and the results from (Pateli &
Giaglis, 2004) and emphasises that the main future research suggestions remained the same.
There is still a lack of cohesion in this field, which is needed for further developing the business
model concept.
15
This summary does not aim at given a full overview of the available literature. For such an
overview the two founding articles (Pateli & Giaglis, 2004; Vermolen, 2010) of this section are
useful. The goal is to give some insight in the current status and especially in the domains of the
research gaps. Based on Vermolen (2010) Meertens et al. (2011) concludes that there is no
methodological approach in literature for the design and specification of business models. In an
attempt to make business modelling a science instead of an art, Meertens et al. (2011)
proposes a method which enables the development of business models in a structured and
repeatable manner. Meertens et al. (2011) jump in one of the research gaps defined by
Vermolen (2010), as ‘Design’, and Pateli and Giaglis (2004), as ‘Design tools’.
In conclusion, the main research question of this research implies a method is needed to build a
business model and for scientific purposes such a method needs to be reproducible. Based on
the research of Vermolen (2010) Meertens et al. (2011) concludes that there is no such method
available and proposes a method to build a business model which is structured and repeatable.
Because there is no alternative, the decision to use the business modelling method of Meertens
et al. (2011) to answer the main research question is considered valid. In the next section this
method is described.
2.1.3 Business Modelling Method (BMM)
Meertens et al. (2011) proposes the Business Modelling Method, which from here on is
referred to as BMM. The application of this method results in at least two business models. One
business model which reflects the ‘as-is’ situation or the current situation of the business and
the other one which reflects ‘to-be’ business model(s). This represents the potential impact on
the business model after adoption of innovative technologies or more efficient business
processes (Meertens et al., 2011). This is a direct representation of the definition of business
models defined in section 2.1.1.
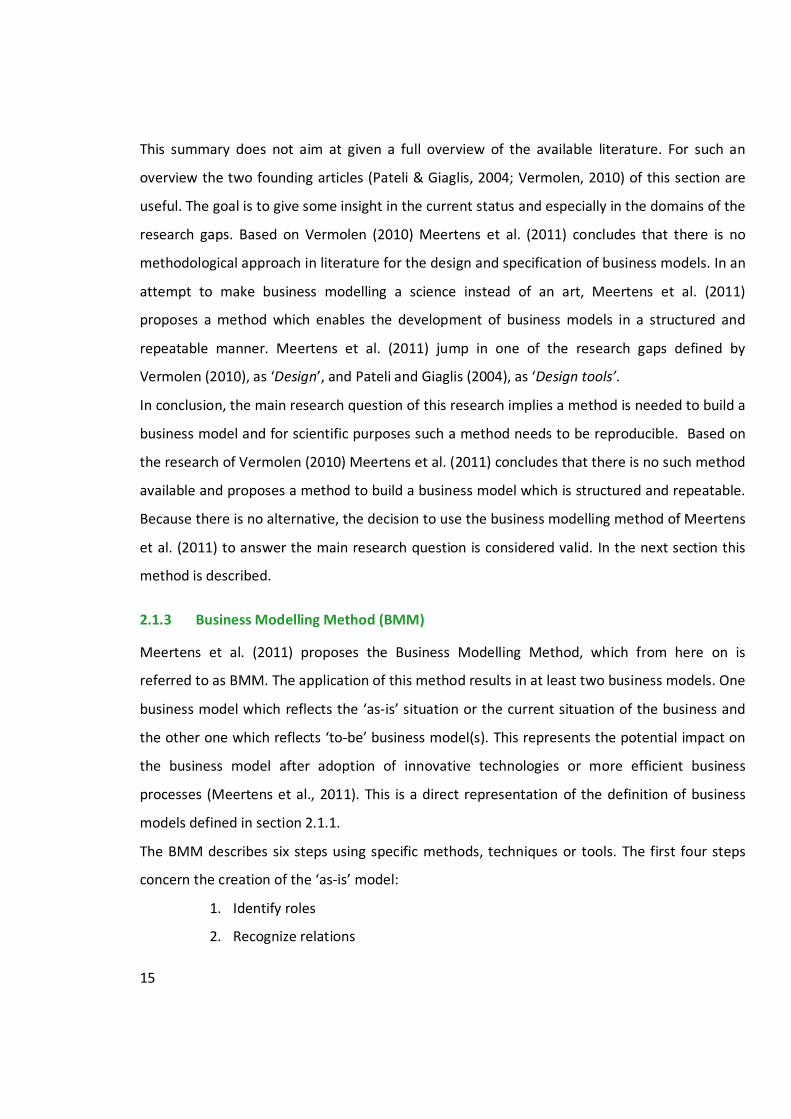
The BMM describes six steps using specific methods, techniques or tools. The first four steps
concern the creation of the ‘as-is’ model:
1. Identify roles
2. Recognize relations
16
3. Specify activities
4. Quantify model
The remaining two steps concern developing the ‘to-be’ model:
1. Design alternatives
2. Analyse alternatives
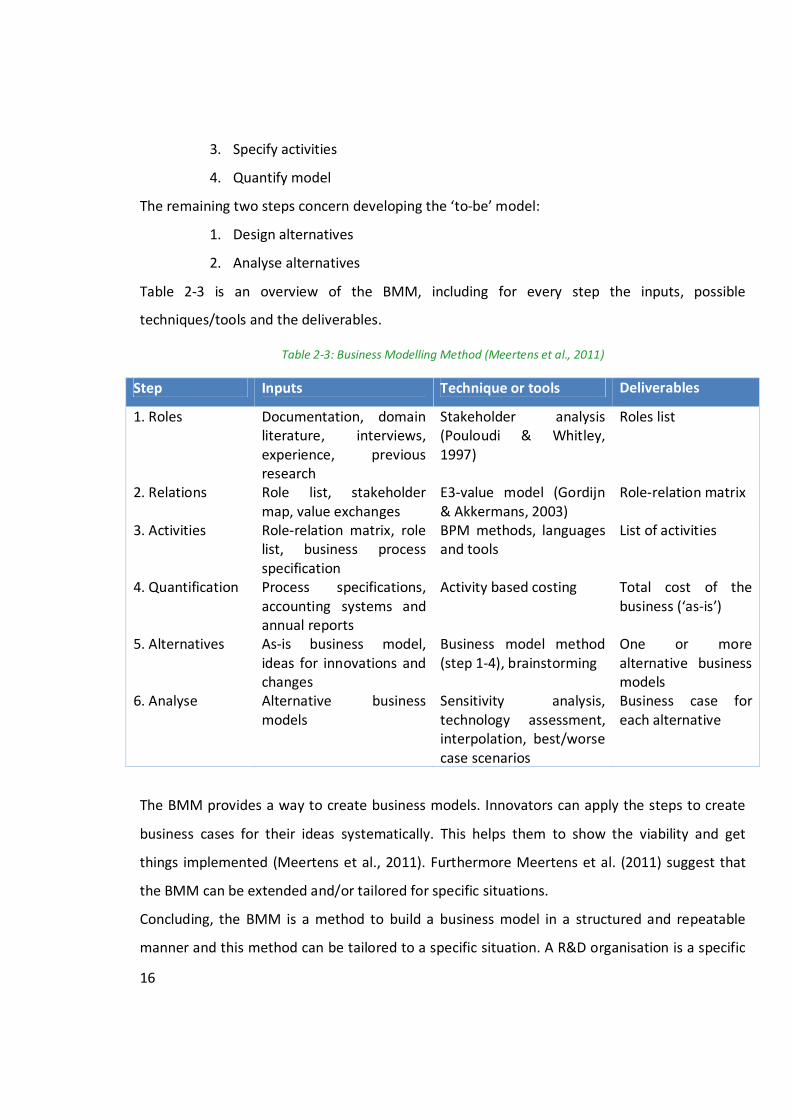
Table 2-3 is an overview of the BMM, including for every step the inputs, possible
techniques/tools and the deliverables.
Table 2-3: Business Modelling Method (Meertens et al., 2011)
Step Inputs Technique or tools Deliverables
1. Roles Documentation, domain literature, interviews, experience, previous research
Stakeholder analysis (Pouloudi & Whitley, 1997)
Roles list
2. Relations Role list, stakeholder map, value exchanges
E3-value model (Gordijn & Akkermans, 2003)
Role-relation matrix
3. Activities Role-relation matrix, role list, business process specification
BPM methods, languages and tools
List of activities
4. Quantification Process specifications, accounting systems and annual reports
Activity based costing Total cost of the business (‘as-is’)
5. Alternatives As-is business model, ideas for innovations and changes
Business model method (step 1-4), brainstorming
One or more alternative business models
6. Analyse Alternative business models
Sensitivity analysis, technology assessment, interpolation, best/worse case scenarios
Business case for each alternative
The BMM provides a way to create business models. Innovators can apply the steps to create
business cases for their ideas systematically. This helps them to show the viability and get
things implemented (Meertens et al., 2011). Furthermore Meertens et al. (2011) suggest that
the BMM can be extended and/or tailored for specific situations.
Concluding, the BMM is a method to build a business model in a structured and repeatable
manner and this method can be tailored to a specific situation. A R&D organisation is a specific
17
situation and therefore the BMM could be used in search of an answer to the research
question.
2.2 Characteristics R&D
For an extensive literature review on the history of R&D and the various terminologies go to
Appendix E). In the section 2.1.1 the following definition is given:
“A business model is a simplified representation that counts for the known and inferred
properties of the business or industry as a whole, which may be used to study its characteristics
further...”
The last section ended with the remark that the BMM can be used to answer the research
question by tailoring the method to a specific situation. This specific situation is of course a
R&D organisation which means that the known and inferred properties of R&D are needed to
tailor the method. In this section is searched for the R&D characteristics by a literature study.
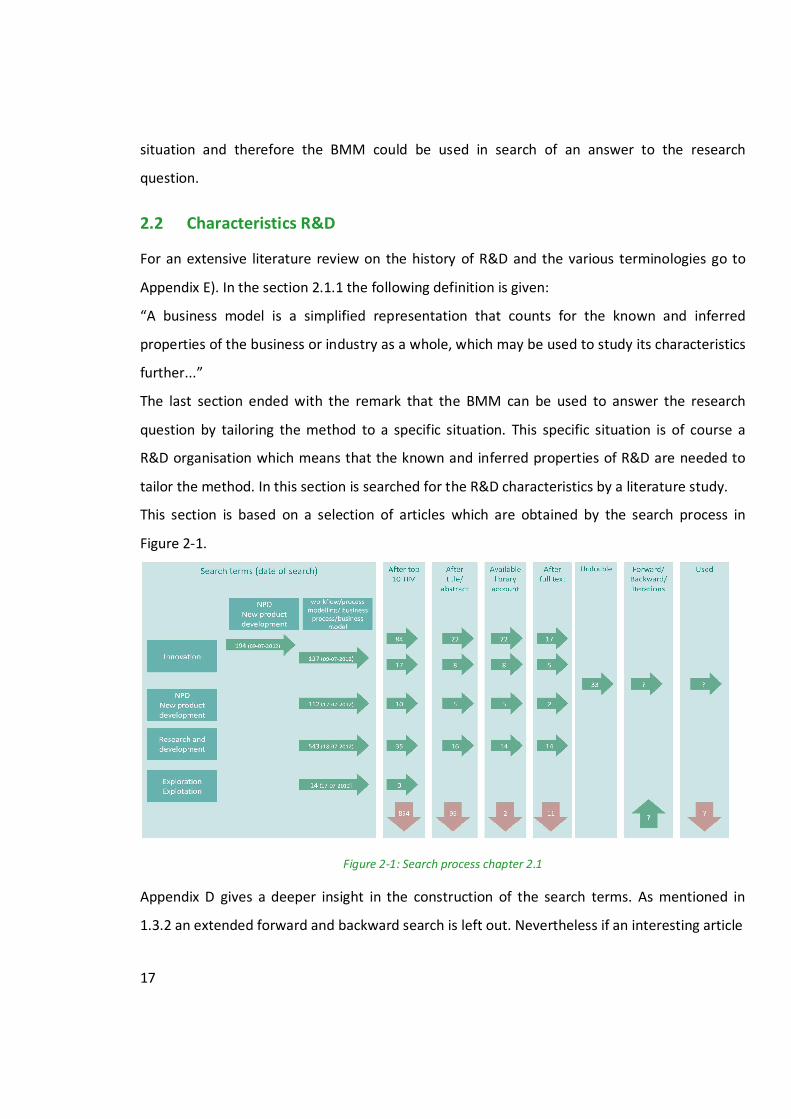
This section is based on a selection of articles which are obtained by the search process in
Figure 2-1.
Figure 2-1: Search process chapter 2.1
Appendix D gives a deeper insight in the construction of the search terms. As mentioned in
1.3.2 an extended forward and backward search is left out. Nevertheless if an interesting article
18
is selected using citations it can be found in the right arrow in the block
forward/backward/iteration in Figure 2-1. The arrow at the bottom of this block stands for
articles conducted from iterations. These iterations are the result of the relevant articles which
appeared during the literature research in section 2.3. Some terms are used from the business
engineering field, this delineation is done, because of the great amount of articles in the
innovation field which is not relevant for this research. Therefore, to ensure the literature
review is manageable, the business engineering perspective is already taken into account. Again
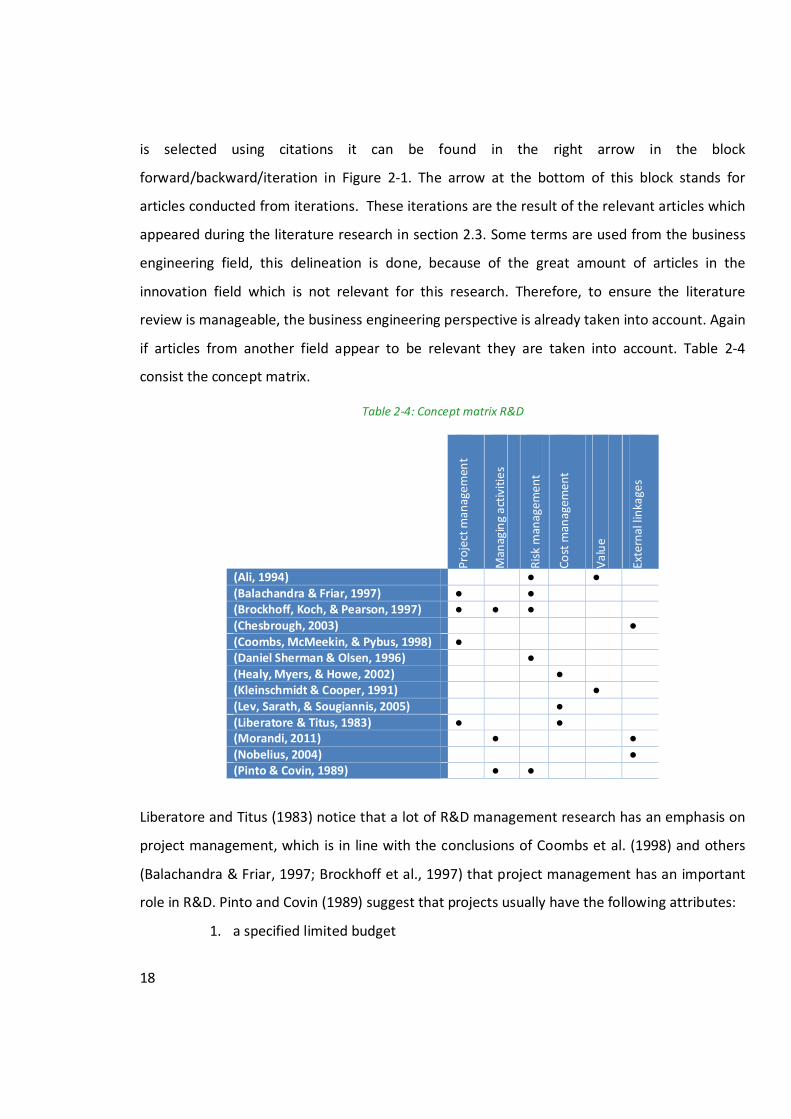
if articles from another field appear to be relevant they are taken into account. Table 2-4
consist the concept matrix.
Table 2-4: Concept matrix R&D
Pro
ject
man
agem
ent
Man
agin
g a
ctiv
itie
s
Ris
k m
anag
emen
t
Co
st m
anag
emen
t
Va
lue
Exte
rnal
lin
kage
s
(Ali, 1994) ● ● (Balachandra & Friar, 1997) ● ● (Brockhoff, Koch, & Pearson, 1997) ● ● ● (Chesbrough, 2003) ● (Coombs, McMeekin, & Pybus, 1998) ● (Daniel Sherman & Olsen, 1996) ● (Healy, Myers, & Howe, 2002) ● (Kleinschmidt & Cooper, 1991) ● (Lev, Sarath, & Sougiannis, 2005) ● (Liberatore & Titus, 1983) ● ● (Morandi, 2011) ● ● (Nobelius, 2004) ● (Pinto & Covin, 1989) ● ●
Liberatore and Titus (1983) notice that a lot of R&D management research has an emphasis on
project management, which is in line with the conclusions of Coombs et al. (1998) and others
(Balachandra & Friar, 1997; Brockhoff et al., 1997) that project management has an important
role in R&D. Pinto and Covin (1989) suggest that projects usually have the following attributes:
1. a specified limited budget
19
2. a specified time frame or duration
3. a preordained performance goal or set of goals
4. a series of complex, interrelated activities
Based on these attributes R&D specific characteristics are exposed in the literature review.
There may be overlap between the different characteristics because they are intertwined.
Therefore the different classifications do not have hard boundaries and are only for
clarification.
Risk management
Pinto and Covin (1989) notice the overt risks which are familiar to R&D projects. Ali (1994)
mentions a lack or loss of project support and uncertain resource requirements. The duration of
a R&D project can be very long (Brockhoff et al., 1997) especially for radical innovation
(McDermott & O'Connor, 2002; Veryzer Jr, 1998), which makes it harder and more risky to
determine the allocation of resources and set reasonable goals. The same goes for project
support which is important for R&D, because R&D benefits are often only seen on the long
term and success rates are often low (Daniel Sherman & Olsen, 1996; Pinto & Covin, 1989). The
outcomes of R&D projects are difficult to predict (Balachandra & Friar, 1997; Brockhoff et al.,
1997; Pinto & Covin, 1989) and together with the managerial aversion of taking risk, makes risk
management an important R&D characteristic.
Managing activities
R&D activities are often considered as a black box, which is very hard to systematically manage
and control. According to Brockhoff et al. (1997) R&D activities are more often none repetitive.
Which is in line with Pinto and Covin (1989), who state that activities involved in R&D project
execution are less amenable to scheduling. A project is a series of complex interrelated
activities and the task uncertainty (Morandi, 2011) involving R&D processes makes it even more
complex. However, because it is difficult to manage and control R&D activities, this does not
mean it should be neglected. As mentioned before, there is a common understanding that the
distinguished types of innovation need to be managed differently. Incremental innovation is
more structured than radical innovation and therefore the same management and control
techniques cannot always be used interchangeable. Section

20
21
Specify activities0 offers a deeper insight in the different management models for radical and
incremental innovation.
Value
Value is hard to determine because the success of the outcome is not known. Even if the
outcome will definitely lead to a patent, then the lifetime of that outcome or product cannot be
predicted. The expected returns from incremental innovations are lower than from radical
innovations (Kleinschmidt & Cooper, 1991). However, the risk associated with their
development and commercialisation is lower than from radical innovations, incremental
innovations are important for the firm’s overall profitability (Kleinschmidt & Cooper, 1991).
Cost management
Liberatore and Titus (1983) address the existence of cost-effective techniques which can
improve the R&D project management for. However, costing techniques may not directly apply
because of availability of information, which is in line with earlier mentioned uncertainties.
Uncertainty is why financial accounting rules treat R&D as an expense instead of the
capitalisation of costs (Healy et al., 2002; Lev et al., 2005). Because the success of a R&D project
is not known as well as the eventual life time of the R&D outcome, it is impossible to capitalise
the R&D costs without the big risk of manipulation of earnings (Healy et al., 2002; Lev et al.,
2005). The downside is the intangible assets are often undervalued.
External linkages
In Appendix E the five generations of R&D are mentioned and characteristic for the fifth
generation is the emphasis on external linkages, in other words R&D as a network. The focus is
on collaboration within a wider system, involving competitors, suppliers, distributors etc.
(Nobelius, 2004). This is in line with open innovation proposed by Chesbrough (2003), which he
defines as a paradigm that assumes that firms can and should use external ideas as well as
internal ideas, and internal and external paths to market, as the firms look to advance their
technology.

22
2.3 Challenges
In this section the first four steps of the BMM are assessed against the R&D characteristics from
section 2.3. Step 5 and 6 are steps who are based on the first four steps or use general
techniques such as brainstorming. There is no need to assess them against the R&D
characteristics. Meertens et al. (2011) proposed specific methods, techniques or tools that are
suitable, but they remark that other techniques may be useful and applicable as well.
Therefore, based on literature reviews for every step, a possible set of suitable techniques is
presented. This section forms the basis for the solution design in the chapter 4, where a
suitable technique is chosen, argued and presented.
2.3.1 Identify roles
Proposed technique – Stakeholder Analysis
The deliverable of this step is to create a role list. A stakeholder analysis (SA) is proposed as a
technique to identify the different roles (Meertens et al., 2011). In the presented case study the
SA method of Pouloudi and Whitley (1997) is used. This SA arose from the IS field and aims at
inter-organisational information systems. From the perspective of ‘External linkages’ this SA is
suitable for R&D, because of the focus on external stakeholders.
Literature review
Figure 2-2 forms the search process of the literature review.
Figure 2-2: Search process 2.3.1
23
The search process only results in one article (Elias, Cavana, & Jackson, 2002) which satisfies the
selection criteria. In this article stakeholder management is verified as an important aspect of
R&D management by various examples in literature (see for overview Elias et al., 2002).
Furthermore a SA for R&D project management is presented. The proposed SA provides a
systematic approach to identify and classify who the stakeholders are. It furthermore describes
how to analyse the stakeholders’ interests. These interests are used to map the changing role
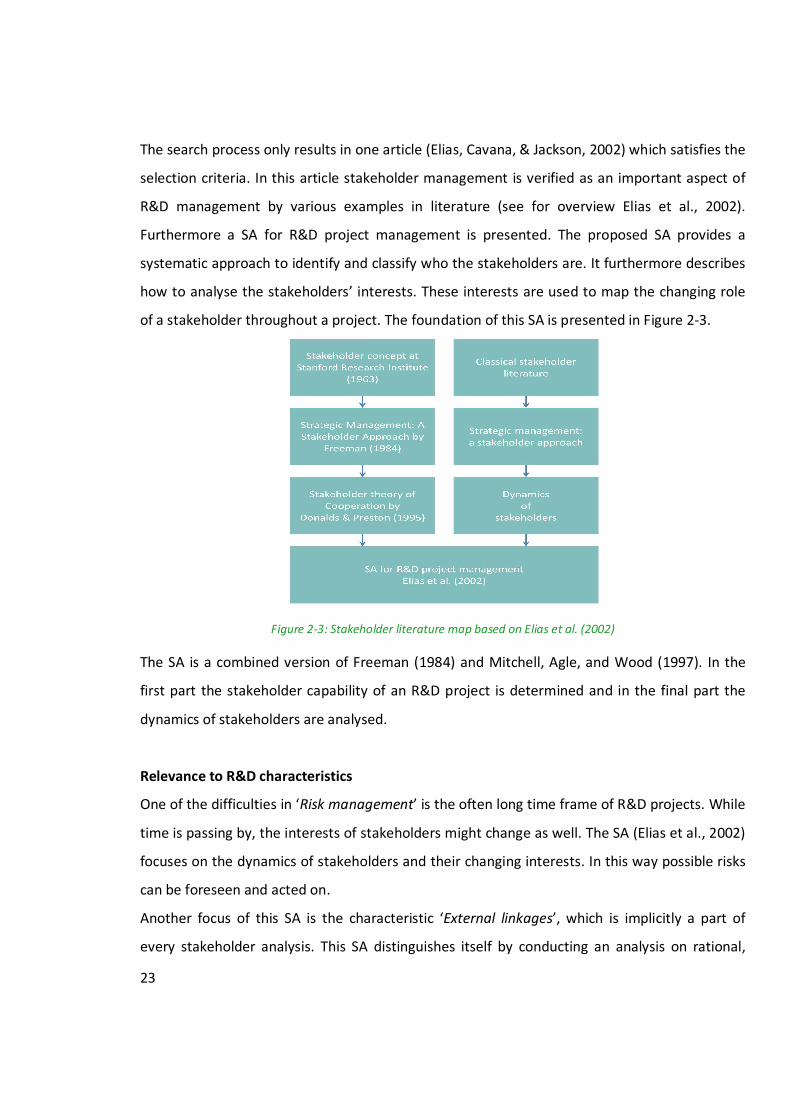
of a stakeholder throughout a project. The foundation of this SA is presented in Figure 2-3.
Figure 2-3: Stakeholder literature map based on Elias et al. (2002)
The SA is a combined version of Freeman (1984) and Mitchell, Agle, and Wood (1997). In the
first part the stakeholder capability of an R&D project is determined and in the final part the
dynamics of stakeholders are analysed.
Relevance to R&D characteristics
One of the difficulties in ‘Risk management’ is the often long time frame of R&D projects. While
time is passing by, the interests of stakeholders might change as well. The SA (Elias et al., 2002)
focuses on the dynamics of stakeholders and their changing interests. In this way possible risks
can be foreseen and acted on.
Another focus of this SA is the characteristic ‘External linkages’, which is implicitly a part of
every stakeholder analysis. This SA distinguishes itself by conducting an analysis on rational,
24
process and transactional level. This way a deeper insight is given in the management of
relations as well as the transactions that take place. This information is supporting in the
management of risks.
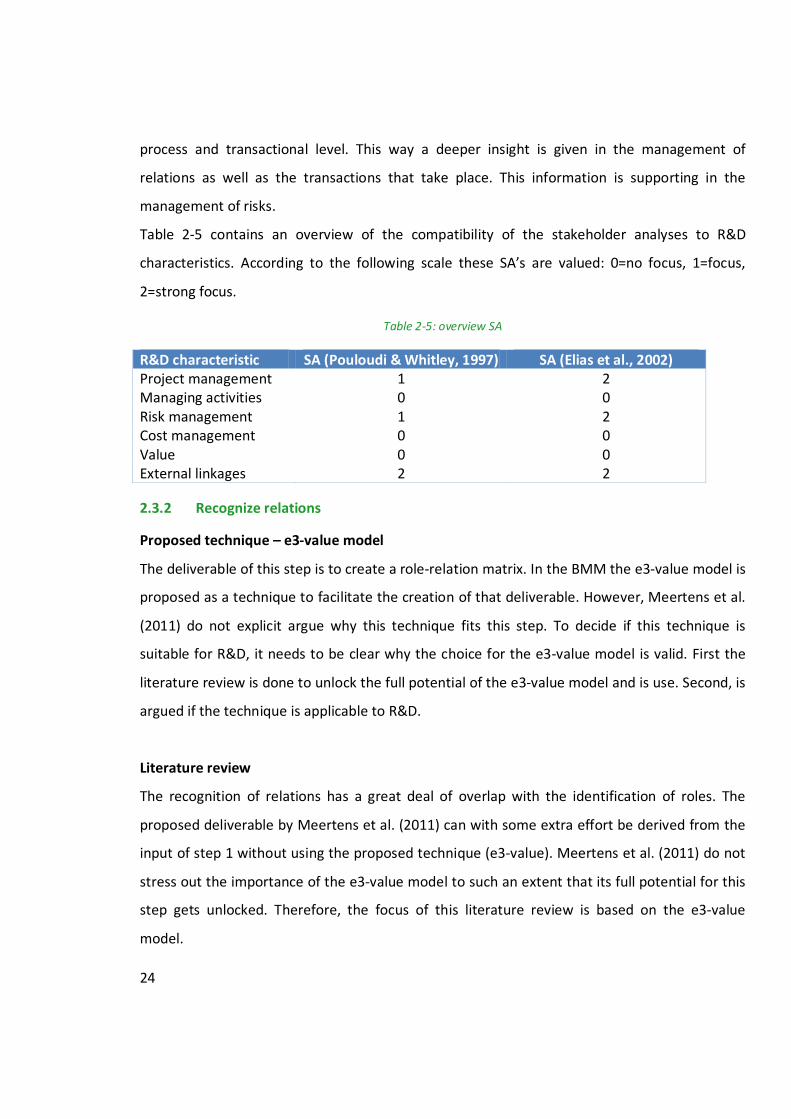
Table 2-5 contains an overview of the compatibility of the stakeholder analyses to R&D
characteristics. According to the following scale these SA’s are valued: 0=no focus, 1=focus,
2=strong focus.
Table 2-5: overview SA
R&D characteristic SA (Pouloudi & Whitley, 1997) SA (Elias et al., 2002) Project management 1 2 Managing activities 0 0 Risk management 1 2 Cost management 0 0 Value 0 0 External linkages 2 2
2.3.2 Recognize relations
Proposed technique – e3-value model
The deliverable of this step is to create a role-relation matrix. In the BMM the e3-value model is
proposed as a technique to facilitate the creation of that deliverable. However, Meertens et al.
(2011) do not explicit argue why this technique fits this step. To decide if this technique is
suitable for R&D, it needs to be clear why the choice for the e3-value model is valid. First the
literature review is done to unlock the full potential of the e3-value model and is use. Second, is
argued if the technique is applicable to R&D.
Literature review
The recognition of relations has a great deal of overlap with the identification of roles. The
proposed deliverable by Meertens et al. (2011) can with some extra effort be derived from the
input of step 1 without using the proposed technique (e3-value). Meertens et al. (2011) do not
stress out the importance of the e3-value model to such an extent that its full potential for this
step gets unlocked. Therefore, the focus of this literature review is based on the e3-value
model.
25
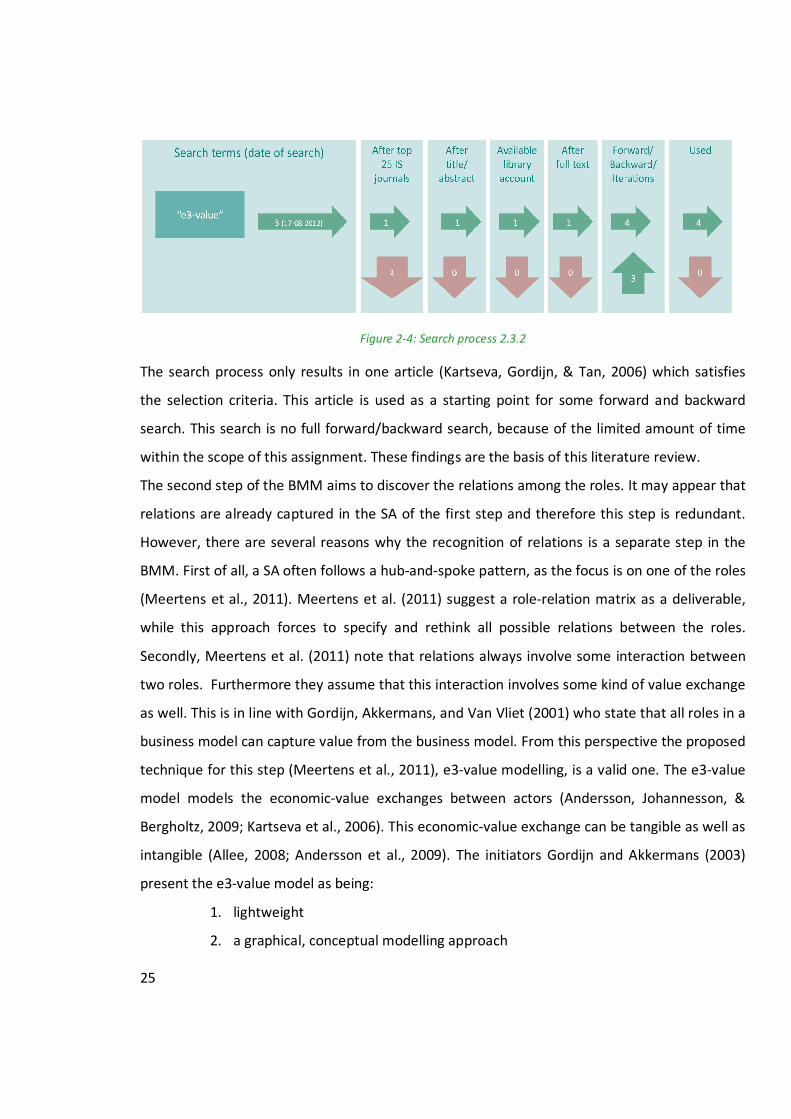
Figure 2-4: Search process 2.3.2
The search process only results in one article (Kartseva, Gordijn, & Tan, 2006) which satisfies
the selection criteria. This article is used as a starting point for some forward and backward
search. This search is no full forward/backward search, because of the limited amount of time
within the scope of this assignment. These findings are the basis of this literature review.
The second step of the BMM aims to discover the relations among the roles. It may appear that
relations are already captured in the SA of the first step and therefore this step is redundant.
However, there are several reasons why the recognition of relations is a separate step in the
BMM. First of all, a SA often follows a hub-and-spoke pattern, as the focus is on one of the roles
(Meertens et al., 2011). Meertens et al. (2011) suggest a role-relation matrix as a deliverable,
while this approach forces to specify and rethink all possible relations between the roles.
Secondly, Meertens et al. (2011) note that relations always involve some interaction between
two roles. Furthermore they assume that this interaction involves some kind of value exchange
as well. This is in line with Gordijn, Akkermans, and Van Vliet (2001) who state that all roles in a
business model can capture value from the business model. From this perspective the proposed
technique for this step (Meertens et al., 2011), e3-value modelling, is a valid one. The e3-value
model models the economic-value exchanges between actors (Andersson, Johannesson, &
Bergholtz, 2009; Kartseva et al., 2006). This economic-value exchange can be tangible as well as
intangible (Allee, 2008; Andersson et al., 2009). The initiators Gordijn and Akkermans (2003)
present the e3-value model as being:
1. lightweight
2. a graphical, conceptual modelling approach
26
3. based on multiple viewpoints
4. exploits scenarios, both operational and evolutionary
5. recognising the importance of economic value creation and distribution
Property 3 and 5 are in line with the choice of this model in this step. The multiple view
approach is the missing link between the SA and the role-relation matrix. Furthermore the
focus on value exchange fits the property of a relation being an interaction between roles with
some kind of value exchange. The remaining properties 1, 2 and 4 are useful in step 5 of the
BMM. The light weighted and visual oriented approach facilitates the brainstorming and
generating scenarios, which are important aspects of step 5.
Relevance to R&D characteristics
Now is clear why the e3-value model is suitable for this step. The next step is to decide if this
technique is suitable according to R&D characteristics as well. Two R&D characteristics which
are relevant for this step are ‘Value’ and ‘External linkages’. The value exchange of intangible
assets is an exchange occurs often while knowledge transfer goes hand in hand with R&D. By
exposing the tangible value exchanges as well as the intangible ones, the e3-value model is
from a ‘Value’ perspective suitable for R&D. This automatically shows that this model is suitable
from the perspective of ‘External linkages’ as well. External linkages are the relations between
different roles, for example a supplier, and the exchange of for example knowledge. The
strength of the e3-value model lies in business network environments and an organisation
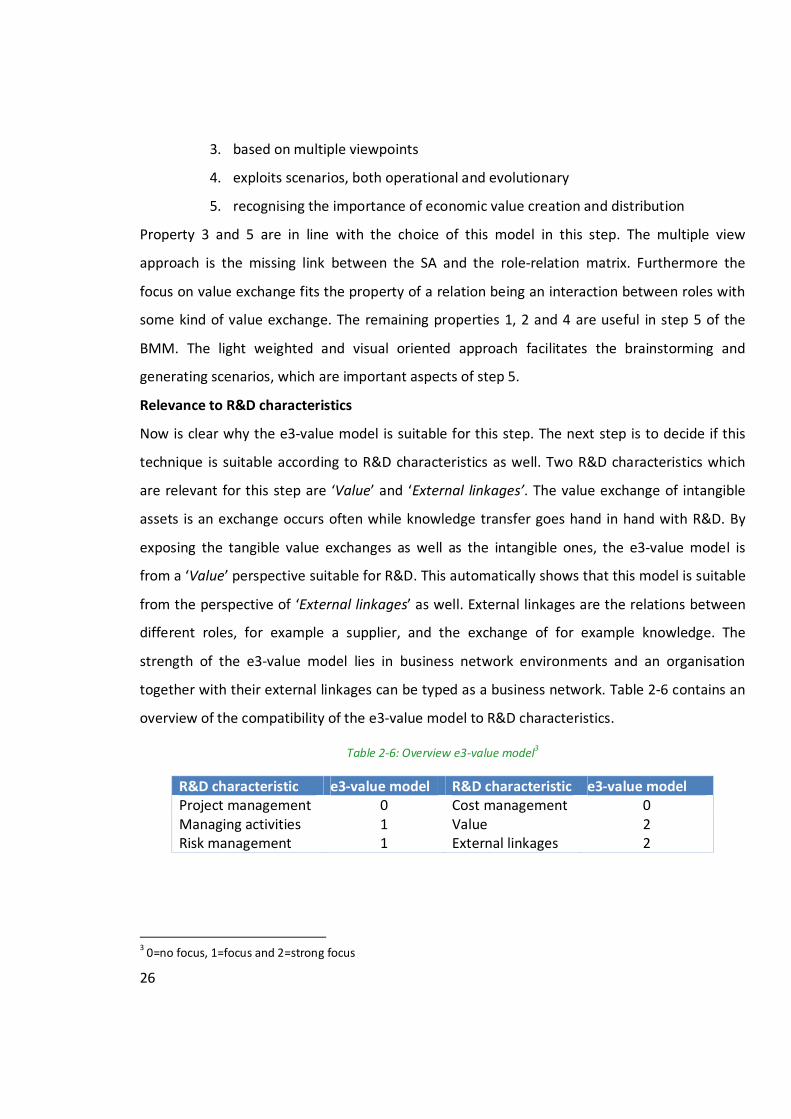
together with their external linkages can be typed as a business network. Table 2-6 contains an
overview of the compatibility of the e3-value model to R&D characteristics.
Table 2-6: Overview e3-value model3
R&D characteristic e3-value model R&D characteristic e3-value model Project management 0 Cost management 0 Managing activities 1 Value 2 Risk management 1 External linkages 2
3 0=no focus, 1=focus and 2=strong focus
27
2.3.3 Specify activities
Proposed technique(s) – BPM methods, languages and tools
The deliverable of this step is to create a list of business activities, which together form the
qualitative model. This qualitative model reveals what must happen for the business to function
properly (Meertens et al., 2011). The basis for this step forms the role-relation matrix, because
a relation between two roles requires activities by both roles. To visualize this, think of the
example of a hairdresser and his customer. The relation between these two roles is based on
the payment of the customer and the coiffure from the hairdresser. The coiffure is designed by
for example two activities washing and cutting. Meertens et al. (2011) propose techniques from
business process management to create the attended output. However, in contrast to the
example, R&D activities are considered as a black box, which makes them hard to specify. It is
possible to cluster activities in groups, but the number of techniques offered by business
process management is considerable, it is necessary to look deeper into the field of business
processes in R&D.
Literature review
Process orientation and thinking has entered the engineering environment in the last two
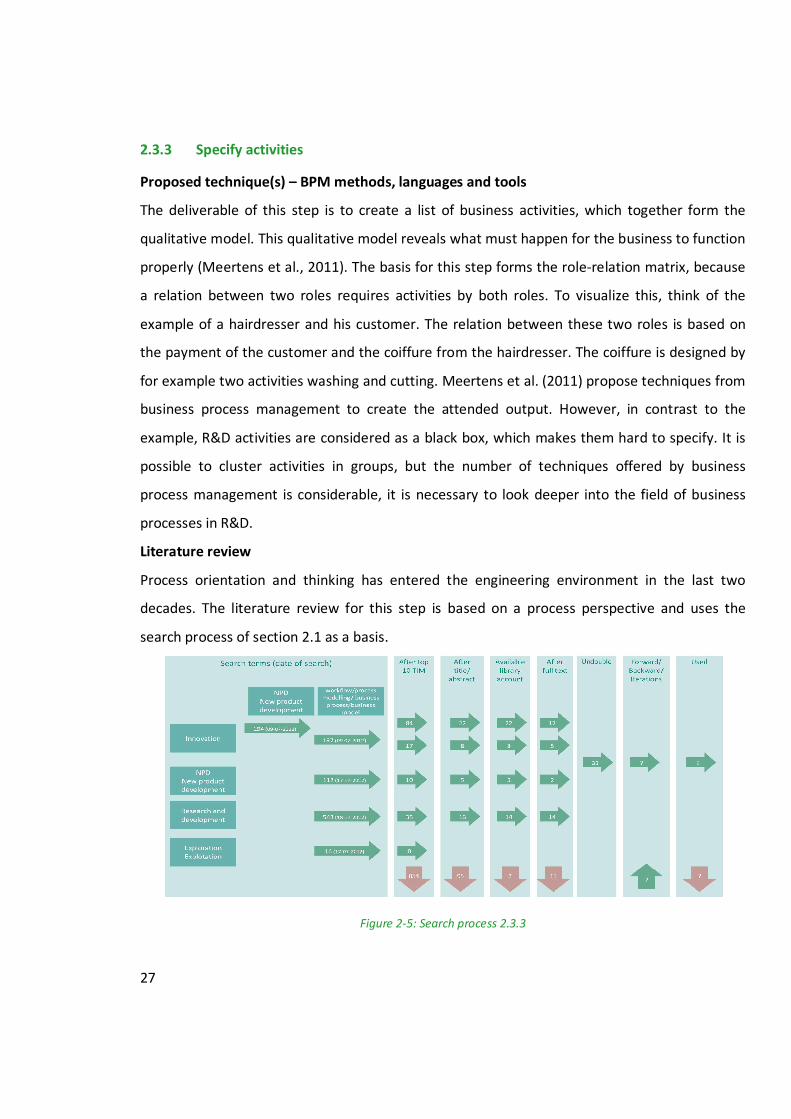
decades. The literature review for this step is based on a process perspective and uses the
search process of section 2.1 as a basis.
Figure 2-5: Search process 2.3.3
28
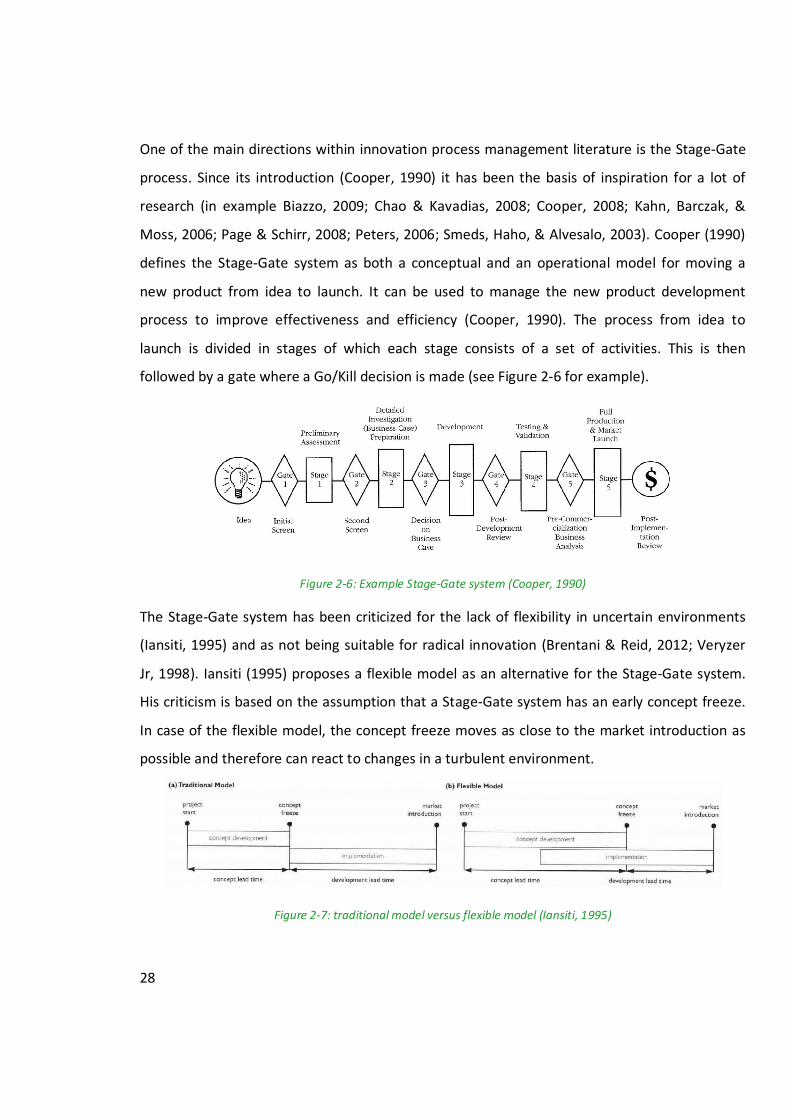
One of the main directions within innovation process management literature is the Stage-Gate
process. Since its introduction (Cooper, 1990) it has been the basis of inspiration for a lot of
research (in example Biazzo, 2009; Chao & Kavadias, 2008; Cooper, 2008; Kahn, Barczak, &
Moss, 2006; Page & Schirr, 2008; Peters, 2006; Smeds, Haho, & Alvesalo, 2003). Cooper (1990)
defines the Stage-Gate system as both a conceptual and an operational model for moving a
new product from idea to launch. It can be used to manage the new product development
process to improve effectiveness and efficiency (Cooper, 1990). The process from idea to
launch is divided in stages of which each stage consists of a set of activities. This is then
followed by a gate where a Go/Kill decision is made (see Figure 2-6 for example).
Figure 2-6: Example Stage-Gate system (Cooper, 1990)
The Stage-Gate system has been criticized for the lack of flexibility in uncertain environments
(Iansiti, 1995) and as not being suitable for radical innovation (Brentani & Reid, 2012; Veryzer
Jr, 1998). Iansiti (1995) proposes a flexible model as an alternative for the Stage-Gate system.
His criticism is based on the assumption that a Stage-Gate system has an early concept freeze.
In case of the flexible model, the concept freeze moves as close to the market introduction as
possible and therefore can react to changes in a turbulent environment.
Figure 2-7: traditional model versus flexible model (Iansiti, 1995)
29
Figure 2-7 shows the differences between the Stage-Gate system (traditional model) and the
flexible model. According to Iansiti (1995) in the flexible model the concept development and
implementation are tightly linked set of activities and not sequential phases like in the
traditional model. By overlapping these two stages and thereby moving the concept freeze, the
flexible model allows being responsive to in a turbulent environment. This perspective is
followed by other authors as well (in example Haque & Pawar, 2001; Kamoche & e Cunha,
2001).
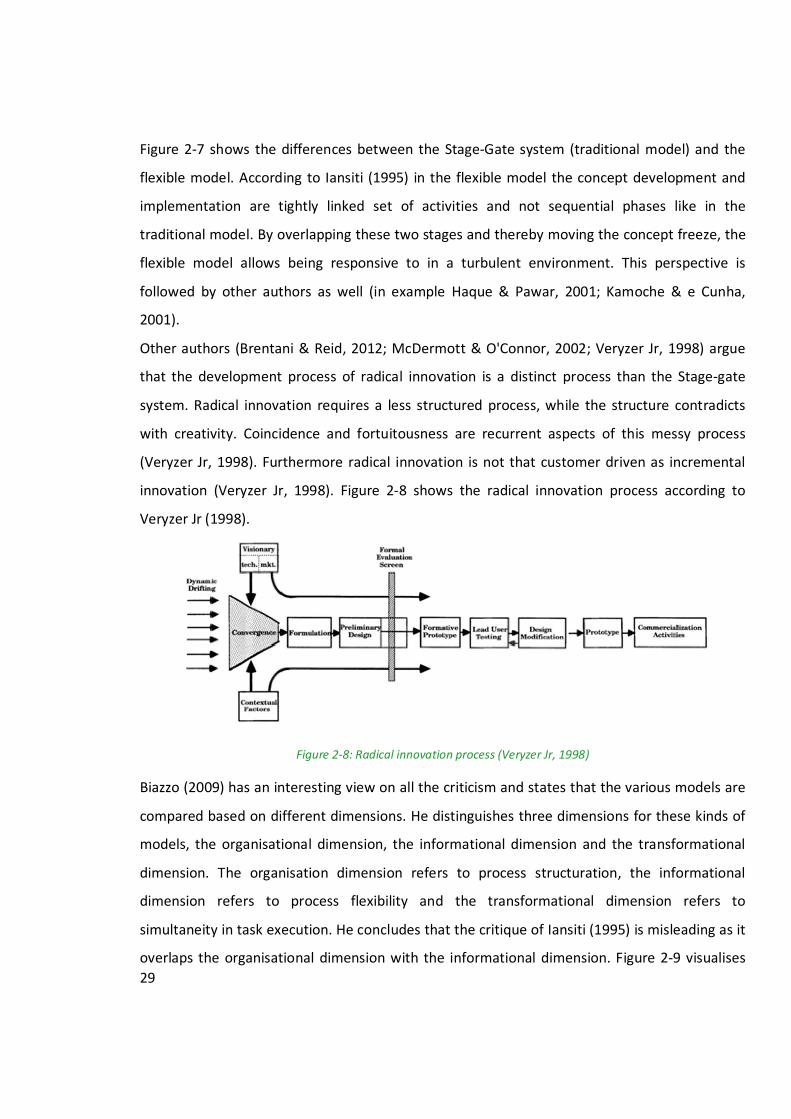
Other authors (Brentani & Reid, 2012; McDermott & O'Connor, 2002; Veryzer Jr, 1998) argue
that the development process of radical innovation is a distinct process than the Stage-gate
system. Radical innovation requires a less structured process, while the structure contradicts
with creativity. Coincidence and fortuitousness are recurrent aspects of this messy process
(Veryzer Jr, 1998). Furthermore radical innovation is not that customer driven as incremental
innovation (Veryzer Jr, 1998). Figure 2-8 shows the radical innovation process according to
Veryzer Jr (1998).
Figure 2-8: Radical innovation process (Veryzer Jr, 1998)
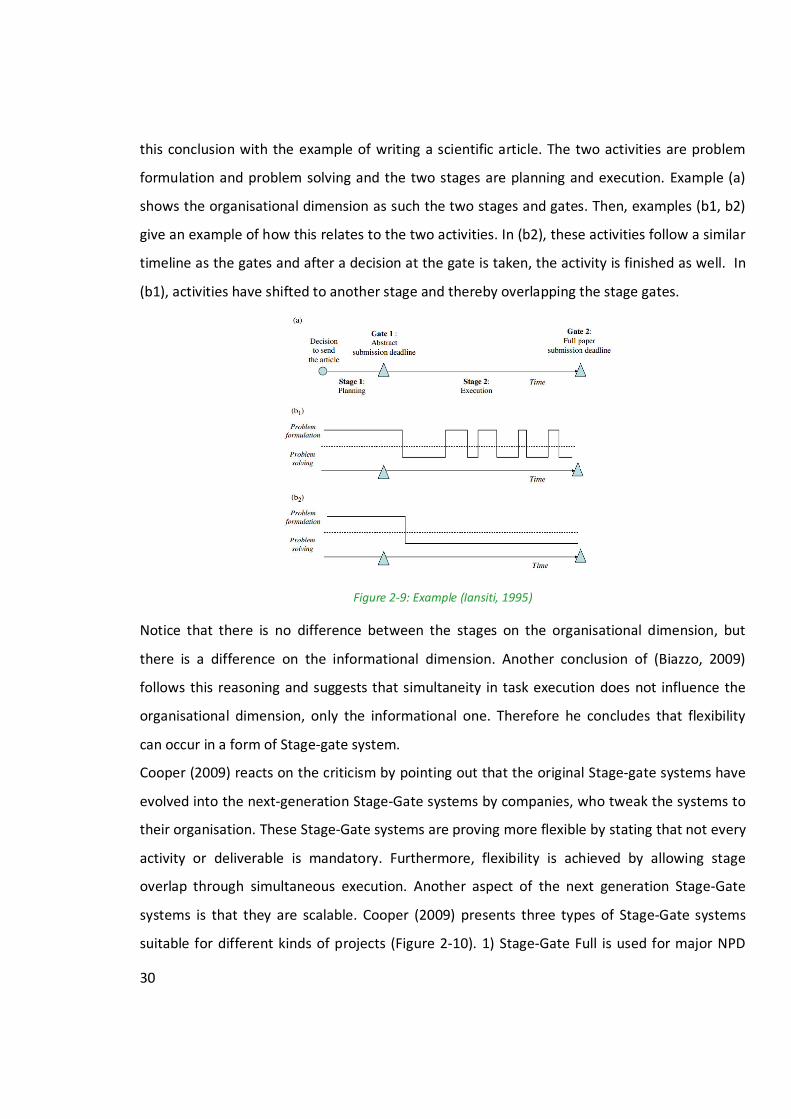
Biazzo (2009) has an interesting view on all the criticism and states that the various models are
compared based on different dimensions. He distinguishes three dimensions for these kinds of
models, the organisational dimension, the informational dimension and the transformational
dimension. The organisation dimension refers to process structuration, the informational
dimension refers to process flexibility and the transformational dimension refers to
simultaneity in task execution. He concludes that the critique of Iansiti (1995) is misleading as it
overlaps the organisational dimension with the informational dimension. Figure 2-9 visualises
30
this conclusion with the example of writing a scientific article. The two activities are problem
formulation and problem solving and the two stages are planning and execution. Example (a)
shows the organisational dimension as such the two stages and gates. Then, examples (b1, b2)
give an example of how this relates to the two activities. In (b2), these activities follow a similar
timeline as the gates and after a decision at the gate is taken, the activity is finished as well. In
(b1), activities have shifted to another stage and thereby overlapping the stage gates.
Figure 2-9: Example (Iansiti, 1995)
Notice that there is no difference between the stages on the organisational dimension, but
there is a difference on the informational dimension. Another conclusion of (Biazzo, 2009)
follows this reasoning and suggests that simultaneity in task execution does not influence the
organisational dimension, only the informational one. Therefore he concludes that flexibility
can occur in a form of Stage-gate system.
Cooper (2009) reacts on the criticism by pointing out that the original Stage-gate systems have
evolved into the next-generation Stage-Gate systems by companies, who tweak the systems to
their organisation. These Stage-Gate systems are proving more flexible by stating that not every
activity or deliverable is mandatory. Furthermore, flexibility is achieved by allowing stage
overlap through simultaneous execution. Another aspect of the next generation Stage-Gate
systems is that they are scalable. Cooper (2009) presents three types of Stage-Gate systems
suitable for different kinds of projects (Figure 2-10). 1) Stage-Gate Full is used for major NPD
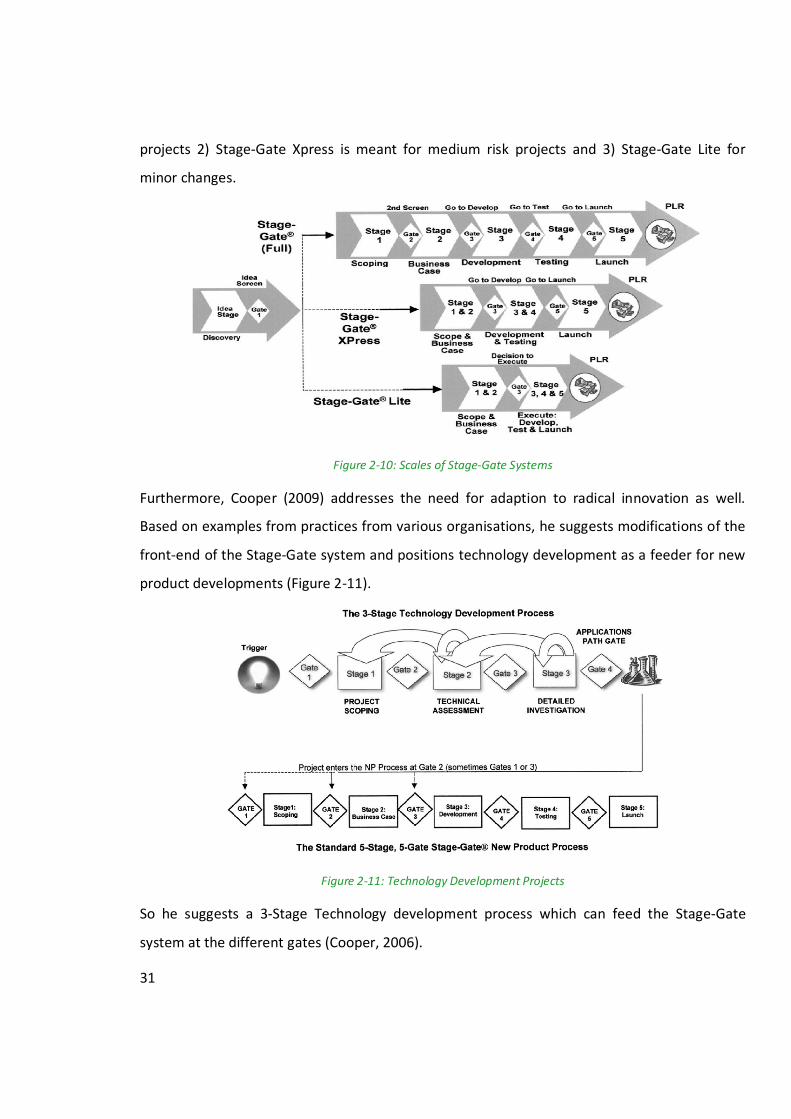
31
projects 2) Stage-Gate Xpress is meant for medium risk projects and 3) Stage-Gate Lite for
minor changes.
Figure 2-10: Scales of Stage-Gate Systems
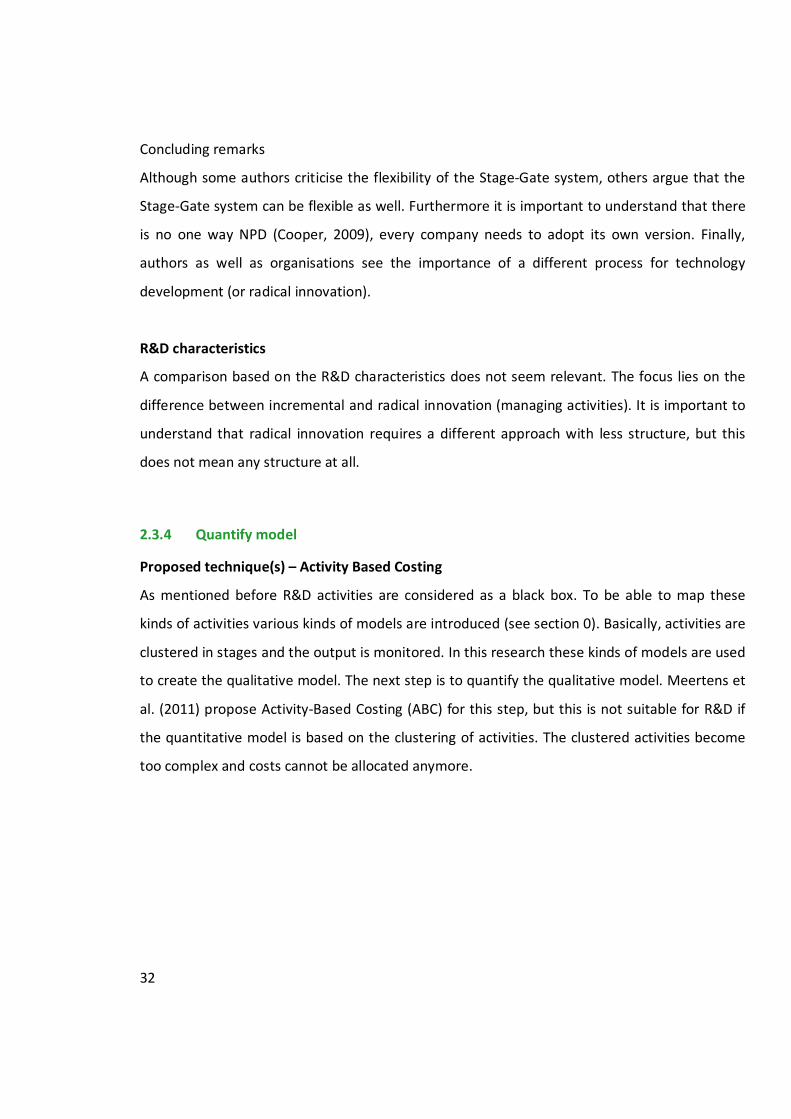
Furthermore, Cooper (2009) addresses the need for adaption to radical innovation as well.
Based on examples from practices from various organisations, he suggests modifications of the
front-end of the Stage-Gate system and positions technology development as a feeder for new
product developments (Figure 2-11).
Figure 2-11: Technology Development Projects
So he suggests a 3-Stage Technology development process which can feed the Stage-Gate
system at the different gates (Cooper, 2006).
32
Concluding remarks
Although some authors criticise the flexibility of the Stage-Gate system, others argue that the
Stage-Gate system can be flexible as well. Furthermore it is important to understand that there
is no one way NPD (Cooper, 2009), every company needs to adopt its own version. Finally,
authors as well as organisations see the importance of a different process for technology
development (or radical innovation).
R&D characteristics
A comparison based on the R&D characteristics does not seem relevant. The focus lies on the
difference between incremental and radical innovation (managing activities). It is important to
understand that radical innovation requires a different approach with less structure, but this
does not mean any structure at all.
2.3.4 Quantify model
Proposed technique(s) – Activity Based Costing
As mentioned before R&D activities are considered as a black box. To be able to map these
kinds of activities various kinds of models are introduced (see section 0). Basically, activities are
clustered in stages and the output is monitored. In this research these kinds of models are used
to create the qualitative model. The next step is to quantify the qualitative model. Meertens et
al. (2011) propose Activity-Based Costing (ABC) for this step, but this is not suitable for R&D if
the quantitative model is based on the clustering of activities. The clustered activities become
too complex and costs cannot be allocated anymore.
33
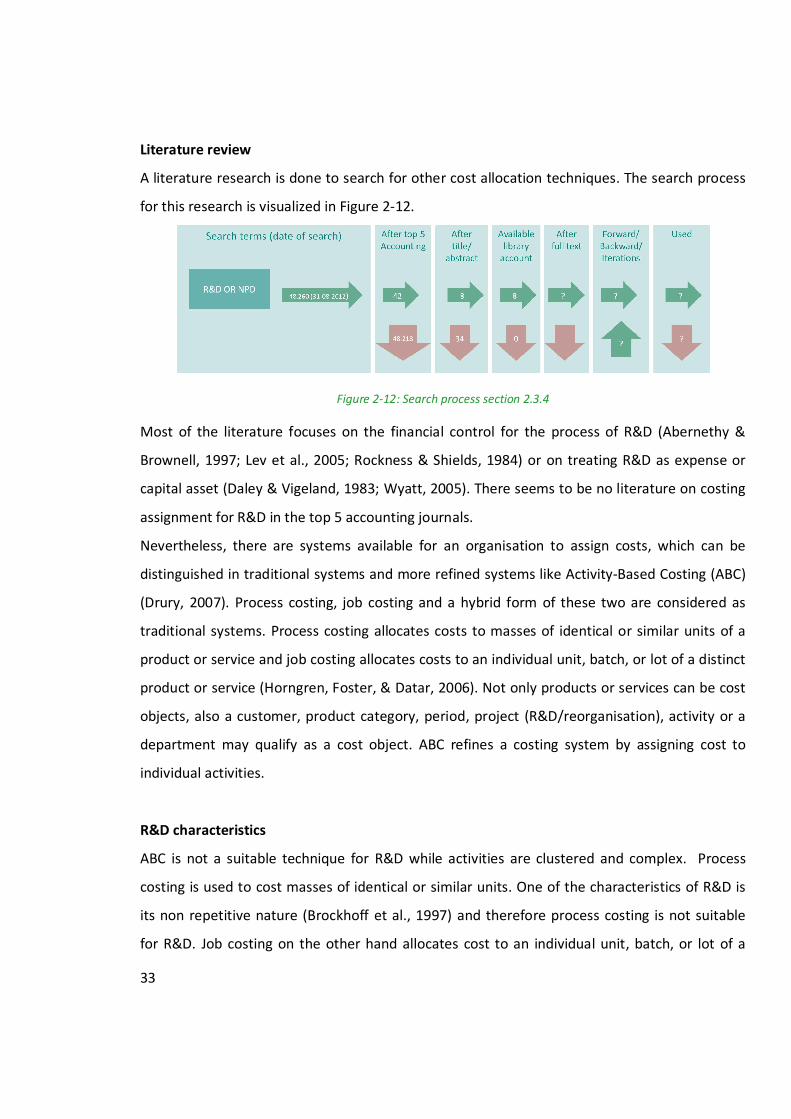
Literature review
A literature research is done to search for other cost allocation techniques. The search process
for this research is visualized in Figure 2-12.
Figure 2-12: Search process section 2.3.4
Most of the literature focuses on the financial control for the process of R&D (Abernethy &
Brownell, 1997; Lev et al., 2005; Rockness & Shields, 1984) or on treating R&D as expense or
capital asset (Daley & Vigeland, 1983; Wyatt, 2005). There seems to be no literature on costing
assignment for R&D in the top 5 accounting journals.
Nevertheless, there are systems available for an organisation to assign costs, which can be
distinguished in traditional systems and more refined systems like Activity-Based Costing (ABC)
(Drury, 2007). Process costing, job costing and a hybrid form of these two are considered as
traditional systems. Process costing allocates costs to masses of identical or similar units of a
product or service and job costing allocates costs to an individual unit, batch, or lot of a distinct
product or service (Horngren, Foster, & Datar, 2006). Not only products or services can be cost
objects, also a customer, product category, period, project (R&D/reorganisation), activity or a
department may qualify as a cost object. ABC refines a costing system by assigning cost to
individual activities.
R&D characteristics
ABC is not a suitable technique for R&D while activities are clustered and complex. Process
costing is used to cost masses of identical or similar units. One of the characteristics of R&D is
its non repetitive nature (Brockhoff et al., 1997) and therefore process costing is not suitable
for R&D. Job costing on the other hand allocates cost to an individual unit, batch, or lot of a
34
distinct product or service. As mentioned, this research considers an R&D organisation as an
organisation which is built on projects. Although project management techniques are used to
create uniform structures like NPD processes, this does not mean that process costing can be
used. These kinds of structures do not cluster uniform activities but try to support the process
of delivering certain outputs. Each output is unique or has its unique features and therefore job
costing is a suitable technique for R&D.
2.4 Conclusion
In this chapter, the BMM is introduced as a method to build a business model in a structured
and reproducible manner. The BMM can be tailored to specific situations such as R&D. A
literature study is done to uncover the characteristics of R&D. These characteristics are used to
research possible suitable techniques within the BMM for the first four steps for R&D. The last
two steps are of a general nature and build upon the first four. In the next chapter, techniques
are chosen and presented for every step.
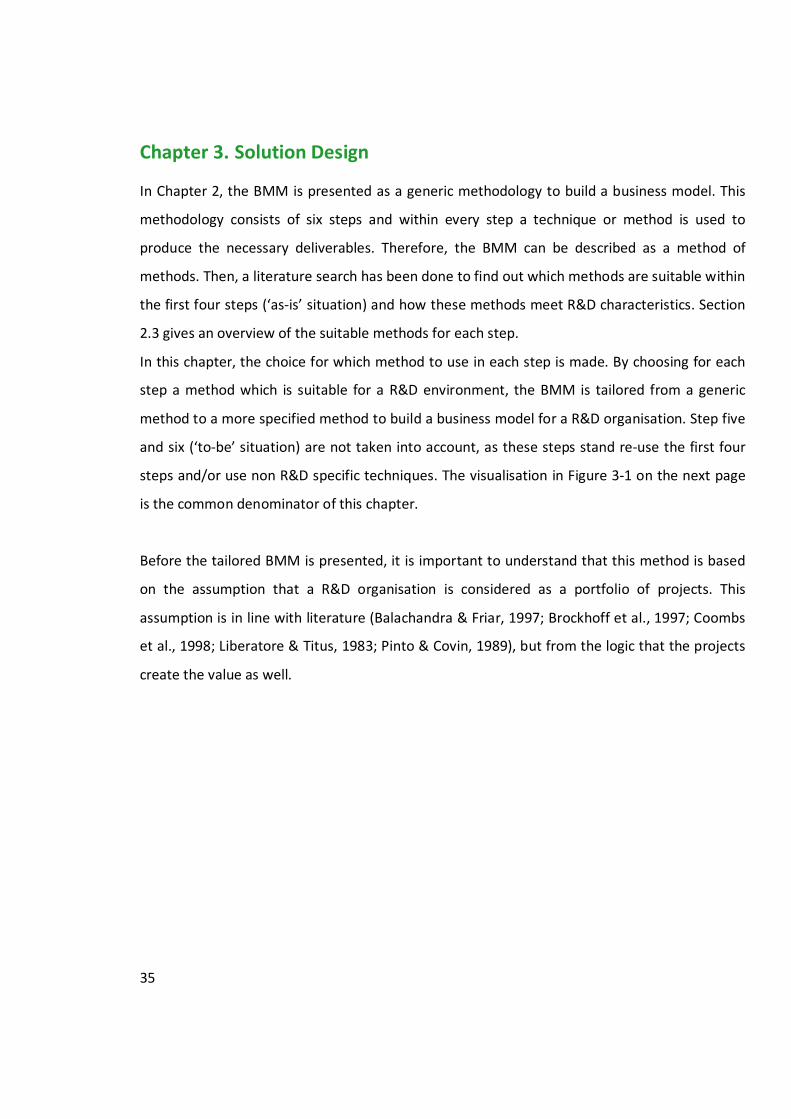
35
Chapter 3. Solution Design
In Chapter 2, the BMM is presented as a generic methodology to build a business model. This
methodology consists of six steps and within every step a technique or method is used to
produce the necessary deliverables. Therefore, the BMM can be described as a method of
methods. Then, a literature search has been done to find out which methods are suitable within
the first four steps (‘as-is’ situation) and how these methods meet R&D characteristics. Section
2.3 gives an overview of the suitable methods for each step.
In this chapter, the choice for which method to use in each step is made. By choosing for each
step a method which is suitable for a R&D environment, the BMM is tailored from a generic
method to a more specified method to build a business model for a R&D organisation. Step five
and six (‘to-be’ situation) are not taken into account, as these steps stand re-use the first four
steps and/or use non R&D specific techniques. The visualisation in Figure 3-1 on the next page
is the common denominator of this chapter.
Before the tailored BMM is presented, it is important to understand that this method is based
on the assumption that a R&D organisation is considered as a portfolio of projects. This
assumption is in line with literature (Balachandra & Friar, 1997; Brockhoff et al., 1997; Coombs
et al., 1998; Liberatore & Titus, 1983; Pinto & Covin, 1989), but from the logic that the projects
create the value as well.
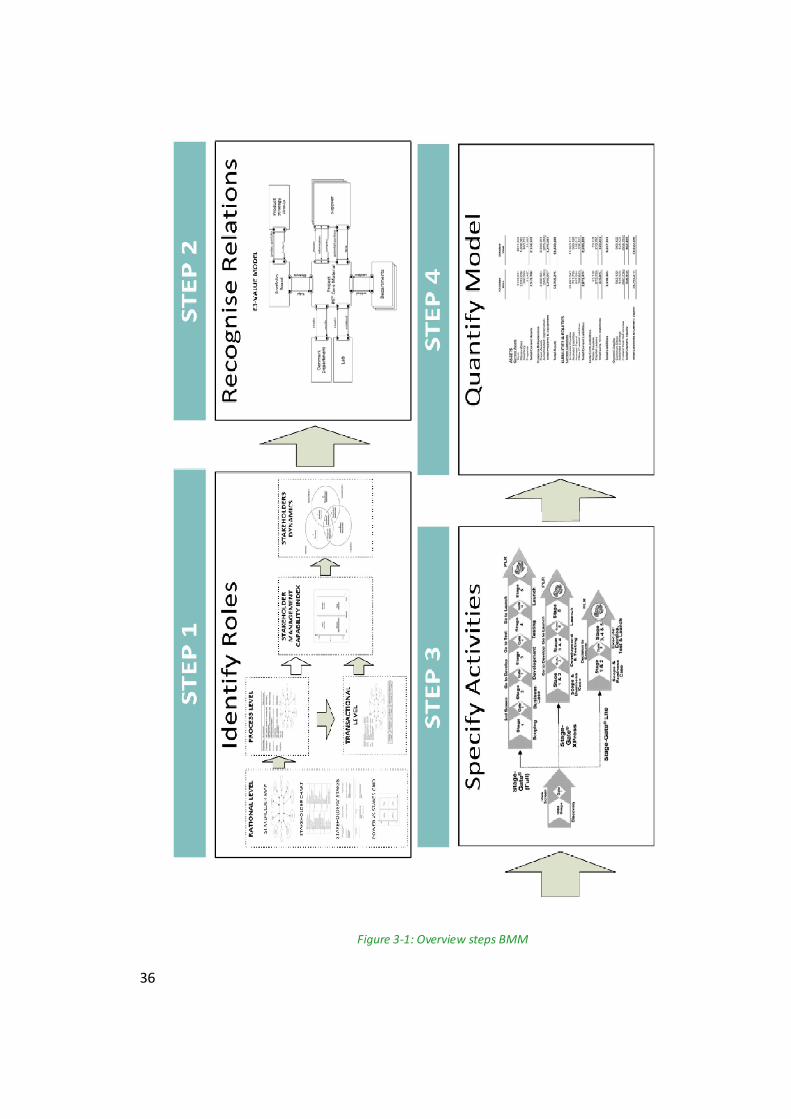
36
Figure 3-1: Overview steps BMM
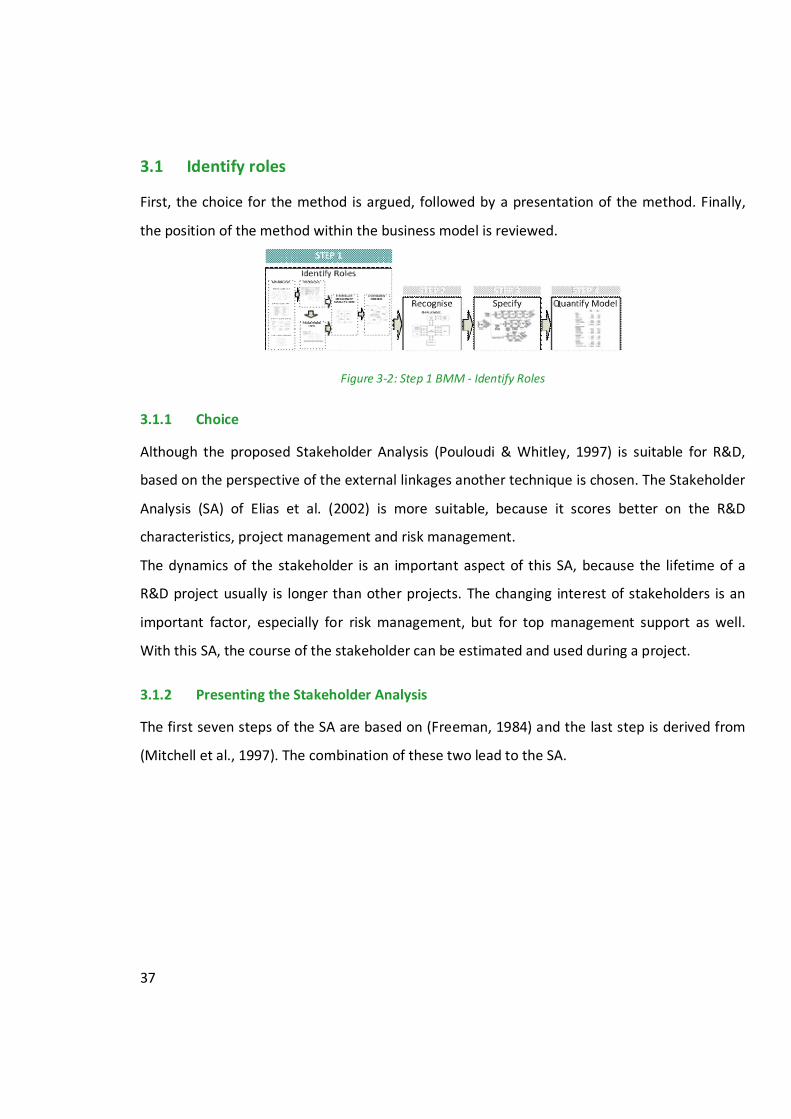
37
3.1 Identify roles
First, the choice for the method is argued, followed by a presentation of the method. Finally,
the position of the method within the business model is reviewed.
Figure 3-2: Step 1 BMM - Identify Roles
3.1.1 Choice
Although the proposed Stakeholder Analysis (Pouloudi & Whitley, 1997) is suitable for R&D,
based on the perspective of the external linkages another technique is chosen. The Stakeholder
Analysis (SA) of Elias et al. (2002) is more suitable, because it scores better on the R&D
characteristics, project management and risk management.
The dynamics of the stakeholder is an important aspect of this SA, because the lifetime of a
R&D project usually is longer than other projects. The changing interest of stakeholders is an
important factor, especially for risk management, but for top management support as well.
With this SA, the course of the stakeholder can be estimated and used during a project.
3.1.2 Presenting the Stakeholder Analysis
The first seven steps of the SA are based on (Freeman, 1984) and the last step is derived from
(Mitchell et al., 1997). The combination of these two lead to the SA.
38
Table 3-1: Stakeholder Analysis based on (Elias et al., 2002)
Rational Level
In this level, the various stakeholders are identified together with their stakes. In the last step of
this level, the stakeholders are placed in a two dimension grid (stakes and power). A stake is
distinguished by equity, economic and influencers, and power is distinguished by formal/voting,
economic and political power. The information needed can be obtained using the organisations’
documentation and interviews. At the end of the first four steps, there is an understanding of
who the stakeholders are and what their perceived stakes are.
Process Level
In this step is analysed how the project manager explicitly or implicitly manages the relations
with the stakeholders. Are there any protocols or organisational processes for the management
of these relations? This outcome then needs to be analysed if it is in line with the stakes and
power of that stakeholder according to the rational level analysis. The information needed can
be obtained using the organisations’ documentation and interviews.
Transactional Level
The goal of this step is to have insight into the transactions with the stakeholders. This can then
be compared to the status of a stakeholder according to the rational and process level analysis.
Again, the information needed can be obtained using the organisations’ documentation and
interviews. This step helps to find out if transactions with stakeholders are built on
understanding the legitimacy of the stakeholder.
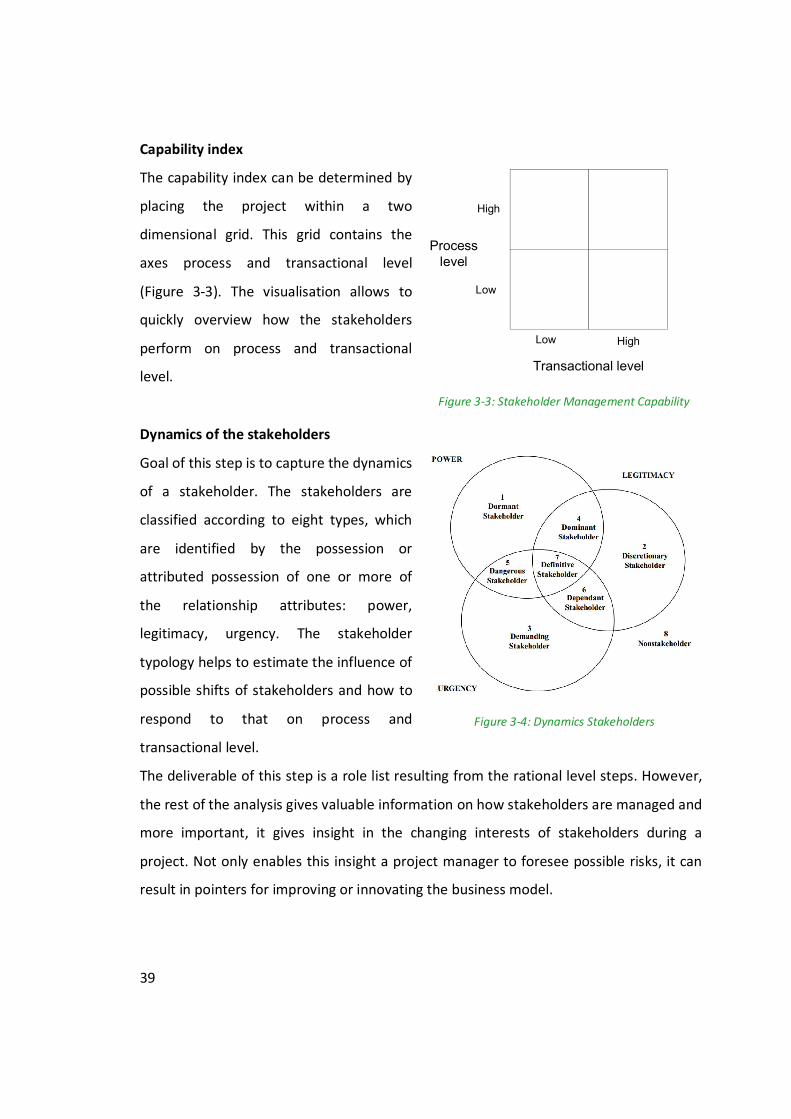
39
Capability index
The capability index can be determined by
placing the project within a two
dimensional grid. This grid contains the
axes process and transactional level
(Figure 3-3). The visualisation allows to
quickly overview how the stakeholders
perform on process and transactional
level.
Figure 3-3: Stakeholder Management Capability
Dynamics of the stakeholders
Goal of this step is to capture the dynamics
of a stakeholder. The stakeholders are
classified according to eight types, which
are identified by the possession or
attributed possession of one or more of
the relationship attributes: power,
legitimacy, urgency. The stakeholder
typology helps to estimate the influence of
possible shifts of stakeholders and how to
respond to that on process and
transactional level.
Figure 3-4: Dynamics Stakeholders
The deliverable of this step is a role list resulting from the rational level steps. However,
the rest of the analysis gives valuable information on how stakeholders are managed and
more important, it gives insight in the changing interests of stakeholders during a
project. Not only enables this insight a project manager to foresee possible risks, it can
result in pointers for improving or innovating the business model.
Process level
Transactional level
High
Low
Low High
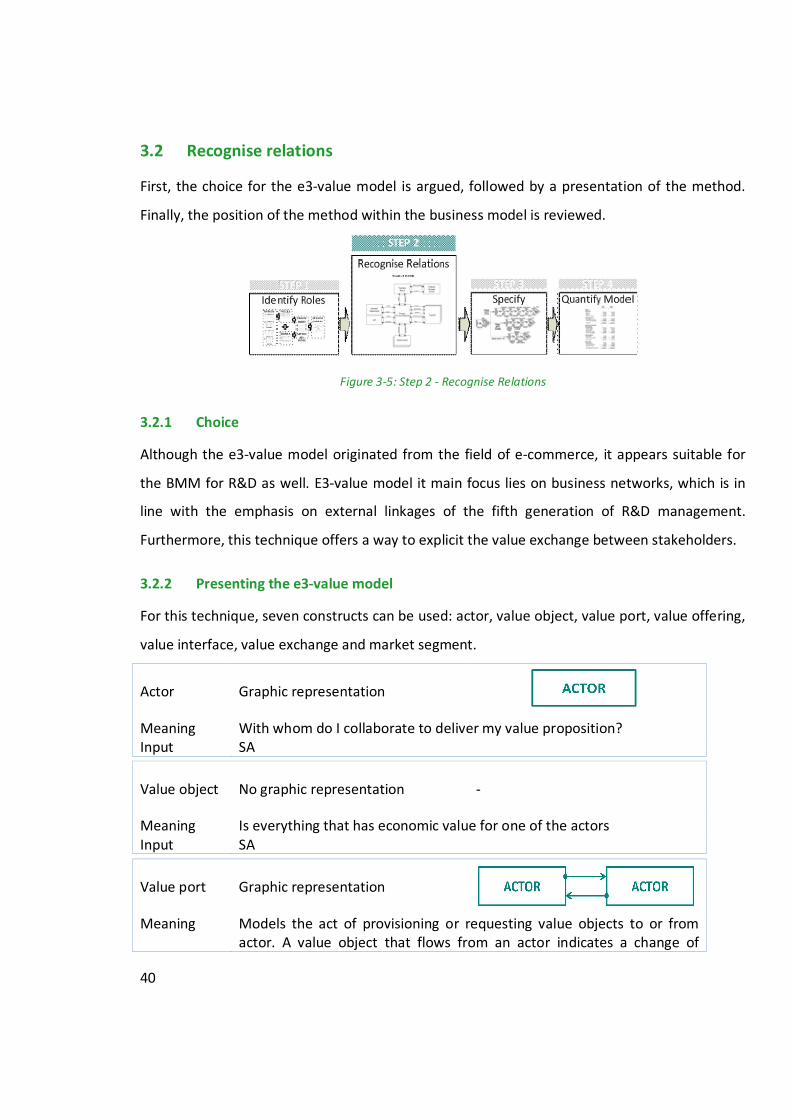
40
3.2 Recognise relations
First, the choice for the e3-value model is argued, followed by a presentation of the method.
Finally, the position of the method within the business model is reviewed.
Figure 3-5: Step 2 - Recognise Relations
3.2.1 Choice
Although the e3-value model originated from the field of e-commerce, it appears suitable for
the BMM for R&D as well. E3-value model it main focus lies on business networks, which is in
line with the emphasis on external linkages of the fifth generation of R&D management.
Furthermore, this technique offers a way to explicit the value exchange between stakeholders.
3.2.2 Presenting the e3-value model
For this technique, seven constructs can be used: actor, value object, value port, value offering,
value interface, value exchange and market segment.
Actor Graphic representation
Meaning With whom do I collaborate to deliver my value proposition? Input SA
Value object No graphic representation -
Meaning Is everything that has economic value for one of the actors Input SA
Value port Graphic representation
Meaning Models the act of provisioning or requesting value objects to or from actor. A value object that flows from an actor indicates a change of
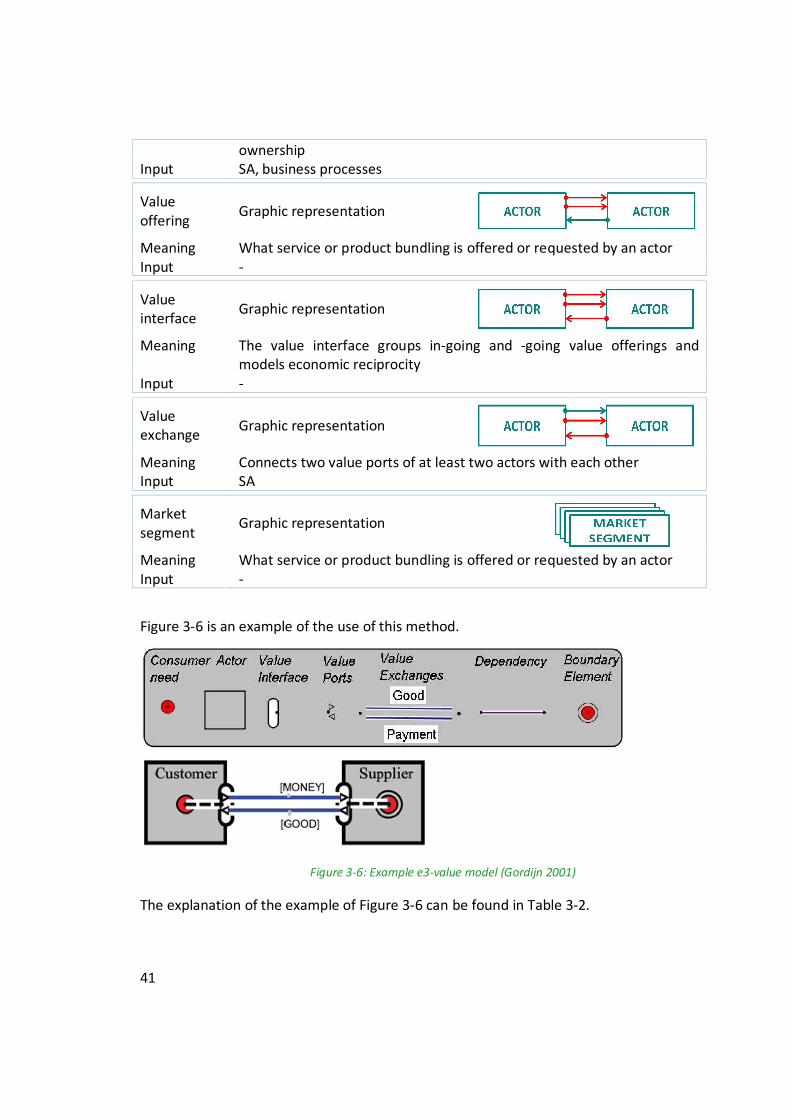
41
ownership Input SA, business processes
Value offering
Graphic representation
Meaning What service or product bundling is offered or requested by an actor Input -
Value interface
Graphic representation
Meaning The value interface groups in-going and -going value offerings and models economic reciprocity
Input -
Value exchange
Graphic representation
Meaning Connects two value ports of at least two actors with each other Input SA
Market segment
Graphic representation
Meaning What service or product bundling is offered or requested by an actor Input -
Figure 3-6 is an example of the use of this method.
Figure 3-6: Example e3-value model (Gordijn 2001)
The explanation of the example of Figure 3-6 can be found in Table 3-2.
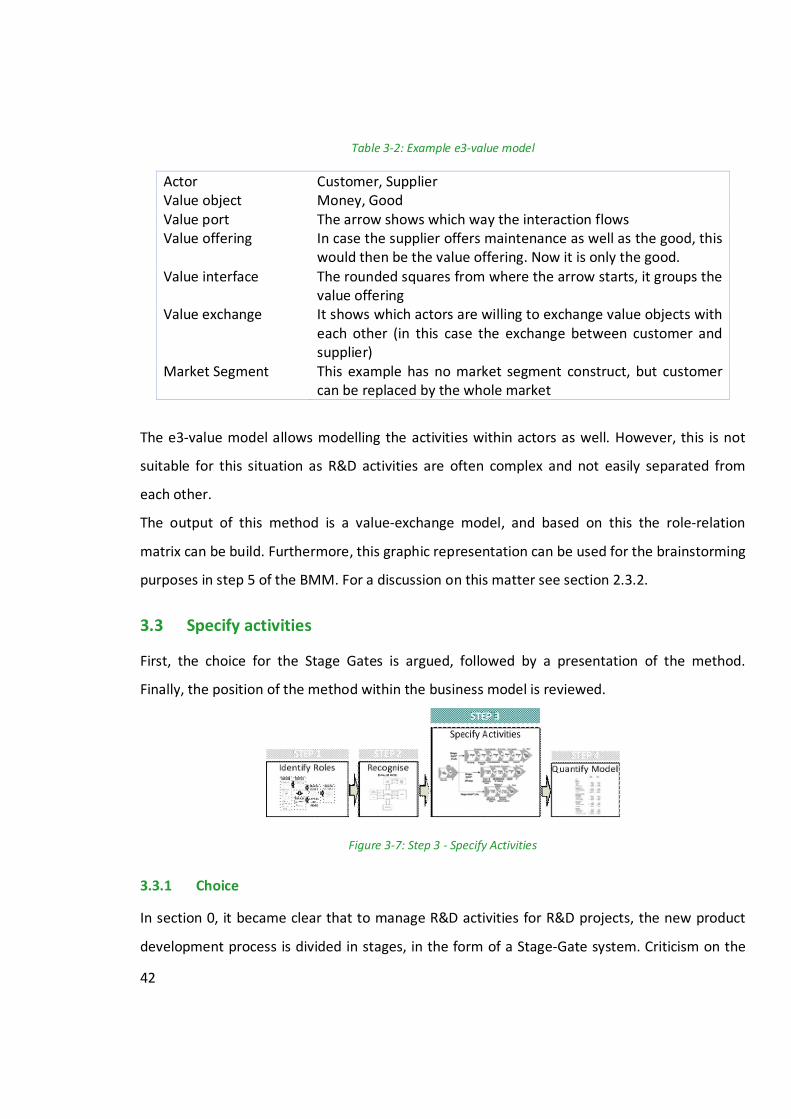
42
Table 3-2: Example e3-value model
Actor Customer, Supplier Value object Money, Good Value port The arrow shows which way the interaction flows Value offering In case the supplier offers maintenance as well as the good, this
would then be the value offering. Now it is only the good.
Value interface The rounded squares from where the arrow starts, it groups the value offering
Value exchange It shows which actors are willing to exchange value objects with each other (in this case the exchange between customer and supplier)
Market Segment This example has no market segment construct, but customer can be replaced by the whole market
The e3-value model allows modelling the activities within actors as well. However, this is not
suitable for this situation as R&D activities are often complex and not easily separated from
each other.
The output of this method is a value-exchange model, and based on this the role-relation
matrix can be build. Furthermore, this graphic representation can be used for the brainstorming
purposes in step 5 of the BMM. For a discussion on this matter see section 2.3.2.
3.3 Specify activities
First, the choice for the Stage Gates is argued, followed by a presentation of the method.
Finally, the position of the method within the business model is reviewed.
Figure 3-7: Step 3 - Specify Activities
3.3.1 Choice
In section 0, it became clear that to manage R&D activities for R&D projects, the new product
development process is divided in stages, in the form of a Stage-Gate system. Criticism on the
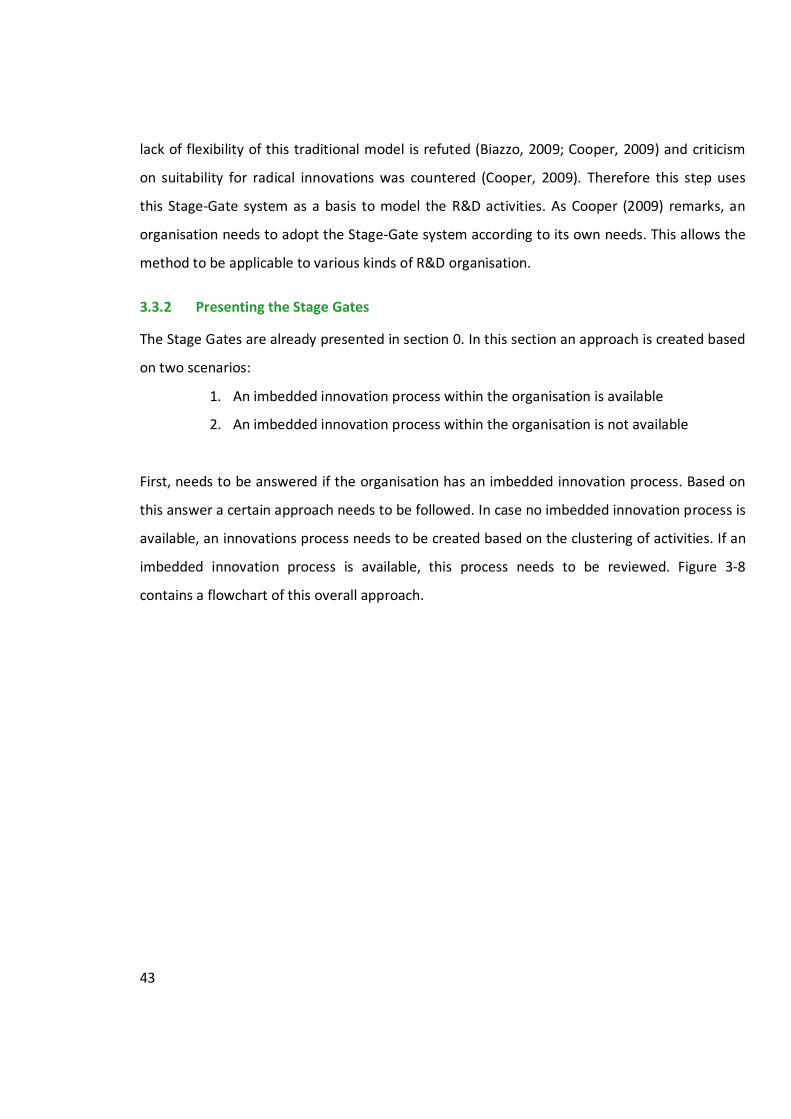
43
lack of flexibility of this traditional model is refuted (Biazzo, 2009; Cooper, 2009) and criticism
on suitability for radical innovations was countered (Cooper, 2009). Therefore this step uses
this Stage-Gate system as a basis to model the R&D activities. As Cooper (2009) remarks, an
organisation needs to adopt the Stage-Gate system according to its own needs. This allows the
method to be applicable to various kinds of R&D organisation.
3.3.2 Presenting the Stage Gates
The Stage Gates are already presented in section 0. In this section an approach is created based
on two scenarios:
1. An imbedded innovation process within the organisation is available
2. An imbedded innovation process within the organisation is not available
First, needs to be answered if the organisation has an imbedded innovation process. Based on
this answer a certain approach needs to be followed. In case no imbedded innovation process is
available, an innovations process needs to be created based on the clustering of activities. If an
imbedded innovation process is available, this process needs to be reviewed. Figure 3-8
contains a flowchart of this overall approach.
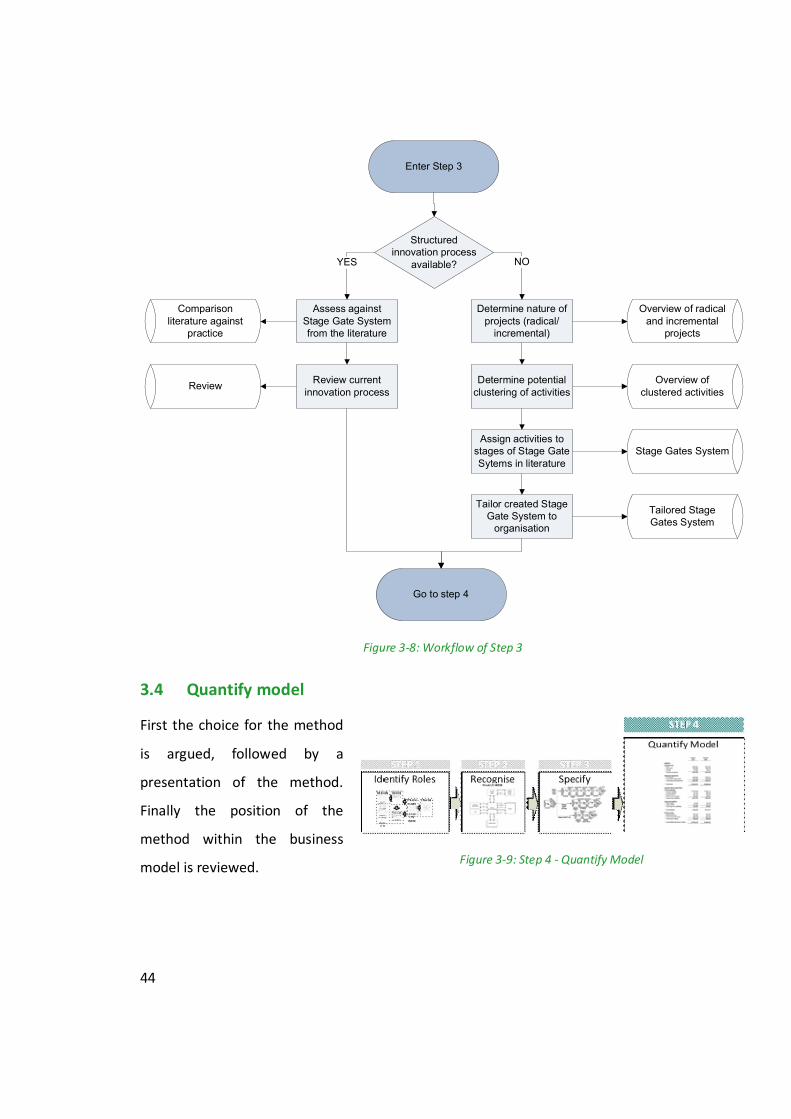
44
Figure 3-8: Workflow of Step 3
3.4 Quantify model
First the choice for the method
is argued, followed by a
presentation of the method.
Finally the position of the
method within the business
model is reviewed.
Figure 3-9: Step 4 - Quantify Model
Enter Step 3
Structured innovation process
available?
Assess against Stage Gate System from the literature
Determine nature of projects (radical/
incremental)
YES NO
Review current innovation process
Determine potential clustering of activities
Assign activities to stages of Stage Gate Sytems in literature
Tailor created Stage Gate System to
organisation
Go to step 4
Overview of radical and incremental
projects
Overview of clustered activities
Stage Gates System
Tailored Stage Gates System
Comparison literature against
practice
Review
45
3.4.1 Choice
According to the argument in section 2.3.4, job costing is the most suitable technique for
allocating costs compared to process costing and ABC. With job costing, costs can be allocated
to a project or even a project stage.
3.4.2 Presenting job-costing
The general procedure for job costing consists of seven steps to assigning costs to an individual
job (Horngren et al., 2006):
1. Identify the job that is the chosen cost object
In this model the cost object may be a project or a project stage.
2. Identify the direct costs of the job
Direct costs like materials and labour are directly assigned as direct costs to the project or
project stage.
3. Select the cost-allocation bases to use for allocating indirect costs to the job
Indirect costs cannot be directly traced to a job and therefore need to be allocated.
Different jobs require different quantities of indirect resources and therefore there needs to
be some base to allocate. An example for a project can be hours spent.
4. Identify the indirect costs associated with each cost-allocation base
All indirect costs can be summed up and assigned to a single cost pool (which needs to be
allocated according to the choice in step 3). It is possible to create multiple overhead cost
pools and even use different cost-allocation bases for these cost pools.
5. Compute the rate per unit of each cost allocation base used to allocate indirect costs to
the job
This step is an extension of step 3 and 4.
6. Compute the indirect costs allocated to the job
This can be calculated by multiplying the outcome of step 5, by the actual quantity of the in
step 3 chosen allocation base for that job.
7. Compute the total cost of the job by adding all direct and indirect costs assigned to the
job
46
For this approach actual costing and normal costing can be used (Horngren et al., 2006). To
allocate the actual overhead costs it is needed to wait until the end of the fiscal year, because
only then all the actual costs can be taken into account. An advantage of actual costing is that
possible season patterns are paved and the fixed indirect costs are spread over the monthly
output. The disadvantage of course is that actual costs of jobs cannot be calculated until
completed and at the end of the fiscal year. Normal costing makes it possible to allocate costs
before all the overhead costs are known by calculating a budgeted indirect-cost rate for each
cost pool at the beginning of the fiscal year. This costing system uses budgeted indirect-cost
rates instead of actual indirect-cost rates (Horngren et al., 2006).
3.5 Conclusion
In this chapter the solution design based on chapter 2 is presented. The basis is the definition:
“A business model is a simplified representation that counts for the known and inferred
properties of the business or industry as a whole, which may be used to study its characteristics
further...”
The known and inferred properties of the business have been identified as the characteristics of
R&D. Furthermore, this method is based on the assumption that a R&D organisation is
considered as a portfolio of projects. For this research a new definition for a R&D business
model is defined which is derived from the above definition and the theory on Stage Gate
Systems. A R&D business model is a portfolio of innovation processes. All projects are
assigned to an innovation process and pools of projects are created. Those pools have some
generic stakeholders, and generic cost structures. Of course projects are different from each
other but certain similarities exist as well.
This is the foundation for the solution design. In this chapter the techniques used at every step
have been presented. First roles are identified using a stakeholder analysis which is especially
designed for R&D projects. Second, relations are recognised by mapping the value exchanges
with e3-value modelling. Third, activities are specified using Stage Gate Systems and the fourth
step of the model is covered by job costing. The fifth and the sixth step are general steps and
outside the scope of this research.

47
Chapter 4. Solution Demonstration and Validation
RESTRICTED
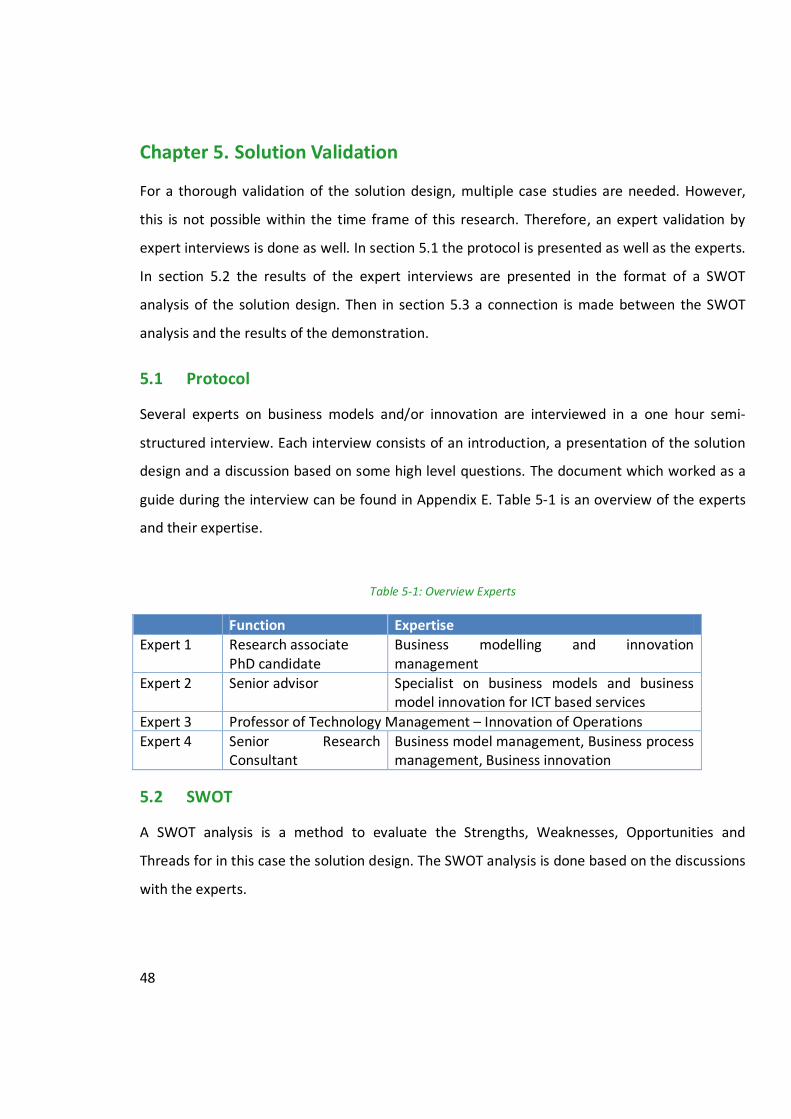
48
Chapter 5. Solution Validation
For a thorough validation of the solution design, multiple case studies are needed. However,
this is not possible within the time frame of this research. Therefore, an expert validation by
expert interviews is done as well. In section 5.1 the protocol is presented as well as the experts.
In section 5.2 the results of the expert interviews are presented in the format of a SWOT
analysis of the solution design. Then in section 5.3 a connection is made between the SWOT
analysis and the results of the demonstration.
5.1 Protocol
Several experts on business models and/or innovation are interviewed in a one hour semi-
structured interview. Each interview consists of an introduction, a presentation of the solution
design and a discussion based on some high level questions. The document which worked as a
guide during the interview can be found in Appendix E. Table 5-1 is an overview of the experts
and their expertise.
Table 5-1: Overview Experts
Function Expertise
Expert 1 Research associate PhD candidate
Business modelling and innovation management
Expert 2 Senior advisor Specialist on business models and business model innovation for ICT based services
Expert 3 Professor of Technology Management – Innovation of Operations
Expert 4 Senior Research Consultant
Business model management, Business process management, Business innovation
5.2 SWOT
A SWOT analysis is a method to evaluate the Strengths, Weaknesses, Opportunities and
Threads for in this case the solution design. The SWOT analysis is done based on the discussions
with the experts.
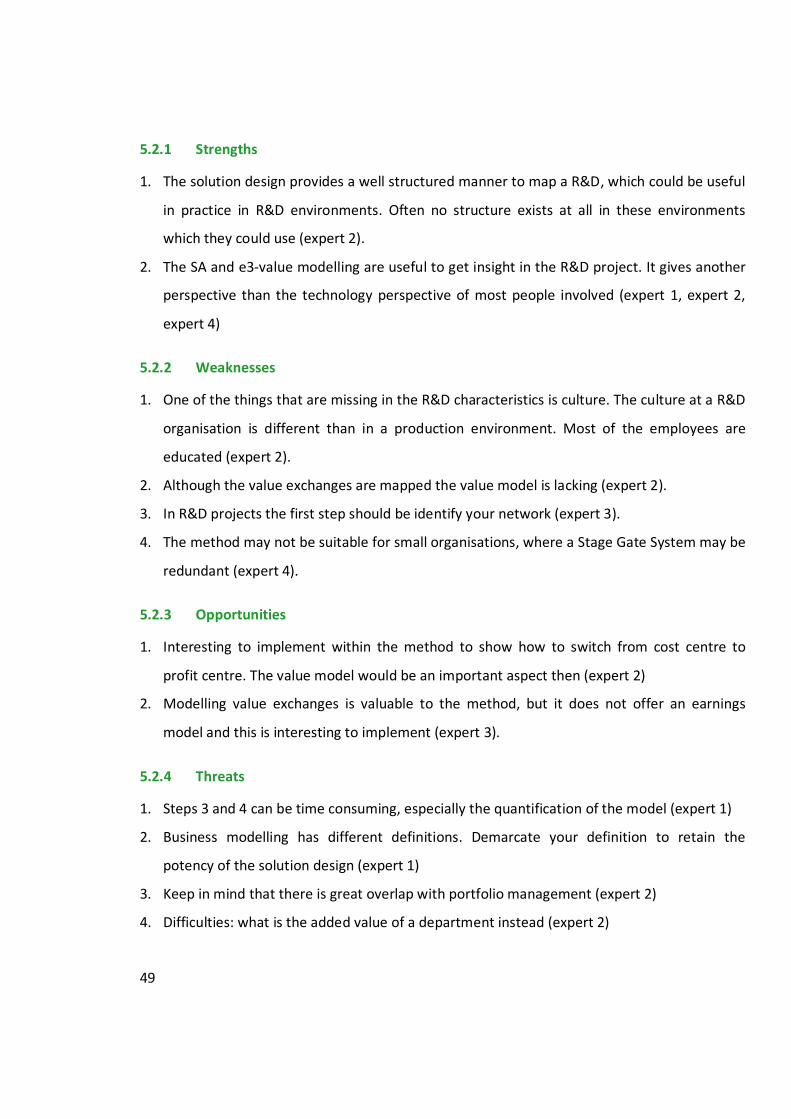
49
5.2.1 Strengths
1. The solution design provides a well structured manner to map a R&D, which could be useful
in practice in R&D environments. Often no structure exists at all in these environments
which they could use (expert 2).
2. The SA and e3-value modelling are useful to get insight in the R&D project. It gives another
perspective than the technology perspective of most people involved (expert 1, expert 2,
expert 4)
5.2.2 Weaknesses
1. One of the things that are missing in the R&D characteristics is culture. The culture at a R&D
organisation is different than in a production environment. Most of the employees are
educated (expert 2).
2. Although the value exchanges are mapped the value model is lacking (expert 2).
3. In R&D projects the first step should be identify your network (expert 3).
4. The method may not be suitable for small organisations, where a Stage Gate System may be
redundant (expert 4).
5.2.3 Opportunities
1. Interesting to implement within the method to show how to switch from cost centre to
profit centre. The value model would be an important aspect then (expert 2)
2. Modelling value exchanges is valuable to the method, but it does not offer an earnings
model and this is interesting to implement (expert 3).
5.2.4 Threats
1. Steps 3 and 4 can be time consuming, especially the quantification of the model (expert 1)
2. Business modelling has different definitions. Demarcate your definition to retain the
potency of the solution design (expert 1)
3. Keep in mind that there is great overlap with portfolio management (expert 2)
4. Difficulties: what is the added value of a department instead (expert 2)
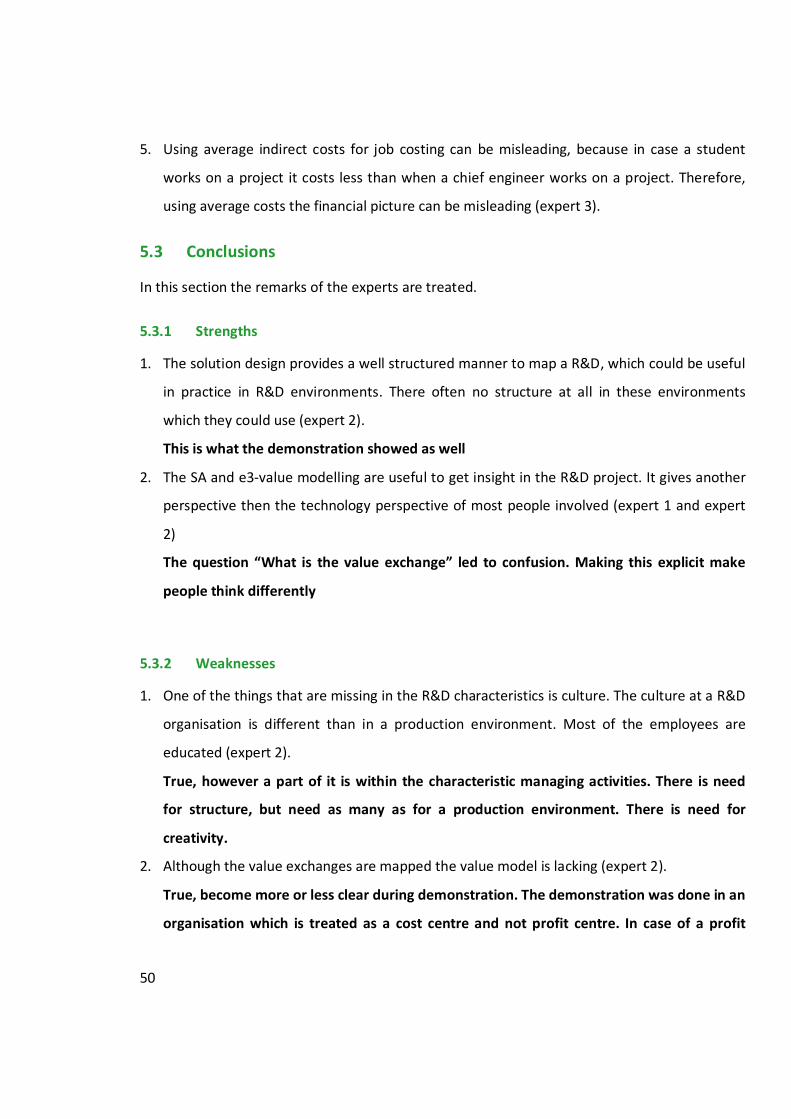
50
5. Using average indirect costs for job costing can be misleading, because in case a student
works on a project it costs less than when a chief engineer works on a project. Therefore,
using average costs the financial picture can be misleading (expert 3).
5.3 Conclusions
In this section the remarks of the experts are treated.
5.3.1 Strengths
1. The solution design provides a well structured manner to map a R&D, which could be useful
in practice in R&D environments. There often no structure at all in these environments
which they could use (expert 2).
This is what the demonstration showed as well
2. The SA and e3-value modelling are useful to get insight in the R&D project. It gives another
perspective then the technology perspective of most people involved (expert 1 and expert
2)
The question “What is the value exchange” led to confusion. Making this explicit make
people think differently
5.3.2 Weaknesses
1. One of the things that are missing in the R&D characteristics is culture. The culture at a R&D
organisation is different than in a production environment. Most of the employees are
educated (expert 2).
True, however a part of it is within the characteristic managing activities. There is need
for structure, but need as many as for a production environment. There is need for
creativity.
2. Although the value exchanges are mapped the value model is lacking (expert 2).
True, become more or less clear during demonstration. The demonstration was done in an
organisation which is treated as a cost centre and not profit centre. In case of a profit
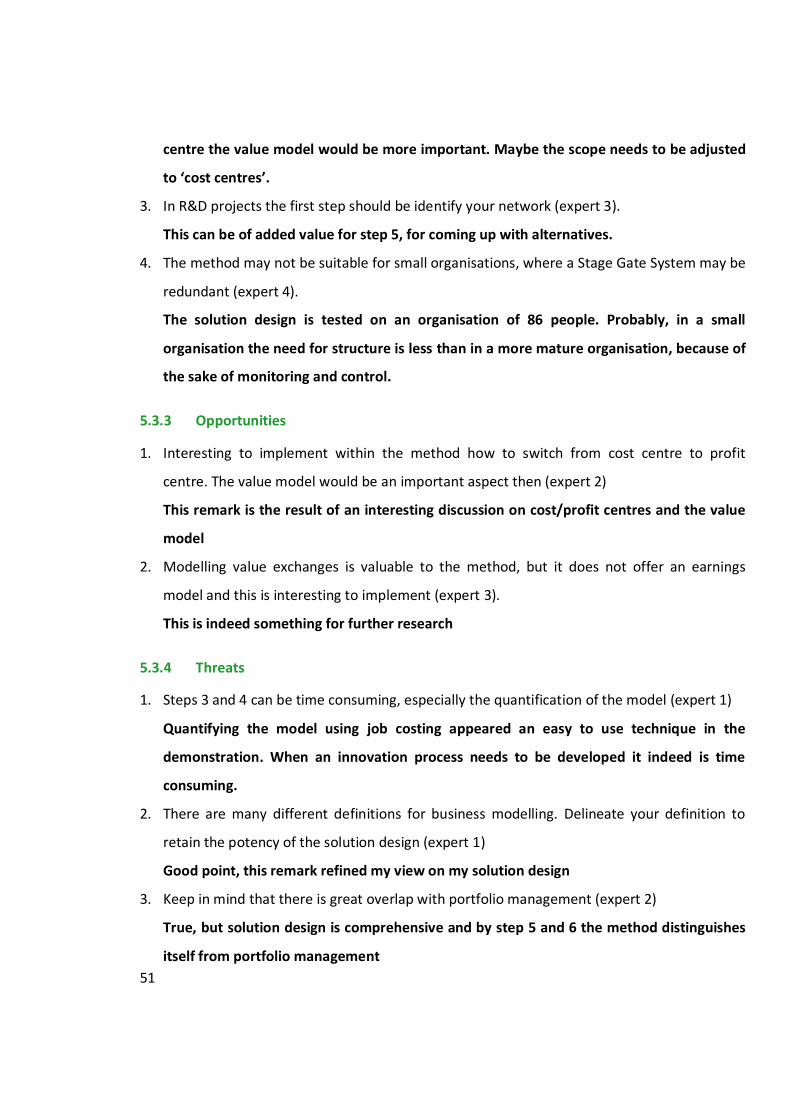
51
centre the value model would be more important. Maybe the scope needs to be adjusted
to ‘cost centres’.
3. In R&D projects the first step should be identify your network (expert 3).
This can be of added value for step 5, for coming up with alternatives.
4. The method may not be suitable for small organisations, where a Stage Gate System may be
redundant (expert 4).
The solution design is tested on an organisation of 86 people. Probably, in a small
organisation the need for structure is less than in a more mature organisation, because of
the sake of monitoring and control.
5.3.3 Opportunities
1. Interesting to implement within the method how to switch from cost centre to profit
centre. The value model would be an important aspect then (expert 2)
This remark is the result of an interesting discussion on cost/profit centres and the value
model
2. Modelling value exchanges is valuable to the method, but it does not offer an earnings
model and this is interesting to implement (expert 3).
This is indeed something for further research
5.3.4 Threats
1. Steps 3 and 4 can be time consuming, especially the quantification of the model (expert 1)
Quantifying the model using job costing appeared an easy to use technique in the
demonstration. When an innovation process needs to be developed it indeed is time
consuming.
2. There are many different definitions for business modelling. Delineate your definition to
retain the potency of the solution design (expert 1)
Good point, this remark refined my view on my solution design
3. Keep in mind that there is great overlap with portfolio management (expert 2)
True, but solution design is comprehensive and by step 5 and 6 the method distinguishes
itself from portfolio management
52
4. Difficulties: what is the added value of a department instead (expert 2)
Close to remark on value model, what is the value model of a department?
5. Using average indirect costs for job costing can be misleading, because in case a student
works on a project it costs less than when a chief engineer works on a project. Therefore,
using average costs the financial picture can be misleading (expert 3).
If the financial data allows making this distinction, this needs to be taken into account. If
not, the continuous improving character of the solution design should ensure that the job
costing methodology is continuously refined.
53
Chapter 6. Conclusions, discussion and recommendations
This section contains the conclusions in section 6.1, the discussion in section 6.2 and the
recommendations in section 6.3.
6.1 Conclusion
The research question of this thesis is:
How to build a business model for a research and development organisation?
To answer this question in section 2.1 is concluded that the Business Modelling Method is a
method to build a business model in a structured and repeatable manner and this method can
be tailored to a specific situation. A R&D organisation is such a specific situation and therefore
the Business Modelling Method is used. In section 2.2, the known and inferred properties of
R&D are classified as project oriented, managing activities, risk management, cost
management, value and external linkages. These characteristics are used in section 2.3 to
research the suitable techniques within the Business Modelling Method. Four steps of solution
design are presented in chapter 3. First roles are identified using a stakeholder analysis which is
especially designed for R&D projects. Second, relations are recognised by mapping the value
exchanges with e3-value modelling. Third, activities are specified using Stage Gate Systems and
the fourth step of the model is covered by job costing. The last two steps, design alternatives
and analyse alternatives are not taken into account for this research. Both steps use the output
derived from the first four steps in combination with general techniques which are not R&D
specific.
Chapter 4 demonstrates the solution design for two scenarios. First it is demonstrated in case a
Stage Gate system is already imbedded. All the four steps are performed and the solution
design automatically resulted in ideas for improvements which can be implemented directly or
can be feeders for step 5 and 6. Secondly, the solution design is demonstrated in case a Stage
Gate System is not available. Only the first three steps have been performed, but it showed that
the solution design works sufficient as a Stage Gate System is created. Furthermore, the only
reason for not demonstrating step four is the lack of available financial data.
54
Based on expert interviews a SWOT analysis is performed for the solution design. One of the
strengths confirmed by the results is that the method appeared well structured and useable in
practice. The lack of an earning model was addressed as a limitation.
In conclusion, an answer is given to the research question in the form of a business modelling
method tailored to be applicable in a R&D organisation.
6.2 Discussion
In section 6.2.1 the limitations of this research are presented as well as directions for further
research in section 6.2.2. Finally, in section 6.2.3 the contribution of this research is described.
6.2.1 Limitations
The expert validation resulted in limiting the solution design to cost centres. Not because it
cannot be used on a profit centre, but the discussion on earnings models led to the discovery
that the solution design only is demonstrated at a R&D organisation which is seen as a cost
centre.
The lack of an earnings model within the solution design to determine value creation was
addressed by the experts as well. This limitation did not come to light during the demonstration
because of the first described limitation in this section.
Quantifying the model for Technology projects could not been done, as the data was not
sufficient. Unfortunately, the studied projects were still ongoing.
6.2.2 Further research
One of the aspects which came forward during the demonstration is Technology Readiness
Levels. TRL’s could be interesting to implement in Technology projects which are feeders for
other projects. By monitoring the maturation of technology, the organisation has more insight
in its current technological capabilities, more insight in foreseeing potential costs to improve a
technology and the organisation can measure technology.
One of the limitations is that the model is demonstrated on a cost centre and not on a profit
centre. It would be interesting to connect this solution design to the known theory of the shift
from cost centre to profit centre.
55
6.2.3 Contribution of research
Meertens et al. (2011) encouraged to extend, improve or tailor the BMM to specific situations.
This research picked this up and developed and validated a structured way to build a business
model for a R&D organisation. The demonstration of the method showed that the solution
design is applicable in practice and not only in theory.
By tailoring the BMM for a specific situation this research contributed to the validation of the
original BMM as well.
6.3 Recommendations
RESTRICTED
56
REFERENCES
Abernethy, M. A., & Brownell, P. (1997). Management control systems in research and
development organizations: the role of accounting, behavior and personnel controls.
Accounting, Organizations and Society, 22(3), 233-248.
Ali, A. (1994). Pioneering versus incremental innovation: Review and research propositions.
Journal of Product Innovation Management, 11(1), 46-61.
Allee, V. (2008). Value network analysis and value conversion of tangible and intangible assets.
Journal of Intellectual Capital, 9(1), 5-24.
Andersson, B., Johannesson, P., & Bergholtz, M. (2009). Purpose driven value model design.
Balachandra, R., & Friar, J. H. (1997). Factors for success in R&D projects and new product
innovation: a contextual framework. Engineering Management, IEEE Transactions on,
44(3), 276-287.
Biazzo, S. (2009). Flexibility, structuration, and simultaneity in new product development.
Journal of Product Innovation Management, 26(3), 336-353.
Birkinshaw, J., & Gibson, C. (2004). Building ambidexterity into an organization. MIT Sloan
Management Review, 45, 47-55.
Bonner, S. E., Hesford, J. W., Van der Stede, W. A., & Young, S. M. (2006). The most influential
journals in academic accounting. Accounting, Organizations and Society, 31(7), 663-685.
Brentani, U., & Reid, S. E. (2012). The Fuzzy Front-End of Discontinuous Innovation: Insights for
Research and Management. Journal of Product Innovation Management.
Brockhoff, K. K. (1992). Forschung und Entwicklung: Planung und Kontrolle (Vol. 3). München: R.
Oldenbourg Verlag
Brockhoff, K. K., Koch, G., & Pearson, A. W. (1997). Business process re–engineering:
experiences in R&D. Technology Analysis & Strategic Management, 9(2), 163-178.
Brockhoff, K. K., & Pearson, A. W. (1998). R&D budgeting reactions to a recession. MIR:
Management International Review, 363-376.
Bullinger, A. (2008). Innovation and Ontologies: structuring the early stages of innovation
management. Gabler Verlag.
57
Chao, R., & Kavadias, S. (2008). A theoretical framework for managing the NPD portfolio: When
and how to use strategic buckets. Management Science, Vol. 54, No. 5, pp. 907-921,
2008.
Chesbrough, H. W. (2003). Open innovation: The new imperative for creating and profiting from
technology: Harvard Business Press.
Coombs, R., McMeekin, A., & Pybus, R. (1998). Toward the development of benchmarking tools
for R&D project management. R&D Management, 28(3), 175-186.
Cooper, R. G. (1990). Stage-gate systems: a new tool for managing new products. Business
Horizons, 33(3), 44-54.
Cooper, R. G. (2006). Managing technology development projects. Research-Technology
Management, 49(6), 23-31.
Cooper, R. G. (2008). Perspective: The Stage-Gate® Idea-to-Launch Process—Update, What's
New, and NexGen Systems*. Journal of Product Innovation Management, 25(3), 213-
232. doi: 10.1111/j.1540-5885.2008.00296.x
Cooper, R. G. (2009). How Companies are Reinventing Their IdeatoLaunch Methodologies.
Research-Technology Management, 52(2), 47-57.
Cooper, R. G., & Kleinschmidt, E. J. (1986). An investigation into the new product process: steps,
deficiencies, and impact. Journal of Product Innovation Management, 3(2), 71-85.
Daley, L. A., & Vigeland, R. L. (1983). The effects of debt covenants and political costs on the
choice of accounting methods: The case of accounting for R&D costs. Journal of
Accounting and Economics, 5, 195-211.
Daniel Sherman, J., & Olsen, E. A. (1996). Stages in the project life cycle in R&D organizations
and the differing relationships between organizational climate and performance. The
Journal of High Technology Management Research, 7(1), 79-90.
de Haas, K. (2012). Project Request Form: Blade Matrial Design Values. Hengelo: Department
CMP.
Drury, C. (2007). Management and cost accounting (6th Value Media Edition ed.). London:
Thomson Learning.
58
Elias, A. A., Cavana, R. Y., & Jackson, L. S. (2002). Stakeholder analysis for R&D project
management. R&D Management, 32(4), 301-310.
Emans, B. J. M. (1985). Interviewen: theorie, techniek en training: Wolters-Noordhoff
Groningen.
Freeman, R. E. (1984). Strategic management: A stakeholder approach. Boston, MA: Pitman.
Gaynor, G. H. (1996). Handbook of technology management. New York: McGraw-Hill.
Gordijn, J., Akkermans, H., & Van Vliet, J. (2001). Designing and evaluating e-business models.
IEEE Intelligent Systems, 16(4), 11-17.
Gordijn, J., & Akkermans, J. (2003). Value-based requirements engineering: Exploring innovative
e-commerce ideas. Requirements engineering, 8(2), 114-134.
Gregor, S. (2006). The nature of theory in information systems. Mis Quarterly, 30(3), 611-642.
Griffin, A. (1997). PDMA research on new product development practices: updating trends and
benchmarking best practices. Journal of Product Innovation Management, 14(6), 429-
458.
Haque, B., & Pawar, K. S. (2001). Improving the management of concurrent new product
Development using Process Modelling and Analysis. R&D Management, 31(1), 27-40.
Healy, P. M., Myers, S. C., & Howe, C. D. (2002). R&D accounting and the tradeoff between
relevance and objectivity. Journal of Accounting Research, 40(3), 677-710.
Hevner, A. R., March, S. T., Park, J., & Ram, S. (2004). Design science in information systems
research. Mis Quarterly, 28(1), 75-105.
Horngren, C. T., Foster, G., & Datar, S. M. (2006). Cost Accounting: A Managerial Emphasis (12th
edition ed.). Upper Saddle River, N.J.: Pearson/Prentice Hall.
Iansiti, M. (1995). Shooting the rapids: Managing product development in turbulent
environments. California Management Review, 38, 37-58.
Icke, R. (2012). Innovation position of the Netherlands hinders prospects for economic growth.
Press release 2012-21 Retrieved 27-08, 2012, from
http://www.tno.nl/content.cfm?context=overtno&content=persbericht&laag1=37&ite
m_id=201206080021&Taal=2
59
Kahn, K. B., Barczak, G., & Moss, R. (2006). Perspective: establishing an NPD best practices
framework. Journal of Product Innovation Management, 23(2), 106-116.
Kamoche, K., & e Cunha, M. P. (2001). Minimal structures: from jazz improvisation to product
innovation. Organization Studies, 22(5), 733-764.
Kartseva, V., Gordijn, J., & Tan, Y. H. (2006). Toward a modeling tool for designing control
mechanisms for network organizations. International Journal of Electronic Commerce,
10(2), 58-84.
Kleinschmidt, E. J., & Cooper, R. G. (1991). The impact of product innovativeness on
performance. Journal of Product Innovation Management, 8(4), 240-251.
Kuipers, A. (2011). Netherlands drifting further behind in R&D. Web magazine Retrieved 30-08,
2012, from http://www.cbs.nl/en-
GB/menu/themas/dossiers/ondernemingsklimaat/publicaties/artikelen/archief/2011/2
011-3303-wm.htm?Languageswitch=on
Kumar, K., & Welke, R. J. (1992). Methodology engineering: a proposal for situation-specific
methodology construction. In Challenges and Strategies for Research in Systems
Development. John Wiley series information systems. Chichester: Wiley, p. 257-269
Lev, B., Sarath, B., & Sougiannis, T. (2005). R&D Reporting Biases and Their Consequences.
Contemporary Accounting Research, 22(4), 977-1026.
Liberatore, M. J., & Titus, G. J. (1983). The practice of management science in R&D project
management. Management Science, 962-974.
Linton, J. D., & Thongpapanl, N. T. (2004). PERSPECTIVE: Ranking the Technology Innovation
Management Journals. Journal of Product Innovation Management, 21(2), 123-139.
Luinge, H. (2012). Project Request Form: PET Core Material. Hengelo: Department CMP.
March, S. T., & Smith, G. F. (1995). Design and natural science research on information
technology. Decision support systems, 15(4), 251-266.
McDermott, C. M., & O'Connor, G. C. (2002). Managing radical innovation: an overview of
emergent strategy issues. Journal of Product Innovation Management, 19(6), 424-438.
McLaughlin, P., Bessant, J., & Smart, P. (2008). Developing an organisation culture to facilitate
radical innovation. International Journal of Technology Management, 44(3), 298-323.
60
Meertens, L., Iacob, M., & Nieuwenhuis, L. (2011). Developing the business modelling method.
In Proceedings of the First International Symposium on Business Modeling and Software
Design 2011. (BMSD 2011), pp. 88-95.
Mitchell, R. K., Agle, B. R., & Wood, D. J. (1997). Toward a theory of stakeholder identification
and salience: Defining the principle of who and what really counts. Academy of
management review, 853-886.
Morandi, V. (2011). The management of industry–university joint research projects: how do
partners coordinate and control R&D activities? The Journal of Technology Transfer, 1-
24.
Nobelius, D. (2004). Towards the sixth generation of R&D management. International Journal of
Project Management, 22(5), 369-375.
Offermann, P., Blom, S., Levina, O., & Bub, U. (2010). Proposal for Components of Method
Design Theories. Business & Information Systems Engineering, 2(5), 295-304.
Osterwalder, A. (2004). The business model ontology: A proposition in a design science
approach. Academic Dissertation, Université de Lausanne lécole des hautes etudes
Ccmmerciales.
Page, A. L., & Schirr, G. R. (2008). Growth and Development of a Body of Knowledge: 16 Years of
New Product Development Research, 1989–2004*. Journal of Product Innovation
Management, 25(3), 233-248.
Pappas, R. A., & Remer, D. S. (1985). Measuring R and D Productivity.
Pateli, A. G., & Giaglis, G. M. (2004). A research framework for analysing eBusiness models.
European journal of information systems, 13(4), 302-314.
Peters, L. S. (2006). Rejoinders to “establishing an NPD best practices framework”. Journal of
Product Innovation Management, 23(2), 117-127.
Pinto, J. K., & Covin, J. G. (1989). Critical factors in project implementation: a comparison of
construction and R&D projects. Technovation, 9(1), 49-62.
Pouloudi, A., & Whitley, E. A. (1997). Stakeholder identification in inter-organizational systems:
gaining insights for drug use management systems. European journal of information
systems, 6(1), 1-14.
61
Rice, M. P., O'CONNOR, G. C., Peters, L. S., & Morone, J. G. (1998). Managing discontinuous
innovation. Research Technology Management, 41(3), 52-58.
Rockness, H. O., & Shields, M. D. (1984). Organizational control systems in research and
development. Accounting, Organizations and Society, 9(2), 165-177.
Rosenberg, N. (1982). Inside the black box: technology and economics. Cambridge: Cambridge
University Press.
Rothwell, R. (1994). Industrial innovation: success, strategy, trends. In M. Dodgson & R.
Rothwell (Eds.), The handbook of industrial innovation. Cheltenham: Edward Elgar.
Roussel, P. A., Saad, K. N., & Erickson, T. J. (1991). Third generation R&D: managing the link to
corporate strategy: Harvard Business Press.
Schumpeter, J. A. (1994). Capitalism, socialism and democracy. London: Routledge.
Schwartz, R. B., & Russo, M. C. (2004). How to quickly find articles in the top IS journals.
Communications of the ACM, 47(2), 98-101.
Smeds, R., Haho, P., & Alvesalo, J. (2003). Bottom-up or top-down? Evolutionary change
management in NPD processes. International Journal of Technology Management,
26(8), 887-902.
Sushandoyo, D., & Magnusson, T. (2012). A two-way relationship between multi-level
technological change and organisational characteristics-cases involving the development
of heavy hybrid buses. Technovation.
Teece, D. J. (2010). Business models, business strategy and innovation. Long range planning,
43(2), 172-194.
Thongpapanl, N. T. (2012). The changing landscape of technology and innovation management:
An updated ranking of journals in the field. Technovation, 32, 257-271.
Trott, P. (2005). Innovation management and new product development (third ed.). Harlow
Financial Times Prentice Hall.
Verhagen, M. J. M. (2011). Bedrijfslevenbeleid. Den Haag: Tweede Kamer der Staten-Generaal.
Verloop, J. (2006). The Shell way to innovate. International Journal of Technology Management,
34(3), 243-259.
62
Vermolen, R. (2010). Reflecting on IS Business Model Research: Current Gaps and Future
Directions. In Proceedings of the 13th Twente Student Conference on IT, Enschede,
Netherlands: University of Twente.
Veryzer Jr, R. W. (1998). Discontinuous innovation and the new product development process.
Journal of Product Innovation Management, 15(4), 304-321.
Wyatt, A. (2005). Accounting recognition of intangible assets: theory and evidence on economic
determinants. Accounting Review, 967-1003.
Yin, R. K. (1987). Case study research: Design and methods (Vol. 5): Sage publications, INC.
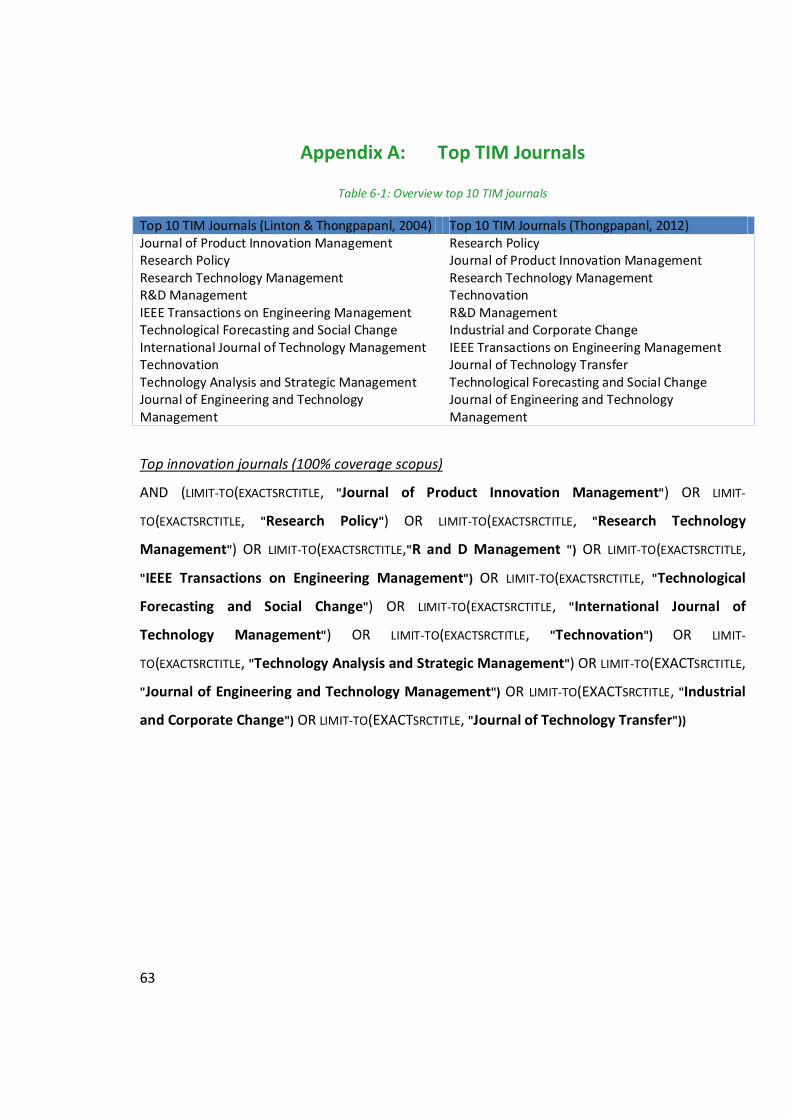
63
Appendix A: Top TIM Journals
Table 6-1: Overview top 10 TIM journals
Top 10 TIM Journals (Linton & Thongpapanl, 2004) Top 10 TIM Journals (Thongpapanl, 2012) Journal of Product Innovation Management Research Policy Research Policy Journal of Product Innovation Management Research Technology Management Research Technology Management R&D Management Technovation IEEE Transactions on Engineering Management R&D Management Technological Forecasting and Social Change Industrial and Corporate Change International Journal of Technology Management IEEE Transactions on Engineering Management Technovation Journal of Technology Transfer Technology Analysis and Strategic Management Technological Forecasting and Social Change Journal of Engineering and Technology Management
Journal of Engineering and Technology Management
Top innovation journals (100% coverage scopus)
AND (LIMIT-TO(EXACTSRCTITLE, "Journal of Product Innovation Management") OR LIMIT-
TO(EXACTSRCTITLE, "Research Policy") OR LIMIT-TO(EXACTSRCTITLE, "Research Technology
Management") OR LIMIT-TO(EXACTSRCTITLE,"R and D Management ") OR LIMIT-TO(EXACTSRCTITLE,
"IEEE Transactions on Engineering Management") OR LIMIT-TO(EXACTSRCTITLE, "Technological
Forecasting and Social Change") OR LIMIT-TO(EXACTSRCTITLE, "International Journal of
Technology Management") OR LIMIT-TO(EXACTSRCTITLE, "Technovation") OR LIMIT-
TO(EXACTSRCTITLE, "Technology Analysis and Strategic Management") OR LIMIT-TO(EXACTSRCTITLE,
"Journal of Engineering and Technology Management") OR LIMIT-TO(EXACTSRCTITLE, "Industrial
and Corporate Change") OR LIMIT-TO(EXACTSRCTITLE, "Journal of Technology Transfer"))
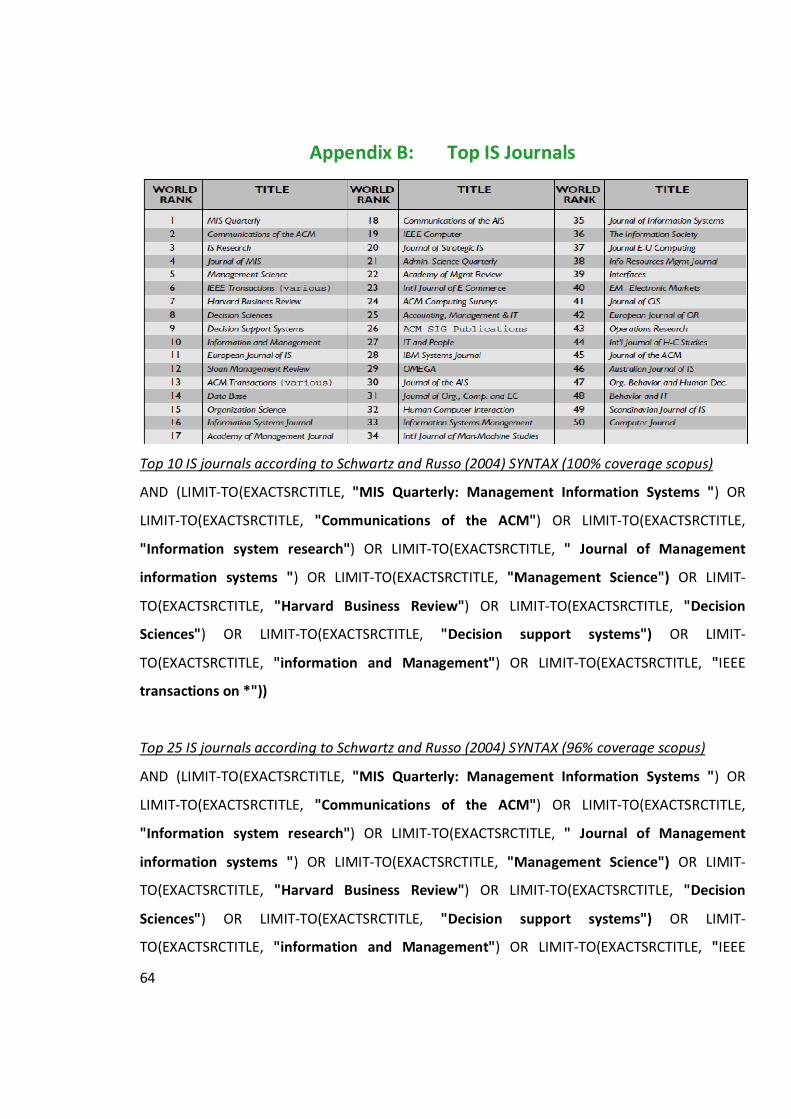
64
Appendix B: Top IS Journals
Top 10 IS journals according to Schwartz and Russo (2004) SYNTAX (100% coverage scopus)
AND (LIMIT-TO(EXACTSRCTITLE, "MIS Quarterly: Management Information Systems ") OR
LIMIT-TO(EXACTSRCTITLE, "Communications of the ACM") OR LIMIT-TO(EXACTSRCTITLE,
"Information system research") OR LIMIT-TO(EXACTSRCTITLE, " Journal of Management
information systems ") OR LIMIT-TO(EXACTSRCTITLE, "Management Science") OR LIMIT-
TO(EXACTSRCTITLE, "Harvard Business Review") OR LIMIT-TO(EXACTSRCTITLE, "Decision
Sciences") OR LIMIT-TO(EXACTSRCTITLE, "Decision support systems") OR LIMIT-
TO(EXACTSRCTITLE, "information and Management") OR LIMIT-TO(EXACTSRCTITLE, "IEEE
transactions on *"))
Top 25 IS journals according to Schwartz and Russo (2004) SYNTAX (96% coverage scopus)
AND (LIMIT-TO(EXACTSRCTITLE, "MIS Quarterly: Management Information Systems ") OR
LIMIT-TO(EXACTSRCTITLE, "Communications of the ACM") OR LIMIT-TO(EXACTSRCTITLE,
"Information system research") OR LIMIT-TO(EXACTSRCTITLE, " Journal of Management
information systems ") OR LIMIT-TO(EXACTSRCTITLE, "Management Science") OR LIMIT-
TO(EXACTSRCTITLE, "Harvard Business Review") OR LIMIT-TO(EXACTSRCTITLE, "Decision
Sciences") OR LIMIT-TO(EXACTSRCTITLE, "Decision support systems") OR LIMIT-
TO(EXACTSRCTITLE, "information and Management") OR LIMIT-TO(EXACTSRCTITLE, "IEEE
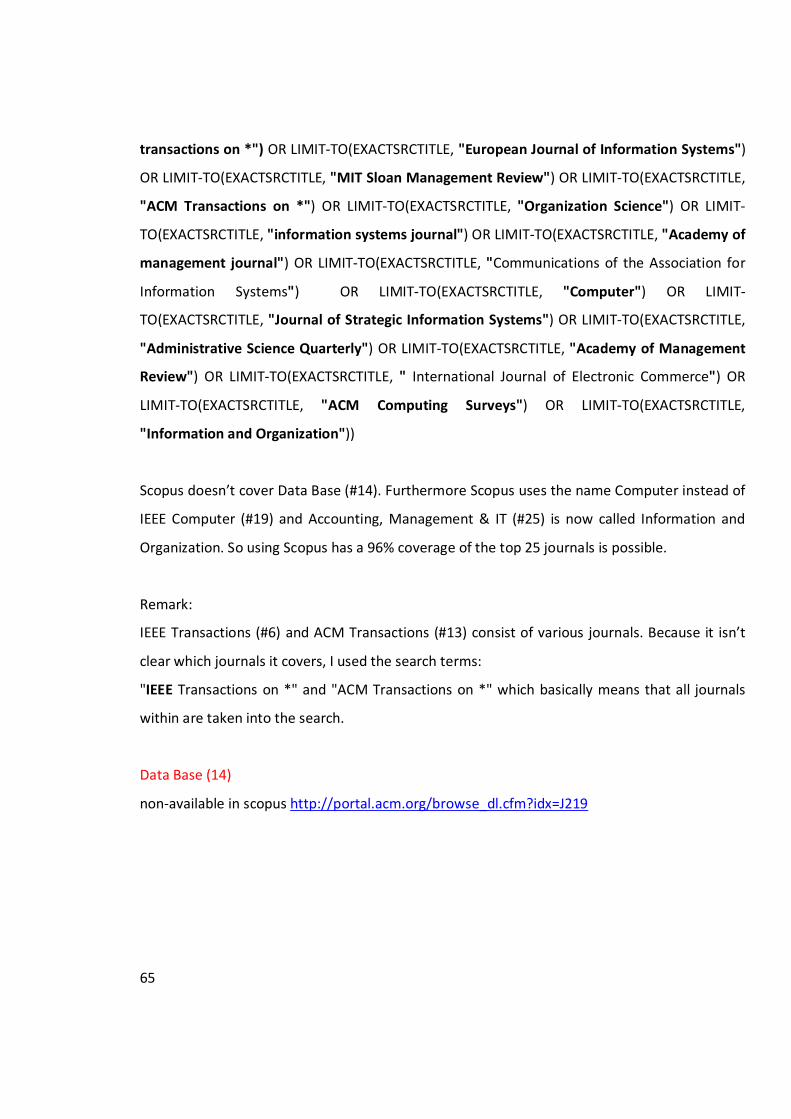
65
transactions on *") OR LIMIT-TO(EXACTSRCTITLE, "European Journal of Information Systems")
OR LIMIT-TO(EXACTSRCTITLE, "MIT Sloan Management Review") OR LIMIT-TO(EXACTSRCTITLE,
"ACM Transactions on *") OR LIMIT-TO(EXACTSRCTITLE, "Organization Science") OR LIMIT-
TO(EXACTSRCTITLE, "information systems journal") OR LIMIT-TO(EXACTSRCTITLE, "Academy of
management journal") OR LIMIT-TO(EXACTSRCTITLE, "Communications of the Association for
Information Systems") OR LIMIT-TO(EXACTSRCTITLE, "Computer") OR LIMIT-
TO(EXACTSRCTITLE, "Journal of Strategic Information Systems") OR LIMIT-TO(EXACTSRCTITLE,
"Administrative Science Quarterly") OR LIMIT-TO(EXACTSRCTITLE, "Academy of Management
Review") OR LIMIT-TO(EXACTSRCTITLE, " International Journal of Electronic Commerce") OR
LIMIT-TO(EXACTSRCTITLE, "ACM Computing Surveys") OR LIMIT-TO(EXACTSRCTITLE,
"Information and Organization"))
Scopus doesn’t cover Data Base (#14). Furthermore Scopus uses the name Computer instead of
IEEE Computer (#19) and Accounting, Management & IT (#25) is now called Information and
Organization. So using Scopus has a 96% coverage of the top 25 journals is possible.
Remark:
IEEE Transactions (#6) and ACM Transactions (#13) consist of various journals. Because it isn’t
clear which journals it covers, I used the search terms:
"IEEE Transactions on *" and "ACM Transactions on *" which basically means that all journals
within are taken into the search.
Data Base (14)
non-available in scopus http://portal.acm.org/browse_dl.cfm?idx=J219
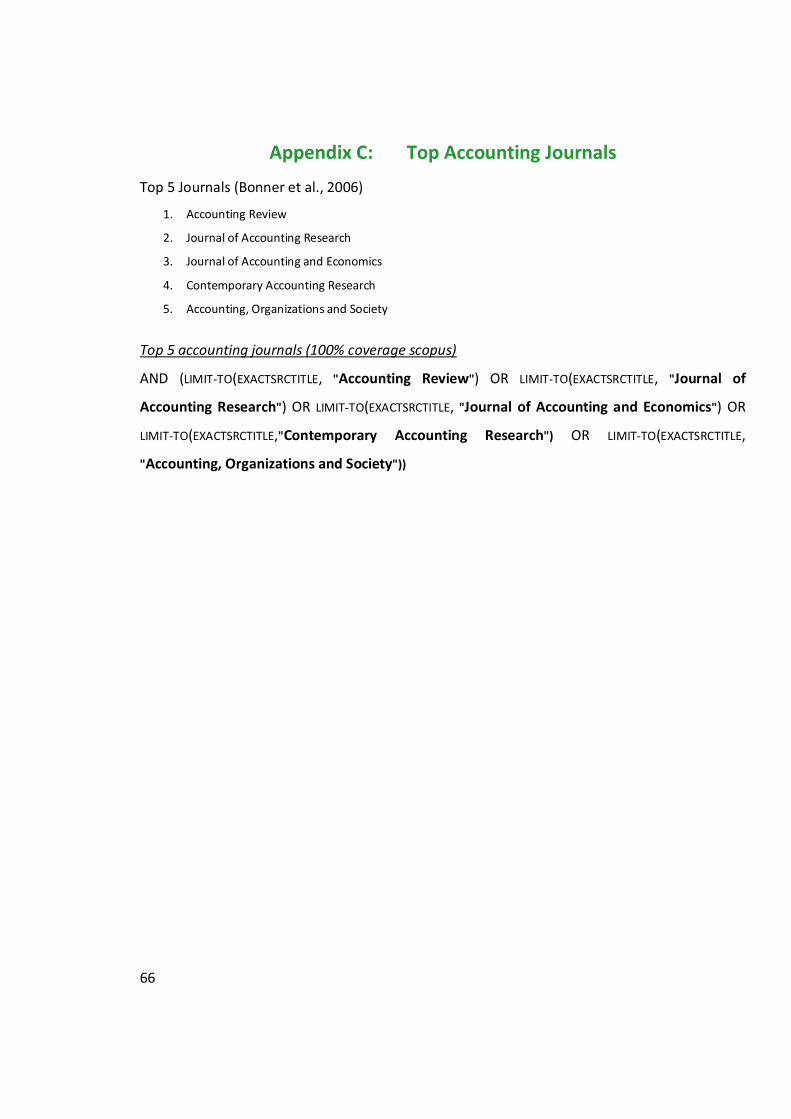
66
Appendix C: Top Accounting Journals
Top 5 Journals (Bonner et al., 2006)
1. Accounting Review
2. Journal of Accounting Research
3. Journal of Accounting and Economics
4. Contemporary Accounting Research
5. Accounting, Organizations and Society
Top 5 accounting journals (100% coverage scopus)
AND (LIMIT-TO(EXACTSRCTITLE, "Accounting Review") OR LIMIT-TO(EXACTSRCTITLE, "Journal of
Accounting Research") OR LIMIT-TO(EXACTSRCTITLE, "Journal of Accounting and Economics") OR
LIMIT-TO(EXACTSRCTITLE,"Contemporary Accounting Research") OR LIMIT-TO(EXACTSRCTITLE,
"Accounting, Organizations and Society"))
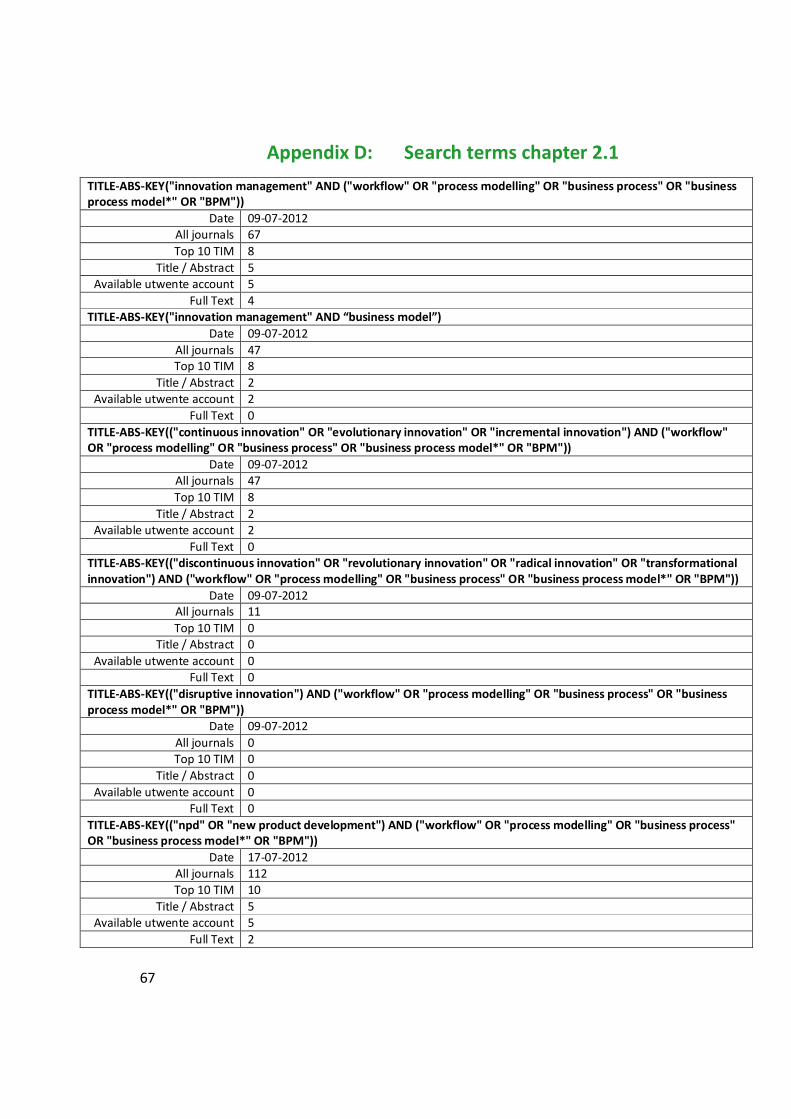
67
Appendix D: Search terms chapter 2.1
TITLE-ABS-KEY("innovation management" AND ("workflow" OR "process modelling" OR "business process" OR "business process model*" OR "BPM"))
Date 09-07-2012 All journals 67
Top 10 TIM 8
Title / Abstract 5 Available utwente account 5
Full Text 4 TITLE-ABS-KEY("innovation management" AND “business model”)
Date 09-07-2012
All journals 47 Top 10 TIM 8
Title / Abstract 2 Available utwente account 2
Full Text 0
TITLE-ABS-KEY(("continuous innovation" OR "evolutionary innovation" OR "incremental innovation") AND ("workflow" OR "process modelling" OR "business process" OR "business process model*" OR "BPM"))
Date 09-07-2012 All journals 47
Top 10 TIM 8
Title / Abstract 2 Available utwente account 2
Full Text 0 TITLE-ABS-KEY(("discontinuous innovation" OR "revolutionary innovation" OR "radical innovation" OR "transformational innovation") AND ("workflow" OR "process modelling" OR "business process" OR "business process model*" OR "BPM"))
Date 09-07-2012 All journals 11
Top 10 TIM 0 Title / Abstract 0
Available utwente account 0 Full Text 0
TITLE-ABS-KEY(("disruptive innovation") AND ("workflow" OR "process modelling" OR "business process" OR "business process model*" OR "BPM"))
Date 09-07-2012
All journals 0 Top 10 TIM 0
Title / Abstract 0
Available utwente account 0 Full Text 0
TITLE-ABS-KEY(("npd" OR "new product development") AND ("workflow" OR "process modelling" OR "business process" OR "business process model*" OR "BPM"))
Date 17-07-2012 All journals 112 Top 10 TIM 10
Title / Abstract 5 Available utwente account 5
Full Text 2
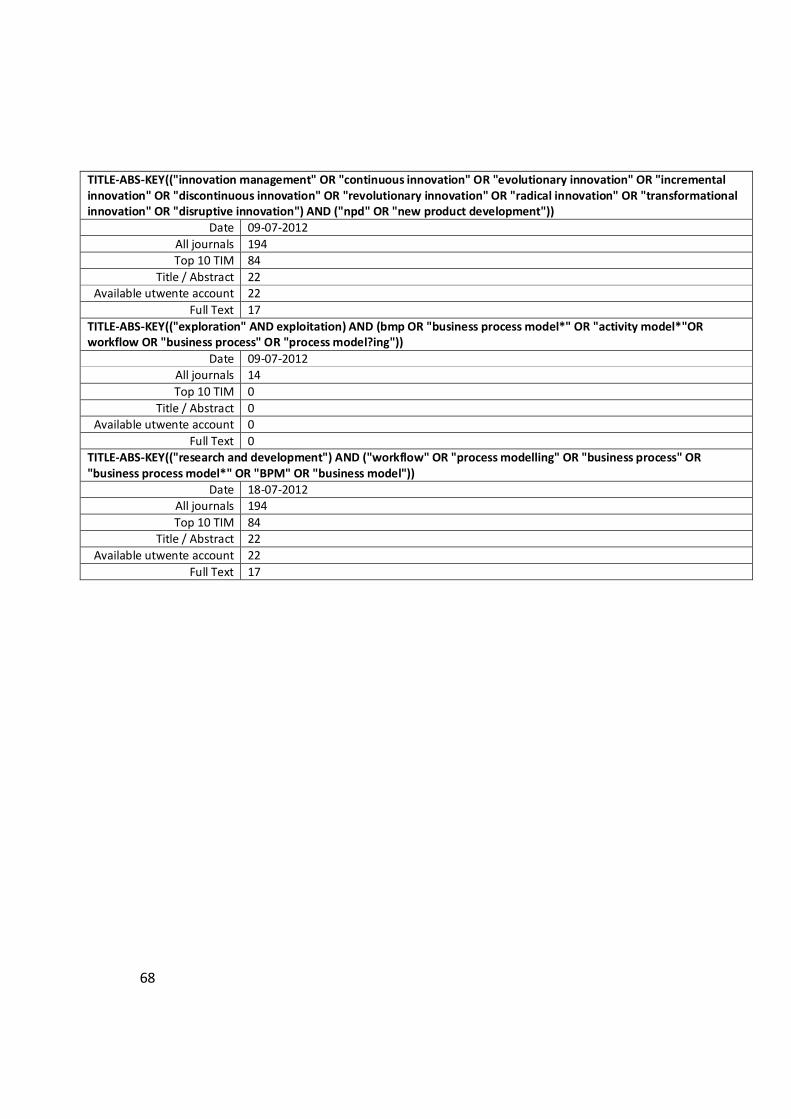
68
TITLE-ABS-KEY(("innovation management" OR "continuous innovation" OR "evolutionary innovation" OR "incremental innovation" OR "discontinuous innovation" OR "revolutionary innovation" OR "radical innovation" OR "transformational innovation" OR "disruptive innovation") AND ("npd" OR "new product development"))
Date 09-07-2012
All journals 194 Top 10 TIM 84
Title / Abstract 22 Available utwente account 22
Full Text 17
TITLE-ABS-KEY(("exploration" AND exploitation) AND (bmp OR "business process model*" OR "activity model*"OR workflow OR "business process" OR "process model?ing"))
Date 09-07-2012 All journals 14
Top 10 TIM 0
Title / Abstract 0 Available utwente account 0
Full Text 0 TITLE-ABS-KEY(("research and development") AND ("workflow" OR "process modelling" OR "business process" OR "business process model*" OR "BPM" OR "business model"))
Date 18-07-2012 All journals 194
Top 10 TIM 84 Title / Abstract 22
Available utwente account 22
Full Text 17
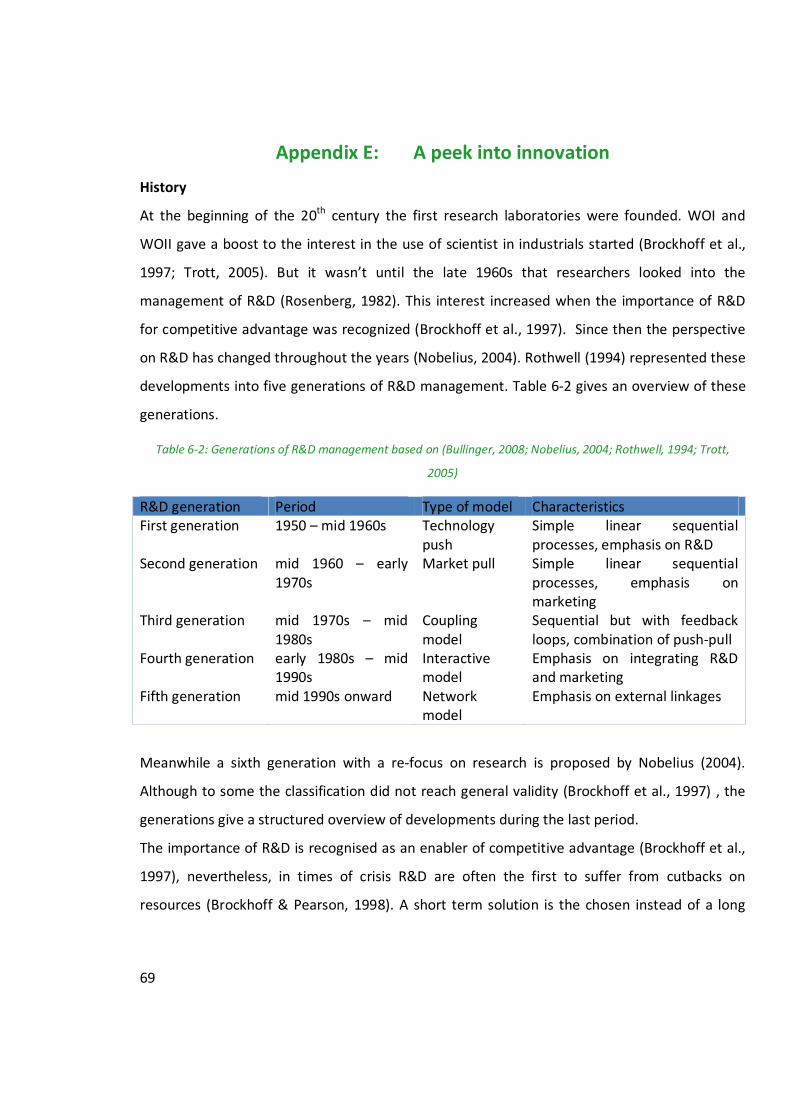
69
Appendix E: A peek into innovation
History
At the beginning of the 20th century the first research laboratories were founded. WOI and
WOII gave a boost to the interest in the use of scientist in industrials started (Brockhoff et al.,
1997; Trott, 2005). But it wasn’t until the late 1960s that researchers looked into the
management of R&D (Rosenberg, 1982). This interest increased when the importance of R&D
for competitive advantage was recognized (Brockhoff et al., 1997). Since then the perspective
on R&D has changed throughout the years (Nobelius, 2004). Rothwell (1994) represented these
developments into five generations of R&D management. Table 6-2 gives an overview of these
generations.
Table 6-2: Generations of R&D management based on (Bullinger, 2008; Nobelius, 2004; Rothwell, 1994; Trott,
2005)
R&D generation Period Type of model Characteristics First generation 1950 – mid 1960s Technology
push Simple linear sequential processes, emphasis on R&D
Second generation mid 1960 – early 1970s
Market pull Simple linear sequential processes, emphasis on marketing
Third generation mid 1970s – mid 1980s
Coupling model
Sequential but with feedback loops, combination of push-pull
Fourth generation early 1980s – mid 1990s
Interactive model
Emphasis on integrating R&D and marketing
Fifth generation mid 1990s onward Network model
Emphasis on external linkages
Meanwhile a sixth generation with a re-focus on research is proposed by Nobelius (2004).
Although to some the classification did not reach general validity (Brockhoff et al., 1997) , the
generations give a structured overview of developments during the last period.
The importance of R&D is recognised as an enabler of competitive advantage (Brockhoff et al.,
1997), nevertheless, in times of crisis R&D are often the first to suffer from cutbacks on
resources (Brockhoff & Pearson, 1998). A short term solution is the chosen instead of a long
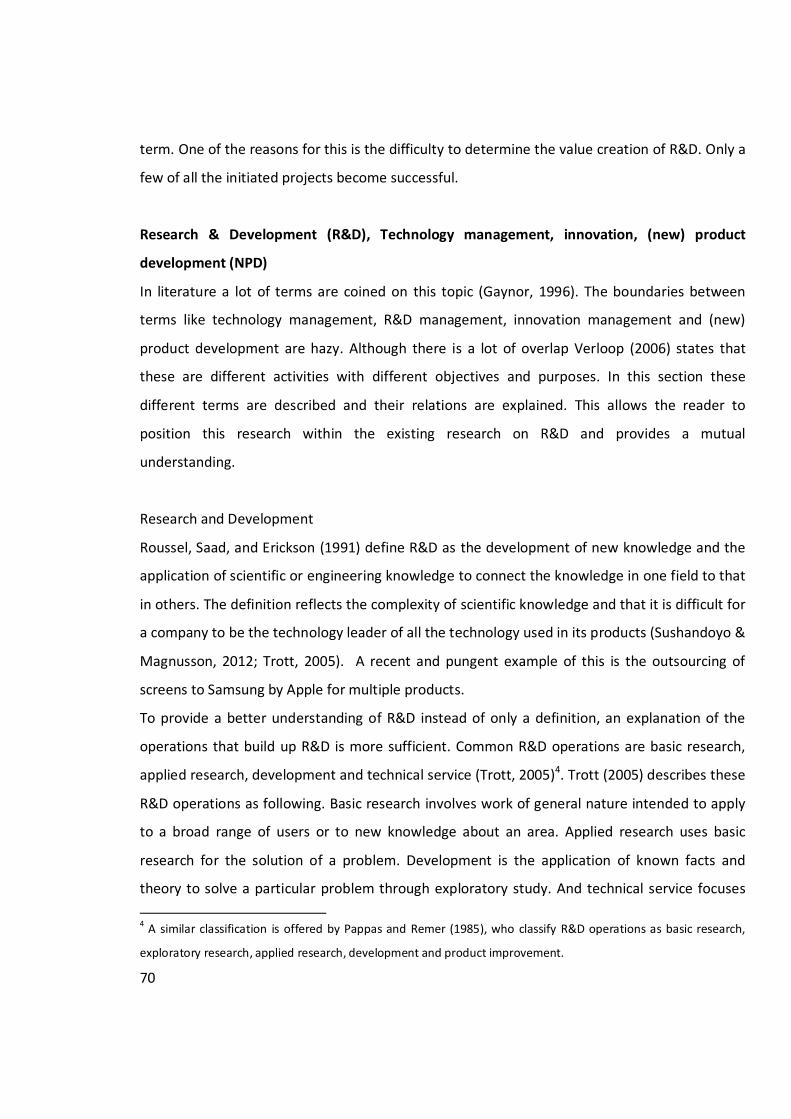
70
term. One of the reasons for this is the difficulty to determine the value creation of R&D. Only a
few of all the initiated projects become successful.
Research & Development (R&D), Technology management, innovation, (new) product
development (NPD)
In literature a lot of terms are coined on this topic (Gaynor, 1996). The boundaries between
terms like technology management, R&D management, innovation management and (new)
product development are hazy. Although there is a lot of overlap Verloop (2006) states that
these are different activities with different objectives and purposes. In this section these
different terms are described and their relations are explained. This allows the reader to
position this research within the existing research on R&D and provides a mutual
understanding.
Research and Development
Roussel, Saad, and Erickson (1991) define R&D as the development of new knowledge and the
application of scientific or engineering knowledge to connect the knowledge in one field to that
in others. The definition reflects the complexity of scientific knowledge and that it is difficult for
a company to be the technology leader of all the technology used in its products (Sushandoyo &
Magnusson, 2012; Trott, 2005). A recent and pungent example of this is the outsourcing of
screens to Samsung by Apple for multiple products.
To provide a better understanding of R&D instead of only a definition, an explanation of the
operations that build up R&D is more sufficient. Common R&D operations are basic research,
applied research, development and technical service (Trott, 2005)4. Trott (2005) describes these
R&D operations as following. Basic research involves work of general nature intended to apply
to a broad range of users or to new knowledge about an area. Applied research uses basic
research for the solution of a problem. Development is the application of known facts and
theory to solve a particular problem through exploratory study. And technical service focuses
4 A similar classification is offered by Pappas and Remer (1985), who classify R&D operations as basic research,
exploratory research, applied research, development and product improvement.
71
on costs and performance improvements to existing products, processes or systems. Figure 6-1
gives an indication of the place of these R&D operations.
Figure 6-1: Classification, place of R&D, measuring R&D (based on Pappas & Remer, 1985; Trott, 2005)
Figure 6-1 shows that the emphasis of industrial R&D has a stronger focus on the development
side then on the research side. This is in line with the industry’s purpose to grow and make
profit, which can be achieved through the development of new products and new businesses
(Trott, 2005). Figure 6-1 shows which measuring techniques for R&D productivity are used as
well in the different stages. However, according to Pappas and Remer (1985) this must be
interpreted as a general trend and that exceptions are possible.
Technology management
There is an overlap between technology- and innovation management (Brockhoff, 1992), which
often gives a confused view of these terms. It appears that within the literature there is no clear
divided line between the two disciplines. Bullinger (2008) offers a overview of references which
states that technology management covers decisions on the strategic and operational selection,
procurement, maintenance and exploitation of novel and existing technological competences of
the firm, covering their entire lifecycle. In other words, technology management is about an
organization’s interaction with its external and internal technological environment. Examples as
such are licensing, acquisition of external knowledge and R&D.
72
Innovation (management)
While technology management has a strong focus on technology, innovation management has
a more organization wide focus. Trott (2005) sees innovation as a management process by
defining innovation as the management of all the activities involved in the process of idea
generation, technology development, manufacturing and marketing of a new (or improved)
product or manufacturing process or equipment. Examples of innovation management are
processes such as new product development and new process development. By managing
innovation, the right conditions are set to ensure that the company as a whole is given the
opportunity to develop new products (Trott, 2005).
Before (new) product development is described, the different degrees of innovation should be
explained. In this research the terms incremental and radical innovation are used, but there is
no consensus in literature on this terminology. Incremental innovation is interchangeably used
with continuous (Veryzer Jr, 1998) and evolutionary innovation (Verloop, 2006). Radical
innovation is used as well as discontinuous (Veryzer Jr, 1998) revolutionary (Verloop, 2006) and
breakthrough (McLaughlin, Bessant, & Smart, 2008) innovation, which again is interchangeable.
The distinction between incremental and radical change can be traced back to 1942 when
Schumpeter (1994) states:
“We have seen that the function of entrepreneurs is to reform or revolutionize the pattern of
production by exploiting an invention or, more generally, an untried technological possibility for
producing a new commodity or producing an old one in a new way…”
In which he basically describes the fundament of radical innovation. Later on in that paragraph
he distinguishes incremental innovation as:
“…down to such things as making a success of a particular kind of sausage or toothbrush”
Ali (1994) defines incremental products as product line extensions or modifications of existing
products and radical products as technical breakthroughs. Radical products often are
unfamiliar to the market which results in a high level of uncertainty concerning their
technological and market feasibility (Ali, 1994; Verloop, 2006; Veryzer Jr, 1998). In incremental
innovation one knows the customer and in radical innovation one does not (Verloop, 2006). An
example as such for radical innovation is the first Apple Iphone, where following generations
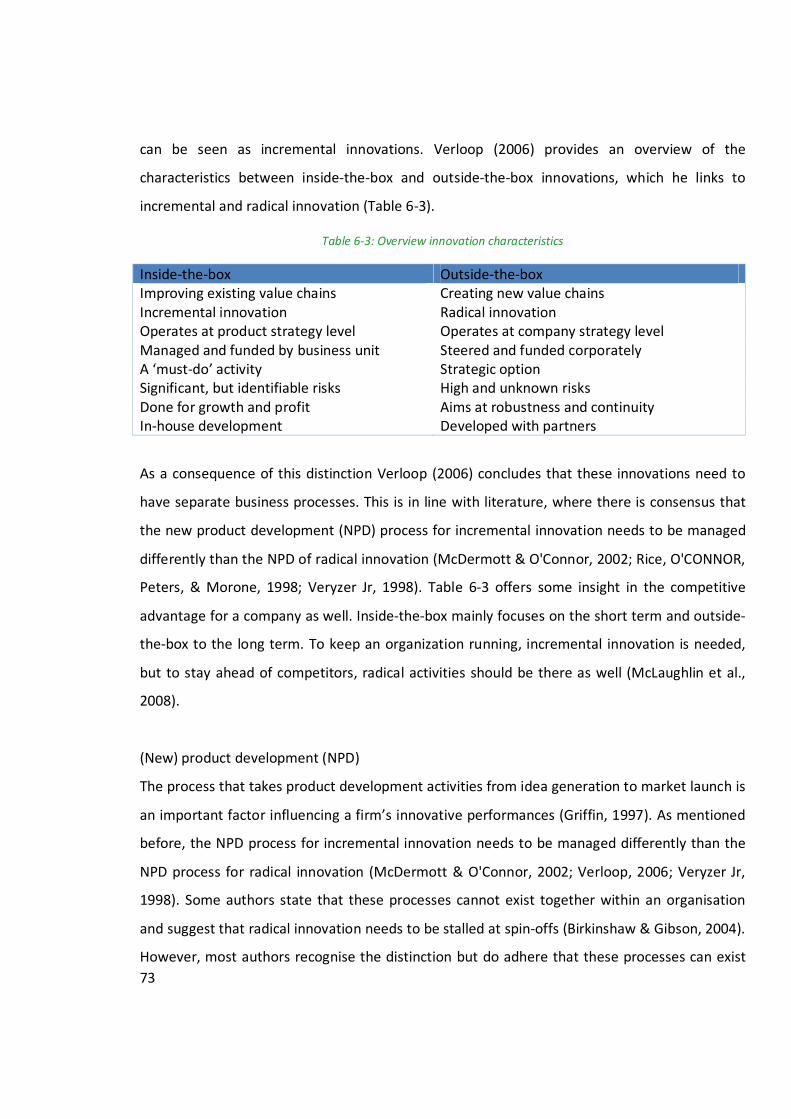
73
can be seen as incremental innovations. Verloop (2006) provides an overview of the
characteristics between inside-the-box and outside-the-box innovations, which he links to
incremental and radical innovation (Table 6-3).
Table 6-3: Overview innovation characteristics
Inside-the-box Outside-the-box Improving existing value chains Creating new value chains Incremental innovation Radical innovation Operates at product strategy level Operates at company strategy level Managed and funded by business unit Steered and funded corporately A ‘must-do’ activity Strategic option Significant, but identifiable risks High and unknown risks Done for growth and profit Aims at robustness and continuity In-house development Developed with partners
As a consequence of this distinction Verloop (2006) concludes that these innovations need to
have separate business processes. This is in line with literature, where there is consensus that
the new product development (NPD) process for incremental innovation needs to be managed
differently than the NPD of radical innovation (McDermott & O'Connor, 2002; Rice, O'CONNOR,
Peters, & Morone, 1998; Veryzer Jr, 1998). Table 6-3 offers some insight in the competitive
advantage for a company as well. Inside-the-box mainly focuses on the short term and outside-
the-box to the long term. To keep an organization running, incremental innovation is needed,
but to stay ahead of competitors, radical activities should be there as well (McLaughlin et al.,
2008).
(New) product development (NPD)
The process that takes product development activities from idea generation to market launch is
an important factor influencing a firm’s innovative performances (Griffin, 1997). As mentioned
before, the NPD process for incremental innovation needs to be managed differently than the
NPD process for radical innovation (McDermott & O'Connor, 2002; Verloop, 2006; Veryzer Jr,
1998). Some authors state that these processes cannot exist together within an organisation
and suggest that radical innovation needs to be stalled at spin-offs (Birkinshaw & Gibson, 2004).
However, most authors recognise the distinction but do adhere that these processes can exist
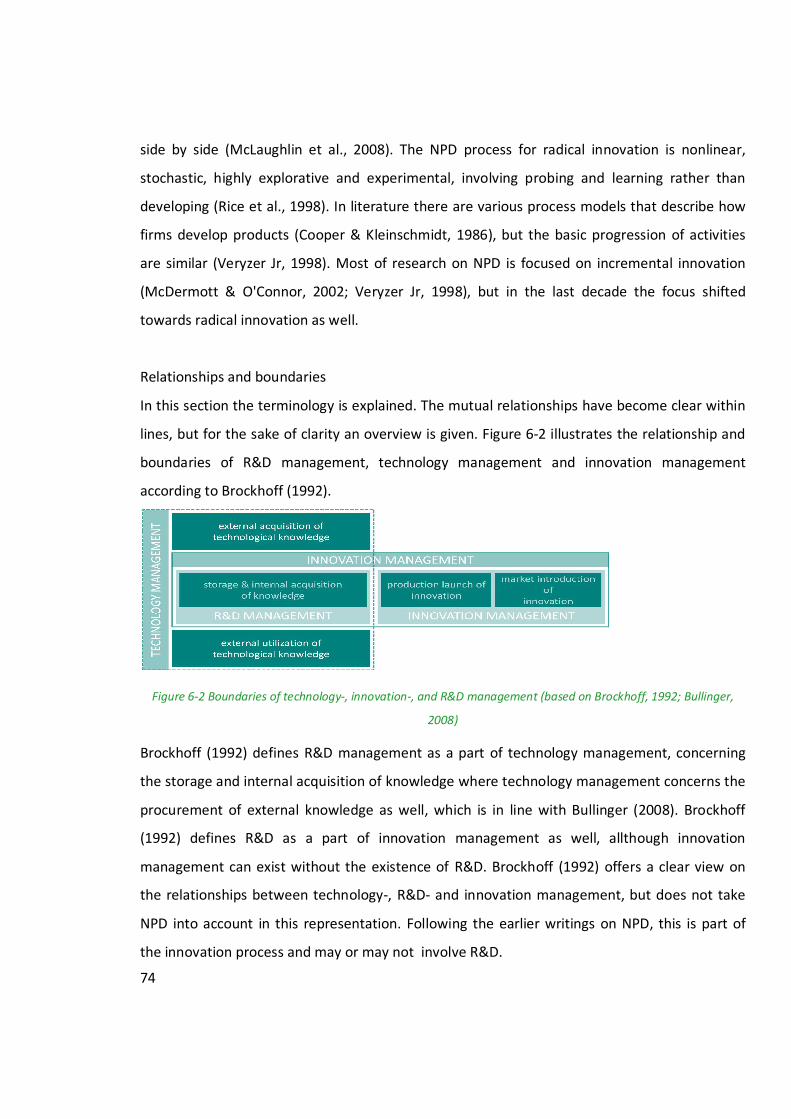
74
side by side (McLaughlin et al., 2008). The NPD process for radical innovation is nonlinear,
stochastic, highly explorative and experimental, involving probing and learning rather than
developing (Rice et al., 1998). In literature there are various process models that describe how
firms develop products (Cooper & Kleinschmidt, 1986), but the basic progression of activities
are similar (Veryzer Jr, 1998). Most of research on NPD is focused on incremental innovation
(McDermott & O'Connor, 2002; Veryzer Jr, 1998), but in the last decade the focus shifted
towards radical innovation as well.
Relationships and boundaries
In this section the terminology is explained. The mutual relationships have become clear within
lines, but for the sake of clarity an overview is given. Figure 6-2 illustrates the relationship and
boundaries of R&D management, technology management and innovation management
according to Brockhoff (1992).
Figure 6-2 Boundaries of technology-, innovation-, and R&D management (based on Brockhoff, 1992; Bullinger,
2008)
Brockhoff (1992) defines R&D management as a part of technology management, concerning
the storage and internal acquisition of knowledge where technology management concerns the
procurement of external knowledge as well, which is in line with Bullinger (2008). Brockhoff
(1992) defines R&D as a part of innovation management as well, allthough innovation
management can exist without the existence of R&D. Brockhoff (1992) offers a clear view on
the relationships between technology-, R&D- and innovation management, but does not take
NPD into account in this representation. Following the earlier writings on NPD, this is part of
the innovation process and may or may not involve R&D.
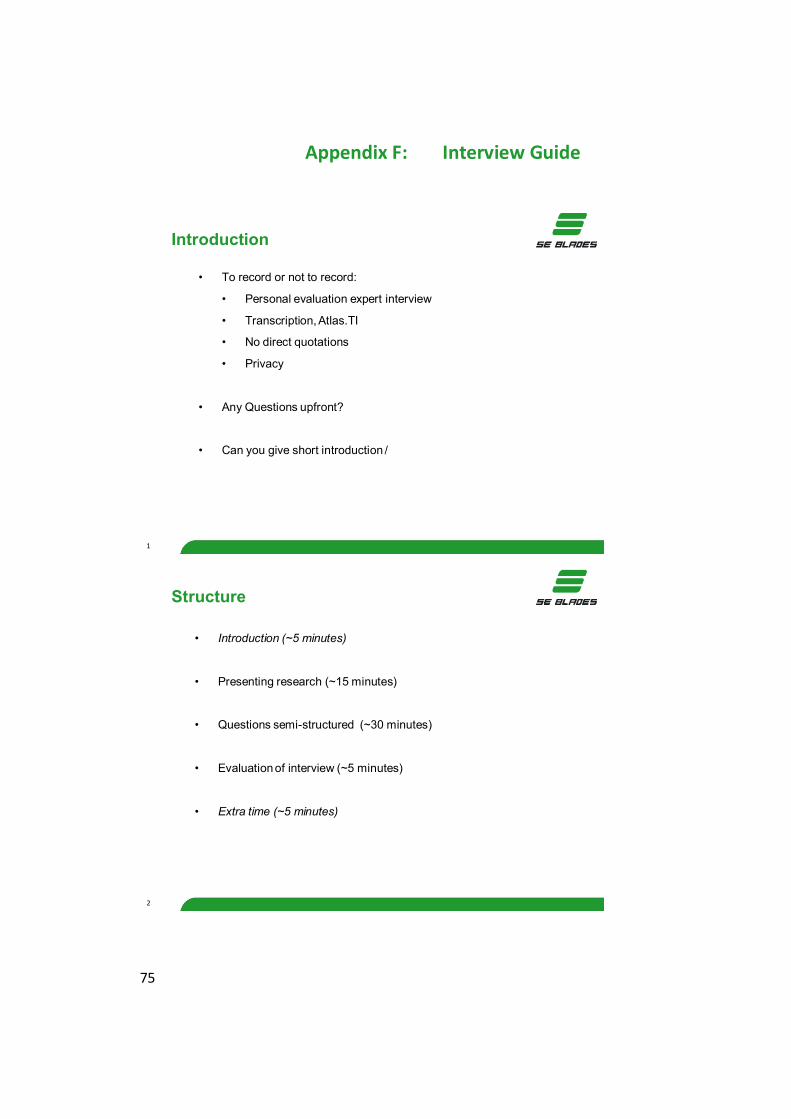
75
Appendix F: Interview Guide
Introduction
• To record or not to record:
• Personal evaluation expert interview
• Transcription, Atlas.TI
• No direct quotations
• Privacy
• Any Questions upfront?
• Can you give short introduction /
1
Structure
• Introduction (~5 minutes)
• Presenting research (~15 minutes)
• Questions semi-structured (~30 minutes)
• Evaluation of interview (~5 minutes)
• Extra time (~5 minutes)
2
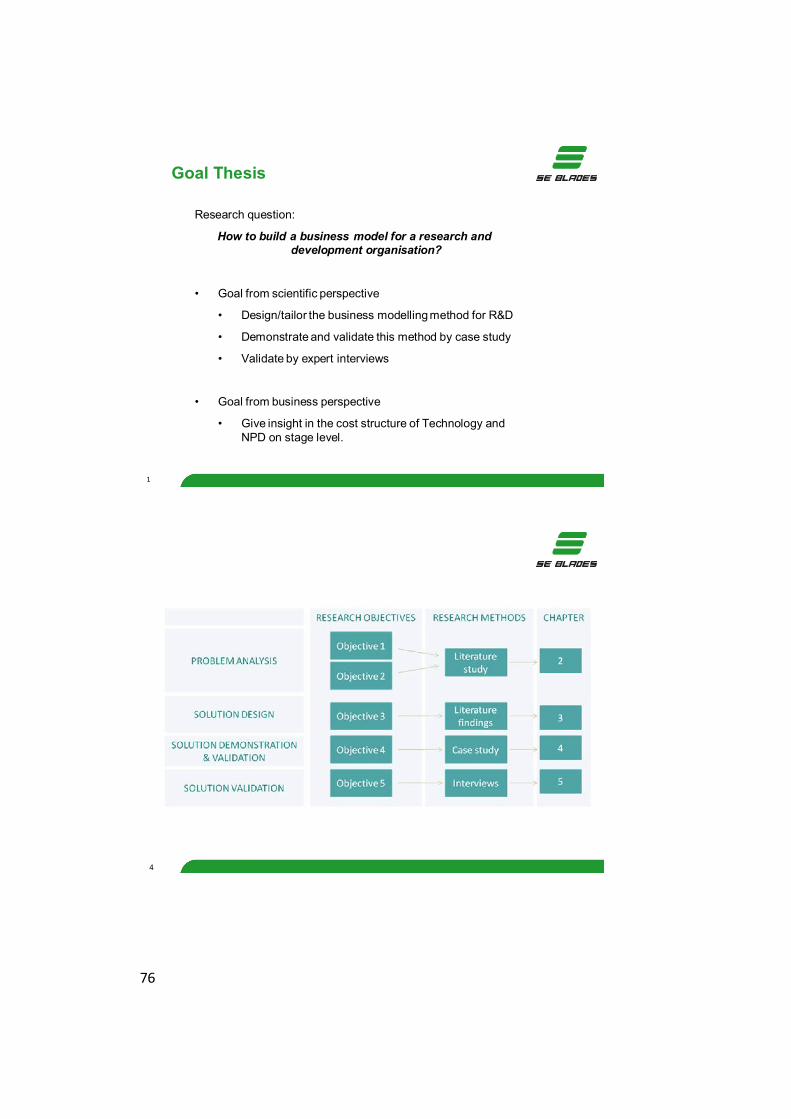
76
Goal Thesis
Research question:
How to build a business model for a research and development organisation?
• Goal from scientific perspective
• Design/tailor the business modelling method for R&D
• Demonstrate and validate this method by case study
• Validate by expert interviews
• Goal from business perspective
• Give insight in the cost structure of Technology and NPD on stage level.
1
4
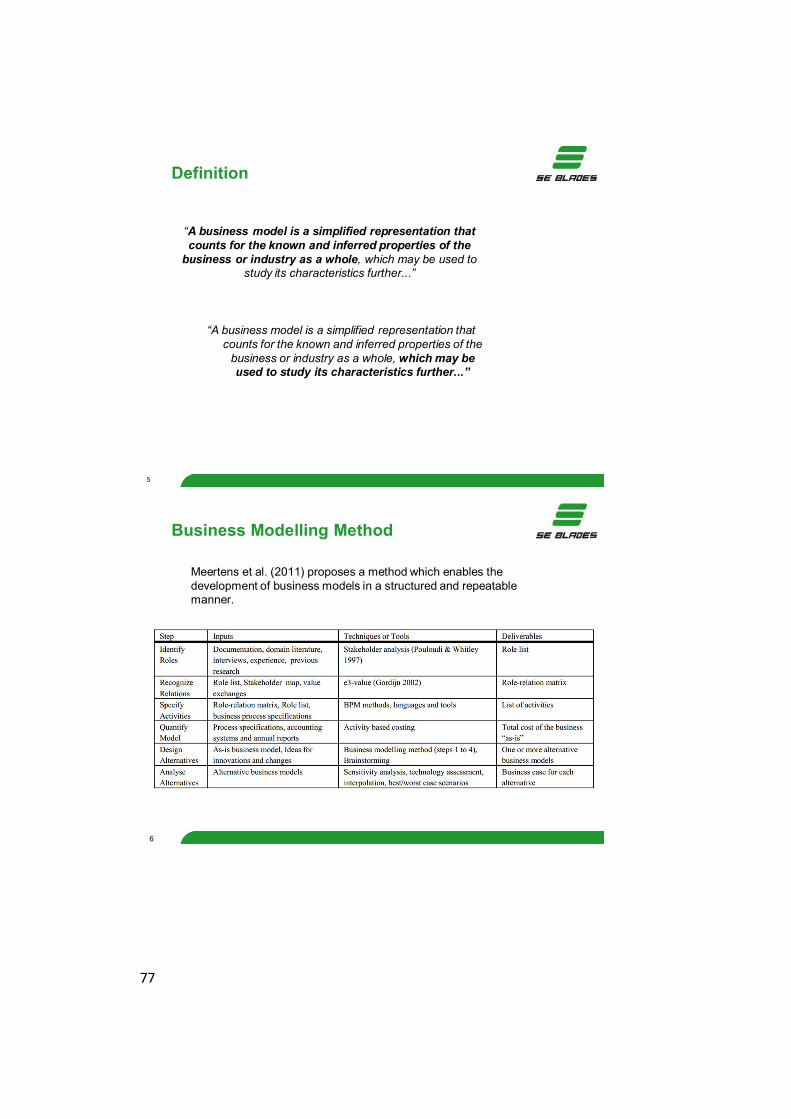
77
Definition
“A business model is a simplified representation that counts for the known and inferred properties of the
business or industry as a whole, which may be used to study its characteristics further...”
“A business model is a simplified representation that counts for the known and inferred properties of the
business or industry as a whole, which may be used to study its characteristics further...”
5
6
Business Modelling Method
Meertens et al. (2011) proposes a method which enables the development of business models in a structured and repeatable manner.
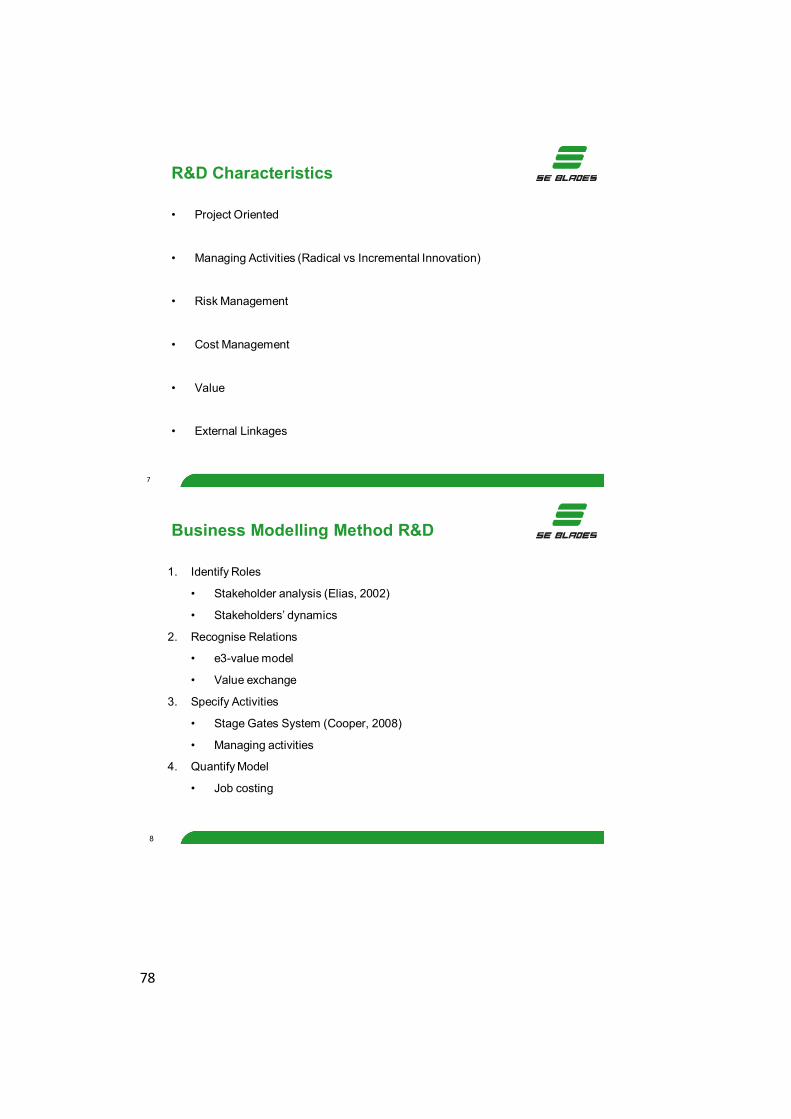
78
R&D Characteristics
• Project Oriented
• Managing Activities (Radical vs Incremental Innovation)
• Risk Management
• Cost Management
• Value
• External Linkages
7
8
Business Modelling Method R&D
1. Identify Roles
• Stakeholder analysis (Elias, 2002)
• Stakeholders’ dynamics
2. Recognise Relations
• e3-value model
• Value exchange
3. Specify Activities
• Stage Gates System (Cooper, 2008)
• Managing activities
4. Quantify Model
• Job costing
79
Heeft u vragen naar aanleiding van deze uitleg?
9
Wat zijn de sterke punten van deze methode?
10
80
Wat zijn de zwakke punten van deze methode?
11
Denkt u dat deze methode toepasbaar is bij R&D organisaties?
12

81
Bedankt!
13
Back-up vraag:
Wat vindt u van de gekozen technieken?
14
82
Abernethy, M. A., & Brownell, P. (1997). Management control systems in research and development organizations: the role of accounting, behavior and personnel controls. Accounting, Organizations and Society, 22(3), 233-248.
Ali, A. (1994). Pioneering versus incremental innovation: Review and research propositions. Journal of Product Innovation Management, 11(1), 46-61.
Allee, V. (2008). Value network analysis and value conversion of tangible and intangible assets. Journal of Intellectual Capital, 9(1), 5-24.
Andersson, B., Johannesson, P., & Bergholtz, M. (2009). Purpose driven value model design. Balachandra, R., & Friar, J. H. (1997). Factors for success in R&D projects and new product
innovation: a contextual framework. Engineering Management, IEEE Transactions on, 44(3), 276-287.
Biazzo, S. (2009). Flexibility, structuration, and simultaneity in new product development. Journal of Product Innovation Management, 26(3), 336-353.
Birkinshaw, J., & Gibson, C. (2004). Building ambidexterity into an organization. MIT Sloan Management Review, 45, 47-55.
Bonner, S. E., Hesford, J. W., Van der Stede, W. A., & Young, S. M. (2006). The most influential journals in academic accounting. Accounting, Organizations and Society, 31(7), 663-685.
Brentani, U., & Reid, S. E. (2012). The Fuzzy Front-End of Discontinuous Innovation: Insights for Research and Management. Journal of Product Innovation Management.
Brockhoff, K. K. (1992). Forschung und Entwicklung: Planung und Kontrolle (Vol. 3). München: R. Oldenbourg Verlag
Brockhoff, K. K., Koch, G., & Pearson, A. W. (1997). Business process re–engineering: experiences in R&D. Technology Analysis & Strategic Management, 9(2), 163-178.
Brockhoff, K. K., & Pearson, A. W. (1998). R&D budgeting reactions to a recession. MIR: Management International Review, 363-376.
Bullinger, A. (2008). Innovation and Ontologies: structuring the early stages of innovation management. Gabler Verlag.
Chao, R., & Kavadias, S. (2008). A theoretical framework for managing the NPD portfolio: When and how to use strategic buckets. Management Science, Vol. 54, No. 5, pp. 907-921, 2008.
Chesbrough, H. W. (2003). Open innovation: The new imperative for creating and profiting from technology: Harvard Business Press.
Coombs, R., McMeekin, A., & Pybus, R. (1998). Toward the development of benchmarking tools for R&D project management. R&D Management, 28(3), 175-186.
Cooper, R. G. (1990). Stage-gate systems: a new tool for managing new products. Business Horizons, 33(3), 44-54.
Cooper, R. G. (2006). Managing technology development projects. Research-Technology Management, 49(6), 23-31.
Cooper, R. G. (2008). Perspective: The Stage-Gate® Idea-to-Launch Process—Update, What's New, and NexGen Systems*. Journal of Product Innovation Management, 25(3), 213-232. doi: 10.1111/j.1540-5885.2008.00296.x
Cooper, R. G. (2009). How Companies are Reinventing Their IdeatoLaunch Methodologies. Research-Technology Management, 52(2), 47-57.
83
Cooper, R. G., & Kleinschmidt, E. J. (1986). An investigation into the new product process: steps, deficiencies, and impact. Journal of Product Innovation Management, 3(2), 71-85.
Daley, L. A., & Vigeland, R. L. (1983). The effects of debt covenants and political costs on the choice of accounting methods:: The case of accounting for R&D costs. Journal of Accounting and Economics, 5, 195-211.
Daniel Sherman, J., & Olsen, E. A. (1996). Stages in the project life cycle in R&D organizations and the differing relationships between organizational climate and performance. The Journal of High Technology Management Research, 7(1), 79-90.
Drury, C. (2007). Management and cost accounting (6th Value Media Edition ed.). London: Thomson Learning.
Elias, A. A., Cavana, R. Y., & Jackson, L. S. (2002). Stakeholder analysis for R&D project management. R&D Management, 32(4), 301-310.
Emans, B. J. M. (1985). Interviewen: theorie, techniek en training: Wolters-Noordhoff Groningen.
Freeman, R. E. (1984). Strategic management: A stakeholder approach. Boston, MA: Pitman. Gaynor, G. H. (1996). Handbook of technology management. New York: McGraw-Hill. Gordijn, J., Akkermans, H., & Van Vliet, J. (2001). Designing and evaluating e-business models.
IEEE Intelligent Systems, 16(4), 11-17. Gordijn, J., & Akkermans, J. (2003). Value-based requirements engineering: Exploring innovative
e-commerce ideas. Requirements engineering, 8(2), 114-134. Gregor, S. (2006). The nature of theory in information systems. Mis Quarterly, 30(3), 611-642. Griffin, A. (1997). PDMA research on new product development practices: updating trends and
benchmarking best practices. Journal of Product Innovation Management, 14(6), 429-458.
Haque, B., & Pawar, K. S. (2001). Improving the management of concurrent new product Development using Process Modelling and Analysis. R&D Management, 31(1), 27-40.
Healy, P. M., Myers, S. C., & Howe, C. D. (2002). R&D accounting and the tradeoff between relevance and objectivity. Journal of Accounting Research, 40(3), 677-710.
Hevner, A. R., March, S. T., Park, J., & Ram, S. (2004). Design science in information systems research. Mis Quarterly, 28(1), 75-105.
Horngren, C. T., Foster, G., & Datar, S. M. (2006). Cost Accounting: A Managerial Emphasis (12th edition ed.). Upper Saddle River, N.J.: Pearson/Prentice Hall.
Iansiti, M. (1995). Shooting the rapids: Managing product development in turbulent environments. California Management Review, 38, 37-58.
Icke, R. (2012). Innovation position of the Netherlands hinders prospects for economic growth. Press release 2012-21 Retrieved 27-08, 2012, from http://www.tno.nl/content.cfm?context=overtno&content=persbericht&laag1=37&item_id=201206080021&Taal=2
Kahn, K. B., Barczak, G., & Moss, R. (2006). Perspective: establishing an NPD best practices framework. Journal of Product Innovation Management, 23(2), 106-116.
Kamoche, K., & e Cunha, M. P. (2001). Minimal structures: from jazz improvisation to product innovation. Organization Studies, 22(5), 733-764.
84
Kartseva, V., Gordijn, J., & Tan, Y. H. (2006). Toward a modeling tool for designing control mechanisms for network organizations. International Journal of Electronic Commerce, 10(2), 58-84.
Kleinschmidt, E. J., & Cooper, R. G. (1991). The impact of product innovativeness on performance. Journal of Product Innovation Management, 8(4), 240-251.
Kuipers, A. (2011). Netherlands drifting further behind in R&D. Web magazine Retrieved 30-08, 2012, from http://www.cbs.nl/en-GB/menu/themas/dossiers/ondernemingsklimaat/publicaties/artikelen/archief/2011/2011-3303-wm.htm?Languageswitch=on
Kumar, K., & Welke, R. J. (1992). Methodology engineering: a proposal for situation-specific methodology construction.
Lev, B., Sarath, B., & Sougiannis, T. (2005). R&D Reporting Biases and Their Consequences. Contemporary Accounting Research, 22(4), 977-1026.
Liberatore, M. J., & Titus, G. J. (1983). The practice of management science in R&D project management. Management Science, 962-974.
Linton, J. D., & Thongpapanl, N. T. (2004). PERSPECTIVE: Ranking the Technology Innovation Management Journals. Journal of Product Innovation Management, 21(2), 123-139.
March, S. T., & Smith, G. F. (1995). Design and natural science research on information technology. Decision support systems, 15(4), 251-266.
McDermott, C. M., & O'Connor, G. C. (2002). Managing radical innovation: an overview of emergent strategy issues. Journal of Product Innovation Management, 19(6), 424-438.
McLaughlin, P., Bessant, J., & Smart, P. (2008). Developing an organisation culture to facilitate radical innovation. International Journal of Technology Management, 44(3), 298-323.
Meertens, L., Iacob, M., & Nieuwenhuis, L. (2011). Developing the business modelling method. Paper presented at the Proceedings of the First International Symposium on Business Modeling and Software Design 2011.
Mitchell, R. K., Agle, B. R., & Wood, D. J. (1997). Toward a theory of stakeholder identification and salience: Defining the principle of who and what really counts. Academy of management review, 853-886.
Morandi, V. (2011). The management of industry–university joint research projects: how do partners coordinate and control R&D activities? The Journal of Technology Transfer, 1-24.
Nobelius, D. (2004). Towards the sixth generation of R&D management. International Journal of Project Management, 22(5), 369-375.
Offermann, P., Blom, S., Levina, O., & Bub, U. (2010). Proposal for Components of Method Design Theories. Business & Information Systems Engineering, 2(5), 295-304.
Osterwalder, A. (2004). The business model ontology: A proposition in a design science approach. Academic Dissertation, Université de Lausanne lécole des hautes etudes Ccmmerciales.
Page, A. L., & Schirr, G. R. (2008). Growth and Development of a Body of Knowledge: 16 Years of New Product Development Research, 1989–2004*. Journal of Product Innovation Management, 25(3), 233-248.
Pappas, R. A., & Remer, D. S. (1985). Measuring R and D Productivity.
85
Pateli, A. G., & Giaglis, G. M. (2004). A research framework for analysing eBusiness models. European journal of information systems, 13(4), 302-314.
Peters, L. S. (2006). Rejoinders to “establishing an NPD best practices framework”. Journal of Product Innovation Management, 23(2), 117-127.
Pinto, J. K., & Covin, J. G. (1989). Critical factors in project implementation: a comparison of construction and R&D projects. Technovation, 9(1), 49-62.
Pouloudi, A., & Whitley, E. A. (1997). Stakeholder identification in inter-organizational systems: gaining insights for drug use management systems. European journal of information systems, 6(1), 1-14.
Rice, M. P., O'CONNOR, G. C., Peters, L. S., & Morone, J. G. (1998). Managing discontinuous innovation. Research Technology Management, 41(3), 52-58.
Rockness, H. O., & Shields, M. D. (1984). Organizational control systems in research and development. Accounting, Organizations and Society, 9(2), 165-177.
Rosenberg, N. (1982). Inside the black box: technology and economics. Cambridge: Cambridge University Press.
Rothwell, R. (1994). Industrial innovation: success, strategy, trends. In M. Dodgson & R. Rothwell (Eds.), The handbook of industrial innovation. Cheltenham: Edward Elgar.
Roussel, P. A., Saad, K. N., & Erickson, T. J. (1991). Third generation R&D: managing the link to corporate strategy: Harvard Business Press.
Schumpeter, J. A. (1994). Capitalism, socialism and democracy. London: Routledge. Schwartz, R. B., & Russo, M. C. (2004). How to quickly find articles in the top IS journals.
Communications of the ACM, 47(2), 98-101. Smeds, R., Haho, P., & Alvesalo, J. (2003). Bottom-up or top-down? Evolutionary change
management in NPD processes. International Journal of Technology Management, 26(8), 887-902.
Sushandoyo, D., & Magnusson, T. (2012). A two-way relationship between multi-level technological change and organisational characteristics-cases involving the development of heavy hybrid buses. Technovation.
Teece, D. J. (2010). Business models, business strategy and innovation. Long range planning, 43(2), 172-194.
Thongpapanl, N. T. (2012). The changing landscape of technology and innovation management: An updated ranking of journals in the field. Technovation, 32, 257-271.
Trott, P. (2005). Innovation management and new product development (third ed.). Harlow Financial Times Prentice Hall.
Verhagen, M. J. M. (2011). Bedrijfslevenbeleid. Den Haag: Tweede Kamer der Staten-Generaal. Verloop, J. (2006). The Shell way to innovate. International Journal of Technology Management,
34(3), 243-259. Vermolen, R. (2010). Reflecting on IS Business Model Research: Current Gaps and Future
Directions. Paper presented at the Proceedings of the 13th Twente Student Conference on IT, Enschede, Netherlands: University of Twente.
Veryzer Jr, R. W. (1998). Discontinuous innovation and the new product development process. Journal of Product Innovation Management, 15(4), 304-321.

86
Wyatt, A. (2005). Accounting recognition of intangible assets: theory and evidence on economic determinants. Accounting Review, 967-1003.
Yin, R. K. (1987). Case study research: Design and methods (Vol. 5): Sage publications, INC.


