Global Exhibition Barometer 17th edition (July 2016) A UFI report based on the results of a survey conducted in June 2016
Southern Africa
Global
US
Central & South America
Mexico
Brazil
United Kingdom
Thailand
Page
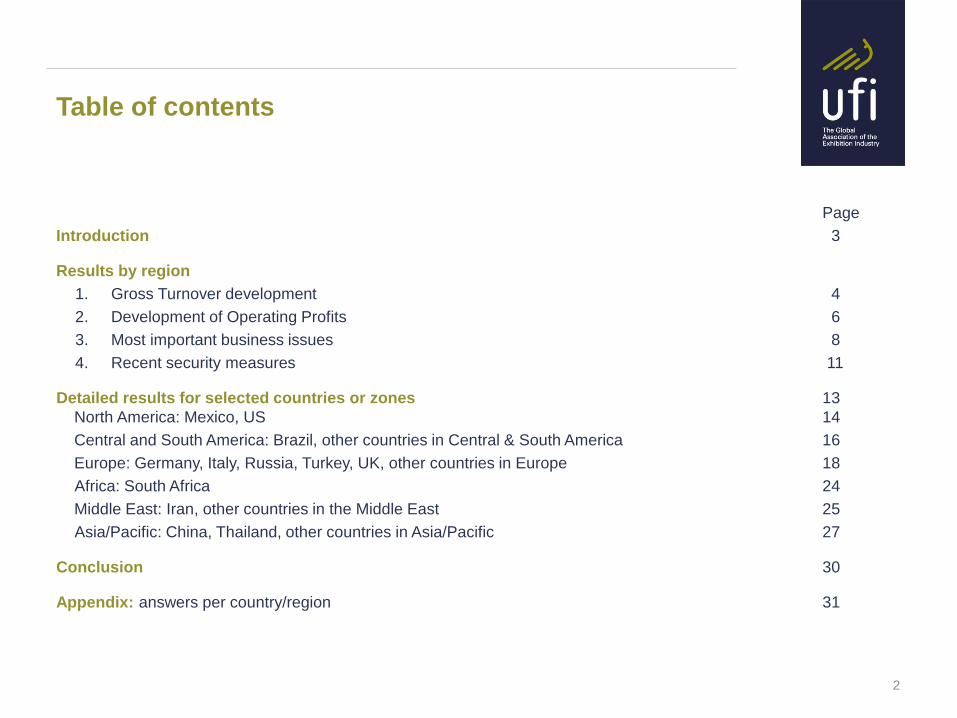
Introduction 3
Results by region
1. Gross Turnover development 4
2. Development of Operating Profits 6
3. Most important business issues 8
4. Recent security measures 11
Detailed results for selected countries or zones 13
North America: Mexico, US 14
Central and South America: Brazil, other countries in Central & South America 16
Europe: Germany, Italy, Russia, Turkey, UK, other countries in Europe 18
Africa: South Africa 24
Middle East: Iran, other countries in the Middle East 25
Asia/Pacific: China, Thailand, other countries in Asia/Pacific 27
Conclusion 30
Appendix: answers per country/region 31
Table of contents
2

Welcome to the 17th edition of the “UFI Global Exhibition Barometer“ survey. This study is based on a global survey,
conducted in June 2016. It represents up to date information on the development and the outlook of the global exhibition
industry as well as on 16 specific countries and zones.
UFI began assessing the impact of the global economic conditions on the exhibition industry twice a year in 2009, based
on perceptions of UFI members around the world. In 2010, this biannual survey became the “UFI Global Exhibition
Barometer“. For the United States, this survey includes SISO Members (Society of Independent Show Organizers) and
the scope of the Research has since been broadened to include members of AFIDA (Asociación Internacional de Ferias
de América), AMPROFEC (Asociación Mexicana de Profesionales de Ferias y Exposiciones y Convenciones) and
UBRAFE (União Brasileira dos Promotores Feiras) in Central and South America and of EXSA (Exhibition and Events
Association of Southern Africa) in South Africa. In this 17th edition, Members from AEO (Association of Event
Organisers, UK) and TEA (Thai Exhibition Association) have been included for the first time.
Important remarks
It should be noted that the number of replies to the current survey (262 from 56 countries - see full list on the page 31)
provides representative results. However, the consolidated regional results may not reflect the situation of specific
countries in that region. This is why the report also includes a set of detailed results for the 16 countries or zones where
a significant number of answers were obtained are included (see list on the page 17).
Also it should be noted that the answers to this survey were provided before the recent events in the UK (EU
referendum) and Turkey (terrorist attacks).
Questions related to this survey can be addressed to Christian Druart, UFI Research Manager, at [email protected].
Introduction
3
The 17th Barometer surveyed the evolution of participants’ gross turnover expectations for the two halves of 2016 and
the first half of 2017 compared to their turnover during the same period in the previous year (regardless of possible
biennial effects).
The chart on the next page presents the percentage of companies declaring an increase in their turnover. It combines
these results with those of previous surveys since 2008. It does not take into account the “unknown” or “not applicable”
answers – see footnote.
Survey results indicate a variety of current regional developments around the globe:
• In North America, 7 to 9 companies out of 10 expect increase in turnover for all three periods;
• In Europe, this is also the case for the UK. In Italy and Turkey this situation is only reached with time. In Germany,
less than 1 company out of 2 anticipates a growth for the first half of 2017. In Russia ,(only 1 company out of 2 on
average expects increase in turnover for all three periods;
• In Asia/Pacific, 2 to 3 companies out of 10 have uncertainty as to their turnover for the first half of 2017, whereas for
2016, 5 to 6 companies out of 10 in China and most other Asian countries expect an increase. In Thailand however,
the situation is more contrasted;
• In the Middle East and Africa, 3 to 4 companies out of 10 have uncertainty as to their turnover for the first half of
2017, whereas for 2016, 7 to 8 companies out of 10 in Iran and 4 to 5 in other countries expect an increase;
• In Central and South America, a majority of companies anticipate decreases in 2016, but they are more confident
for the first half of 2017;
Footnote: The charts included in the second part of this report (“Detailed results for selected countries or zones”) detail these
results, adding the percentage of companies declaring decreases in their turnover and the percentage of “unknown”
answers.
1. Gross Turnover development
4

% of companies declaring an increase in turnover when
compared to their projections for the same period
the year before (regardless of possible biennial effects)
As declared in previous surveys As declared
in June 2016
Americas
Asia &
Pacific
Europe
5
Middle East
& Africa
0%
10%
20%
30%
40%
50%
60%
70%
80%
90%
100%
H22008
H12009
H22009
H12010
H22010
H12011
H22011
H12012
H22012
H12013
H22013
H12014
H22014
H12015
H22015
H12016
H22016
H12017
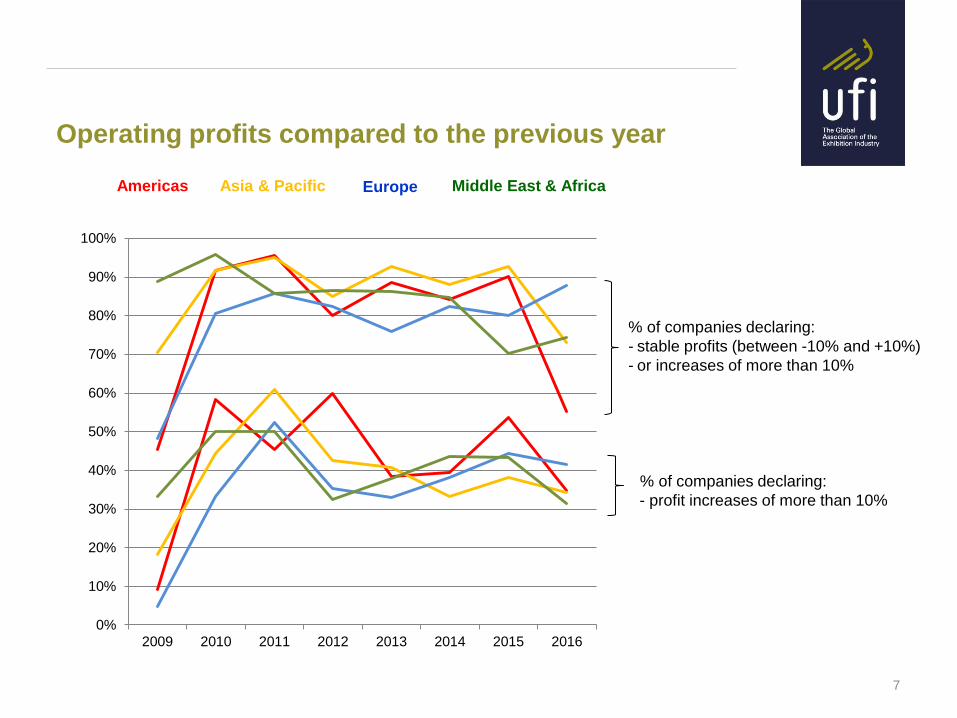
The 17th Global Barometer survey questioned the evolution of operating profits for 2015 and 2016 compared to the
previous year.
The chart presented on the following page combines these results with those of previous surveys which track the
development of operating profits since 2009. It highlights the results of companies declaring an increase of more than
10% and those declaring a more stable result (between -10% and +10%) – see footnote.
The detailed results show that:
• More than 1 company out of 2 declare an increase of more than 10% in annual profits for 2015 and 2016 in Mexico,
USA, the UK and most countries in Central and South America (but not in Brazil, see below);
• 3 to 5 companies out of 10 declare an increase of more than 10% in annual profits for 2015 and 2016 in most
countries in Asia (except China, where only 2 to 3 do), the Middle East or Europe (but not in Russia and Turkey, see
below);
• In Brazil, Russia and Turkey the levels of companies declaring an increase of more than 10% decrease sharply
between 2015 and 2016.
Footnote: The charts included in the second part of this report (“Detailed results for selected countries or zones”) detail these
results, adding the percentage of companies with reductions in profits or losses.
2. Development of Operating Profits
6
Operating profits compared to the previous year
Americas Europe Asia & Pacific Middle East & Africa
% of companies declaring:
- stable profits (between -10% and +10%)
- or increases of more than 10%
% of companies declaring:
- profit increases of more than 10%
7
0%
10%
20%
30%
40%
50%
60%
70%
80%
90%
100%
2009 2010 2011 2012 2013 2014 2015 2016
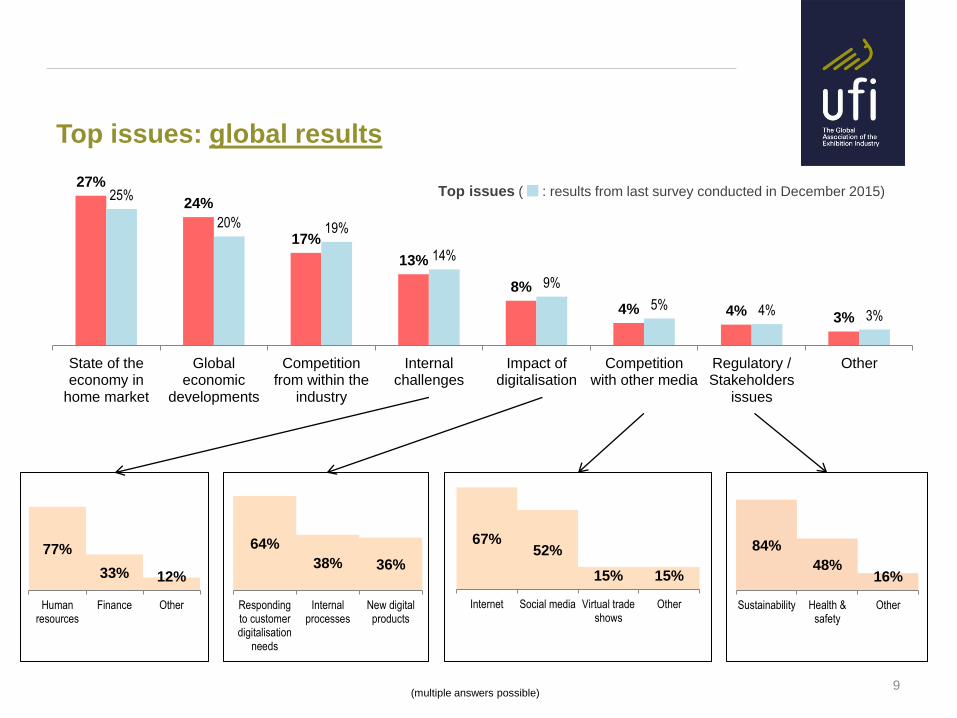
Companies were asked to identify the three most important issues for their business in the coming year from a pre-
defined list of seven issues. Multiples choices were proposed to get further insight for some answers.
As in previous surveys, around 80% of all answers relate to the following 4 issues:
• “State of the economy in home market” (27% in the current survey)
• “Global economic developments” (24% in the current survey)
• “Competition from within the industry” (17% in the current survey)
• “Internal challenges” (13% in the current survey), where “Human resources” are named as the most important
aspect.
“Impact of digitalisation” (“Responding to customer digitalization needs”, “New digital products” or “Internal
processes”), “Competition with other media” (“Internet”, “Social media”, “Virtual trade shows” or “Other”) and
“Regulatory / Stakeholders issues” (“Sustainability”, “Health & safety” or “Other) appear as less important issues in the
coming year.
The next slide shows the consolidated global results, including further insights, where asked.
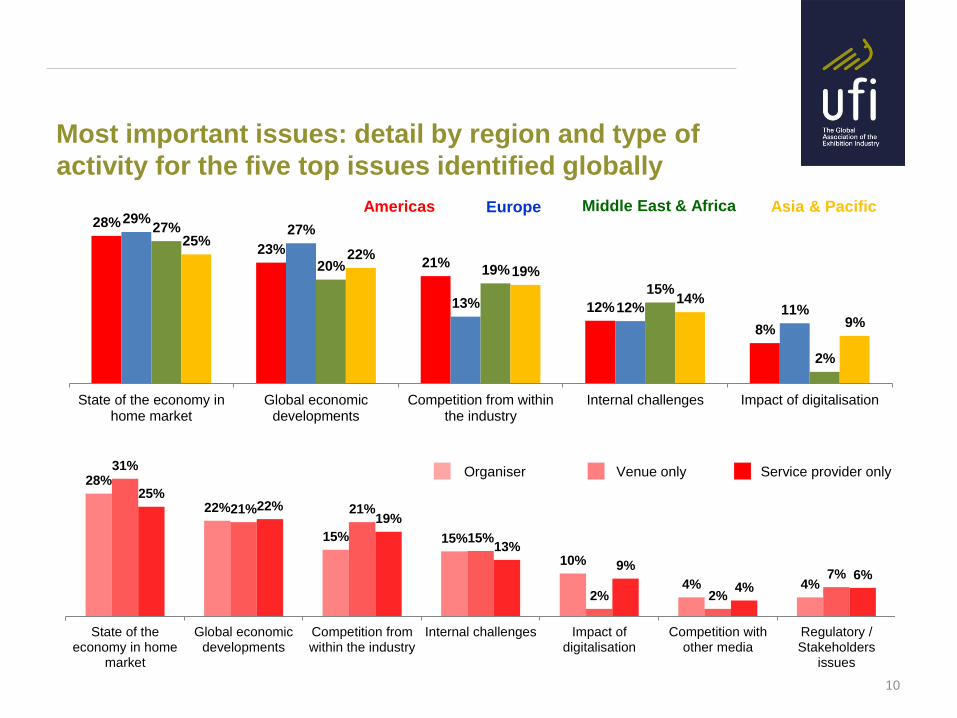
The following pages details those results by region and by type of activity (for 3 main segments: “Organiser”, “Venue
only” and “Service provider only”). Results show that there are no significant differences based on these criteria,
except for the “Impact of digitalisation” which is not so present, generally speaking, in Middle East and Africa and also
among “Venues only”, but receives vey high relevance in Germany (19%).
3. Most important business issues
8
Top issues: global results
9 (multiple answers possible)
77%
33% 12%
Humanresources
Finance Other
64%
38% 36%
Respondingto customerdigitalisation
needs
Internalprocesses
New digitalproducts
67% 52%
15% 15%
Internet Social media Virtual tradeshows
Other
84%
48% 16%
Sustainability Health &safety
Other
27%
24%
17%
13%
8%
4% 4% 3%
25%
20% 19%
14%
9%
5% 4% 3%
State of theeconomy in
home market
Globaleconomic
developments
Competitionfrom within the
industry
Internalchallenges
Impact ofdigitalisation
Competitionwith other media
Regulatory /Stakeholders
issues
Other
Top issues ( : results from last survey conducted in December 2015)
Most important issues: detail by region and type of
activity for the five top issues identified globally
10
Organiser
Americas Europe Asia & Pacific Middle East & Africa
Venue only Service provider only 28%
22%
15% 15%
10%
4% 4%
31%
21% 21%
15%
2% 2%
7%
25% 22%
19%
13%
9%
4% 6%
State of theeconomy in home
market
Global economicdevelopments
Competition fromwithin the industry
Internal challenges Impact ofdigitalisation
Competition withother media
Regulatory /Stakeholders
issues
28%
23% 21%
12%
8%
29% 27%
13% 12% 11%
27%
20% 19%
15%
2%
25% 22%
19%
14%
9%
State of the economy inhome market
Global economicdevelopments
Competition from withinthe industry
Internal challenges Impact of digitalisation
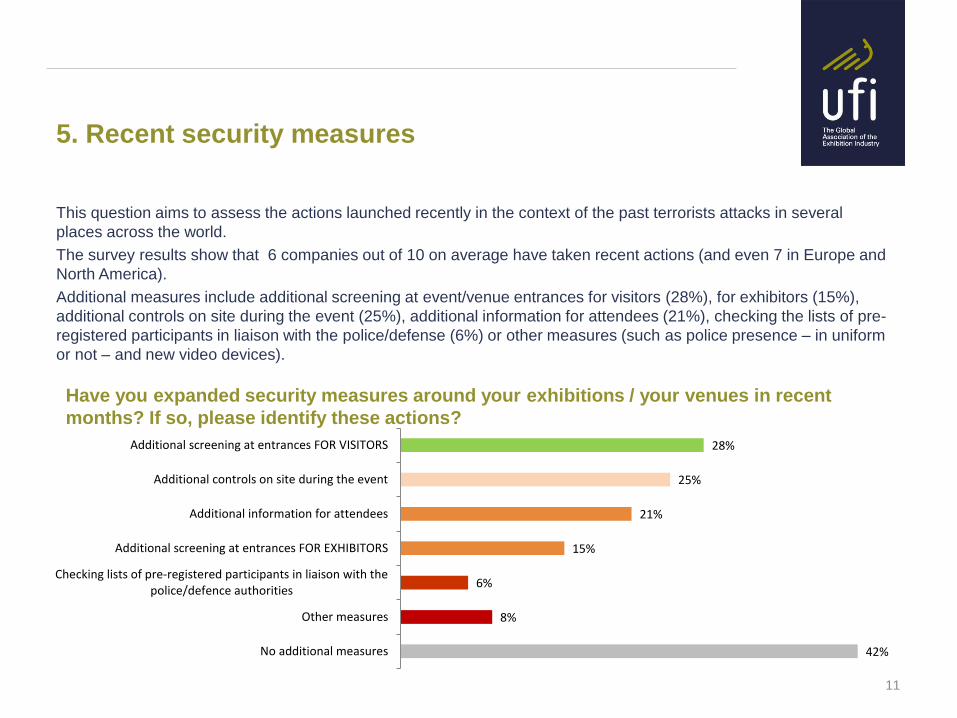
This question aims to assess the actions launched recently in the context of the past terrorists attacks in several
places across the world.
The survey results show that 6 companies out of 10 on average have taken recent actions (and even 7 in Europe and
North America).
Additional measures include additional screening at event/venue entrances for visitors (28%), for exhibitors (15%),
additional controls on site during the event (25%), additional information for attendees (21%), checking the lists of pre-
registered participants in liaison with the police/defense (6%) or other measures (such as police presence – in uniform
or not – and new video devices).
5. Recent security measures
11
Have you expanded security measures around your exhibitions / your venues in recent
months? If so, please identify these actions?
28%
25%
21%
15%
6%
8%
42%
Additional screening at entrances FOR VISITORS
Additional controls on site during the event
Additional information for attendees
Additional screening at entrances FOR EXHIBITORS
Checking lists of pre-registered participants in liaison with thepolice/defence authorities
Other measures
No additional measures
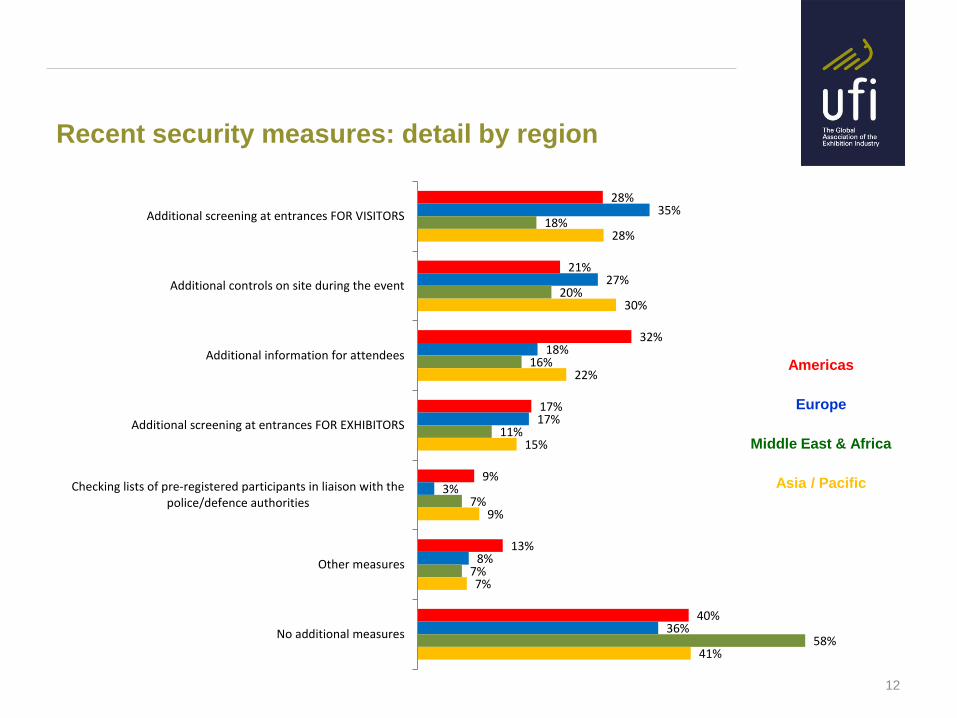
Recent security measures: detail by region
12
Americas
Asia / Pacific
Europe
Middle East & Africa
28%
21%
32%
17%
9%
13%
40%
35%
27%
18%
17%
3%
8%
36%
18%
20%
16%
11%
7%
7%
58%
28%
30%
22%
15%
9%
7%
41%
Additional screening at entrances FOR VISITORS
Additional controls on site during the event
Additional information for attendees
Additional screening at entrances FOR EXHIBITORS
Checking lists of pre-registered participants in liaison with thepolice/defence authorities
Other measures
No additional measures

North America: Mexico
US
Central and South America: Brazil
Other countries in Central & South America
Europe: Germany
Italy
Russia
Turkey
United Kingdom
Other countries in Europe
Africa: South Africa
Middle East: Iran
Other countries in the Middle East
Asia/Pacific: China
Thailand
Other countries in Asia/Pacific
13
Part 2: Detailed results for 12 selected countries or zones
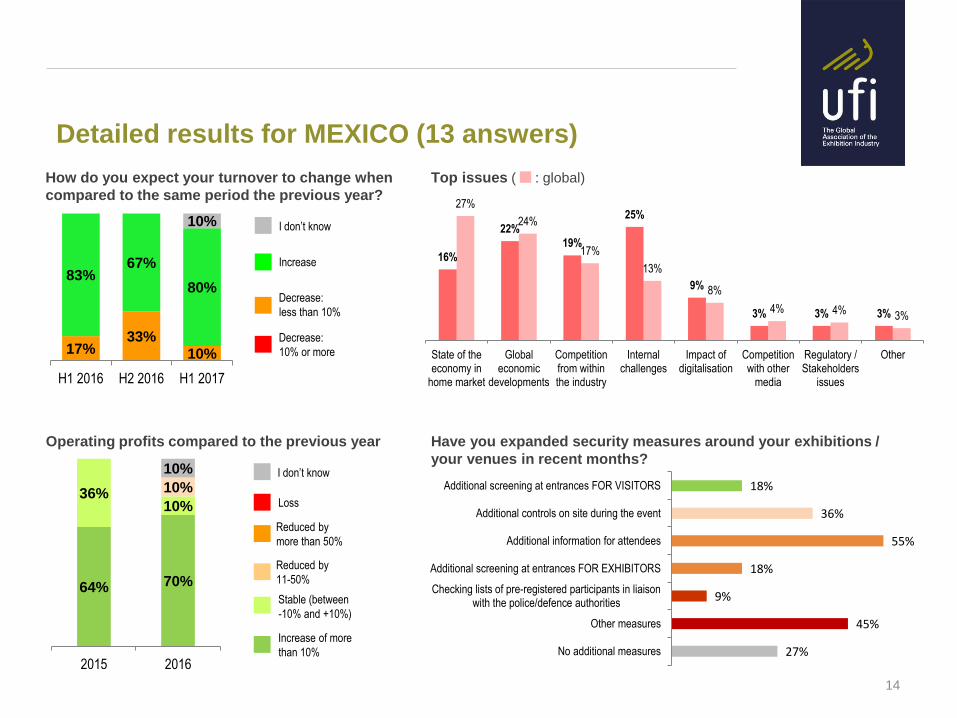
Detailed results for MEXICO (13 answers)
14
Decrease:
10% or more
Increase
Decrease:
less than 10%
I don’t know
How do you expect your turnover to change when
compared to the same period the previous year?
Operating profits compared to the previous year
Top issues ( : global)
Have you expanded security measures around your exhibitions /
your venues in recent months?
17% 33%
10%
83% 67%
80%
10%
H1 2016 H2 2016 H1 2017
64% 70%
36% 10%
10%
10%
2015 2016
Loss
Increase of more
than 10%
Reduced by
11-50%
Stable (between
-10% and +10%)
Reduced by
more than 50%
I don’t know 18%
36%
55%
18%
9%
45%
27%
Additional screening at entrances FOR VISITORS
Additional controls on site during the event
Additional information for attendees
Additional screening at entrances FOR EXHIBITORS
Checking lists of pre-registered participants in liaisonwith the police/defence authorities
Other measures
No additional measures
16%
22%
19%
25%
9%
3% 3% 3%
27%
24%
17%
13%
8%
4% 4% 3%
State of theeconomy in
home market
Globaleconomic
developments
Competitionfrom withinthe industry
Internalchallenges
Impact ofdigitalisation
Competitionwith other
media
Regulatory /Stakeholders
issues
Other
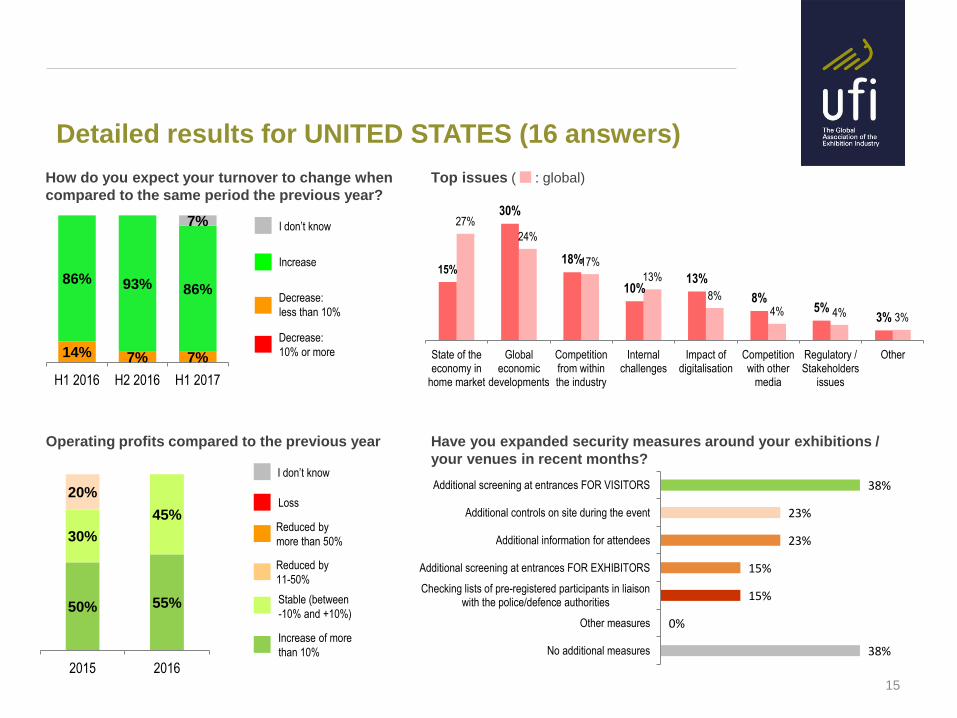
Detailed results for UNITED STATES (16 answers)
Decrease:
10% or more
Increase
Decrease:
less than 10%
I don’t know
How do you expect your turnover to change when
compared to the same period the previous year?
Loss
Increase of more
than 10%
Reduced by
11-50%
Operating profits compared to the previous year
Stable (between
-10% and +10%)
Reduced by
more than 50%
15
Have you expanded security measures around your exhibitions /
your venues in recent months?
14% 7% 7%
86% 93% 86%
7%
H1 2016 H2 2016 H1 2017
50% 55%
30%
45%
20%
2015 2016
I don’t know 38%
23%
23%
15%
15%
0%
38%
Additional screening at entrances FOR VISITORS
Additional controls on site during the event
Additional information for attendees
Additional screening at entrances FOR EXHIBITORS
Checking lists of pre-registered participants in liaisonwith the police/defence authorities
Other measures
No additional measures
15%
30%
18%
10% 13%
8% 5%
3%
27%
24%
17%
13%
8%
4% 4% 3%
State of theeconomy in
home market
Globaleconomic
developments
Competitionfrom withinthe industry
Internalchallenges
Impact ofdigitalisation
Competitionwith other
media
Regulatory /Stakeholders
issues
Other
Top issues ( : global)
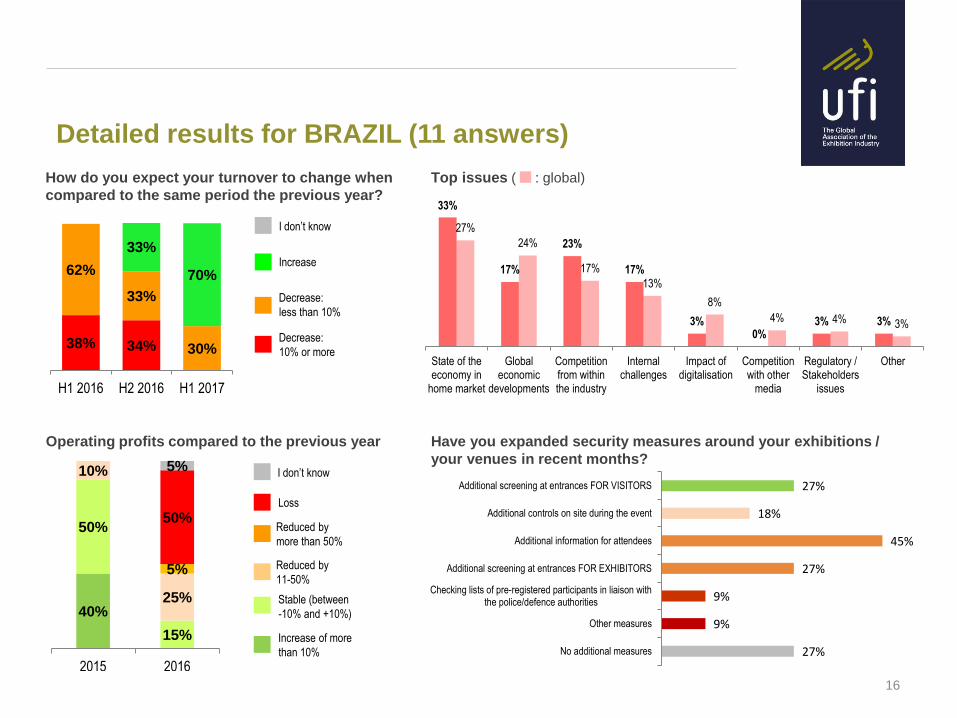
Detailed results for BRAZIL (11 answers)
16
Decrease:
10% or more
Increase
Decrease:
less than 10%
I don’t know
How do you expect your turnover to change when
compared to the same period the previous year?
Operating profits compared to the previous year Have you expanded security measures around your exhibitions /
your venues in recent months?
38% 34%
62%
33%
30%
33%
70%
H1 2016 H2 2016 H1 2017
40%
50%
15%
10%
25%
5%
50%
5%
2015 2016
Loss
Increase of more
than 10%
Reduced by
11-50%
Stable (between
-10% and +10%)
Reduced by
more than 50%
I don’t know 27%
18%
45%
27%
9%
9%
27%
Additional screening at entrances FOR VISITORS
Additional controls on site during the event
Additional information for attendees
Additional screening at entrances FOR EXHIBITORS
Checking lists of pre-registered participants in liaison withthe police/defence authorities
Other measures
No additional measures
33%
17%
23%
17%
3% 0%
3% 3%
27%
24%
17%
13%
8%
4% 4% 3%
State of theeconomy in
home market
Globaleconomic
developments
Competitionfrom withinthe industry
Internalchallenges
Impact ofdigitalisation
Competitionwith other
media
Regulatory /Stakeholders
issues
Other
Top issues ( : global)
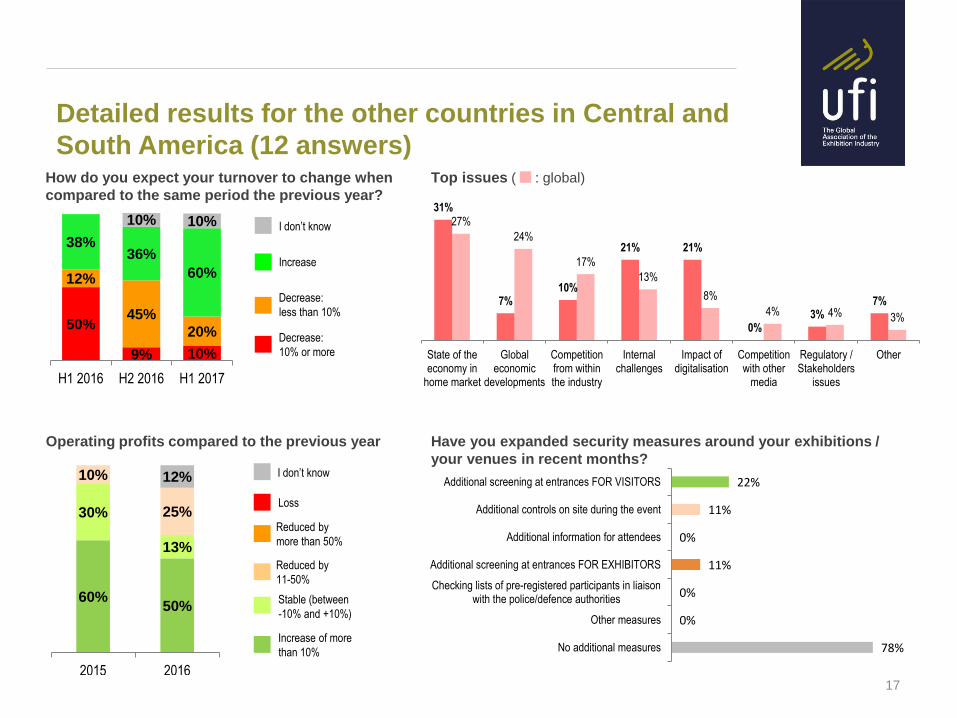
Detailed results for the other countries in Central and
South America (12 answers)
17
Decrease:
10% or more
Increase
Decrease:
less than 10%
I don’t know
How do you expect your turnover to change when
compared to the same period the previous year?
Operating profits compared to the previous year Have you expanded security measures around your exhibitions /
your venues in recent months?
50%
9% 10%
12%
45%
20%
38% 36%
60%
10% 10%
H1 2016 H2 2016 H1 2017
60% 50%
30%
13%
10%
25%
12%
2015 2016
Loss
Increase of more
than 10%
Reduced by
11-50%
Stable (between
-10% and +10%)
Reduced by
more than 50%
I don’t know 22%
11%
0%
11%
0%
0%
78%
Additional screening at entrances FOR VISITORS
Additional controls on site during the event
Additional information for attendees
Additional screening at entrances FOR EXHIBITORS
Checking lists of pre-registered participants in liaisonwith the police/defence authorities
Other measures
No additional measures
31%
7% 10%
21% 21%
0% 3%
7%
27%
24%
17%
13%
8%
4% 4% 3%
State of theeconomy in
home market
Globaleconomic
developments
Competitionfrom withinthe industry
Internalchallenges
Impact ofdigitalisation
Competitionwith other
media
Regulatory /Stakeholders
issues
Other
Top issues ( : global)

Detailed results for GERMANY (17 answers)
18
Decrease:
10% or more
Increase
Decrease:
less than 10%
I don’t know
How do you expect your turnover to change when
compared to the same period the previous year?
Operating profits compared to the previous year Have you expanded security measures around your exhibitions /
your venues in recent months?
6% 29% 13%
14%
81%
93%
43%
7% 14%
H1 2016 H2 2016 H1 2017
40% 58%
27%
34% 27%
8% 6%
2015 2016
Loss
Increase of more
than 10%
Reduced by
11-50%
Stable (between
-10% and +10%)
Reduced by
more than 50%
I don’t know 33%
8%
17%
0%
0%
25%
33%
Additional screening at entrances FOR VISITORS
Additional controls on site during the event
Additional information for attendees
Additional screening at entrances FOR EXHIBITORS
Checking lists of pre-registered participants in liaisonwith the police/defence authorities
Other measures
No additional measures
21%
26%
13%
9%
19%
9%
4%
0%
27%
24%
17%
13%
8%
4% 4% 3%
State of theeconomy in
home market
Globaleconomic
developments
Competitionfrom withinthe industry
Internalchallenges
Impact ofdigitalisation
Competitionwith other
media
Regulatory /Stakeholders
issues
Other
Top issues ( : global)
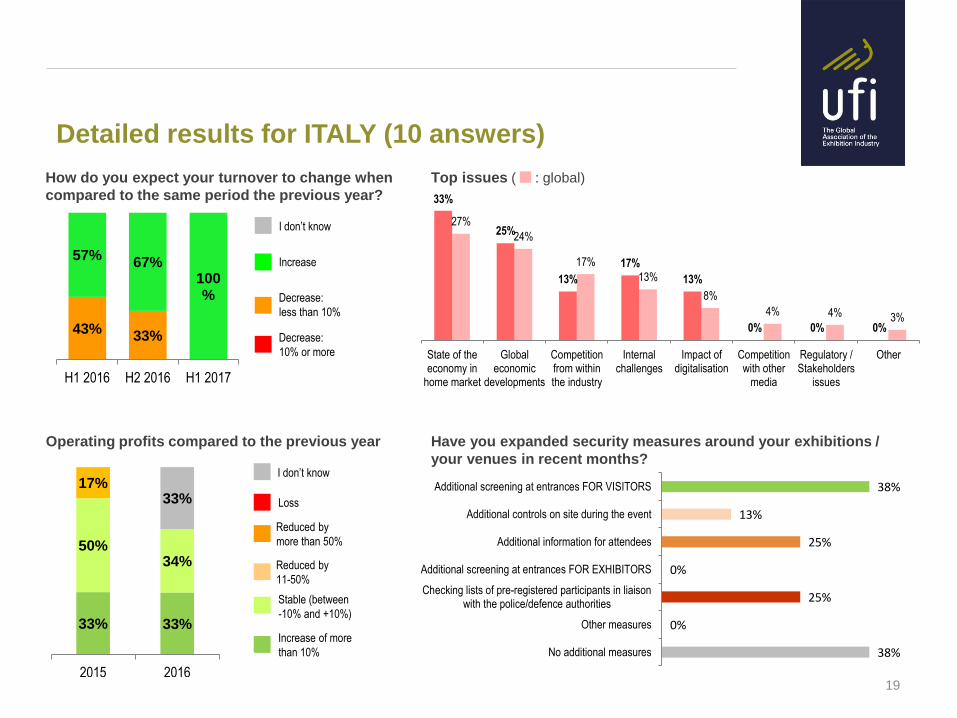
Detailed results for ITALY (10 answers)
19
Decrease:
10% or more
Increase
Decrease:
less than 10%
I don’t know
How do you expect your turnover to change when
compared to the same period the previous year?
Operating profits compared to the previous year Have you expanded security measures around your exhibitions /
your venues in recent months?
43% 33%
57% 67%
100%
H1 2016 H2 2016 H1 2017
33% 33%
50% 34%
17% 33%
2015 2016
Loss
Increase of more
than 10%
Reduced by
11-50%
Stable (between
-10% and +10%)
Reduced by
more than 50%
I don’t know
38%
13%
25%
0%
25%
0%
38%
Additional screening at entrances FOR VISITORS
Additional controls on site during the event
Additional information for attendees
Additional screening at entrances FOR EXHIBITORS
Checking lists of pre-registered participants in liaisonwith the police/defence authorities
Other measures
No additional measures
33%
25%
13%
17%
13%
0% 0% 0%
27%
24%
17%
13%
8%
4% 4% 3%
State of theeconomy in
home market
Globaleconomic
developments
Competitionfrom withinthe industry
Internalchallenges
Impact ofdigitalisation
Competitionwith other
media
Regulatory /Stakeholders
issues
Other
Top issues ( : global)
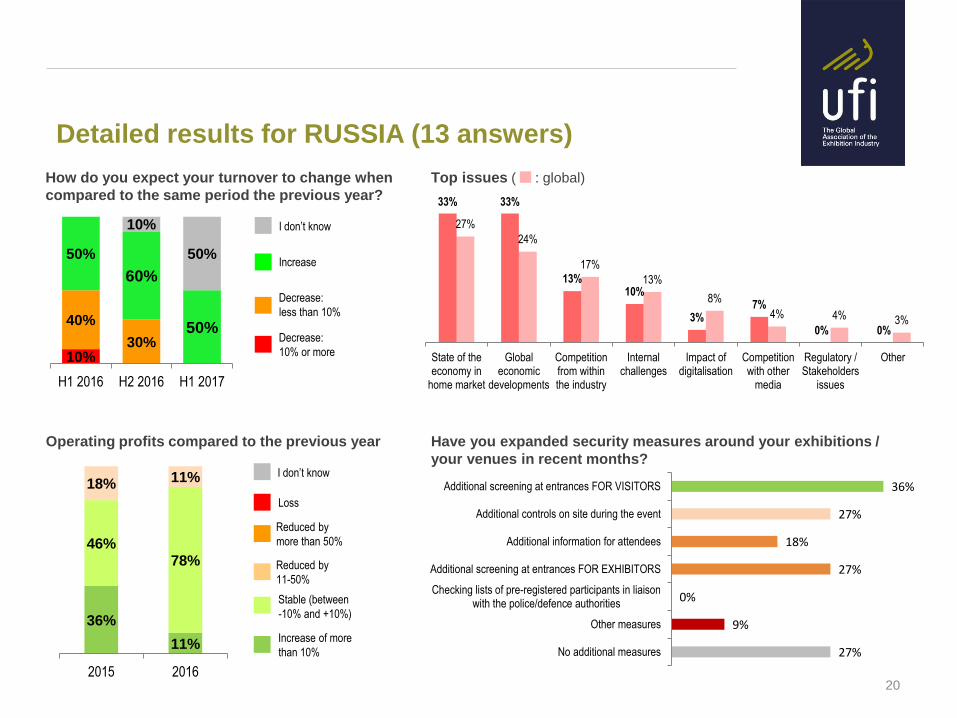
Detailed results for RUSSIA (13 answers)
20
Decrease:
10% or more
Increase
Decrease:
less than 10%
I don’t know
How do you expect your turnover to change when
compared to the same period the previous year?
Operating profits compared to the previous year Have you expanded security measures around your exhibitions /
your venues in recent months?
10%
40%
30%
50%
60%
50%
10%
50%
H1 2016 H2 2016 H1 2017
36%
11%
46% 78%
18% 11%
2015 2016
Loss
Increase of more
than 10%
Reduced by
11-50%
Stable (between
-10% and +10%)
Reduced by
more than 50%
I don’t know
36%
27%
18%
27%
0%
9%
27%
Additional screening at entrances FOR VISITORS
Additional controls on site during the event
Additional information for attendees
Additional screening at entrances FOR EXHIBITORS
Checking lists of pre-registered participants in liaisonwith the police/defence authorities
Other measures
No additional measures
33% 33%
13% 10%
3% 7%
0% 0%
27%
24%
17%
13%
8%
4% 4% 3%
State of theeconomy in
home market
Globaleconomic
developments
Competitionfrom withinthe industry
Internalchallenges
Impact ofdigitalisation
Competitionwith other
media
Regulatory /Stakeholders
issues
Other
Top issues ( : global)
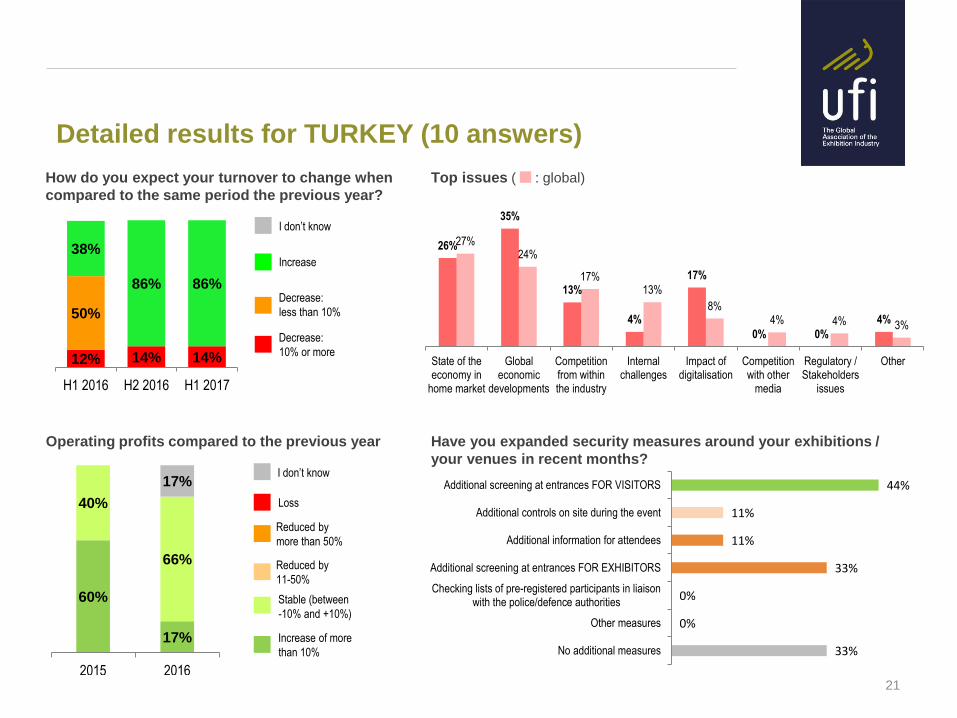
Detailed results for TURKEY (10 answers)
21
Decrease:
10% or more
Increase
Decrease:
less than 10%
I don’t know
How do you expect your turnover to change when
compared to the same period the previous year?
Operating profits compared to the previous year Have you expanded security measures around your exhibitions /
your venues in recent months?
12% 14% 14%
50%
38%
86% 86%
H1 2016 H2 2016 H1 2017
60%
17%
40%
66%
17%
2015 2016
Loss
Increase of more
than 10%
Reduced by
11-50%
Stable (between
-10% and +10%)
Reduced by
more than 50%
I don’t know 44%
11%
11%
33%
0%
0%
33%
Additional screening at entrances FOR VISITORS
Additional controls on site during the event
Additional information for attendees
Additional screening at entrances FOR EXHIBITORS
Checking lists of pre-registered participants in liaisonwith the police/defence authorities
Other measures
No additional measures
26%
35%
13%
4%
17%
0% 0%
4%
27% 24%
17% 13%
8% 4% 4% 3%
State of theeconomy in
home market
Globaleconomic
developments
Competitionfrom withinthe industry
Internalchallenges
Impact ofdigitalisation
Competitionwith other
media
Regulatory /Stakeholders
issues
Other
Top issues ( : global)
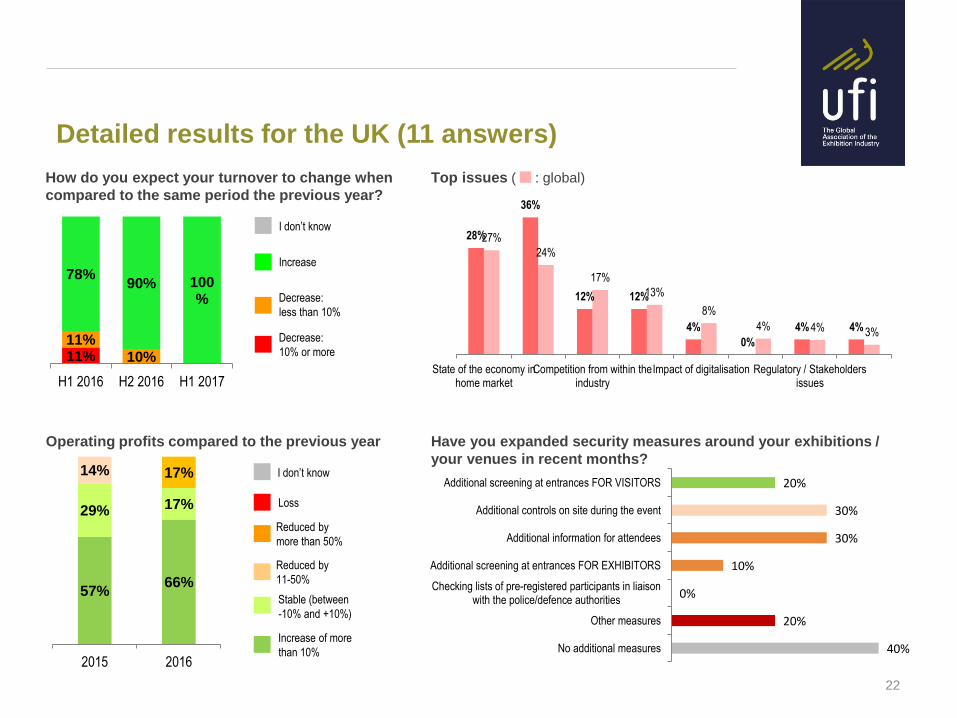
Detailed results for the UK (11 answers)
22
Decrease:
10% or more
Increase
Decrease:
less than 10%
I don’t know
How do you expect your turnover to change when
compared to the same period the previous year?
Operating profits compared to the previous year Have you expanded security measures around your exhibitions /
your venues in recent months?
11% 11%
10%
78% 90% 100
%
H1 2016 H2 2016 H1 2017
57% 66%
29% 17%
14% 17%
2015 2016
Loss
Increase of more
than 10%
Reduced by
11-50%
Stable (between
-10% and +10%)
Reduced by
more than 50%
I don’t know 20%
30%
30%
10%
0%
20%
40%
Additional screening at entrances FOR VISITORS
Additional controls on site during the event
Additional information for attendees
Additional screening at entrances FOR EXHIBITORS
Checking lists of pre-registered participants in liaisonwith the police/defence authorities
Other measures
No additional measures
28%
36%
12% 12%
4%
0%
4% 4%
27%
24%
17%
13%
8%
4% 4% 3%
State of the economy inhome market
Competition from within theindustry
Impact of digitalisation Regulatory / Stakeholdersissues
Top issues ( : global)
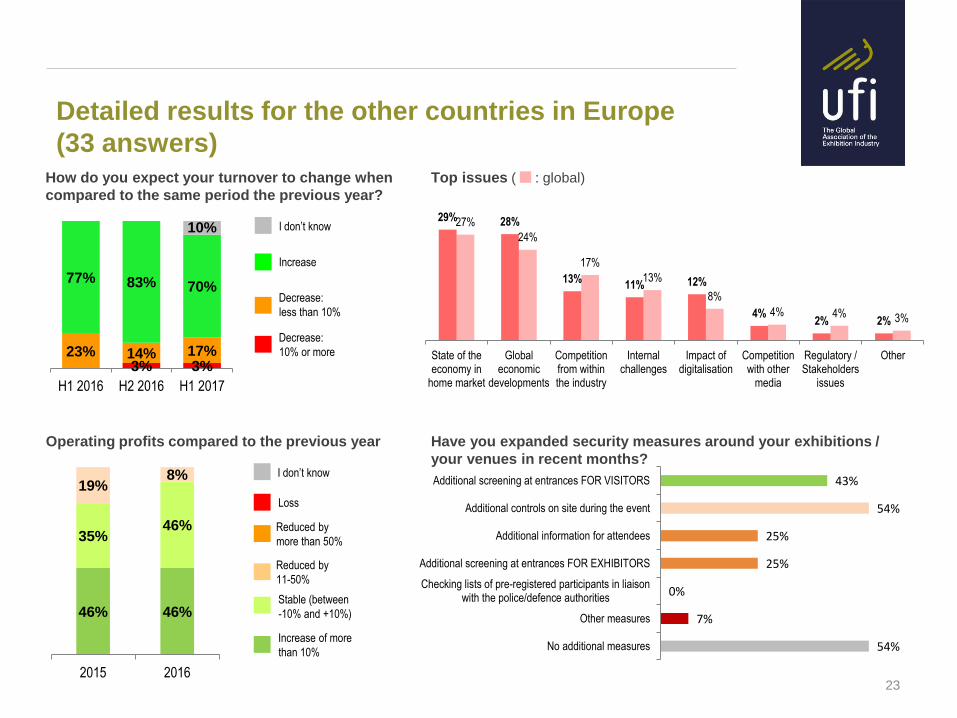
Detailed results for the other countries in Europe
(33 answers)
23
Decrease:
10% or more
Increase
Decrease:
less than 10%
I don’t know
How do you expect your turnover to change when
compared to the same period the previous year?
Operating profits compared to the previous year Have you expanded security measures around your exhibitions /
your venues in recent months?
3% 3% 23% 14% 17%
77% 83% 70%
10%
H1 2016 H2 2016 H1 2017
46% 46%
35% 46%
19% 8%
2015 2016
Loss
Increase of more
than 10%
Reduced by
11-50%
Stable (between
-10% and +10%)
Reduced by
more than 50%
I don’t know 43%
54%
25%
25%
0%
7%
54%
Additional screening at entrances FOR VISITORS
Additional controls on site during the event
Additional information for attendees
Additional screening at entrances FOR EXHIBITORS
Checking lists of pre-registered participants in liaisonwith the police/defence authorities
Other measures
No additional measures
29% 28%
13% 11% 12%
4% 2% 2%
27%
24%
17%
13%
8%
4% 4% 3%
State of theeconomy in
home market
Globaleconomic
developments
Competitionfrom withinthe industry
Internalchallenges
Impact ofdigitalisation
Competitionwith other
media
Regulatory /Stakeholders
issues
Other
Top issues ( : global)
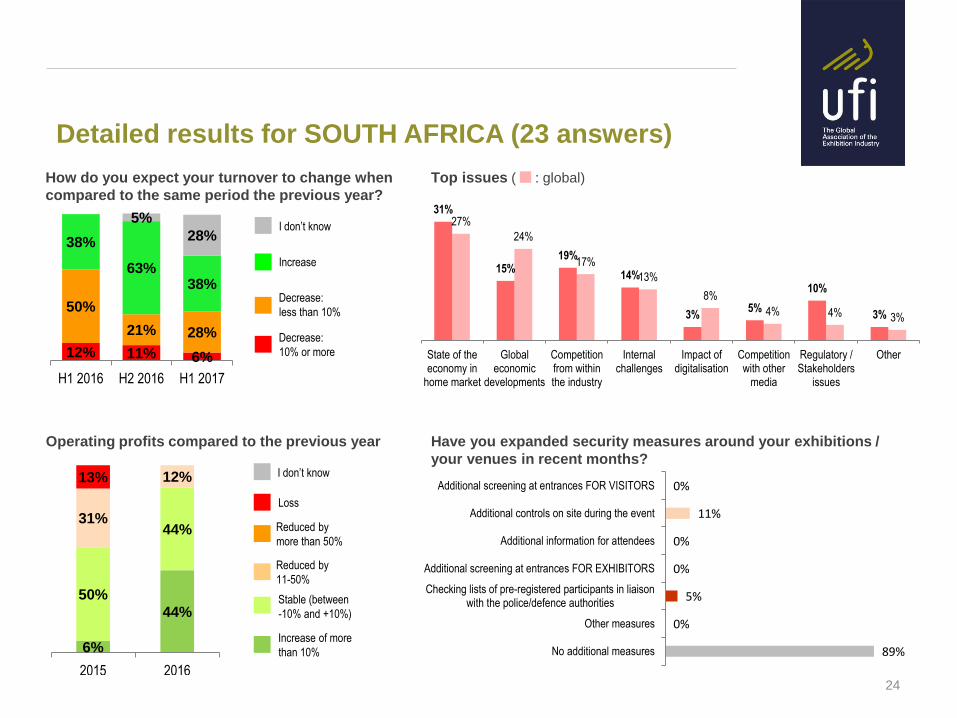
Detailed results for SOUTH AFRICA (23 answers)
24
Decrease:
10% or more
Increase
Decrease:
less than 10%
I don’t know
How do you expect your turnover to change when
compared to the same period the previous year?
Operating profits compared to the previous year Have you expanded security measures around your exhibitions /
your venues in recent months?
12% 11% 6%
50%
21% 28%
38%
63% 38%
5%
28%
H1 2016 H2 2016 H1 2017
6%
44%
50%
44% 31%
12% 13%
2015 2016
Loss
Increase of more
than 10%
Reduced by
11-50%
Stable (between
-10% and +10%)
Reduced by
more than 50%
I don’t know 0%
11%
0%
0%
5%
0%
89%
Additional screening at entrances FOR VISITORS
Additional controls on site during the event
Additional information for attendees
Additional screening at entrances FOR EXHIBITORS
Checking lists of pre-registered participants in liaisonwith the police/defence authorities
Other measures
No additional measures
31%
15% 19%
14%
3% 5%
10%
3%
27%
24%
17%
13%
8%
4% 4% 3%
State of theeconomy in
home market
Globaleconomic
developments
Competitionfrom withinthe industry
Internalchallenges
Impact ofdigitalisation
Competitionwith other
media
Regulatory /Stakeholders
issues
Other
Top issues ( : global)
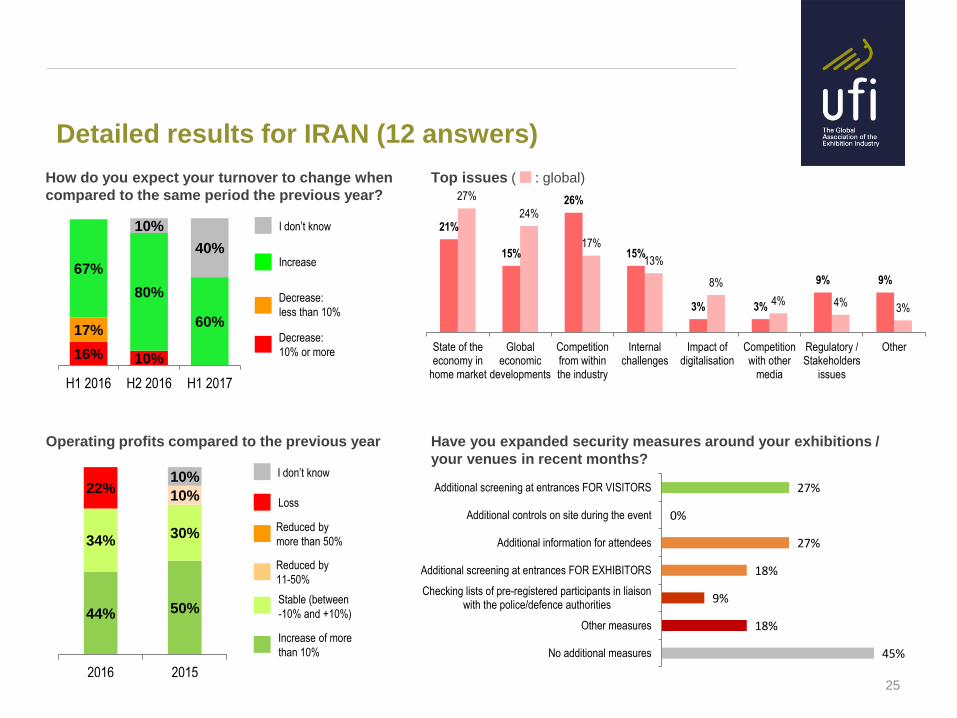
Detailed results for IRAN (12 answers)
25
Decrease:
10% or more
Increase
Decrease:
less than 10%
I don’t know
How do you expect your turnover to change when
compared to the same period the previous year?
Operating profits compared to the previous year Have you expanded security measures around your exhibitions /
your venues in recent months?
16% 10%
17%
67%
80%
60%
10%
40%
H1 2016 H2 2016 H1 2017
44% 50%
34% 30%
10% 22%
10%
2016 2015
Loss
Increase of more
than 10%
Reduced by
11-50%
Stable (between
-10% and +10%)
Reduced by
more than 50%
I don’t know
27%
0%
27%
18%
9%
18%
45%
Additional screening at entrances FOR VISITORS
Additional controls on site during the event
Additional information for attendees
Additional screening at entrances FOR EXHIBITORS
Checking lists of pre-registered participants in liaisonwith the police/defence authorities
Other measures
No additional measures
21%
15%
26%
15%
3% 3%
9% 9%
27%
24%
17%
13%
8%
4% 4% 3%
State of theeconomy in
home market
Globaleconomic
developments
Competitionfrom withinthe industry
Internalchallenges
Impact ofdigitalisation
Competitionwith other
media
Regulatory /Stakeholders
issues
Other
Top issues ( : global)

Detailed results for other countries in the MIDDLE EAST
(12 answers)
26
Decrease:
10% or more
Increase
Decrease:
less than 10%
I don’t know
How do you expect your turnover to change when
compared to the same period the previous year?
Operating profits compared to the previous year Have you expanded security measures around your exhibitions /
your venues in recent months?
38% 29% 12%
12% 30%
13%
50% 29%
50%
14% 25%
H1 2016 H2 2016 H1 2017
38% 29%
38%
12%
43%
12% 28%
2016 2015
Loss
Increase of more
than 10%
Reduced by
11-50%
Stable (between
-10% and +10%)
Reduced by
more than 50%
I don’t know 27%
55%
36%
27%
0%
9%
18%
Additional screening at entrances FOR VISITORS
Additional controls on site during the event
Additional information for attendees
Additional screening at entrances FOR EXHIBITORS
Checking lists of pre-registered participants in liaisonwith the police/defence authorities
Other measures
No additional measures
24% 22%
19% 18%
1% 3%
9%
4%
27%
24%
17%
13%
8%
4% 4% 3%
State of theeconomy in
home market
Globaleconomic
developments
Competitionfrom withinthe industry
Internalchallenges
Impact ofdigitalisation
Competitionwith other
media
Regulatory /Stakeholders
issues
Other
Top issues ( : global)

Detailed results for CHINA (23 answers)
27
Decrease:
10% or more
Increase
Decrease:
less than 10%
I don’t know
How do you expect your turnover to change when
compared to the same period the previous year?
Operating profits compared to the previous year Have you expanded security measures around your exhibitions /
your venues in recent months?
0% 15% 6%
40% 30%
24%
60% 50%
46%
5% 24%
H1 2016 H2 2016 H1 2017
19% 27%
69% 53%
6% 13%
6% 7%
2015 2016
Loss
Increase of more
than 10%
Reduced by
11-50%
Stable (between
-10% and +10%)
Reduced by
more than 50%
I don’t know
30%
30%
30%
25%
10%
5%
35%
Additional screening at entrances FOR VISITORS
Additional controls on site during the event
Additional information for attendees
Additional screening at entrances FOR EXHIBITORS
Checking lists of pre-registered participants in liaisonwith the police/defence authorities
Other measures
No additional measures
25%
22%
15% 13%
7% 9%
4% 5%
27%
24%
17%
13%
8%
4% 4% 3%
State of theeconomy in
home market
Globaleconomic
developments
Competitionfrom withinthe industry
Internalchallenges
Impact ofdigitalisation
Competitionwith other
media
Regulatory /Stakeholders
issues
Other
Top issues ( : global)
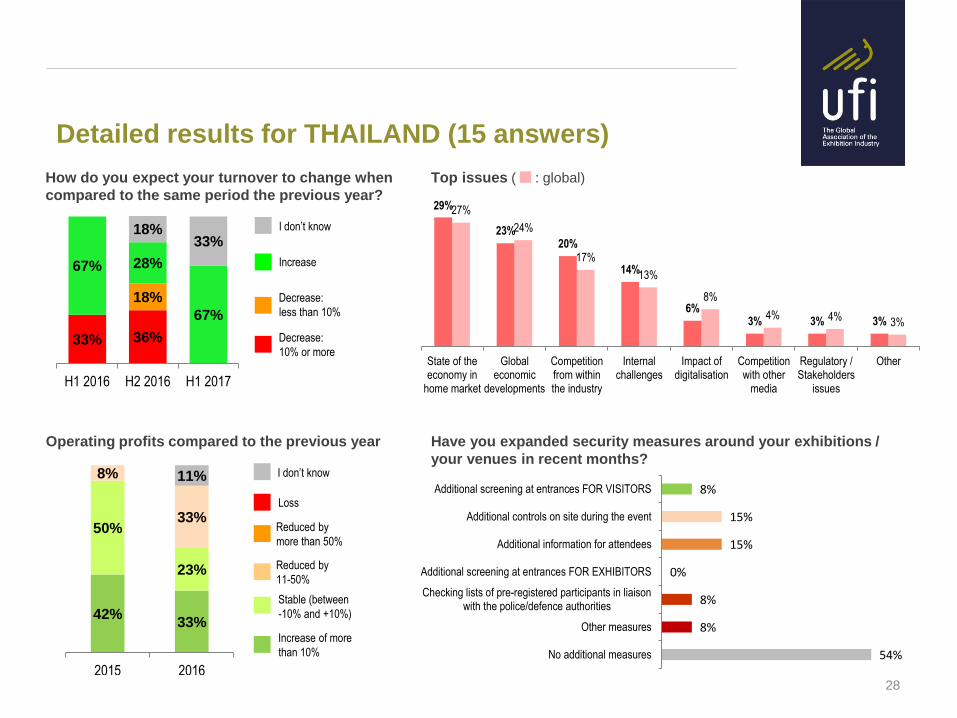
Detailed results for THAILAND (15 answers)
28
Decrease:
10% or more
Increase
Decrease:
less than 10%
I don’t know
How do you expect your turnover to change when
compared to the same period the previous year?
Operating profits compared to the previous year Have you expanded security measures around your exhibitions /
your venues in recent months?
33% 36%
18%
67% 28%
67%
18% 33%
H1 2016 H2 2016 H1 2017
42% 33%
50%
23%
8%
33%
11%
2015 2016
Loss
Increase of more
than 10%
Reduced by
11-50%
Stable (between
-10% and +10%)
Reduced by
more than 50%
I don’t know
8%
15%
15%
0%
8%
8%
54%
Additional screening at entrances FOR VISITORS
Additional controls on site during the event
Additional information for attendees
Additional screening at entrances FOR EXHIBITORS
Checking lists of pre-registered participants in liaisonwith the police/defence authorities
Other measures
No additional measures
29%
23% 20%
14%
6% 3% 3% 3%
27%
24%
17%
13%
8%
4% 4% 3%
State of theeconomy in
home market
Globaleconomic
developments
Competitionfrom withinthe industry
Internalchallenges
Impact ofdigitalisation
Competitionwith other
media
Regulatory /Stakeholders
issues
Other
Top issues ( : global)
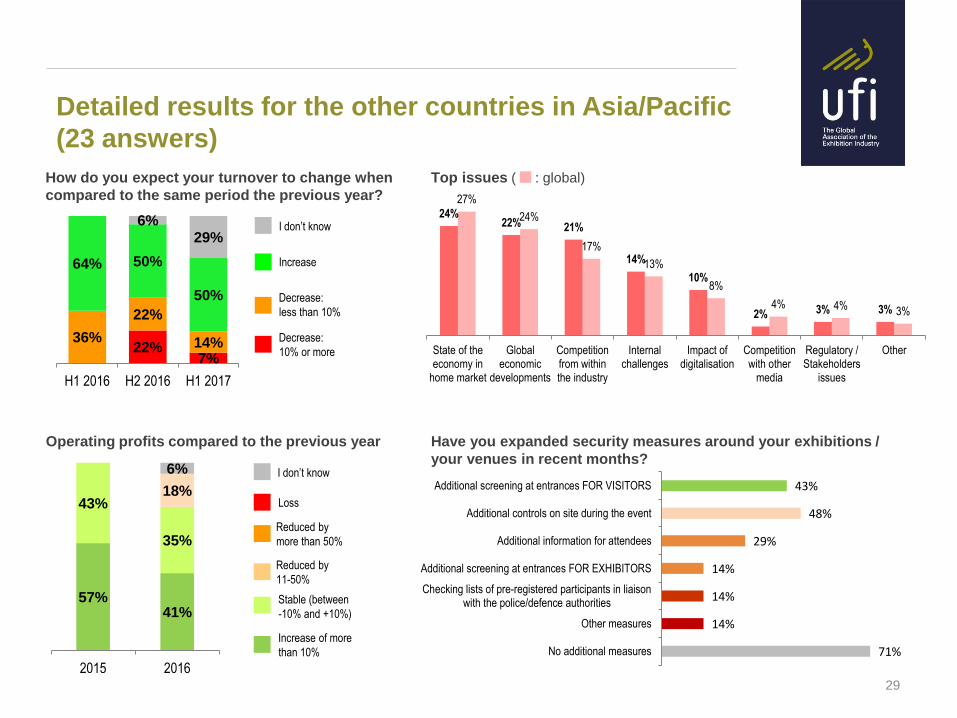
Detailed results for the other countries in Asia/Pacific
(23 answers)
29
Decrease:
10% or more
Increase
Decrease:
less than 10%
I don’t know
How do you expect your turnover to change when
compared to the same period the previous year?
Operating profits compared to the previous year Have you expanded security measures around your exhibitions /
your venues in recent months?
22% 7%
36%
22%
14%
64% 50%
50%
6% 29%
H1 2016 H2 2016 H1 2017
57% 41%
43%
35%
18%
6%
2015 2016
Loss
Increase of more
than 10%
Reduced by
11-50%
Stable (between
-10% and +10%)
Reduced by
more than 50%
I don’t know 43%
48%
29%
14%
14%
14%
71%
Additional screening at entrances FOR VISITORS
Additional controls on site during the event
Additional information for attendees
Additional screening at entrances FOR EXHIBITORS
Checking lists of pre-registered participants in liaisonwith the police/defence authorities
Other measures
No additional measures
24% 22% 21%
14%
10%
2% 3% 3%
27%
24%
17%
13%
8%
4% 4% 3%
State of theeconomy in
home market
Globaleconomic
developments
Competitionfrom withinthe industry
Internalchallenges
Impact ofdigitalisation
Competitionwith other
media
Regulatory /Stakeholders
issues
Other
Top issues ( : global)
The Global Barometer survey has been measuring the pulse of the exhibition industry since 2008. The 17th survey,
conducted in June 2016, was answered by 262 companies from 56 countries. The results are detailed for 16
geographical zones, including 12 major national markets. Survey results reveals a number of key regional trends for
the exhibition industry:
• In North America, the outlook is very positive: more than 8 companies out of 10 expect increase in turnover for 2016
and the first half of 2017 and more than 50% of those polled declare an increase of more than 10% in annual profits
for 2015 and 2016.
• In Europe, UK - at the time of the survey, before the EU referendum - was expecting to perform in a positive way
similar to North America, whereas good perspectives also appeared in several European markets. In Germany
however, less than 50% of the survey participants anticipate a growth for the first half of 2017 compared to a
cyclically strong 2016. In Turkey, the levels of companies declaring a profit increase of more than 10% decreases
sharply between 2015 and 2016. The situation in Russia remains flat.
• In Central and South America, a majority of companies anticipate turnover decreases in 2016, but are more
confident for the first half of 2017. Profits there are also expected to rise, with the notable exception of Brazil.
• In Asia as well as in the Middle East and Africa, 3 to 5 companies out of 10 declare an increase of more than 10% in
annual profits for 2015 and 2016. The level is lower in China, where 2 to 3 do but 2 to 4 companies out of 10 report
uncertainty regarding their turnover for the first half of 2017.
In each region, the most important business issues remain related to the general economic situation with the state of
the economy in home market, the global economic development uncertainty, the competition from within the industry,
and internal challenges.
Security is also high on the agenda with a large majority of companies declaring having implemented additional
measures in the recent months, varying from additional screening for visitors and exhibitors to additional information
for attendees, controls on site during the event and also, sometimes, checking the lists of pre-registered participants in
liaison with government institutions.
THE NEXT GLOBAL BAROMETER SURVEY WILL BE RUN IN DECEMBER 2016 – PLEASE PARTICIPATE!
Conclusion
30
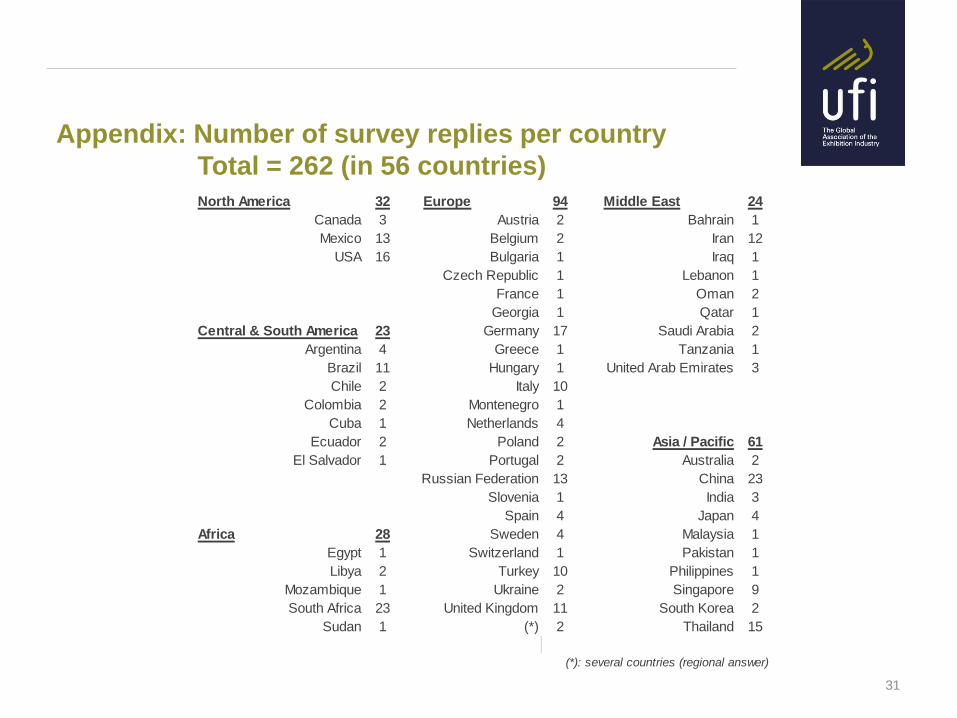
Appendix: Number of survey replies per country
Total = 262 (in 56 countries)
31
North America 32 Europe 94 Middle East 24
Canada 3 Austria 2 Bahrain 1
Mexico 13 Belgium 2 Iran 12
USA 16 Bulgaria 1 Iraq 1
Czech Republic 1 Lebanon 1
France 1 Oman 2
Georgia 1 Qatar 1
Central & South America 23 Germany 17 Saudi Arabia 2
Argentina 4 Greece 1 Tanzania 1
Brazil 11 Hungary 1 United Arab Emirates 3
Chile 2 Italy 10
Colombia 2 Montenegro 1
Cuba 1 Netherlands 4
Ecuador 2 Poland 2 Asia / Pacific 61
El Salvador 1 Portugal 2 Australia 2
Russian Federation 13 China 23
Slovenia 1 India 3
Spain 4 Japan 4
Africa 28 Sweden 4 Malaysia 1
Egypt 1 Switzerland 1 Pakistan 1
Libya 2 Turkey 10 Philippines 1
Mozambique 1 Ukraine 2 Singapore 9
South Africa 23 United Kingdom 11 South Korea 2
Sudan 1 (*) 2 Thailand 15
(*): several countries (regional answer)
UFI Diamond Sponsors
Headquarters 17, rue Louise Michel F-92300 Levallois-Perret France Tel: (33) 1 46 39 75 00 Fax: (33) 1 46 39 75 01
E-mail: [email protected]
Asia/Pacific Office Suite 4114, Hong Kong Plaza 188 Connaught Road West Hong Kong, China Tel: (852) 2525 6129 Fax: (852) 2525 6171
E-mail: [email protected]
Middle East/Africa Office Expo Centre Sharjah, UAE Tel / Fax: (971) 6 599 1352
E-mail: [email protected]


