Download - Geography of advice seeking
Geoforum 39 (2008) 2084–2096
Contents lists available at ScienceDirect
Geoforum
journal homepage: www.elsevier .com/locate /geoforum
Geography of advice seeking
A. Patel a,*, N.J. Balmer a,b, P. Pleasence a,b
a Legal Services Research Centre, Legal Services Commission, 4 Abbey Orchard Street, London, SW1P 2BS, UKb Faculty of Laws, University College London, UK
a r t i c l e i n f o
Article history:Received 29 May 2007Received in revised form 22 May 2008
Keywords:Civil and social justice problemsLegal servicesAdvice servicesAdvice seeking strategyProximityAwareness
0016-7185/$ - see front matter Crown Copyright � 2doi:10.1016/j.geoforum.2008.07.004
* Corresponding author. Present address: Legal ServOrchard Street, London SW1P 2BS, UK.
E-mail address: [email protected]
a b s t r a c t
Despite limited research on access to advice services, it has long been assumed that access is related togeographic proximity [e.g. Blacksell, M., 1990. Social Justice and access to legal services: a geographic per-spective. Geoforum 21 (4), 489–502]. The current study uses data from the English and Welsh Civil andSocial Justice Survey, a large-scale nationally representative survey of respondents’ experience of andresponse to civil and social justice problems [Pleasence, P., 2006. Causes of Action: Civil Law and SocialJustice, second ed. TSO, Norwich], to examine the impact of proximity to mainstream advice serviceson awareness and utilisation of services. In general, proximity of advice services had a relatively modestimpact on both awareness and advice seeking. However, proximity did impact upon mode of contact andthere was some evidence of difference in strategy (particularly more inaction) for isolated individualswithout use of motorised transport. The suitability of different modes of advice provision for particulardemographic groups are discussed, as well as implications for service delivery.
Crown Copyright � 2008 Published by Elsevier Ltd. All rights reserved.
1. Introduction
It is assumed that access to civil justice advice services is, at leastpartially, dependent upon physical proximity to an adviser (Black-sell 1990; Sandbach 2004). Unfortunately, there has been little re-search on the effect that distance has on how an individual seeksout advice for a civil justice problem, leaving the assumption un-tested. Regardless of the shortfall of evidence to support thisassumption, the possibility that distance may act as an obstacle toaccessing legal services is an important consideration within thecontext of the provision of public legal services. This is recognisedin the Legal Services Commission’s (an executive non-departmentalpublic body responsible for the administration of legal aid fundingin England and Wales) Strategy for the Community Legal Service(Legal Services Commission 2005, p. 24), in which the need to tailor,‘‘advice services in accordance with geographical factors” is empha-sised. Indeed, with the likely contraction of the number of legal aidorganisations over the coming years (Mayson 2007; Carter, 2006),geographical aspects of advice provision are of increasing relevance.
This paper explores the impact that distance between an indi-vidual and their closest advice provider has upon the utilisationof advice services. Using both actual and perceived distance mea-sures, we first seek to understand whether having an adviser lo-cated nearby increases awareness of available services and howthis in turn may impact upon the use of services. We then investi-
008 Published by Elsevier Ltd. All r
ices Research Centre, 4 Abbey
(A. Patel).
gate the impact of increasing distance, on both service use andmode of access.
2. Access to advice services
In spite of the important role played by the civil advice sectorwithin society there has been surprisingly little research on geo-graphical aspects of legal advice seeking and service location. Thisapplies to research both in the legal and geographical fields. One ofthe first investigations into the distribution of solicitors in the UK,the Exeter Access to Justice in Rural Britain Project (AJRBP), noted,‘‘Lawyers and legal services as a whole have received scant atten-tion in the extensive geographical literature on service provisionwhich has for the most part concentrated on public sector servicessuch as health and education” (Economides et al., 1986, p. 162).The studies that do exist, while important, are usually limited bytheir supplier orientated nature, concentrating on analysis of thelocations and perceptions of advice providers, providing littleinformation about the impact of poor physical accessibility uponthose people that require the use of such services. They nonethe-less highlight a trend towards legal advisers being concentratedin urbanised commercial centres and less so in deprived residentialand suburban and rural areas (Abel, 1988; Foster, 1973).
The AJRBP, which was completed in 1988, remains the most in-depth study of the distribution of solicitors and its impact on ser-vice accessibility in the UK. Building upon assumptions surround-ing the need for advice services in rural areas outlined by The RoyalCommission on Legal Services (1979), the study found that formany people living in isolated rural communities, difficulties in
ights reserved.

A. Patel et al. / Geoforum 39 (2008) 2084–2096 2085
accessing advice services stemmed from the ‘‘intrinsic remotenessof the countryside, which dictates that people have to expend moretime, money and energy” (Blacksell et al., 1991, p. 169) than thoseliving in more urban areas.
However, the significant changes that have taken place in thelegal and general advice sector since the completion of the AJRBPlimit the extent to which it is possible to apply its findings to thepresent day. Changes in the scope and mechanisms of legal aidand the utilisation of communication technologies to deliver ser-vices mean that advice options have significantly altered sincethe AJRBP study.
Societal changes since the completion of the AJRBP have alsoredefined traditional barriers to obtaining advice, for example theconsiderable increase in personal car ownership1 is likely to havealtered peoples’ ability to access advice services. In their study look-ing into the experience of civil justice problems in New Zealand,Maxwell et al. (1999) revealed that having access to personal trans-port increased the rate at which survey respondents were able tosuccessfully obtain advice. Additionally, the enormous growth inthe use of digital and mobile technology (Ofcom, 2006) has also chal-lenged traditional notions of access, leading some, such as Graham(1998), to reassess conceptualisations of accessibility. He states:
‘‘Propinquity in material space has no necessary correlationwith relational meaning. . .Complex place and transport-based relational meaning. . .are constantly being recombinedwith local and non-local relational connections, accessed viatechnological networks.” (p. 181)
The growth in personal use of mobile and digital communicationtechnologies has eroded some barriers individuals may have previ-ously faced. New methods being employed to deliver services byadvice sector organisations, such as advice delivered over the tele-phone and via internet/e-mail, are also changing the manner inwhich individuals can engage with the advice sector. It has beenspeculated that the ‘virtual mobility’ created by the use of Informa-tion and Communication Technologies (ICT’s) can offset some of thedifficulties presented by poor availability of transport and may evenpromote social inclusion by enabling access to key services (Kenyonet al., 2002).
Access is thus a multifaceted concept that goes beyond simplylooking at spatial measures (see Field and Briggs 2001; Weberand Kwan, 2003a). Yet, as is often noted by geographers, accessusually does include a spatial element, something socio-legal re-search has tended to ignore. Traditionally, such research has re-garded access and accessibility to the legal system, ‘‘in relation toeconomic, cultural and psychological barriers” (Economides et al.,1986, p. 173).
While there is a shortfall in literature on spatial accessibility tothe advice sector, it has been widely explored within health careresearch. In light of the growing recognition of the relationship be-tween the experience of civil and social justice problems and ill-health (Balmer et al., 2005; British Medical Association, 2003;Drentea, 2000; Drentea and Lavrakas, 2000; Nettleton and Bur-rows, 1998; Pleasence et al., 2004a; Reading and Reynolds, 2001),and also the role played by medical services, in particular GeneralPractitioners’ offices, in delivering civil justice advice (Balmer et al.,2005; Lord Chancellor’s Department, 2003; Working Party of theRoyal College of General Practitioners, 1972; Social Exclusion Unit,2004), the application of health care doctrines to inform debate
1 Comparing figures between the 1991 and 2001 census shows an increase in carownership of 5% during that period. This increase is relevant when coupled withfindings from the National Statistics’ Omnibus Survey (January and March 2000–2001) which suggested that individuals living in a household without access to a carwere almost twice as likely to find difficulty in accessing key services compared tothose that did have access (Ruston, 2002).
surrounding access to advice services would seem entirelyappropriate.
Understanding service accessibility in both the health and theadvice sector is highly important. As with problems of ill-health,failing to take appropriate action to deal with a civil justice prob-lem may well exacerbate it. Early intervention could possibly avertsimple problems spiralling into far more complicated ones later on(Department for Constitutional Affairs, 2006; Genn, 1999; Gennand Paterson, 2001; Pleasence, 2006), therefore making it crucialthat appropriate advice services can be easily accessed. Field andBriggs (2001, p. 295) note that accessibility and utilisation of pri-mary health care (though equally applicable to advice services),should not be more arduous than the underlying need for the ad-vice. They argue that:
‘‘. . .the action of seeking health care must not be more trou-blesome and disturbing than the illness itself, and the barri-ers to effective accessibility such as distance, inconvenience,and cost may act as a deterrent and reduce utilization eventhough a psychological readiness to use a healthcare serviceexists.”
2.1. Definitions of access
Before any discussion about the effect of physical accessibilitycan begin, it is helpful to conceptualise access by looking towardsestablished health sector doctrines. A widely accepted conceptuali-sation put forward by Khan (1992), describes access as being con-structed of two dichotomous dimensions. The first dichotomy isbetween potential versus realised (also referred to as revealed oractualised) access. Potential accessibility suggests the probable en-try into the healthcare system, however, it does not necessarily en-sure such services are utilised (Khan 1992). Realised access isachieved when barriers to entry into the healthcare system areovercome and services are actually utilised (Guagliardo, 2004; Jo-seph and Phillips, 1984; Luo and Wang, 2003). Though it is ac-cepted that spatial accessibility can be measured in terms ofdistance or time, recent research has also demonstrated the impactupon service utilisation based upon perceived distance (whetherconsidered in terms of physical distance or time) (Fone et al.,2006).
The second dichotomous dimension is between spatial versusaspatial access. Spatial access is, ‘‘specifically conditioned by a spa-tial/distance variable (as a barrier or facilitator)” (Khan 1992, p.276). Clearly, the use of travel impedance or cumulative opportu-nity measures cannot fully explain variations in access. As withmedical problems, individuals can respond in a number of differ-ent ways when faced with a civil justice problem; the decision toseek advice and the choice of advice provider is far from obvious(Genn, 1999; Pleasence, 2006) and not explained by physicalproximity alone. Variations are as much determined by socio-cul-tural and demographic constraints as physical distance or locationper se (Deas et al., 2003; Weber and Kwan, 2003b; Rose, 1993,1997; Schuurman and Pratt, 2002; Yapa, 1998). Relying exclu-sively on spatial accessibility measures fails to, ‘‘capture the com-plexities arising from the effect of personal idiosyncrasies andindividual perception of the geographical and temporal availabil-ity” (Weber and Kwan 2003b, p. 345). Aspatial (or social) access,which stresses the relevance of non-geographic barriers or facili-tators, essentially addresses these ‘personal idiosyncrasies andindividual perceptions’ (Birkin et al., 1996;, Field and Briggs,2001; Guagliardo, 2004; Joseph and Phillips, 1984; Khan, 1992;Luo and Wang, 2003).
Combining the two dichotomies provides a useful typology ofaccess (see Table 1). Khan’s dichotomy demonstrates the com-plex of factors that influence geographic access and shows that
Table 2Discrete problem types reported in the survey, and percentage/number of respon-dents reporting one or more problem of each type
Problem type Example % N
Consumer Faulty goods/services (e.g. building work) 10.0 503Neighbours Anti-social behaviour 6.6 329Money/debt Mis-selling of financial products, disputed
bills5.6 279
Employment Termination/terms of employment 5.2 260Negligent accidents Road accidents, workplace accidents 4.9 244Housing (renting) Repairs to property/unfit housing, lease
terms2.7 137
Housing (owning) Boundaries/rights of way, planningpermission
2.4 121
Discrimination Disability discrimination, racediscrimination
2.2 111
Divorce – 2.1 106Welfare benefits Entitlement to/quantification of benefits 1.9 98Relationship
breakdownResidence/care of children, division of assets 1.7 84
Clinical negligence Negligent medical or dental treatment 1.6 79Children School exclusion, choice of school 1.5 75Housing
(homelessness)Experience/threat of homelessness 1.2 61
Domestic violence Violence against respondent/children 0.8 42Unfair police
treatmentAssault/unreasonable detention by police 0.8 40
Immigration Obtaining authority to remain in the UK 0.3 16Mental health Conditions of/care after hospital discharge 0.2 11
2 Using a show card listing a variety of advice providers, including Citizens AdviceBureaux (CABs), solicitors and Law Centres, respondents were asked whether any ofthe organisations were located close to where they lived. Respondents were told that‘close’ meant within about two miles of where they lived.
Table 1A typology of access (source: Khan, 1992)
Accessdimensions
Spatial (Geographic) Aspatial (Social)
Potential Potential spatial/geographic access Potential aspatial/social accessRealised Realised spatial/geographic access Realised aspatial/social access
2086 A. Patel et al. / Geoforum 39 (2008) 2084–2096
as only one part of this complex, the effect of physical distancemay vary. Though it would be extremely interesting to get a fullinsight on issues surrounding geographic access, this currentstudy is limited for several methodological reasons (noted be-low), to investigate geographic and spatial issues of access purelyin terms of proximity (defined by physical Euclidean distanceand location) to address differences between potential and rea-lised spatial access to advice services. It will investigate to whatextent advice service utilisation is reliant on awareness of, orpropinquity to local advice provision and in doing so, identifywhether access to advice services is equal between different pop-ulation groups.
3. Methodology
3.1. The English and Welsh Civil and Social Justice Survey
Data in the present study come from the 2004 English andWelsh Civil and Social Justice Survey. The English and Welsh Ci-vil and Social Justice Survey (CSJS) provides detailed informationon the nature, pattern and impact of people’s experience of civiljustice problems and the use and success of problem resolutionstrategies (Pleasence, 2006). All interviews for the 2004 surveywere arranged and conducted face-to-face in respondents’ ownhomes, by BMRB Limited between July and December 2004.The form of the survey is a development upon the earlier surveysof Pleasence et al. (2004b), Genn (1999) and Genn and Paterson(2001).
Residential addresses were randomly selected from 250 post-code sectors, spread throughout England and Wales, using thesmall user Postcode Address File. Adults over 18 years of age with-in each of 3832 households were interviewed, yielding 5015respondents. Seventy-two per cent of adult household members(over 18 years of age) were interviewed. The household responserate was 79% (89% where successful contact was made with anadult occupant), and the cumulative eligible adult response ratewas 57%. These response rates compare with other large-scale so-cial surveys such as the Expenditure and Food Survey (58% in 2003/2004: Gibbins, 2004) and Family Resources Survey (65% in 2003/2004: Chung et al., 2004).
Twenty per cent of households contained just one adult, 58%contained two adults and the remainder contained three or more.The average number of adults in each household was 1.8. Overall,the average survey household size was 2.7, slightly bigger than the2001 census estimate of 2.4. Twenty-five per cent of respondentsaged between 25 and 74 years old reported a long-term limiting ill-ness or disability, compared to the 2001 census estimate of 24%.
All respondents completed a screening interview, where theywere asked if they had experienced a problem since January2001, that had been difficult to solve in each of 18 distinct problemcategories. The screen interview was carefully constructed to limit(as far as possible) the circumstances reported to those to whichlegal principles can be applied. Problem types are listed in Table2, along with examples of constituent sub-categories and the pro-portion of respondents reporting having experienced one or moreproblem of each type.
For the two most recent problems identified in each category,respondents were asked about their nature, action taken to resolve
them, manners of conclusion, and the impact they had had on theirlives.
All respondents were also asked for a range of details aboutthemselves and the household in which they resided. These in-cluded details of the duration of any reported long-standing ill-health or disability, as well as an indication of severity.
If a respondent had experienced at least one problem, they pro-gressed to a short follow-up interview, which addressed further as-pects of a single problem drawn from those identified through thescreening interview (including advice, objectives, costs and out-comes). No main interviews were conducted in respect of con-sumer problems.
The mean interview duration was half an hour. Twenty-two percent of respondents completed both a screen interview and a maininterview. A full technical report of the survey has been publishedelsewhere (Phelps et al., 2005).
Survey findings, specifically those relating to respondents’ per-ception of local advice points,2 were used to compare respondents’situational knowledge of local advice provision against mapped ad-viser locations.
3.2. Mapping
Respondents’ and advice providers’ postcodes were assignednational grid references against the Royal Mail’s Postcode addressfile. This enabled the analysis of a respondent’s distance from theirclosest adviser in MapInfo GIS.
The prevailing environment for the advice sector currently, isessentially a quasi-mixed market, made up of solicitors, n-for profitadvice agencies, local and national government. To reflect thediversity amongst the supplier groups, four discreet datasets wereused to identify potential sources of advice. Data obtained from

Fig. 1. Distribution of solicitors holding community legal services contracts, Citizens Advice Bureaux and Law Centres throughout England and Wales. (For interpretation tocolours in this figure, the reader is referred to the web version of this paper.)
A. Patel et al. / Geoforum 39 (2008) 2084–2096 2087
Citizens Advice was used to map the locations of 882 Citizens Ad-vice Bureaux (CABs). Similarly, address information obtained fromthe Law Centres Federation enabled the mapping of 60 Law Cen-tres. Data were acquired from the Legal Services Commission(LSC) and related to solicitors’ offices awarded a Community LegalService (CLS) civil contract, enabling the organisation to providefree civil legal advice to an individual3 through public funding(commonly referred to as legal aid). These later data were used asa proxy measure for solicitors’ offices. The CLS data contained loca-
3 Provided the client satisfies a financial means and a merits test.
tion information about solicitors providing advice and assistance inkey social welfare and civil law categories, including advice on fam-ily and children law, discrimination, welfare benefits, debt and com-munity care to name a few. It excludes law firms that only carry outcriminal or commercial work, such as corporate law, tax, and con-veyancing. These latter organisations do not provide services thataddress civil or social justice problems faced by individuals. Overall,3988 point locations were mapped for CLS civil contract holders. Inaddition to the CLS civil contract holder data, the LSC also provideddata on organisations holding a CLS Quality Mark. The Quality Markrefers to a recognised standard denoting a minimum level of servicequality within the advice sector. In total this dataset included 2546
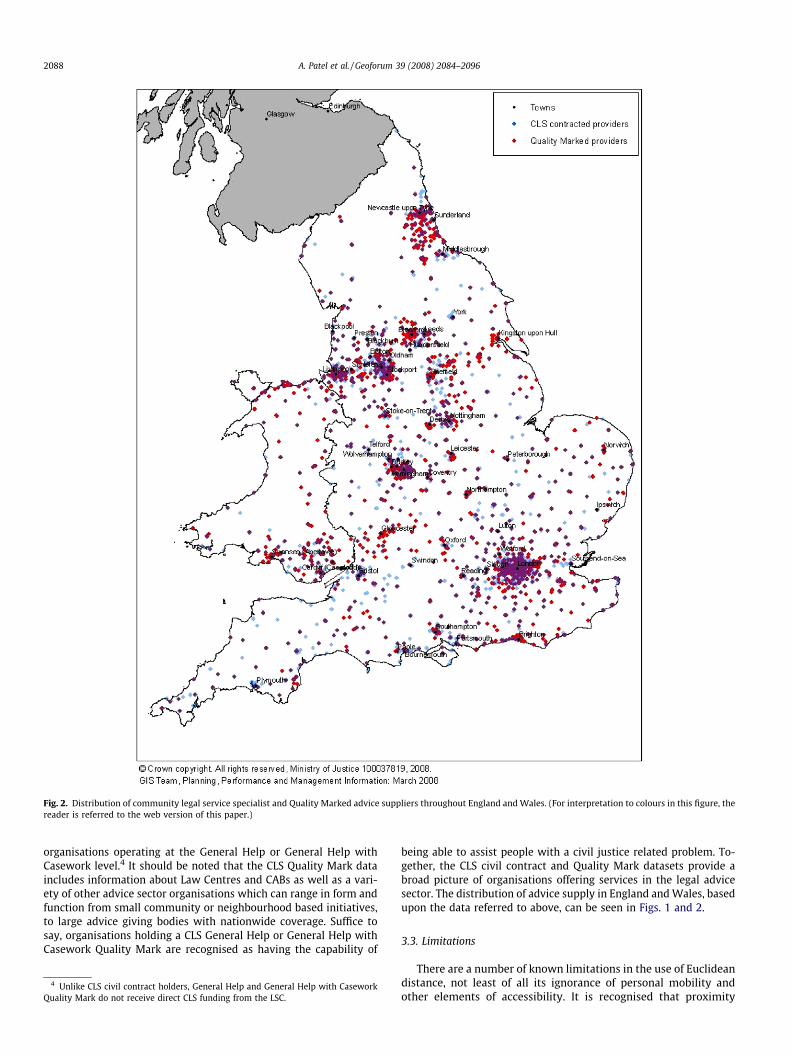
Fig. 2. Distribution of community legal service specialist and Quality Marked advice suppliers throughout England and Wales. (For interpretation to colours in this figure, thereader is referred to the web version of this paper.)
2088 A. Patel et al. / Geoforum 39 (2008) 2084–2096
organisations operating at the General Help or General Help withCasework level.4 It should be noted that the CLS Quality Mark dataincludes information about Law Centres and CABs as well as a vari-ety of other advice sector organisations which can range in form andfunction from small community or neighbourhood based initiatives,to large advice giving bodies with nationwide coverage. Suffice tosay, organisations holding a CLS General Help or General Help withCasework Quality Mark are recognised as having the capability of
4 Unlike CLS civil contract holders, General Help and General Help with CaseworkQuality Mark do not receive direct CLS funding from the LSC.
being able to assist people with a civil justice related problem. To-gether, the CLS civil contract and Quality Mark datasets provide abroad picture of organisations offering services in the legal advicesector. The distribution of advice supply in England and Wales, basedupon the data referred to above, can be seen in Figs. 1 and 2.
3.3. Limitations
There are a number of known limitations in the use of Euclideandistance, not least of all its ignorance of personal mobility andother elements of accessibility. It is recognised that proximity

A. Patel et al. / Geoforum 39 (2008) 2084–2096 2089
and access to an advice service is not, necessarily, synonymous.Nevertheless, the phrasing of the question used here to gauge theawareness of advice providers, was based solely on distance be-tween respondents and their closest solicitor, CAB and Law Centre;inhibiting analysis to look solely at physical distance as opposed totravel time measures. Additionally, it was not possible to explorehow respondents perceived distance (e.g. whether as a straightline, distance by walking, by road or by public transport). The ab-sence of such information restricts the possible use of more ad-vanced measures.
Analysis also relies on certain suppositions that are not neces-sarily true. As distances were measured between a respondent’susual residential postcode centroid and address matched adviserpoint location, it is assumed that journey origins invariably beginfrom an individual’s residence. However, this assumption over-looks alternative spatial origins, such as place of work, children’sschool or main grocery shopping point, which could influence ser-vice selection and utilisation. An individual’s location is often de-fined beyond their place of residence (Guagliardo, 2004), inparticular, physical proximity is considered a less prominent deter-minant in service utilisation in urban geographies (Hanson andPratt, 1988; Kwan, 1998; Weber, 2003).
Further, Euclidian measures are not temporally restricted andthus produce inflated values of accessibility. Issues such as peaktime-congestion and public transport pricing policies can greatlyaffect accessibility at different times of the day. Temporal barriers,such as business opening hours coupled with individual occupa-tional, educational, or family commitments, not only reduce acces-sibility, but can, ‘‘also produce a very different – and perhapsunexpected – geography of accessibility” (Weber and Kwan 2002,p. 236).
Advice services are not only limited to CABs, solicitors and LawCentres. Other well established advice services are able to assistpeople when confronted by a civil justice problem (organisationssuch as Shelter, Age Concern, National Debtline, etc.). However, ad-vice is also sought from insurance companies, local authorities, thepolice, local Members of Parliament, trade unions and other profes-sional bodies and an array of other sources (Genn, 1999; Genn andPaterson, 2001; Pleasence, 2006. Though some of these serviceswill fall within the CLS General Help or General Help with Case-work Quality Mark data, it follows that findings do not convey fullknowledge, or lack thereof, of advice provision. However, as thelargest collective contributors to the legal information and advicesector (Pleasence, 2006), and principal providers of specifically ci-vil justice advice, analysis of proximity to solicitors, CABs and LawCentres can at the very least provide some insight into people’sperception of local advice provision.
It is important to note this study does not seek to provide anabsolute measure of accessibility. It is an initial step into lookingat the effect spatial awareness and adviser proximity has uponthe utilisation of advice services.
3.4. Analysis
Survey findings, specifically those relating to respondents’ per-ception of local advice points,5 were used to compare respondents’situational knowledge of local advice provision against mapped ad-viser locations. Distance to advisers was also related to broad prob-lem solving strategy and mode of contact.
Section 4.1 provides a descriptive analysis of awareness of ad-vice provision, while Section 4.2 uses binary logistic regression toexamine social and demographic predictors of awareness. Section
5 Respondents were asked specifically about the location of CABs, solicitors andLaw Centres as well as other advice services close to where they lived.
4.3 examines whether awareness or lack of awareness impactsupon broad problem solving strategy.
Section 4.4 examines how social and demographic predictors aswell as proximity impact upon broad problem solving strategy,while Section 4.5 specifically examines the impact of proximity,use of transport and their interaction on strategy, to establishwhether transport might moderate the impact of proximity. Final-ly, Section 4.6 provides a descriptive analysis of how proximity ofadvisers might relate to mode of contact.
For the purposes of Sections 4.4 and 4.5, multilevel models wereimplemented using MlwiN (Rasbash et al., 2004). Multilevel mod-els (Goldstein 2003) were used in order to correctly model thehierarchical structure of the data. In the CSJS, all eligible adultswithin households are interviewed, resulting in survey respon-dents being clustered within households. In the present study,we fit data as random intercept models that allow the probabilityof experiencing problems to vary across households (i.e. acknowl-edging that a household member experiencing a problem mayinfluence the likelihood of additional household members experi-encing problems). There are a number of consequences associatedwith not accounting for clustering, including underestimation ofstandard errors associated with regression coefficients (Rasbashet al., 2004). Multilevel models were not implemented for the pur-poses of Sections 4.2 and 4.3, as there were relatively few instancesof data originating from main survey interviews, as main inter-views concern only one problem being derived from individualsin the same household. Thus, there is little need to specify a mul-tilevel data structure in the models. Analysis was restricted tothose survey respondents reporting one or more civil justiceproblems.
Finally, Sections 4.1–4.3, below, deal with the awareness ofsolicitors’ firms, CABs and Law Centres specifically, whereas Sec-tions 4.4–4.6 look more broadly at distance to CLS civil contractholders or Quality Marked advice organisations.
4. Results
4.1. Awareness and lack of awareness
Figures obtained from the LSC and census 2001 England andWales population data, suggest that the majority of people havean adviser located ‘nearby’. It is estimated that 74% of the popula-tion have a CLS civil contract holder located within 2 miles of theirresidential address, and 93% within 5 miles6 Of course, type of geo-graphical location affects the proportion of the population fallingwithin these catchment areas. Only 19% of the population living inareas classified as ‘rural’ have a CLS civil contract provider locatedwithin 2 miles, going up to 70% with an adviser within 5 miles; thiscompared to 88% and 99%, respectively, for populations living in ‘ur-ban’ areas.7
Data from the CSJS demonstrate a similar level of coverage, with79% of respondents being located within 2 miles of a solicitor, Cit-izens Advice Bureau or Law Centre. The slight increase over the fig-ures provided by the LSC partly results from the inclusion of CABsand Law Centres as well as CLS civil contract holders.
Only 65% of respondents who had an adviser located within2 miles of their home were able to identify the fact, and only 43%correctly identified all advisers within 2 miles. Thirty-five per centfailed to identify any advisers within 2 miles of their homes.
Examining adviser types individually, of those with a CAB with-in 2 miles of their homes, 46% were unaware of it. For those with a
6 Based upon the levels of supply in April 2006.7 Areas were classified using the Department for Environment, Food and Rural
Affair’s ‘Rural Definition’ (Bibby and Shephard, 2005).
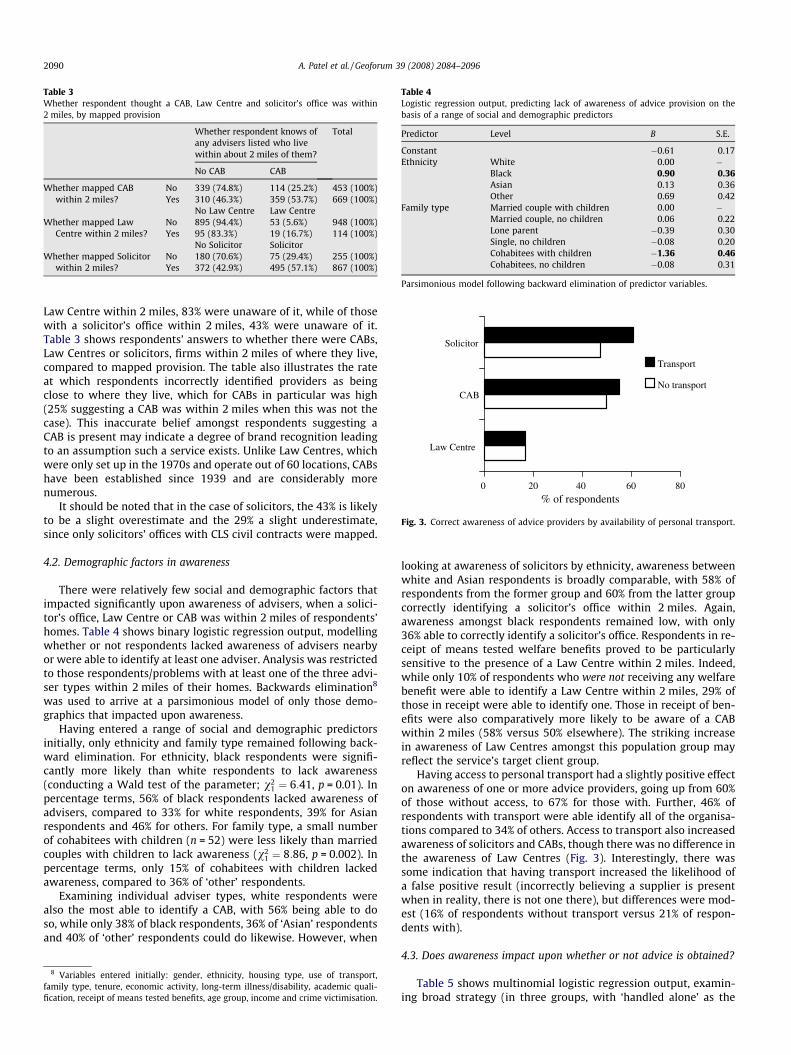
Table 3Whether respondent thought a CAB, Law Centre and solicitor’s office was within2 miles, by mapped provision
Whether respondent knows ofany advisers listed who livewithin about 2 miles of them?
Total
No CAB CAB
Whether mapped CABwithin 2 miles?
No 339 (74.8%) 114 (25.2%) 453 (100%)Yes 310 (46.3%) 359 (53.7%) 669 (100%)
No Law Centre Law CentreWhether mapped Law
Centre within 2 miles?No 895 (94.4%) 53 (5.6%) 948 (100%)Yes 95 (83.3%) 19 (16.7%) 114 (100%)
No Solicitor SolicitorWhether mapped Solicitor
within 2 miles?No 180 (70.6%) 75 (29.4%) 255 (100%)Yes 372 (42.9%) 495 (57.1%) 867 (100%)
Table 4Logistic regression output, predicting lack of awareness of advice provision on thebasis of a range of social and demographic predictors
Predictor Level B S.E.
Constant �0.61 0.17Ethnicity White 0.00 �
Black 0.90 0.36Asian 0.13 0.36Other 0.69 0.42
Family type Married couple with children 0.00 �Married couple, no children 0.06 0.22Lone parent �0.39 0.30Single, no children �0.08 0.20Cohabitees with children �1.36 0.46Cohabitees, no children �0.08 0.31
Parsimonious model following backward elimination of predictor variables.
0 20 40 60 80
Law Centre
CAB
Solicitor
% of respondents
Transport
No transport
Fig. 3. Correct awareness of advice providers by availability of personal transport.
2090 A. Patel et al. / Geoforum 39 (2008) 2084–2096
Law Centre within 2 miles, 83% were unaware of it, while of thosewith a solicitor’s office within 2 miles, 43% were unaware of it.Table 3 shows respondents’ answers to whether there were CABs,Law Centres or solicitors, firms within 2 miles of where they live,compared to mapped provision. The table also illustrates the rateat which respondents incorrectly identified providers as beingclose to where they live, which for CABs in particular was high(25% suggesting a CAB was within 2 miles when this was not thecase). This inaccurate belief amongst respondents suggesting aCAB is present may indicate a degree of brand recognition leadingto an assumption such a service exists. Unlike Law Centres, whichwere only set up in the 1970s and operate out of 60 locations, CABshave been established since 1939 and are considerably morenumerous.
It should be noted that in the case of solicitors, the 43% is likelyto be a slight overestimate and the 29% a slight underestimate,since only solicitors’ offices with CLS civil contracts were mapped.
4.2. Demographic factors in awareness
There were relatively few social and demographic factors thatimpacted significantly upon awareness of advisers, when a solici-tor’s office, Law Centre or CAB was within 2 miles of respondents’homes. Table 4 shows binary logistic regression output, modellingwhether or not respondents lacked awareness of advisers nearbyor were able to identify at least one adviser. Analysis was restrictedto those respondents/problems with at least one of the three advi-ser types within 2 miles of their homes. Backwards elimination8
was used to arrive at a parsimonious model of only those demo-graphics that impacted upon awareness.
Having entered a range of social and demographic predictorsinitially, only ethnicity and family type remained following back-ward elimination. For ethnicity, black respondents were signifi-cantly more likely than white respondents to lack awareness(conducting a Wald test of the parameter; v2
1 ¼ 6:41, p = 0.01). Inpercentage terms, 56% of black respondents lacked awareness ofadvisers, compared to 33% for white respondents, 39% for Asianrespondents and 46% for others. For family type, a small numberof cohabitees with children (n = 52) were less likely than marriedcouples with children to lack awareness (v2
1 ¼ 8:86, p = 0.002). Inpercentage terms, only 15% of cohabitees with children lackedawareness, compared to 36% of ‘other’ respondents.
Examining individual adviser types, white respondents werealso the most able to identify a CAB, with 56% being able to doso, while only 38% of black respondents, 36% of ‘Asian’ respondentsand 40% of ‘other’ respondents could do likewise. However, when
8 Variables entered initially: gender, ethnicity, housing type, use of transport,family type, tenure, economic activity, long-term illness/disability, academic quali-fication, receipt of means tested benefits, age group, income and crime victimisation.
looking at awareness of solicitors by ethnicity, awareness betweenwhite and Asian respondents is broadly comparable, with 58% ofrespondents from the former group and 60% from the latter groupcorrectly identifying a solicitor’s office within 2 miles. Again,awareness amongst black respondents remained low, with only36% able to correctly identify a solicitor’s office. Respondents in re-ceipt of means tested welfare benefits proved to be particularlysensitive to the presence of a Law Centre within 2 miles. Indeed,while only 10% of respondents who were not receiving any welfarebenefit were able to identify a Law Centre within 2 miles, 29% ofthose in receipt were able to identify one. Those in receipt of ben-efits were also comparatively more likely to be aware of a CABwithin 2 miles (58% versus 50% elsewhere). The striking increasein awareness of Law Centres amongst this population group mayreflect the service’s target client group.
Having access to personal transport had a slightly positive effecton awareness of one or more advice providers, going up from 60%of those without access, to 67% for those with. Further, 46% ofrespondents with transport were able identify all of the organisa-tions compared to 34% of others. Access to transport also increasedawareness of solicitors and CABs, though there was no difference inthe awareness of Law Centres (Fig. 3). Interestingly, there wassome indication that having transport increased the likelihood ofa false positive result (incorrectly believing a supplier is presentwhen in reality, there is not one there), but differences were mod-est (16% of respondents without transport versus 21% of respon-dents with).
4.3. Does awareness impact upon whether or not advice is obtained?
Table 5 shows multinomial logistic regression output, examin-ing broad strategy (in three groups, with ‘handled alone’ as the

0 20 40 60 80 100
Lac
k of
awar
enes
s
Cor
rect
/par
tly
corr
ect
Civil Justice Problems (%)
Did nothing
Handled alone
Obtained advice
Fig. 4. Broad problem solving strategy by awareness of mainstream adviceprovision.
Table 6Multilevel multinomial logit model output examining broad problem solving strategyon the basis of a range of social and demographic predictors
Strategya Predictor Level B S.E.
Did nothing Constant �0.06 0.30Ethnicity White 0.00 –
Black �0.28 0.38Asian �1.16 0.63Other 0.10 0.46
House type Detached 0.00 –Semi-detached �0.29 0.22Terrace �0.10 0.24Flat �0.04 0.28
Use of transport Yes �0.42 0.19Tenure Own 0.00 –
Mortgage �0.02 0.22Rent publicly �0.15 0.28Rent privately �0.20 0.30Rent free �0.02 0.35
Academic qualifications Yes �0.48 0.19Means tested benefits Yes �0.06 0.18
Obtained advice Constant 0.14 0.21Ethnicity White 0.00 –
Black �0.72 0.26Asian �0.34 0.29Other 0.19 0.31
House type Detached 0.00 �Semi–detached �0.19 0.15Terrace 0.20 0.16Flat �0.15 0.19
Use of transport Yes 0.12 0.13Tenure Own 0.00 –
Mortgage 0.31 0.15Rent publicly 0.51 0.19Rent privately �0.25 0.21Rent free �0.22 0.24
Academic qualifications Yes 0.06 0.13Means tested benefits Yes 0.23 0.11
Parsimonious model following backward elimination of predictor variables.a The reference category is ‘Handled alone’.
Table 7Household level covariance matrix
Did nothing Obtained advice
Did nothing 0.87 (0.23)Obtained advice �0.26 (0.11) 0.34 (0.10)
Table 5Multinomial logistic regression model output examining broad problem solvingstrategy on the basis of awareness of advice provision
Strategya Coefficient B S.E.
Did nothing Intercept �1.15 0.15No awareness 0.63 0.24Some awareness 0.00 �
Obtained advice Intercept 0.64 0.09No awareness 0.14 0.16Some awareness 0.00 –
a The reference category is ‘Handled alone’.
A. Patel et al. / Geoforum 39 (2008) 2084–2096 2091
reference category), by whether or not respondents were able tocorrectly identify at least some advisers (solicitor’s firms, CABs orLaw Centres) within 2 miles of their homes. By definition, analysisis restricted to those with at least one adviser within 2 miles oftheir home.
Those lacking awareness of any adviser were similar in theirtendency to obtain advice (rather than handle alone) when com-pared to those who were able to identify advisers (v2
1 ¼ 0:74,p = 0.39). In percentage terms, those with knowledge of an adviserobtained advice 59% of the time, compared to 58% for those lackingawareness. In contrast, those lacking awareness were far morelikely than those with awareness of advisers to do nothing, ratherthan handle alone (v2
1 ¼ 6:98, p = 0.08). In percentage terms, thoselacking awareness did nothing around 16% of the time, comparedto around 10% for those with knowledge of advisers near theirhome. Broad strategy by awareness of advisers is shown in Fig. 4.
When looking at individual organisation types, of those whohad sought advice from a CAB and had one nearby, 73% were ableto correctly identify a CAB as nearby. This compared to 52% forthose who had not used a CAB. Though this may not be interestingin itself (for it seems obvious that if an individual uses a service,they are more likely to know its approximate location), there werenot such noticeable differences in the case of solicitors. Of respon-dents who had used a solicitor and had one with a CLS civil con-tract nearby, 66% correctly identified a local office compared to55% who had not used one. It could be speculated that unlike CABs,this smaller change in awareness indicates that the use of solicitorsis not as dependent on awareness but rather other factors, such asseverity of problem, or that people are prepared to travel further tovisit solicitors.
4.4. Social and demographic factors in broad problem solving strategy
Overall, collapsing problem solving strategy into three broadcategories, survey respondents obtained advice for around 52% ofproblems, handled alone for around 36% and did nothing around
12% of the time. Table 6 shows multilevel multinomial logit modeloutput (with Table 7 showing the household level covariance ma-trix), examining broad strategy (grouped into did nothing, handledalone, or obtained advice) on the basis of a range of social anddemographic predictors, as well as distance to the nearest CLS civilcontract/Quality Mark advice provider. As previously, backwardselimination was used to arrive at a parsimonious model of onlythose factors that impacted upon awareness.
A range of social and demographic predictors can be seen tohave an impact on the likelihood of doing nothing, or obtaining ad-vice rather than handling alone. Those with use of transport wereless likely to do nothing rather than handle alone (v2
1 ¼ 4:73,p = 0.029) as were those with an academic qualification (GCSE orabove; v2
1 ¼ 6:36, p = 0.012). Black respondents were significantlyless likely than white respondents to obtain advice rather thanhandle alone (v2
1 ¼ 7:71, p = 0.005). In contrast, those with mort-gages and those renting publicly were both more likely than thosewho owned their homes to obtain advice rather than handle alone(v2
1 ¼ 4:58, p = 0.032 and v21 ¼ 7:36, p = 0.004, respectively) as were
those in receipt of means tested benefits (v21 ¼ 4:09, p = 0.043).
Of course, some differences are (at least in part) attributable to

0 20 40 60 80 100
<2 miles
2-5 miles
5 miles or more
<2 miles
2-5 miles
5 miles or more
No
tran
spor
tT
rans
port
Civil Justice Problems (%)
Did nothing
Handled alone
Obtained advice
Fig. 5. Broad problem solving strategy by proximity of specialist/QM advice and useof motorised transport.
2092 A. Patel et al. / Geoforum 39 (2008) 2084–2096
differences in the types of problems reported. This is discussedelsewhere (Pleasence, 2006).
While grouped distance to CLS civil contract/Quality Mark advi-ser did not have a significant impact upon broad strategy, trans-port, which we might expect to moderate the impact of distance,did (see above and Table 6). The following section looks specificallyat proximity of advice, use of motorised transport and their inter-action in predicting strategy.
4.5. The impact of proximity to advisers and the role of transport
Table 8 shows multilevel multinomial logit model output (withTable 9 showing the household level covariance matrix), examin-ing broad strategy (grouped into did nothing, handled alone, or ob-tained advice) by distance to CLS civil contact or Quality Markedprovider (<2 miles, 2–5 miles, 5 miles or more), whether or notrespondents had motorised transport, and their interaction (i.e.distance to provider � use of transport). The analysis aims to deter-mine whether distance to provider impacts upon strategy, whileacknowledging that the impact of distance may be reduced ifrespondents have use of motorised transport (which the majorityof rural survey respondents did; 87% versus 72% of urban respon-dents). Similarly, the majority of those five miles or more fromCLS civil contract/Quality Mark providers also had use of transport(76%).
These findings are illustrated in Fig. 5, which shows broad strat-egy by distance to CLS civil contract/Quality Marked adviser forthose problems where respondents had transport and those wherethey did not.
Table 8Multilevel multinomial logit model output examining broad problem solving strategyon the basis of proximity of specialist/QM advice, whether or not respondents had useof motorised transport, and their interaction
Strategya Coefficient B S.E.
Did nothing Intercept �1.15 0.15 miles or more �0.77 0.562–5 miles 0.26 0.22<2 miles 0.00 –No transport 0.49 0.18Transport 0.00 –5 miles or more * No transport 1.54 0.875 miles or more * Transport 0.00 –2–5 miles * No transport �0.24 0.512–5 miles * Transport 0.00 –<2 miles * No transport 0.00 –<2 miles * Transport 0.00 –
Obtained advice Intercept 0.55 0.065 miles or more �0.09 0.272–5 miles �0.23 0.15<2 miles 0.00 –No transport �0.15 0.13Transport 0.00 –5 miles or more * No transport 0.24 0.605 miles or more * Transport 0.00 –2–5 miles * No transport 0.35 0.362–5 miles * Transport 0.00 –<2 miles * No transport 0.00 –<2 miles * Transport 0.00 –
a The reference category is ‘Handled alone’.
Table 9Household level covariance matrix
Did nothing Obtained advice
Did nothing 0.91 (0.22)Obtained advice �0.26 (0.11) 0.38 (0.10)
Overall, proximity to mainstream advisers (any CLS civil con-tract or Quality Marked adviser) had little impact on the broadproblem solving strategies adopted by survey respondents. Thosewho were 2–5 or 5 miles or more from the nearest CLS civil con-tracted adviser, were no more likely than those less than 2 milesfrom advisers to obtain advice rather than handle alone (testingthe terms in Table 8, v2
1 ¼ 2:38, p = 0.12 and v21 ¼ 0:12, p = 0.73,
respectively). Similarly, those 2–5 miles from advisers were notsignificantly more likely than those less than 2 miles from advisersto do nothing rather than handle alone (v2
1 ¼ 1:40, p = 0.24). Whilethose over 5 miles from advisers with transport were slightly lesslikely to do nothing (see Fig. 5), their overall tendency to do noth-ing was less when compared to those less than 5 miles from advis-ers (though this did not reach significance, v2
1 ¼ 1:92, p = 0.17).Importantly, while there was little difference in the tendency of
those without transport to obtain advice rather than handle alone,they were significantly more likely to do nothing (v2
1 ¼ 7:27,p < 0.01). Moreover, those five miles or more from advisers weremore likely than those less than 2 miles from advisers to do noth-ing rather than handle alone (see Fig. 5), though this difference didnot quite reach significance (v2
1 ¼ 3:11, p = 0.078).9 Lack of signifi-cance despite a large parameter estimate is likely to be a conse-quence of respondents without transport, more than five milesfrom a CLS civil contract/Quality Mark provider and with matchingadviser data being rare (there were only 23 problems in the problemlevel dataset where this was the case).
4.6. Mode of contact in obtaining advice
One potential solution for those with problems in remote areas,and particularly those without use of motorised transport, wouldbe to obtain advice by telephone. Internet based solutions also pro-vide respondents a means of accessing information. Indeed, the useof the Internet to gather information about a rights based problemincreased from the 4% reported in the 2001 survey (Pleasence et al.,2004b) to 11% in the 2004 survey. Promising as this is, the Internetis seldom used to obtain substantive advice; typically it is used tolocate an adviser. Sixty-eight per cent of respondents who used theInternet went on to obtain advice either in person or over the tele-phone compared to 56% of those who had not used the Internet.
Ignoring mode of initial contact and focussing on how respon-dents tried to obtain advice, around 52% only obtained advice inperson, 40% by telephone and 9% used both modes (across up tofour main survey advisers). Interestingly, in terms of adverse con-sequences, those only using face-to-face advice tended to have
9 p = 0.052 if a single-level model is fitted.

0 10 15 20 25 30 35 40
Physical ill-health
Stress related ill-health
Relationship breakdown
Violence aimed at me
Damage to property
Had to move home
Loss of employment
Loss of income
Loss of confidence
% civil justice problems
Advice by telephone only
Advice in person only
5
Fig. 6. Adverse consequences suffered as a result of civil justice problems byrespondents only obtaining advice by telephone and those only obtaining advice inperson.
0 20 40 60 80 100
<2miles
2-5 miles
5 miles or more
Civil Justice Problems (%)
Person only
Phone only
Both
Fig. 7. Mode of contact with advisers by proximity of specialist/QM advice.
10 The CSJS has shown, elsewhere, that exposure and response to civil justiceproblems can be affected by race and ethnicity (O’Grady et al., 2005), morbidity(Pleasence et al., 2004b), mental health (Pleasence and Balmer, 2007), social exclusion(Buck et al., 2005) and lone parenthood (Buck et al., 2004). Similar associations havealso been observed in a number of other jurisdictions including Australia (Mulherinand Coumarelos, 2007), Canada (Currie, 2007), New Zealand (Ignite Research, 2006),Northern Ireland (Dignan, 2006) and Scotland (Genn and Paterson, 2001).
A. Patel et al. / Geoforum 39 (2008) 2084–2096 2093
more severe problems than those using only telephone advice,with significantly more reporting an adverse consequence(v2
1 ¼ 6:57, p = 0.017; 71% with one or more adverse consequence,compared to 59%). Fig. 6 shows individual types of adverse conse-quences reported by those who only obtained advice in person, andthose who used only telephone advice. However, there were differ-ences by proximity to adviser (Fig. 7).
Respondents who were five miles or more from CLS civil con-tract/Quality Mark advisers were most likely to use only telephoneadvice, doing so for over 58% of main survey problems. This com-pared to 49% for those between 2 and 5 miles from advisers andless than 37% for those less than 2 miles from advisers. As onlymain survey data relating to problems where advice was obtainedwere examined, numbers are relatively small (n = 403), particularlyfor those over five miles from advisers (n = 24). As a result, the fur-ther impact of use of motorised transport could not be examined interms of mode of advice.
5. Discussion
It has been shown that even though the vast majority of peoplehave at least one advice provider within a relatively close proxim-ity, a significant proportion are unable to recognise their presenceraising the fear that if these services are unknown, they are likelyto be unused. The study found that specific groups were notablyless likely to be able to identify advice providers, for example,when looking at ethnicity, it was evident that black respondentsin particular, were significantly less likely to be aware of any local
advice providers, as were those without access to personal trans-port. In relation to family type, respondents from cohabitating withchildren households demonstrated very low levels of awarenesswhen compared to other family types. The unequal level of aware-ness is reminiscent of specific respondent groups’ susceptibility orvulnerability to experience civil justice problems and how they aredealt with.10
There appear to be some overlaps between findings concerningawareness of local advice supply and the broader concept of cogni-tive mapping. This latter concept refer to the process ‘‘composed ofa series of psychology transformations by which an individual ac-quires, codes, stores, recalls, and decodes information about therelative locations and attributes of phenomena in his everyday spa-tial environment” (Downs and Stea, 1973, p. 11). Literature sug-gests that cognitive mapping may be conditioned by inter-groupcharacteristics (Banerjee and Baer, 1984; Mondschein et al.,2006), which, as it would appear within this study, would manifestin differences in spatial awareness of services between differentpopulation sub-groups. This is clearly exemplified when compar-ing differences in awareness of respondents with and without ac-cess to personal transport who were not only more like to beable to identify an advice provider nearby, but were also morelikely to perceive the existence of an advice provider nearby, whennone were apparent.
Levels of awareness also differed considerably among specificorganisation types – awareness of Law Centres was noticeably low-er when compared to either of the other two services respondentswere questioned about. It is likely that as the least widespread ofthe organisations, respondents are simply unfamiliar with theLaw Centre brand and its function. Interestingly, respondents in re-ceipt of welfare benefits were more able to identify Law Centresthan other respondents. It could be speculated that this is a reflec-tion of this not-for-profit organisation’s target client group.
When looking at proximity to adviser generally, there was littleto suggest that distance between respondents and their closest ad-viser affected their decision to obtain advice. However, distancedid have an effect when coupled with access to personal transport.Having transport moderated barriers to accessing advice servicesput up by distance. More generally, this finding is in line withthe impact of having access to personal transport on people’s abil-ity to use other key services, such as accessing General Practitio-ners (see Ruston, 2002). Those furthest away from an adviser andwithout transport not only fail to obtain advice more, but also‘do nothing’ to resolve their problems (rather than handling alone),at a higher rate. This is of particular concern in the context of tar-geted public services, given that having personal or householdtransport is inherently linked to income – with the poorest house-holds being considerably more unlikely to have private transportavailable (Department for Transport 2005). It also links with theincreasingly recognised role of poor availability of transport in pre-cipitating and prolonging social exclusion (Centre for TransportStudies. and Macdonald, 2001; Social Exclusion Unit, 2003). Inthe context of legal aid services, this presents the danger that vul-nerable people who live at a distance from advice services and donot have their own transportation (or a sufficiently affordable andconvenient public transport substitute), may be less likely to accessthe services they require to resolve their problems.
2094 A. Patel et al. / Geoforum 39 (2008) 2084–2096
Of those respondents who sought advice despite living five ormore miles away from an adviser, relatively few accessed their ad-vice in person. This suggests that delivery of advice through tele-phone services can play an important role in mitigating thespatial obstacles to advice. The evaluation of the LSC’s telephoneadvice pilot reported that 30% of users cited distance, disabilityor mobility problems as the reason for their choosing the service(Hobson and Jones, 2004). However, telephone advice may not al-ways represent an effective alternative to face-to-face advice. Thesame evaluation also concluded that:
‘‘Telephone advice is not suitable for all clients and all prob-lems. Clients need to be able to fully understand the advicethat is given over the telephone; and the adviser needs tobe able to discern the facts of the case and take properinstructions over the telephone or by correspondence. . .Thecapabilities of the client influence the complexity of problemthat can be dealt with.” (p. 10)
An independent assessment of US telephone services carried out byPearson and Davis (2002) also suggested that such services mightnot be useful for all people. From their study of people who hadused a telephone service, respondents with lower education levels,language difficulties, on lower incomes, and who had suffered fromfamily breakdown were the least likely to benefit from such ser-vices, obtaining fewer favourable outcomes.
While our finding that people accessing telephone advice tendto be facing less severe problems does not mean that face-to-faceadvice is essential in the case of more severe problems, it doespoint to people’s preferences and the potential limitations ofsubstituting telephone advice for face-to-face advice.
General concerns have been raised about providing ‘partial’ le-gal services to those unable to gain ‘full-service representation’(Bickel, 2006). However, as Echols and Gordon (2003) have argued,this remains one of the primary rationales for the setting up of tele-phone services. In the United States, they suggest telephone ser-vices tend to serve one of two purposes: ‘‘providing information,advice, and similar services to people who do not need full-servicerepresentation; and providing advice as a fall back to people whoneed but cannot be provided with full-service representation”(Echols and Gordon, 2003, p. 16).
Alongside telephone services Internet solutions could also pro-vide an alternative mechanism to deliver advice. Findings showedthat people are increasingly referring to the Internet when facedwith a civil justice problem, though it is currently infrequentlyused to obtain substantive advice. While the Internet may lackthe immediacy of obtaining advice from telephone or face-to-faceservices; an important consideration for those whose problemmay require timely intervention, it offers a highly fertile mediumby which to deliver advice. However, the Internet’s relative infancycoupled with the legal and advice sector’s hesitance to embrace it(particularly as a tool to deliver, as opposed to raise awareness of,services) is likely to have contributed to the relatively slow devel-opment of such services to date (Douglas et al., 2004).
Developing telephone and internet services into a comprehen-sive vehicle for delivering advice and effectively disseminatinginformation about services to hard to reach and isolated groups,would almost certainly redress some of the imbalance in obtainingadvice faced by those with poor physical access to face-to-face ad-vice services.
Even then, over-reliance on telephone or Internet based servicescan overlook the particularly hard to reach, who may not have ac-cess to a telephone or the Internet or for whom the use of suchthings is prohibitively expensive. In some instances, telephoneand Internet services may not be able to replicate the full benefitsof a face-to-face service. One possible solution for such groups
would be to have dedicated outreach services able to deliverface-to-face advice via a roaming adviser, either by visiting a clientat their home or by delivering advice from a more convenient loca-tion to the client, for example East Dorset CAB which runs an out-reach service to clients in three GP surgeries in rural Dorset(Citizens Advice, 2005). A variant of the outreach model that har-nesses the full capabilities of ICT involves having ‘nested’ serviceswithin locations already familiar to potential clients. These servicesare able to provide advice remotely via video conferencing andother internet and computer based solutions to numerous loca-tions, such as family centres and local libraries (Zacaroli, 2007),combining the benefits of delivering advice to hard to reach groupsin a safe, comfortable environment without limiting access toirregular hours or requiring specialist advisers to travel for ex-tended periods of time. Such services are a relatively new aspectof advice provision and, as yet, largely untested. They nonethelessappear to have the potential to overcome some of the barriers toobtaining advice.
6. Conclusion
The objective of this paper was to investigate the extent towhich awareness of local advice services and the proximity to suchservices, affects how individuals respond when faced with a civil orsocial justice problem.
It shows that as an element of accessibility, pre-existing knowl-edge of the location of advice providers played little part. Never-theless, while there was no indication of awareness affecting arespondent’s decision whether or not to seek advice overall, thegeneral lack and uneven spread of awareness amongst respon-dents, may suggest a need for active and specific engagement withdistinct populations by the advice sector to raise its profile.
Clear behavioural changes were evident as distances betweenadviser and respondents increased. Service utilisation did not, gen-erally speaking, decline as distances increased, but it did affect themanner in which contact with an advice service was initiated, andthen maintained. As one would expect, the use of the telephone be-came more common as distances increased, thus apparently offer-ing an alternative to face-to-face service in areas with sparseadvice service coverage; whether this substitution of mode of ser-vice delivery is suitable in all circumstances remains unclear. De-spite proximity having little impact upon whether an individualsought advice or not in general, the study drew attention to thedisadvantage faced by those people that do not live near a main-stream adviser and without access to personal transport, who weremore likely to do nothing when faced with a civil justice problem.Findings concerning this minority group suggest that more directengagement may be required to overcome the isolation they expe-rience than simply relying on telephone or Internet services alone.
In common with existing literature on access, the study con-firms that while proximity may effect how individuals interactwith advice services; it is only one of many factors determiningaccessibility to advice. However, the study empirically demon-strates for the first time that differences in responses to problemsare to some extent attributable to physical distance and servicelocation and that more broadly, that the application of geographicdoctrines may apply equally to advice sector services as they dowith other service (for example, health related services, financialservices, etc.).
6.1. Future research
This study has demonstrated that spatial factors do influencewhether or not individuals respond when faced with a civil justiceproblem and how they would go about doing so. It has shown that

A. Patel et al. / Geoforum 39 (2008) 2084–2096 2095
those particularly isolated from advice services do, in fact, behavedifferently, often to their detriment. However, further researchspecifically sampling isolated groups in rural locations, and partic-ularly those with poor transport/mobility would be necessary togive a comprehensive measure of the true impact of poor physicalaccess to advice services. Future incarnations of the survey willseek to gather more detailed data about respondents’ travel behav-iour and their geographic relationship with advice suppliers. Indoing so, it will hopefully provide a more reflective understandingof what is meant by access to advice.
References
Abel, R.L., 1988. The Legal Profession in England and Wales. Basil Blackwell, Oxford.Balmer, N.B., Pleasence, P., Buck, A., Walker, H.C., 2005. Worried sick: the experience
of debt problems and their relationship with health, illness and disability. SocialPolicy & Society 5 (1), 39–51.
Banerjee, T., Baer, W.C., 1984. Beyond the Neighbourhood Unit: ResidentialEnvironments and Public Policy. Plenum Press, New York.
Bibby. P., Shephard, C., 2005. Developing a new classification of urban and ruralareas for policy purposes – the methodology. London, Office for NationalStatistics: <http://www.statistics.gov.uk/geography/downloads/Methodology_Report.pdf>.
Bickel, R., 2006. Limited legal services: is it worth it? Columbia Journal of Law andSocial Problems 39, 331–374.
Birkin, M., Clarke, G., Clarke, M., Wilson, A., 1996. Intelligent GIS: Location Decisionsand Strategic Planning. Geoinformation International, Cambridge.
Blacksell, M., 1990. Social Justice and access to legal services: a geographicperspective. Geoforum 21 (4), 489–502.
Blacksell, M., Economides, K., Watkins, C., 1991. Justice Outside the City: Access toLegal Services in Rural Britain. Scientific & Technical, Harlow, Longman.
British Medical Association, 2003. Housing and Health: Building for the Future.London, British Medical Association.
Buck, A., Pleasence, P., Balmer, N.J., 2005. Social exclusion and civil law: experienceof civil justice problems among vulnerable groups. Social Policy andAdministration 39 (3), 302–322.
Buck, A., Pleasence, P., Balmer, N.J., O’Grady, A., Genn, H., 2004. Lone parents andcivil law: their experience of problems and their advice seeking behaviour.Social Policy and Administration 38 (3), 253–269.
Carter, P., 2006. Legal Aid: A Market-Based Approach to Reform. Department forConstitutional Affairs, London.
Centre for Transport Studies, Macdonald, M., Institute for Transport Studies, 2001.Social Inclusion: Transport aspects study for DfT economics and Local Transportand General Division. London, Department for Transport.
Chung, R., Donaldson, D., Herring, I., McColl, H., Snow, J., Cockerham, J., Ellerd-Elliott,S., Hirani, B., Shome, J., 2004. Family Resources Survey. Department for Workand Pensions, London.
Citizens Advice, 2005. Prescribing Advice: Improving Health through CAB AdviceServices. Springer, Berlin.
Currie, A., 2007. Civil justice problems and the disability and health status ofCanadians. Journal of Law and Social Policy 21, 31–48.
Department for Constitutional Affairs, 2006. Getting Earlier Better Advice toVulnerable People. Springer, Berlin.
Department for Transport, 2005. Focus on personal travel. London, TSO.Deas, I., Robson, B., Wong, C., Bradford, M., 2003. Measuring neighbourhood
deprivation: a critique of the Index of multiple deprivation. Environment andPlanning C: Government and Policy 21, 883–903.
Dignan, T., 2006. Northern Ireland legal needs survey. Northern Ireland LegalServices Commission, Belfast.
Downs, R.M., Stea, D., 1973. Cognitive maps and spatial behaviour: process andprocedures. In: Downs, R.M., Stea, D. (Eds.), Image and environment: Cognitivemaps and spatial behaviour. Aldine Transaction, New Brunswick.
Douglas, A., Muir, L., Meehan, K., 2004. E-quality in the e-services provision of legalpractices. Managing Service Quality 13 (6), 483–491.
Drentea, P., 2000. Age, debt and anxiety. Journal of Health and Social Behaviour 41(4), 437–450.
Drentea, P., Lavrakas, P.J., 2000. Over the limit: the association among health, raceand debt. Social Science Medicine 50 (4), 517–529.
Echols, R., Gordon, J., 2003. Recommendations and thoughts from the managers ofthe hotline outcomes assessment study project. Management InformationExchange Journal 9, 9–18.
Economides, K., Blacksell, M., Watkins, C., 1986. The spatial analysis of legalsystems: towards a geography of law. Journal of Law and Society 13 (2), 161–181.
Field, K.S., Briggs, D.J., 2001. Socio-economic and location determinants ofaccessibility and utilization of primary health-care. Health and Social Care inthe Community 9 (5), 294–308.
Fone, D.L., Christie, S., Lester, N., 2006. Comparison of perceived and modelledgeographical access to accident and emergency departments: a cross-sectionalanalysis from the Caerphilly Health and Social Needs Study. InternationalJournal of Health Geographics 5 (16), 16–25. <http://www.ij-healthgeographics.com/content/5/1/16>.
Foster, K., 1973. The location of solicitors. The Modern Law Review 36 (2), 153–166.Genn, H., 1999. Paths to Justice: What People Do and Think about Going to Law.
Oxford, Hart.Genn, H., Paterson, A., 2001. Paths to Justice Scotland: What People in Scotland Do
and Think about Going to Law. Oxford, Hart.Gibbins, C., 2004. Family Spending: A Report on the 2003–04 Expenditure and Food
Survey. The Stationery Office, London.Graham, S., 1998. The end of geography and the explosion of place? Conceptualizing
space, place and information technology. Progress in Human Geography 22 (2),165–185.
Goldstein, H., 2003. Multilevel statistical modelism, third ed. Arnold, London.Guagliardo, M.F., 2004. Spatial accessibility of primary care: concepts, methods, and
challenges. International Journal of Health Geographics 3 (1), 3–15. <http://www.ij-healthgeographics.com/content/3/1/3>.
Hanson, S., Pratt, G., 1988. Reconceptualizing the link between home and work inurban geography. Economic Geography 64 (4), 299–321.
Hobson, J., Jones, P., 2004. Telephone advice pilot. In: Legal Services Commission(Ed.), Improving Access to Advice in the Community Legal Service: Report onEvaluation Research on Alternative Methods of Delivery. London. Legal ServicesCommission.
Ignite Research, 2006. Report on the 2006 national survey of unmet needs andaccess to services. Legal Services Agency, Wellington (New Zealand).
Joseph, A.E., Phillips, D.R., 1984. Accessibility and Utilisation – GeographicalPerspective on Health Care Delivery. Harper & Row, New York.
Kenyon, S., Lyons, G., Rafferty, J., 2002. Transport and social exclusion: investigatingthe possibility of promoting inclusion through virtual mobility. Journal ofTransport Geography 10 (3), 207–219.
Khan, A.A., 1992. An integrated approach to measuring potential spatial access tohealth care services. Socio-economic Planning Science 26 (4), 275–287.
Kwan, M.-P., 1998. Space-time and integral measures if individual accessibility: acomparative analysis using a point-based framework. Geographic Analysis 30(3), 191–217.
Legal Services Commission, 2005. Making Legal Rights a Reality: The Legal ServicesCommission’s Strategy for the Community Legal Service, vol. 1, London, LegalServices Commission.
Lord Chancellor’s Department, 2003. Departmental Report 2002–2003. Norwich,The Stationery Office.
Luo, W., Wang, F., 2003. Measures of spatial accessibility to health care in a GISenvironment: synthesis and a case study in the Chicago region. Environmentand Planning B: Planning and Design 30 (6), 865–884.
Mayson, S., 2007. Legal Services Reforms: Catalyst, Cataclysm or Catastrophe?Inaugural Lecture at the Legal Services Policy Institute, London, 21 March 2007.
Maxwell, G.M., Smith, C., Shepherd, P.J., Morris, A., 1999. Meeting Legal ServiceNeeds. Victoria University of Wellington, Wellington.
Mondschein, A., Blumenberg, E., Taylor, B.D., 2006. Cognitive mapping, travelbehaviour, and access to opportunity. Transportation Research Record 1985,266–272.
Mulherin, G., Coumarelos, C., 2007. Access to justice in disadvantaged communities.In: Pleasence, P., Buck, A., Balmer, N. (Eds.), Transforming Lives: Law and SocialProcess. TSO, London.
Nettleton, S., Burrows, R., 1998. Mortgage debt, insecure home, ownership andhealth: an explanatory analysis. Sociology of Health and Illness 20 (5), 731–753.
O’Grady, A., Balmer, N.J., Carter, B., Pleasence, P., Buck, A., Genn, H., 2005.Institutional racism and civil justice. Ethnic and Racial Studies 28 (4),620–628.
Ofcom, 2006. The Communications Market 2006. London, The Stationery Office.Pearson, J., Davis, D., 2002. The hotlines outcomes assessment study final report –
Phase 3: full scale telephone survey. Denver, Centre for Policy Research.Phelps, A., Hayward, B., Hanson T., 2005. 2004 English and Welsh Civil and Social
Justice Survey: Technical report. London. BMRB.Pleasence, P., 2006. Causes of Action: Civil Law and Social Justice, second ed. TSO,
Norwich.Pleasence, P., Balmer, N.J., 2007. Mental Health and the Experience of Problems
Involving Rights. People, Place and Policy Online 2(1), pp. 4–16. <http://extra.shu.ac.uk/ppp-online/issue_1_300108/documents/mental_health_housing_problems_rights.pdf> (accessed 08.02.08).
Pleasence, P., Balmer, N.J., Buck, A., O’Grady, A., Genn, H., 2004a. Civil law problemsand morbidity. Journal of Epidemiology and Community Health 58 (7), 552–557.
Pleasence, P., Buck, A., Balmer, N.B., O’Grady, A., Genn, H., Smith, M., 2004b. Causesof Action: Civil Law and Social Justice, first ed. TSO, Norwich.
Rasbash, J., Steele, F., Browne, W., Prosser, B., 2004. A User’s Guide to MlwiN(version 2.0). Institute of Education, London.
Reading, R., Reynolds, S., 2001. Debt, social disadvantage and maternal depression.Social Science and Medicine 53 (4), 441–453.
Rose, G., 1993. Feminism and Geography: The Limits of Geographical Knowledge.University of Minnesota, Minneapolis.
Rose, G., 1997. Situating Knowledges: Positionality, Reflexivities, and Other Tactics.Progress in Human Geography 21 (3), 305–320.
Ruston, D., 2002. Difficulty in accessing key services. London, National Statistics.<http://www.statistics.gov.uk/downloads/theme_social/access_key_services/access_to_services.pdf> (accessed 05.03.08).
Sandbach, J., 2004. Geography of Advice: An Overview of the Challenges Facing theCommunity Legal Service. Citizens Advice, London.
Schuurman, N., Pratt, G., 2002. Care of the subject: feminism and critiques of GISgender. Place and Culture 9, 291–299.

2096 A. Patel et al. / Geoforum 39 (2008) 2084–2096
Social Exclusion Unit, 2003. Making the Connection: Final Report on Transport andSocial Exclusion. Social Exclusion Unit, London.
Social Exclusion Unit 2004. Health and debt. London, Office of the Deputy PrimeMinster. In: Taylor, D.R., (Ed.), Policy Issues in Modern Cartography. Oxford,Pergamon.
The Royal Commission on Legal Services, 1979. Final Report: Cmnd. 7648. London,Her Majesty’s Stationery Office.
Weber, J., 2003. Individual accessibility and distance from major employmentcentres: An examination using space–time measures. Journal of GeographicSystems 5 (1), 51–70.
Weber, J., Kwan, M.-P., 2002. Bringing time back in: a study on the influence oftravel time variations and facility opening hours on individual accessibility. TheProfessional Geographer 54 (2), 226–240.
Weber, J., Kwan, M.-P., 2003a. Evaluating the effects of geographic contexts onindividual accessibility: a multilevel approach. Urban Geography 24 (8), 647–671.
Weber, J., Kwan, M.-P., 2003b. Individual accessibility revisited: implications forgeographical analysis in the twenty-first century. Geographical Analysis 35 (4),341–353.
Working Party of the Royal College of General Practitioners, 1972. The futureGeneral Practitioner. Learning and Teaching. London, Royal College of GeneralPractitioners.
Yapa, L., 1998. Why GIS needs postmodern social theory, and vice versa. In: Taylor,D.R. (Ed.), Policy Issues in Modern Cartography. Oxford, Pergamon, pp.233–247.
Zacaroli, M., 2007. Legal Eagles on the Net. The Oxford Times, 18 May.


