financial literacy, overconfidence and financial advice ... annual meetings/2015-… · financial...
TRANSCRIPT

1
FINANCIAL LITERACY, OVERCONFIDENCE
AND FINANCIAL ADVICE SEEKING
Marc M. Kramer1
University of Groningen
This version: December 19, 2014
Abstract: This study examines whether financial literacy and overconfidence relate to financial
advice seeking. We use both the Dutch DNB Household Survey (DHS) and a random sample of
retail investors from a large Dutch bank. The data suggest that confidence in ones‘ own literacy is
negatively associated with asking for help, while actual expertise does not relate to advice-seeking.
This implies a role for overconfidence. Indeed, our estimations confirm that a higher degree of
overconfidence relates to lower demand for advice. These results are robust for the inclusion of
various investor preferences, trust and cognitive abilities, and controlling for endogeneity of
financial literacy. We confirm the role of overconfidence by showing that overconfidence only
matters for male subjects. In addition, overconfidence relates to believes on benefits of financial
advisors in the expected direction. More overconfident investors rate their investment skills,
knowledge and information as higher compared to a financial advisor; while they perceive
investing on their own as less risky with more control.
Keywords: household financial decision making, financial advice, financial literacy,
overconfidence
JEL-Codes: D14, D81, D83, G11, G24.
1 Marc M. Kramer is researcher at the University of Groningen, Faculty of Economics and Business,
Department of Economics, Econometrics and Finance, email: [email protected]. I thank Werner de Bondt
and other participants at the seminar held at DePaul University on 12 March 2013. Frans Tempeleaar, Auke
Plantinga, Niels Hermes, Arvid Hoffman and Wim Westerman provided useful feedback on earlier versions
of this paper.

2
1. Introduction
Understanding the demand for, and impact of, financial advice is an important and understudied line
of inquiry. Recent studies indicate that demand for financial advice may be driven by financial literacy
(Calcagno and Monticone, 2014). This is an important finding, given that financial illiteracy is
widespread and adversely affects the quality of financial decision making (Lusardi and Mitchell,
2011). The use of a financial expert who provides unbiased advice may in principle ameliorate
negative effects of financial illiteracy.
In reality however, two factors undermine this potential benefit. First, advisors may provide biased
advice because a typical advisor’s incentive structure creates a conflict of interest (Mullainathan et al.,
2012). Second, some authors (Calcagno and Monticone, 2014; Collins, 2012) indicate that more
literate investors demand financial advice more, which implies expert advice as a complement rather
than a substitute for financial literacy. This latter finding is not undisputed, however. Other studies
find a negative or no relationship between professional financial advice seeking and financial literacy
(Hung and Yoong, 2010; Von Gaudekker, 2014). Interestingly, studies that use measured financial
literacy typically find a positive (or no) relationship, while studies that use self-assessed financial
literacy find a negative relationship. This could imply a role for overconfidence in advice seeking
behavior (Guiso and Jappelli, 2006).
The exact relationship between various measures of financial literacy and financial advice seeking
thus remains an open question that deserves more inquiry. Knowledge about this relationship gained
prominence in light of recent regulatory measures in many countries to limit the possibility of
misselling, which appears especially relevant for the less wary. Our study relates the choice for expert
financial help to both measured and perceived financial literacy and to overconfidence, which is the
discrepancy between the two. Overconfidence is typically defined as an unwarranted confidence in
one’s own knowledge and may therefore be especially relevant in asking for expert help when
making financial decisions. Heath and Tversky (1991) posit that people are more willing to act on
their own judgments when they perceive themselves as more competent.
We use two data sources. The first is based on the Dutch DNB Household Survey (DHS), which
represents a representative sample of Dutch households and provides information on a broad range of
financial and socio-demographic characteristics. In 2005 a special financial literacy module was added
to the survey that was completed by 1,508 households (see: Van Rooij et al., 2011a). The second is
based on a survey of a randomly selected, representative sample of retail investors at one of the largest
Dutch banks. This survey was completed by 467 investors in 2011. We are able to combine this
survey with client data registered by the bank.

3
Our main finding are as follows. We find a strong and significantly negative association between self-
assessed financial literacy and the choice to ask for expert help, while we find no such relationship for
measured financial literacy. This discrepancy between the role of actual and self-assessed financial
knowledge implies a role for overconfidence. Indeed, our estimations show that more overconfident
investors demand advice less. We confirm this result by presenting evidence that overconfidence
matters only for males and not for females, consistent with prior evidence that overconfidence in
financial matters is a typical male trait. In addition, overconfidence relates strongly to the agreement
on statements about perceived benefits of advised and self-directed investing. More overconfident
individuals perceive more control and less risk in self-directed investing, while they rate their
investment skill, knowledge and information higher compared to a financial expert. These findings are
in line with the recent study by Von Gaudekker (2014). He finds that most diversification losses are
incurred by overconfident investors, i.e. investors that neither are financially literate nor turn to
professional financial advice. The findings are also in line with the competence hypothesis (Heath and
Tversky, 1991) which posits that people are more willing to act on their own judgments when they
perceive themselves as more competent.
Our study distinguishes itself from related studies in four ways. First, we explicitly relate the
discrepancy between measured and self-perceived financial literacy (which we label overconfidence)
as a factor that helps to explain advice seeking behavior. Second, we focus both on general households
as well as investors. Financial literacy may have different effects on behavior for those who participate
in financial markets and those who don’t. In addition, it makes the comparison of our two datasets
more straightforward. Third, our retail bank dataset combines survey data and client data from the
bank. That allows us to observe actual choices investors make (e.g. expert advice seeking), and to
perform various checks on other variables (e.g. portfolio size and allocations). Fourth, we control for a
plethora of controls in order to limit the possibility that our results are driven by omitted variables.
Apart from the usual socio-economic characteristics, we use data on investor’s preferences, trust, and
cognitive abilities.
Our findings have important implications for policymaking. First, policy makers should be aware that
financial expert advice cannot be treated as the sole mechanism to help those who need it the most: the
low literate and overconfident individuals. Second, financial institutions should be aware that client
profiling with respect to self-reported financial literacy may not capture actual financial literacy, but
may rather indicate overconfidence.
2. Literature Review
Abundant evidence indicates that many households make suboptimal financial decisions. A major
cause of suboptimal financial decision making is a limited degree of financial literacy. Less financial
literate have been found to save less, accumulate more debt, have higher mortgage delinquency rates,

4
plan less for retirement, and accumulate less wealth (Lusardi and Mitchell, 2007b; Van Rooij et al.,
2011b, 2012). Other researchers specifically relate financial literacy to the quality of investment
decisions. Biased behaviors such as the disposition effect, low stock market participation, and
insufficient diversification have been found more prevalent among those with lower financial literacy
(Van Rooij et al., 2011a; Dhar and Zhu, 2006). Our study therefore uses both samples of general
households as well as investors.
The use of a financial expert may in principle ameliorate the negative effects of financial illiteracy and
improve financial decision making. A large fraction of retail investors rely on financial advice. In the
United States, 81% of the households investing in mutual funds, outside a retirement plan, rely on a
financial advisor (ICI, 2007), and 75% of them consult financial advisors before conducting stock
market or mutual fund transactions (Hung and Yoong, 2010). Bluethgen et al. (2008) indicate that
roughly 80% of individual investors in Germany turn to financial advice for their investment
decisions, and in the Netherlands, 51% of households with an investment portfolio rely on financial
advice (Millward Brown, 2010).
Two channels may drive the potential mitigation of limited financial literacy through financial
assistance. First, those with lower levels of financial literacy may be more inclined to turn to financial
experts. Second, if advice is of high enough quality, the impact of advice for less financially literate
households may still be positive even in the case of lower demand. Whether financial expert
intervention indeed benefits investors remains up for debate (Bergstresser et al., 2009; Hackethal et
al., 2012; Kramer, 2012), despite some consensus that it can improve retail investor portfolio
decisions if conflicts of interest are minimized (Bhattacharya et al., 2012; Hung and Yoong, 2010).
Recently, regulators in various countries explicitly prohibit incentives that drive biased advice (e.g. the
new legislation to prohibit commissions for brokers and advisors in the Netherlands and in the UK).
Therefore, the first channel, which is the main focus of this paper, becomes of greater importance.
The relationship between advice-seeking propensity and financial literacy has recently come under the
attention of academic researchers. A negative relationship follows from the assumption that low
literate have a higher barrier to gather and process information, and may thus save more on
information and search costs by hiring an advisor. In addition, less financially literate households may
be less aware of potential conflicts of interest and therefore less hesitant to consult an advisor (Inderst
and Ottaviani , 2009). Some recent empirical studies provide evidence on such a negative relationship.
Hackethal et al. (2012) find that investors who rely more on financial advice perceive themselves as
less knowledgeable, and in Hung and Yoong’s (2010) choice experiment, less sophisticated people
were more likely to take advice. Similarly, in a survey, respondents who considered themselves more
financially literate preferred more autonomy in their pension decisions (Van Rooij et al., 2007). Guiso
and Japelli (2006) also find that investors who spend more time acquiring financial information

5
delegate their financial decisions less. And, Georgarakos and Inderst (2011) suggest that advice
matters most for households with low financial capability and trust in advice. Hackethal et al. (2012)
confirm that investors who rely more on financial advice perceive less conflict of interests.
This negative relationship between advice-seeking propensity and financial literacy is not ambiguous,
though. Calcagno and Monticone (2014) and Collins (2010) consider that financial literacy and
financial advice are complements rather than substitutes. Bucher-Koenen and Koenen (2011) state that
more literate investors make more use of advisors because they can induce advisors to provide better
advice. In addition, more sophisticated investors might have higher advice-seeking propensities
because of their higher opportunity costs of time. In line with this view, Van Rooij et al. (2011a) find
that people who are less financially literate rely more on informal sources of financial advice, such as
friends and family. The finding that less literate people rely less on advice also resonates with
psychological literature, which indicates that less knowledgeable people lack the ability to recognize
their illiteracy, leading them to overestimate their ability and not seek advice (Kruger and Dunning,
1999).
In summary, the exact relationship among financial literacy and the propensity to seek professional
financial advice is still unclear. Part of the explanation for the ambiguous results, may lay in the proxy
for financial literacy. Studies that use self-assessed financial literacy typically find a negative
relationship with advice seeking, while those that use measured financial literacy report a positive or
no relationship. This discrepancy between the role of self-assessed and measured financial literacy
implies a role for overconfidence. Some authors indeed relate overconfidence to financial advice
seeking. The model from Guiso and Japelli (2006) predicts that overconfident investors are less
willing to rely on information provided by financial advisors, banks or brokers and more likely to
collect information directly because they believe that self-collected information is of better quality
than it actually is. As a result overconfident investors perform less. In the recent study by Von
Gaudekker (2014) most losses from insufficient diversification are obtained by overconfident
investors, which neither are financially literate nor go to financial advisors.
3. Data and Methods
3.1. The DNB Household Survey
We use the data from a special financial literacy module that was added to De Nederlandsche Bank
(DNB) Household Survey (DHS) in 2005. DHS is a representative panel of Dutch households that
contains more than 2,000 households. It provides detailed information of financial and demographic
characteristics. In 2005 an extra module was added to the survey containing a set of financial
knowledge questions. 1,508 households responded to these financial literacy questions, which implies
a response rate of 74%. In Van Rooij et al., (2011a) this dataset is extensively discussed.

6
The dataset is considered as of high quality. Attrition is dealt with by biannual refreshment of
participants. Surveys take place through the internet. Although the Netherlands has one of the highest
internet access rates in the world, potential bias may result from lack of internet access. Households
that have no internet connection are provided with a set-top box for a television.
Our final sample consists of 1,276 households. These are households that both participated in the
literacy survey and for which professional advice seeking propensity is known. To be better able to
compare the DHS sample with our second sample (discussed in the next section), we also provide
statistics and analysis on the subset of households that hold risky assets (stocks, bonds and/or
mutual funds), throughout this paper. We refer to this subset as investors. This procedure
dramatically reduces the sample size to 354 households.
3.2. The Retail Bank Sample
To construct our retail bank sample, we used two data sources. First, we obtained detailed information
about a randomly selected sample of retail investors from a large Dutch bank. The bank provided us
with information about each client’s financial assets, and type of investment service chosen (execution
only, investment advice, or delegated portfolio management). Second, we surveyed these investors
with an e-mailed questionnaire, sent in October 2011 and then repeated after two weeks for investors
who had not responded. If investors had no e-mail address listed, we sent them an invitation to
participate through postal mail2, sent on the same day as the e-mail invitation but without any
reminder. Of the 4,586 randomly selected investors, 251 could not be reached due to e-mail bounces.
We received completed surveys from 467 investors, for a net response rate of 10.8%.
The bank that provided the data is one of the largest retail banks in the Netherlands. Many services are
sold through account managers, private bankers, retail advisors, or the internet. Its services and
products include checking accounts, savings, mortgages, insurance, business loans, investments,
private equity, leasing, and pensions. Because we obtained data from just one retail bank, we took
great caution to ensure that our sample of respondents was both internally and externally valid.
Table I provides an overview of some key statistics for both samples. The average age in the DHS
sample is almost 51 years, and a little older (54 years) for investors, similar to the retail bank sample.
A little more than half the respondents in the DHS and almost 70% of the subset of investors are male.
In the retail bank sample, males comprise an even larger fraction (73%) , especially so for respondents
(79%). The amount of liquid assets (which consist of checking, savings and investment accounts) are
almost €30,000 for DHS respondents, and more for the investor subsample (over €75,000). Investors
2 For both e-mail and postal invitations, participants answered the questions in a web-based environment.
Stanton and Rogelberg (2001) warn that web-based surveys may suffer from the so-called digital divide, in
that some groups have much less Internet access. The Netherlands has one of the highest Internet access
rates in the world, so it is unlikely to be a problem.

7
at the retail bank have lower liquid assets (€66,000), but this statistic is likely downward biased, given
that people may have liquid assets at other banks too. Comparing some broad portfolio allocation
statistics, we note that in our samples between 22%-30% is allocated to individuals stocks, 9%-17% to
bonds, and 47%-49% to mutual funds.
We observe some significant differences in the investor and portfolio characteristics between
respondents and non-respondents in the retail bank data, and between our full retail bank sample the
full DHS sample. However, we do not believe that our primary results are driven by sample selection
bias for two reasons. First, our main results are consistent for all our samples and the DHS sample has
been designed as to provide an accurate representation of the Dutch population. Second, as a
robustness test for the retail bank sample we also estimated all our models using post stratification
weighting on age, gender and portfolio value. Also then, all reported findings in this study remain
intact.
[TABLE I HERE]
3.3. Construction of Key Variables
3.3.1. Financial Expert Advice Seeking
DHS Sample
Our main dependent variable is whether or not households seek out professional financial advice. We
created a dummy variable based on the following question: “What is the most important source of
advice when you have to make important financial decisions for the household?”. We assigned a [1] to
those who answered “Professional financial advisors”, and [0] to all others. In our sample 375
respondents (29.4%) indicated professional advisors as their main source of advice. Other frequently
mentioned advice sources include: parents, friends and acquaintances (17%) and the internet (15%).
Retail Bank Sample
The retail bank organizes its investment services as follows: All investors may open an execution-only
account after establishing the legally required client profile. The execution-only channel implies that
investors do not receive any advice; they have their trades executed by means of internet or telephone.
Clients may receive a warning though, when a proposed trade is not in line with their client profile,
but can still have the trade executed.
Clients with less than €20,000 available for investments have only the execution-only option. Those
with more than €20,000 available may choose: they opt for execution-only, or for some sort of
financial expert assistance: either by means of financial advice or delegated portfolio management.
This choice is registered by the bank, and clients can only trade through the department of this
registered choice. We construct our advice seeking dummy from this information: we assign a [1] to

8
those investors who opt for some sort of expert assistance, and [0] for those who in the execution-only
channel. Given that investors that have less than €20,000 available can trade only though the
execution-only channel, we excluded them from our survey. Some execution-only investors in our
sample indicated to receive professional financial advice from another retail bank. We added them to
the expert advice seeking group, rather than the execution-only group. Our final sample consist of 320
respondents (68.5%) that received professional financial advice, and 147 (31.5%) that opted for
execution-only.
3.3.2. Measurement of Financial Literacy and Overconfidence
Measured Financial Literacy
The DHS contains 16 questions to assess financial literacy. The 5 basic questions relate to financial
numeracy while the 11 more advanced questions relate to knowledge of financial instruments and
concepts (Von Gaudekker, 2014). Given our focus on financial knowledge, we focus on the 11
advanced questions only. The questions relate to important elements of adequate investment decision
making: the differences between saving accounts, stocks, and bonds, the function of the stock market,
the relationship between interest rates and bond prices, how diversification works, and the use of
mutual funds. Please refer to appendix A for the exact wording of the literacy questions.
In table II we provide an overview of the distribution of correct answers. The average respondent
answered approximately 6 questions correctly (55% of all questions). The group that used
professional financial advisors as their main source of information scored almost identical than other
households (6.10 vs 6.06 correct answers). Not surprisingly, the subsample of investors performed
much better with on average about 7.5 correct answers (68% of all questions).
In our retail bank survey we use the same advanced questions from the DNB Household Survey.
However, to keep the survey at a manageable length, we exclude three questions that require very
similar knowledge. These eight remaining questions have been well validated as having good internal
consistency and test–retest reliability (Hung et al., 2009). The retail bank respondents performed
remarkably similar to the investors of the DHS sample. Both advised and self-directed investors
provided correct answers to approximately 70% of the literacy questions on average (see Table II).
[TABLE II HERE]
To obtain a score on financial literacy for each respondent, we perform a factor analysis similar to van
Rooij et al., (2011a) on both our datasets. We also use information contained in the difference between
incorrect answers and “don’t know” answers. Lusardi and Mitchell (2007b) show that those who
answer “don’t know” are different from other respondents: They are less likely to plan and succeed in
a planning effort, even compared with those who give an incorrect answer. We therefore constructed

9
two dummies for each of the questions. The first dummy indicates whether the question was answered
correctly, and the second refers to “don’t know” responses. From a factor analysis of these dummies,
we retained one key factor underlying the level of financial literacy. The Kaiser-Meyer-Olkin test of
sampling adequacy (Kaiser, 1970) returned a value of 0.923 for the DHS sample and 0.823 for our
retail bank sample, which indicates that factor analysis was appropriate. The use of a single factor to
indicate literacy also was confirmed by a scree plot, which displays a point of inflexion after one
factor for both samples (Field, 2005). We use the Bartlett (1937) method to determine factor scores for
each respondent in our sample, which indicate their measured financial literacy. Please refer to
Appendix B for an overview of factor loadings for both samples.
Self-Assessed Financial Literacy
Instead of measuring literacy by means of knowledge questions, some authors rely on self-assessed
financial literacy. People may not be able to assess their actual financial knowledge and thus base their
decisions on how much they think they know. If they think they know more than they actually do,
people exhibit a tendency toward overconfidence. Hung et al., (2009b) find that self-assessed literacy
better predicts financial behaviors than measured financial literacy and Graham et al. (2009) relate
perceived competence to trading behavior and the home bias.
Measured and perceived financial literacy are generally (moderately) positively correlated (Hung et
al., 2009b), and both have some predictive power for estimating stock market participation (Van Rooij
et al., 2011a). Because self-assessed literacy may be more related to actual advice seeking behavior
than our measure of financial literacy, we also asked about perceived literacy to test our predictions.
Specifically, we measure perceived financial literacy using the following questions: “How
knowledgeable do you consider yourself with respect to financial matters?" (DHS survey) and “How
would you assess your own financial knowledge?” (Retail bank survey) and Please refer to appendix
A for more information on the exact wording of these survey questions.
Overconfidence
Overconfidence has been put forward as an explanation for various household behaviors. Odean
(1999) and Barber and Odean (2000) relate overconfidence to excessive trading, excessive risk taking,
and under diversification. Overconfidence relates to various concepts. The miscallibration type of
overconfidence refers to a systematic overestimation of the precision of one’s own knowledge. A
typical finding in miscallibration studies is that people set too narrow confidence intervals for
knowledge questions. The better than average type of overconfidence refers to the phenomenon that
most people rate themselves as better than average individual. A frequently cited example is Svenson
(1981), who shows that 82% of drivers rate themselves in the top 30% of the distribution. Many
studies report similar findings on intelligence, social and leadership skills.

10
Our proxy of overconfidence refers mostly to miscallibration. It measures the degree of self-perceived
literacy that is not explained by actual financial literacy and thus refers to the degree of misjudgment
of one’s own financial knowledge. Specifically, we regress our measure of self-assessed literacy on
the financial literacy index and take the residual as our overconfidence measure. This overconfidence
measure thus indicates whether confidence, conditional on actual knowledge, is higher or lower than
the average individual. In line with previous studies (e.g. Hung and Yuoong, 2010), we find that
although measured financial literacy relates significantly and positively to self-assessed financial
literacy, it only explains a fraction (approximately 20% ) of the variation in self-assessed literacy. It
should be noted that our overconfidence measure captures both underconfidence and overconfidence.
3.3.3. Control Variables
Guiso and Japelli (2006) indicate that men are less willing to delegate their portfolio decisions, which
may relate to their higher level of confidence in financial matters (Barber and Odean, 2000) or their
generally higher degree of financial literacy (Van Rooij et al. 2011b). Hackethal et al. (2012) indicate
that age relates positively and being married negatively to advice seeking. Older investors may opt for
financial advice to compensate for their cognitive aging (Korniotis and Kumar, 2013) and married
couples have their spouse as a sounding board in financial matters. Hung and Yoong (2010) however,
find that being married increases the propensity to seek advice. Hackethal et al. (2012) also find
investment experience relates positively to advice seeking. Elmerick et al. (2002) find that the
likelihood of using a financial planner relates positively income, and wealth. High income households
likely have higher opportunity costs of time, which induces them to ask for assistance, and high
wealth households have the means to pay for professional assistance. The authors also find that the
likelihood of using a financial planner relates positively to educational achievement, arguably because
education increases the awareness for complexity of financial products.
Based on the short discussion above, we decided to include the following socio-economic variables as
controls in our multivariate analysis: gender, age, educational achievement, occupation, household
composition, income, wealth and investment experience.
4. Results
4.1. Financial Literacy, Overconfidence and Financial Advice Seeking: Univariate Results
In Table III we provide an overview of the propensity to seek professional financial advice for various
groups based on financial literacy, overconfidence and socio-economic variables.
[TABLE III HERE]
Panel A of table III shows that differences in advice seeking are only small when our samples are spit
in quartiles based on measured financial literacy. The quartile of most literate households in the DHS

11
sample have an insignificant 1.6% higher propensity to seek advice compared to the quartile of lowest
literate (column 1), while the subset of high literate investors have a 2.4% lower propensity than the
group of low literate investors (column 2). A similar pattern is visible in our retail bank sample. An
interesting observation is that advice seeking is much more prevent in the retail bank sample. This is
mainly attributable to our variable construction. In the DHS sample the advice seeking measure is
based on households that indicate professional financial advice as their main source of advice, which
by no means implies that other households do not make use of a financial advisor. In the retail bank
sample the advice seeking measure is based on investors that actually choose to consult an advisor in
their investment decisions.
Panel B of table III splits our sample into groups based on self-assessed financial literacy. Households
and investors that rate their financial literacy high, exhibit a dramatically lower propensity to seek out
advice, especially so for investors. Investors that rate their literacy as high, have a 17.5 (DHS) or a 22
(Retail Bank) percentage point lower advice seeking propensity than those who rate their literacy as
low. This finding is a first indication that confidence in one’s knowledge matters more than actual
knowledge.
In panel C we split our samples into overconfidence quartiles. Although we observe no difference in
advice seeking behavior between quartile 1 and 4 for all households in the total DHS sample (Column
1), overconfident investors (Column 2 and 3) seek out advice less. Specifically, the quartile of most
overconfident investors in both samples, exhibits a 14 to 15 percentage point lower propensity to seek
expert financial advice.
Panels D to H of Table III present advise seeking behavior of various socio-economic groups. Panel D
shows that male investors exhibit a lower tendency to consult an advisor, while Panel E presents
evidence that higher educated seek out advice more often. Panel F partitions respondents based on
household income. For general households (Column 1), those with high incomes seek out expert
advice more that the low income group (38% vs 21%). For the two investor samples (Column 2 and
3), income is much less related to advice seeking. In Panel G we split our samples in age groups.
Only in the retail bank sample a significant effect is observable: 75% of the investors above 60 years
old consult an advisor, compared to 53% of those aged 40 or below. Panel H indicates the importance
of wealth. Households in the highest wealth quartile, exhibit a much higher advice seeking propensity
than those in the lowest quartile (40% vs 17%). A similar pattern is visible for the too samples of
investors.

12
4.2. Financial Literacy, Overconfidence and Financial Advice Seeking: Multivariate Results
To determine whether financial literacy and overconfidence relate to the propensity to seek expert
help conditional on many other characteristics, we estimated various linear probability models3. Table
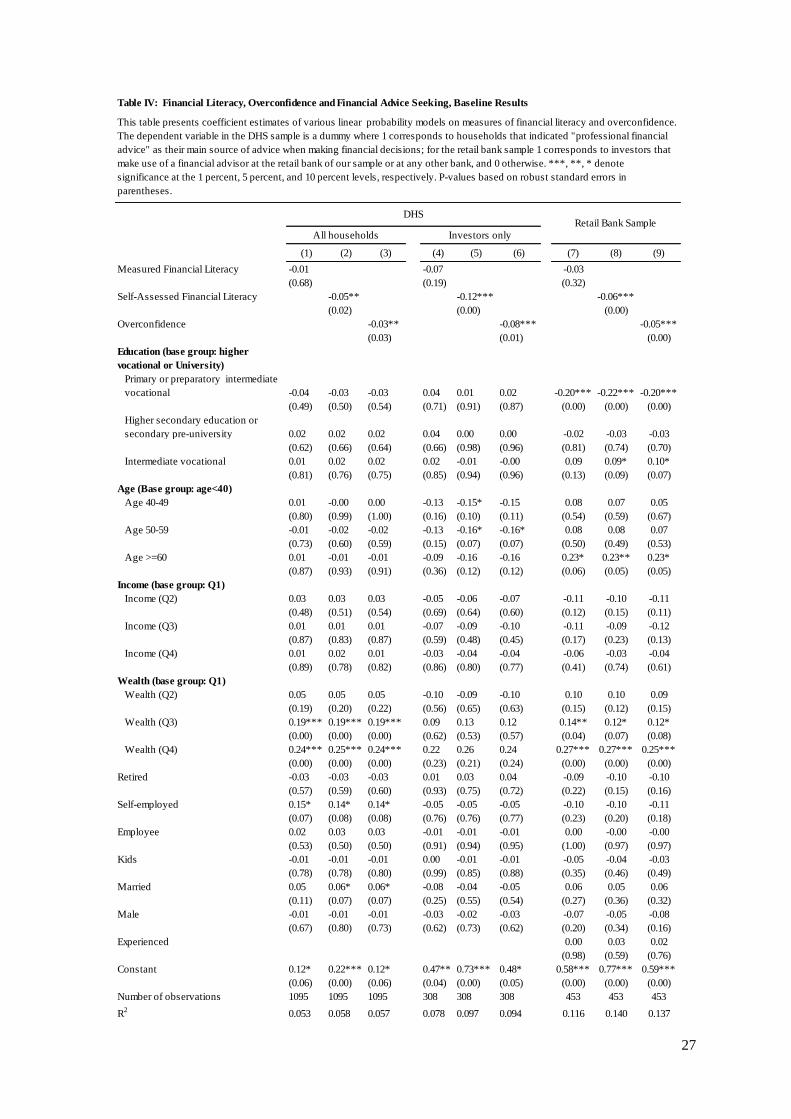
IV, reports the results of our baseline estimations. The most important result is that measured financial
literacy is unrelated to financial advice seeking in all our samples (columns 1, 4, and 7), while self-
assessed financial literacy is strongly negatively associated (column 2, 5 and 8). It appears that how
much people think they know matters more than how much they actually know, which may imply a
role for overconfidence in advice seeking. Indeed, our estimations (column 3, 6, and 9) confirm that
the degree of overconfidence is significantly negatively associated with advice seeking behavior.
Specifically, a one standard deviation change in the degree of overconfidence relates to a 3%, 8% and
7% lower propensity to seek advice for all households in the DHS, investors in the DHS and investors
in bank sample), respectively. These results, in conjunction with the average advice seeking
propensity of 29.4% (all households, DHS sample), 30.1% (investors only, DHS sample) and 68.5%
(retail bank sample), show that the degree of overconfidence is an important aspect to clarify the
demand for financial advice. People that overrate their own financial knowledge compared to others,
thus rely more on non-financial expert advice sources, and opt more frequently for execution-only
trading. Abstracting from causality concerns here, our first results imply that those that are most prone
to make suboptimal financial decisions (low financially literate and overconfident individuals), are
not, or even less inclined to have their behavior corrected by a financial expert.
Furthermore, table IV confirms some results from prior studies on advice seeking (e.g., Bhattacharya
et al., 2012; Bluethgren et al., 2008; Hackethal et al., 2012). In the retail bank sample (Column 7-9),
less educated investors have a significantly lower propensity to seek advice; while investors older than
60 years seek advice more often. Wealth relates positively to advice seeking, although significantly so
only in some of the specifications.
[TABLE IV HERE]
4.3. Robustness Checks
4.3.1 Additional controls
Advice seeking behavior thus bears zero association with actual financial literacy and a strong
negative association with (over)confidence. Thus far, we have not taken heterogeneity in preferences,
trust and cognitive abilities into consideration, though these may have significant effects on choice
3 A probit model is usually preferred for a bivariate dependent variable. We reestimated all equations using a
probit model and achieved qualitatively and quantitatively similar results. The use of linear probability
models is advocated with an instrumental variables technique that we employ later on in this paper
(Freedman and Sekhon ,2010). The error term of a linear probability may suffer from heteroskedasticity.
Therefore, we used heteroskedastic-robust standard errors in all reported estimations.

13
behavior (Christelis et al., 2010). Excluding them from our estimations may lead to incorrect
inferences as a result of omitted variables bias.
Dohmen et al., (2011) documents large heterogeneity in the willingness to take risk across people. For
our purpose it is especially relevant to note that advised investors tend to be more risk averse than
non-advised investors (Bluethgen et al., 2008; Gerhardt and Hackethal, 2009). Risk aversion can be
determined in various ways. Dohmen et al., (2010) use a survey question to measure risk aversion
and show that it predicts behavior especially well when asked in reference to specific domains, such as
financial matters. Lönnqvist et al. (2014) find the survey measure more reliable than a lottery choice
task to assess appetites for risk. For our retail bank sample we therefore used the survey measure from
Dohmen et al., (2011), measured on a seven-point scale: “How would you rate your willingness to
take risks in financial matters?”. For the DHS sample we created a risk aversion measure from a
factor analysis on six questions that ask for the willingness to take financial risks (please refer to
Appendix A for the exact wording of these questions). We believe this measure captures risk aversion
adequately as it correlates strongly and significantly with stock market participation (=0.30, p-
value=0.00).
Simonson (1992) indicates a strong correlation between regret and responsibility. We consider advice
seeking a responsibility-shifting mechanism that helps the investor protect against the feelings of
regret. Shefrin (2002) argues that handholding is the one of the most important services an advisor
provides; if the investment decision turns out poorly, investors have the option of blaming the advisor.
Therefore, in our retail bank survey, we included a question to assess the degree of regret aversion on
a seven-point scale: “Image that your zip code wins a large price in the zip code lottery, how much
regret would you feel if you did not purchase a lottery ticket?”. In the DHS sample we do not have a
measure for regret aversion.
Time preference may drive advice-seeking too. On the one hand, impatient people may be more likely
to invest through an execution-only platform, because its barriers to executing investment decisions
are lower, compared with contacting a financial advisor first, discussing the proposed trade, and then
having it executed. On the other hand, advisors may serve as a self-control mechanism for impatient
investors. To keep the retail bank survey length acceptable, we used only one time preference trade-
off as a rough approximation of the degree of impatience. Frederick (2005) found a large intergroup
difference for the choice between €3.400 this month or €3.800 next month; both amounts and the
difference between them were considerable, but there is also a clearly rational choice, such that the
impatient choice implies an annual discount rate of 280%. Our measure of impatience is only
available in our retail bank sample.

14
Guiso, Sapienza and Zingales (2008) show that the level of trust affects economic decisions in
general; Georagakos and Inderst (2011) specifically indicate that trust in financial advice affects stock
market participation, especially for less literate investors. Trust therefore may directly affect the
decision to ask for help. Indeed, Guiso and Japelli (2006) find that trust is positively associated with
portfolio delegation. We include two trust variables in our analysis, adapted from the World Values
Survey. Specifically, we asked about respondents’ degree of agreement with two statements: (1)
“Most people can be trusted” (which we label “Trust General”) and (2) “Most financial advisors can
be trusted” (“Trust Advice”). Also, our measures of trust are only available in our retail bank sample.
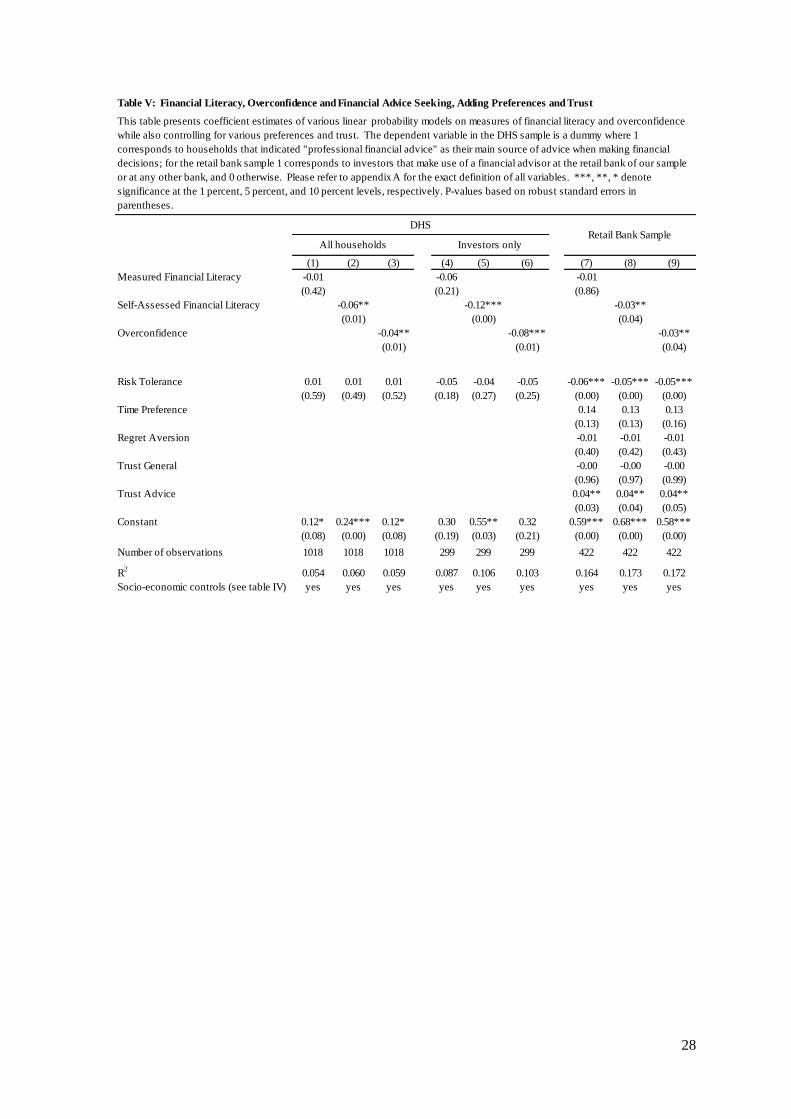
In Table V we provide the results for our estimations, after adding the preference and trust controls.
Risk tolerance is significantly and negatively associated with advice-seeking behavior, but only so in
the retail bank sample (columns 7-9). Time preference shows a positive association, although the
relationship is not significant at conventional levels. Trust in general bores no relation to the
propensity to ask for help, whereas trust in advisors indicated a significant positive association as
expected. Causality may run in both directions though: People who place more trust in advisors may
be more inclined to hire one, and having an advisor may increase trust. Our main findings remained
unaltered, however: measured financial literacy is unrelated to professional advice seeking, while
(over)confidence in financial matters relates to a lower propensity to ask for expert assistance.
[TABLE V HERE]
In addition to preferences and trust, cognitive ability may drive advice seeking behavior. Cognitive
ability relates to various cognitive domains, such as numerical and verbal skills and memory
functioning (Christellis et al., 2010). On the one hand, those with better mental ability have lower
search costs, and may thus be less in need of assistance. On the other hand, evidence from the
psychological literature indicates that individuals with lower cognitive abilities, are less aware of their
limitations, and may thus believe they do not need expert help (Kruger and Dunning, 1999).
Measuring cognitive ability by means of a lengthy standard IQ test is not feasible in a survey. We
therefore rely on crude proxies for cognitive ability.
In the DHS, 5 financial literacy questions are included that capture very basic numerical skills, and
may thus serve as a proxy for cognitive ability (please refer to Appendix A for an exact wording of
these five questions). Similar to Van Rooij, et al. (2011a) we performed a factor analysis on these
questions, and use the score of each respondent as our cognitive ability measure. In our retail bank
survey, we included the three-question cognitive reflection test (CRT) proposed by Frederick (2005).
The CRT is attractive because it demands a limited amount of time and correlates sufficiently with the
scores on other IQ tests. It ranked as the best or second-best predictor across four decision-making
domains in a comparison with other tests (Fredrick, 2005). Please refer to Appendix A for more detail
on the questions. The noninvestment nature of these questions however deviates considerably from

15
the rest of the survey and may make respondents suspicious. Therefore, we framed the CRT-
questions as a contest, in which participants could win one of two €50 prizes. A moderate proportion
of 93 respondents (20%) opted not to participate in the contest, so our sample size drops when we
include cognitive ability in our analysis. Both advised and self-directed investors participated equally.
[TABLE VI HERE]
The first interesting observation from Table VI, is that cognitive ability is not significant in all our
specifications. Again, and most importantly, our main results remain unaffected: we observe no
relationship between measured financial literacy and the propensity to seek professional financial
advice and a significantly negative relationship with (over)confidence.
4.3.2 Endogeneity of Financial Literacy
In estimating the relationship between advice seeking and financial literacy, we must consider the
possibility that measured financial literacy is in fact endogenous. We should therefore be careful in
interpreting our OLS estimates. Although, by including many demographic controls, preferences, trust
and cognitive ability we limit the possibility that our results are driven by omitted variables bias, we
cannot rule it out. In addition, our estimations may suffer from reversed causality. The choice to hire
an advisor may impact the degree of financial literacy. The sign of this relationship is not clear a
priori. Both advised and non-advised households may increase their literacy from interacting with
financial markets; the effect even may be greater for non-advised households, who deal with financial
markets directly, find information themselves, and decide on their own which investments to pursue.
Alternatively, advised households may learn from their interactions with their financial advisor, who
teaches them about risk, return, and diversification.
To address causality concerns, we use additional information that is available in our retail bank
survey. One questions asks about the amount of education respondents received on economics before
they entered the job market, which should be before they started to invest. Economic education
probably correlates positively with current financial literacy but will not depend on having a financial
advisor and thus resolves our reversed causality concerns (see also Van Rooij et al., 2012 for a similar
solution). Specifically, we asked respondents: “How much of your formal education was devoted to
economics?” using a seven-point scale ranging from “very little” to “very much”. We then created two
dummies: one for respondents who indicated to have had some economic education (score of 3–5) and
one for respondents who indicated to have had a lot of economic education (score of 6–7). Those with
little economic education (score of 1–2) constitute the benchmark group.
In appendix C we present the results of the first stage regression on measured financial literacy. It
shows that our instruments are positively correlated with measured financial literacy, and highly

16
significant. The estimates of our second stage regression in table VII show that the relationship
between financial literacy and expert advice seeking remains insignificant. The Hansen J-test indicates
that the over-identifying restrictions are not rejected, while also the exogeneity test is not rejected. The
F-statistic of the first stage regression is high enough to avoid the weak instrument problem. These
results imply that measured financial literacy bears no causal relationship with financial advice
seeking. From a policy makers’ perspective, this is an valuable finding. Financial advice cannot be
treated as a substitute for limited financial knowledge, which paves the road for other solutions such
as financial education, choice architecture or regulation.
[TABLE VII HERE]
4.3.3. An Alternative Proxy for Over- and Underconfidence
An important finding thus far, is the negative relationship between (over)confidence and advice
seeking. Overconfident individuals have been shown to make the biggest mistakes in financial
decision making. In our main specifications we proxy overconfidence as the residual of regressing
self-assessed financial literacy on measured financial literacy. As a robustness test, we create an
overconfident and underconfident dummy. We proceed as follows: we first split our samples in 4
quartiles of measured financial literacy, and in 4 groups based on self-assessed financial literacy. For
the DHS sample these 4 groups equal the answer categories (1-4) of the question that was introduced
in section 3.3.2. For the retail bank sample we create 4 quartiles of self-assessed literacy. Then, we
label respondents who rank themselves in the highest of the four self-assessed literacy groups, but
reside in the lowest measured financial literacy quartiles as overconfident. We label respondents who
rank themselves in the lowest of the four self-assessed literacy groups, but reside in the highest of the
measured financial literacy quartiles as underconfident. Both variables are dummies taking the value
of 1 if the respondent is overconfident or underconfident, and zero otherwise.
Table VIII present the results using our alternative overconfidence proxy. Although, underconfidence
is positively related to advice seeking, it is only marginal significant for all households in the DHS
sample (column 1), and the investors of our retail bank sample (column 3). Our overconfidence
dummy however relates strongly to asking for expert help. Being overconfident lowers the advice
seeking propensity by approximately 30 percentage points both in the full sample of the DHS and the
retail bank sample.
[TABLE VIII HERE]
4.3.4. Overconfidence and Gender
Our multivariate regressions show a strong negative relationship between overconfidence and advice
seeking behavior. We cannot interpret this finding as a causal effect, however, unless one assumes that

17
overconfidence is an stable personality trait with biological roots, and thus exogenous. Although some
evidence points at a genetic basis for various investor behaviors (e.g. Barnea, et al., 2010), one could
also argue that the relationship is driven by an additional omitted variable, measurement error, or
reversed causality. In Gervais and Odean (1998) for example investors become overconfident after
interpreting financial successes and failures in a self-serving fashion. This assessment of their own
financial skill may depend on whether or not someone is assisted by a professional. Someone that uses
an advisor, may have more opportunity to blame some else for mistakes.
Unfortunately we do not have valid instruments available in both our samples. To give some guidance
on whether overconfidence drives advice seeking, we rely on prior evidence that overconfidence in
financial matters is a typical male trait. Barber & Odean (2000) show that especially males exhibit
investment behavior that can be attributed to overconfidence.
We therefore partition our samples in male and female respondents in Table IX. Interestingly, it
appears that our results on overconfidence are fully driven by male respondents. All three estimations
using subsamples of males (column 1,3, and 5), indicate that overconfidence is strongly and
negatively related to advice seeking, while we find no effect at all in the subsample of female
respondents (column 2, 4 and 6). Although this gender partition does not really solve our endogeneity
concerns, we do believe it enhances the plausibility of a causal relationship between overconfidence
and asking for expert help.
[TABLE IX HERE]
4.3.5. Overconfidence and Opinions of Advice Seeking and Self-Directed Investing
To provide further evidence on the drivers of our overconfidence result, we make use of additional
information in our retail bank survey of opinions on financial advisors. We use statements that have
been related to overconfidence in prior literature, such as the illusion of control, excessive risk
taking, and the illusion of superior investment skill, superior information and superior knowledge.
Specifically we use the degree of agreement (on a 7 point scale) on the following 6 statements:
1) “Investing on your own (compared to investing using a financial advisor) gives more control”
2) “Investing on your own (compared to investing using a financial advisor) leads to more
investment mistakes.”
3) “Investing on your own (compared to investing using a financial advisor) leads to more
risks.”
4) “A financial advisor (compared to investing on your own) makes better investment decisions.”
5) “A financial advisor (compared to investing on your own) possesses more investment
information.”

18
6) “A financial advisor (compared to investing on your own) knows less on investing.”
We then regress the degree of agreement on these statements using an ordered probit model on our
measure of overconfidence and all other controls. Table X presents the results. The main finding
here is that overconfidence significantly relates to the degree of agreement with all 6 statements in the
expected direction. The findings imply that more overconfident people believe self-directed investing
provides more control, while they agree less that self-directed investing leads to more investment
mistakes or increased risk. Overconfident people neither believe that advisors make better decisions,
nor have more information, while they do agree more that advisors knowing less on investing. These
results show that overconfidence relates significantly to believes that are likely drivers in the choice to
hire an advisor or not.
[TABLE X HERE]
5. Conclusion and Discussion
Many households make poor financial decisions that result from low financial literacy. Various
remedies, such as financial education and choice architecture, have been proposed both by academics
and policy makers. The focus of this paper is on the provision of guidance by an financial expert.
Households may profit from economies of scale in information acquisition and possible superior
financial skills of advisors. The quality of advice, however, may be hampered by incentive structures
that create a conflict of interest between the financial advisor and the client. Indeed, Mullanaithan et
al., (2012) showed that advisors tend to support strategies that result in more transactions and higher
fees. This tendency urged some countries to propose new legislation in order to prevent biased advice.
In the Netherlands, for example, advisors are now prohibited to receive commissions for the products
they sell. Such regulation makes sense given the evidence that, once conflicts of interest are
minimized, advisors do improve financial decision making (Bhattacharya et al, 2012; Hung and
Yoong, 2010).
In light of these regulatory measures to limit the possibility of misselling especially to the less wary,
the relationship between financial literacy and advice seeking becomes more prominent. For those in
favor of financial advice as a remedy for poor decision making, it would be helpful to find that
households with low financial literacy are more inclined to consult a professional advisor. This paper,
however, provides evidence that any causal relationship between the level of financial literacy and the
propensity to seek advice is absent. This finding in itself does not imply that financial advice can be
of no help. Those with low financial literacy that do seek assistance could still benefit, if one is willing
to assume a larger and beneficiary advisory impact for less knowledgeable. Still, our findings show
that professional advice can at best be only a partly solution.

19
Our evidence actually points at the crucial role of (over)confidence in advice seeking behavior.
Households that are more (over)confident about their own financial knowledge are less inclined to
consult an advisor. This is a worrisome conclusion, given the evidence that especially overconfident
individuals are most at risk to make costly mistakes (Von Gaudekker, 2014).
For policy makers, our findings have several relevant implications. First, financial advice appears to
be an inadequate mechanism to assist those who need it the most. Individuals that are prone to make
the biggest financial mistakes (low literate and overconfident individuals) are not more (or even less)
likely to have their suboptimal behavior corrected by a financial advisor. Second, financial institutions
must be cautious in using self-assessed literacy to determine suitability of retail financial products.
Many client profiling surveys include questions on ones ‘one assessment of financial knowledge. Our
findings show that answers to these questions should be treated with skepticism, given its weak
correlation with actual financial knowledge.
Although, more research is needed to fully understand the relationships between financial literacy,
financial advice, and financial decision making, evidence thus far points at a limited effectiveness of
advice. We believe promising routes for policy makers that deserve further inquiry are both choice
architecture and financial education. Evidence on the causal effects of financial training on financial
behavior so far is ambiguous, so additional experimental work is needed here.
Choice architecture relates to the creation of a decision context that uses departures from full
rationality of decision makers to their own advantage. Choice architecture has been shown to deliver
good results in some areas. The Save More Tomorrow plan that was proposed by Thaler and Benarti
(2004), for example, uses loss aversion, money illusion, status quo bias, and inconsistent time
preferences to have people save more for retirement. In addition, policy makers could stimulate the
development of simple to understand, transparent, and low cost financial products
20
References
Barber, B.M. and T. Odean, 2000, “Trading is Hazardous to Your Wealth: The Common Stock
Investment Performance of Individual Investors,” Journal of Finance 55, 773-806.
Barnea, A., H. Cronqvist, and Stephan Siegel, 2010, "Nature or nurture: What determines investor
behavior?." Journal of Financial Economics 98, 583-604.
Bartlett, M., 1937, “The Statistical Conception of Mental Factors”, British Journal of Psychology 28,
97-104.
Bergstresser, D., J.M.R. Chalmers, and P. Tufano, 2009, “Assessing the Costs and Benefits of Brokers
in the Mutual Fund Industry”, Review of Financial Studies 22, 4,129-4,156.
Bhattacharya, U., A. Hackethal, S. Kaesler, B. Loos, and S. Meyer, 2012, “Is Unbiased Financial
Advice to Retail Investors Sufficient? Answers from a Large Field Study,” Review of Financial
Studies 25, 975-1,032.
Bluethgen, R., A. Gintschel, A. Hackethal, and A. Müller, 2008, “Financial Advice and Individual
Investors’ Portfolios” European Business School Working Paper. Available at SSRN:
http://ssrn.com/abstract=968197.
Bucher-Koenen, T., Koenen, J., 2011, “Do Smarter Consumers Get Better Advice”, Working Paper.
Available at: http://www.wiwi.uni-bonn.de.
Calcagno, R., and C. Monticone, 2014, “Financial Literacy and the Demand for Financial Advice”,
Journal of Banking and Finance, forthcoming.
Christellis, D., T. Jappelli, and M. Padula, 2010, “Cognitive Ability and Portfolio Choice”, European
Economic Review 54, 18-38.
Collins, J.M., 2012, “Financial advice: a substitute for financial literacy?”, Financial Services Review
21, 307-322.
Dhar R. and N. Zhu, 2006, “Up Close and Personal: Investor Sophistication and the Disposition
Effect,” Management Science 52, 726-740.
Dohmen, T., A. Falk, D. Huffman, and U. Sunde, 2010, “Are Risk Aversion and Impatience Related
to Cognitive Ability?”, American Economic Review 100, 1238-1260.
Dohmen, T., A. Falk, D. Huffman, U. Sunde, J. Schupp, and G.G. Wagner, 2011, Individual Risk
Attitudes: Measurement, Determinants, and Behavioral Consequences, Journal of the European
Economic Association 9, 522–550.

21
Elmerick, S.A., C.P. Montalto, J.J. Fox, 2002, “Use of Financial Planners by US Households”,
Financial Services Review 11, 217-231.
Frederick, S., 2005, “Cognitive Reflection and Decision Making”, Journal of Economic Perspectives
19, 25-42
Gerhardt, R. and A. Hackethal, 2009, “The Influence of Financial Advisors on Household Portfolios:
A Study on Private Investors Switching to Financial Advice”, Working Paper. Available at SSRN:
http://ssrn.com/abstract= 1343607
Gervais, S. and T. Odean, 1998, “Learning to be overconfident”, Review of Financial Studies 14, 1-
27.
Georgarakos, D., and R. Inderst, 2011, “Financial Advice and Stock Market Participation”, ECB
Working Paper. Available at SSRN: http://ssrn.com/abstract= 1761486.
Graham, J.R., and C.R. Harvey, 2009, “Investor Competence, Trading Frequency and Home Bias”,
Management Science 55, 1094-1106
Guiso, L. and T. Jappelli, 2006, “Information Acquisition and Portfolio Performance,” Centre for
Economic Policy Research Discussion Paper. Available at SSRN: http://ssrn.com/abstract=954121.
Guiso, L., P. Sapienza, and L. Zingales, 2008, “Trusting the Stock Market”, Journal of Finance 63,
2557-2600.
Hackethal, A., M. Haliassos, and T. Jappelli, 2012, “Financial Advisors: A Case of Babysitters?”
Journal of Banking and Finance 36, 509-524.
Heath, C., and A. Tversky, 1991, “Preference and belief: Ambiguity and Competence in Choice under
Uncertainty”, Journal of Risk and Uncertainty 4, 5-28.
Hung, A.A. A.M. Parker, and J.K. Yoong, 2009, “Defining and Measuring Financial Literacy”,
RAND Center for Labor and Population, Working Paper. Available at SSRN:
http://ssrn.com/abstract=1498674.
Hung, A.A. and J.K. Yoong, 2010, “Asking for Help: Survey and Experimental Evidence on Financial
Advice and Behavior Change,” RAND Center for Labor and Population, Working Paper. Available at
SSRN: http://ssrn.com/abstract=1532993.
ICI (Investment Company Institute), 2007, “Why do Mutual Fund Investors Use Professional
Advisors?”, Research Fundamentals 16, retrieved 12 December 2011 from:
http://www.ici.org/pdf/fm-v16n1.pdf.

22
Inderst, R. and M. Ottaviani, 2009, “Misselling through Agents,” American Economic Review 99,
883-908.
Kaiser, H.F., 1970, “A Second-Generation Little Jiffy”, Psychometrika 35, 401-415.
Kramer, M.M., 2012, “Financial Advice and Individual Investor Portfolio Performance”, Financial
Management 41, 395-428.
Kruger, J., and D. Dunning, 1999, “Unskilled and Unaware of It: How Difficulties in Recognizing
One's Own Incompetence Lead to Inflated Self-Assessments ”, Journal of Personality and Social
Psychology 77, 1121-1134.
Lönnqvist, J.E., M. Verkasalo, G. Walkowitz , P.C. Wichardt, 2014 “Measuring Individual Risk
Attitudes in the Lab: Task or Ask? An Empirical Comparison”, Working Paper, Available at SSRN:
http://ssrn.com/abstract= 1556647.
Lusardi, A., and O.S. Mitchell, 2007, Financial Literacy and Retirement Planning: New Evidence
from the Rand American Life Panel, Michigan Retirement Research Centre Working Paper, Available
at: http://www.mrrc.isr.umich.edu.
Lusardi, A., and O.S. Mitchell, 2011, “Financial Literacy and Planning: Implications for Retirement
Wellbeing”, NBER Working Paper No. 17078, Available at SSRN: http://ssrn.com/abstract=
1848593.
Lusardi, A., and O.S. Mitchell, 2014. "The Economic Importance of Financial Literacy: Theory and
Evidence," Journal of Economic Literature 52, 5-44.
Millward Brown, 2010, Annual Survey of Dutch Private Investors, retrieved 15 April 2010 from:
http://www.millwardbrown.nl/?pm=branches_d&type=publicatie&id=106.
Mullainathan, S., M. Nöth, and A. Schoar, 2012, “The Market for Financial Advice: An Audit Study,”
The National Bureau of Economic Research Working Paper. Available at SSRN:
http://ssrn.com/abstract= 2028263.
Odean, T., 1999, “Do Investors Trade Too Much?,” American Economic Review 89, 1279-1298.
Shefrin, H., 2002, “Beyond Greed and Fear”, Oxford University Press.
Simonson , I., 1992, “The Influence of Anticipating Regret and Responsibility on Purchase
Decisions”, Journal of Consumer Research 19, 105-118
Stanton, J.M. and S.G. Rogelberg, 2001, “Using Internet/Intranet Web Pages to Collect
Organizational Research Data”, Organizational Research Methods 4, 200-217.

23
Svenson, O., 1981, “Are we all less risky and more skillful than our fellow drivers?”, Acta
Psychologica 47, 143-148.
Van Rooij, M.C.J., C.J.M. Kool, and H.M. Prast, 2007, “Risk-return Preferences in the Pension
Domain: Are People Able to Choose?”, Journal of Public Economics 91, 701-722.
Van Rooij, M.C.J., A. Lusardi, and R. Alessie, 2011a, “Financial Literacy and Stock Market
Participation”, Journal of Financial Economics 101, 449-472.
Van Rooij, M., A. Lusardi, and R. Alessie, 2011b, “Financial Literacy and Retirement Planning in the
Netherlands”, Journal of Economic Psychology 32, 539-608.
Van Rooij, M., A. Lusardi, and R. Alessie, 2012, “Financial Literacy, Retirement Planning and
Household Wealth”, Economic Journal 122, 449-478.
Von Gaudecker, 2014, “How does Household Portfolio Diversification vary with Financial
Sophistication and Advice?”, Journal of Finance, forthcoming.
Willis, L.E., 2011, “The Financial Education Fallacy”, The American Economic Review 101, 429-
434.

24
Full sampleInvestors
only
Full
sample
Respondents
(Resp)
Non-
Respondents
(Non-Resp)
Difference
(Resp-Non-
Resp)
Age 50.8 53.8 54.2 58.4 53.7 4.7***
Male (%) 51.5 69.5 73.1 79.0 72.4 6.6%***
Liquid Assets (€) 29,727 75,718 66,170 95,675 66,142 29.533***
Portfolio Value (€) 12,493 42,457 59,709 79,970 57,263 22.707*
Equity (%) 70.8 69.7 71.0 -1.31
Individual stocks (%) 29.8 22.8 21.6 23.0 -1.4
Bonds (%) 9.1 10.1 16.8 9.3 7.5***
Mutual Funds (%) 49.0 46.9 47.8 46.8 1.0
Options (% of portfolios) 2.8 4.7 2.5 2.2**
N 1,276 354 4,335 467 3,868
DHS Sample
This table provides and overview of summary statistics of the DHS and the Retail bank sample. In the DHS sample
"Investors Only" refers to the subset of households that own stocks, bonds, and/or mutuals funds.Within the
Retail Bank sample survey respondents and non-respondents are compared. Liquid assets refers to the summ of
checking and savings accounts and investments in stocks, bonds and mutual funds. Portfolio Value refers to the
sum of investments in stocks, bonds and mutual funds. Equity, Individual Stocks , Bonds and Mutual funds refer
to the average portfolio allocation to these asset classes. Options refers to the percentage of portfolios that hold
options. ***, **, * denote significance at the 1 percent, 5 percent, and 10 percent levels, respectively
Table I. Sample Validity
Retail Bank Sample

25
Use
Professional
Advisors
Other
Sources of
Advice
Use
Professional
Advisors
Other
Sources of
Advice
Advised
Investors
Self Directed
Investors
None Correct 6.4 6.1 2.8 1.7 3.8 3.4
1 Correct 2.4 4.7 0.0 0.8 3.8 2.7
2 Correct 3.7 5.2 1.9 0.4 5.0 2.0
3 Correct 5.3 5.4 3.8 3.0 7.2 8.8
4 Correct 8.8 6.0 3.8 1.7 5.3 8.2
5 Correct 9.1 9.0 5.7 7.2 10.9 15.0
6 Correct 11.7 12.9 11.3 13.9 16.9 17.0
7 Correct 13.3 14.4 15.1 14.4 24.7 22.4
8 Correct 14.7 12.8 19.8 16.5 . .
9 Correct 15.2 12.3 20.8 18.6 . .
10 Correct 7.2 9.3 10.4 18.1 . .
All (11 or 8) Correct 2.1 1.9 4.7 3.8 22.5 20.4
Mean # correct 6.20 6.06 7.33 7.59 5.65 5.63
Mean % correct 56.3% 55.0% 66.6% 69.0% 70.6% 70.4%
N 375 901 106 237 320 147
All Households Investors Only
This tables reports the distributions of the number of correct answers for the 11 (Dutch Household Survey,
DHS) and 8 (Retail Bank sample) financial literacy questions. The DHS sample is split in households that
indicated professional financial advice as their main source of information and others. In the DHS sample
"Investors Only" relates to the subset of households that own stocks, bonds, and/or mutuals funds. The Retail
Bank sample is split in advised and self-directed investors.
Table II. Financial Literacy Score
DHSRetail Bank

26
All Households
N=1,276
Investors Only
N=343
All Households
N=1,276
Investors Only
N=343
(1) (2) (3) (1) (2) (3)
Panel E: Education
1 (Low) 27.6% 32.1% 70.1% Primary / Preparatory intermediate vocational 24.6% 31.0% 54.2%
2 28.0% 34.5% 61.5% Intermediate vocational 32.5% 30.3% 77.8%
3 32.7% 27.3% 71.8% Higher secondary education / Secondary pre-university 31.4% 31.3% 66.7%
4 (High) 29.1% 29.8% 70.6% Higher vocational / University 29.1% 32.2% 68.6%
Difference 4-1 1.6% -2.4% 0.5%
Panel F: Annual Household Income
Q1 20.6% 38.9% 73.0%
1 (Low) 29.1% 33.3% 76.6% Q2 26.5% 29.1% 67.3%
2 29.8% 35.2% 67.2% Q3 31.9% 29.7% 66.4%
3 29.9% 25.0% 72.1% Q4 38.0% 36.7% 70.5%
4 (High) 20.0% 15.8% 54.6%
Difference 4-1 -9.1% -17.5% -22.0% Panel G: Age
<40 29.1% 32.3% 52.9%
Panel C: Overconfidence Quartiles 40-49 32.1% 31.8% 62.7%
1 (Low: Underconfident) 29.5% 36.0% 78.0% 50-59 28.8% 27.6% 61.8%
2 31.3% 33.7% 67.0% >60 28.1% 32.0% 74.6%
3 27.3% 32.2% 66.0%
4 (High: Overconfident) 29.5% 21.4% 64.0% Panel H: Wealth
Difference 4-1 0.0% -14.6% -14.0% Q1 17.1% 33.3% 53.8%
Q2 22.5% 16.0% 65.3%
Panel D: Gender Q3 34.9% 30.6% 70.7%
Female 28.8% 33.7% 75.9% Q4 39.8% 41.5% 84.5%
Male 29.8% 29.7% 66.3%
Panel B: Self-Assessed Financial Literacy Groups
Panel A: Measured Financial Literacy Quartiles
DHS DHS
Table III: Financial Advice Seeking Propensity, Univariate statistics
This table present average advice seeking propensity over measured financial literacy, perceived financial literacy, and overconfidence quartiles and several socio-economic variables. In the DHS
sample "Investors Only" relates to the subset of households that own stocks, bonds, and/or mutuals funds.
Professional Financial Advice seeking
propensity
Professional Financial Advice seeking
propensity
Retail Bank
N=467
Retail Bank
N=467
27
(1) (2) (3) (4) (5) (6) (7) (8) (9)
Measured Financial Literacy -0.01 -0.07 -0.03
(0.68) (0.19) (0.32)
Self-Assessed Financial Literacy -0.05** -0.12*** -0.06***
(0.02) (0.00) (0.00)
Overconfidence -0.03** -0.08*** -0.05***
(0.03) (0.01) (0.00)
Education (base group: higher
vocational or University)
Primary or preparatory intermediate
vocational -0.04 -0.03 -0.03 0.04 0.01 0.02 -0.20*** -0.22*** -0.20***
(0.49) (0.50) (0.54) (0.71) (0.91) (0.87) (0.00) (0.00) (0.00)
Higher secondary education or
secondary pre-university 0.02 0.02 0.02 0.04 0.00 0.00 -0.02 -0.03 -0.03
(0.62) (0.66) (0.64) (0.66) (0.98) (0.96) (0.81) (0.74) (0.70)
Intermediate vocational 0.01 0.02 0.02 0.02 -0.01 -0.00 0.09 0.09* 0.10*
(0.81) (0.76) (0.75) (0.85) (0.94) (0.96) (0.13) (0.09) (0.07)
Age (Base group: age<40)
Age 40-49 0.01 -0.00 0.00 -0.13 -0.15* -0.15 0.08 0.07 0.05
(0.80) (0.99) (1.00) (0.16) (0.10) (0.11) (0.54) (0.59) (0.67)
Age 50-59 -0.01 -0.02 -0.02 -0.13 -0.16* -0.16* 0.08 0.08 0.07
(0.73) (0.60) (0.59) (0.15) (0.07) (0.07) (0.50) (0.49) (0.53)
Age >=60 0.01 -0.01 -0.01 -0.09 -0.16 -0.16 0.23* 0.23** 0.23*
(0.87) (0.93) (0.91) (0.36) (0.12) (0.12) (0.06) (0.05) (0.05)
Income (base group: Q1)
Income (Q2) 0.03 0.03 0.03 -0.05 -0.06 -0.07 -0.11 -0.10 -0.11
(0.48) (0.51) (0.54) (0.69) (0.64) (0.60) (0.12) (0.15) (0.11)
Income (Q3) 0.01 0.01 0.01 -0.07 -0.09 -0.10 -0.11 -0.09 -0.12
(0.87) (0.83) (0.87) (0.59) (0.48) (0.45) (0.17) (0.23) (0.13)
Income (Q4) 0.01 0.02 0.01 -0.03 -0.04 -0.04 -0.06 -0.03 -0.04
(0.89) (0.78) (0.82) (0.86) (0.80) (0.77) (0.41) (0.74) (0.61)
Wealth (base group: Q1)
Wealth (Q2) 0.05 0.05 0.05 -0.10 -0.09 -0.10 0.10 0.10 0.09
(0.19) (0.20) (0.22) (0.56) (0.65) (0.63) (0.15) (0.12) (0.15)
Wealth (Q3) 0.19*** 0.19*** 0.19*** 0.09 0.13 0.12 0.14** 0.12* 0.12*
(0.00) (0.00) (0.00) (0.62) (0.53) (0.57) (0.04) (0.07) (0.08)
Wealth (Q4) 0.24*** 0.25*** 0.24*** 0.22 0.26 0.24 0.27*** 0.27*** 0.25***
(0.00) (0.00) (0.00) (0.23) (0.21) (0.24) (0.00) (0.00) (0.00)
Retired -0.03 -0.03 -0.03 0.01 0.03 0.04 -0.09 -0.10 -0.10
(0.57) (0.59) (0.60) (0.93) (0.75) (0.72) (0.22) (0.15) (0.16)
Self-employed 0.15* 0.14* 0.14* -0.05 -0.05 -0.05 -0.10 -0.10 -0.11
(0.07) (0.08) (0.08) (0.76) (0.76) (0.77) (0.23) (0.20) (0.18)
Employee 0.02 0.03 0.03 -0.01 -0.01 -0.01 0.00 -0.00 -0.00
(0.53) (0.50) (0.50) (0.91) (0.94) (0.95) (1.00) (0.97) (0.97)
Kids -0.01 -0.01 -0.01 0.00 -0.01 -0.01 -0.05 -0.04 -0.03
(0.78) (0.78) (0.80) (0.99) (0.85) (0.88) (0.35) (0.46) (0.49)
Married 0.05 0.06* 0.06* -0.08 -0.04 -0.05 0.06 0.05 0.06
(0.11) (0.07) (0.07) (0.25) (0.55) (0.54) (0.27) (0.36) (0.32)
Male -0.01 -0.01 -0.01 -0.03 -0.02 -0.03 -0.07 -0.05 -0.08
(0.67) (0.80) (0.73) (0.62) (0.73) (0.62) (0.20) (0.34) (0.16)
Experienced 0.00 0.03 0.02
(0.98) (0.59) (0.76)
Constant 0.12* 0.22*** 0.12* 0.47** 0.73*** 0.48* 0.58*** 0.77*** 0.59***
(0.06) (0.00) (0.06) (0.04) (0.00) (0.05) (0.00) (0.00) (0.00)
Number of observations 1095 1095 1095 308 308 308 453 453 453
R2
0.053 0.058 0.057 0.078 0.097 0.094 0.116 0.140 0.137
This table presents coefficient estimates of various linear probability models on measures of financial literacy and overconfidence.
The dependent variable in the DHS sample is a dummy where 1 corresponds to households that indicated "professional financial
advice" as their main source of advice when making financial decisions; for the retail bank sample 1 corresponds to investors that
make use of a financial advisor at the retail bank of our sample or at any other bank, and 0 otherwise. ***, **, * denote
significance at the 1 percent, 5 percent, and 10 percent levels, respectively. P-values based on robust standard errors in
parentheses.
All households Investors only
DHS
Table IV: Financial Literacy, Overconfidence and Financial Advice Seeking, Baseline Results
Retail Bank Sample
28
(1) (2) (3) (4) (5) (6) (7) (8) (9)
Measured Financial Literacy -0.01 -0.06 -0.01
(0.42) (0.21) (0.86)
Self-Assessed Financial Literacy -0.06** -0.12*** -0.03**
(0.01) (0.00) (0.04)
Overconfidence -0.04** -0.08*** -0.03**
(0.01) (0.01) (0.04)
Risk Tolerance 0.01 0.01 0.01 -0.05 -0.04 -0.05 -0.06*** -0.05*** -0.05***
(0.59) (0.49) (0.52) (0.18) (0.27) (0.25) (0.00) (0.00) (0.00)
Time Preference 0.14 0.13 0.13
(0.13) (0.13) (0.16)
Regret Aversion -0.01 -0.01 -0.01
(0.40) (0.42) (0.43)
Trust General -0.00 -0.00 -0.00
(0.96) (0.97) (0.99)
Trust Advice 0.04** 0.04** 0.04**
(0.03) (0.04) (0.05)
Constant 0.12* 0.24*** 0.12* 0.30 0.55** 0.32 0.59*** 0.68*** 0.58***
(0.08) (0.00) (0.08) (0.19) (0.03) (0.21) (0.00) (0.00) (0.00)
Number of observations 1018 1018 1018 299 299 299 422 422 422
R2
0.054 0.060 0.059 0.087 0.106 0.103 0.164 0.173 0.172
Socio-economic controls (see table IV) yes yes yes yes yes yes yes yes yes
Table V: Financial Literacy, Overconfidence and Financial Advice Seeking, Adding Preferences and Trust
This table presents coefficient estimates of various linear probability models on measures of financial literacy and overconfidence
while also controlling for various preferences and trust. The dependent variable in the DHS sample is a dummy where 1
corresponds to households that indicated "professional financial advice" as their main source of advice when making financial
decisions; for the retail bank sample 1 corresponds to investors that make use of a financial advisor at the retail bank of our sample
or at any other bank, and 0 otherwise. Please refer to appendix A for the exact definition of all variables. ***, **, * denote
significance at the 1 percent, 5 percent, and 10 percent levels, respectively. P-values based on robust standard errors in
parentheses.
Retail Bank SampleDHS
All households Investors only

29
(1) (2) (3) (4) (5) (6) (7) (8) (9)
Measured Financial Literacy -0.01 -0.09 -0.01
(0.54) (0.13) (0.84)
Self-Assessed Financial Literacy -0.06** -0.12*** -0.04**
(0.01) (0.00) (0.05)
Overconfidence -0.04** -0.08*** -0.04**
(0.01) (0.01) (0.05)
Cognitive Abilities -0.01 -0.01 -0.02 0.05 0.02 0.01 0.01 0.02 0.01
(0.62) (0.54) (0.44) (0.36) (0.72) (0.84) (0.66) (0.51) (0.61)
Number of observations 1018 1018 1018 299 299 299 296 296 296
R2
0.054 0.060 0.059 0.090 0.106 0.103 0.194 0.206 0.204
Socio-economic controls (see table IV) yes yes yes yes yes yes yes yes yes
Preferences controls (see table V) yes yes yes yes yes yes yes yes yes
Trust controls (see table V) no no no no no no yes yes yes
Table VI: Financial Literacy, Overconfidence and Financial Advice Seeking, Adding Cognitive Abilities
This table presents coefficient estimates of various linear probability models on measures of financial literacy and overconfidence
while also controlling for cognitive abilities. The dependent variable in the DHS sample is a dummy where 1 corresponds to
households that indicated "professional financial advice" as their main source of advice when making financial decisions; for the
retail bank sample 1 corresponds to investors that make use of a financial advisor at the retail bank of our sample or at any other
bank, and 0 otherwise. Please refer to appendix A for the exact definition of all variables. ***, **, * denote significance at the 1
percent, 5 percent, and 10 percent levels, respectively. P-values based on robust standard errors in parentheses.
DHSRetail Bank Sample
All households Investors only

30
(1)
Measured Financial Literacy -0.17
(0.42)
Other controls (see table V) yes
R2
0.088
Number of observations 430
F-Statistic First Stage Regression 8.87
Hansen J test p-value 0.39
Exogeniety test p-value 0.42
Retail Bank Sample
Table VII. Financial Literacy and Financial Advice Seeking, IV Estimation
This table presents coefficient estimates of an instumental variables
regression of advice seeking on measured financial literacy. Financial literacy
is instrumented using the the amount of economics education before entering
the stock market. The dependent variable is a dummy where 0 corresponds to
investors that invest by means of execution-only, and 1 to investors that ask
for financial expert-help at the bank of our sample or at any other bank. ***,
**, * denote significance at the 1 percent, 5 percent, and 10 percent levels,
respectively. P-values in parentheses based on robust standard errors.
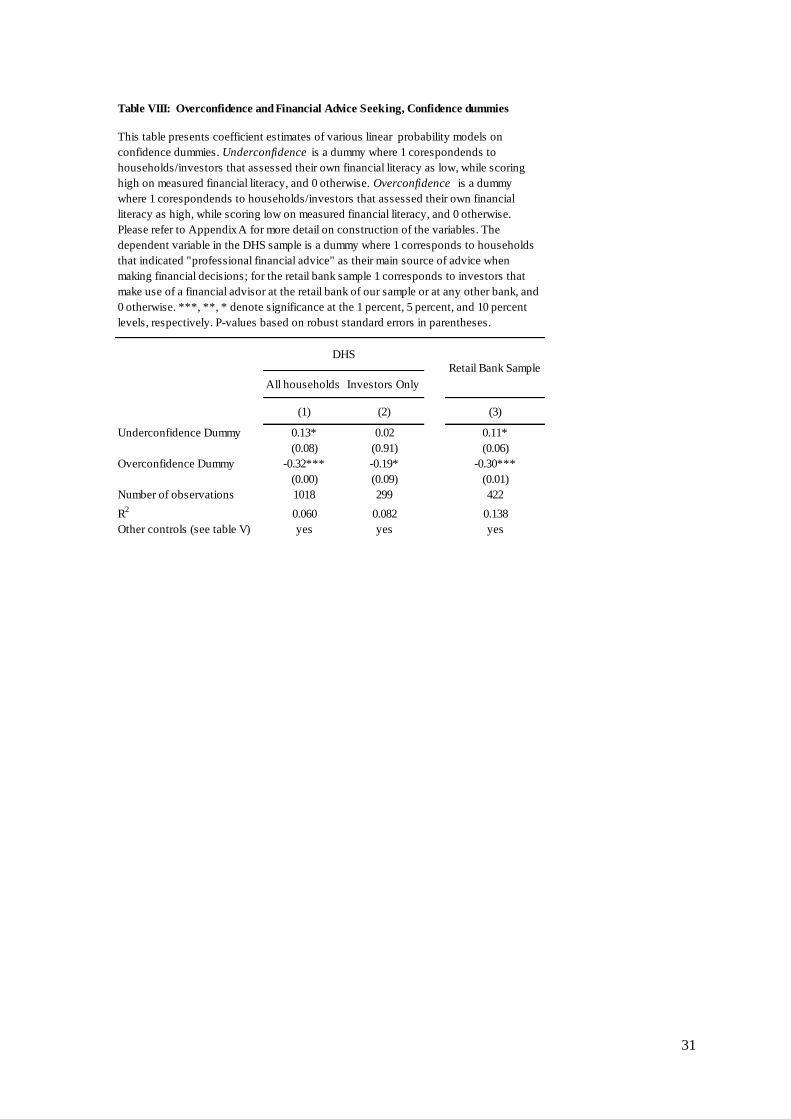
31
All households Investors Only
(1) (2) (3)
Underconfidence Dummy 0.13* 0.02 0.11*
(0.08) (0.91) (0.06)
Overconfidence Dummy -0.32*** -0.19* -0.30***
(0.00) (0.09) (0.01)
Number of observations 1018 299 422
R2
0.060 0.082 0.138
Other controls (see table V) yes yes yes
This table presents coefficient estimates of various linear probability models on
confidence dummies. Underconfidence is a dummy where 1 corespondends to
households/investors that assessed their own financial literacy as low, while scoring
high on measured financial literacy, and 0 otherwise. Overconfidence is a dummy
where 1 corespondends to households/investors that assessed their own financial
literacy as high, while scoring low on measured financial literacy, and 0 otherwise.
Please refer to Appendix A for more detail on construction of the variables. The
dependent variable in the DHS sample is a dummy where 1 corresponds to households
that indicated "professional financial advice" as their main source of advice when
making financial decisions; for the retail bank sample 1 corresponds to investors that
make use of a financial advisor at the retail bank of our sample or at any other bank, and
0 otherwise. ***, **, * denote significance at the 1 percent, 5 percent, and 10 percent
levels, respectively. P-values based on robust standard errors in parentheses.
Table VIII: Overconfidence and Financial Advice Seeking, Confidence dummies
DHS
Retail Bank Sample
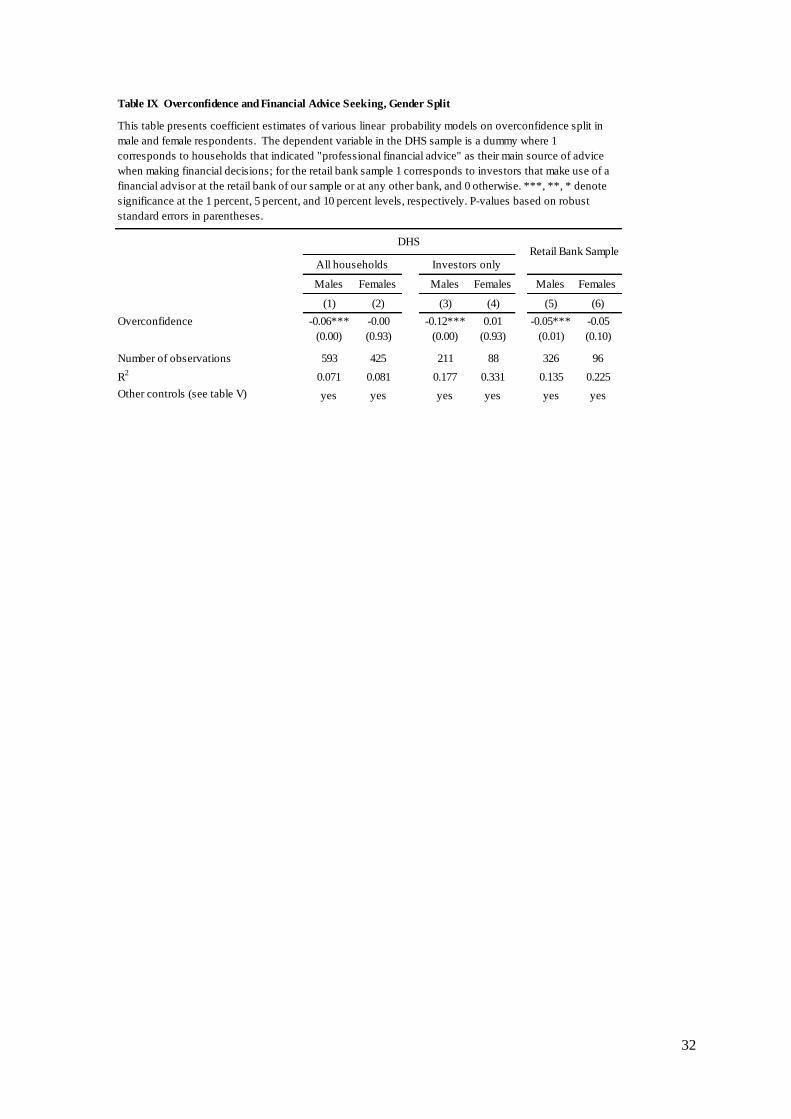
32
Males Females Males Females Males Females
(1) (2) (3) (4) (5) (6)
Overconfidence -0.06*** -0.00 -0.12*** 0.01 -0.05*** -0.05
(0.00) (0.93) (0.00) (0.93) (0.01) (0.10)
Number of observations 593 425 211 88 326 96
R2
0.071 0.081 0.177 0.331 0.135 0.225
Other controls (see table V) yes yes yes yes yes yes
Table IX Overconfidence and Financial Advice Seeking, Gender Split
This table presents coefficient estimates of various linear probability models on overconfidence split in
male and female respondents. The dependent variable in the DHS sample is a dummy where 1
corresponds to households that indicated "professional financial advice" as their main source of advice
when making financial decisions; for the retail bank sample 1 corresponds to investors that make use of a
financial advisor at the retail bank of our sample or at any other bank, and 0 otherwise. ***, **, * denote
significance at the 1 percent, 5 percent, and 10 percent levels, respectively. P-values based on robust
standard errors in parentheses.
DHSRetail Bank Sample
All households Investors only

33
...gives more
control
...leads to more
investment
mistakes
...leads to more
risks
...makes better
investment
decisions
...possesses more
investment
information
...knows less on
investing
1 2 3 4 5 6
Overconfidence 0.12* -0.21*** -0.18*** -0.23*** -0.21*** 0.12*
(0.08) (0.00) (0.01) (0.00) (0.00) (0.08)
Number of observations 388 385 404 403 414 404
Pseudo R2
0.019 0.024 0.026 0.041 0.030 0.039
Other controls (see table V) yes yes yes yes yes yes
Table X Overconfidence and Opinions on Financial Advice and Self-Directed Investing
This table presents results on the impact of overconfidence on perceptions about execution-only and financial advice using
ordered probit regressions. The dependent variable is the degree of agreement on 6 different statements that highlight various
(dis)advantages of investing by means of execution-only or by making use of a financial adviser using a 7-point scale from (1)
"Totally Disagee to (7) "Totally Agree". The exact wording and the univariate statistics of the statements are given in Appendix C.
***, **, * denote significance at the 1 percent, 5 percent, and 10 percent levels, respectively. P-values based on robust standard
errors in parentheses.
Investing on your own (compared to
investing using a financial advisor)…
A financial advisor (compared to investing on your
own)…

34
Appendix A: Wording of Survey Questions and Key Variables Construction
Financial Advice Seeking - DHS Sample: Dummy variable indicating [1] when household answered “Professional financial advisers” to
the following question: “What is the most important source of advice when you have to make important financial
decisions for the household?”, and [0] otherwise
'- Retail Bank Sample: Dummy variable indicating [1] when an investors is registered as client of the financial
advisory or delegated portfolio management department at the bank that provided us the data, or if investors
indicated using an financial adviser at another bank, and [0] otherwise.
Measured Financial Literacy Score obtained from a factor analysis on the first 8 [Retail Bank Sample] or all 11 [DHS sample] of the following
financial literacy questions:
[All questions also included a “don’t know” and a "refusal" option].
1) Which of the following statements describes the main function of the stock market? [The stock market helps
to predict stock earnings; The stock market results in an increase in the price of stocks; The stock market brings
people who want to buy stocks together with those who want to sell stocks; None of the above.]
2) Which of the following statements is correct? [Once one invests in a mutual fund, one cannot withdraw the
money in the first year; Mutual funds can invest in several assets, for example invest in both stocks and bonds;
Mutual funds pay a guaranteed rate of return which depends on their past performance; None of the above.]
3) If the interest rate falls, what should happen to bond prices? [Rise; Fall; Stay the same; None of the above.]
4) True or false? Buying a company stock usually provides a safer return than a stock mutual fund. [True; False].
5) True or false? Stocks are normally riskier than bonds. [True; False].
6) Considering a long time period (for example 10 or 20 years), which asset normally gives the highest return?
[Savings accounts; Bonds; Stocks].
7) Normally, which asset displays the highest fluctuations over time? [Savings accounts; Bonds; Stocks].
8) When an investor spreads his money among different assets, does the risk of losing money: [Increase;
Decrease; Stay the same].
9) Which of the following statements is correct? If someone buys the stock of firm B in the stock market: [He
owns part of firm B; He has lent money to firm B; He is liable for firm 's debt, None of the above]
10) Which of the following statements is correct? If someone buys a bond of firm B: [He owns part of firm B; He
has lent money to firm B; He is liable for firm 's debt, None of the above]
11) True or false? If you buy a 10-year bond, it means you cannot sell it after 5 years without incurring a major
penaly.[True; False].
Self-Assessed financial literacy - DHS Sample: A score ranging from [1] "not knowledgeable" to [4] "very knowledgeable" on the following
question: "How knowledgeable do you consider yourself with respect to financial matters?
- Retail Bank Sample: A score ranging from [1] "very low" to [7] "very high" on the following question:
"Financial knowledge varies from person to person. How would you assess your own financial knowledge?"
Overconfidence The residual taken from a regression of the standarizeded score of Self-Assessed Financial Literacy on the
standarized score of Measured Financial Literacy.
Overconfidence dummy - Retail Bank Sample: dummy indicating [1] if respondents ranked high in self-assesed financial literacy
(specifically: 6 or 7), while their measured financial literacy ranked below the median, and [0] otherwise.
- DHS Sample: dummy indicating [1] if respondents ranked high in self-assesed financial literacy (specifically:
4), while their measured financial literacy ranked below the median, and [0] otherwise.
Underconfidence dummy - Retail Bank Sample: dummy indicating [1] if respondents ranked low in self-assesed financial literacy
(specifically: 1 or 2), while their measured financial literacy ranked above the median, and [0] otherwise.
- DHS Sample: dummy indicating [1] if respondents ranked low in self-assesed financial literacy (specifically: 1),
while their measured financial literacy ranked above the median, and [0] otherwise.
Risk Tolerance - Retail Bank Sample: Score based the following question: “How would you rate your willingness to take risks
in financial matters?” based on Dohmen et al. (2011), [1="totally not prepared" to 7="totally prepared"]
- DHS Sample: Factor score based on agreement (ranging from 1 (totally disagree) - 7 (totally agree)) on the
following 6 questions: (1) I think it is more important to have safe investments and guaranteed returns, than to
take a risk to have a chance to get the highest possible returns, (2) I would never consider investments in shares
because I find this too risky, (3) If I think an investment will be profitable, I am prepared to borrow money to
make this investment, (4) I want to be certain that my investments are safe, (5) I get more and more convinced
that I should take greater financial risks to improve my financial position, (6) I am prepared to take the risk to lose
money, when there is also a chance to gain money.
Time Preference - Only in Retail Bank Sample: Dummy variable on impatience, indicated as 1 if people choose the first option in
the following question: "Image you have to make a choice between the receiving €3,400 right away, or €3,800 in
one month from now, which choice would you make?", and 0 otherwise.
Regret Aversion - Only in Retail Bank Sample: Based on “Image that your zip code wins a large price in the Zip Code Lottery1,
how much regret would you feel if you did not purchase a lottery ticket?” using a seven-point scale [1 = “totally
no regret to 7 = “a lot of regret”].
1The Dutch Zip Code Lottery provides a unique platform to measure regret. Even if people do not buy a lottery
ticket, they receive a lottery number (i.e., their zip code). Thus people know the outcome of their decision, even if
they do not participate, which may induce feelings of regret.

35
Trust General - Only in Retail Bank Sample: Based on the degree of agreement on the following statement using a seven-point
scale [1 = “totally disagree” to 7 = “totally agree”]: “Most people can be trusted”.
Trust Advice - Only in Retail Bank Sample: Based on the degree of agreement on the following statement using a seven-point
scale [1 = “totally disagree” to 7 = “totally agree”]: “Most financial advisors can be trusted”.
Cognitive Abilities -DHS Sample: score baased on a factor analysis on the follwing 5 basic literacy questions:
[All questions also included a “don’t know” and a "refusal" option].
1) Suppose you had €100 in a savings account and the interest rate was 2% per year. After 5 years, how much do
you think you would have in the account if you left the money to grow? [More than €102; Exactly €102; Less
than €102]
2) Suppose you had €100 in a savings account and the interest rate is 20% per year and you never withdraw
money or interest payments. After 5 years, how much would you have on this account in total? [More than €200;
Exactly €200; Less than €200].
3) Imagine that the interest rate on your savings account was 1% per year and inflation was 2% per year. After 1
year, how much would you be able to buy with the money in this account? [More than today; Exactly the same;
Less than today]
4) Assume a friend inherits €10,000 today and his sibling inherits €10,000 3 years from now. Who is richer
because of the inheritance? [My friend; His sibling; They are equally Rich]
5) Suppose that in the year 2010, your income has doubled and prices of all goods have doubled too. In 2010,
how much will you be able to buy with your income? [More than today; The same; Less than today]
- Retail Bank Sample: Number of correct answers [ranging from 0 - 3] on the Cognitive Reflection Test [CRT]
from Fredrick (2005). Specifically, the CRT ask the following 3 questions:
1) A bat and a ball cost $1.10 in total. The bat costs $1.00 more than the ball. How much does the ball cost?
_____ cents.
2) If it takes 5 machines 5 minutes to make 5 widgets, how long would it take 100 machines to make 100 widgets?
_____ minutes.
3) In a lake, there is a patch of lily pads. Every day, the patch doubles in size. If it takes 48 days for the patch to
cover the entire lake, how long would it take for the patch to cover half of the lake? _____ days.
Education Highest attained educational degree of respondent
Age Age of the respondent
Income Gross annual household income
Wealth DHS Sample: summ of savings accounts, amount invested in stocks, bonds and mutual funds, and house value
Retail Bank Sample: portfolio value
Retired Dummy indicating [1] if respondents are retired and [0] otherwise.
Self-employed Dummy indicating [1] if respondents are self-employed and [0] otherwise.
Employee Dummy indicating [1] if respondents work as an employee and [0] otherwise.
Kids Dummy indicating [1] if respondents have kids and [0] otherwise.
Married Dummy indicating [1] if respondents are maried and [0] otherwise.
Male Dummy indicating [1] if respondents are male and [0] for female.
Experienced Retail Bank Sample only: dummy indicating [1] if respondents have more than 5 year investment experience and
[0] otherwise
- Only in Retail Bank Sample: Dependent variables are equal to the degree of agreement on the following 6
statements using a seven-point scale [1 = “totally disagree” to 7 = “totally agree”]:
1) Investing on your own (compared to investing using a financial advisor) gives more control
2) Investing on your own (compared to investing using a financial advisor) leads to more investment mistakes
3) Investing on your own (compared to investing using a financial advisor) leads to more risks
4) A financial advisor (compared to investing on your own) makes better investment decisions
5) A financial advisor (compared to investing on your own) possesses more investment information
6) A financial advisor (compared to investing on your own) knows less on investing
Opinions on Financial Advice and
Self-Directed investing (Table X)

36
DHSRetail Bank
Sample
Question AnswerFactor
Loadings
Factor
Loadings
Correct 0.6058 0.605
Don't Know -0.7215 -0.708
Correct 0.6467 0.646
Don't Know -0.7667 -0.754
Correct 0.3102 0.469
Don't Know -0.689 -0.599
Correct 0.4664 0.699
Don't Know -0.7607 -0.666
Correct 0.2997 0.674
Don't Know -0.7488 -0.688
Correct 0.5074 0.538
Don't Know -0.7503 -0.526
Correct 0.644 0.675
Don't Know -0.7758 -0.636
Correct 0.5597 0.541
Don't Know -0.7524 -0.599
Correct 0.4287
Don't Know -0.6099
Correct 0.6118
Don't Know -0.7539
Correct 0.4747
Don't Know -0.5259
5. Stocks are normally safer than bonds, true or false
6. Considering a long time period, which asset normally gives the
highest return?
Appendix B. Factor Loadings Financial Literacy Questions
1. Which statement describes the main function of the stock market?
2. Which statement about mutual funds is correct?
3. What should happen to bond prices if interest rates fall?
4. Buying a company stock usually provides a safer return than a stock
mutual fund that invests worldwide?
9. Which of the following statements is correct? If someone buys the
stock of firm B in the stock market:
10. Which of the following statements is correct? If someone buys a
bond of firm B:
11. If you buy a 10-year bond, it means you cannot sell it after 5 years
without incurring a major penaly, true or false?
7. Normally, which asset displays the highest fluctuations over time?
8. What happens to the risk of losing money when an investors spreads
money among different assets?

37
Instruments (Base Group: Little Economics Education)
A lot of Economics Education 0.27***
(0.00)
Some Economics Education 0.15*
(0.09)
Education (base group: higher vocational or University)
Primary or preparatory intermediate vocational -0.59***
(0.00)
Higher secondary education or secondary pre-university 0.09
(0.50)
Intermediate vocational -0.14
(0.21)
Age (Base group: age<40)
Age 40-49 0.34
(0.10)
Age 50-59 0.16
(0.41)
Age >=60 0.19
(0.37)
Income (base group: Q1)
Income (Q2) 0.30*
(0.06)
Income (Q3) 0.49***
(0.00)
Income (Q4) 0.15
(0.42)
Wealth (base group: Q1)
Wealth (Q2) 0.20*
(0.06)
Wealth (Q3) 0.14
(0.25)
Wealth (Q4) 0.38***
(0.00)
Retired -0.07
(0.68)
Self-employed 0.09
(0.62)
Employee -0.03
(0.89)
Kids -0.06
(0.51)
Married -0.18
(0.11)
Male 0.44***
(0.00)
Experienced 0.32***
(0.01)
Risk Tolerance 0.15***
(0.00)
Time Preference 0.25
(0.19)
Regret Aversion -0.00
(0.89)
Trust General -0.02
(0.55)
Trust Advice 0.06
(0.10)
Constant -1.73***
(0.00)
Number of observations 430
R2
0.385
F-Statistic 8.87
Appendix C. First Stage Regression on Measured Financial Literacy
This table presents coefficient estimates of the first stage regression of financial literacy on various control variables and
two dummies that represent the level of numeracy (DHS) or the amount of economics education obtained before entering
the stock market (Retail Bank Sample). ***, **, * denote significance at the 1 percent, 5 percent, and 10 percent levels,
respectively. P-values based on robust standard errors in parentheses.
Retail Bank Sample