Download - Fin-and-Rudder Loads in a Yawivg 'Manoeuvre:

C.P.(,+hj 30 I A.R.C. TechnIcat Report
C.P. No. 301 (18.124)
A.R.C. Technical Report
MINISTRY OF SUPPLY
AERO,NAUTlCAL RESEARCH COlJNClL
CURRENT PAPERS
Fin-and-Rudder Loads in a Yawivg ‘Manoeuvre:
Effect <of Direct’ and Power
Assisted Rudder Movemht
BY
D. R. P&ock, D.C.Ae.
LONDON: HER MAJESTY’S STATIONERY OFFICE
1956
SEVEN SHILLINGS NET’


C.P. No. 301
U.D.C. No. 629.13.014.4 : 533.69.048.1
Technical Note No. Structures 169
July, 1955
Fin-and-rudder loads in a yawing manoeuvre: effect of direct ad power assisted rudder movement
D. R. Puttack., D.C.Ae.
The severity of a yawing manoeuvre specified' for design purposes is investigated, It is found that the manoeuvre does not alwsys represent the most critical case, higher fin-and-ruilder loadi~s being obtainable when the specified frequency of rudder movement is changed. The inclusicn of a power unit in the circuit may however impose restrictions on the rudder movement, leading to a reduction in the severity of the loading.
The analytical treatment includes the derivation of exact expressions for the angle of sideslip, fin-and-rudder load and rudder hinge moment induced by a sinusoidal rudder movement of arbitrary frequency. These expressions are snslysed,to determine haw the rrmxima of each of the quantities are affected by variations in the frequency of the rudder movement. Computational charts are included to simplify the determination of these effeots in particular instances.
The problems are illustrated with reference to a numerical example.


LISP OF COiVl'ENTS
1 Introduction
: The investigation Discussion 5
3.1 Genera1 note 5 3.2 Effect of frequency of rudder movement on the response
in yaw ' 3.21 Introduction z 3.22 Response per u-9.t amplitude of rudder movement 5 3.23 Response per unit ~~exixnum pedal force or hinge moment 6
3.3 Effeot of a power unit on the rudder movement and pedal forces 7
3.4 Effect of a power unit on the response of the aircreft 7
4 Conclusions Notation ;3 Referenoes IO
LIST OF APBEXJXCES
Analysis A.1 Equations of motion A.2 Definition of the manoeuvre A.3 Solution for the angle of sideslip A.4 Fin and rudder load
A.4.1 General formulae A.4.2 Approximate formulae
A. 5 Rudder hinge moment
Detailed disoussion B.1 Effect of frequency of rudder movement on the
response in yaw B.l.l Introduction B.1.2 Response per unit amplitude of rudder movement
B.1.2.1 Angle of aideslip B.1.2.2 Fm and rudder load B.1.2.3 Rudder hinge moment
B.l.3 Response per unit,msxi.mum pedel force B.2 Effect of a power unit on the rudder mOVeDent and pedal
forces B.3 Effect of a power unit on the response of an aircraft
B.3.1 Example chosen B.3.2 Angle of sideslip B.3.3 Fin and rudder load B.3.4 Rudder hinge moment
Computational charts
Data for Example
LIST OF TAXES
&wendb
I
II
III
Table I
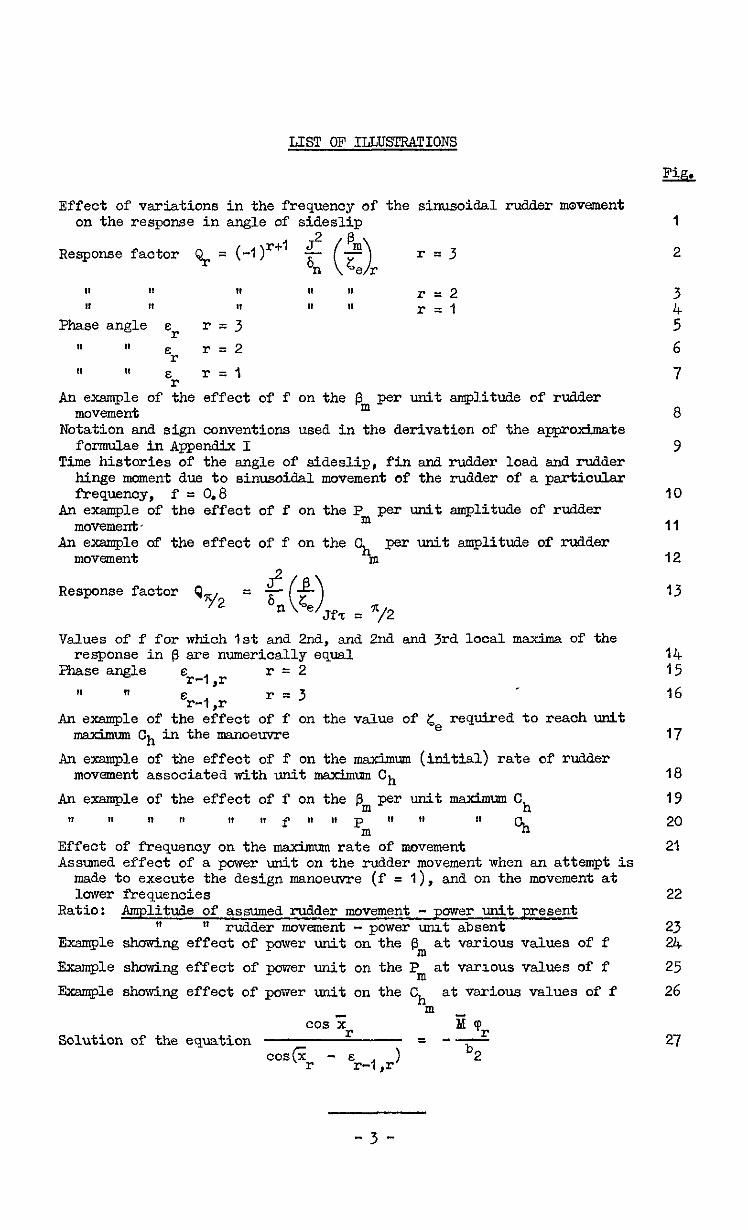
LIST OF ILLUSTRATIONS
Effect of variations in the frequency of the sinusoidal rudder movement on the response in angle of sideslip
Response factor
II 1, 1, II II r=2 II I, II II I, r=l
Phase angle E r r=3 11 11
E r=2 II II E l-=1
r An example of the effect of f on the pm per unit smplitude of rudder
movement Notation and sign conventions used in the derivation of the approzdmate
formulae inAppendix Time histories of the angle of sideslip, fin and rudder load and rudder
hinge moment due to sinusoidal movement of the rudder of a particular frequency, f = 0.8
An example of the effect of f on the Pm pez? unit amplitude of rudder movement.,
An example of the effect of f on the Ch per unit amplitude of rudder movement m
JQ!. Response factor QY2 = rn me 0 JfT = "/2
Values of f for which 1st and 2nd, and 2nd and 3rd local maxima of the response in p are numerically equal
ph2.se angle q, r r=2 3 II 11 E r-l ,r
r=3 An example of the effect of f on the value of ze required to reach unit
nn.dmum Ch in the manoeuvre An example of the effect of f on the maximum (initial) rate of rudder
movement associated with unit maxzimm Ch An example of the effect of f on the pm per unit maximum Ch
II II " !I I, II f It II pm tI II II s
Effect of frequency on the msximum rate of rmrvement Assumed effect of a power unit on the zw%ler movement when an attempt is
made to execute the design manoeuvre (f = I), and on the movement at lower frequencies
Ratio: Amplitude of assumed rudder movement - power unit uresent II II rudder movement - dower uzut absent
Example showing effect of power unit on-the (3, at various values of f Example shcwing effect of power unit on the Pm at varz.ous values of f Example shcwing effect of power unit on the Ch at various values of f
m cos x r Ejicp
Solution of the equation = -2 cost;;, - E r-l ,r 1 b2
1
2
8
9
IO
11
12
13
14 15 16
17
18
19 20
21
22
23 24 25 26
27
-3-
1 Introduction
One of the present design requirements 12 stipulates &t all siroraft shall have sufficient strength to permit ths execution of two yawing manoeuvres. In one of these manc~cuvres the rudder is to be moved sinu- soidally through I or I$ cycles at a frequency equal to the dsmped natural yawing frequency of the aircraft, with an amplitude corresponding to a specified pedal foroe.
It will be noted that with the manoeuvre defined in this manner, the mexbnun rate of rudder movement needed for its execution is also implicitly determined. However, if the rnddel* circuit contains a powsr unit, the msdmum rate of rudder movement is, in general, limited, and may well be less than that required for the above manoeuvre. The question then arises whether the associated design requirement, which normally determines the design loads for the fin-and-rudder, is not too severe in these cases.
The.present note is p5marily concerned with sny limitations that a power unit may impose on the fin-end-rudder design conditions. Additionslly, however, it.also contains the results of a detailed study of the effects of the frequency of manual or power assisted sinusoidal rudder movement on the fin-end-rudder loading conditions. This study, which was a necessary pre- liminary to the main objdotive, has yielded some significant infarmation on the manoeuvre executed without power assistance, and therefore, the results are presented and discussed.
The investigation is treated throughout fran the airworthiness stand- point, so that the ohief interest lies in the medmwn loading conditions for a given effort during msnoeuvrss whiah the pilot is able to perform. No consideration is given to the determination of the mo~?iel..y yawing manoeuvre, i.e. the one occurring most frequently.
2 Details of the investigation
For the pre liminary study,, exact analytical solutions, based on the equations of motion of the aircraft as used in response theory, were derived for the angle of sideslip, fin-sd-rudder load and rudder hinge moment prodwed by a sinusoidal rudder movement of unit smplituak and arbitrary frequency (see Appendix I para.ll3). These solutions were analysed to determine how the quantities were sffeotsd by variations in the frequency of movement, attention being conoentrated on their local mdma.
*The range of frequencies considered ms frcm 0.5 to 1.5 times the damped natural yawing frequency of the aircraft. It was found that, for conven- tional aircraft, this range was sufficient to oover all the critical loading conditions.
In the pesentation of this part of the investigation, the effects oP frequency of rudder movement on the local lllaxima of the angle of sideslip are illustrated @;raphically. Unfortunately no such general approach is possible for the associated effects on the fin-and-rudder load and rudder hinge moment because of the increased number of significant parameters affecting these two quantities. However, with the use of apprcdmate formulae, it has been possible to minimize the labour required to determine these effects in particular instances. A further simplification results from the use of a number of computational charts (see Appendix III). The' effects of frequency are illustrated with the aid of a typical exsmple, the data for which are given in Table I.
With a timledge of the foregoing results the effects of the inclusion of a power unit into the rudder c:rcuit have been assessed. Here too, a oaupletely general presentation has been precluded by the number of
-4- .

significant parameters invoived, but the trends sre illustrated by an extension of the above example (see Table I and para.3.4).
3 Discussion:
3.1 General note
The following paragraphs cover the most inportant aspects of the problan. A more detailed discussion of these aspects is presented in Appendix II. The suffix m is used throughout to denote local msxima of the vsr1ous quantities.
3.2 Effect of frequency of rudder movement on the response in .yaw
3.21 Introduction
The design yawing msnosuvre is specified in terms of a pedal force, which, in the absence of a power unit, is a function of the rudder angle and the response of the aircraft in yap, itself a futdion of the rudder sngle. Again, if a power unit is present, and limitations are imposed on the fin-and-rudder design conditions, it 1s probable that, the limitations will, in the first instance, relate to the amplitude and frequency of the specified rudder movement. It is therefore clear that, as a first step the response of the aircraft in yaw to unit sinusoidal rudder movement of different frequencies should be derived.
In this note the frequency of the rudder movement is, by definition, pro- portionalto the parameter f, which is the ratio of the frequency of rudder movement to the dsmped natural yawing frequency of the aircraft (see Appendix I eqns. 3 ~~3.4). Thus, when the response of the aircraft is expressed in terms of the amplitude of rudder movement, a change in f indioates a proportional change in both the frequency, and maximum (initial) rate of that movement. ? When the response is expressed in terms of pedsl force, however, a change in f still indicates a proportional chaxge in the frequency cf the rudder movement, but the maximum rate depends upon the amplitude of the movement, which in turn depends on the hinge moment chsracteristrcs of the rudder. The case f = 1 '; corresponds to movement of the rudder at a frequency equd to the damped. natural frequency of the niroraft (designated the damped resonant frequency) i.e. the frequency specified for the design manoeuvre.
3.22 Response per unit amplitude of rudder movement (See also Appendix II psra B.l.2)
The response of an aircraft in angle of sideslip, 0, to sinusoidal rudder movement is dependent (see Appendix I equaiion 5) on the fre.quency of the .
32 rudder movement, proportional to f, and on the ratio J , which is a measure of the aerodynamic characteristics of the aircraft. The influence of f on the response of a psrticular aircraft (i.e. at a particular value of! ) is
illustrated in Fig.(l), whilst its influence, and that of + , on the magnitude
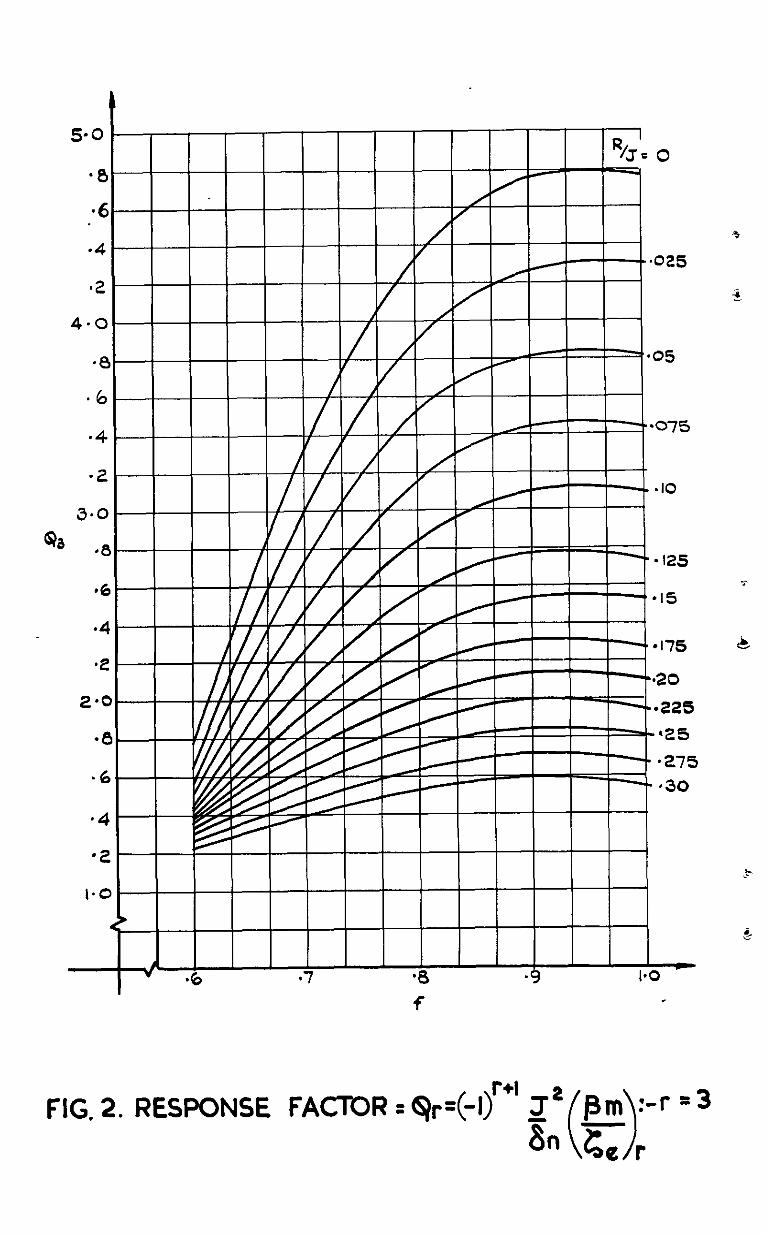
of the three local maxima which OCCUT during a manoeuvre of 'I& cycles of rudder movement, and which are of primar interest in the present note, is illustrated in Figs.(2), (3), (4) and (By. Fig.(O) relates to a specific exszple, the data fcr which sxe contained in Table I. Since the equation describing the.lateral motion of the aircraft in the present problem, see Appendix I equation 2 and 4, is identical in form to that of a simple mass- spring-damping system subjected to a sinusoidal disturbance, it is therefore to be expected, and in fact confirmed by the figures, that the peak vsJ.ues of the local maxima OCCUT with a frequency closer to the damped resonant frequency (f = 1) as the manoeuvre prrmeeds, and also that, at lovr frequencies of rudder movement, the first or second local maximum (in time) may be the absolute maximum in the manoeuvre.
-5s
The associated re equation 9 end Fig.(lO) is similar to that in p except for the in&d- 7
onse in fin-and-rudder load, P, (see Appendix I
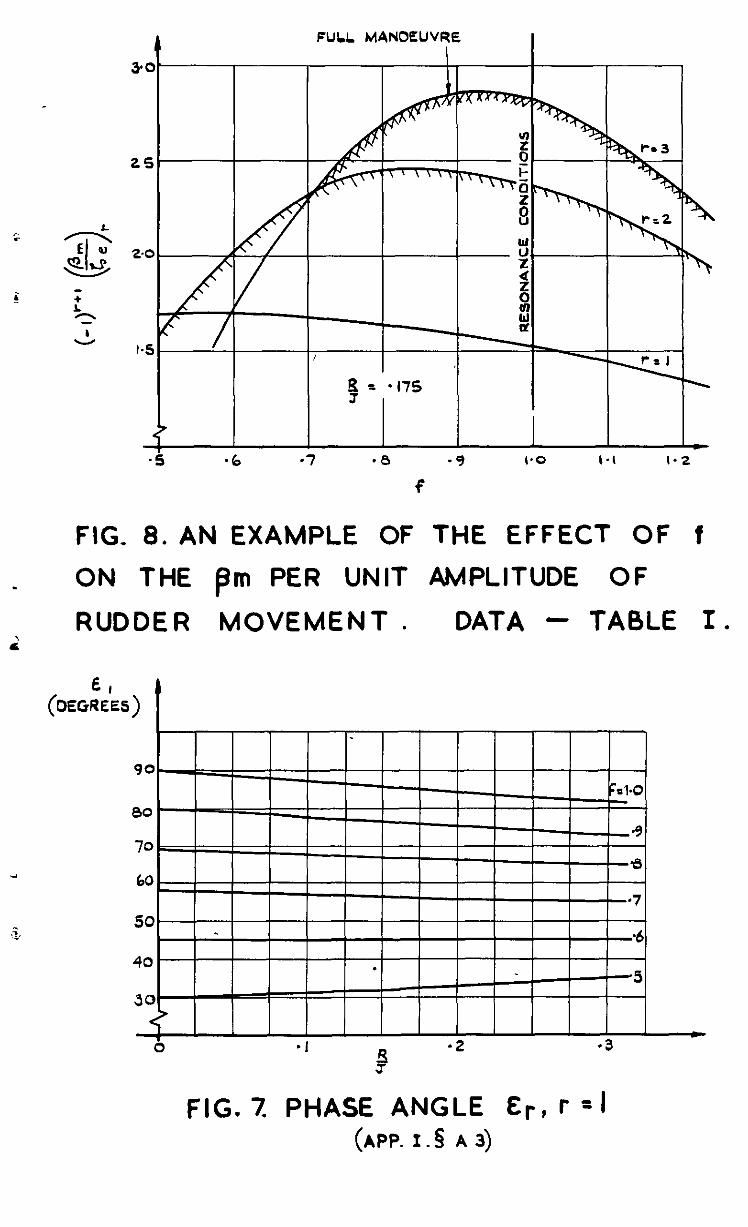
f'icant maximumwhich occurs at the beginning of the manoeuvre, and, by comparing Fig.(8) and (11) it will be seen that the general effects of f on the signifioant Pm are similar to those on the 8,. Any qualitative dif-
ferences between Figs.(8) and (11) are primarily dependent en the magnitude "I of the ratio - a2
, but for conventional aircraft the differenoes will be
small.
The response in rudder hinge moment, Ch (see Appendix I equation Ii')
is also illustrated in Big.(lO) and the variations of its looal msxima with f are shown in Fig.(12). Here it should be noted that the values of f associated with the peak values of the Ch are much higher than in either
of the cases covered above, cf. Figs.(8),m(ll) and (12). The dotted line in Fig.(l2) represents the special case bl = 0 and divergence from it at
any value of f is entirely due to b,8 i.e. the effect of the response in I sideslip on the hinge moments of the aircraft.
bl In this oonnection the sign
and magnitude of the ratio a is of importance (see Appendix II para.B.1.23); 2
with the value used in the derivation of Fig.(l2) the response of the aircraft relieves the hinge moment due to rudder angle alone at low values or f.
The general equations for P and Ch are complex and somewhat unwieldy for use in detailed calculation of the local maxima, and in Appendix I para.& and A5 respeotively approximate but more rapid methods are devised. The associated computational charts, are given in Appendix III. The accuracy of the approximate methods may be gauged from Fig.(lO).
3.23 Response per unit maximum hinge moment or pedal force (See also Appendix II para. B.l.3)
So far, the discussion has been confined to the effects of f on the pm and Pm per unit rudder movement. The results presented in support of
this discussion may now be re-examined to determine the effects of f on the pm and Pm per unit m&mum rudder hinge moment. These effects are illus-
trated in Figs.(ly) and (20). The important difference to be noted between these Figs and Figs.(B) and (11) is that the peak values of the 8, and Pm no longer oocur in the neighbowhocd of f = 1. Consequently the damped resonant condition, which forms a basis for the determination of the design loading conditionl, does not necessariQ represent the most oritiosl loading condition In the present exsmple, see Table I, a load-on the fin-and-rudder some 1% greater than the design load is obtained by moving the rudder sinu- so&dally with a frequency equal to 0.84 of the damped resonant frequency. This is due to the relieving effect of the aircraft respnse in yaw on the
^ 1 rudder hinge moments at low frequencies; and the ratio- has, therefore,
b2 a significant effect on the absolute maximum loading condition. Other
significant parameters are Rand-- a1 J
a2 , but they sffeot the picture to a
minor extent only.
-6-
3.3 Effect of a power unit on the rudder movement 7See also Appendix II pera B.l.2)
To determine what limitations a power unit may impose on the fin-and- rudder design conditions, it is first necessary to consider what limitations, if any, the power unit vvlll place on the rudder movement when an attempt ia made to execute the specified manoeuvre, The precise limitations are difficult to assess, but for a qualitative investigation refined asswtions are probably not necessary, end in this note the rudder movement is assumed to be as illus- -i‘ trated in Fig.(22a), i.e. the frequency remsins the same/but the amplitude is reduced. It is further assumed that the pedal force is proportional to rudder angle. However, to complete the picture it 1s desirable to consider also the effect of change in the frequency of the assumed movement,see Fig.(22b), on the
6
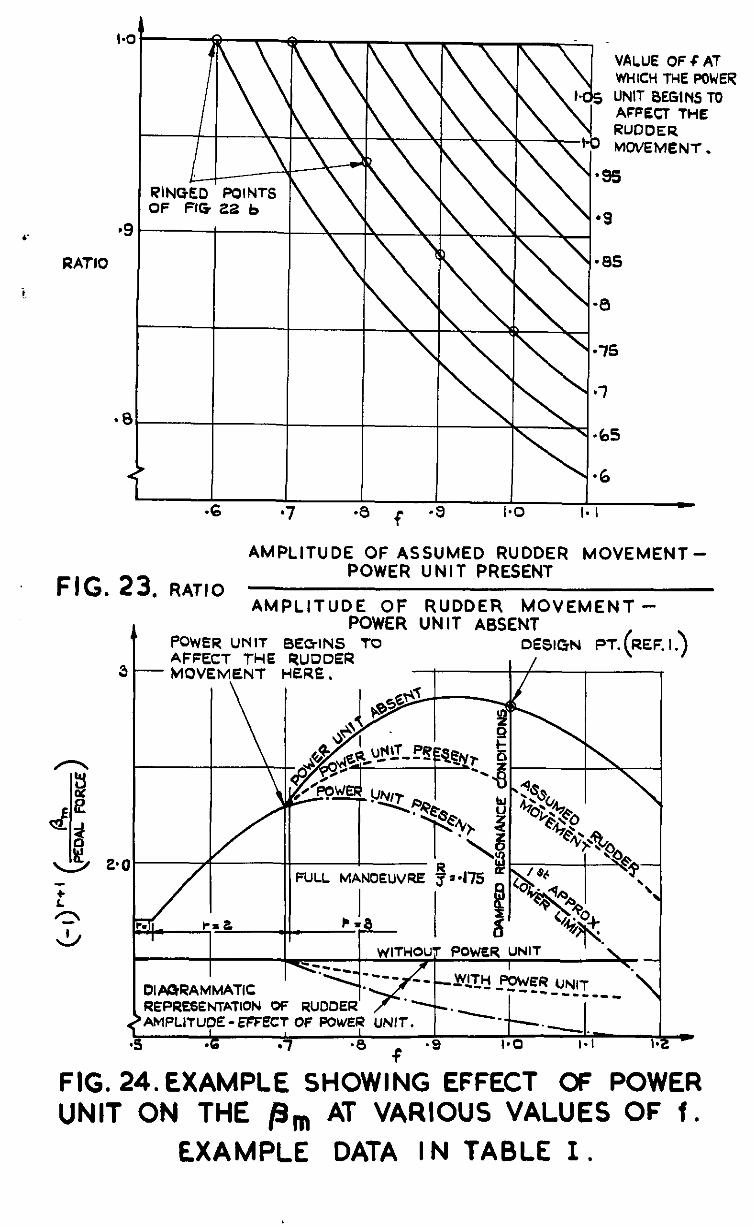
response of the aircraft end to determine the critical conditions mith the power unit present. The results of the preceding paragraphs are of use in this respect. The general effect of frequency changes on the amplitude of rudder movement, under the foregoing assumption, is illustrated in Fig.(23).
3.4 Effect of a power unit on the response of en aircraft 7See also Appendix II para.B.3)
To illustrate these effects the example of Table I has been extended to cover the case with a power unit in the rudder circuit. The characteristics of the power tit are assumed to be such that its maximum rate is reached when f = 0.7.
Thus below this frequency the power unit does nnt restrict the amplitude of movement, but above it the amplitude is reduced according tC the relevant curve in Fig.(23).
3 The curves of the pm end Pm per unit pedal force for a range of frequencies
ere given in Figs.(2&) and (25) respectively. The full curves relate to the original example, i.e. without power unit, whilst the dotted end ohain dotted. curves relate to the example with power unit present, applying the assumed. zi
rudder displacement of pra.3.3 and another, less realistic, and unoonsenrative, approzdmation (see Appendix II para.B2) respectively. In practise it is to be expected that the aotual curve would lie between the dotted and chain dotted curve a.
The sets of curves indicate that, if a power unit restricts the movement of the rudder such that the design conditions cannot be met, the critical Pm and. Pm obtained are lower than those associated with the specified design conditions. Further these critical conditions do not necessarily occur at the biped resonant frequency of the aircraft.
4 Conclusions: tT
(1) If the design menoeuvre is defined in terms of the amplitude of the rudder movement, the absolute m&ma of the angle of sideslip end fin-snd- ruder load occur, as would be expected, when the frequency of the rudder movement is very close to the demped natural yaning frequency of the r&
aircraft, i.e. close to the damped resonant conditions.
(2) The absolute maximum hinge moment for usual velues of b bl
, and b2 i.e.
6 positive end b2 negative, occws at a much higher frequency thsn the 2 bl damped respnant frequency, depending on the value of a . At low fre-
2 quencies the response of the aircraft has a relie\Cng effect on the
-7-

hinge moments, through b,, which allows the application of greater rudder amplitudes for a given pedal force than would be predicted from a knowledge of the hinge moment due to rudder angle alone.
(3) If the design manoeuvre is defined in terms of a msxkmns hinge moment or pedal force, the absolute mexima of the angle of sideslip and fin-and-rudder load occur at frequenoies much below the
al7 resonant frequency, the precise values depending on! , - a2 mds;*
(4) It follows from (3) that the present design requirement, which calls for movement of the rucVier at the damped resonant frequency up to a specified pedal force, does not elweys form the critical case. In soane cases greater angles of sideslip end fin-and-rudder loads msy be obtained by a slight reduotion in the frequency of rudder movement.
(5) If a power unit limits the rudder movement such that the design conditions cannot be realised the ensuing fin-and-rudder loads are in general lower than those of the present design requirement.
N6'lXTION
A&J coefficients in equation 9
a%f al =-ap (including effects of local sidewash at the tail)
a%f a2 = 3t;
b wing span
a% bl=-- w
(including effects of local sidewash at the tail)
a% b2 =a2:
Oh
%f
rudder hinge moment ooeffioient
lateral force coefficient of the fin and rudder
f . frequency of the sxa~soidal rudder movement ratio natural frequency of the damped yawing oscillations of the aircraft
g
-H
He i
0
J
gravity constant
rudder hinge moment
amplification factor in equation 5
coeffioient of inertia about the e axis
non-dimensional damped natural oirouler frequency of the eircraftinyaw
-8-
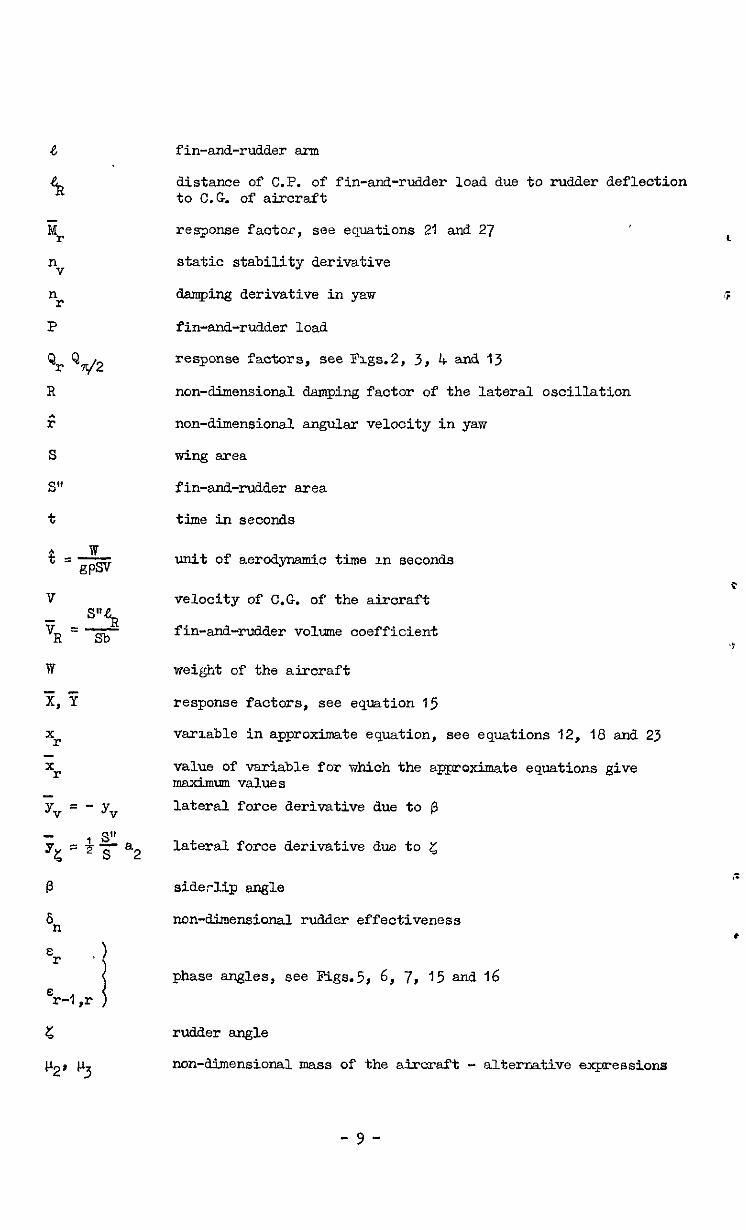
8 fin-and-rudder arm
53 distance of C.P. of fin-and-rudder load due to rudder deflection to C.G. of aircraft
E r remonse factor, see equations 21 and 27
n v static stability derivative
n r wing derivative in yaw
P fin-and-rudder load
Qr T/2 response factors, see Flgs.2, 3, 4 and 13
R non-dimensional damping factor of the lateral oscillation
; non-dimensional angular velocity in yaw
s wing area
S" fin-and-rudder area
t time in seconds
t =w gPw
unit of aerodynamic time m seconds
v velocity of C.G. of the airoraft
yR =gB fin-snd-rudder volume coefficient
w weight of the aircraft
Ti, T response factors, see equation 15
x r
variable in approximate equation, see equations 12, 18 and 23
x r value of variable for which the approximate equations give maximum values
TV = - Yv lateral force derivative due to fi
, S" Tc = F -g a2 lateral force derivative due to r:
P siderlip angle
$2 non-dimensional rudder effectiveness
E r ,) phase angles, see Figs.5, 6, 7, 15 and $6
E r-l ,r I
z rudder angle
cl,' p3 non-dimensional mass of the akrcraft - alternative expressions
,
-P-
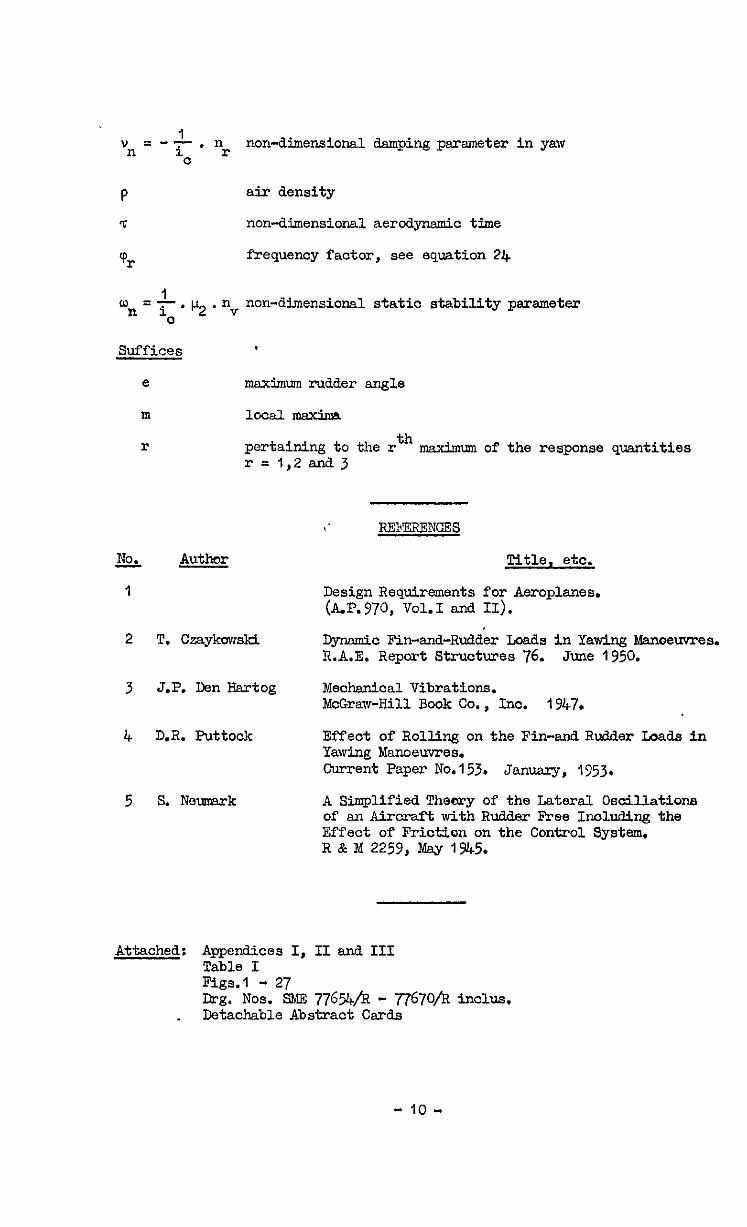
1 ” “‘7. n n 3. r
non-dimensional damping parameter in yaw c
P air density
7 non-dimensional aercd.ynemic time
'pr frequency factor, see equation 24
1 “!I = T.Pz. nv non-dimensional static stability parameter
0
Suffices
e
m
r pertaining to the r th maximum of the response quantities r = I,2 and3
No.
1
2
3
4
Author
REFEREN(=ES
Title, etc.
Design Requirements for Aeroplanes. (iLP.970, Vol.1 and II).
T. CzaykowsN Qnxmic Fin-and-Rudder Loads in Yawing bWmeuvres. R.A.E. Report Structures 76. June 1950.
J.P. &n Hmtog Mechanical Vibrations. McGraw-Hill Book Co., Inc. 1947.
D.R. Puttock Effeot of Rolling on the Fin-and Rudder Loads in Yawing Manoeuvres. Current Paper No.153. January, 1553.
5 S. Neumark A Simplified Theory of the Lateral Osoillations of anAiroraftwithRud&rF'ree Inoludingthe Effect of Friction on the Control System. R & M 2259, WY 1945.
Attached: Appendices I, II and III Table I Figs.1 - 27 a-g. Nos. S&B 776%/Q - 77670/R inclus..
. Detachable Abstract Cards
- 10 -


AFFTXDIXI
Analysis
A.1 Equations of motion
The non-dimensional equations of lateral motion of sn aircraft msy be written in the form, with the notation of ref.5.
Ol-
where
The underlying assumptions are that:
1. the fo-d speed is constant throughout the msnoeuwe,
2. the fin-end-rudder force derivative due tc rudder displaoement (yz) is negligible in equation(la),
*
3. the verticsl principal ads of inertia of the aircraft coincides with the s &s,
4. all rolling motion is neglected.
Equation(la (lb)msy be expressed in the farm
A dT2
t 2R 2 t (R* t J2)P = 6n5
(2)
R = $Gv + vn) = ncn-d.imensional dsmping factor of the oscillatory motion.
----_- _
J = \/on '( 2 1 (3)
- T vn - $ = non-dimensional dampednatural circular frequency factor of the J oscillatory motion.
It has been shown4 that, with the present trends in aircraft design, the assw@ion of zero rolling motion is tending to became invalid, However, it is also shown that the main effect of neglect of the rolling is to modify the numerical values of the parameters R and J, and that the effect of rolling may be taken into account by using the exact values of R and J in all the response formulae obtained fram the simplified approach. Fundamentally, it is necessary to add a furthsr equation, an equation of rolling moments, to equations (la) and (lb), and solve the resulting quartic to obtain the exact values of R snd J. In practice, however, a method of factorisation mtroduoed by Neumark5 msy be used for this purpose. In the analysis of
- II -
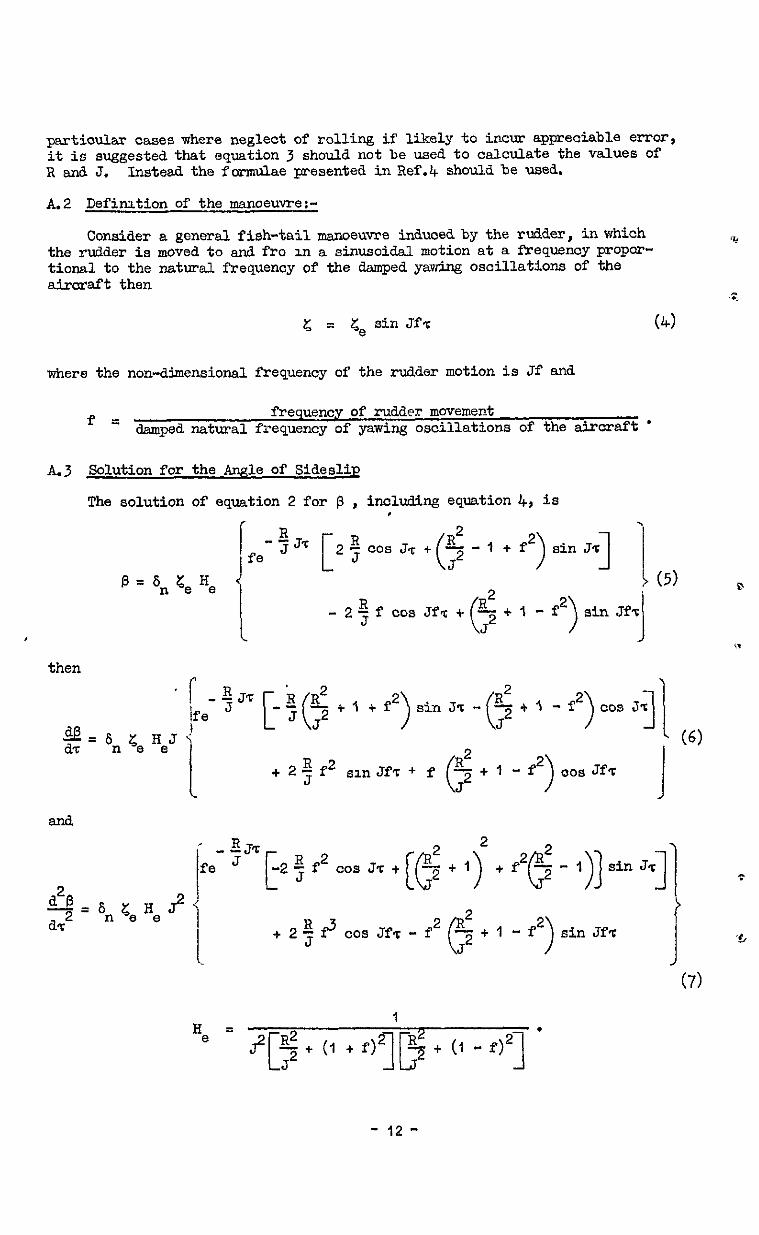
particular cases where neglect of rolling if likely to incur appeoiable error, it is suggested that equation 3 should not be used to calculate the values of R end J. Instead the fcumulae presented in Ref.4 should be used.
A.2 Defirution of the manoeuvre:-
Consider a general fish-tail manoeuvre induced by the rudder, in which the rudder is moved. to and fro m a sinusoidal motion at a frequency propar- tional to the natural frequency of the damped yavdng oscillations of the airaraft then
c = ce sin JUT (4)
where the non-dlnensional frequency of the rudder motion is Jf and
f = frequency of rudder movement
&mped. natural frequency of yawing oscillations of the aircraft '
A.3 Solution for the Ande of SidesliE
The solution of equation 2 for p , including equation 4, is
fe -!JT
P = 6, Ge He
i
(5) D
.g= 6n ‘e ‘eJ
+2g 2 Jf sm Jf% + f 00s Jf-z
cos JfT - f2 ($+I -f2)sinJfq i
'5
H =- e J!
1
-FG .
2 + (I + f)2 s + (I - f)2 lLZ 1
J
(7)
- 12 -
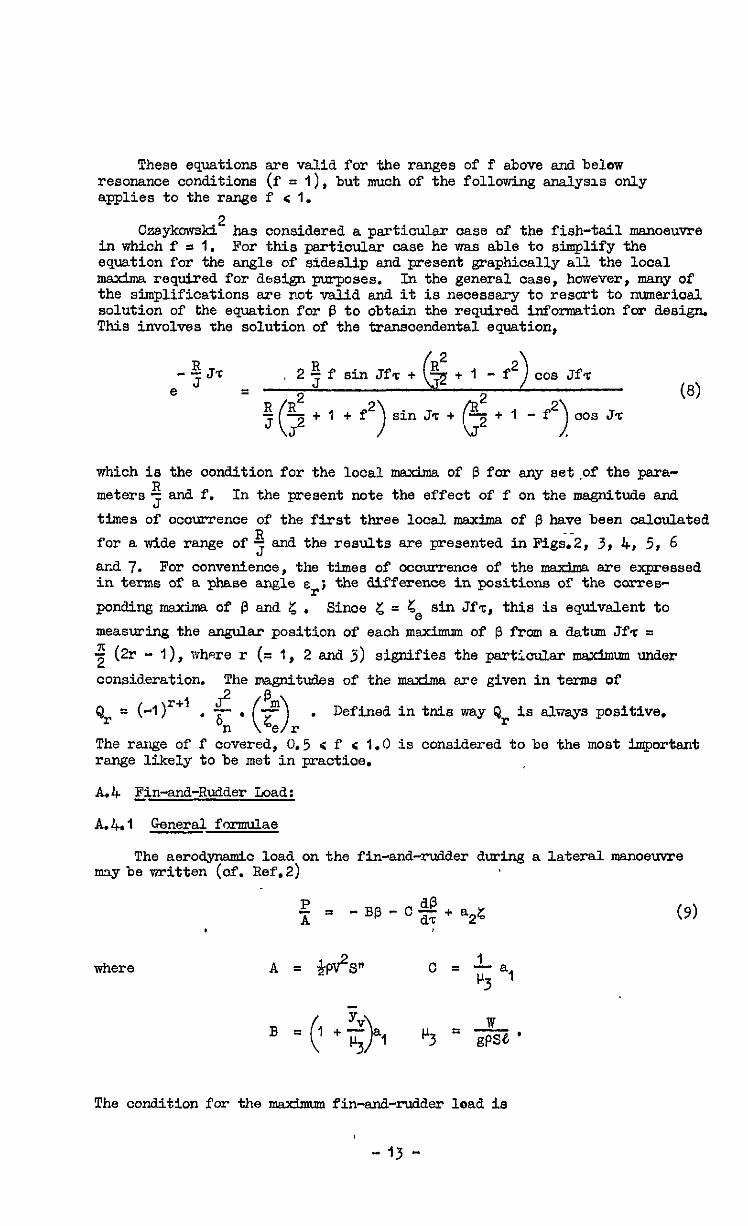
These equations are valid for the ranges of f above and below resonance conditions (f = I), but much of the following enalysxs only applies to the range f c 1.
Cseykowski* has considered a particular case of the fish-tail manoeuvre inwhichfsl. For this particular case he was able to simplify the equation for the angle of sideslip and present graphically all the local rimims. required for design purposes. In the general case, however, many of the simplifications are not valid end it is necessary to resort to numerical solution of the equation for p to obtain the required InPormation for design. This involves the solution of the transcendental equation,
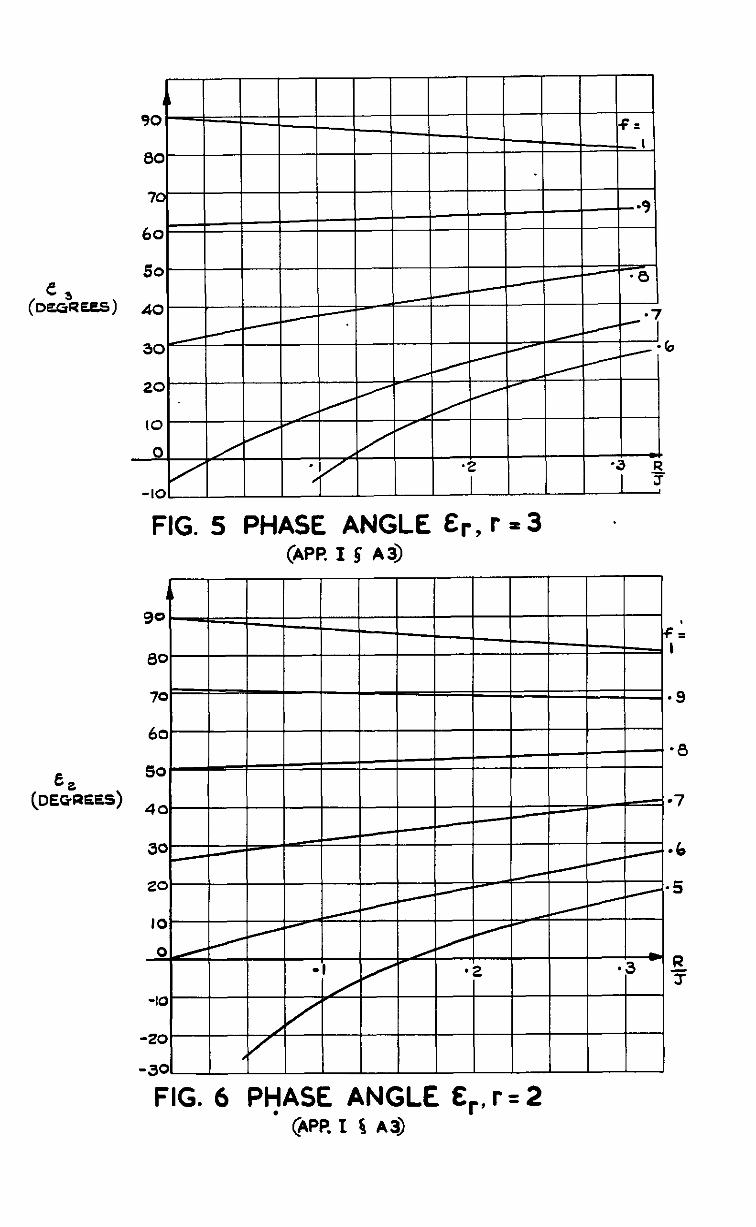
which is the condition for the local maxima of p for any set.of the pera- meters E J e.na f. In the present note the effect of f on the magnitude and times of ocourrence of the first three local mexima of p have been caloulated for a tide renge of 2 and the results are presented in I"igii2, 3, 4, 5, 6 sml 7. For convenience, the times of oc-ence of the maxima are expressed in terms of a phase angle 6~~; the difference in positions of the corres- pondingmexilnaofpenclt;. Sinoe z = ge sin Jfz, this is equivalent to measuring the angular position of each meximum of p fram a datum Jf% = $ (2r - I), h w ere r (= 1, 2 and J;) signifies the particular maximum under consideration. The magnitudes of the msxima are given in terms of
a, = ("I y+' . f . (?) . Defined in tnis way Qr is always positive.
The range of f covered: <5 c f c 1.0 is considered to be the most important range likely to be met in practice.
A.4 in-and-Rudder Load:
A.lbl General formulae
The aerodynsdc load on the fin-and-rudder during a lateral manoeuvre mxybe written (cf. Ref.2)
where
7 B = 1 + ,v a1 ( >
W
p3 p3 = gpsL'
The condition for the maximum fin-and-ruader load is
- 13 -

(IO)
Using equations 4, 6 and 7 this condition may be rewritten as
It is obvxous that this equation is too complex to be of any practical value. The complexity is due to the nature‘of the equations for p and
3 and, as implied in the previous paragraph, it is not possible to introduce 3 general simplifications into the equations for p and dz , Iiowever, it is
possible to replace them locally by simpler functions for use in equations 9 and 40. In this way the labour can be kept to a minimum without eny great loss in accuracy.
A.4.2 Approximate formulae for the fin-and-rudder load
Calculaticns have indicated that, in the general case, the component of the fin-and-rudder load which is dependent on%! has a marked influence on the
precise positions of the maxima of the total load, although the magnitudes of these maxima are not appreciably affected, It is usually necessary to know both the total fin-and-rudder load and the load due to the rudder alone, and, since the load due to the rudder displacement alone is directly proportional to the position of Lhe rudder at the Pm, it appears that the position of the Pm should be determined as accurately as possible. It is felt, therefore, that
the term proportional to z , which may be neglected in the particular case f = 1 (cf. Ref.2), should be retained in the general case.
An analysis of the time histories of 0 and P in tne general manoeuvre - see Fig.10 for example - suggests that, with the usual ranges of parameters, the various maxima of P occur later in the manoeuvre than the corresponding ~EIX~EL of @ (i.e. if -ihe first small maximum of P is ignored). However, the phase angle between them is usually small. The new functions for p and2 need
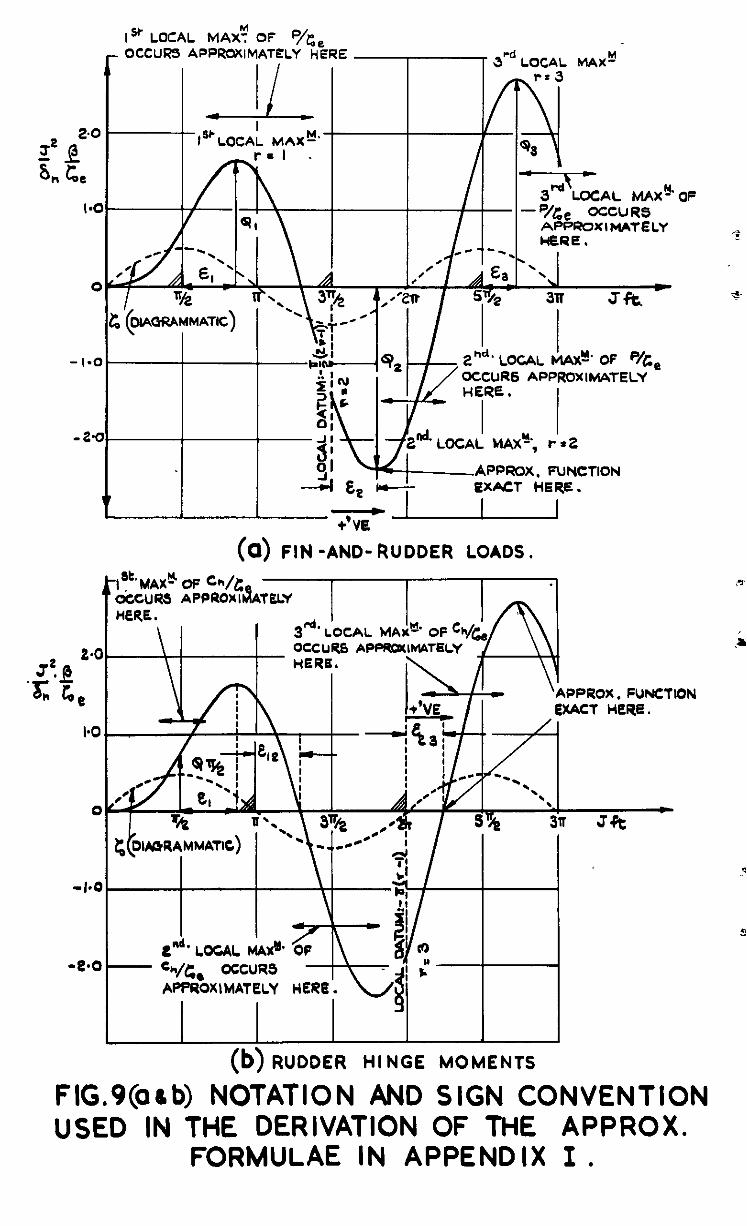
only be accurate, therefore, in the regions of the corresponding maxima of p and P. The response in B is oscillatory in character and a suitable function to describe the motion locally is found to be a cFrcul.ar function in which the ooeffioxents and phase angles are chosen to give the local maxima exactly both in position and magnitude. The frequency of the new function may be assumed to be the same as that of the rudder movement. For convenience a separate datm is constiered for each maximum. For the rth maximum the local function for P is, using the notation of Fig.9
J2 n* (p), = (-I)~+’ Q~ cos - (2r - 1) $ - sr >
= (-1 y+’ Q, cos (xr - Er) (12)
- 14-
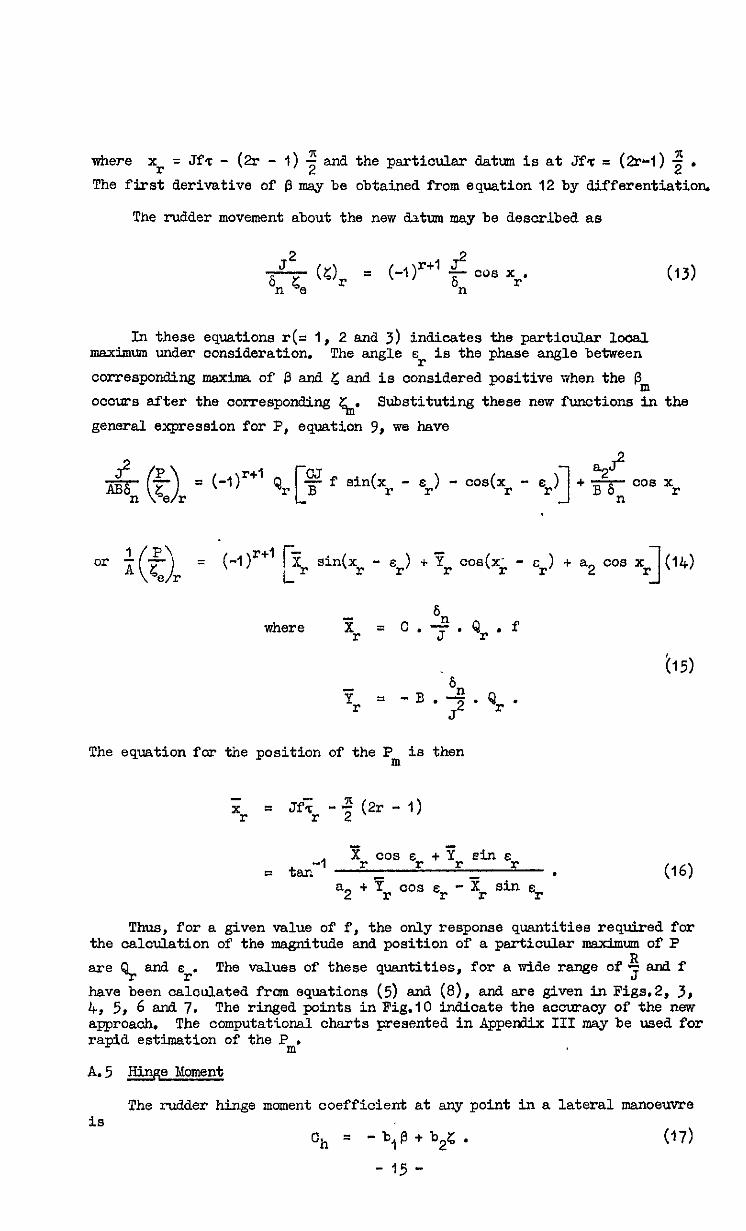
where xr=Jf,-(a-1) 5 and the particular datum is at Jfz = (a-1) f . The first derivative of p msy be obtained from equation 12 by differentiation.
The rudder movement about the new titum may be described as
& (g), = (-l)r+' f CO8 xr. (13)
In these equations r(= I, 2 and 3) indicates the particular local maximum under consideration. The angle sr is the phase angle between corresponding maxima of I3 and t: and is considered positive when the pm occws after the corresponding Q Substituting these new functions in the general expression for P, equation 9, we have
= (-IF+' Q, f sin(xr - Er) - cos(xr - Er) 1 Er) + ‘i;, CO”(X;’ - cr) + a2 co9 xr
1 (14)
6 where Tr = C . f . Qr . f
6 Pr = - D . -n . Qr .
J2
The equation for tine position of the Pm is then
x r = JfTr-S(*r-l)
= tar-’ ” 00s Er t Tr sin E
r .
a2 t Tr co9 E r - Zr sin s r (16)
Thus, for a given value of f, the only response quantities required for the calculation of the magnitude and position of a particular maximum of P are F ana Er* The values of these quantities, for a wide range of J Ramif have been calculated from equations (5) and (E), and are given in Figs.2, 3, 4, 5, 6 and 7. The ringed points in Fig.10 indicate the accuracy of the new approach. The computational charts presented in Appendix III may be used for rapid estimation of the Pm.
A.5 Hinge Moment
The rudder hinge moment coefficient at sny point in a lateral manoeuvre iS
Ch = -b,P+b2r;. (17)
- 15 -

The conditmn for the Cb is rather unwieldy, and the investigation of a particular case would be tedious. Hwever, using the same technique as has been used m the previous section, approximate formulae msy be derived to reduce the labour in such instsxces without any great loss in accuracy. All the maxima except the first may be obtained from a general formula.
1st Maximm:-
With typical values of b, and b2, the first maximum of Ch occurs close to Jfz =; . In this region the response u @ varies approximately as (1 - 00s Jf%). If the new function for p is chosen such that it is exact at JfT = 0 and+ , we have, assuming the frequency of the motion to be the same as the frequency of the rudder displacement
ft =Qn/ 0 e 2 . (I - 00s xr)
where x = JfT and. r r = 1.
Equation (17) becomes
22
0
6
z = - +$ . b, . Q2 . (1 -
el cos x,) + b2 sin x,
= ii, (1 - cos x,) t b2 sin x 1
where
The position of the maximum is at
-1 b2 4
=tsn -=--. ( >
Ml
(19)
(20)
(21)
(22)
Further Maxima:-
The dominant term in the equation for Ch, equation (17), is b2z . Thus for normal values of b, and b2, the maxima in Ch will occur close to the corresponding maxima in t; end the phase angle between corresponding maxima of and Ch may be large. The function previously used to replace p locally (~.4.2 P is only accurate in the region of each pm. A more general function is therefore needed if accurate values of the remaining Ch are to be obtained.
m
- 16 -

A suitable general function is a sine function which gives exactly,the positions of B = 0 end the following pm (in the region of the Ch in
m question) snd also the magnitude of the pm. The frequency of the new funotior. is then automatically defined.
The function is (see also Fig.9)
h n 0 er = (-i)r+’ CL, sin Qr (Xr - Er-q ,r)
where the local datum is at Jf% = x(1-1) and r = 2, 3 etc.
(S-1 r ) is the phase angle between the positions of the corresponding p = O'and t: = 0, considered positive when p = 0 occurs after g = 0 and
Qr = local frequency of the response in 13 frequency of applied rudder movement
Also
J2 & 0
rtl 2 . b = n G r t-11 x . s9.n xr.
(23)
(25)
Hence equation (Ii') becomes
q (-l)r+’ Qr . 3 . b, . sin Q~(X~ - Ed-, + b2 Sin xr
= (-,y+’ er sin ‘pr (xr - E,,+) + b2 sin xr)
The positions of the maxima are given by the following equation
00s x r 5 Q E -c,
mJs QrGr - Er-.l,J b2
Within the ranges of + and f considered in this note the range of vr is
0.8: .z 'pr ( 1.2. For such &xses
CO9 Qr& - Er-, r 2 WS& - Er+) ,)
- 17 -

an3 equation (28) my be simplified to
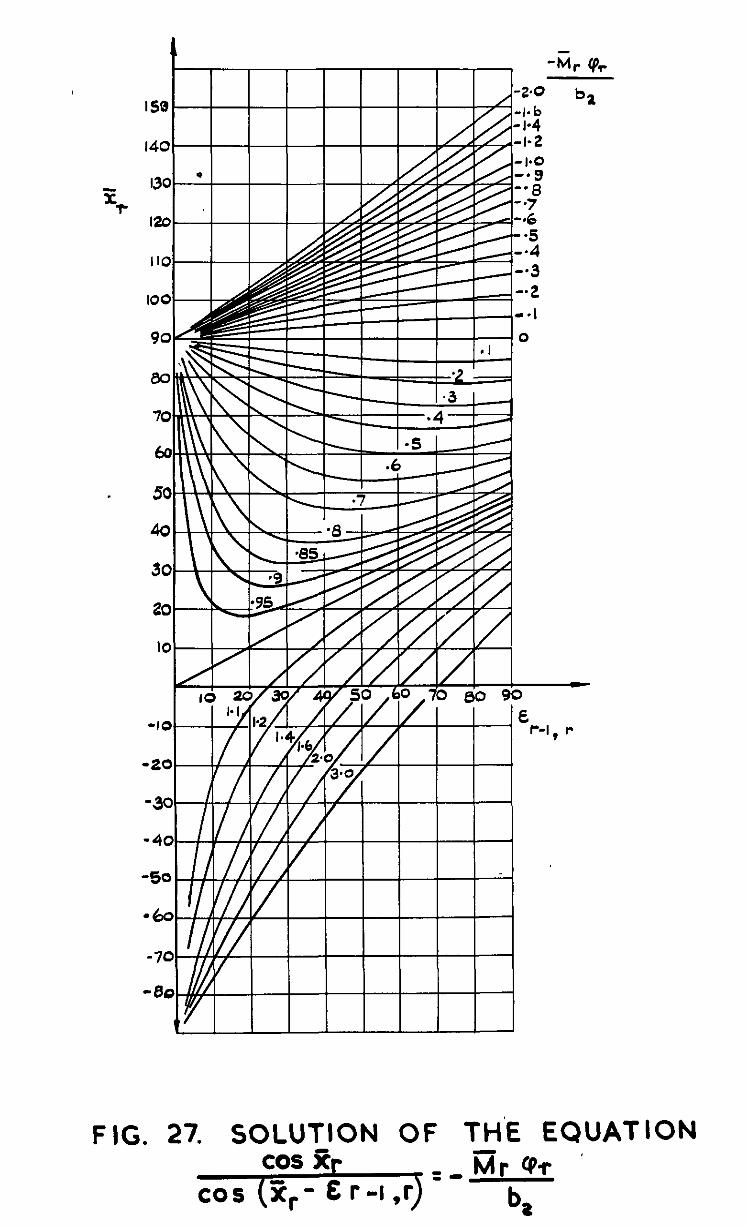
cos x r E q
00s - - E (3 = mu*
r-l ,r b2
The solution to an equation of this type is given in Fig.27 for a oon- siderable range of parameters.
Thus for rapid estimation of the Ch , the only additional response In
quantities, over and above those used in the estimation of the Pm, sre Q "12
ana T- 1 I-* These maybe found from equation (5). The values have been derived fn the present note for a wide range of 5 and f; the results are given
inFigs.13, 15 and 16.
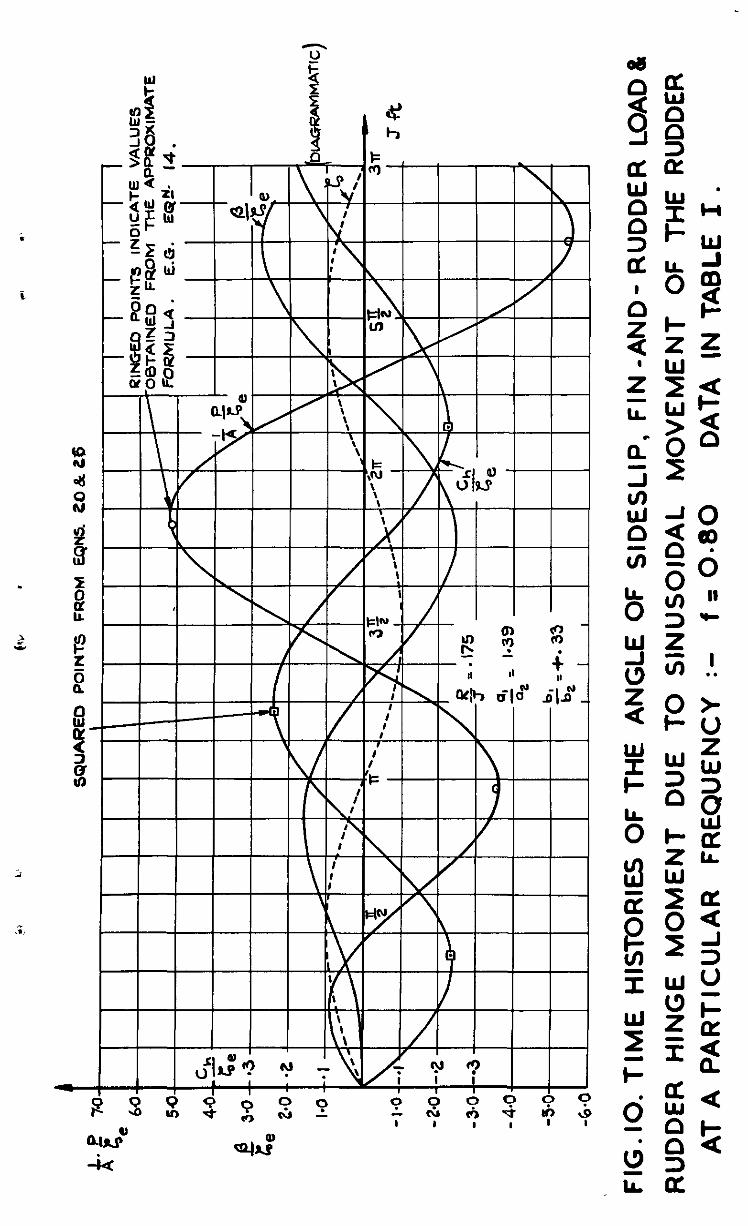
Fig.10 gives the exact response in p, P and Gh to‘s fish-tall manoeuwe for the aircraft considered in Table I. The ringed points are the maxima of P and Ch as calculated by the above fotiae. It is seen that the approximate values are accurate to within 5%.
- 18 -

APPENDIX11
Detailed Discussion
The primery object of the present investigation has been to exemine the effects of direct end power assisted rudder movement in relation to the design requirementl. Th3.s has necessitated a very detailed analysis of the general effeots of rudder movement on the ensuing loading conditions. The chief points of interest are reported in pera. of the mein text, but the dekiled discussion covering these points end further points cf perhaps secondary interest from the s&worthiness aspeot are given in this Appendix. The Appendix is self oontained and has the same general layout as para.3,
B.1 Effect of Frequenoy of Rudder Movement on the Response in Yaw
B.l.1 Introduction
To simplify the discussion, consideration is first given to the manner in which the various response quantities are affeoted by variations in the frequency of a sinusoidal rudder movement of constant amplitude (para.1.2). Then the quantities are considered in terms of a maximum pedal force for the same frequency range (pera.1.3). '
The rudder movement is defined as 5 = t;, sin Jf% where J is the non- dimensional, dsmped, natural circular frequency of the eiroraft in yaw, and ge is the amplitude of the movement. The non-dimensional oiroulsr frequenoy of the rudder movement is Jf, and f is, therefore, the ratio between the rudder frequency and the damped, natural yawzing frequency of the aircraft. The case f = 1 corresponds to movement of the rudder at the demped resonant frequency of the aircraft in yaw. The non-dimensional rate of movement of the rudder is 2 = Jft; e cos JfT and the meximum (initial) rate is Jfrd,. Thus when the response is expressed in terms of the amplitude of rudder movement, a variation in f indicates a proportional variation in both the frequency and mexlmum rate of movement of the rudder. Hczever, if the response 1s expressed m terms of the maximum pedal fame, a variation in f still indicates a proportional change in the frequency of the displacement, but the maximum rate of displacement depends on g,, which, in turn, depends on the hinge moment cheraoteristics of the rudder and, as will be seen later, on f itself although not proportional to it.
B.l.2 Response oer unit amplitude cf rudder movement
B.1.2.1 tile of sideslip
The cmves in Fig.1 give the response of an aircraft in angle of side- slip to sinusoidal movement of the rudder at POLL? different frequencies. All the curves are presented with Jfz = Jr .
0 z t, which is proportional to
non-dimensione.1 time, as a common base. In this way the disturbing movement, g = ge sin JfT , appears as a single curve irrespeotive of the frequency. Plotted against JT, the curves of response would be considerably closer together with a resultant loss in clarity. It is seen that, while the general character of the curves is the same, both the positions and magnitudes of the local maxima are affeoted by variations in f. It is also apparent that the msnner in which each of these maxima is affeoted depends on the partioular local meximum in question.
- 19-
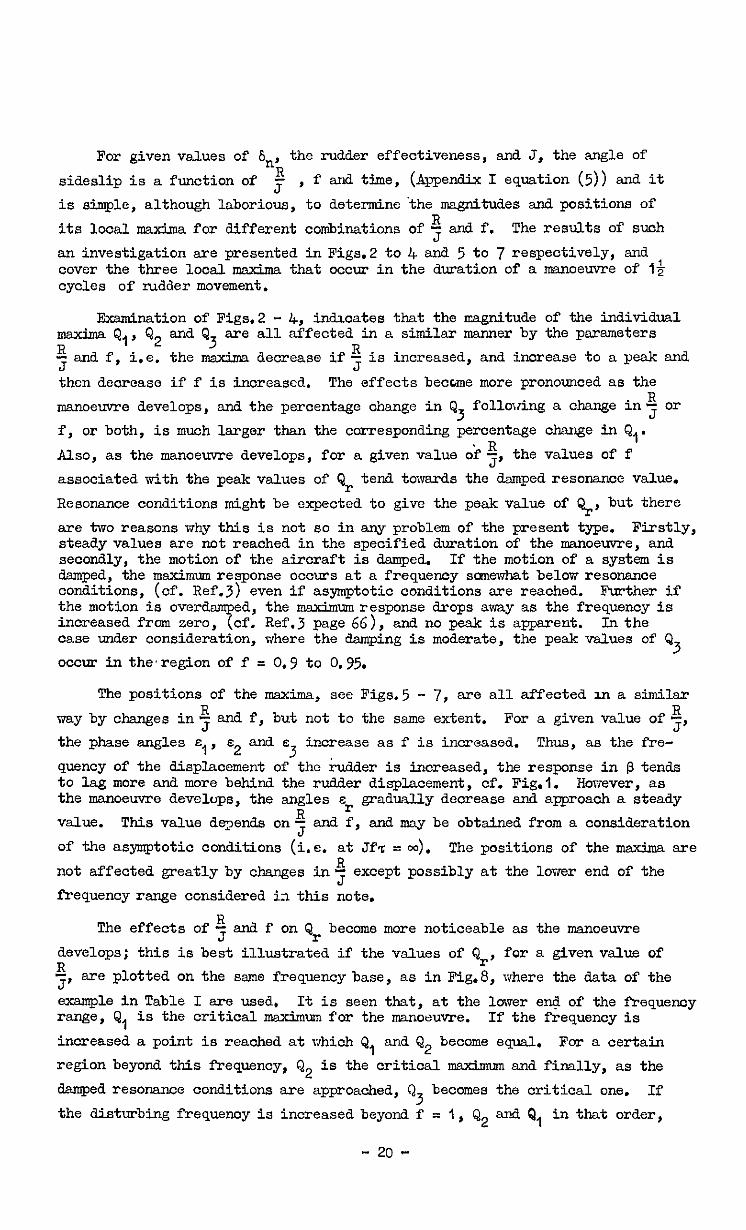
For given values of 6,, the rudder effectiveness, and J, the angle of
sideslip is a function of $ , f and time, (Amen&ix I equation (5)) and it
is simple, although laborious, to determine the magnitudes and positions of its local maxima for different combinations of! and f. The results of such
an investigation are presented in Figs.2 to 4 and 5 to 7 respectively, and cover the three local msxima that occur in the duration of a manoeuvre of 13 cycles of rddder movement.
Examination of Figs.2 - 4, indicates that the magnitude of the individual maxima Q,, Q, and Q are all affected in a similar manner by the parameters
3 s and f, i.e. the maxima decrease if? is increased, and increase to a peak and
then decrease if f is increased, The effects becwne more pronounced as the
manoeuvre develops, and the percentage change in Q3 following a change in J g or
f, or both, is muoh larger than the corresponding percentage change in Q,. Also, as the manoeuvre develops, for a given value ok{, the values of f
associated with the peak values of Qr tend. towards the damped resonance value. Resonance conditions might be expected to give the peak value of Qr, but there are two reasons why this is not so in any problem of the present type. Firstly, steady values are not reached in the specified duration of the manoeuvre, and secondly, the motion of the aircraft is wed. If the motion of a system is demped, the msximum response occurs at a frequency scmewbat below resonance g$-;, ip;;e;gf. 3 1 even if asymptotic conditions are reached. Father if
T ed, the maximum response drops away as the frequency is
increased from zero, cf. Ref.3 page 66), and no peak is apparent. In the case under consideration, where the dsmping is moderate, the peak values of Q
3 occur in the’region of f = 0.7 to 0.95.
The positions of the msdma, see Figs.5 - 7, are all affected 111 a similar way by changes in $ and f, but not to the same extent. For a given value of %, the phase angles s,, 2 s and s increase as f is increased.
3 Thus, as the fre-
quency of the displacement of the kudder is increased, the response in p tends to lag more and more behind the rudder displacement, cf. Fig.1. However, as the manoeuvre develops, the angles sr gradually decrease and approach a steady value. This value dqmnds on $ and f, and may be obtained from a consideration Of the asymptotic conditions (i.e. at Jfq = co). The positions of the msxzima are not affected greatly by changes in J 2 except possibly at the lower end of the frequency range considered i:l this note.
The effects of g J and f on Qr become more noticeable as the manoeuvre develops; this is best illustrated if the values of Qr, for a given value of R 7
are plotted on the same frequency base, as in Fig.8, where the data of the example In Table I are used, It is seen that, at the lower er@ of the frequency range, Q, is the critical maximum for the manoeuvre. If the frequency is increased a point is reached at which Q, and Q2 become equal. For a certain region beyond this frequency, Q, is the critical maximum and finally, as the damped. resonance conditions are approached, (2 becomes the critical one. If
3 the disturbing frequency is increased beyond f = 1, Q2 and Q, in that order,
- 20 -
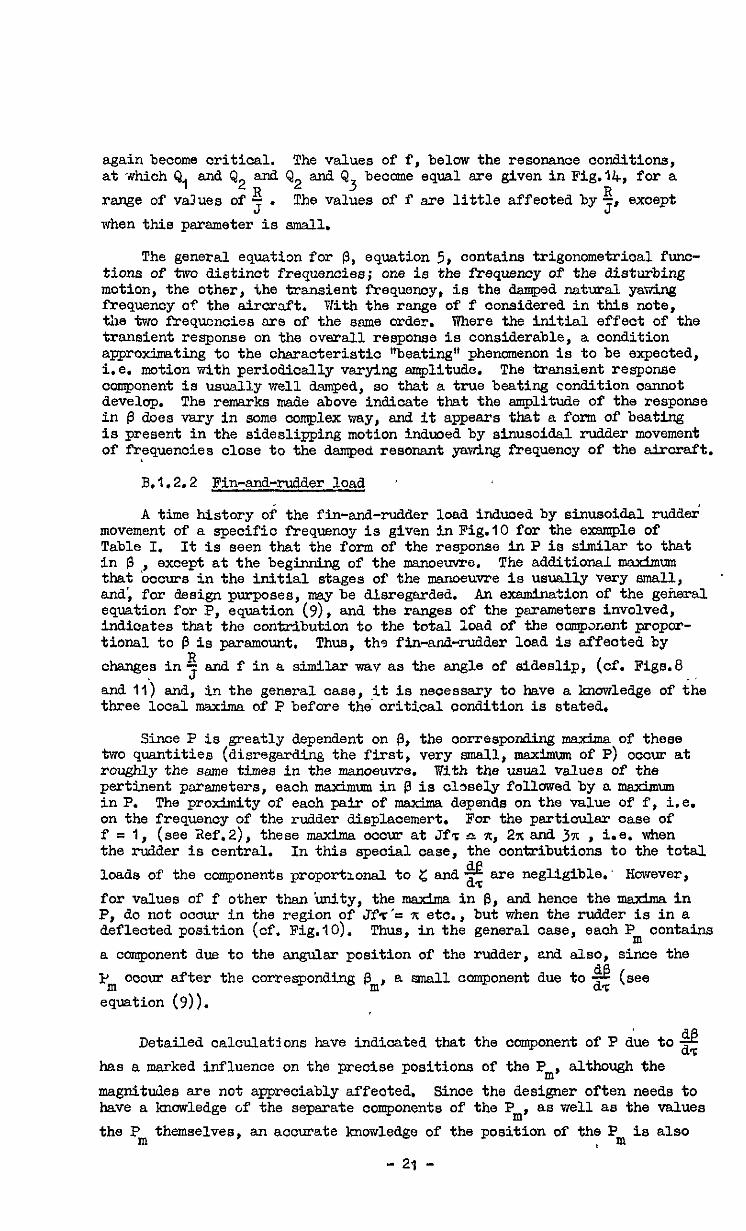
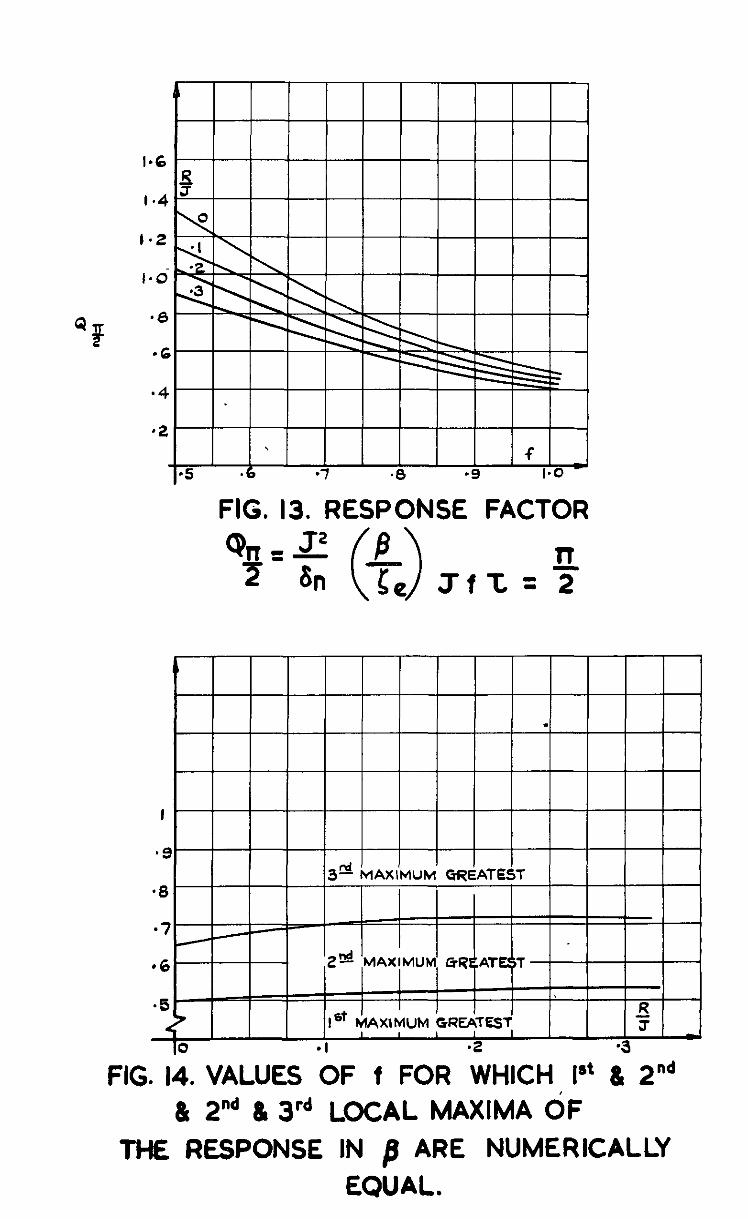
again become critical, The values of f, below the resonance conditions, at which Q, end Q, and Q2 end Q range of values of $.
3 become equal are given in Fig.14, for a The values of f are little affected by:, exoept
when this parameter is emsll,
The general equation for g, equation 5, contains trigonometrical func- tions of two distinct frequencies; one is the frequency of the disturbing motion, the other, the transient frequency, is the dsmped natureit yawing frequency of the aircraft. With the rsnge of f oonsidered in this note, the two frequencies are of the same order. Where the initial effect of the transient response on the overall response is considerable, a condition approximating to the characteristic "beating" phenomenon is to be expeoted, i.e. motion with periodically varying amplitude. The transient response component is usuelly well damped, so that a true beating condition osnnot develup. The remarks made above indicate that the amplitude of the response in (3 does very in some complex way, end it appears that a fom of beating is present in the sideslipping motion induoed by sinusoidal rudder movement of frequencies close to the damped resonant yaw%ng frequency of the aircraft.
B.1.2.2 Fin-and-rudder load '
A time history of the fin-and-rudder load induced by sinusoidal rudd& movement of a specific frequency is given in Fig.10 for the exsmple of Table I. It is seen that the form of the response In P is similsr to that in P ,, except at the beginning of the manoeuvre. The additional meximtu~~ that occurs in the initial stages of the manoeuvre is usually very small, and; for design purposes, mey be G®arded. An e2eimination of the general equation for P, equation (q), and the ranges of the parsmeters involved, indicates that the contribution to the total hid of the ccmpenent propor- tional to g is paramount, Thus, the fin-and-rudder load is affected by changes in+ end f in a skmilsr mav as the angle of sideslip, (cf. Figs.8 _ end 11') and, in the general case, it is necessary to have a bowledge of the three loosl maxima of P before the Gritice oondition is stated.
Sinoe P is greatly dependent on g, the oarresponding maxima of these two quantities (disregarding the first, very small, maxti of P) occur at roughly the same tines in the manoeuvre. With the usual values of the pertinent parameters, each maximm in p is closely followed by a msz&num in P. The proximity of each pair of maxima depends on the value of f, i.e. on the frequency of the rudder displacemert. For the particular case of f = I, (see Sef.2), these maxima occur at Jf% p. 7[, 2x snd 3x , i.e. when the rudder is central. In this speoial case, the contributions to the total
2zE loads of the components proport~onsl to c and do are negligible,' However, for values of f other thsn'unity, the msxima in g, and hence the msxhaa in P, do not ooour in the region of Jf%'e ?c eta., but when the rudder is in a deflected position (cf. Fig.10). Thus, in the general case, each Pm contains a component due to the angular position of the rudder, and also, since the Pm occur after the corresponding pm, a small component due to $ (see
equation (9)).
AC? Detailed calculations have indicated that the component of P due to d7 has a marked influence on the precise positions of the Pm, although the magnitudes ere not appreciably affeoted, Since the designer often needs to have a lonowledge of the separate components of the Pm, as well as the values the Pm themselves, an accurate knowledge of the position of the Pm is also
- 23 -
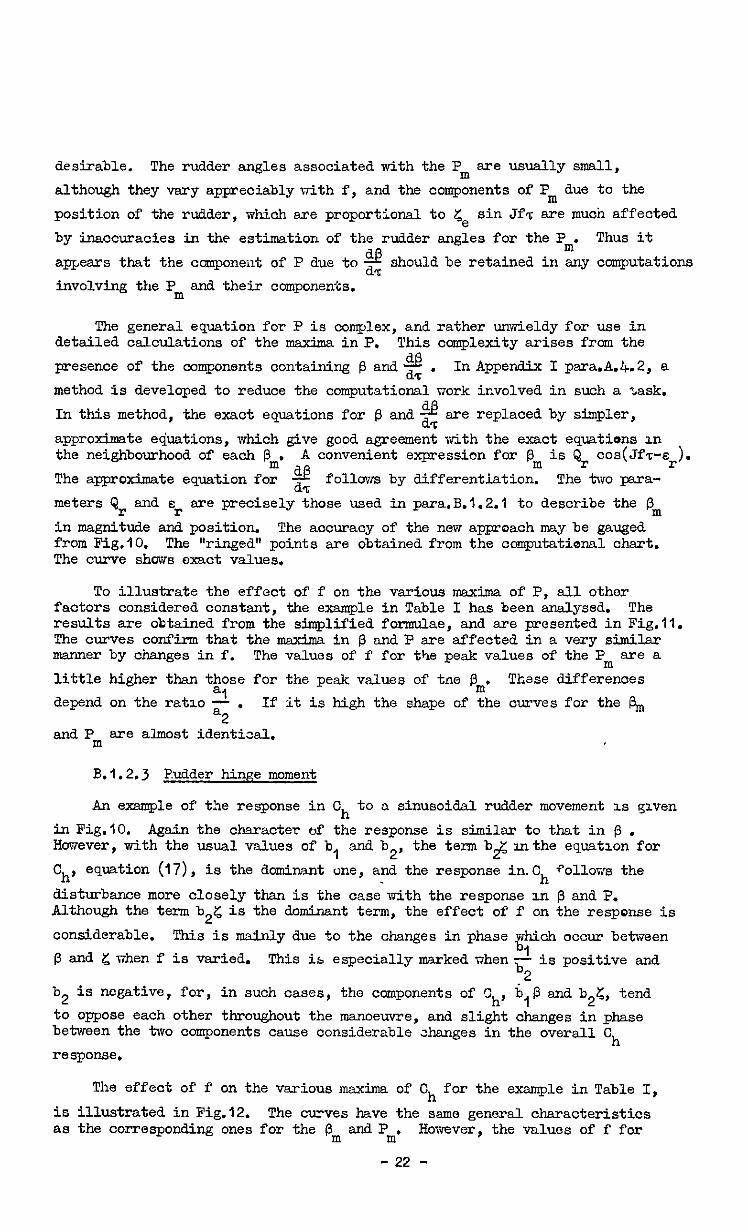
desirable. The rudder angles associated with the Pm are usually small, although they vary appreciably nith f, and the components of Pm due to the position of the rudder, which are proportional to ge sin Jf% are much affected by inaccuracies in the estimation of the rudder angles for the Pm. Thus it appears that the ccmponent of P due to do 2.2 should be retained in any computations
involving the Pm and their components.
The general equation for P is complex, and rather unwieldy for use in detailed calculations of the maxima in P. This complexity arises from the presence of the components containing p and do . 5% In Appendix I para.A.4.2, a method is developed to reduce the computational work involved in such a task. In this method, the exact equations for @ and. d7 are replaced by simpler, 2
approximate e&ations, which give good agreement with the exact equations In the neighbourhood of each p . A convenient expression for Bm is Qr cos(JfT-sr). The approximate equation for m z follows by differentiation. The two pwa-
meters Qr end sr are precisely those used in para.B.1.2.1 to describe the 0, in magnitude and position. The accuracy of the new approach may be gauged from Fig.10. The "ringed" points are obtained from the ccmputatienal chart. The curve shows exact values.
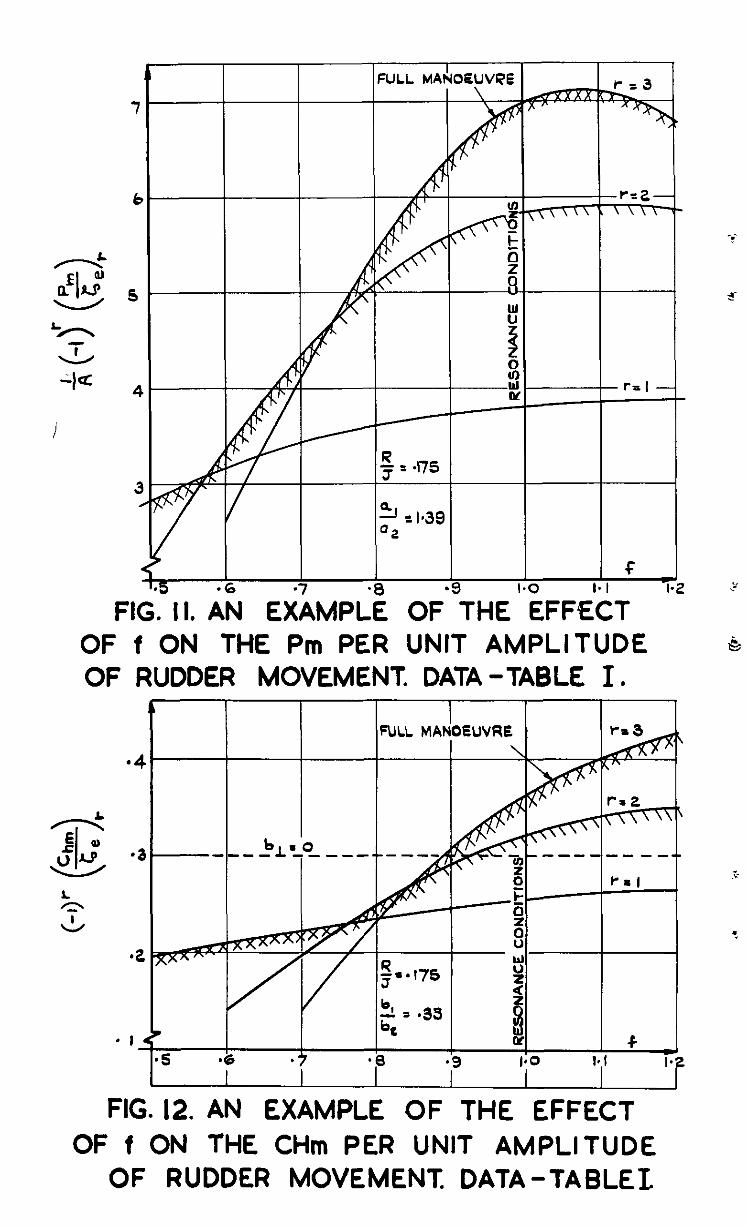
To illustrate the effect of f on the various maxima of P, all other factors considered constant, the example in Table I has been analysed. The results are obtained from the simplified formulae, and are presented in Fig.11. The curves confirm that the msxima in fs and P are affected in a very similsr manner by changes in f. The values of f for the peak values of the Pm are a little higher than those for the peak values of tne @ . These differences depend on the ratlo "1 . If it is high the shape of The curves for the &,
a2 and Pm are almost identical.
B.1.2.j F?udder hinge moment
An example of the response in Ch to a sinusoidal rudder movement 3.6 gxven in Fig.10. Again the character of the response is similar to that in p . However, with the usual values of bl and b2, the term b& mthe equation for
'h' equation (IT), is the dominant one, and the response in.C ~0110~s the h
disturbance more closely than is the case'with the response m p and P. Although the term b2z is the do minant term, the effect of f on the response is cotiderable. This is mainly due to the changes in phase which occur between 13 and t; -hen f is varied. This ib especially marked Ghhenb is positive and bl
2 b2 is negative, for, in such cases, the components of Sh, 6,p and b2?& tend to oppose each other throughout the manoeuvre, and slight changes in phase between the two components cause considerable changes in the overall Ch
response.
The effect of f on the various maxima of Ch for the example in Table I, is illustrated in Fig.12. The curves have the same general characteristics as the corresponding ones for the pm and Pm. However, the values of f for
- 22 -

the peak values of the Ch are higher than in either of the other cases. m
The dotted line represents the maxima of Ch for the special case b, = 0 and divergence from this line, at any value of f, is entirely the effect of b,g i.e. the effect of the response of the aircraft in p . Be& f = 0.9 in this particular example, the response of the aircraft reduces the hinge moment below the value obtained from the rudder alone. This tendency i;s likely to be present if a is positive and b2 is negative. The ratio $ bl
2 2 has a controlling influence on the value of f at which the effect of the response of the aircraft changes sign. The significance of this feature till be discussed more fully in psxx..B.1.3.
The curves in Fig.12 indicate that it is necessary to calculate the values of all three C h before stating the absolute maximum for the
manoeuvre. HoiYever, Ge character of the equation for Ch, equation (I?), is basically the same as that for P, and it is consequently unsuitable for use in detailed calculations because of the labour involved. In Appendix I psra.A.5 further approxunate equations for g are introduced to simplify the equation for Ch. For the 1st maximum of Ch, g is expressed as a function
Q~~2(1-cos Jfz) where Qm12 is,a responsu factor involving the Vslue of p at
Jfz = $ (see Fig.lJ), and for the 2nd and 3rd maz&na, fi is expressed as a function of Qr sin 'pr (Jf% - sr-, r,. ) In both cases, the approximate equation for Ch may be tabulated for calculation of the maxima. The
relevant charts are given in Append& III. The accuracy of the approach maybe gauged from Fig.lO. The squsrod points sre obtained from the approximate equations; the curve shows the exact values.
B.l.3 Response per unit maximum pedal force
go far the discussion has been confined to consideration of the effect of f on the response in 8, P and Ch induced by unit amplitude sinusoidal
rudder movement. The present design requirement specifies an amplitude of movement corresponding to a given pedal force being the maximum force applied in the manoeuvre. To compare the fin-and-rudder load for the design case f = 1, and the load induced by sinusoidal movement of the rudder at other frequencies, the effects of f on such quantities as the Pm and Pm per unit maximum Ch are required. Because of the large nlrmber of persmeoers
involved, the effects are best illust ated b an example. 4n E+$n
In the previous
paragraphs, the effects of f onr , - have been given for the ce
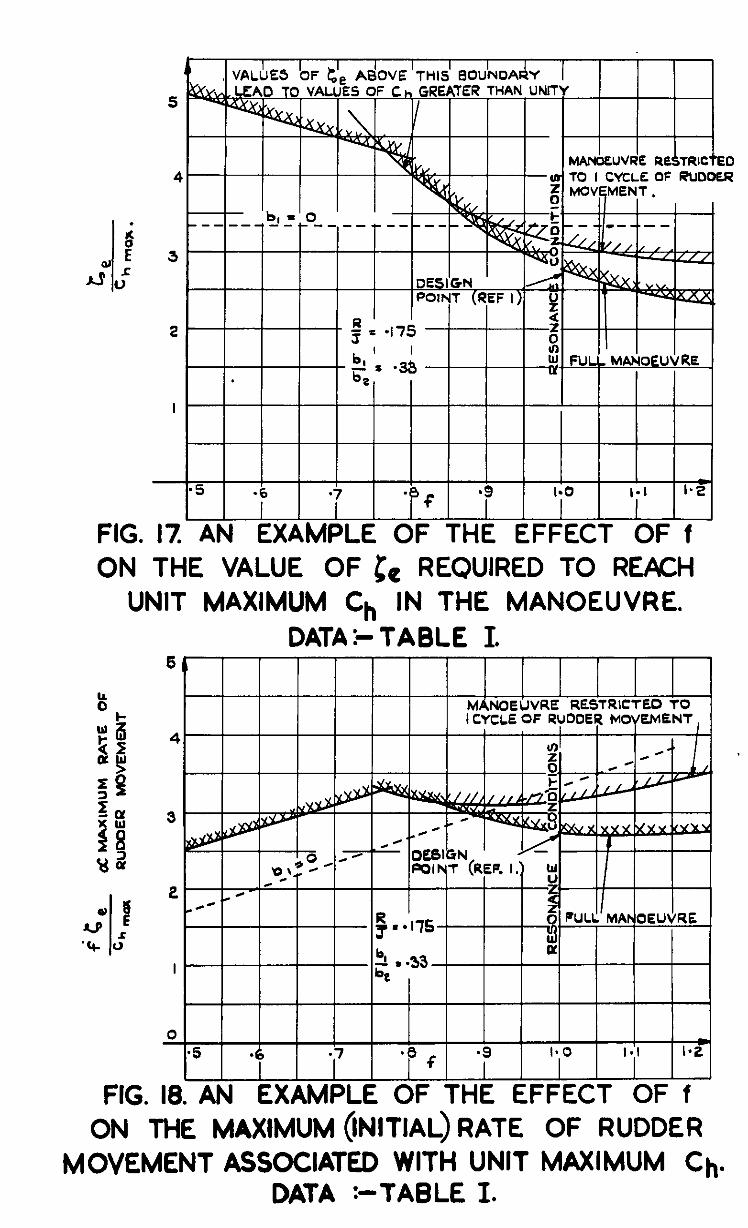
the example in Table I - see Figsyg, 1; and 12. At sny value of f; the uppermost curve in each figure gives the absolute maximum value of each quantity produced in the full manoeuvre of 1s cycles of rudder displacement. If only one cycle of rudder displacement is to be considered, the curve for the third maximum r = 3, may be neglected in each case. If the reciprocal of the vslues on the upper boundary in Fig.12 are calculated, the resultant curve gives the value of t;e at each value of f, which must bz applied to obtain unit C
'rn at some point in the manoeuvre. The curve is given in
Fig.17. Any combination of ge and f below this curve does not produce unit Ch at any time during the msnoeuvre considered. Conversely, if a combination
m - 23 -

above the curve is selected, unit Ch will be excaeded. It is seen that, as m
f is increased, the amplitude of rudder movement to produce unit maximum Ch decreases considerably. This effect is likely to occur in all cases where
bl 'i;- is positive and b2 is negative. 2
The rapidity with which ze decreases as
bl f is increased depends on the magnitude of 6 . The curve is discontinuous 2
since it is based on the upper boundary in Fig.12. The points of discontinuity correspond to value&of f at which the absolute maximum of Ch for the manoeuvre ahanges from one local maximum to the next (see para.B.1.2.3). The dotted line represents the special case b, = 0. The relieving effect of the aircraft
response is clearly demonstrated,
If the combination of f and ce at each frequency, to produce unit maximum Ch is kr~own, the corresponding maximum (initial) rates of displacement of the rudder may be calculated since the maximum rate is proportional to fr; . The curve for the present ewle is given in Fig.18. The area below the curve corresponds to conditions which do not produce unit msximum Ch in the specified duration of the manoeuvre. The mexlmum rate increased to a peak and then drops as f is increased.
bl In general, the position and magnitude of the peak depends
on-. b2
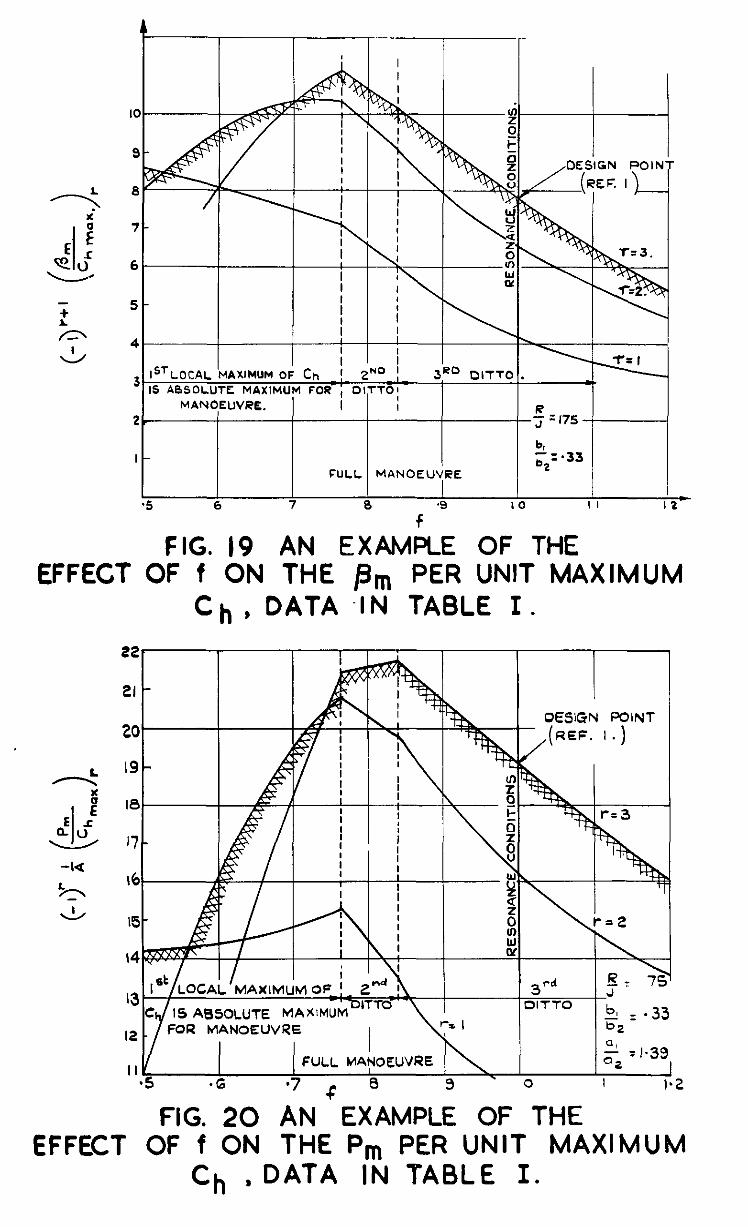
The curves of the pm and Pm per unit maximum Ch are plotted in Pigs.19 and 20. They are similar in character to those for the pm and Pm per unit ze, but there is one imports& difference, namely that the peak values of the p m and Pm per unit maximum Ch do not occur at or close to f = 1. Consequently, the damped resonance condition (i.e. the present design case) does not necessarily represent the critical loading case. In the present example, the greatest pm, at f = 0.765, is 39% greater than the largest pm at f = 1. Similarly the greatest value of Pm, at f = 0.84, is nearly 1% greater than the largest Pm at f = 1. A similar state exists if the duration of the
manoeuvre is restricted to one cycle of rudder displacement.
Thus although the pilot may tend to displace the rudder at the damped natural yawing frequency of the alrcrsft if he executes a manoeuvre approxi- mating to the fish-tail manoeuvre,'he till be able, vnth conventional rudder controls and control characteristics, to apply a greater rudder amplitude for a given maximm pedal force than in the dsmped resonance condition by reducing the frequency of the displacement slightly (because of the relieving effect of the response of the aircraft on the hinge moments at low frequencies). Such an action will give rise to greater angles of sideslip and fin-and-rudder loads thnn those associated with the resonance case. The msximum rate of movement will be slightly higher than that associated with resonance conditions but, with direct control, it should be attainable without undue effort.
These remarks only apply stristly to the chosen example. The important parameters are a,, a2, b,, b2 and /J, and provided these do not change much the overall picture will be similar,
-ue-
B.2 Effect of a power unit on the rudder movement and pedal forces
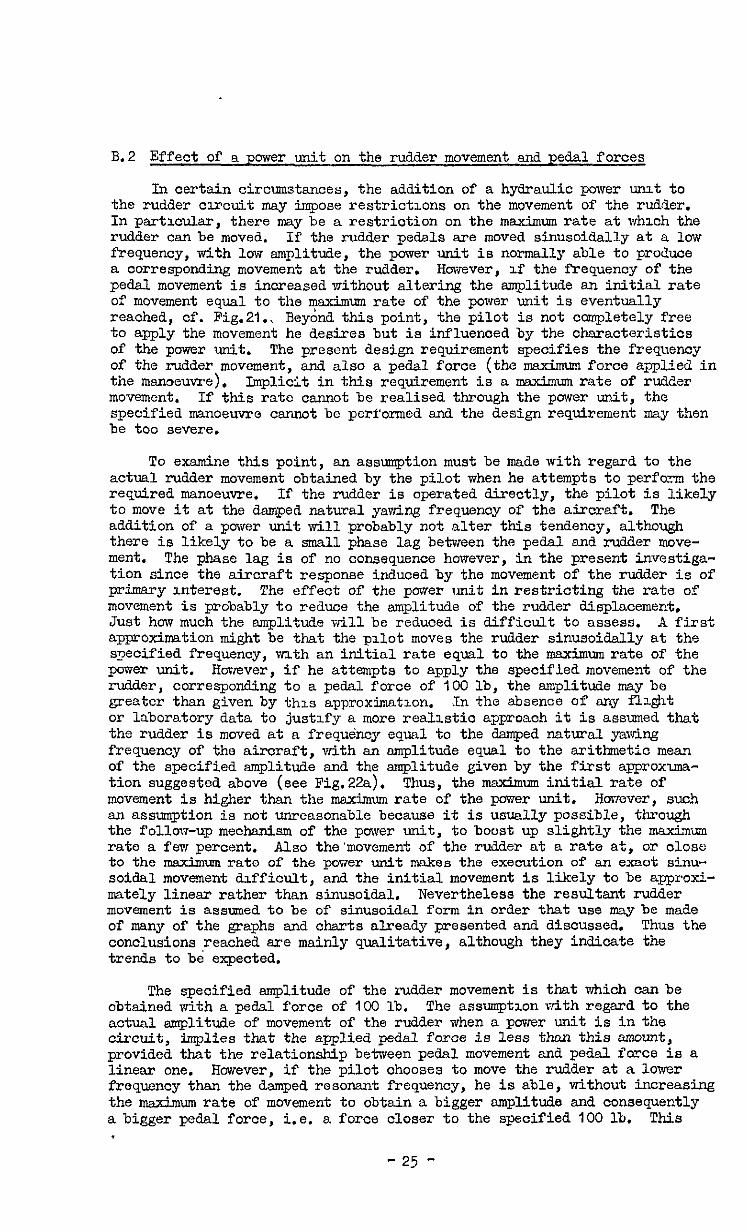
In certain circumstances, the addition of a hydraulic power unit to the rudder circuit may impose restrictions on the movement of the rudder. In particular, there may be a restriction on the maximum rate at which the rudder can be moved. If the rudder pedals are moved sinusoidally at a low frequency, with low amplitude, the power unit is normally able to produce a corresponding movement at the rudder. However, if the frequency of the pedal movement is increased without altering the amplitude an initial rate of movement equal to the maximum rate of the power unit is eventually reached, of. Fig.21.. Beyond this point, the pilot is not completely free to apply the movement he desires but is influenced by the characteristics of the power unit. The present design requirement specifies the frequency of the rudder movement, and also a pedal force (the maximum force applied in the menceuvre). Implicit in this requirement is a maximum rate of rudder movement. If this rate cannot be realised through the power unit, the specified manoeuvre cannot be performed and the design requirement may then be too severe.
To examine this point, an assumption must be made with regard to the actual rudder movement obtained by the pilot when he attempts to perform the required manoeuvre. If the rudder is operated directly, the pilot is likely to move it at the damped natural yawing frequency of the aircraft. The addition of a power unit till probably not alter this tendency, although there is likely to be a small phase lag between the pedal and rudder mcve- ment. The phase lag is of no consequence however, in the present investiga- tion since the aircraft response induced by the movement of the rudder is of primary Interest. The effect of the pomer unit in restricting the rate of movement is probably to reduce the amplitude of the rudder displacement. Just how much the amplitude will be reduced is difficult to assess. A first approximation might be that the pilot moves the rudder sinusoidally at the s?eoified frequency, n%th an initial rate equal to the maximum rate of the power tit. However, if he attempts to apply the specified movement of the rudder, corresponding to a pedal force of 100 lb, the amplitude may ba geatcr than given by this approximation. Jn the absence of any flight or laboratory data to justify a more reallstio approach it is assumed that the rudder is moved at a frequency equal to the dsmped natural yawing frequency of the aircraft, with an smplitude equal to the arithmetic mean of the specified amplitude and the amplitude given by the first approxuna- tion suggested above (see Fig.22a). Thus, the msximum initial rate of movement is higher than the m&mum rate of the power unit. However, such an assumption is not unreasonable because it is usually possible, through the follow-up mechanism of the power unit, to boost up slightly the maximum rate a few percent. Also the'movement of the rudder at a rate at, or close to the maximum rate of the power unit me&s the execution of an exact sinu- soidal movement difficult, and the initial movement is likely to be approxi- mately linear rather than sinusoidal. Nevertheless the resultant rudder movement is assumed to be of sinusoidal form in order that use may be made of many of the graphs and charts already presented and discussed. Thus the conclusions ,reaohed are mainly qualitative, although they indicate the trends to be expected.
The specified amplitude of the rudder movement is that which can be obtained with a pedal force of 100 lb. The assumption with segard to the actual amplitude of movement of the rudder when a power unit is in the circuit, implies that the applied pedal force is less than this amount, provided that the relationship between pedal movement and pedal force is a linear one. However, if the pilot chooses to move the rudder at a lower frequency than the damped resonant frequency, he is able, without increasing the maximum rate of movement to obtain a bigger smplitude and consequently a bigger pedal force, i.e. a force closer to the specified 100 lb. This
- 25 -

reduction l~h frequency, vrhxh involves a corresponding increase in anplrtude, msy give rxe to a greater fin-and-rudder load than could be obtained wxth the assl.mled movement - m much the ssme ~rdnr.cr as In the ease of the manoeuvre in&xc& by drrect opsratzon of the rudder (para.8.1). If the msxxmnn rate of the powr wit 1s very much lower than the rate u;lplxit il the spccdxd manoeuvre, the power unit affects the pedal movement over a consderable rsnge of frequencies. In thz rawe, the effect of the power wt ~~11 be assumed to be as before, namely that ad the smplltude 1 s ecpal to the antkmetx mean of the specxfIed smplltude and the smplltude correspondxng to movement s.t the optimum rate of the power unit and the freqency in question (see Fig.22b). Tllus the assumkl rate of movomcnt varies vath the frequency of movement.
B.3 Effect of a power unxt on the response of an axrcraft
B.3.1 Example chosen __--
To illustrate the effects of a poricr unit, on the va~lous response qusntdaes, the prevzous example of Table I is exteded to cover the case =xth a power urut in cl=ult. The chsrscterxdxs of the unit are as-d to be such that Its mexxmzm rate 1s 0.7 of the maxxxmm rate reqmred to perform the specified fish-tsil manoeuvre, 1.e. tfle maxzmum attaxnshle frequency of movement of the rudder, rrlth the amplitude corresponding to a pedal force of ICO lb, is 0.7 of the damped natural yaw.ng frequency of the aircraft, or simply, f'= 0.7. At low- fiequencxes, below f = 0.7, the pxlot can apply the amplitude of movement correspondxng to 100 lb pedal force, and the maxmum indlal rate of movement depends on the frequerzy he chooses to use. Above f = 0.7, %xth the influerxe of the power wt, the resultant emplxtude of movement depends on the frequency as shov*zn In ?kg. 23.
It 1s felt that the chosen char‘acterlstxs of the power unit represent slmost an extreme practical case, mace It IS not expected that the optic rate of the urut vnll be much less than 0.7 of that re@red for the execution of the fish-tad manoeuvre. If it 1s) it will probably mean that the aircraft cannot be msnoeuvred in the most eff'Lclent manner,
D.3.2 Angle of sldeslip
Consider now Pig.&. The fill line represents the case 1x-1 which, for the range of frequencies consd.ered, the power urLt has no effect on the control motion 1.e. the present design conclztrons, at f = 1, csn be met. The Pm are expressed m terms of pedal force, ,md am obtained alrectly from F1.g.8. In making thx step It is assumed that the pedal force 1s proportional to pe?d dx.pls.cement. The dotted curve represents the case m which the power unit is added to the circuit. The smplxttie of the rz!lder movement above f = 0.7 IS reduced accordwg to the relcvsnt curve in Fig.23. The than dotted curve has been produced by asslwng that $he rudder movement above f = 0.7 is sinu- soda1 but that the maxxnum rate is limited to the msxw rate of the power unit, i.e. the fkrst approximation mentioned in para.B.2. In this case the smplltude of the movement decreases as the ftiquency is increased such that the msxumLll rate remains constant.
The curves lndlcate that, If the power unxt restrrcts the movement of the rudder mch that the design conditions cannot be reached, the maximm~ angle of sdeslip obtaxnable is lower than that associated \nththe present desxn condltlons. Also, this maximum may occur at a frevency considerably lower then the damped resonant frequency of the system.
B.3.3 Fin-and-rudder load
A similar set of curves has been produced for the fin-end-rudder load at various frequencies, Fig.25. The curves arc very similar to those for the
- 26 -

angle of sidesllp. If the assumed effect of the pc~er unit on the pedal FIxplacement is accepted. rough quantitative conc+sions may be drawn. In the example chosen, it is seen that the maximum load is approximately I&% lower than the specified design load.. The maximum occurs when the rudder is moved at a frequency approximately equal to the damped resonzat frequency. However,'it is likely that in other examples, the critical frequency may differ from the damped resonant frequency,
B.3.4. Rudder hinge moment
The rudder hinge moment, v?hich may be needed for the determination of the strength of components on the rudder side of the power unit, has also been calculated (see Fig.26). The effects of a poner unit are similar to those found in the other two response quantities.
- 27 -


AWENDIX III
Computntional Charts
The following charts may be used to calculate the local mexima of the fm-and-rudder load rnd rudder hinge moment produced by unit omp1~tud.e of sinusoidnl ru&r movement of n chosen frequency (af), and the local maxima of the angle of sideslip and fin-and-rudder load per urdt maximum 0 h for
the same f?xquency of movement. The corresponding &um angle of side- slip per unit rudder movement may be obtained from Figs.2, 3 snd 4. If the duration of the manoeuvre is 13 cycles of rdder movement, three local msxima of each quantity are produced, correspoding to r = 1, 2 and. 1, (for I cycle of movement the number of zxiaxima is only two, r = 1 and 2), and for the chosen value of f, all three local rrmximn should be computed before stating the absolute maximum of the qwdity for the chosen manoeuvre. The charts are based on the approximate formulae derived in Appendix I, ==lY
1 ‘rn -- 0 A ‘er
= (-l)r+’ t
‘jl- sir&$ - .er) + 3, cos(;;, - E$ + a2 co6 X, 3
,
r = I, 2a3
= iql - CO&~) + b2 sin x -r
r = 1
= (-q y+' c
zr sin 'pr Gr - srml , & + b2 sin yr
3
r = 2md3.
The charts may also be used to celculate the local and absolute maxima of the above quantities over a range of rudder movement frequencies thereby permitting the determination of the frequencies vrhich produce the greatest angle of sideslip and fin-ancl-rudder load per unit rudder movement and maximum Ch, and the magx-iitudes of these quantities. In general, the
critical frequency d.lllie in the range 0.5 6 f c 1.0.
The numerical values included in the charts illustrate the orders of magnitude of the quantities in the various columns etc.
Data required.
(see else List of Symbols):
“1 52 et1
"2 n v
- 20 -
b (ft)
bl
b2 f 3 range
g (ft/sec2)
i 0
e b-t)
Basic formulae:
w -- I3 - gpa
($ =!$3 n 1 c
n v = -2
n i 0
n l- s
S"
v
7
W
yv
6, = p2 vR a2 i c
bt2) (rt2) (ft/sec T.A.S.)
(lb)
J = J
wn - $(v,+~ CA-", "3
- 29 -

-
-
_-_
-30 -
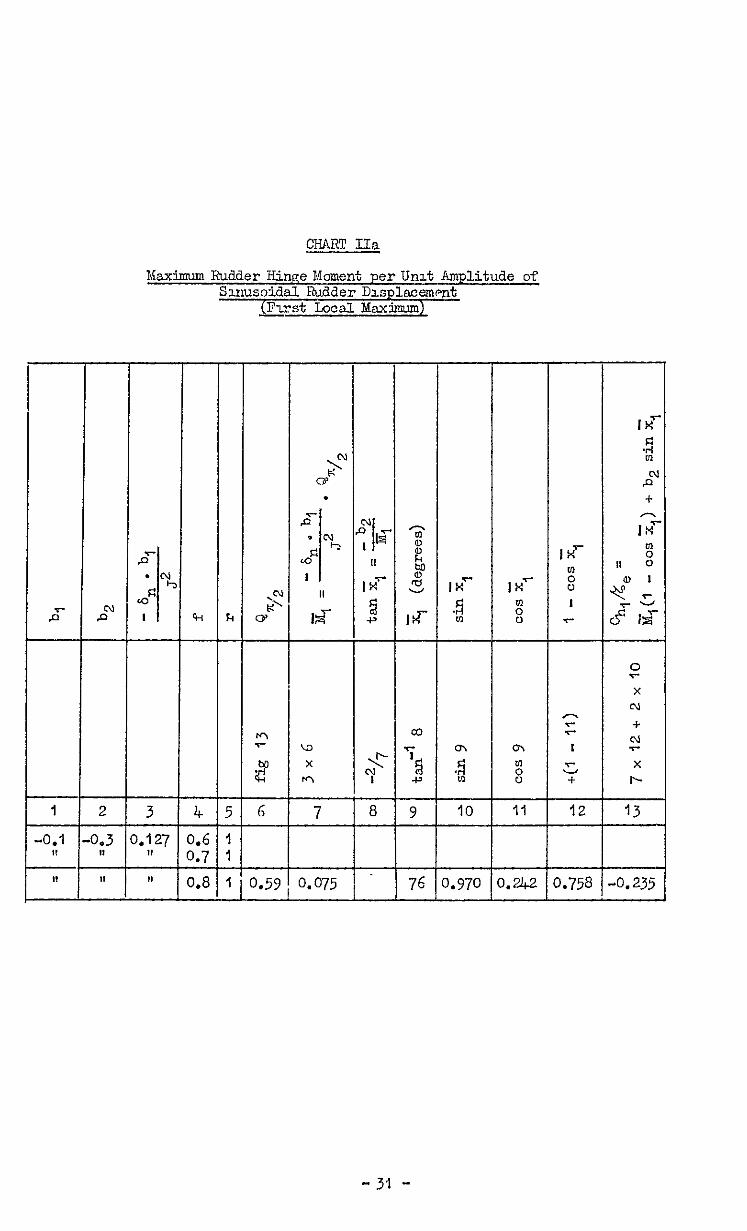
CWT IIa
Maxti Rudder Hinge Moment perUrut Amplitude of Smusoidal Ruader D~splsmment
(First Local Mbaximunl~
-
bl -
T- z b.7 - I.8 -
z-
,o x N + 2 x r-
: I
J +
co F 4!
2 i? -z-
cn In 8
11 1 T-- 7 8 9 IO 12 13
-0.235
-0.1 I,
I,
j.3 8,
I.53 0.075 70 I.970 ).2-Q b.758 L
-31 -

-32 -

CHART III
Naxima of the An@ of Sideslip and the Fin-and-tidder Load per Unit i%xmum Rudder Hziwe Moment
-
6.481 -9.ZJ.t 9.909
-
k
-
-
2 - j.7 11 9,
- I.8
,I
I,
-
k -
r -
I 2 3
-
k. -i -. -
0 . 5 f
-T- -
- 1
-1 1
-
T T
6
I.562 -4.30 .2.223 5.85 2.388 -6.13
0.235 0.2Jtl '0.228
23 i -75 i.88
0.24.1
- 33 ”

TABIE I
Data for example
2 = 0.664
'J = 3.775
x = J
0.175
$I = 17.64
??i = 1.257 J* '
B = 2.527
c = 0.115
al - = I.39 a2
9 = 1.8
b, =, -0.1
b2 = -0.3
bl -= 0;33 b2
-34 - kr~.~?S.c~,301.83 - Pmnted zn &cat Srttasn

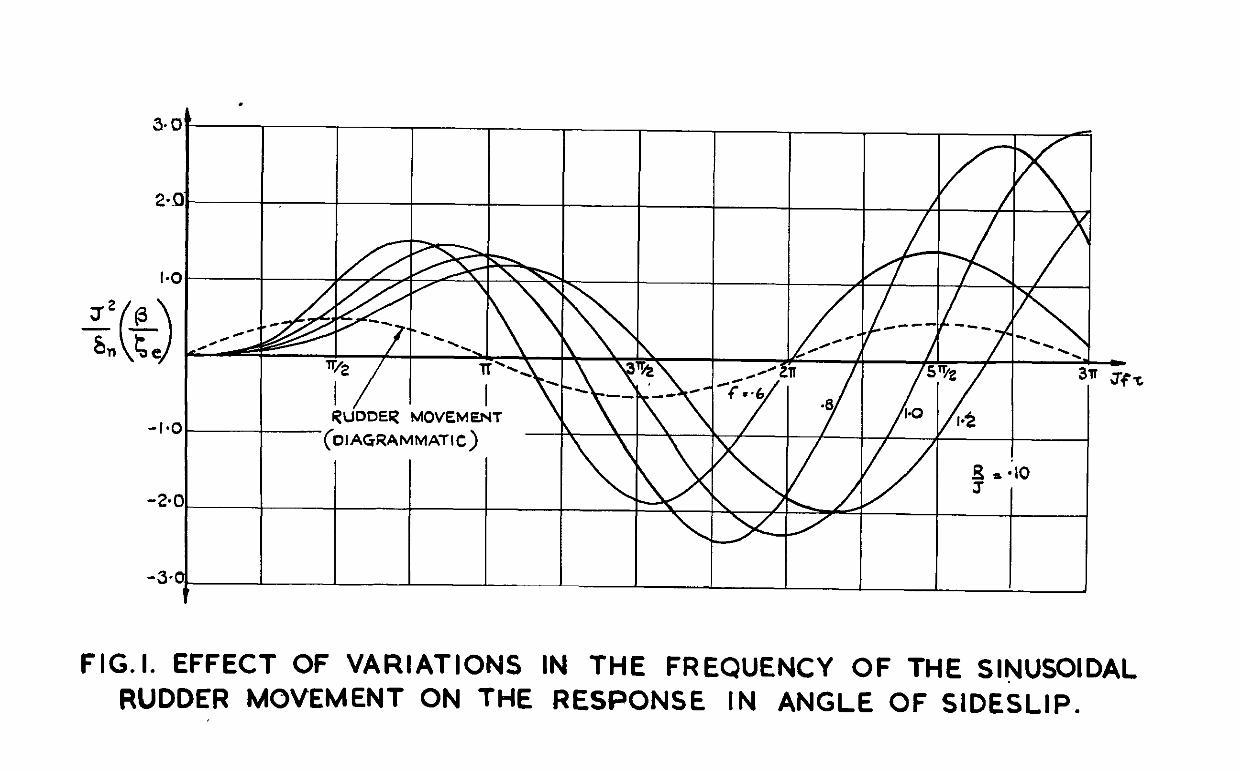
FIG.1. EFFECT OF VARIATIONS IN THE FREQUENCY OF THE SINUSOIDAL RUDDER MOVEMENT ON THE RESPONSE IN ANGLE OF SIDESLIP.
I I l 2 .
.?- I.0
2
I
f
FIG. 2. RESPONSE FACTOR = C$p=(-l)r*’
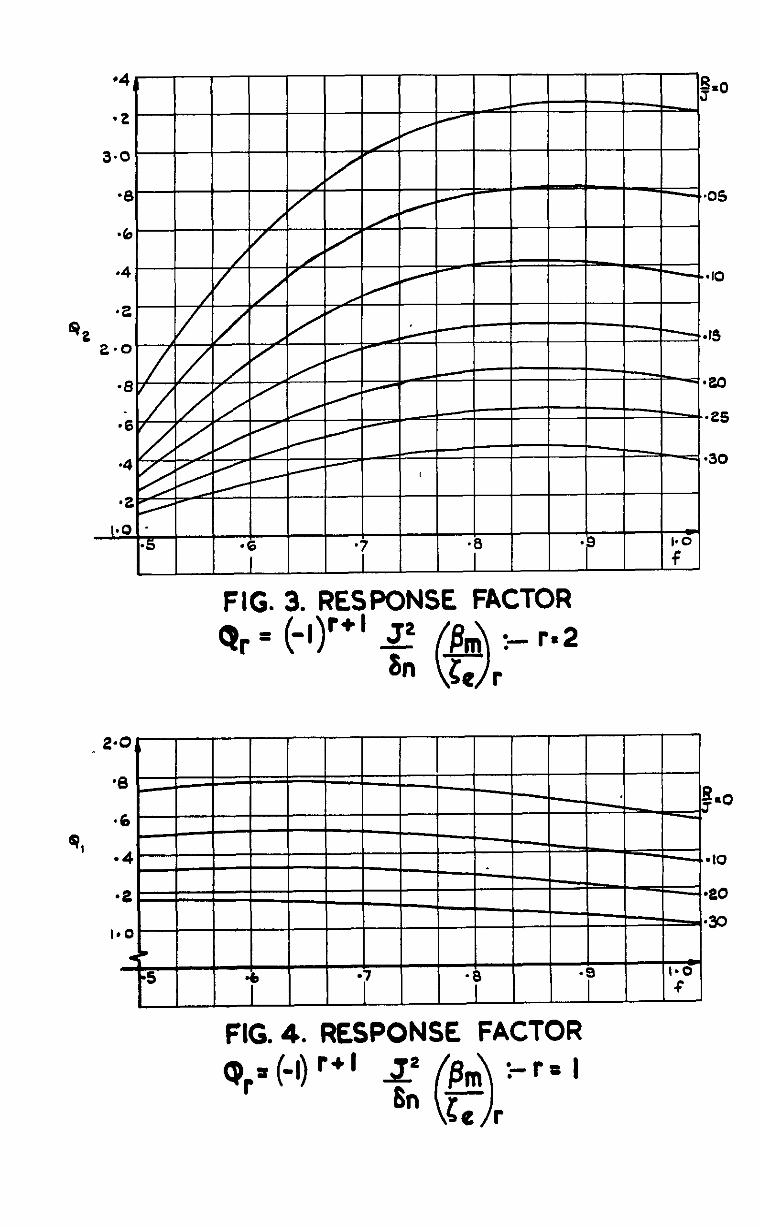
FIG. 3. RESPONSE FACTOR Qr = (-l)r*’
FIG. 4. RESPONSE FACTOR Q s (-I) r+’ J,* r B
6n & 0
1-r= I
e (DE&ES)
5, (DEGREES)
FIG. 5 PHASE ANGLE &r, r = 3 (API? I 5 A3)
.
FIG. 6 PljASE ANGLE E,, r = 2 (APR I 5 A3)
FULL MANOEUVRE I
7
i
FIG. 8. AN EXAMPLE OF THE EFFECT OF f
ON THE f?m PER UNIT AMPLITUDE OF
RUDDER MOVEMENT. DATA - TABLE I.
e, (OEGREES)
t
FIG. 7 PHASE ANGLE Er, I= = 1 (Af’P. I.5 A 3)
-1.c
-e-a
Is’ LOCAL MAX? OF p/c OCCUR6 APPROXIMATELY HkRE
I I I
(nAGi?ANNATlc, -I- 1 APPRox . FUNCTION
EXACT HERE.
L -- +‘ve (0) FIN -AND- RUDDER LOADS.
-V& =CURs APPRoX I MATE LY
OCCUR6 AP
I I end’ LOCAL MAX”’
WC. OCCUR3 APPROXlMATeLY HERe.
I I
w RUDDER HINGE MOMENTS
FIG.9(asb) NOTATION AND SIGN CONVENTION USED IN THE DERIVATION OF THE APPROX.
FORMULAE IN APPENDIX I .
7
6
r= 3
-i
FIG. II. AN EXAMPLE OF THE EFFECT OF f ON THE Pm PER UNIT AMPLITUDE OF RUDDER MOVEMENT. DATA-TABLE I.
l 4 I FULL MAN’OEUVRE
I
------- -- t
FIG. 12. AN EXAMPLE OF THE EFFECT OF f ON THE CHm PER UNIT AMPLITUDE
OF RUDDER MOVEMENT. DATA-TABLEL
FIG;. 13. RESPONSE FACTOR QnrJ’ p
2 6n 0 z Jft=%
FIG.z”A‘“ES ‘OF t FOR ;;J”ICH & 2”d & 3rd LOCAL MAXIMA 6F
THE RESPONSE IN p ARE NUMERICALLY EQUAL.

& I,.?.
FIG. 15. PHASE ANGLE &r-IJ, r=2 (APF? 4 AS)
I w I /I I I I I I I I l
FIG: 16. PHASE ANGLE &r-,, ,-, r=3 @PP. 5 A$
4 I LI MOVEMENT.
I
17 , AN EXAMPLE OF THE EFFECT OF f ON THE VALUE OF cc REQUIRED TO REACH
UNIT MAXIMUM Cl, IN THE MANOEUVRE. DATA :- TABLE I.
-5 *6 -7 .eg -9 I. 0 I.7
FIG. 18. AN EXAMPLE OF THE EFFECT OF f ON THE MAXIMUM (INITIAL) RATE OF RUDDER
MOVEMENT ASSOCIATED WITH UNIT MAXIMUM Ch. DATA :-TABLE I.
EFFECT
EFFEC
I I I I I I
I-LOCAL MAXIMUM OF ‘& ! p I
’ I 3=
IS ABSOLUTE MAXIMUM FOR ; DITTO; MANOEUVRE. I I
.
FULL MANOEUVRE
I / / I 5 6 7 A 53
FIG. 19 AN EXAM& OF f ON THE Pm PER
OF THE UNIT MAX
ch, DATA -IN TABLE I.
I I I Y II
I?.
IMUM
’ I I I I st
LOCAL MAXIMUM OF ! _ Znd .-.---Pl
IS ABSOLUTE MAX!MUtilD’TTo FOR MANOEUVRE
I
“2 a,
FULL MANOEUVRE - -1.39 a2
-6 *7 $ 8 3 0 I I-2
FIG. 20 AN EXAMPLE OF THE tT OF f ON THE Pm PER UNIT MAXIMUM
ch * DATA IN TABLE I.

FIG. 21. EFFECT OF FREQUENCY ON THE MAXIMUM RATE OF MOVEMENT.

FOR DESIGN MANOEUVRE
AMPLITUDE ASSOCIATED WITH 4PECIFIED PEDAL FC?RCE. ,
SINUSOl’bAL~ RUor: MOVEMENT FOR
SINUSOIDAL RUDDER MOVEMENT MAXlMUM I
POWER UNIT PRESENT i.e SAME FREQUENCY AS FOR THE DESIGN MANOEUVRE, BUT WITH AMPLITUDE REDUCED AS 5HOWN.
I I I
I I V~‘/I I POWER UNIT, BUT WITH THE
SAME FREQUENCY AS FOR THE DESIGN MANOEUVRE
I I I I I I I
TIME
ATION IT IS ASSUMED THAT THE MAXIMUM RATE OF THE POWER UNIT 15 REACHEO WHEN f = 0.7 1.e. MAKIMUM RATE OF POWER UNIT IS 0’ 7 OF
HE RATE REQUIRED FOR HE DESIGN MANOEUVRE.
TIME
FIG. 22 (a8 b) ASSUMED EFFECT OF A POWER UNIT ON THE RUDDER MOVEMENT WHEN AN ATTEMPT IS MADE To EXECUTE THE DESIGN MANOEUVRE f = I. AND ON THE MOVEMENT
AT LOWER FREQUENCIES.
RATIO
VALUE OF C AT WHICH THE POWER UNIT BEGiNS TU AFFECT THE
WVEMENT.
OF FIG 22 b
AMPLITUDE OF ASSUMED RUDDER MOVEMENT-
FIG. 23. RATIO POWER UNIT PRESENT
AMPLITUDE OF RUDDER MOVEMENT -
DESIGN PT. (REF. I.)
I I VflTHOUT POWER UNIT I \
DlPkRAMMATlC REPRESENTATION AMPLITUDE-EFFECT OF POWER UNIT. ’ --
-5 -6 97 -8 -9 l-0 I.1 I. c
FIG. 24.EXAMPLE SHOW& EFFECT OF POWER UNIT ON THE Pm AT VARIOUS VALUES OF f.
EXAMPLE DATA IN TABLE I.

DESIGN POlNT (REJ I)
.6 .7 I.0 I-I 1.2
FIG.25 EXAMPLE SHOWING EFFECT OF POWER UNIT ON THE P, AT VARIOUS VALUES OF f.
EXAMPLE DATA IN TABLE I,
OESIGN
POWER bNIT ‘&INS TO
AFFECT THE RUDDER MOVEMENT . HERE.
I \ I
1 RUDDER -_--c--
l 2 - - I
r: I
4’ RUDDER AMPLITUDES A5 IN FIG.24.
I I as ~6 *I -0 *S I.0 1’1 I%
f
FIG. 26 EXAMPLE SHOWING EFFECT OF POWER UNIT ON THE Chm AT VARIOUS VALUES OF f
EXAMPLE DATA IN TABLE I.
-2.0 ba -1.b -1.4 -1-2
I I I ,
.-
30
IO
-10
-20
-30
FIG. 27. SOLUT_ION OF TH’E EQUATION
*m=-y+ ’


C.P. No. 301 (18.124)
A.R.C. Technical Report
\ .
Hen MAJPSTY’S STATIONIIRY Orrlcr:
To be purchased from York House, Kmgsway, London w c z
423 Oxford Street, London w I P 0 Box 569, London s n I
rj.~ Castle Street, Edmburgh z rag St Mary Street, Cardiff
39 Kmg Street, Manchester 2 Tower Lane, Bristol I
z Edmund Street, Bmmngham 3 80 Chtchester Street, Belfast
or through any bookseller
S.O. Code No. 23-9010-01
C.P. No. 301

C.P. (f$;) 304 I ,
A.R C. Technml Report
C.k No. 304 417,990)
A.R.C. Technd Report
MINISTRY OF SUPPLY
AERONAUTICAL RESEARCH COUNCIL
CURRENT PAPERS
Three - Dimensional Wind -Tunnel
’ Tests of a 30” Jet Flap Model
BY
1. Williams, M.Sc., Ph.D., and
A. I. Alexander, BSc.,
of the Aerodynamics Division, N.P.L.
LONDON . HER MAJESTY’S STATIONERY OFFICE I
1957
EIGHT SHrLLlNGS NET


C.P. No. 304
gth November, 1455
For the me2smem~nt 0; rxcface s~itic pressures, 26 tappings were oronded at each c.' -ch- b Pour spam~se szt?;ions (1.2s, 0.5.5, Cl.& ~xd 0.95s frm~ the \ri,lg root, closel~y spaced nesr the L.E. and T.E. of 'the r-odel. So.~e st?-cic ~~-e~c.ure ta~>pnq u;ere aleo lncludad xn the enti-plate at the wk~ POOP bu; chest were only useful for general p.iciEi~zce . Unrortunatel;r, it bias not possible to inco~orate s-catic whes in the blo:,w.~ slot :"xills. Tlxe u:;:er lip cl" the Slovin~ slou IliiG loca~6d ~17; rhe T.E. of the elliptic section with she leer lip just on the ~tnclers~d-face to give a mean slot iildth '~4 $l.$ ~~r/c = 0.w;;
or 0.025 m., r.he npanwise variation was less than 0.0025 1%
-. . 2% mzasuremen%s shoved tha?; at zcrc itid-speed -the jet issued at all m:,le j1.3" to the chord-lue, with no observable variation spawise Or Clia-l;:e riiGh jet ti'Exx aver the qrectical rrn;,e. The internal st'mcture of the model is shove ifl Y?+lb.
The mociel i'rt3 loc~t:d centi-zlly in the N.F.L. Low Turbulence ~~~cd-'lkxnel (re@sr l&~;Zdeil cuss-section, 7 ft height), so zhat the tuwle.: inzerfcrence effecux xere small. 'The general arrangement of the model and the exxemai du s:ing ho the Broom-'#tide compressor unit is depicted in Fig.18. A sir@: sitot co& traverse gear was eqdoyed. CO
explore briei'ly cre develoFnc?lt of the Jei. uake (see Eg.lc). The jet could be straddled at eny s-prr;rise locntzon and -7t distances downs~~eatl Up to three clmras be&xl the T.E; -the axis of the comb could be alzgned. alung the local mean direction of the jeT flow. Detailed CXl$omtums were not possible, however, ovri,r~~ to shortage of tunnel time and l&k of a sur"f5.cie.xI.y clo;ely spaced pitot coab.
The calikr??;io,, curve given UT ?xg.Fo, of jet reac-clon J s~ainst the jet total prcs:ure measured in the bloving duct, was used to derive the values of the non-dimensxon~l jet reaction ooefficlent CJ (: J&o@). 'The w.r-ve was determined at the N.G.T.E. from balLance measurements of ~Lhxwt WITH the ‘mdel et zero inoidenoe and rith zero riind-turuel speed, a correction being applaed to allow for ~112 static pressure disctibu?;ion arisiw, from the flow induced about the rode1 by the jot efYl;u:.
3. P,.nrc of Tests and Rcduc-c~on of Observations
Xost of the mind tunnel tests mere carried out st a. windspeed of 100 rrjsec (B = 0.1 x lOi), when the omilnhle air supply permitted c J - w.luos u7 to (2.5 GO be wed. Higher values of C xere obtained by recuxxq: the windspeed to 50 Ft/sec (CJ T 2.1) and. 4 o 30 f't/sec ;:a,', ;.$*
Obsermtmm -r;ere i'irst mCe wxtn the three-dimensional zero iixidence nad CJ - values 11::) to L.8. Twnsition wires
were located on the i'r~n umer ,md l.ower surEa-es of -the model, a7; 0.2~ behi??d the L.E as fnr I'orvara as Qcsslble without causing inLerference at che'iloccly spaced static holes in the wing nose. Siur~lor experiiments mere &en made a-c inczdenoes ranging beween -50 and 200 for CJ values up to 2.1, , bothwich and wIthout vansition v&-es. I~nles~ othervise si;cii-ed the result:; discussed sn the text alld plor;t;d i~-~ the graphs rcrer to Those ob?;:iined with traas1tlon wires.
'The 1Lrt cocl"i'rLcuxYt CL on i;he Y@ may be regarded es comyrix.ng the vertical component CJ sin (8 + a) of the jet reaction ct -the nozzle and the vertical 'pressure force' C:
Thus we write Ip amsmg from the
~irilow over the aerof0j.l surface.
CL = CJ sin (0 + a) i- CLP j
CD = -cJ cos (a + a) -1 ccp ; . . ...(I)
$1 = - 2 CJ c c@ /
where/
-4 -
.cThere n is the penendicukxdistanoe fro:) the Foist about which IBXlents are ta..en onto the extended centre-line of the jet nozzle. For mmen-w about mid-chord, 8s r!uoted for the present zests, n/c n :z sin 0. The secGona1 pressure-force coefficlencs were obtamed from the nmsured static pressures by chordwise m?;ezration. The overall force coeffflcients were them derived by integracio? across the span, a& for convenience were based oil the area S of the rectangthr plan-form e~cl~dixg xhe zmal! ellF$soidal tipx. %me sxi$ir^:-ing assumpT;row had to be made for xhe &ordwse MegraTion of ~;he swtic pressures riose to the T.%slnce there were no static pressure holes inside the slot thma-c. tizhough the resultI% error in the lift coefi'icients is tisl@ficant, thu may 120~ be so for r&e pitchul; moment a,?d drag coeffxients under all co.ndixlons.
The quasi two-dimensiona e>;l)erimen-cs, made xith the ell~psorcbl Tip removed and a second end-o2zze added, covered rwdghly the sane rar+,es 0Ln CJ and incQtcnce 2s those Tested on the three-~meix3mi~~ i model. IT ms firsz checked ?;har. the set-up gave sensibly constan loaduy acrzs the span, i.e., nominally ti~o-dimensioml flow, for :i I'mi represencazive co.lditi.ons. Then for the remainder 0; the ten.:, The sta-cic preswres were recorded only a~ the mid-span section a&. the oressure r'orce coeffxients evaluated -Lhercfron.
IL.. 'ikee-Du?ensio.wI I~%xIel Results
L-.1 I,if%
The .,~~nkse dutxbutzon of 'pressure Ixi'z' loading u&ced '>y 'I.E. blovrlng, l,iT;h the vslng at zero mncidence, seems little different from That given by si.m>le lifting-lme theory (sae P"ig.3a) or that due to wing ilxidence :"lT;hz)uT blow (3ig.3b).
The total lift "si -.
at zero VU% incidence is plotted agasmst C i in Fig&a, bcth ui-ch an A-
J v~lthout wansition wires and for various wmdspeeds . At CJ-values belo;-v unizy, the expcrime@xA results lie reasonably close to xhe s-Cra-Lzht line C$, = 1.4 CF, and ax higher CJ-value; are sl q$llTl$ ehovc this. The relative magnitudes of the jet reac-clon and ;r~sure :orce con-cribxtlops to The total lxft are also 3ASxted. Curves of CL againsG CJ5 for other sncidences are plotted,in >ig. J,b for the c7--e j;lth -cransizlon ekes; the slope dqd.CJF at a prescribed CJ 1s seen to increase I-7ith incidence. The @,-values obwined $;zthout wa.~sitioa wires are ILL xost instances not more than 0.1 dlf."crent fron those wir;h.
Lif-i-uxldense curves for a rave of CJ-"lues with transition wres are shoT:?Il ix IQ.>. 1-s C J 1s increased L%DI zero there is no .w.~u:'icant loss in scal1l.y: 5:zcuIenca; ac Cj-values above unity there is cxcn some ixrease in s-b:lling kcu3ence ;,illch, zhwgh ;7osslbly pcculisr to the lw Rcynoids number and particular wing configuration of the tests, is at least encoureging. The value of dC+/dct for small incidencos rises s~eadi.l;r 3s Cj increases, from O.O35/deg without blo,;T t? about O.-i/de2 ai CJ = 2. The incredse 1s roughly p~opoZ+lO~l to "j>, and. is made us of contrlbc:io::s iron both -the Jet reaction and pressure force co.qmen?;s. :?iTh c, measured in de&:ees,
dC&. = 0.0175 CJ cos(0 + a) * dQ&u . . ...(2)
?- C.015 CJ + dx&k for small a . . ...(3)
The remvzl of -the transizux mues had lit-cle effect on d'ZL/da, except for the results vn-chout blorring, when the value became extraaixSnari1:~ lx&h. This secsedto be associaxedwth the presence of a zhiE 1amiaa.r boundary lzycr right back to zhc "23. at the low test Reynoids number combmed \-5th the unusual sloc~ed T.E. shape.
k.Z/ -_----l----___-_-----_-_---_-__---_--- e----m-- x T&e tip increased the w5ng area by only about 12;.

-%-
Fig.6 give3 curves of total pimhing mment about the hlf-chord axis plotted a:,afnst the corresponding total ift range of vslues of c!
CL, for a an?L ZJ, from the tests with trmsitm,? ?vires.
Probab?y not more than broad conclusions should be drmn from the results, 5zt view of the fm stozic pressure holes m the vxinity of +A slot.. It is seen that The mean slope (dC&lC& of the curves ;'or coritant CJ (a -Jar-d) is about 0.25 at low butJnon-mm values of ~gsit;~rithat 'Lhe aerodynamic centre 1 's located close to the quarter-chord
hat the'aerodynamc centre tends to move furthe; aft, sny by about As CJ . uxreases, the value 0f (fu+/dC~J~~ decreases so
o.ac as CJ is raised from 0.2 to unity. licro CJ
The $4 - CL curves for are,hmever, sonm&?; unusual itl that the slopes both with
and Mithout transition mires differed appreciably from 0.25, being respectively greater and less. This peculiar behaviour in the absence of blowing ms a;pin ;csredi.ted to 'the mconventional T.E. shape avid km Reynolds number of the tests.
A3 c, incrensm mth (71 constant, the nose-down pitching moment becomes &eadiQ le:ger r, b ecause ti2c mduced suction forces on the wxlg upper su rface are much higher near the T.E. r,wn the LA (see later discussion on pres ure distributions). The &or&rise location oi'the centre of Tot31 lent is plotted. against x in pig.7, aad in Lenerai ~OVOS rea~ard spproclably as CJ is increased at constant incidence or 3s the incidence 1s decreased at constant CJ.
,
It will be recslled that the drag is made up of the chordwise components of the direct jr,?; reaction and the pmssure forces on the ocrofoll surface; t!:c relative mgnitudes of the two contributions are indicated in l?f~.8a for the ZCPO incidence case. Thus, sfithout blowing, CD includes tho conventions1 .?orm drag of the ~;ng sections and the -nduced drag arising from dommash effects, btit excludes the skin- friction drag. Eth blo~mg, vre might therefore regard CD as coqrcCmg a chordt&:c coqonent - c cos (8 i u) from the direct jcc rw2c u~.on, n .ror:~ drrg together VU 11 any recovery of thrust which 4 mni;zs?.Y itself III the pxssure distribution, axd. on induced drag resulting frorl do~nmsh cffccm over the i&p?. Fbr ides1 conditions, i.e., ptential flow in the ,nmstream flop and no :Gxing, it can be shorn that the direct jet reaction am1 thrust recovery terms taken together contribute the amxmt - CJ corresmmiing to tho &roes thrum. in our measurement3 the so-called form dmg, induced drag and thrust recovery tern are of necessity lumped together as pressure drag. Yig.8a shows that the rate of decrease in !D mith C
i is appreciably
less than the amount Cj cos (0 + a) assoclazed with he direct jet seaction. Tiius, because of the low aspect ratios and mall jet angle, the combined. form and mduced drag contrzbutions to the pressure drag co,nplet;ely outzeigh and msk any negative contribution ar1si.W from thrust recovery.
l?or comparisons vtith the pressure drag associated with more conventioml methotis of producing pressure lift on a wmg, l%mely by incidence and camber, the value of CDI, for the present jet flap wing
has/ __________I___--________II____--__-_-_-~-_---_----------------- f On a complete mrcraft with tail this could as least be partially
trimcd out by the increased dowmash over the tail.
CQ = 0.013 + O.lL c;q
while for CJ-values u;l to 2 the value of Cc 0.013 + 0.16 Qp. Wg.80, giving results for -&h,?;:C~:~~ee:hOWS thst up to 11" the trend 1s also much the same. The combined ion and vlduced dmgs of a conventional wing of aspect ratx 2.75 producing corresponding pressare lifts at the same Reynolds number would not in fdct be greatly di;'ferent from the above (see 3 6).
4.4 General Flow Characteristics and Fressure Distributions
'-"uft and china clay cbsewatxns were mde to visualise the f'lox about the model. ?or Cj-values up to 2.1, 111th she wing at zero incidence, no separa:ion was evldent on the upper surface ke to the adverse pessuze &rad3ents 3-c the frons,'. As the wing incidence ~jas increased a small bubble of separated flow appeered, at the inboard Sections first, berg forned by separation of the laminar boundary layer close to xhe L.7. :5th subequent reattachment as a turbulent boundary laya ahead of the tra;ls;tion wire. l'ijthout blowing, the bubble did not elzand a~precicblp chordwise until the incidence exceeded 1 O", uftar wllich the ?osition of reattachment moved steadily reanTards, api. at the &cosrd sections first. The behaviour with blowing operative vas sc.m&xr, but the i:'ing incidence at which the bubble began to expand decreased somewhat as CJ was increased.
Some representative orescure distributions with the wing at zero incidence and irsnsition ~vires on are sho\n? in Figs.ga and 9b for the chordkse sections at y/s = 0.20 and y/s = 0.95, and selected %-%-;gs;w~b;;l;n 1‘6 =- *n seen thet they are simlar in shape to the
s on the ,-win part of a wing when a T.E. flap is deflected. In order to obtain some idea of the variation in pressure diswibution with incidence as well as CJ, the values of the peak suctions occurring near the L.E. and. T.E. of the tvc chordwise sections Ilsve been plotted against c.ncxdence for GJ-values ranging up to 2.1 (see Pig.?O). As the incide;xe i,xreases at constant CJ the peak suction 01 the nose grows zore rapidly at the mnboard tinan the outboard section, so flew separatxon may be expected earlier inboard which agrees viith the deduction from flew visualisation experiments. Furthermore, although the oeak suction near the T.3. of the outboard section grows with increasing incidence, the-t at the T.5. of the inboard section varies little at first and eventually diminishes. As CJ increases at constant incidence, the T.E. peak suctions the L.E.,
grow much more rapidly tnan those near partly because the latter are much reduced by downwash effects.
Some t~:el head vaverses of the jet 'iore carried out at various distadaces dowestrea~~ of the T.E. and at a few spanwise Iocatio?%s, but unfortunately the tests had to be severely limited. Mg.lla shows the mean l;ne of the jet (locus of maximum total head) and also the distributxz, of the total head in the wake dox~nstream of the mid-s_oan station (6 in. fro the root), for the wing at zero incidence with CJ = 0.5. It is seen that the width of the v;zke increases rapidly near the slot exit, being about 1 in.at s quarter-chord behind the T.E., by v&ich time the inclination of the mean-line to the chord has fallen to about 15". Zig.llb compares a few messure3ments of the mean-line of the jet dowstream of the mid-span station xith those further outboard. Spavise varic-ams are clearly evident further outboard than IO in.from the root, i.e., beyond about 83," span.
5./
T----- --_-- ---_ ------_.-- -----.- - .._. - -.------ ---------em
In the absence of transition wires, laminar flov~ seemed to persist right back to the 'I.E.
-7-
5. &osi 'D;,o-Rimensional f!kdel Results
'ihe pressure force coeffkcients were derived from static pressure measurements at we n&.-span seotionqnly, since the lift 1onaulg :ms sene~bly const~~nt across the spsn . The curves of total lift, pi-ccl.mng momeln and drag for the quasi txo-dimensional model (arCective rspec?: ra:zo il 6.8) arc generally similar in character to those already discussed for the three-d~mensionsl model.
At CJ-values below unity, the results for the towZl lift CL UT zero incdence both wli;h and wxthou?; trsnsltipn Trires, lie reasonably close to the straight line C C~values are slightly sbovc this (see &g.T2aj:7 EiCvEaoit F*~ainst "Jz for oxher i%idCnces derived from tests with transition w&es are plotted ir lTlg.lFb. Lift-i&idenCe owes for a -ge of CJ-valuea ax 3150 shown in iFig.13, tlx value of d.C&& at small inoidenoes rising steadily from zb071z 0.07~jdo~ :ilthout blow to O.l5/deg at CJ = 2.
The total p~cchmc; moment $x about the half-chord axis is plotted a~;am% CL for 3 range of CJ zn Fxg.14. At 1~ CJ the aerodynexdc centre is l.ocs%ed close to the quar?;er-chord position and moves rear%-d abo*u~ 0.06~ ns CJ increases from 0.2 to unity. The chordmse location of the centre of total lift also moves rearward in geneml 2s CJ incremcs with c con.&snt, or es s decreases at constant CJ (see FL'lg.15).
The total drag'ooefficient $ is plotted against CJ in I"ig.lt;a for a rage of irxn~ences. It is immediately evident that the rate 'of S.ecrease of CD Ttith CJ at eero incidence is less than CJ C"S 8, so that the increcse in pressure drag due to xhe so-called fom and induced drag components again outweighs a~ decrease from the thrust recovery term. The values of the pressure drag, with the wing a-i. zero 2ncidence rnd with ;ront transition )+5res, satisfy fairly well tl-.e relation
cup = 0.015 + 0.068 Ca LP
for CJ valutis u- to 2 (see Fig.16b). This relation also holds with the wiq, at higher incidences, up to at least 6.5O (see fig.l6c), and 1s not :ii'r different fro I thaT for the oombined induced and form drags of a conventicnel xing of aspect ratio 6.8 giving the same pressure lift (see 5 '5 ).
%me rF;?resento-cxve preswre distributions for the mitt-span sectmn >rit' the wrq I-G zero wcidence and transition wires on are Liven in I~~;;.17 for a rnn;;c of CJ-values. As the incidence increases et COnStmt CJ, the ]peak suction near the T.E. varies little at first but eventually d5mixis~(~ee 3.g.18); the value at moderate ulcidences is little differe,lt from shot measured for the inboar sections of the three-dimensional model (c.f. F1g.10). The peak suction at the nose of course increases with mncidence, unzll s certain maxirmun value 935) is rerched. i%r any prescrabed incidence below that corresponding o this nlex5.m.m value, the pea!: suction in general exceeds that measured on the three-dimensional model. The ,,laxim is reached at a lower incidence, as would be expecTed because of the smaller downwash effects, but its value 3.s not vastly different.
The mean line of the jet and the distribution of total head in the wake downstream of the T.E. are plotted in Fig.19 for the wing at zero incxlcnce with CJ-velues of 0.18 and 0.5.
6./ -_---_---_--_---------_----_-----1-1--1----------^-
%nis was nlso checked for us theoretically by Miss Weber of the R.A.E., Farnborough.
(b) I'rezswe D)rsg (Figs.6 and 16) - nor zero incidence and cJ <', the results ?or the aspect rstr~o 2.75 and 6.8 wings satisfy at:poszmately the relations
%I? = 0.013 -i- 0.11. CLp and cnp = 0.015 + 0.068 &p
*1.e., with the lu?c prdxcd by incidence or camber.
-9-
(b) th- L &m~~~sh is &eneraced only by the pressure lift.
The generrl co?s,er;sus 0: opinion held at oresent supports the first poLb.lictc thr t ke prcsaxre iift only is offect;edi since there seems little reason for the &zmx~~sl; to hwe other than small effects on the Jet reazrio.1. Ib~ever, .IZ TO-ec'erence to the second, it is generally considered7 that the do';nva~h results from the reaction of' the total lift on the mamstrea.?. On this basis, the effective downwash angle at the wing is by sonverrx.ona 1 argwxnt s 4 = C~x4e and the corrcs~onding induced drag contributmn to the pressure drag is cL,p Q,/KAe, where e represents an efL'iciency factor which would be unity for a wing at incidence ~nthoout blov;;~~~ and. with ellipt5.c loading. The measured CDp VaiUe.5 are plOtted agaXIst CLp CI, in Fi&s.8d and 16d respectively fop the aspect ratio 2.75 2nd 6.8 xings at zero incidence. It is seen at, 5s CJ increases, tiie efficienq iactor e satisfying a relation of the tpe
1”s L’ar zs asgecz ratio corrections for lift are concerned i C can likc~ xe : ,e aqued that the let nroduces effectively a oha%e 2~ the section:1 -lo-l-Lt: angle, that the pressure lift only is affected !‘j- &SL'rXlzsh, but xhnt the latter should aga,n be based on the total ll.fc. ls,i:-?!e i'crmulae zre then readily obtainable for the pressure lift and the slope of the ;mes:,wc lifj-incidence c-e in terms of the correspm~mL tx04w4ensic'zG values for the same CJ, but these again i~ivolve the prodwx Ae, i.e., the effective aspect ratLO*
6.3 I1U-ntlwr ~~orlc Proposed
Althoush solv at-~eqts have been made to analyse the present expcruwhl &tc in terns of ~!ie above and other osguments, the eqer1 ents -:'ex nat suLkcient.1:: comprehensive to pelxit a. careful rcso3.us~on& fdxia5s-rml cmsiderotmns on aspect ratio effects. For
this reason, further experiment; 9 are proposed on a larger scale model mith Tw5.abl.e aqect ratio and jet an&e It 1s intended to determine the forces bybzknce a:: :~ell as pressure-plottm;; measurements, and to make a detaxled study of the nature of the three-dLnensiona.1 flow.
Re ferd I
+It can also be argued that the total lift should be used throughout to derive the induced drag cDp = const + (C$?As 3.
giving a formula of the type DetaIled theoretical studies are being
oarrled out at the R.A.E., Farnborough, to clarify these points.
-10 -
References
1 I. M. Davidson
2 N. A. Di%xx!:
The jet flap. R.Ae.Soc. Lecture, October, 1955.
An experunencal introduction to the jet flap. N.F.T.E. Rep.R.175. July, 1955. A.R.C, 18,186.
Ar: m2ljms 0f aerodynamic data on blwjumg over T.E. flaps for mncreasing lift. A.R.C. c.~.zm,September, 1954.
Theory of the three-dimensional nerofoil. Pax-z 1 - Theory of the suuoortinrr line. AVA M&graph-l?,. 1M.O.S. R. 8. r.1023. A.R.C. II ,553 FJbvember, 1947.
The %-rice:-s we muoh indebted to N.G.T.E. for conswucting the model and providing the pumpi,% equipment, in particular to Xc. N. A. Duimoc::. 'i%e lengthy computations and graphical integrations assocuted w~ch the reduzzio.1 of the observations were carried out by Rhss E. 14. Love, Kiss L. iI. &son and Miss A. I;. Xernaghan, and the wake traverse ;cor~;c-s cesq~~tsd by Irs. X. Karcus, all of the Aerodjm?mxa Dlvr-ion, 1i.P.L.
%
A
c
CLP - f
CDp
i %p I
% -1
List or' Symbols
Pressure lilt, drag and pitchug moment coefficients
(about G-chord); derived by integratxxn of pressure
forces on aerol"oi.1
Total lift, drag and patching moment coefficients
( about &-chord); derived by adding direct jet reaction
cowonents to ;7resswe forces on aerofoil. See eqn.(d),B 3)
CJ/

CJ
c P
P
PO,PO>UO
R
s
s
x
Y
a
f3
-11 -
jez coefl'icient = J/??poL@
sca~ic ~ress~~re coefflciem = (P - PoEPoU,
minstrsam static Pressure, density, and velocity
mamstream Reynolds number based on wing chord
spsn of x;inZ (excludmg small ellrpsoldal tip)
area of wing (excluding small ellipsoidal tip)
vid-ch of blowing slot
chordwise distance
jet deflection angle relative to wing chord-lme

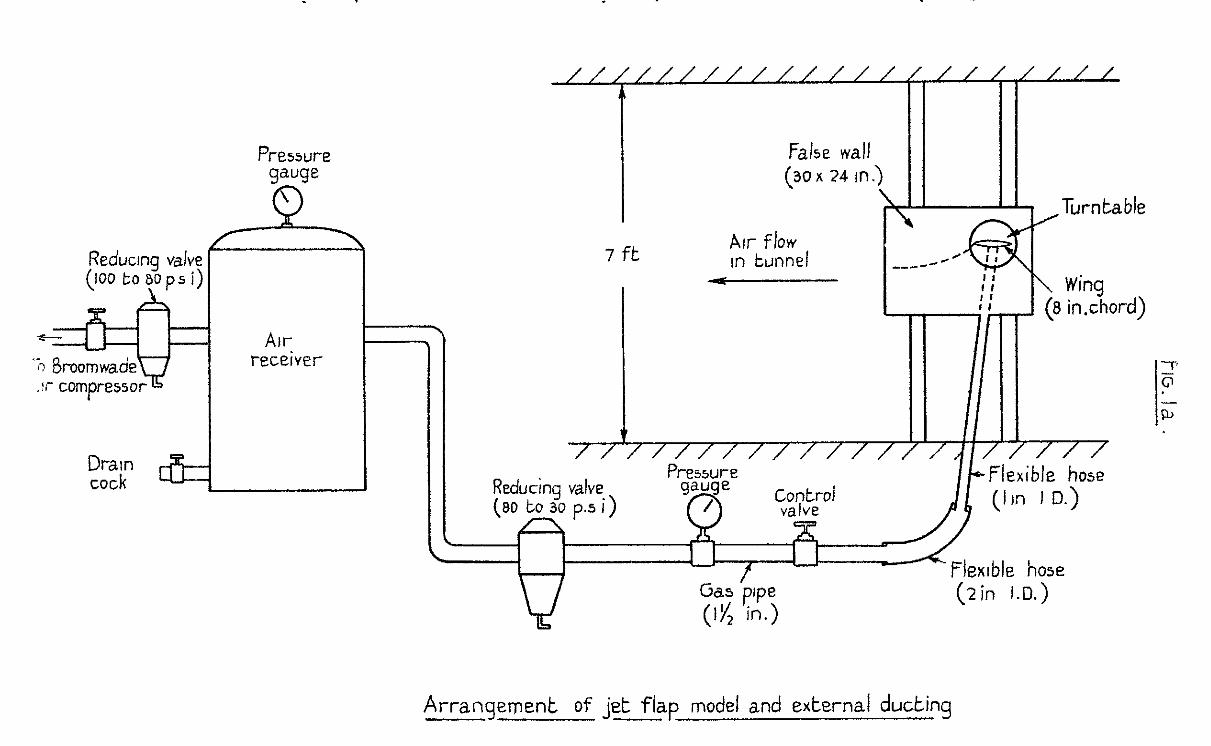
///////i//////j/// ////
(2in I.D.)
Arrangement of jet fiap model and external ducking

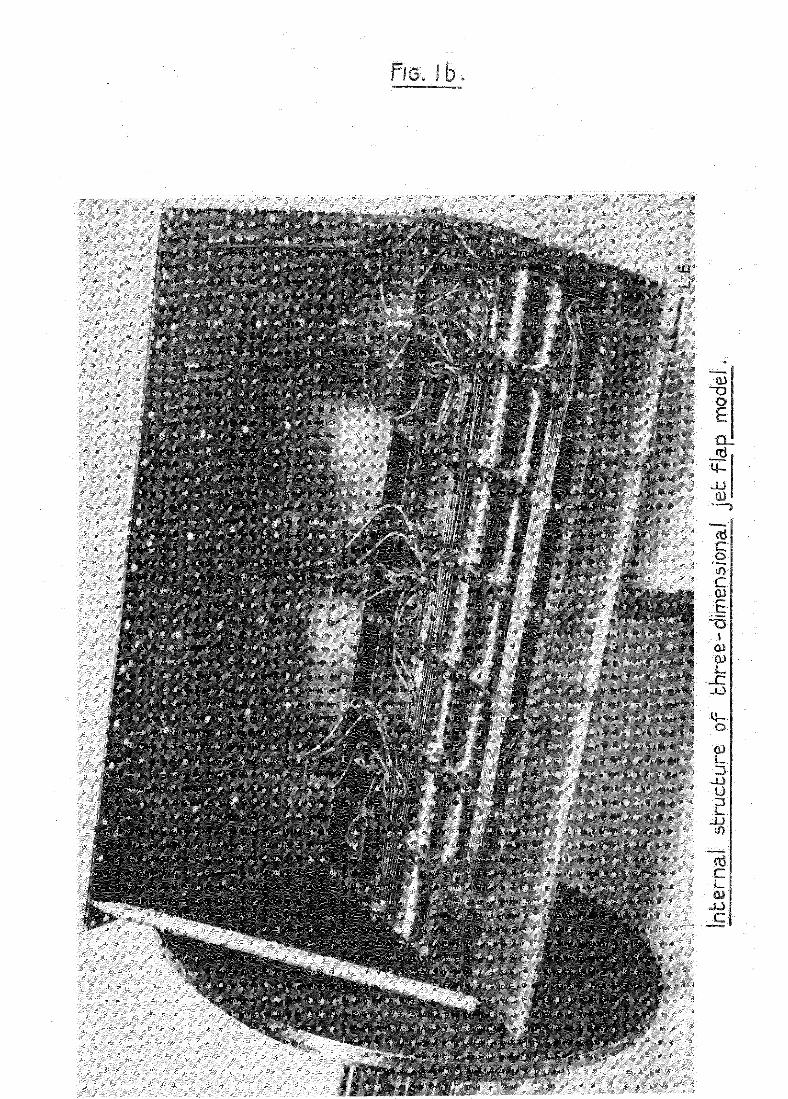


Pitot comb wake traverse get.

1713. 2a.
--
\

-
-
\ \1. __-
\ \ t
- , 2 \ \ h \
--- -4.

_Spanwrse drstt-;htion of pressure lift at ze,v tncl&n ce -
Vat-ration with c,

03
% (l0Ca.I)
0.2
-0.f
-0.2
-a =6-Y
a =o"
2ri - mental
I_- -
i=IG 3b .
\
t
li
spanwrse drstrrbutlon of lift wrk.hout blowrng 'v'ar~ation wkh mcrdence

l-6 4a
P \ \ \ i -r \ \ \ \ \ \ \ \ -!- \ \ \ \

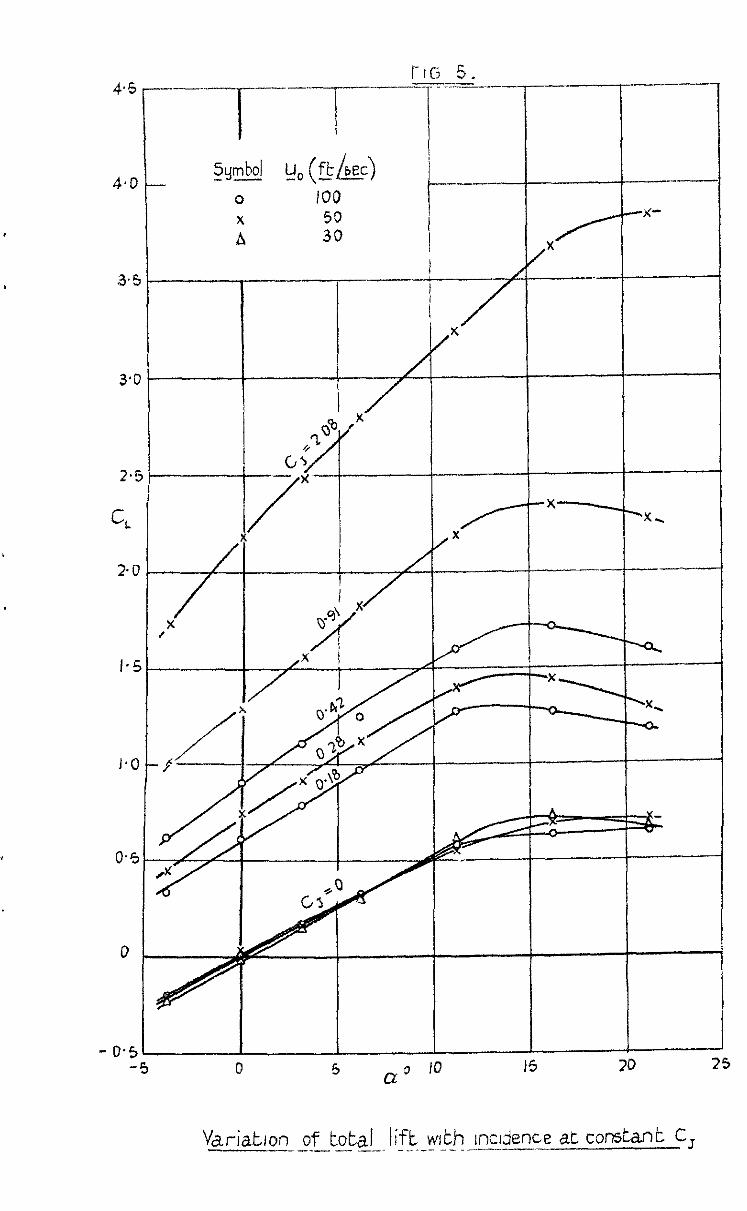

1 I ----------I.
! I I I .
--
- ---__
T

FIG. 7.
1

FIG. aa
\ \ L \

FIG.9b.
L
- I
CT
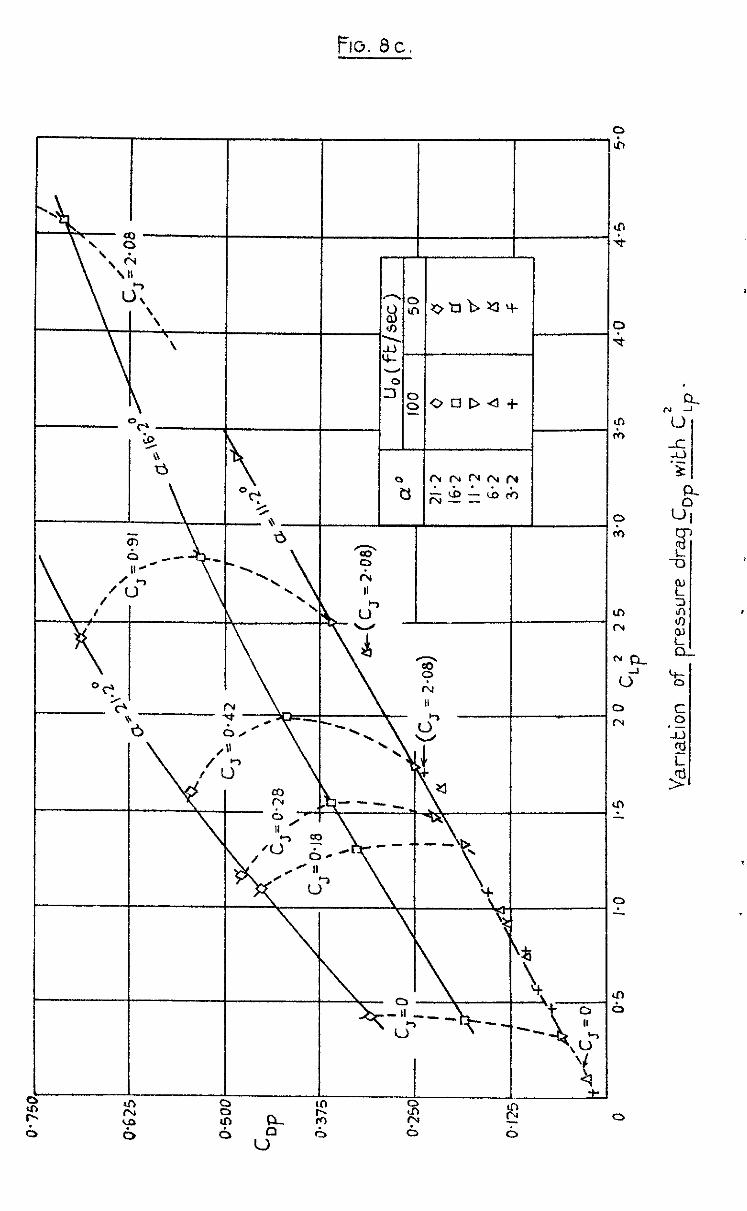
FIG. 8c.
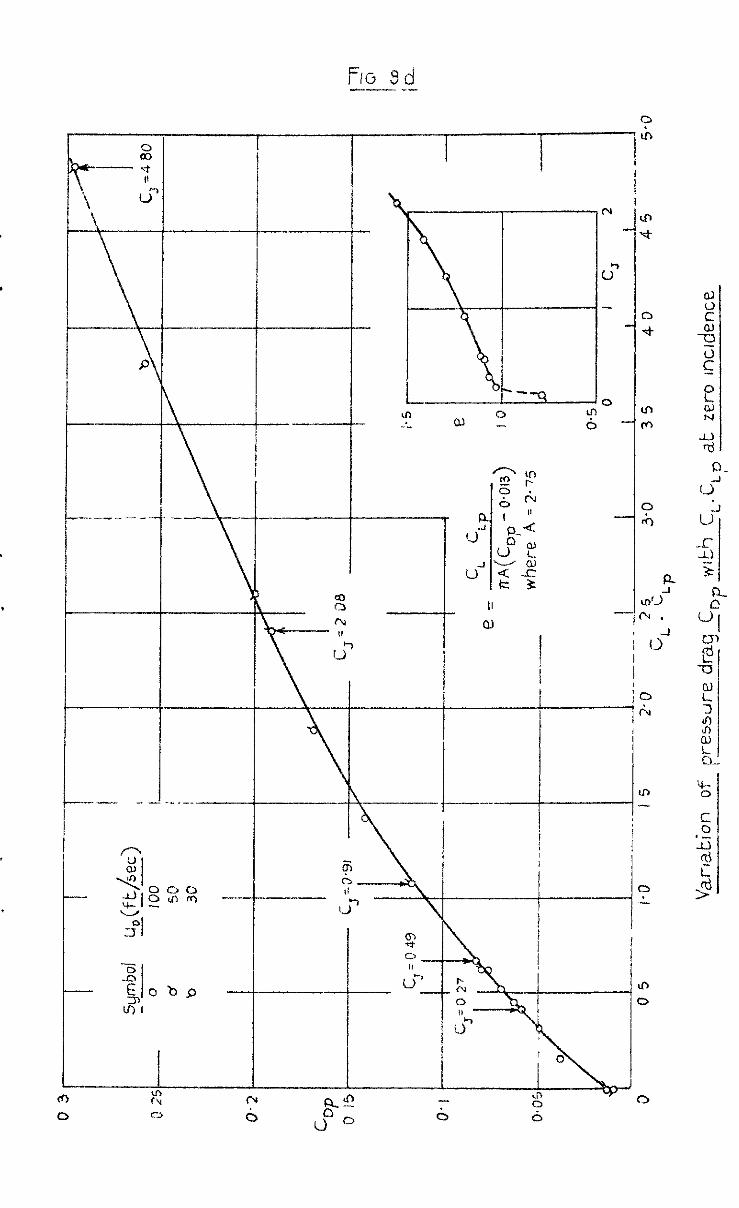
FIG 8d ----. _-
r
/
,: we-----~
, , : c
T s
-
-.-_----_
-- -

F ID c3d ---- l_-
I I

-cj
7
6
5
4
3
3
2
I
0
-I
-2 JL
Chordwrse presstire d&r-l butions at zem mcidence Variation wri;h C,
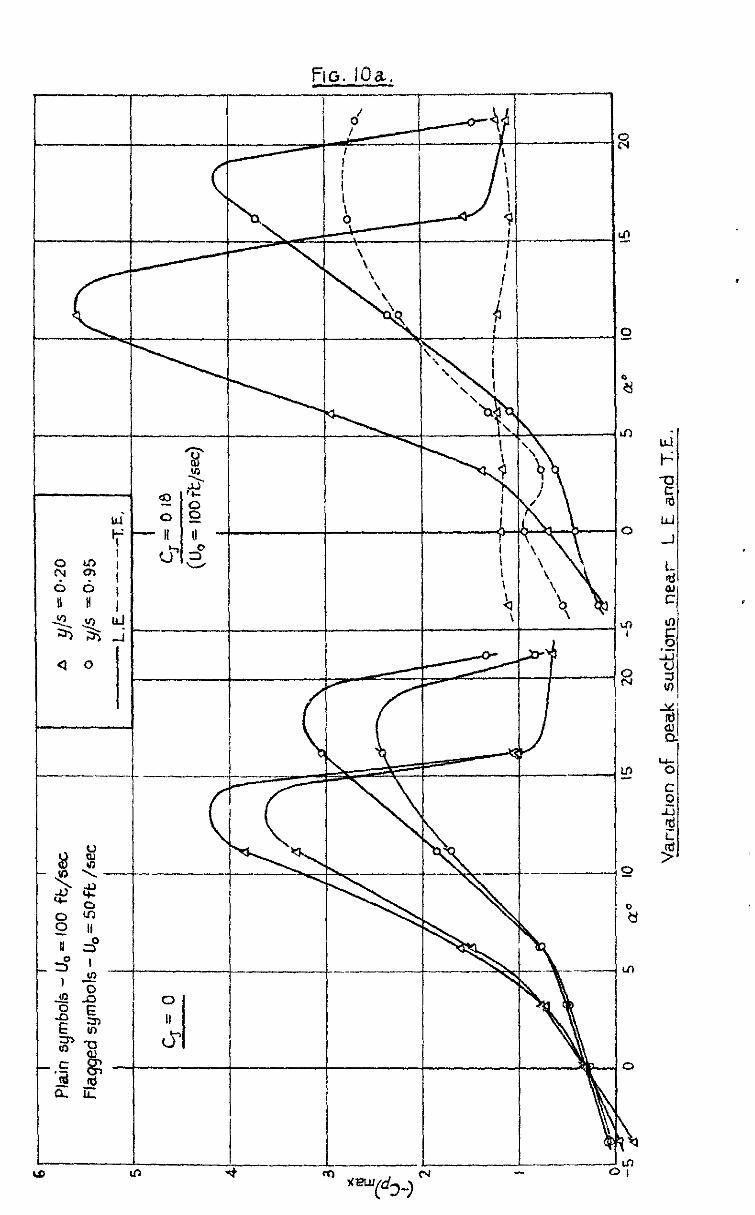
FIG. IOa.
0
II
u” I
I I \ \ \ \ \ a, ‘Q
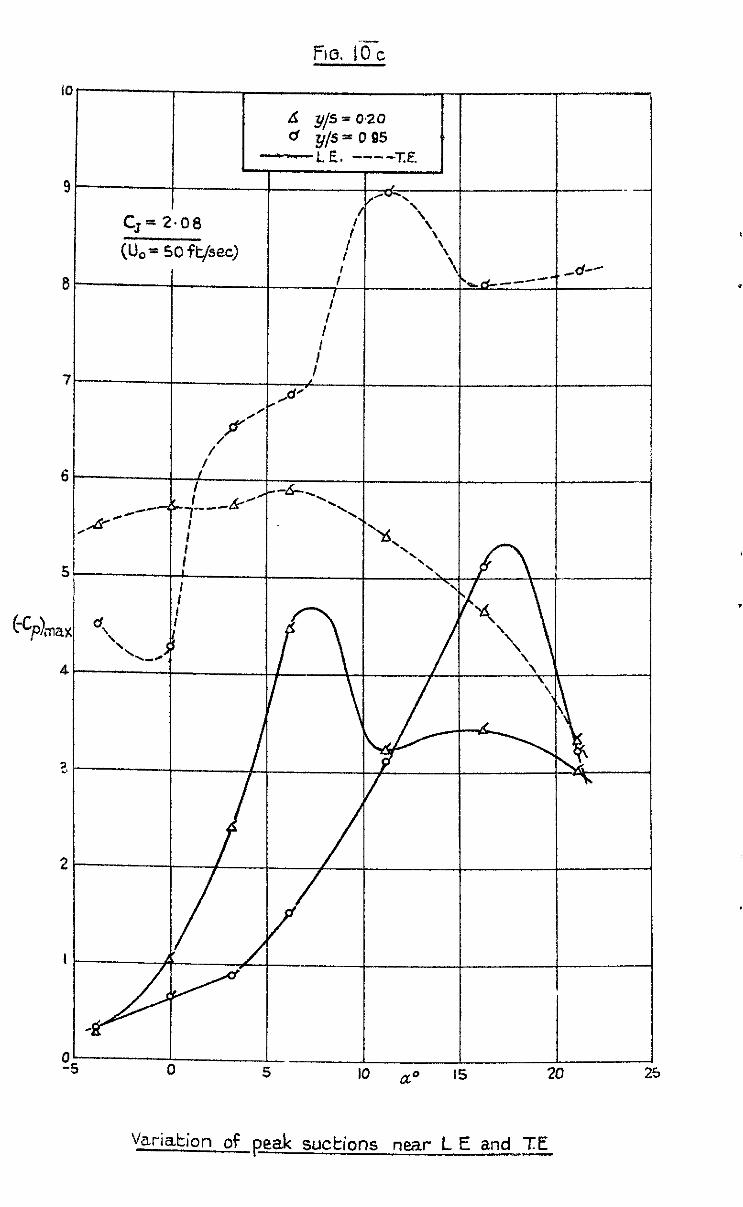
FIB. 16-c
L3 y/s= 020 d qfs- 095
c,= 2’4l8 (Uo= 50 fysec)
l--t---
e-
7’ ’
f---“H
:
Variation of peak suctions near L E and TE -

FIG. IO b. I I I
R d II
\ \
1
Y Q
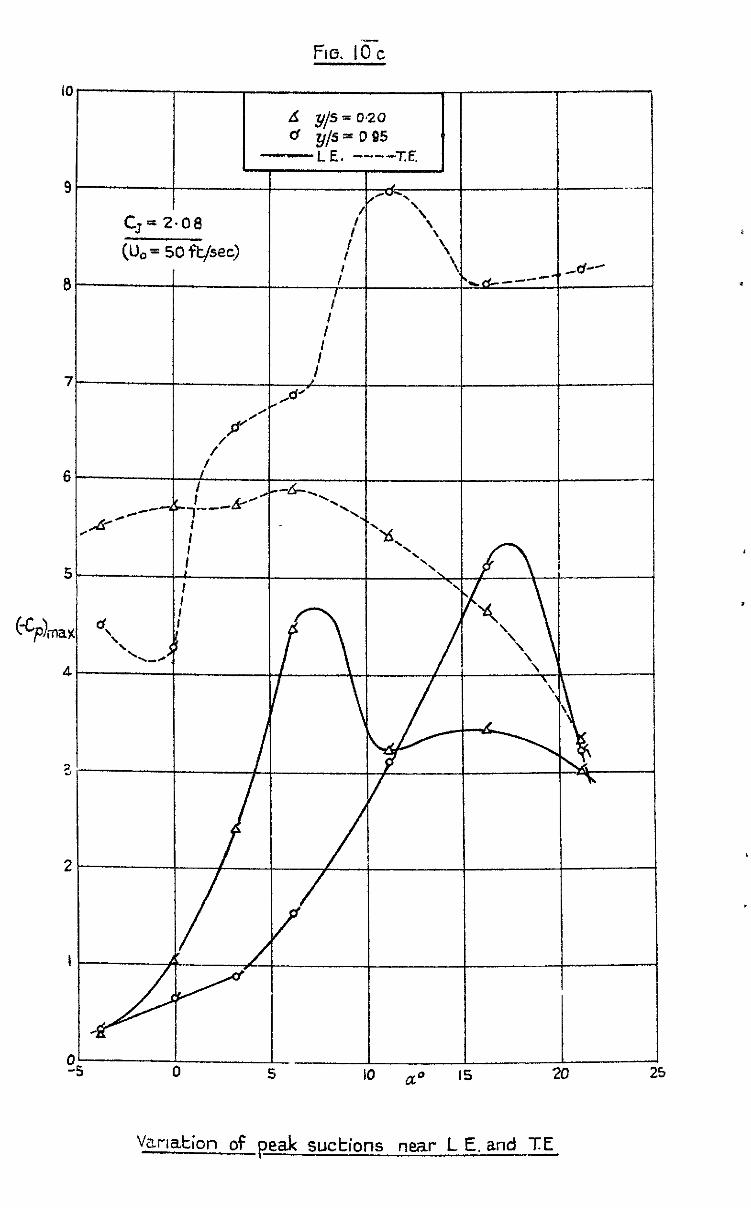
Fio. 16-c
IO
A y/5= a.20
u y/s = 0 95 -LE. -----GC
i 9
cl,= 2.08
(U,- 50 ft/sec)
0
~
VI ‘\
\ \
\ \ \ ?
/ I
0 ~ -s Cl 5
-r’ P
1 I _.
L ,d-’ . _---
Vmation of peak suctions mar L E. and x

‘IO Ila ---1_ ---- -r
J N
_-- 1
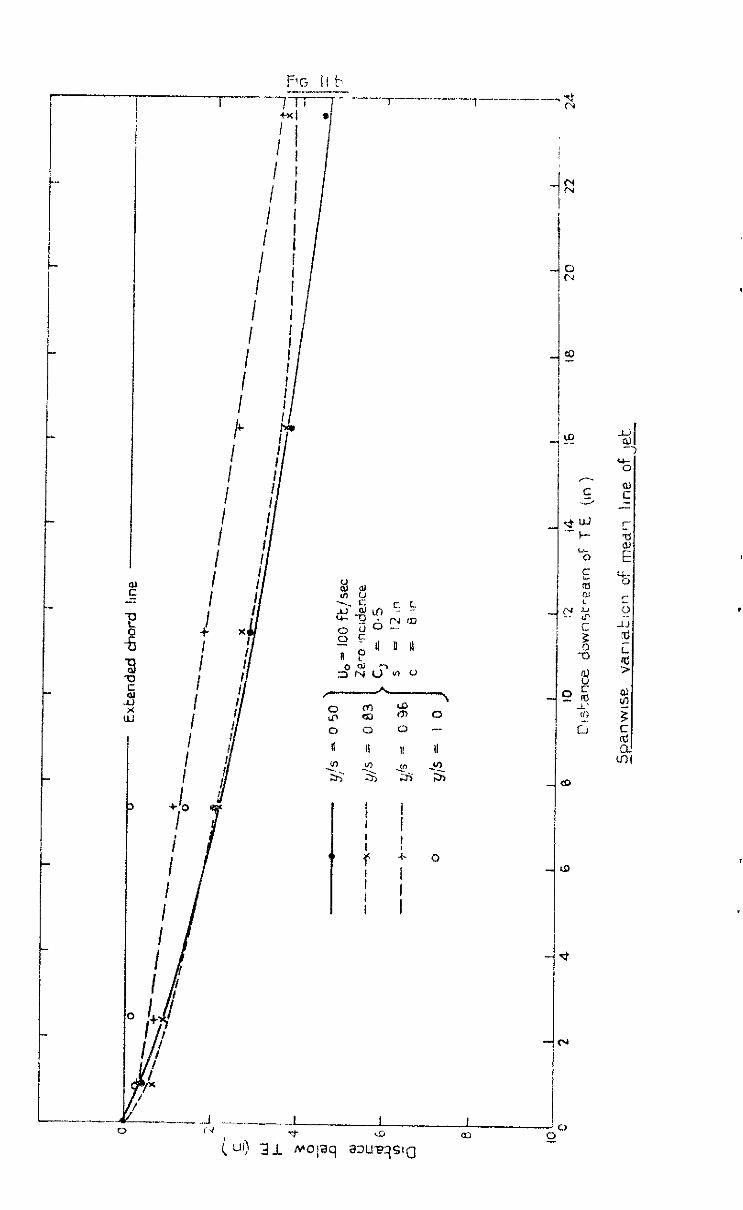
r.- Ii L
-__--- 7- ._._.--- N
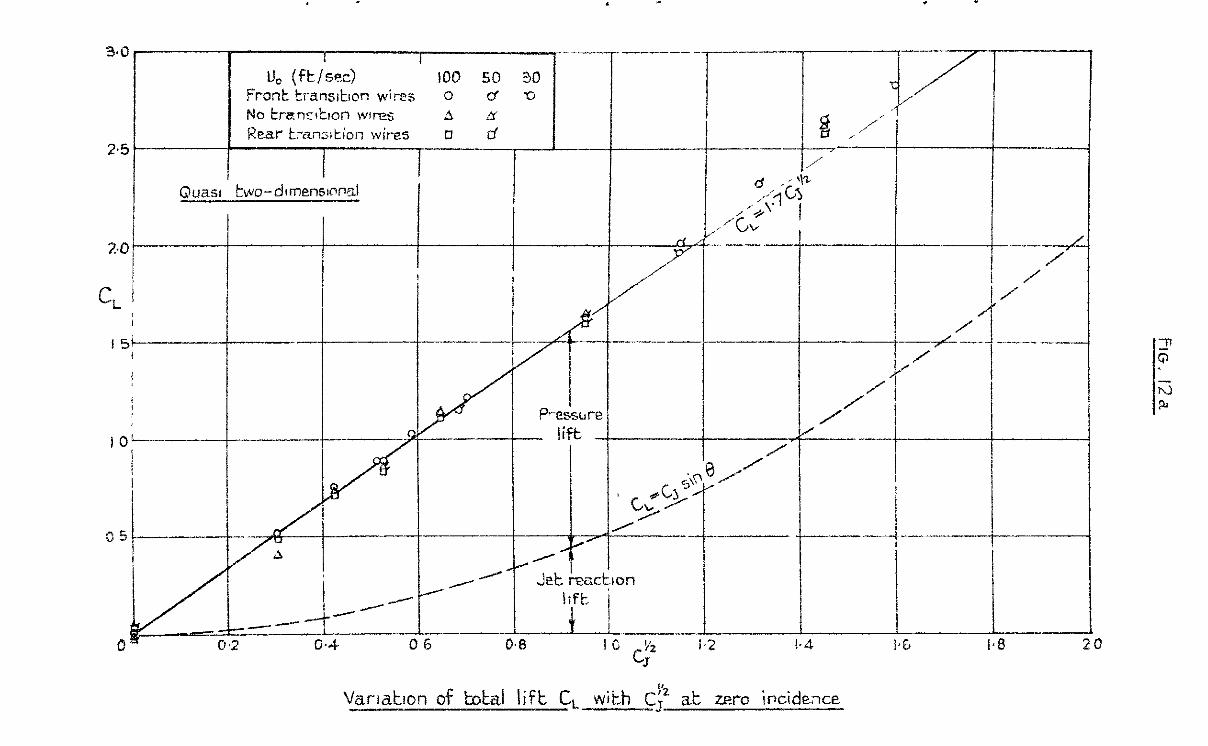
‘ .
I c, I
15+
I OL-- i I I
35 i
- 4 A
-----
[
-
-_ -’
/
---
/------
Varlat~on 0-f k&al lift CL with CF at 2~3 incidence


FE 13.
4-5 ----7------r-----
Qua51 ho-dimensrmal
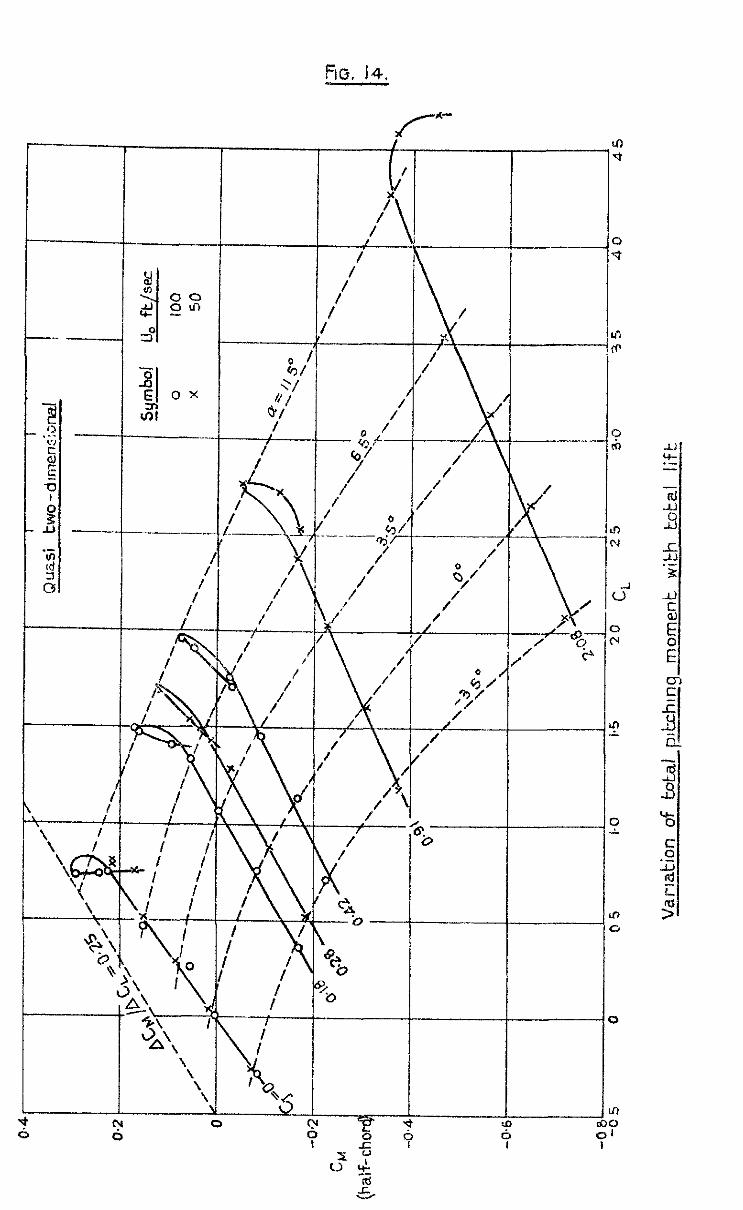
FIG. 14.
I\ \ 1 \ I \i I

I- I I ;I !”
/ l----T-- ,- I -u....+ --,-- -
I
--F------ G

I quasi two-dimensional
a0 LJo (ft/sec> 100 50
1.25- 115 --CL 4 ,t 1 6.5 --& 4 l Front transition O&-G- wires
-35 -%- -XL L
Pressure
I-00
I -----Without tt-&sition bVir& ; ,/ / /
-ag Y , d js -- -
1 c 7- ---I 0 0,75 1 OtJ
c,
Variation of total drags, with C, at constant incidence
50
.
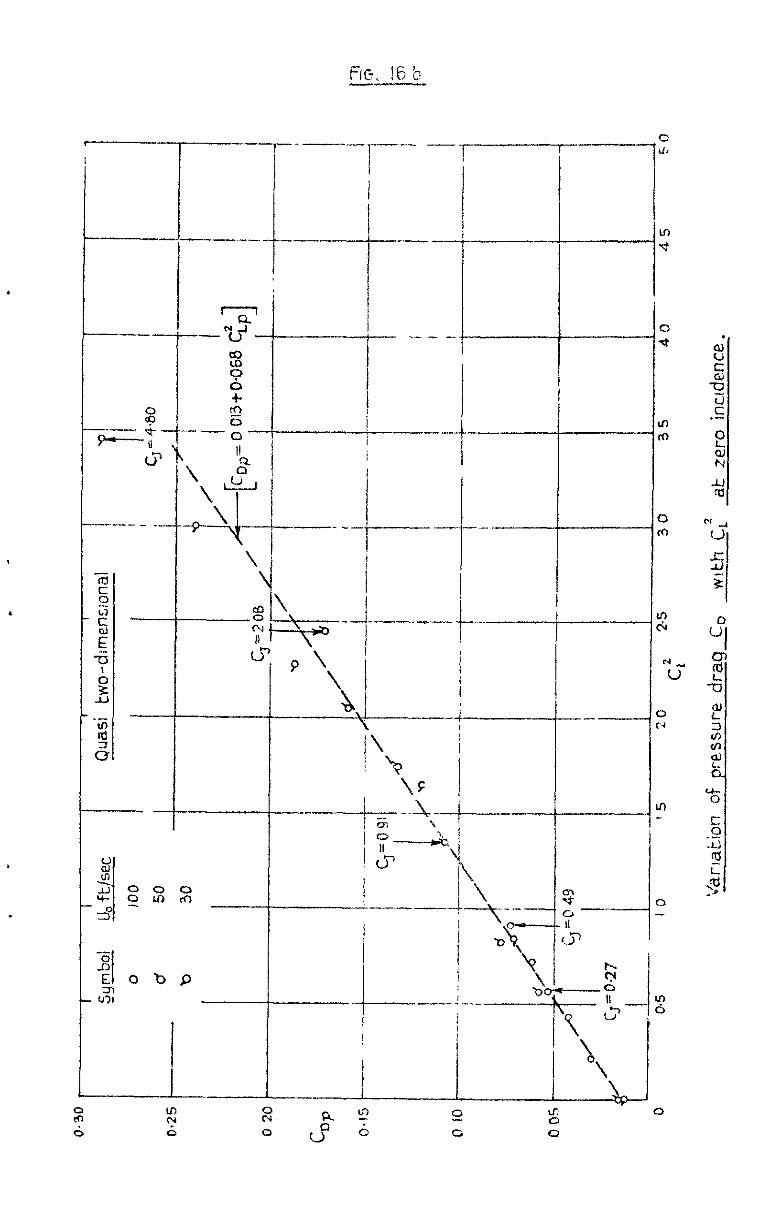
--- 8 +-- -u u?
----- _-
I
---- - _ f-
_- -.- I
I
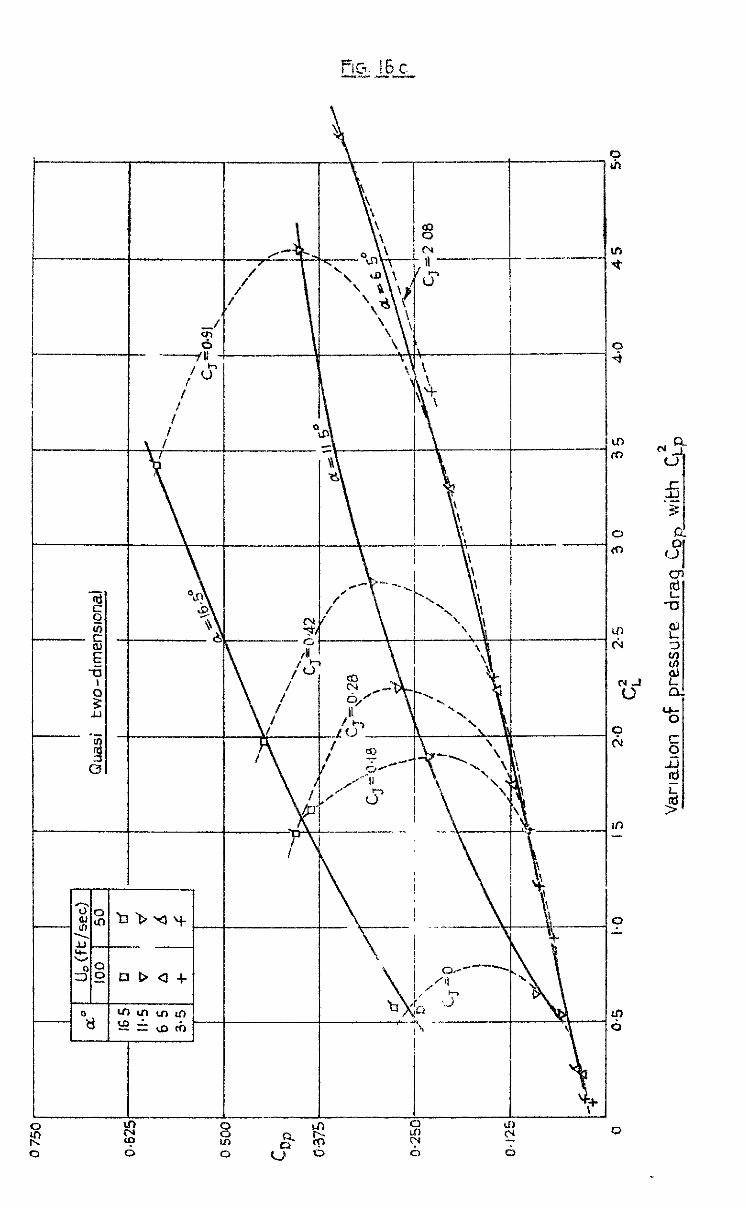
. . . \ -. -0 c-4 21
h \ \ Ki lo II
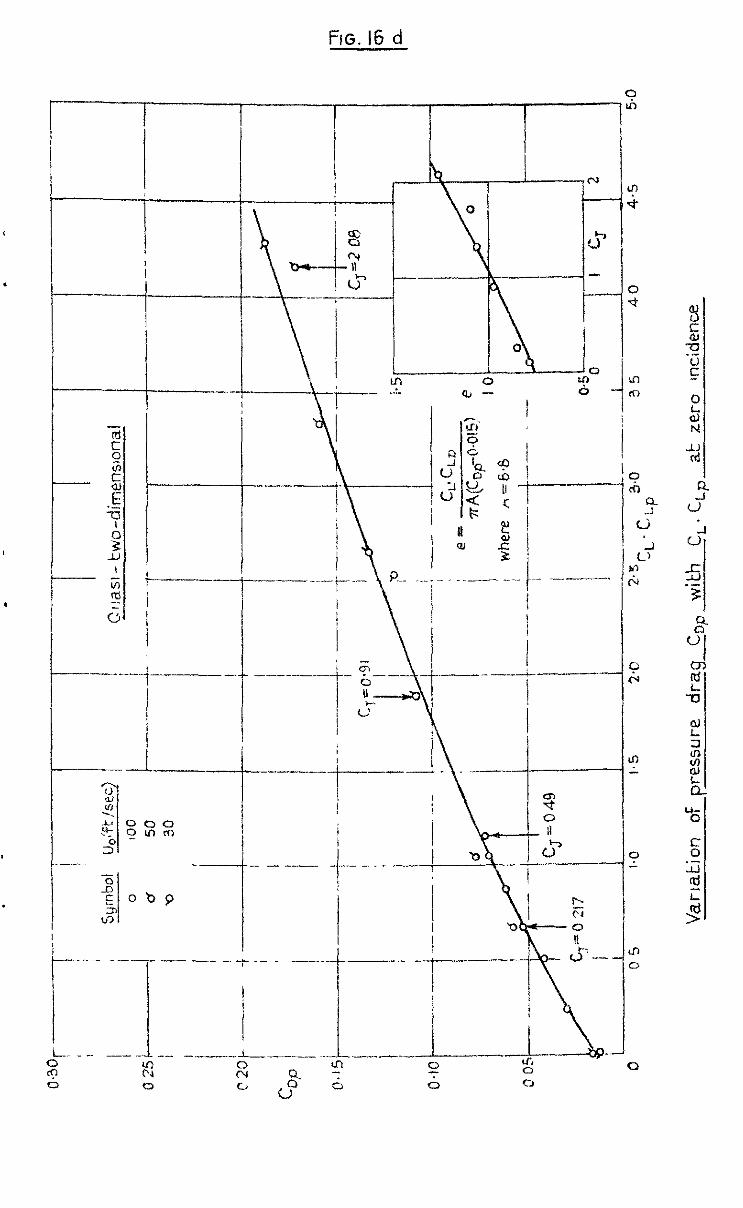
-
FIG. I6 d
----t-- -
------L-- -__..
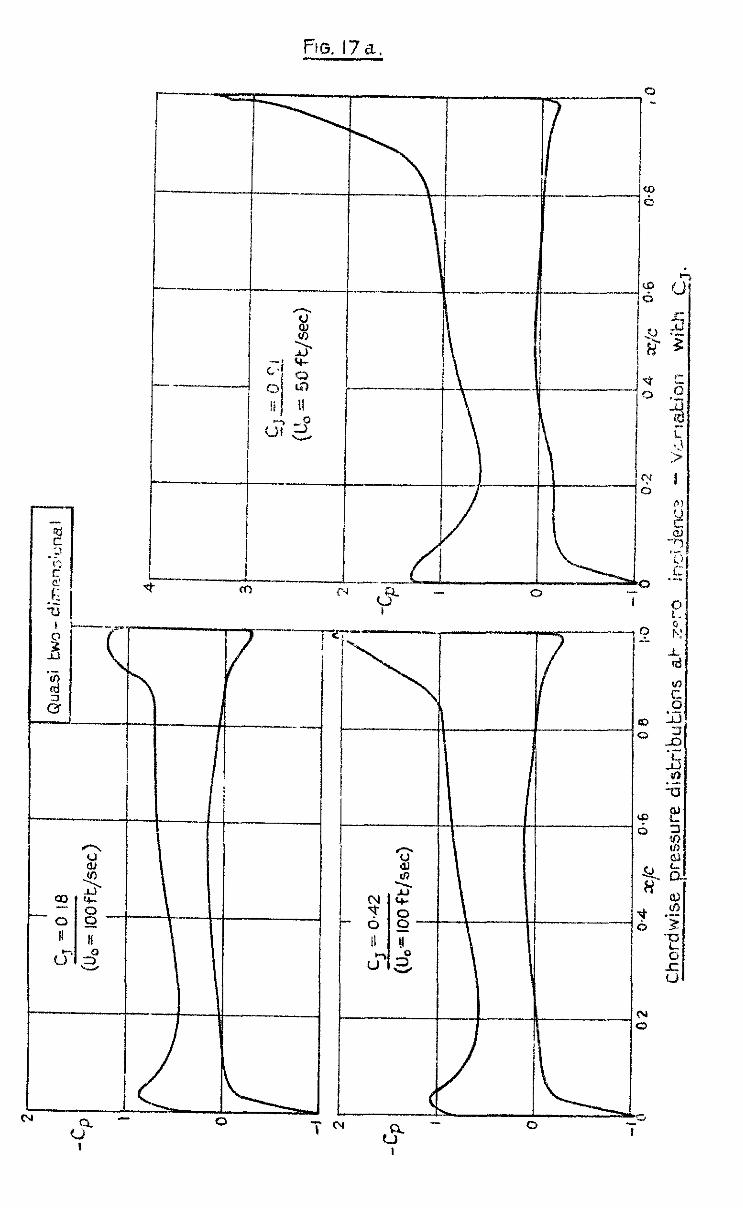
FIG. 17a.
0 II
t.5
-I 0
I---- - I
/ c-4 ua 1
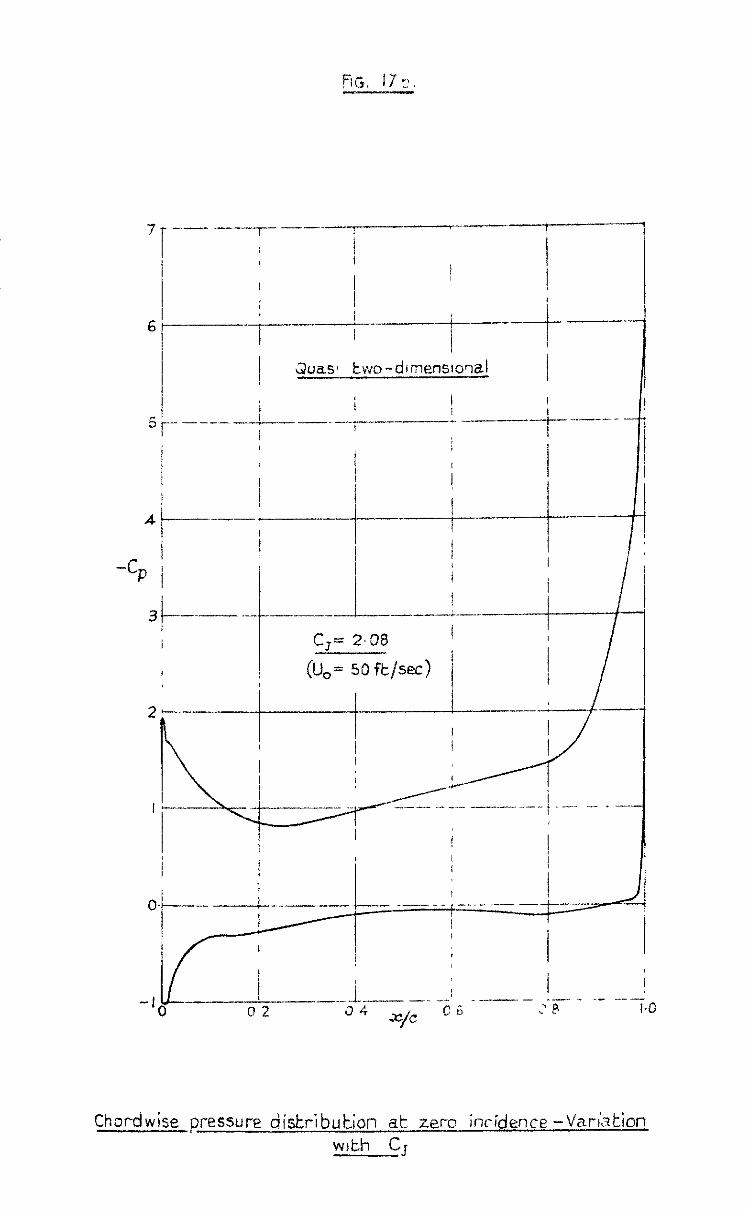
l I 1
2 1 - --
I --l---- --j- !
j 3uas* two-dinensco~l I
1 I I
I - ----- --------i-- ---- I f -----r- -.--- -
/
4 ;-~--+..-& 1 - - - j : ,
% /
~ -’
I
I
I
3 /---.- .-_ - - - - 1 -_-.,-A .-._ -.-
e. ,-.n I --I--/
2 c.-- --. -
b; i
, ’ - ’ ^--_--
I_,i
/----I - - -_ .- _... - .----i.-- - - .-
, i j /
Chordwise pressure di&-ibut& at zero incidence -Varizkion wtth C,
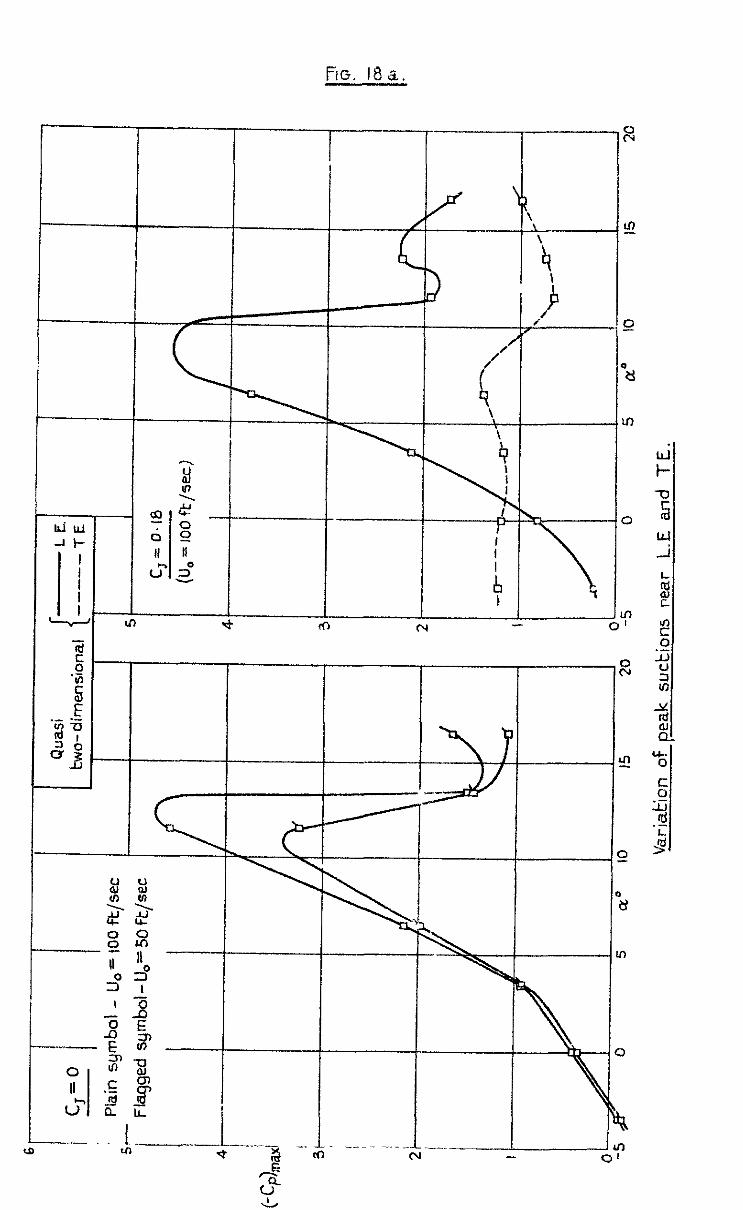
FIG. 18a.
---4--- ,
----I--

-
--A------ In ----s---rd
_--- 2 m fu
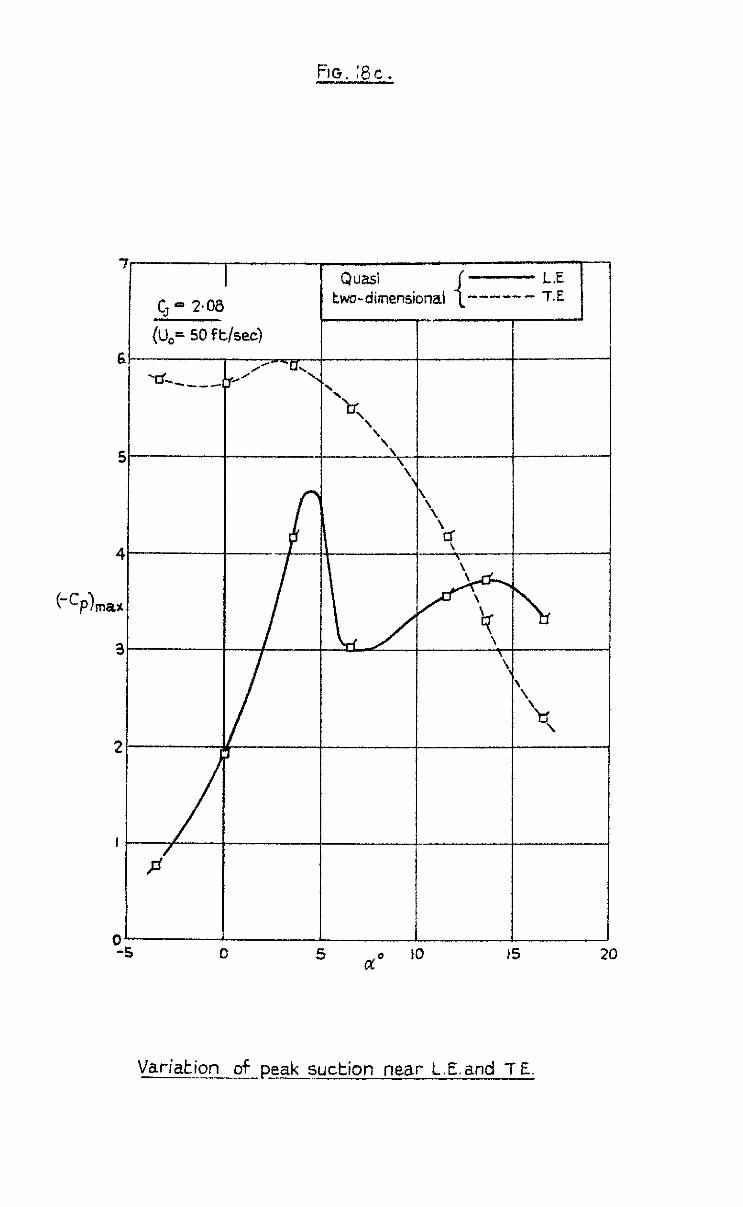
FIG. :8c.
-6 ---_-
5-
4
(-cphlC%X
3
2t----T I
I
~
P
0 -5 0
i \ \ 4.
\ \
c\ \ \ \
\ \ ‘kf \
Variation of-peak suction near L.E.and TE.

_ -_ _--- _____-_ -___-_
.


C.P. No. 304 (17,990)
A.R.C Techntcal Report
Crown copJnght mserved
Printed and publlsbed by HER b%AJESTY’S STATIONERY OFFICE
To be purchased from York House, Kmgswsy, London w c 2
+zx Oxford Street, London W.I P 0 Box 569. London S.B.I
13” Castle Street, Edmburgh z ‘ag St. Mary street, CwchfT
39 Kq Street, Manchester z Tower Lane, Bristol I
2 Edmund Street, Bmungham 3 80 Chchester Street, Belfast
or through my bookseller
S.0 Code No. 21.9010-4
C.P. No. 304


