ice trials of the uscgc healy: ice loads on rudder hornsweb2.clarkson.edu/projects/iahrice/iahr...
TRANSCRIPT
Ice in the Environment: Proceedings of the 16th IAHR International Symposium on Ice Dunedin, New Zealand, 2nd–6th December 2002 International Association of Hydraulic Engineering and Research
ICE TRIALS OF THE USCGC HEALY: ICE LOADS ON RUDDER HORNS
Alfred Tunik1, James W. St. John2, Rubin Sheinberg1 and Peter V. Minnick1
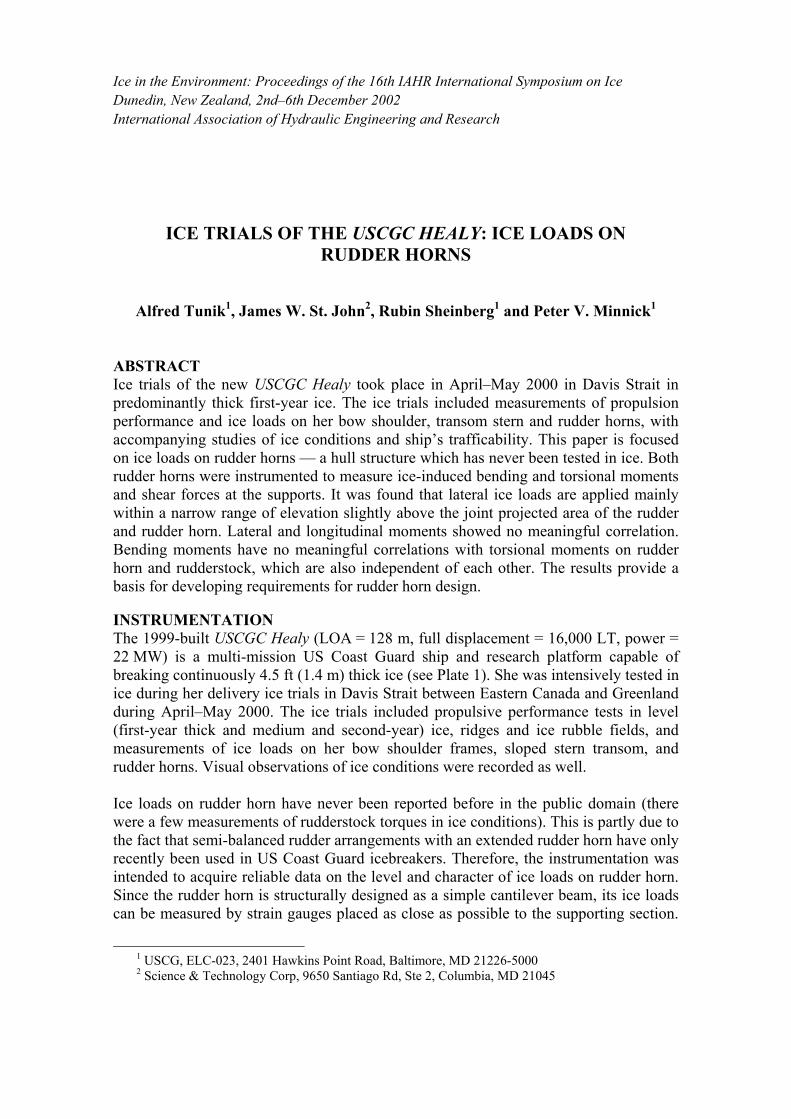
ABSTRACT Ice trials of the new USCGC Healy took place in April–May 2000 in Davis Strait in predominantly thick first-year ice. The ice trials included measurements of propulsion performance and ice loads on her bow shoulder, transom stern and rudder horns, with accompanying studies of ice conditions and ship’s trafficability. This paper is focused on ice loads on rudder horns — a hull structure which has never been tested in ice. Both rudder horns were instrumented to measure ice-induced bending and torsional moments and shear forces at the supports. It was found that lateral ice loads are applied mainly within a narrow range of elevation slightly above the joint projected area of the rudder and rudder horn. Lateral and longitudinal moments showed no meaningful correlation. Bending moments have no meaningful correlations with torsional moments on rudder horn and rudderstock, which are also independent of each other. The results provide a basis for developing requirements for rudder horn design. INSTRUMENTATION The 1999-built USCGC Healy (LOA = 128 m, full displacement = 16,000 LT, power = 22 MW) is a multi-mission US Coast Guard ship and research platform capable of breaking continuously 4.5 ft (1.4 m) thick ice (see Plate 1). She was intensively tested in ice during her delivery ice trials in Davis Strait between Eastern Canada and Greenland during April–May 2000. The ice trials included propulsive performance tests in level (first-year thick and medium and second-year) ice, ridges and ice rubble fields, and measurements of ice loads on her bow shoulder frames, sloped stern transom, and rudder horns. Visual observations of ice conditions were recorded as well. Ice loads on rudder horn have never been reported before in the public domain (there were a few measurements of rudderstock torques in ice conditions). This is partly due to the fact that semi-balanced rudder arrangements with an extended rudder horn have only recently been used in US Coast Guard icebreakers. Therefore, the instrumentation was intended to acquire reliable data on the level and character of ice loads on rudder horn. Since the rudder horn is structurally designed as a simple cantilever beam, its ice loads can be measured by strain gauges placed as close as possible to the supporting section.
1 USCG, ELC-023, 2401 Hawkins Point Road, Baltimore, MD 21226-5000 2 Science & Technology Corp, 9650 Santiago Rd, Ste 2, Columbia, MD 21045
Both starboard (SB) and port (PS) rudder horns were instrumented using identical strain gauge arrangements.
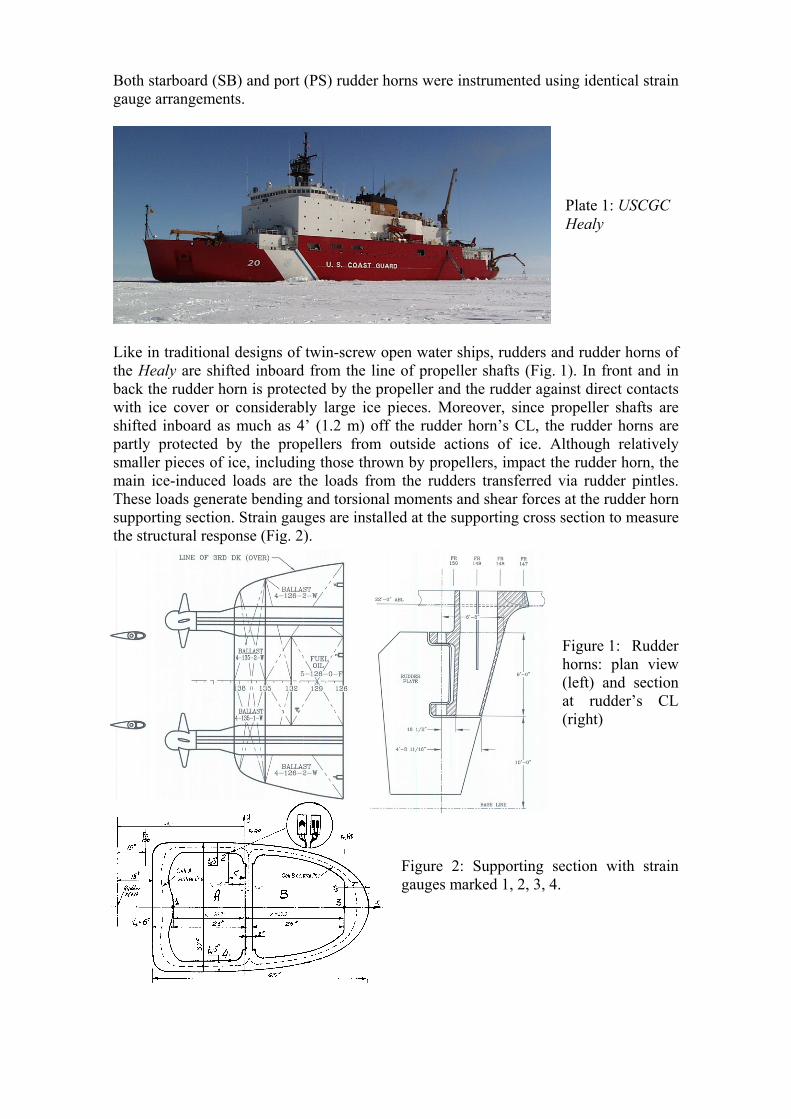
Like in traditional designs of twin-screw open water ships, rudders and rudder horns of the Healy are shifted inboard from the line of propeller shafts (Fig. 1). In front and in back the rudder horn is protected by the propeller and the rudder against direct contacts with ice cover or considerably large ice pieces. Moreover, since propeller shafts are shifted inboard as much as 4’ (1.2 m) off the rudder horn’s CL, the rudder horns are partly protected by the propellers from outside actions of ice. Although relatively smaller pieces of ice, including those thrown by propellers, impact the rudder horn, the main ice-induced loads are the loads from the rudders transferred via rudder pintles. These loads generate bending and torsional moments and shear forces at the rudder horn supporting section. Strain gauges are installed at the supporting cross section to measure the structural response (Fig. 2).
Figure 1: Rudder horns: plan view (left) and section at rudder’s CL (right)
Figure 2: Supporting section with strain gauges marked 1, 2, 3, 4.
Plate 1: USCGC Healy
STRUCTURAL RESPONSE TO EXTERNAL LOADS Based on simple beam theory, the ice-induced longitudinal (My) and transverse (Mx) bending and torsional (Mz) moments and shear forces (Qx and Qy, respectively) were obtained from normal (εi) and shear (γi) strains recorded from four strain gauges (i=1 to 4, in Fig. 2) as follows:
31
1 3
0.5y yM EIx x
εε = +
2 4 2
2 4 2
0.5 xx x y
y
I xM EI My y I yε ε
= + − ⋅
2zA zB
zA B
C M MMC C
= +
2 2 4zA AM GA t γ γ= − , 3
3 1 31
2 BzB B zA
A
tAM GA t MA t
γ γ= − − ⋅
22 4
2
yx
y
GI tQ
Sγ γ= + 1 3
1 3( )x d
yx
I t t tQ GS
γ γ+ += + + ∆
24 /( )
jj j
j
dsC GA
t s= Ú ; j =A, B; 1 3
1 3
( )4
x d A Bz
x A B
I t t t C CMS C A t A t
+ +∆ = −
where MzA and MzB are the torques for contours A and B in Fig. 2, respectively, CA, CB and AA, AB are St.Venant’s torsional stiffnesses and half-sum areas within the
outer and inner contours for contours A and B in Fig. 2, respectively, E and G are the Young’s and shear moduli of elasticity, respectively; Ix and Iy are the cross-sectional moments of inertia relative to the neutral axes x and y,
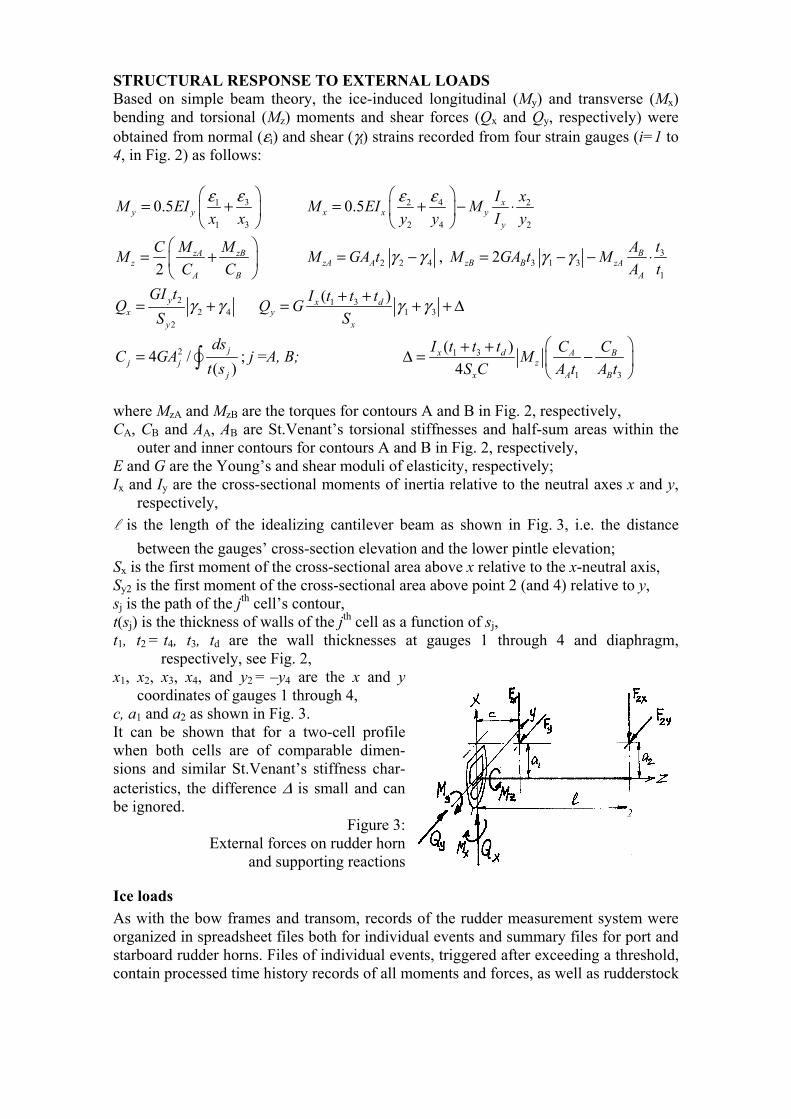
respectively, is the length of the idealizing cantilever beam as shown in Fig. 3, i.e. the distance
between the gauges’ cross-section elevation and the lower pintle elevation; Sx is the first moment of the cross-sectional area above x relative to the x-neutral axis, Sy2 is the first moment of the cross-sectional area above point 2 (and 4) relative to y, sj is the path of the jth cell’s contour, t(sj) is the thickness of walls of the jth cell as a function of sj, t1, t2 = t4, t3, td are the wall thicknesses at gauges 1 through 4 and diaphragm,
respectively, see Fig. 2, x1, x2, x3, x4, and y2 = –y4 are the x and y
coordinates of gauges 1 through 4, c, a1 and a2 as shown in Fig. 3. It can be shown that for a two-cell profile when both cells are of comparable dimen-sions and similar St.Venant’s stiffness char-acteristics, the difference ∆ is small and can be ignored.
Figure 3: External forces on rudder horn
and supporting reactions
Ice loads As with the bow frames and transom, records of the rudder measurement system were organized in spreadsheet files both for individual events and summary files for port and starboard rudder horns. Files of individual events, triggered after exceeding a threshold, contain processed time history records of all moments and forces, as well as rudderstock
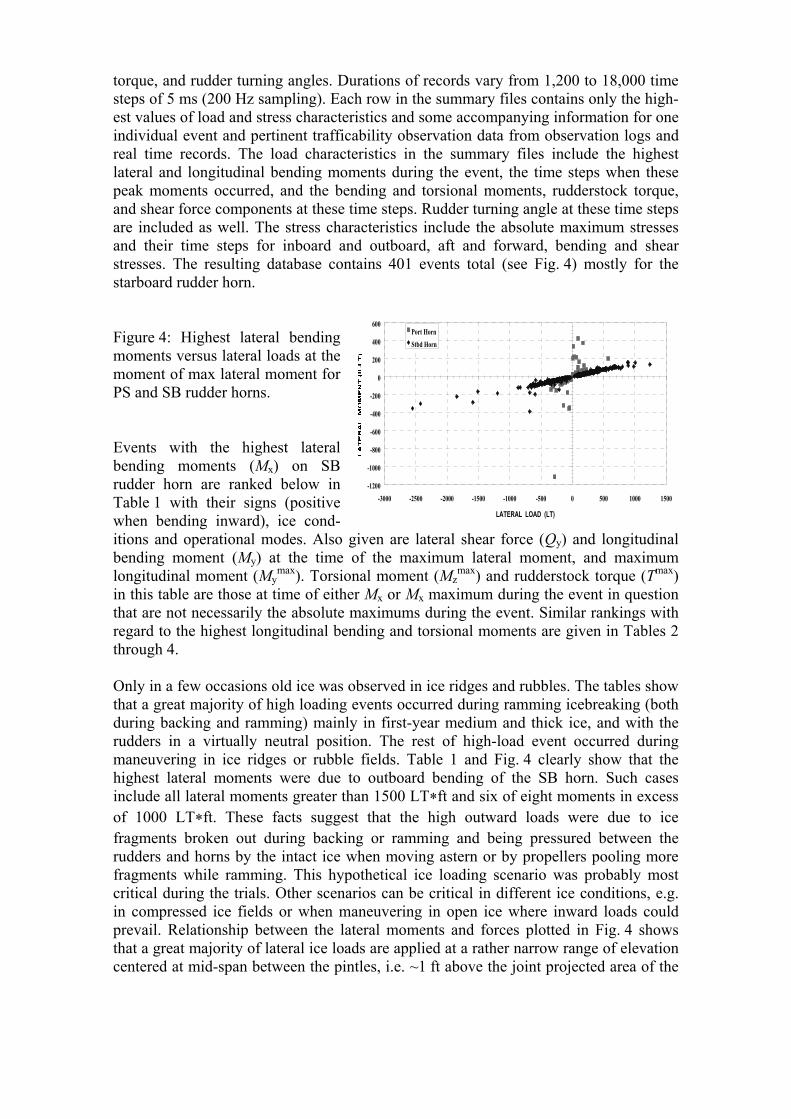
torque, and rudder turning angles. Durations of records vary from 1,200 to 18,000 time steps of 5 ms (200 Hz sampling). Each row in the summary files contains only the high-est values of load and stress characteristics and some accompanying information for one individual event and pertinent trafficability observation data from observation logs and real time records. The load characteristics in the summary files include the highest lateral and longitudinal bending moments during the event, the time steps when these peak moments occurred, and the bending and torsional moments, rudderstock torque, and shear force components at these time steps. Rudder turning angle at these time steps are included as well. The stress characteristics include the absolute maximum stresses and their time steps for inboard and outboard, aft and forward, bending and shear stresses. The resulting database contains 401 events total (see Fig. 4) mostly for the starboard rudder horn. Figure 4: Highest lateral bending moments versus lateral loads at the moment of max lateral moment for PS and SB rudder horns. Events with the highest lateral bending moments (Mx) on SB rudder horn are ranked below in Table 1 with their signs (positive when bending inward), ice cond-itions and operational modes. Also given are lateral shear force (Qy) and longitudinal bending moment (My) at the time of the maximum lateral moment, and maximum longitudinal moment (My
max). Torsional moment (Mzmax) and rudderstock torque (Tmax)
in this table are those at time of either Mx or Mx maximum during the event in question that are not necessarily the absolute maximums during the event. Similar rankings with regard to the highest longitudinal bending and torsional moments are given in Tables 2 through 4. Only in a few occasions old ice was observed in ice ridges and rubbles. The tables show that a great majority of high loading events occurred during ramming icebreaking (both during backing and ramming) mainly in first-year medium and thick ice, and with the rudders in a virtually neutral position. The rest of high-load event occurred during maneuvering in ice ridges or rubble fields. Table 1 and Fig. 4 clearly show that the highest lateral moments were due to outboard bending of the SB horn. Such cases include all lateral moments greater than 1500 LT*ft and six of eight moments in excess of 1000 LT*ft. These facts suggest that the high outward loads were due to ice fragments broken out during backing or ramming and being pressured between the rudders and horns by the intact ice when moving astern or by propellers pooling more fragments while ramming. This hypothetical ice loading scenario was probably most critical during the trials. Other scenarios can be critical in different ice conditions, e.g. in compressed ice fields or when maneuvering in open ice where inward loads could prevail. Relationship between the lateral moments and forces plotted in Fig. 4 shows that a great majority of lateral ice loads are applied at a rather narrow range of elevation centered at mid-span between the pintles, i.e. ~1 ft above the joint projected area of the
-1200
-1000
-800
-600
-400
-200
0
200
400
600
-3000 -2500 -2000 -1500 -1000 -500 0 500 1000 1500
LATERAL LOAD (LT)
Port HornStbd Horn
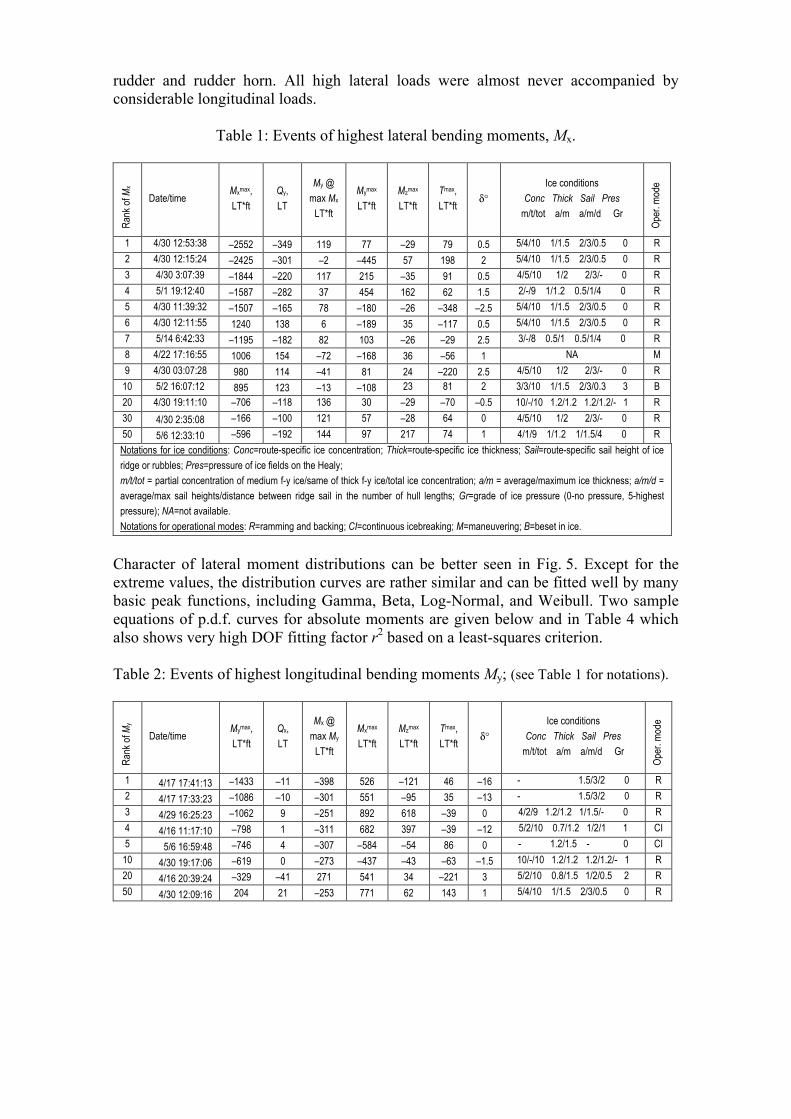
rudder and rudder horn. All high lateral loads were almost never accompanied by considerable longitudinal loads.
Table 1: Events of highest lateral bending moments, Mx.
Rank
of M
x
Date/time Mxmax, LT*ft
Qy, LT
My @ max Mx
LT*ft
Mymax LT*ft
Mzmax LT*ft
Tmax, LT*ft δ°
Ice conditions Conc Thick Sail Pres
m/t/tot a/m a/m/d Gr
Oper
. mod
e
1 4/30 12:53:38 –2552 –349 119 77 –29 79 0.5 5/4/10 1/1.5 2/3/0.5 0 R 2 4/30 12:15:24 –2425 –301 –2 –445 57 198 2 5/4/10 1/1.5 2/3/0.5 0 R 3 4/30 3:07:39 –1844 –220 117 215 –35 91 0.5 4/5/10 1/2 2/3/- 0 R 4 5/1 19:12:40 –1587 –282 37 454 162 62 1.5 2/-/9 1/1.2 0.5/1/4 0 R 5 4/30 11:39:32 –1507 –165 78 –180 –26 –348 –2.5 5/4/10 1/1.5 2/3/0.5 0 R 6 4/30 12:11:55 1240 138 6 –189 35 –117 0.5 5/4/10 1/1.5 2/3/0.5 0 R 7 5/14 6:42:33 –1195 –182 82 103 –26 –29 2.5 3/-/8 0.5/1 0.5/1/4 0 R 8 4/22 17:16:55 1006 154 –72 –168 36 –56 1 NA M 9 4/30 03:07:28 980 114 –41 81 24 –220 2.5 4/5/10 1/2 2/3/- 0 R
10 5/2 16:07:12 895 123 –13 –108 23 81 2 3/3/10 1/1.5 2/3/0.3 3 B 20 4/30 19:11:10 –706 –118 136 30 –29 –70 –0.5 10/-/10 1.2/1.2 1.2/1.2/- 1 R 30 4/30 2:35:08 –166 –100 121 57 –28 64 0 4/5/10 1/2 2/3/- 0 R 50 5/6 12:33:10 –596 –192 144 97 217 74 1 4/1/9 1/1.2 1/1.5/4 0 R Notations for ice conditions: Conc=route-specific ice concentration; Thick=route-specific ice thickness; Sail=route-specific sail height of ice ridge or rubbles; Pres=pressure of ice fields on the Healy; m/t/tot = partial concentration of medium f-y ice/same of thick f-y ice/total ice concentration; a/m = average/maximum ice thickness; a/m/d = average/max sail heights/distance between ridge sail in the number of hull lengths; Gr=grade of ice pressure (0-no pressure, 5-highest pressure); NA=not available. Notations for operational modes: R=ramming and backing; CI=continuous icebreaking; M=maneuvering; B=beset in ice.
Character of lateral moment distributions can be better seen in Fig. 5. Except for the extreme values, the distribution curves are rather similar and can be fitted well by many basic peak functions, including Gamma, Beta, Log-Normal, and Weibull. Two sample equations of p.d.f. curves for absolute moments are given below and in Table 4 which also shows very high DOF fitting factor r2 based on a least-squares criterion. Table 2: Events of highest longitudinal bending moments My; (see Table 1 for notations).
Rank
of M
y
Date/time Mymax, LT*ft
Qx, LT
Mx @ max My
LT*ft
Mxmax LT*ft
Mzmax LT*ft
Tmax, LT*ft δ°
Ice conditions Conc Thick Sail Pres
m/t/tot a/m a/m/d Gr
Oper
. mod
e
1 4/17 17:41:13 –1433 –11 –398 526 –121 46 –16 - 1.5/3/2 0 R 2 4/17 17:33:23 –1086 –10 –301 551 –95 35 –13 - 1.5/3/2 0 R 3 4/29 16:25:23 –1062 9 –251 892 618 –39 0 4/2/9 1.2/1.2 1/1.5/- 0 R 4 4/16 11:17:10 –798 1 –311 682 397 –39 –12 5/2/10 0.7/1.2 1/2/1 1 CI 5 5/6 16:59:48 –746 4 –307 –584 –54 86 0 - 1.2/1.5 - 0 CI
10 4/30 19:17:06 –619 0 –273 –437 –43 –63 –1.5 10/-/10 1.2/1.2 1.2/1.2/- 1 R 20 4/16 20:39:24 –329 –41 271 541 34 –221 3 5/2/10 0.8/1.5 1/2/0.5 2 R 50 4/30 12:09:16 204 21 –253 771 62 143 1 5/4/10 1/1.5 2/3/0.5 0 R
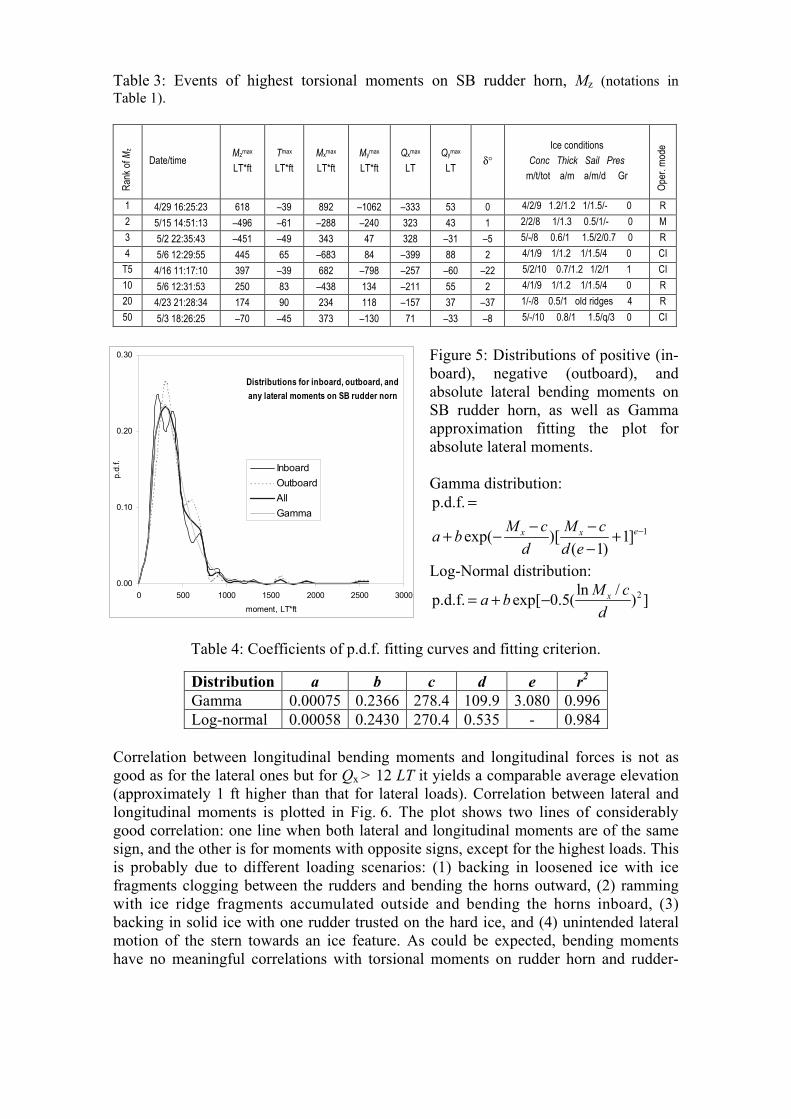
Table 3: Events of highest torsional moments on SB rudder horn, Mz (notations in Table 1).
Ra
nk of
Mz
Date/time Mzmax LT*ft
Tmax LT*ft
Mxmax LT*ft
Mymax LT*ft
Qxmax LT
Qymax LT δ°
Ice conditions Conc Thick Sail Pres
m/t/tot a/m a/m/d Gr
Oper
. mod
e
1 4/29 16:25:23 618 –39 892 –1062 –333 53 0 4/2/9 1.2/1.2 1/1.5/- 0 R 2 5/15 14:51:13 –496 –61 –288 –240 323 43 1 2/2/8 1/1.3 0.5/1/- 0 M 3 5/2 22:35:43 –451 –49 343 47 328 –31 –5 5/-/8 0.6/1 1.5/2/0.7 0 R 4 5/6 12:29:55 445 65 –683 84 –399 88 2 4/1/9 1/1.2 1/1.5/4 0 CI
T5 4/16 11:17:10 397 –39 682 –798 –257 –60 –22 5/2/10 0.7/1.2 1/2/1 1 CI 10 5/6 12:31:53 250 83 –438 134 –211 55 2 4/1/9 1/1.2 1/1.5/4 0 R 20 4/23 21:28:34 174 90 234 118 –157 37 –37 1/-/8 0.5/1 old ridges 4 R 50 5/3 18:26:25 –70 –45 373 –130 71 –33 –8 5/-/10 0.8/1 1.5/q/3 0 CI
Figure 5: Distributions of positive (in-board), negative (outboard), and absolute lateral bending moments on SB rudder horn, as well as Gamma approximation fitting the plot for absolute lateral moments. Gamma distribution:
1
p.d.f.
exp( )[ 1]( 1)
ex xM c M ca bd d e
−
=− −+ − +
−
Log-Normal distribution: 2ln /p.d.f. exp[ 0.5( ) ]xM ca b
d= + −
Table 4: Coefficients of p.d.f. fitting curves and fitting criterion.
Distribution a b c d e r2 Gamma 0.00075 0.2366 278.4 109.9 3.080 0.996 Log-normal 0.00058 0.2430 270.4 0.535 - 0.984
Correlation between longitudinal bending moments and longitudinal forces is not as good as for the lateral ones but for Qx > 12 LT it yields a comparable average elevation (approximately 1 ft higher than that for lateral loads). Correlation between lateral and longitudinal moments is plotted in Fig. 6. The plot shows two lines of considerably good correlation: one line when both lateral and longitudinal moments are of the same sign, and the other is for moments with opposite signs, except for the highest loads. This is probably due to different loading scenarios: (1) backing in loosened ice with ice fragments clogging between the rudders and bending the horns outward, (2) ramming with ice ridge fragments accumulated outside and bending the horns inboard, (3) backing in solid ice with one rudder trusted on the hard ice, and (4) unintended lateral motion of the stern towards an ice feature. As could be expected, bending moments have no meaningful correlations with torsional moments on rudder horn and rudder-
Distributions for inboard, outboard, andany lateral moments on SB rudder norn
0.00
0.10
0.20
0.30
0 500 1000 1500 2000 2500 3000moment, LT*ft
p.d.
f. InboardOutboardAllGamma
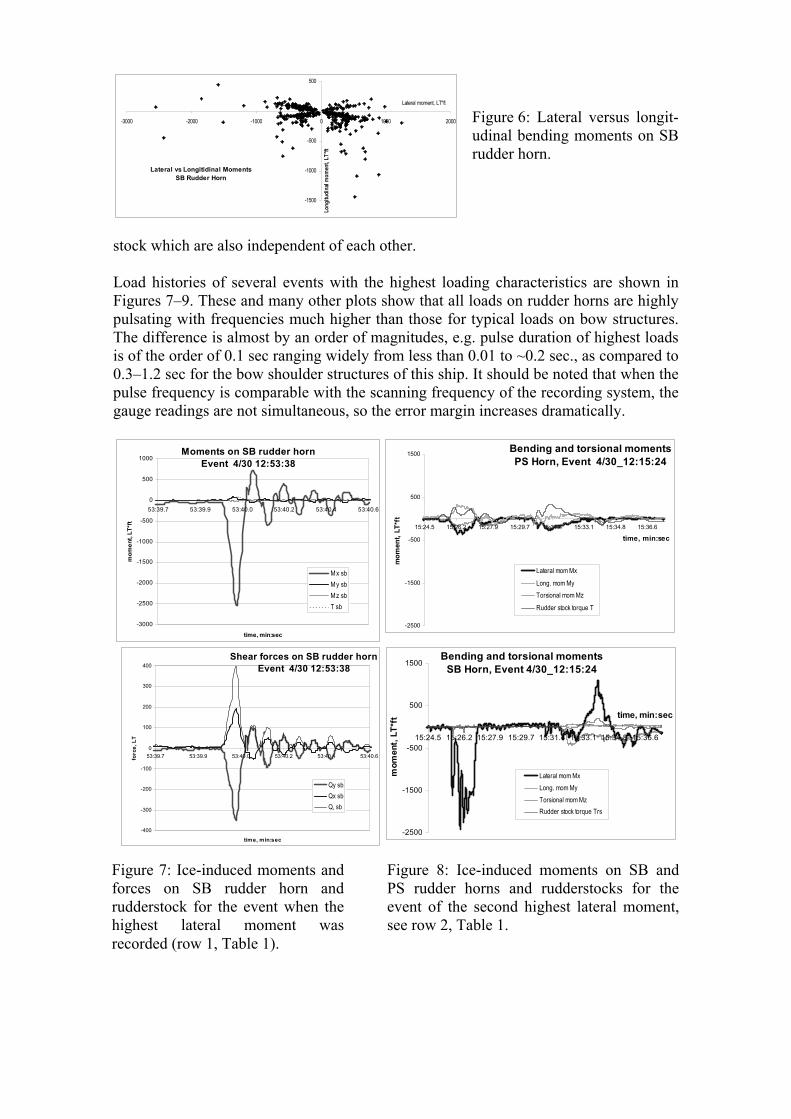
Figure 6: Lateral versus longit-udinal bending moments on SB rudder horn.
stock which are also independent of each other. Load histories of several events with the highest loading characteristics are shown in Figures 7–9. These and many other plots show that all loads on rudder horns are highly pulsating with frequencies much higher than those for typical loads on bow structures. The difference is almost by an order of magnitudes, e.g. pulse duration of highest loads is of the order of 0.1 sec ranging widely from less than 0.01 to ~0.2 sec., as compared to 0.3–1.2 sec for the bow shoulder structures of this ship. It should be noted that when the pulse frequency is comparable with the scanning frequency of the recording system, the gauge readings are not simultaneous, so the error margin increases dramatically.
Lateral vs Longitidinal MomentsSB Rudder Horn
-1500
-1000
-500
0
500
-3000 -2000 -1000 0 1000 2000
Lateral moment, LT*ft
Long
itudi
nal m
omen
t, LT
*ft
Bending and torsional momentsSB Horn, Event 4/30_12:15:24
-2500
-1500
-500
500
1500
15:24.5 15:26.2 15:27.9 15:29.7 15:31.4 15:33.1 15:34.8 15:36.6
time, min:sec
mom
ent,
LT*f
t
Lateral mom MxLong. mom MyTorsional mom MzRudder stock torque Trs
Bending and torsional momentsPS Horn, Event 4/30_12:15:24
-2500
-1500
-500
500
1500
15:24.5 15:26.2 15:27.9 15:29.7 15:31.4 15:33.1 15:34.8 15:36.6
time, min:sec
mom
ent,
LT*f
t
Lateral mom Mx
Long. mom MyTorsional mom Mz
Rudder stock torque T
Moments on SB rudder hornEvent 4/30 12:53:38
-3000
-2500
-2000
-1500
-1000
-500
0
500
1000
53:39.7 53:39.9 53:40.0 53:40.2 53:40.4 53:40.6
time, min:sec
mom
ent,
LT*f
t
Mx sbMy sbMz sbT sb
Shear forces on SB rudder hornEvent 4/30 12:53:38
-400
-300
-200
-100
0
100
200
300
400
53:39.7 53:39.9 53:40.0 53:40.2 53:40.4 53:40.6
time, min:sec
forc
e, L
T
Qy sbQx sbQ, sb
Figure 7: Ice-induced moments and forces on SB rudder horn and rudderstock for the event when the highest lateral moment wasrecorded (row 1, Table 1).
Figure 8: Ice-induced moments on SB and PS rudder horns and rudderstocks for the event of the second highest lateral moment, see row 2, Table 1.
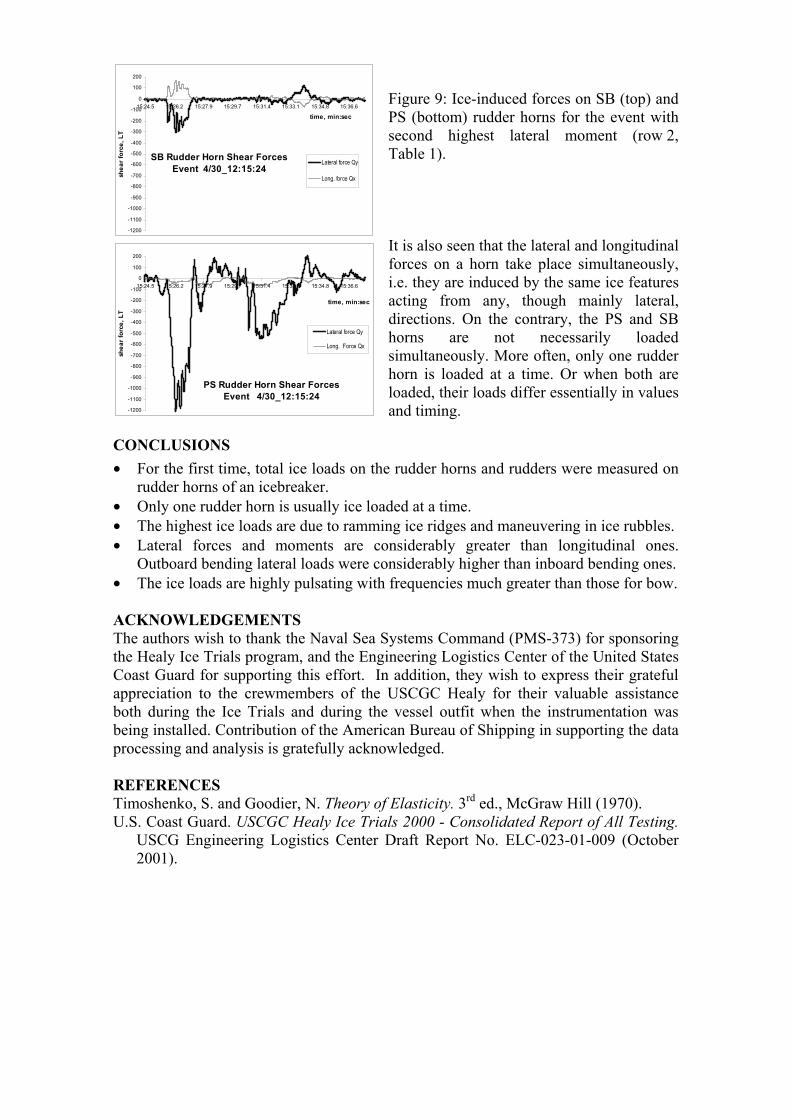
Figure 9: Ice-induced forces on SB (top) and PS (bottom) rudder horns for the event with second highest lateral moment (row 2, Table 1). It is also seen that the lateral and longitudinal forces on a horn take place simultaneously, i.e. they are induced by the same ice features acting from any, though mainly lateral, directions. On the contrary, the PS and SB horns are not necessarily loaded simultaneously. More often, only one rudder horn is loaded at a time. Or when both are loaded, their loads differ essentially in values and timing.
CONCLUSIONS • For the first time, total ice loads on the rudder horns and rudders were measured on
rudder horns of an icebreaker. • Only one rudder horn is usually ice loaded at a time. • The highest ice loads are due to ramming ice ridges and maneuvering in ice rubbles. • Lateral forces and moments are considerably greater than longitudinal ones.
Outboard bending lateral loads were considerably higher than inboard bending ones. • The ice loads are highly pulsating with frequencies much greater than those for bow. ACKNOWLEDGEMENTS The authors wish to thank the Naval Sea Systems Command (PMS-373) for sponsoring the Healy Ice Trials program, and the Engineering Logistics Center of the United States Coast Guard for supporting this effort. In addition, they wish to express their grateful appreciation to the crewmembers of the USCGC Healy for their valuable assistance both during the Ice Trials and during the vessel outfit when the instrumentation was being installed. Contribution of the American Bureau of Shipping in supporting the data processing and analysis is gratefully acknowledged. REFERENCES Timoshenko, S. and Goodier, N. Theory of Elasticity. 3rd ed., McGraw Hill (1970). U.S. Coast Guard. USCGC Healy Ice Trials 2000 - Consolidated Report of All Testing.
USCG Engineering Logistics Center Draft Report No. ELC-023-01-009 (October 2001).
SB Rudder Horn Shear ForcesEvent 4/30_12:15:24
-1200
-1100
-1000
-900
-800
-700
-600
-500
-400
-300
-200
-100
0
100
200
15:24.5 15:26.2 15:27.9 15:29.7 15:31.4 15:33.1 15:34.8 15:36.6
time, min:secsh
ear f
orce
, LT
Lateral force Qy
Long. force Qx
PS Rudder Horn Shear ForcesEvent 4/30_12:15:24
-1200
-1100
-1000
-900
-800
-700
-600
-500
-400
-300
-200
-100
0
100
200
15:24.5 15:26.2 15:27.9 15:29.7 15:31.4 15:33.1 15:34.8 15:36.6
time, min:sec
shea
r for
ce, L
T
Lateral force Qy
Long. Force Qx