Download - FARS database analysis
AN ANALYSIS ON FARS DATA
OVER A PERIOD OF 15 YEARS
(1998 to 2012)(Traffic Safety Term Paper)
GROUP
Abhinav Mishra
Akash Chandra
Anurag Singhal
Dileep Lachheta
Mayank Agarwal
Prabhat K. Ravi
Rocky Kasana

INTRODUCTION
In the current research alcohol consumption has been studied & for deep insight data has been divided into following categories
Blood Alcohol Concentration Data Type Name
All (irrespective of BAC) Type-I
0.01g/dLto 0.94+g/dL Type-II
0.01g/dLto 0.08g/dL Type-III
0.08g/dL to 0.94g/dL Type -IV

PARAMETERS CONSIDERED
Age
Sex
Number of Occupants
Restraint System Used
Crash Time
Ethnicity
Roadway Function Class

Statistical Analysis: Mann-Whitney
Test
What is it for? A non-parametric test to compare the central tendencies of two groups
It assumes Random assignments to groups
Test statistic: U
Based on ranks from two independent
samples, they correspond to
i. the t test for two independent samples,
except that no assumptions
ii. are necessary regarding normality ore
equality or variances

Mann-Whitney Test: Procedure
Rank all scores together, ignoring
which group they belong
Separately sum the ranks for the first and
second samples
Select the larger of these two rank
totals, and call it TX

Sample Null hypothesis
The two groups
are the same
Null distribution
U (Ustatic with n1, n2)compare
How unusual is this test statistic?
P < 0.05 P > 0.05
Reject Ho Fail to reject Ho
Mann-Whitney U test
Test statistic
U1 or U2

Mann-Whitney U test
Critical Values for 1 and 2 Tail Tests
2 Tail
Confidence.
1 Tail
Confidence UCritical U < U Critical
80.0% 90.00% 200 YES
90.0% 95.00% 192 YES
95.0% 97.50% 184 YES
99.0% 99.50% 171 YES
Assume Ustatic=120
AGE
FARS data is divided into different age groups
namely
under 20
20 to 29 years
30 to 39 years
40 to 49 years
50 to 59 years
60 years and above
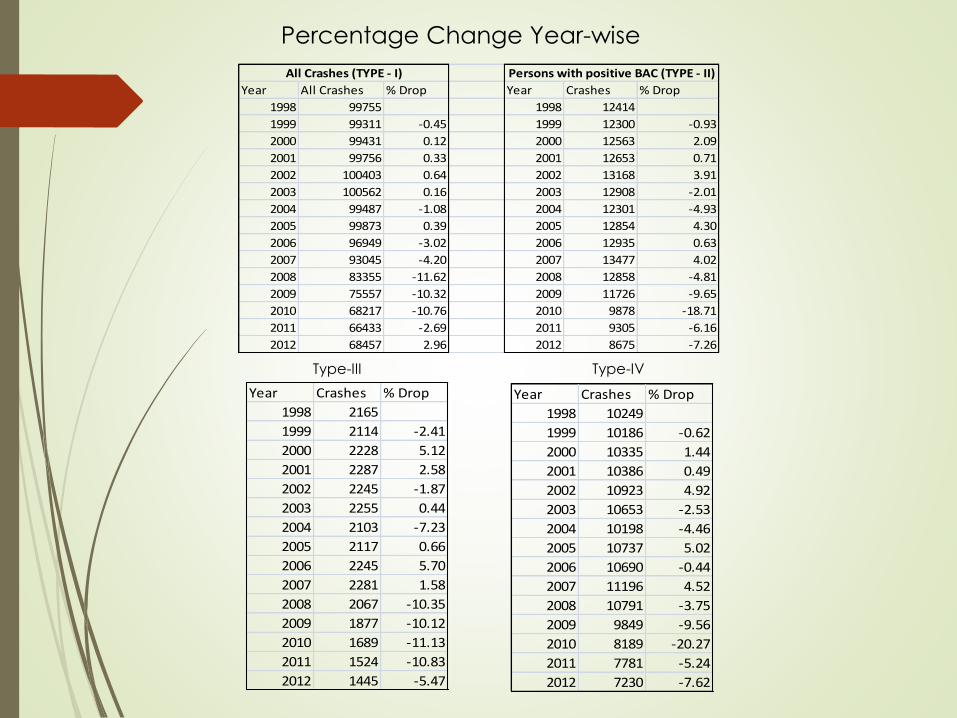
Year All Crashes % Drop Year Crashes % Drop
1998 99755 1998 12414
1999 99311 -0.45 1999 12300 -0.93
2000 99431 0.12 2000 12563 2.09
2001 99756 0.33 2001 12653 0.71
2002 100403 0.64 2002 13168 3.91
2003 100562 0.16 2003 12908 -2.01
2004 99487 -1.08 2004 12301 -4.93
2005 99873 0.39 2005 12854 4.30
2006 96949 -3.02 2006 12935 0.63
2007 93045 -4.20 2007 13477 4.02
2008 83355 -11.62 2008 12858 -4.81
2009 75557 -10.32 2009 11726 -9.65
2010 68217 -10.76 2010 9878 -18.71
2011 66433 -2.69 2011 9305 -6.16
2012 68457 2.96 2012 8675 -7.26
All Crashes (TYPE - I) Persons with positive BAC (TYPE - II)
Year Crashes % Drop
1998 2165
1999 2114 -2.41
2000 2228 5.12
2001 2287 2.58
2002 2245 -1.87
2003 2255 0.44
2004 2103 -7.23
2005 2117 0.66
2006 2245 5.70
2007 2281 1.58
2008 2067 -10.35
2009 1877 -10.12
2010 1689 -11.13
2011 1524 -10.83
2012 1445 -5.47
Year Crashes % Drop
1998 10249
1999 10186 -0.62
2000 10335 1.44
2001 10386 0.49
2002 10923 4.92
2003 10653 -2.53
2004 10198 -4.46
2005 10737 5.02
2006 10690 -0.44
2007 11196 4.52
2008 10791 -3.75
2009 9849 -9.56
2010 8189 -20.27
2011 7781 -5.24
2012 7230 -7.62
Type-III Type-IV
Percentage Change Year-wise

0
5000
10000
15000
20000
25000
1998 2000 2002 2004 2006 2008 2010 2012
No
. o
f Fa
talitie
s
Year
Under 20
20-29
30-39
40-49
50-59
over 59
under 20
20-29
30-39
40-49
50-59
over 59
Type –I v/s Type –II for Age
Variations in fatality with age for data Type I & II
OBSERVATIONS (TYPE 1 & TYPE II)
Younger persons are more involved in crashes in
comparison to older persons
In Type-II data, number of fatalities are more for
person with age between 20 & 29. This may be due
to 21 year minimum drinking age law
In both cases there is decrease in fatalities after 2007
which may be due to change in enforcement.
For type-I data, graph shows that there is decrease in
fatalities with persons involving age less than 20 after
2004 while there is increase in crashes with person
age group between 20 & 29.

0
500
1000
1500
2000
2500
3000
3500
4000
4500
1998 2000 2002 2004 2006 2008 2010 2012
No
. o
f Fa
talit
ies
Year
Under 20
20-29
30-39
40-49
50-59
over 59
Under 20
20-29
30-39
40-49
50-59
Over 59
Type –IV v/s Type –III for Age
Variations in fatality with age for data type III & IV
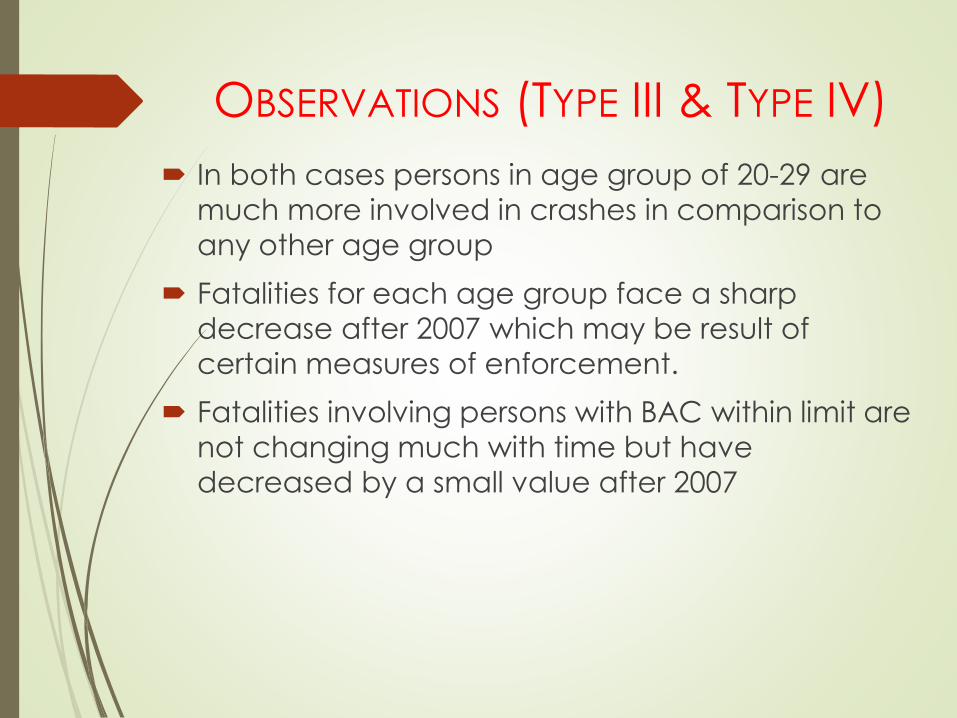
OBSERVATIONS (TYPE III & TYPE IV)
In both cases persons in age group of 20-29 are
much more involved in crashes in comparison to
any other age group
Fatalities for each age group face a sharp
decrease after 2007 which may be result of
certain measures of enforcement.
Fatalities involving persons with BAC within limit are
not changing much with time but have
decreased by a small value after 2007

NUMBER OF OCCUPANT
In order to see the variation for different types of vehicles
the data has been divided into following groups
One
Two
Three to six
More than six
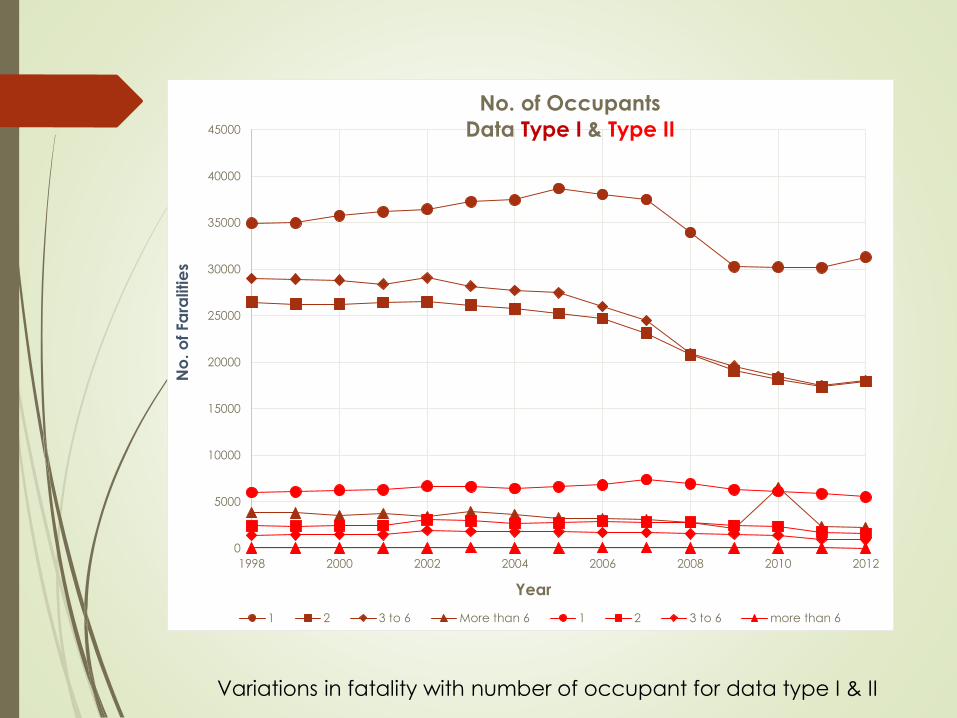
Variations in fatality with number of occupant for data type I & II
0
5000
10000
15000
20000
25000
30000
35000
40000
45000
1998 2000 2002 2004 2006 2008 2010 2012
No
. o
f Fa
ralitie
s
Year
No. of Occupants
Data Type I & Type II
1 2 3 to 6 More than 6 1 2 3 to 6 more than 6
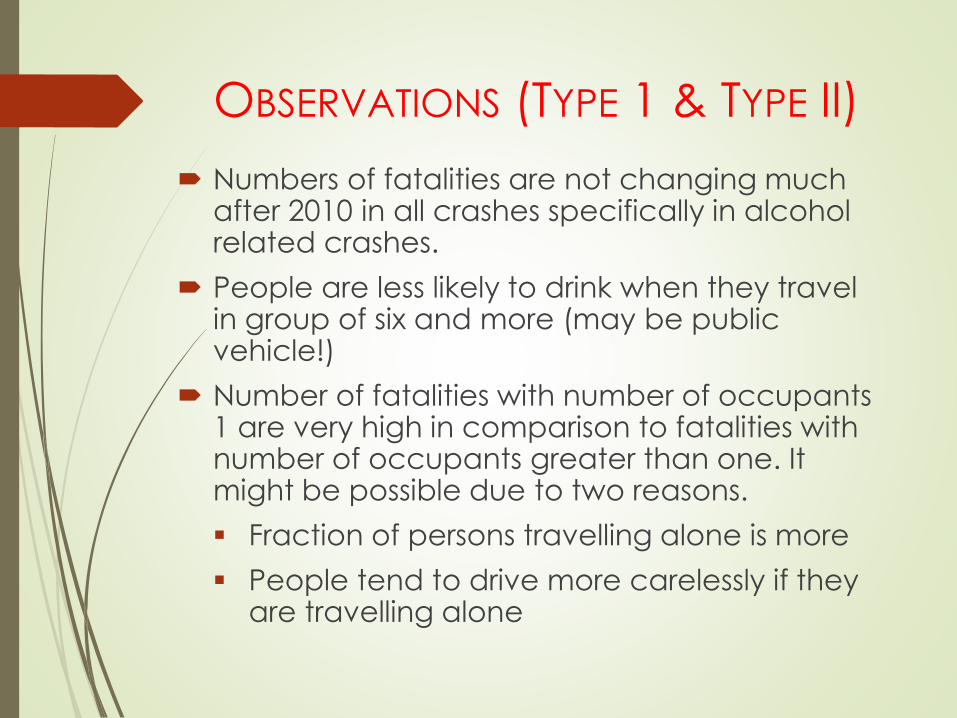
OBSERVATIONS (TYPE 1 & TYPE II)
Numbers of fatalities are not changing much after 2010 in all crashes specifically in alcohol related crashes.
People are less likely to drink when they travel in group of six and more (may be public vehicle!)
Number of fatalities with number of occupants 1 are very high in comparison to fatalities with number of occupants greater than one. It might be possible due to two reasons.
Fraction of persons travelling alone is more
People tend to drive more carelessly if they are travelling alone
0
1000
2000
3000
4000
5000
6000
7000
1998 2000 2002 2004 2006 2008 2010 2012
Nu
mb
er
of Fa
talitie
s
Year
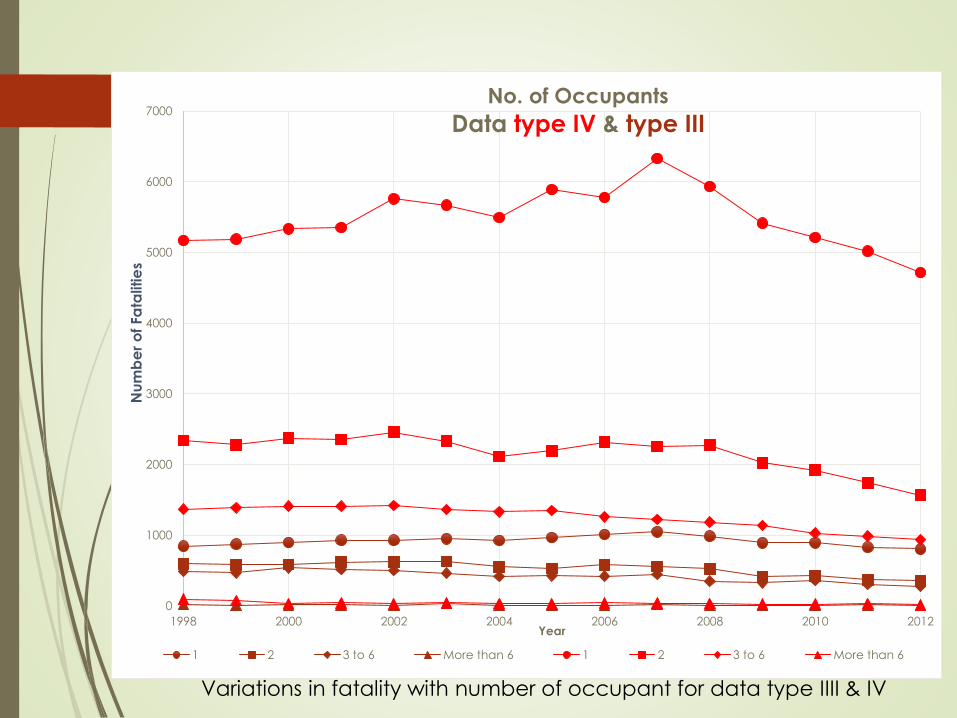
No. of Occupants
Data type IV & type III
1 2 3 to 6 More than 6 1 2 3 to 6 More than 6
Variations in fatality with number of occupant for data type IIII & IV
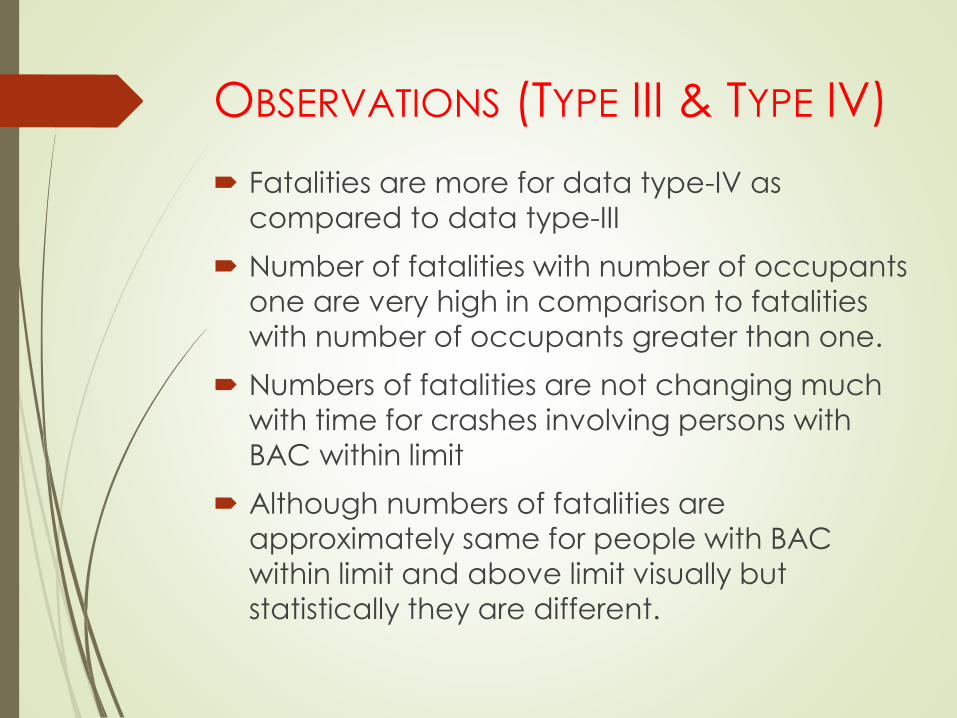
OBSERVATIONS (TYPE III & TYPE IV)
Fatalities are more for data type-IV as
compared to data type-III
Number of fatalities with number of occupants
one are very high in comparison to fatalities
with number of occupants greater than one.
Numbers of fatalities are not changing much
with time for crashes involving persons with
BAC within limit
Although numbers of fatalities are
approximately same for people with BAC
within limit and above limit visually but
statistically they are different.
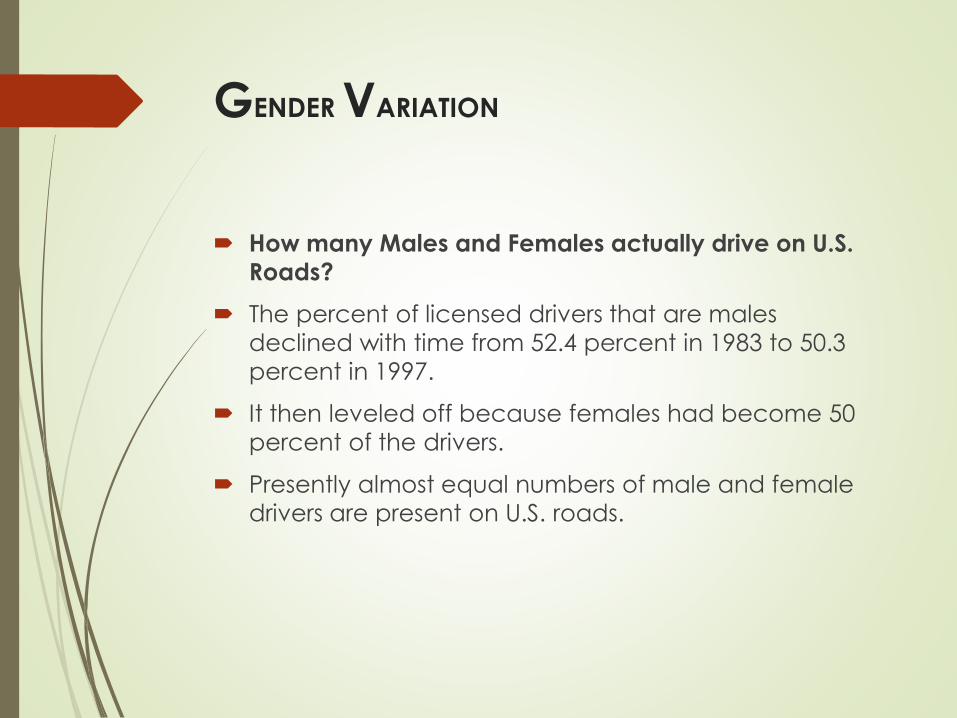
GENDER VARIATION
How many Males and Females actually drive on U.S.
Roads?
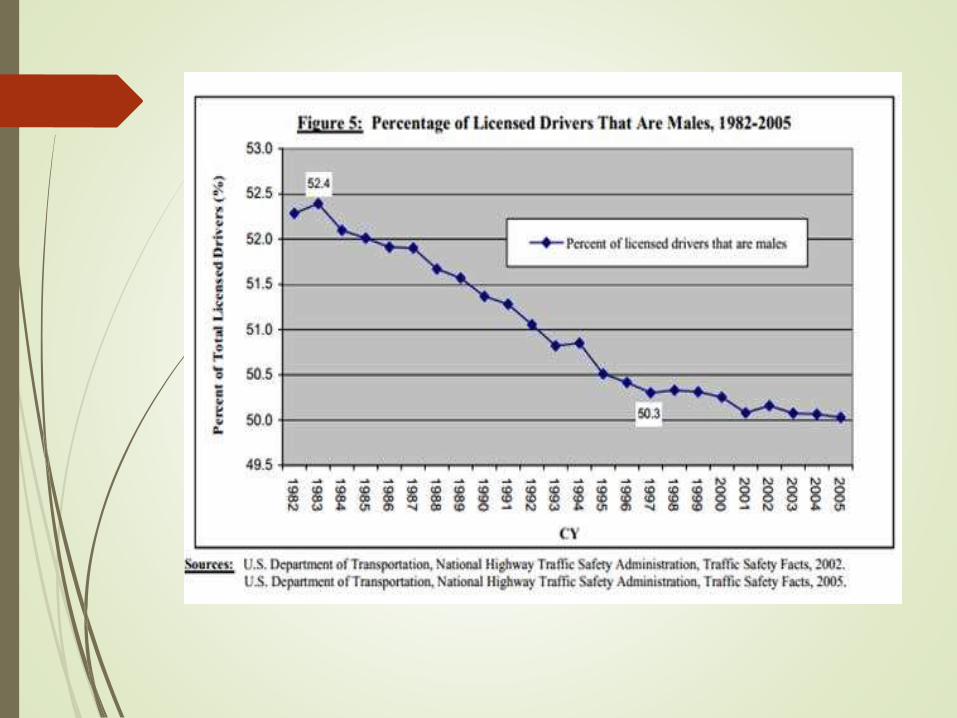
The percent of licensed drivers that are males
declined with time from 52.4 percent in 1983 to 50.3
percent in 1997.
It then leveled off because females had become 50
percent of the drivers.
Presently almost equal numbers of male and female
drivers are present on U.S. roads.
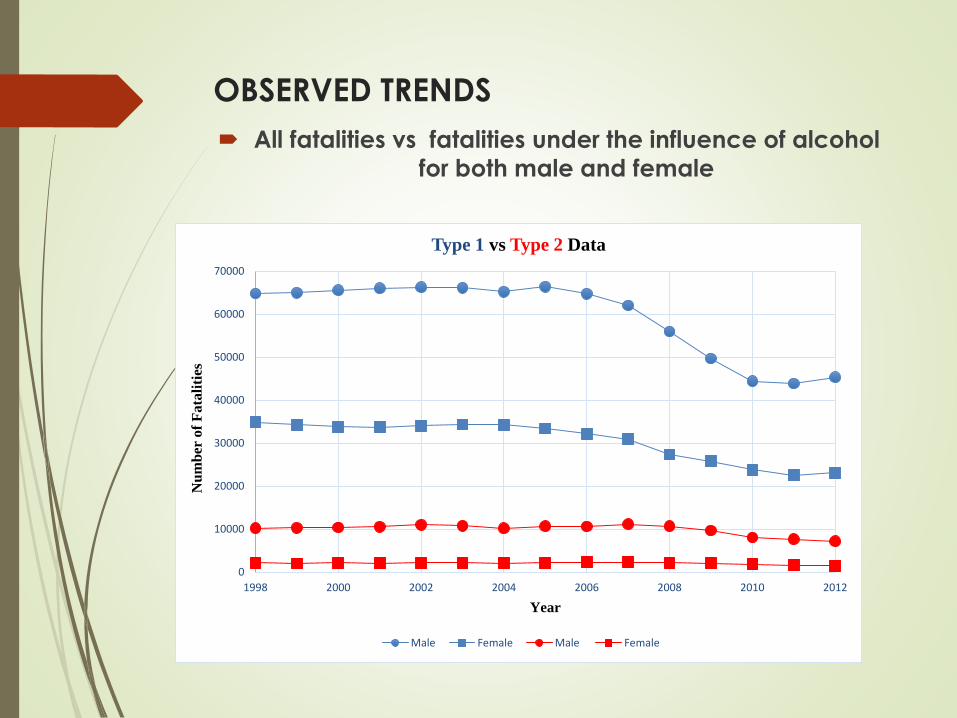
OBSERVED TRENDS
All fatalities vs fatalities under the influence of alcohol
for both male and female
0
10000
20000
30000
40000
50000
60000
70000
1998 2000 2002 2004 2006 2008 2010 2012
Nu
mb
er o
f F
ata
liti
es
Year
Type 1 vs Type 2 Data
Male Female Male Female
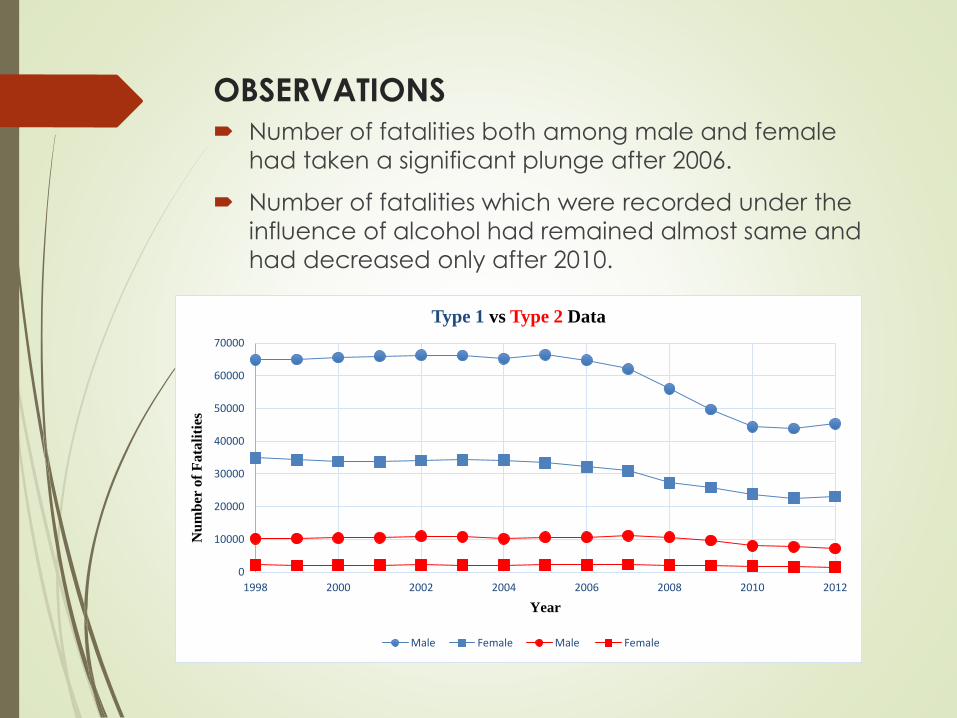
OBSERVATIONS
Number of fatalities both among male and female
had taken a significant plunge after 2006.
Number of fatalities which were recorded under the
influence of alcohol had remained almost same and
had decreased only after 2010.
0
10000
20000
30000
40000
50000
60000
70000
1998 2000 2002 2004 2006 2008 2010 2012
Nu
mb
er o
f F
ata
liti
es
Year
Type 1 vs Type 2 Data
Male Female Male Female
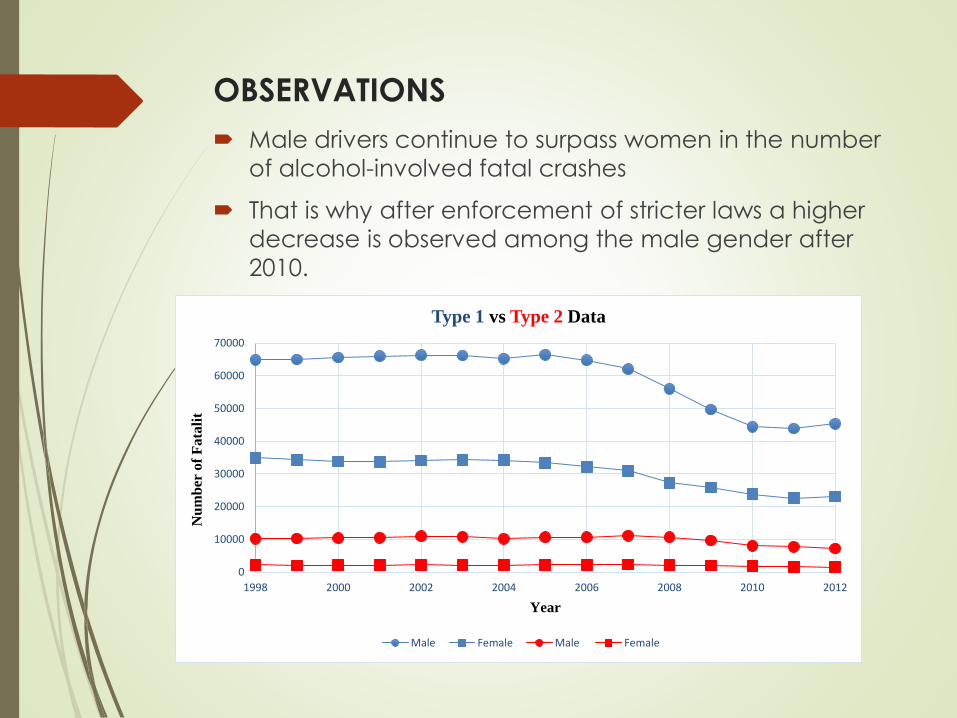
OBSERVATIONS
Male drivers continue to surpass women in the number
of alcohol-involved fatal crashes
That is why after enforcement of stricter laws a higher
decrease is observed among the male gender after
2010.
0
10000
20000
30000
40000
50000
60000
70000
1998 2000 2002 2004 2006 2008 2010 2012
Nu
mb
er o
f F
ata
lit
Year
Type 1 vs Type 2 Data
Male Female Male Female
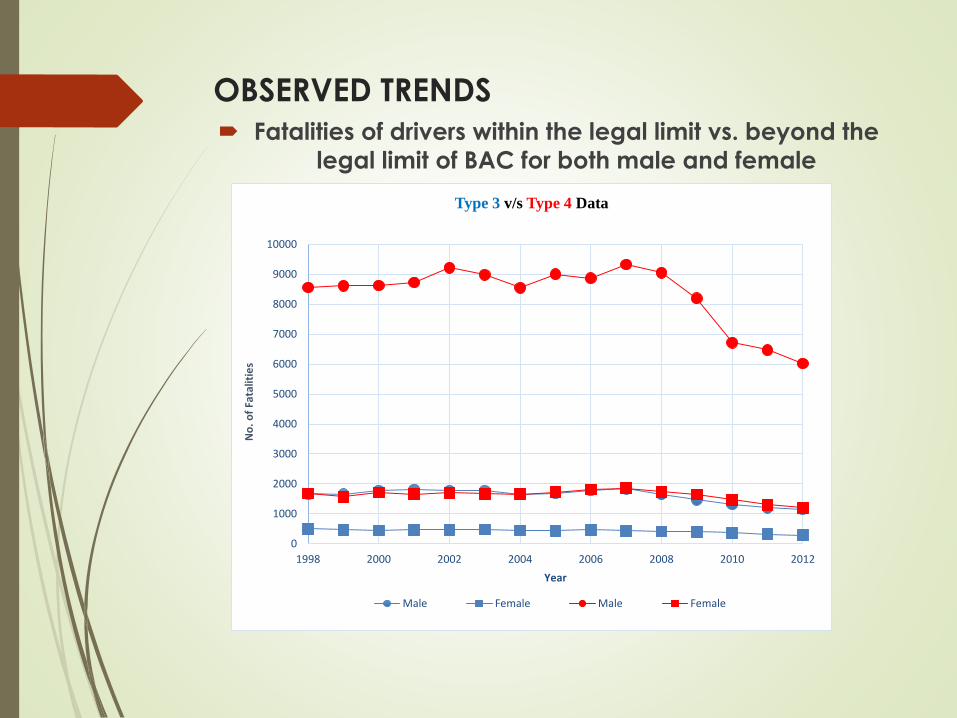
OBSERVED TRENDS
Fatalities of drivers within the legal limit vs. beyond the
legal limit of BAC for both male and female
0
1000
2000
3000
4000
5000
6000
7000
8000
9000
10000
1998 2000 2002 2004 2006 2008 2010 2012
No
. o
f Fa
talit
ies
Year
Type 3 v/s Type 4 Data
Male Female Male Female
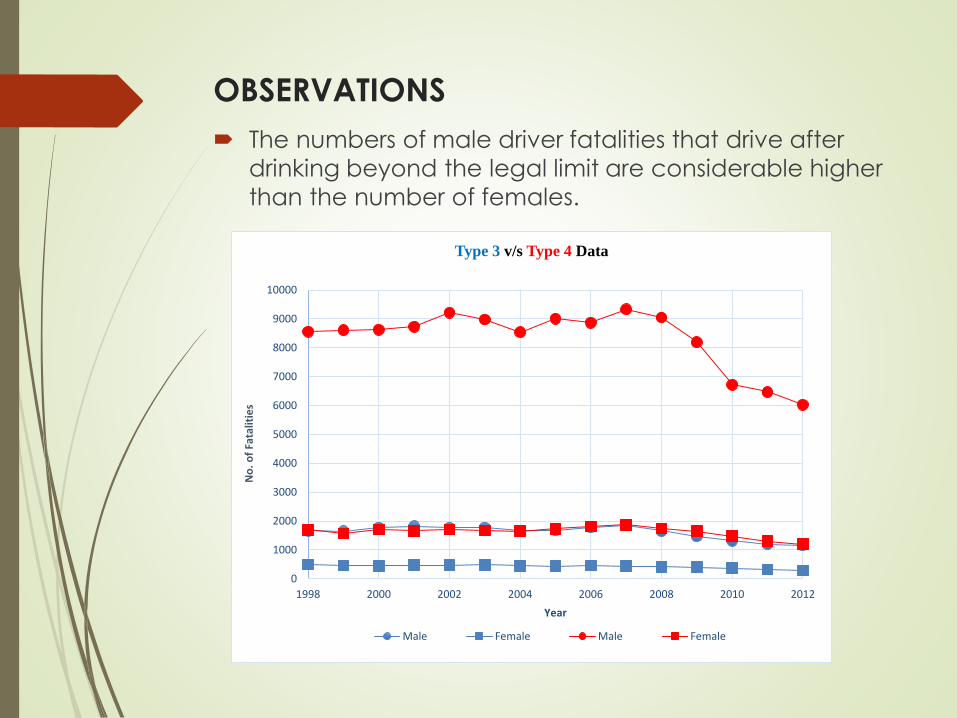
OBSERVATIONS
The numbers of male driver fatalities that drive after
drinking beyond the legal limit are considerable higher
than the number of females.
0
1000
2000
3000
4000
5000
6000
7000
8000
9000
10000
1998 2000 2002 2004 2006 2008 2010 2012
No
. o
f Fa
talit
ies
Year
Type 3 v/s Type 4 Data
Male Female Male Female

OBSERVATIONS
With the increase in the blood alcohol concentration
the number of fatalities in both male and female
increases.
There has been a considerable decrease in the
number of male deaths after 2008
0
1000
2000
3000
4000
5000
6000
7000
8000
9000
10000
1998 2000 2002 2004 2006 2008 2010 2012
No
. o
f Fa
talit
ies
Year
Type 3 v/s Type 4 Data
Male Female Male Female
Factors responsible for this decrease
over the years
Enforcement of Zero Tolerance laws that establish
maximum legal BAC limit of .02 for those under 21
years of age while operating a motor vehicle
Laws that provide for administrative license revocation
or suspension prior to conviction for driving under the
influence
Laws that set the minimum legal drinking age to 21
Laws that define a blood alcohol concentration
above a specified threshold as sufficient evidence of
“driving under the influence”
CRASH TIME
Entire period of 24 hours was divided the into four sub-
segments:-
00:00 AM to 05:59 AM
06:00 AM to 11:59 AM
12:00 PM to 05:59 PM
06:00 PM to 11:59 PM
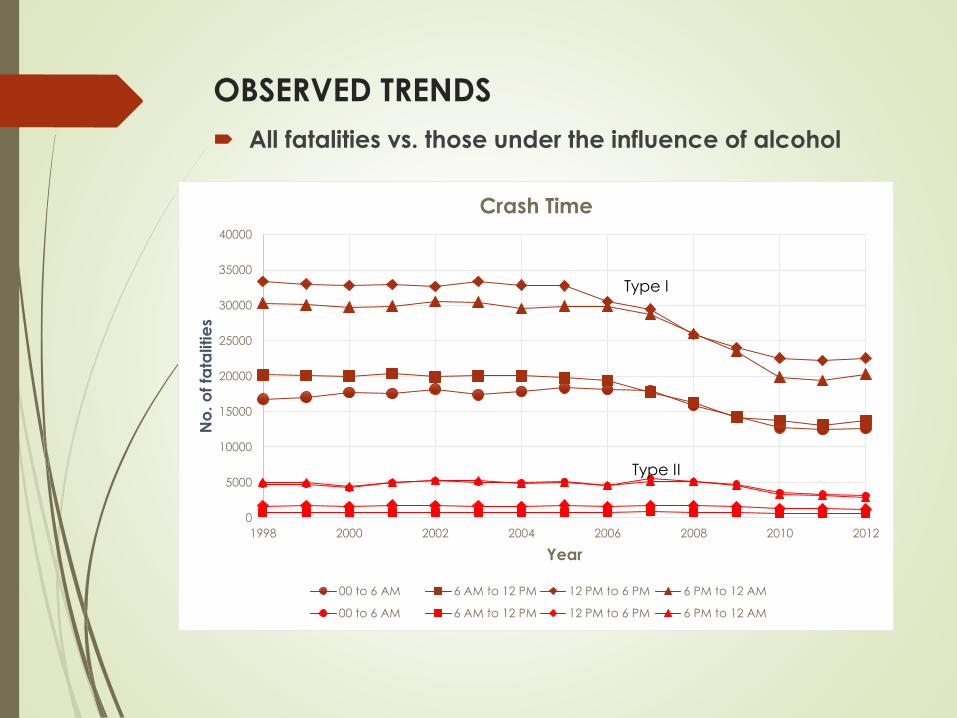
OBSERVED TRENDS
All fatalities vs. those under the influence of alcohol
0
5000
10000
15000
20000
25000
30000
35000
40000
1998 2000 2002 2004 2006 2008 2010 2012
No
. o
f fa
talitie
s
Year
Crash Time
00 to 6 AM 6 AM to 12 PM 12 PM to 6 PM 6 PM to 12 AM
00 to 6 AM 6 AM to 12 PM 12 PM to 6 PM 6 PM to 12 AM
Type II
Type I
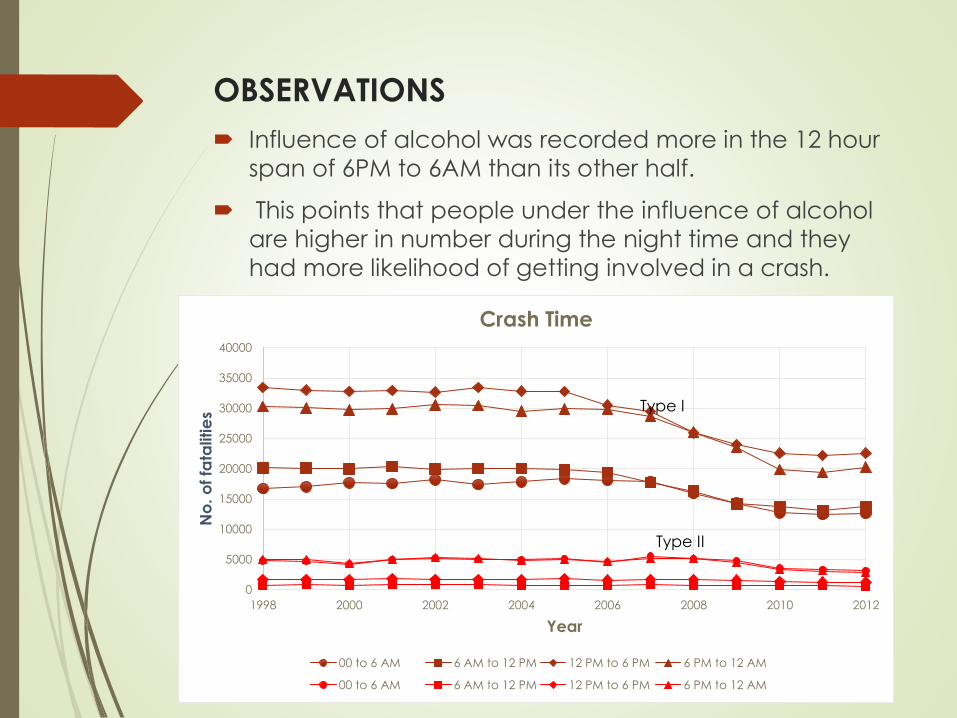
OBSERVATIONS
Influence of alcohol was recorded more in the 12 hour
span of 6PM to 6AM than its other half.
This points that people under the influence of alcohol
are higher in number during the night time and they
had more likelihood of getting involved in a crash.
0
5000
10000
15000
20000
25000
30000
35000
40000
1998 2000 2002 2004 2006 2008 2010 2012
No
. o
f fa
talitie
s
Year
Crash Time
00 to 6 AM 6 AM to 12 PM 12 PM to 6 PM 6 PM to 12 AM
00 to 6 AM 6 AM to 12 PM 12 PM to 6 PM 6 PM to 12 AM
Type I
Type II

OBSERVATIONS
General fatality trend points more deaths in the 12
hour span of 12PM to 12AM but the number of people
dying due to alcohol involvement are still higher in 6PM
to 6 AM span.
For a particular year say 2009, overall on an average
one alcohol-impaired-driving fatality has occurred
every 48 minutes. However, these fatalities did not
occur evenly throughout the day.
In 2009, from midnight to 3 a.m., two-thirds of fatal
crashes involved an alcohol-impaired driver which is
twice the overall average.
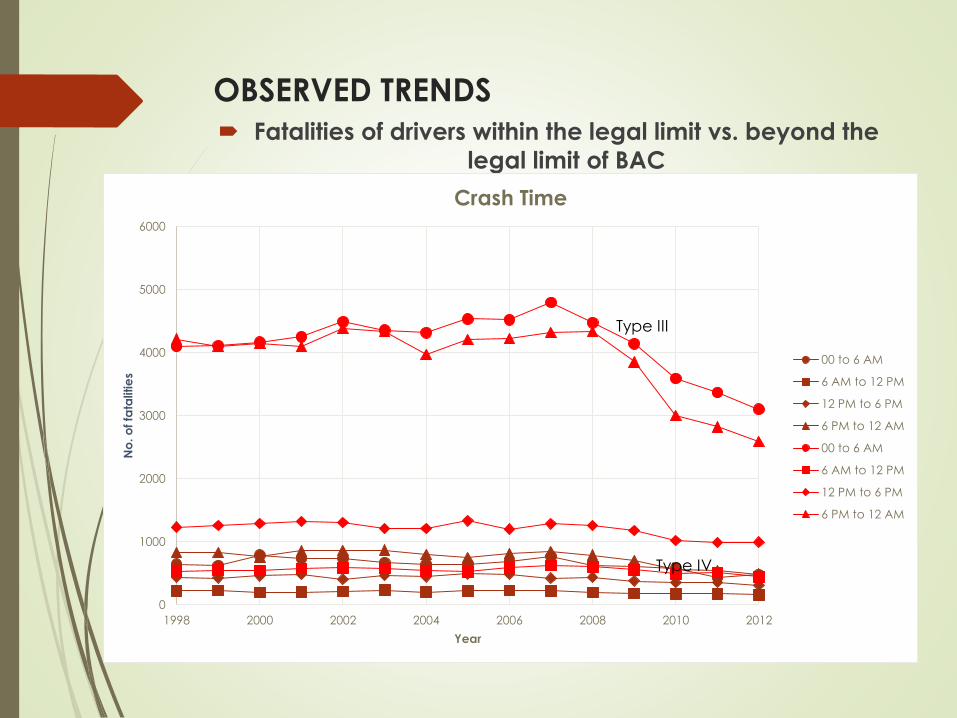
OBSERVED TRENDS
Fatalities of drivers within the legal limit vs. beyond the
legal limit of BAC
0
1000
2000
3000
4000
5000
6000
1998 2000 2002 2004 2006 2008 2010 2012
No
. o
f fa
talitie
s
Year
Crash Time
00 to 6 AM
6 AM to 12 PM
12 PM to 6 PM
6 PM to 12 AM
00 to 6 AM
6 AM to 12 PM
12 PM to 6 PM
6 PM to 12 AM
Type III
Type IV
OBSERVATIONS
Number of fatalities of people drunk within the legal
limit of BAC less than .08 were lesser and most of them
were observed in the time group 6 PM to 12 AM.
The percentage of alcohol-impaired drivers involved
in fatal crashes by time of day also remains consistent
from year to year.

OBSERVATIONS NHTSA (DOT HS 811 523)
“Time of Day and Demographic Perspective Of Fatal
Alcohol-Impaired-Driving Crashes”
This behaviour was consistent with our analysis for all the years.
RESTRAINT SYSTEM USED
Analysis under this category is carried out
considering the usage of Restraint System
Restraint System Used
Restraint System Not-Used
Restraint System Improperly Used
0
10000
20000
30000
40000
50000
60000
1998 2000 2002 2004 2006 2008 2010 2012
No
. o
f F
ata
litie
s
Year
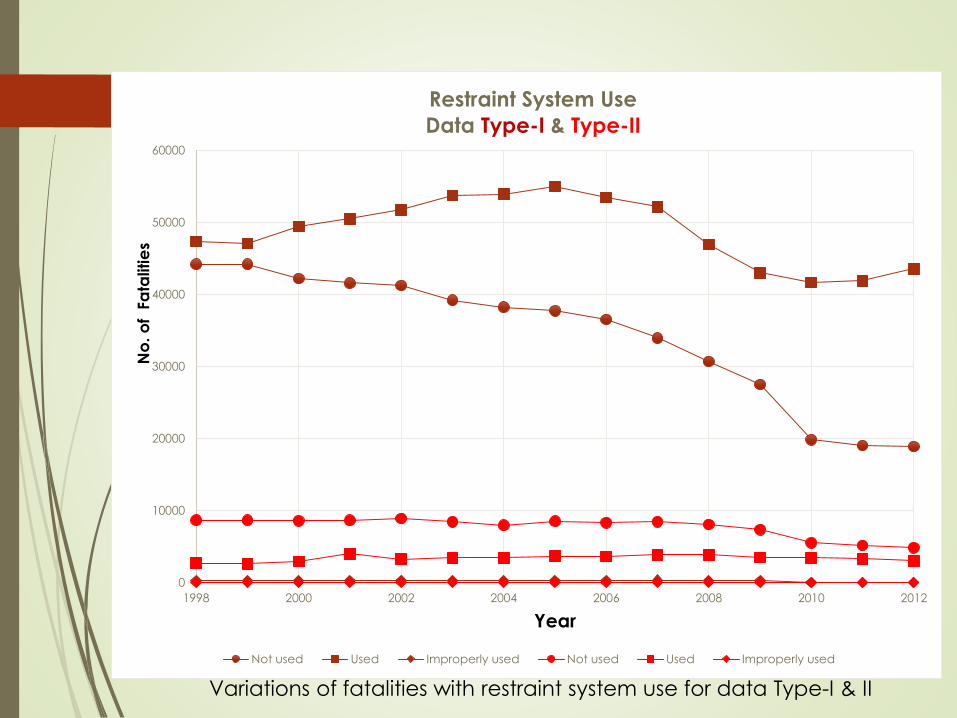
Restraint System Use
Data Type-I & Type-II
Not used Used Improperly used Not used Used Improperly used
Variations of fatalities with restraint system use for data Type-I & II
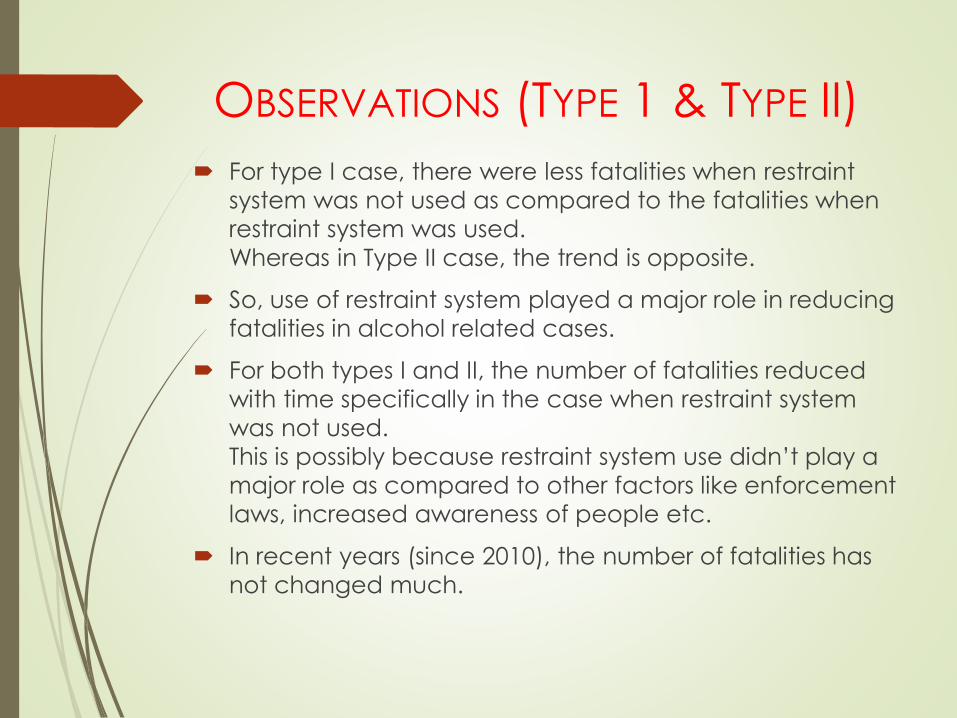
OBSERVATIONS (TYPE 1 & TYPE II)
For type I case, there were less fatalities when restraint
system was not used as compared to the fatalities when
restraint system was used.
Whereas in Type II case, the trend is opposite.
So, use of restraint system played a major role in reducing
fatalities in alcohol related cases.
For both types I and II, the number of fatalities reduced
with time specifically in the case when restraint system
was not used.
This is possibly because restraint system use didn’t play a
major role as compared to other factors like enforcement
laws, increased awareness of people etc.
In recent years (since 2010), the number of fatalities has
not changed much.
0
1000
2000
3000
4000
5000
6000
7000
8000
9000
1998 2000 2002 2004 2006 2008 2010 2012
Nu
mb
er
of fa
talitie
s
Year
Restraint System Use
Data Type-III & Type-IV
Not used Used Improperly used Not used Used Improperly Used
Type IV
Type III
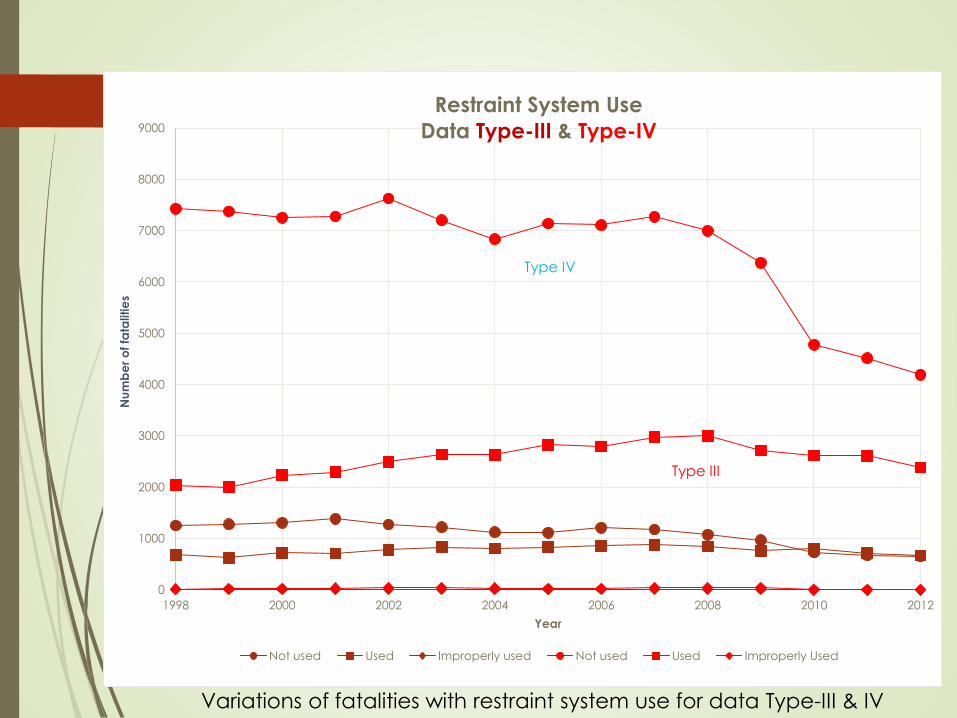
Variations of fatalities with restraint system use for data Type-III & IV
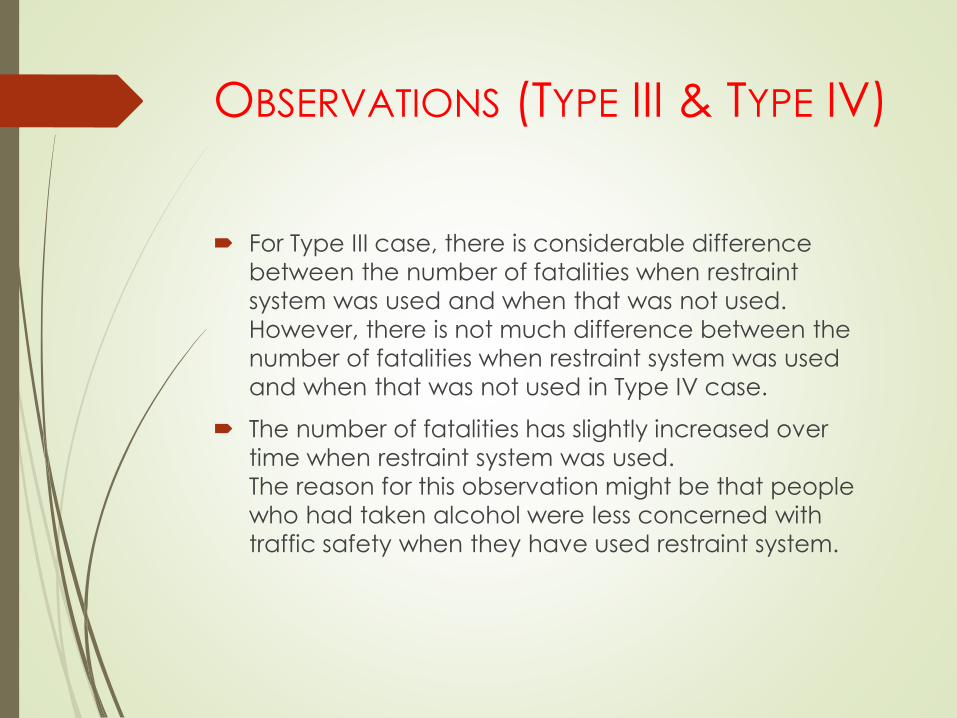
OBSERVATIONS (TYPE III & TYPE IV)
For Type III case, there is considerable difference
between the number of fatalities when restraint
system was used and when that was not used.
However, there is not much difference between the
number of fatalities when restraint system was used
and when that was not used in Type IV case.
The number of fatalities has slightly increased over
time when restraint system was used.
The reason for this observation might be that people
who had taken alcohol were less concerned with
traffic safety when they have used restraint system.

ROADWAY FUNCTION CLASS
For analysis in present study, this is divided into
following categories
Rural Interstate
Rural Others
Urban Interstate
Urban Others
0
1000
2000
3000
4000
5000
6000
7000
1998 2000 2002 2004 2006 2008 2010 2012
No
. o
f P
ers
on
s
Year
Roadway Function Class (Type III vs Type IV)
Rural Interstate
Others
Urban Interstate
Others
Rural Interstate
Others
Urban Interstate
Others
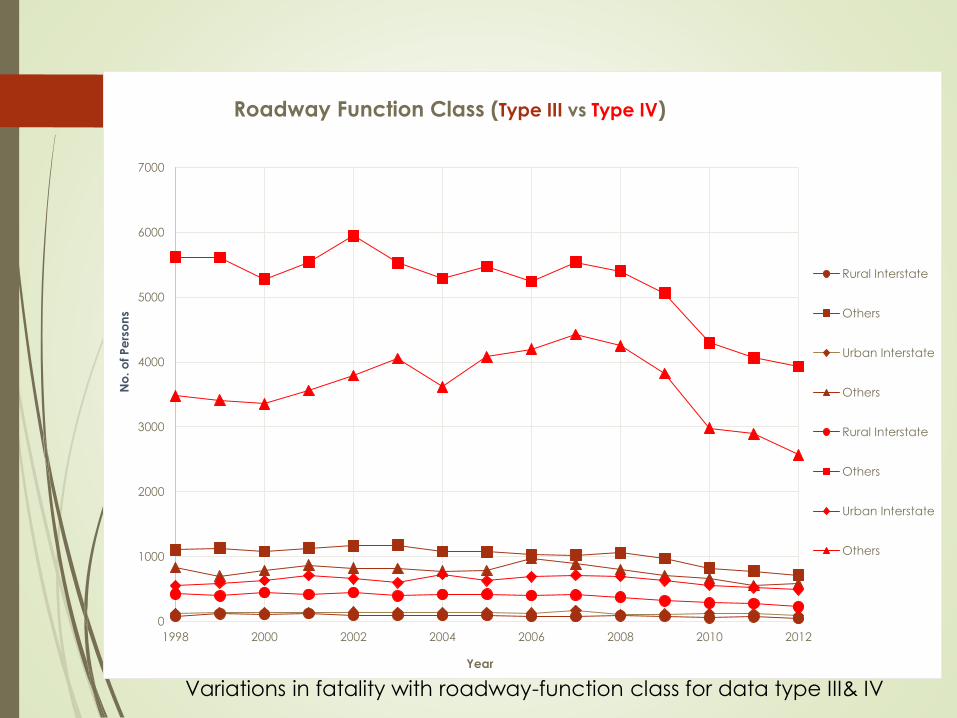
Variations in fatality with roadway-function class for data type III& IV

Observations
For both the cases Types III and IV, fatalities
on rural roadways were more than fatalities
on urban roadways.
Number of fatalities occurred on interstates
roadways was lesser than that in other
roadways due to better infrastructure and
traffic safety measures provided on
interstates road.
0
1000
2000
3000
4000
5000
6000
7000
8000
9000
1998 2000 2002 2004 2006 2008 2010 2012
No
. o
f Fa
talitie
s
Year
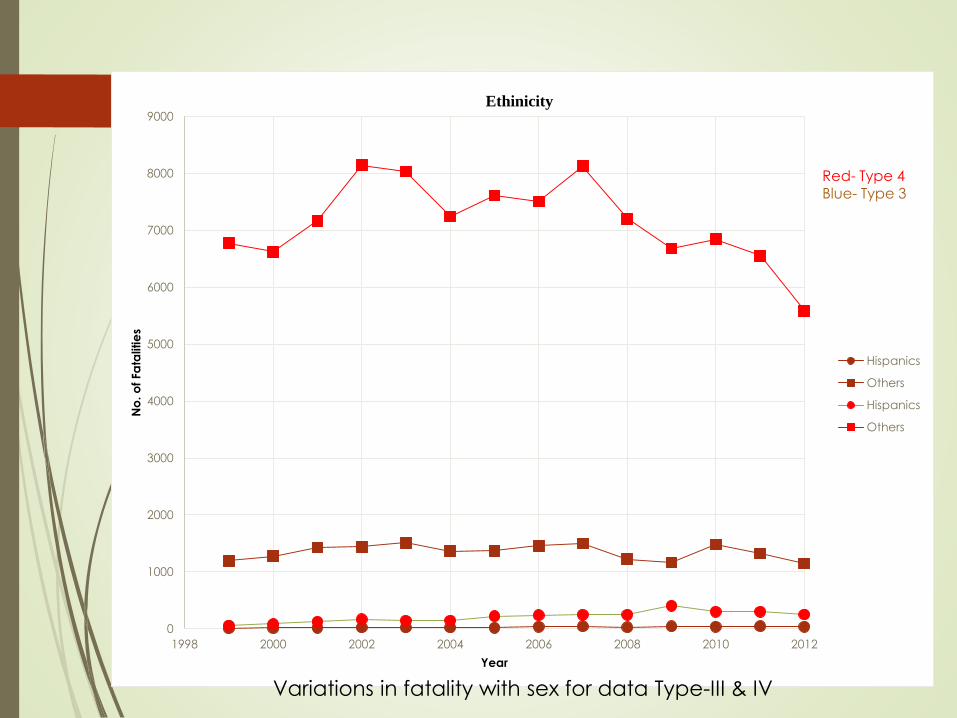
Ethinicity
Hispanics
Others
Hispanics
Others
Red- Type 4Blue- Type 3
Variations in fatality with sex for data Type-III & IV
Conclusions Sharp decrease in number of fatalities in all the
crashes and also those influenced with alcohol especially during the latest years from 2008
Male drivers continue to surpass women in the number of alcohol-involved fatal crashes and after enforcement of stricter laws a higher decrease is observed among the male gender especially after 2010
the number of fatalities with number of occupants one are very high in comparison to fatalities with number of occupants greater than one which indicates that people tend to drink above limit and drive when they are only occupants of vehicle
fatalities that were due to the influence of alcohol were recorded more in the night 12 hour span of 6PM to 6AM than its other half


