
FACTORS INFLUENCING THE IMPLEMENTATION OF THE KENYA OPEN DATA INITATIVE: A CASE OF NAIROBI COUNTY
BY
OYATSI N. CHRISTINE
A research project submitted in partial fulfilment of the requirements for the award of the degree of Masters of Arts in Project Planning and Management
2015

ii
DECLARATION
This project is my original work and has not been presented for any award in any other
university.
Signature…………………………………... Date…………………………………
Name: Oyatsi N. Christine
Registration number: L50/69167/2013
This project report has been submitted for examination with my approval as a University
Supervisor.
Signature…………………………………... Date…………………………………
Name: Prof. Harriet Kidombo
Department of Educational Studies
University of Nairobi

iii
DEDICATION
This project is dedicated to my late parents Pascal and Genevieve Oyatsi. Without you, life
has been different; at the same time your absence has been a motivation to achieve what you
wanted for me. I also cherish in making you proud.

iv
ACKNOWLEDGEMENT
I am indebted to my supervisor Professor Kidombo for the help and guidance she gave in the
course of writing this research project. I am also grateful to the board of post graduate studies
the University of Nairobi for giving me a chance to study at the university. I also wish to
extend my gratitude to all lecturers of the department of Extramural Studies who successfully
taught me coursework and other departmental staff who extended a hand of help whenever I
needed it.
I acknowledge the support of the National Commission for Science and Technology who
accorded me the permission to carry out research for this study. My sincere appreciation also
goes to all organizations and respondents who made the data collection procedure possible
and successful.
I am also indebted to my family: Eva, Charlo, Nang’ayo, Terry and Sarah for the moral,
financial and material support. Thanks Eva for helping in proof reading the study. I thank my
friend Lydia; your support was instrumental in seeing me come this far with the study. Above
all, I thank God for making me invincible and tenacious even when it seemed tough.

v
TABLE OF CONTENTS
DECLARATION ....................................................................................................................... ii
DEDICATION .......................................................................................................................... iii
ACKNOWLEDGEMENT ......................................................................................................... iv
TABLE OF CONTENTS ............................................................................................................v
LIST OF TABLES .................................................................................................................. viii
LIST OF FIGURES .................................................................................................................. ix
ABBREVIATIONS AND ACRONYMS .................................................................................... x
ABSTRACT .............................................................................................................................. xi
CHAPTER ONE: INTRODUCTION ......................................................................................1
1.1 Background to the study .......................................................................................................1
1.1.1 Open government data trends ..................................................................................3
1.1.2 Kenya Open Data Initiative .....................................................................................4
1.2 Statement of the problem ......................................................................................................6
1.3 Purpose of the study .............................................................................................................8
1.4 Objectives of the study .........................................................................................................8
1.5 Research questions ................................................................................................................8
1.6 Significance of the study ......................................................................................................8
1.7 Basic assumptions of the study .............................................................................................8
1.8 Limitations of the study ........................................................................................................9
1.9 Delimitations of the study .....................................................................................................9
1.10 Definition of significant terms used in the study .................................................................9
1.11 Organization of the study .................................................................................................. 10
CHAPTER TWO: LITERATURE REVIEW ........................................................................ 11
2.1 Introduction ......................................................................................................................... 11
2.2 Open data and open government .......................................................................................... 11
2.3 User awareness of open data and implementation of open data initiatives ............................ 16
2.4 Data quality and use of implementation of open data initiatives ........................................... 18
2.5 Legal framework implementation of open data initiatives .................................................... 21

vi
2.6 Theoretical framework ........................................................................................................ 23
2.6.1 Moving from closed to open systems .................................................................... 24
2.6.2 Reinforcing and transforming institutional structures ............................................ 25
2.7 Conceptual framework ........................................................................................................ 27
2.8 Explanation of the relationship between variables in the conceptual framework................... 27
2.9 Knowledge gap ................................................................................................................... 28
2.10 Summary of literature review ............................................................................................ 28
CHAPTER THREE: RESEARCH METHODOLOGY ........................................................ 30
3.1 Introduction ........................................................................................................................ 30
3.2 Research design .................................................................................................................. 30
3.3 Target population ............................................................................................................... 30
3.4 Sample size and sampling procedures ................................................................................. 31
3.4.1 Sample size ........................................................................................................... 31
3.4.2 Sampling procedure .............................................................................................. 31
3.5 Data collection instrument ................................................................................................... 32
3.5.1 Pilot testing of the instrument................................................................................ 32
3.5.2 Validity of the instrument ..................................................................................... 32
3.5.3 Reliability of the instrument .................................................................................. 32
3.6 Data collection procedures .................................................................................................. 33
3.7 Data analysis techniques ...................................................................................................... 33
3.8 Ethical considerations .......................................................................................................... 33
3.9 Operational definition of the variables ................................................................................. 34
CHAPTER FOUR: DATA ANALYSIS, PRESENTATION AND INTERPRETATION .... 36
4.1 Introduction ......................................................................................................................... 36
4.2 Questionnaire return rate ..................................................................................................... 36
4.3 Demographic characteristics of the respondents ................................................................... 36
4.4 User awareness of open data and implementation of the KODI ............................................ 38
4.5 Data quality and use and implementation of the KODI ........................................................ 45
4.6 Legal framework and implementation of the KODI ............................................................. 46

vii
4.7 Implementation of the KODI ............................................................................................... 47
4.8 Hypothesis testing ............................................................................................................... 49
CHAPTER FIVE: SUMMARY OF FINDINGS, DISCUSSION, CONCLUSIONS AND RECOMMENDATIONS ........................................................................................................ 51
5.1 Introduction ......................................................................................................................... 51
5.2 Summary of findings ........................................................................................................... 51
5.3 Discussion ........................................................................................................................... 52
5.4 Conclusions ......................................................................................................................... 55
5.5 Recommendations ............................................................................................................... 55
5.6 Suggestions for further research.......................................................................................... 56
REFERENCES ....................................................................................................................... .57
APPENDIX ONE: Questionnaire ........................................................................................... 62
APPENDIX TWO: Letter of introduction ............................................................................. 66
APPENDIX THREE: Research authorization letter ............................................................. 67
APPENDIX FOUR: Research permit .................................................................................... 68

viii
LIST OF TABLES
Table 2.1: Knowledge gap ......................................................................................................... 28
Table 3.1: Target Population ..................................................................................................... 31
Table 3.2: Operational definition of the variables ...................................................................... 34
Table 4.1: Questionnaire return rate .......................................................................................... 36
Table 4.2: Demographic characteristics of the respondents ........................................................ 36
Table 4.3: Familiarity with KODI ............................................................................................. 38
Table 4.4: Devices one is able to access .................................................................................... 38
Table 4.5: Devices one is able to use ......................................................................................... 39
Table 4.6: Criteria for understanding the mean score ................................................................. 40
Table 4.7: Internet access and use and access to government information .................................. 40
Table 4.8: Preferred way of accessing the internet ..................................................................... 40
Table 4.9: Source of government information ............................................................................ 41
Table 4.10: Information respondents are interested in ................................................................ 42
Table 4.11: Usage of KODI portal ............................................................................................. 45
Table 4.12: KODI data characteristics ....................................................................................... 45
Table 4.13: Legal framework .................................................................................................... 46
Table 4.14: Implementation of KODI on transparency............................................................... 47
Table 4.15: Implementation of KODI on collaboration .............................................................. 47
Table 4.16: Implementation of KODI on participation ............................................................... 48
Table 4.17: Summary of the overall implementation of KODI ................................................... 49
Table 4.18: Awareness of open data and the implementation of KODI ..................................... 49
Table 4.19: Open data use and the implementation of KODI ..................................................... 50
Table 4.20: Legal framework and the implementation of KODI ................................................ 50

ix
LIST OF FIGURES
Figure 1: KODI stakeholders ......................................................................................................6
Figure 2: Conceptual framework ............................................................................................... 27

x
ABBREVIATIONS AND ACRONYMS
CSV – Comma Separated Values
CSO – Civil Society Organization
FOI – Freedom of Information
ICT – Information and Communication Technologies
KNBS – Kenya National Bureau of Statistics
KODI – Kenya Open Data Initiative
NGO – Non Governmental Organization
OGD – Open Government Data
OGP – Open Government Partnership
PDF – Portable Document Format
PS – Permanent Secretary
UN – United Nations
XML – Extensible Markup Language

xi
ABSTRACT
The purpose of this study was to investigate the factors that influence the implementation of the Kenya Open Data Initiative in Nairobi County. The objectives were: to establish the influence of user awareness of open data on the implementation of the KODI; to determine the influence of data use on the implementation of the KODI and to determine the influence of FOI legislation on the implementation of the KODI. The research design that was applied in this study was the descriptive survey design. The study targeted KODI stakeholders’: government institutions, private sector organizations, civil society organizations and citizens within Nairobi County which had a population of 200 people and used a sample of 132 respondents. The researcher used questionnaires as the main instrument for this study. A pilot study was carried out in organizations not involved in the actual study. A test-retest technique was used to test the reliability of the questionnaires using Pearson’s product moment correlation. The researcher obtained a correlation coefficient of 0.89 and concluded that the research instrument was reliable. Validity was determined by pre-testing the questionnaires on a small sample of respondents not involved in the actual study, responses were assessed and then poorly prepared items were reviewed. The data was analyzed using descriptive statistics, Mann Whitney u-test and Kruskal Wallis test. The findings indicated that there was low awareness about the open data initiative in Kenya. It also revealed that the usage of the portal is very minimal and that awareness about the initiative does not necessarily translate in usage of the portal. The findings also indicated that the respondents agree that opening up government information will result in an open government that fosters transparency, collaboration and participation between government and citizens. The study found out that there is a significant relationship between user awareness of open data and the implementation of the KODI. It also found out that there is a significant relationship between open data use and the implementation of the KODI. There is also a significant relationship between FOI legislation and the implementation of the KODI. The findings of the research may be a benchmark for policy makers and implementers in torching the avenues of the improvement of the KODI. Recommendations to the KODI include: it should enhance support for civic education on open data, its availability and use; it should enhance collaborations and partnerships between stakeholders within the open data ecosystem; user awareness of open data does not necessarily translate to using the open data portal. Thus, the users should not only be told why they need the data but should also be shown why they need the data through actionable user experience. This will enhance their chances of using the portal; and while noted it did not hinder the setup of KODI, the enactment of an access to information law is needed to provide a policy framework for data provision and use, and safeguard the initiative.

1
CHAPTER ONE
INTRODUCTION
1.1 Background to the study
Wonderlich (2010) notes that in October 2007, 30 open government advocates met in
Sebastopol, California to discuss how government could open up electronically-stored
government data for public use. Up until that point, the federal and state governments had
made some data available to the public, usually inconsistently and incompletely, which had
whetted the advocates' appetites for more and better data. He states that the conference, led
by Carl Malamud and Tim O'Reilly and funded by a grant from the Sunlight Foundation,
resulted in eight principles that, if implemented, would empower the public's use of
government-held data.
These principles were summarized by Tauberer (2014) as, data must be complete: all public
data are made available. Data are electronically stored information or recordings, including
but not limited to documents, databases, transcripts, and audio/visual recordings. Public data
are data that are not subject to valid privacy, security or privilege limitations, as governed by
other statutes. Data must be primary: data are published as collected at the source, with the
finest possible level of granularity, not in aggregate or modified forms. Data must be timely:
data are made available as quickly as necessary to preserve the value of the data. Data must
be accessible: data are available to the widest range of users for the widest range of purposes.
Data must be machine processable: data are reasonably structured to allow automated
processing of it. Access must be non-discriminatory: data are available to anyone, with no
requirement of registration. Data formats must be non-proprietary: data are available in a
format over which no entity has exclusive control. Data must be license-free: data are not
subject to any copyright, patent, trademark or trade secret regulation. Reasonable privacy,
security and privilege restrictions may be allowed as governed by other statutes.
These basic principles were then updated and re-phrased by the Sunlight Foundation in
August 2010 to now number ten principles, including the use of open standards, making data
permanent, and keeping usage costs to an absolute minimum. All of these are laudable points.
Each may or may not be provided in a fully open way by any given governmental entity
(Civic Dynamics, 2014). According to the Sunlight Foundation (2010), the list is not
exhaustive, and each principle exists along a continuum of openness. The principles are
completeness, primacy, timeliness, ease of physical and electronic access, machine

2
readability, non-discrimination, use of commonly owned standards, licensing, permanence
and usage costs.
Open government data began to truly take off in 2009. This was the year of the first two
Transparency Camp conferences run by the Sunlight Foundation, numerous apps developed
outside of government, and a new interest in open government from inside of government
(Tauberer, 2014). He further notes that the Open Government Data movement was also
spurred by policy changes in 2009. President Obama’s Open Government Directive
(December 8, 2009) re-framed the world-wide movement. This was so, in part, because it
presented a definition of “open government” which many found appealing. The three
principles of transparency, participation, and collaboration form the cornerstone of an open
government.
While transparency was a core component of open government from the beginning of the
open government movement in the 1950s, participation and collaboration were relatively new
and certainly untested. Each of those three parts of the definition of open government was to
be backed up by a new White House technology project. Data.gov, a dataset catalog, and an
information technology spending dashboard were launched early that year as new efforts to
promote transparency. Davies (2012), notes that the current open data movements draws
upon diverse roots, it really burst on to the policy scene in 2009, when US President Barack
Obama signed a Memorandum on Transparency and Open Government as one of his first acts
in office, leading to the creation of the data.gov platform hosting hundreds of federal datasets
for public access.
The White House’s interest in transparency was soon replaced by an interest in using open
data to spur economic activity; Data.gov spurred a world-wide movement of data.gov-style
catalogs in cities and countries throughout the world (Tauberer, 2014). This US move was
quickly followed by the UK launching data.gov.uk in early 2010 and starting a programme of
open data reforms across government that continued and were expanded under a new
administration from mid-2010 onwards. In April 2010, the World Bank launched its own data
portal, providing free access to hundreds of economic and social indicators. The Open
Government Partnership, launched in 2011, is a multi-government effort to advance parallel
transparency reforms in participating countries, focusing on disclosure, citizen participation,
integrity, and technology (Tauberer, 2014).

3
1.1.1 Open government data trends
Open data has been transforming how government does business. Over the past five years
ranging from national governments such as the United States and the United Kingdom to
hundreds of local governments and municipalities and all forms of government in between –
a veritable revolution in opening up data to the public has been underway. The open data in
government (OGD) movement has spawned an entirely new cottage industry in open data
advocacy and tools. Literally hundreds of government organizations are committed to open
data, supported by an ecosystem of advocacy, technology and consulting groups (Civic
Dynamics, 2014).
With experience and practice, we are beginning to see a generational shift in how open data is
being handled by governments. The first generation, still mostly the current practice, was
built around the idea of just making the data public and open. This current generation of open
data is characterized by the publishing of datasets via catalogs. The datasets are static,
unconnected and dumb. Mostly, too, the data within those datasets are poorly described and
documented, often lacking standard metadata. What is now exciting, however, is the
emergence of what can best be called dynamic open data (Civic Dynamics, 2014). According
to Tauberer (2014), actors in the private sector in the United States and abroad are stepping
up to empower the public through not merely online access to government publications but
through a digital transformation of government data into completely new tools.
In order to embrace and utilize dynamic open data, Civic Dynamics (2014) states that there is
need to expose the underlying data dynamically, such that users may request and filter and
correlate what they need and only what they need. Thus, there are five principles or
dimensions by which we need to judge next-generation dynamic open data. Data should be
connected: because we are now collecting by datum and not dataset, connections between
relevant things must be made explicit across relevant datasets. Similar things should be
retrievable together. To achieve this aim, some schema or data definition framework must be
layered over the data and datasets. Data should be documented: in order for these dynamic
selections to be achievable, the data in the system must be fully documented, specifically
including the full description and units used for attributes and values and the scope of entities
and concepts. Only through such complete documentation can accurate connections and
relevant selections per above be made. Data should be expandable: since new data and new
instances and new datasets will constantly arise, the design of the overall data management
system must itself be "open", enabling expansion of the available data store at acceptable cost

4
and effort. Data should be filterable: data should be selectable by type (class), attribute or
value such that only the data of interest is exposed to the user. This means the data should be
structured in some way with facets that can be used dynamically to filter and make those
selections. Data should be atomic: data should be exposed as individual entities or concepts
with their attributes and values. The unit of manipulation thus becomes the datum, rather than
the dataset (Civic Dynamics, 2014).
1.1.2 Kenya Open Data Initiative
In July 2011, with World Bank support, Kenya also launched an open data portal
(opendata.go.ke), becoming the first developing country to have a national government open
data platform (Davies, 2012). President Mwai Kibaki launched the Kenya Open Data
Initiative, making key government data freely available to the public through a single online
portal. The 2009 census, national and regional expenditure, and information on key public
services were some of the first datasets to be released. The website is a user-friendly platform
that allows for visualizations and downloads of the data and easy access for software
developers. Indeed, tools and applications have already been built to take this data and make
it more useful than it originally was (KODI, n.d.).
The successful launch of KODI in 2011 was after several failed attempts before. Political will
is a key driver in incentivizing open data initiatives. In Kenya, government institutions are
charged with collecting and storing data that relates to their mandates. Unfortunately, due to
policies and ingrained practices of the colonial and early Kenyan governments, most of this
information was ‘siloed’ within the respective institution and was rarely shared, even with
other government institutions. Corrupt networks in public institutions benefited greatly from
this culture of monopolizing access to information, and used this power to advance their
personal interest, usually at the expense of the citizens. Access to this information was
extremely difficult and in some cases impossible. These corrupt networks put up a spirited
fight against any and all attempts to release data that would have made them accountable
(Majeed, 2012; Schwegmann, 2013; Kwamboka, 2013; Mutuku & Mahihu, 2014).
These efforts were continuously met with resistance mostly due to vested interests, up until
Dr. Bitange Ndemo’s appointment as the PS (Permanent Secretary) of the Ministry of
Information and Communications Technologies. His role was vital in promoting an open data
ecosystem as he spearheaded the initiative to avail data in an open platform. He and a
volunteer task force made up of computer programmers, data experts and World Bank
officials, worked together to launch Kenya’s first successful open data platform in July of

5
2011 (Majeed 2012). The KODI initiative was not the first attempt at releasing government-
held data though. Ndemo, who joined the then President Kibaki’s government in 2005, was
able to successfully map distributions of Constituency Development Funds (CDF) and by
doing this, exposed the unfair allocation of funds. The initiative ran into intense political
resistance from Members of Parliament as it exposed the allocation of funds to vote rich areas
at the expense of deserving marginalized areas. In order to protect their interests, politicians
lobbied to the minister at that time and the initiative was eventually terminated. In 2010, due
to pressure from the private sector (businesses and the technology community), the ICT board
launched a government website that also aimed to equip the public with crucial government
held data (Mutuku & Mahihu, 2014).
However, the board had no access to information leading to lack of content on the site, and
before the year ended, the site was taken down. The failure of these early attempts were
attributed to lack of well established relationships with the various ministries and institutions
that held this data, as well as lack of political will (Majeed 2012, Kwamboka 2013). At this
time, pressure to increase transparency from different sectors, more notably the civil society,
was piling up. In 2011, Mzalendo, a civil society initiative that aimed to increase public
participation, advocated for release of financial data to allow citizen scrutiny of the
management of public resources. This provided a great opportunity for the development of an
open data initiative. Ndemo and the then Minister of Information and communication, Mutahi
Kagwe, had a good working relationship and were fortunate to have the president’s ear. Buy-
in from the very top of political power created a favorable environment to persuade
government institutions to release their data, allowing for launch of the Kenya Open Data
Initiative (Majeed 2012). Unfortunately, the momentum built during this time wore off as the
political landscape changed. The shift from a centralized system of government to devolved
units (in response to schedules stipulated in the constitution promulgated in 2010)
significantly changed the roles of national government officials especially those working in
ministries whose functions were to be devolved to county governments. The transition period
into a devolved government system which is still taking effect today brings with it many
challenges, and sometimes hinders effective adoption of open data (Mutuku & Mahihu,
2014).
Kenya is the first developing country to have an open government data portal, the first in sub-
Saharan Africa and second on the continent after Morocco. The initiative has been widely
acclaimed globally as one of the most significant steps Kenya has made to improve

6
governance and implement the new Constitution’s provisions on access to information. As of
November 2011, there are close to 390 datasets that have been uploaded to the site, with a
plan currently in place to upload more data over the next year. There have been over 17,000
page views and over 2,500 dataset downloaded and embedded to various websites and
portals. There are now over a hundred requests from the public for new datasets, and there is
a clear demand for more data to be made available (KODI, n.d.).
Kenya's information is a national asset, and this site is about sharing it. The goal of
opendata.go.ke is to make core government development, demographic, statistical and
expenditure data available in a useful digital format for researchers, policymakers, ICT
developers and the general public (KODI, n.d.).
Figure 1: KODI stakeholders
1.2 Statement of the problem
The availability of open data has grown significantly, with pressure being placed on all kinds
of public organizations to release their raw data. Some main motivations are that open access
to publicly funded data provides greater returns from the public investment, can generate
wealth through the downstream use of outputs, provides policy-makers with data needed to
address complex problems (Arzberger, Schroeder, Beaulieu, Bowker, Casey & Laaksonen,
2004) and can help to involve the citizenry in analyzing large quantities of data sets
(Surowiecki, 2004). The Kenya Open Data initiative was launched in July 2011. Kenya was a
pioneer in launching such an initiative with the main objective of making key government

7
data freely available to the public through a single online portal and helping in propagating
better governance through the implementation of the new constitution (Kwamboka, 2013;
Mutuku, Colaco & Omenya, 2013). Kenyan open data portal has been a catalyst for regional
activity on open data. Ghana, Rwanda, and Tunisia have all taken steps to open up
government data and the Kenyan Open Data Task Force has been contacted for guidance by
officials in Uganda, Tanzania, and Nigeria (Brown, 2013).
However, since the launch of the KODI in 2011, access to and utilization of open datasets by
the population has still remained low, despite availability on the main portal opendata.go.ke.
There have also been community applications built using this data available on the platform,
pulling data from the portal and presenting it in a more simplified way for use by the
population. Despite these initiatives, there has been little documented evidence of
consequential increase in use of open data from the platform or the resulting impact of these
initiatives and technologies on the way citizens engage with government information
(Mutuku & Mahihu, 2014). Brown (2013) also opines that Kenya’s open data portal is
floundering. He notes that despite the excitement that surrounded its launch, the portal has
not been updated regularly, has seen stagnant traffic, and is quickly losing its status as the
symbolic leader of open government in Africa. He further notes that for a number of reasons,
the portal has not lived up to the often sky-high expectations of many onlookers.
This claim is supported by the 2014 Global Open Data Index survey in which Kenya was
ranked 13 in Africa out of the 20 countries in the continent that took part in the survey (Open
Knowledge Foundation [OKF], n.d.). The Global Open Data Index measures and benchmarks
the openness of data around the world by looking at ten key datasets in each place. These
include: national election results; company register; national map (low resolution: 1:250,000
or better); government spending – high level of spending by sector; detailed transactional
level government Budget data; legislation – laws and statutes; national statistical office data;
national postcode/ZIP database; public transport timetables and pollutant emissions data.
Open Knowledge's recent publication of the 2014 Open Data Index shows slow progress by
governments in opening up key data. Overall, the level of open is down to 11% from 15% in
2013 (Hare, 2014). Overall, Kenya was ranked 85 out of the 97 countries surveyed in 2014
with an open index of 22%. In 2013 it was ranked 59 out of the 60 countries surveyed with an
open index of 20% (Open Knowledge Foundation [OKF], n.d.). This study sought to
establish the reasons for the dismal performance and declining status of the KODI as a leader
of open government in Africa despite being a pioneer. The study investigated the factors that

8
are influencing the implementation of the KODI.
1.3 Purpose of the study
The purpose of this study was to investigate the factors that influence the implementation of
the Kenya Open Data Initiative in Nairobi County.
1.4 Objectives of the study
This study strove to achieve the following objectives:
i) To establish the influence of user awareness of open data on the implementation
of the KODI.
ii) To determine the influence of data use on the implementation of the KODI.
iii) To determine the influence of FOI legislation on the implementation of the KODI.
1.5 Research questions
i) How does user awareness of open data influence the implementation of the
KODI?
ii) How does data use influence the implementation of the KODI?
iii) What is the influence of FOI legislation on the implementation of the KODI?
1.6 Research hypotheses
i) There is a significant relationship between user awareness of open data and the
implementation of KODI.
ii) There is a significant relationship between data usage and the implementation of
KODI.
iii) There is a significant relationship between FOI legislation and the implementation
of KODI.
1.7 Significance of the study
The findings of the study highlighted factors which influence the implementation of the
KODI in Nairobi County. This has contributed to the body of knowledge in the fairly new
area of open government data in Kenya. It also suggests further areas of research for other
researchers.
This study may be useful to the Ministry of ICT, KODI, Kenya ICT board and KNBS. This is
because its findings have provided statistical data which will highlight the current state of the

9
KODI in terms of factors influencing its implementation hence impacting its role in
promoting an open government. This will enable them to come up with strategies to curb
factors that are negatively influencing the implementation of the KODI.
The study may also have played a role in creating awareness and shedding further light about
the KODI especially to those respondents who were not familiar with the project.
1.8 Basic assumptions of the study
The study was based on the assumptions that: the respondents provided truthful information
when filling out the questionnaires and gave 100% effort; the views of those who were
interviewed represented the opinions of the target population and that through participation in
the study, the respondents were able to understand the concept of open data and open
government and their role through participation and collaboration.
1.9 Limitations of the study
Open government and open data is a fairly new concept in its infancy stages thus very few
related studies have been carried out about the KODI.
Due to the small sample that was used in the study, only views from a small percentage of
stakeholders: citizens, civil society, government and private sector were highlighted in the
study and were not generalized to apply to the whole country.
1.10 Delimitations of the study
The study confined itself to respondents aged eighteen years and above drawn from Nairobi
County, Kenya. Time and financial constraints on the researcher’s part did not allow for a
broader coverage. Since very little research has been done about factors influencing the
implementation of the KODI, the review was basically drawn within and outside Kenya. The
study limited itself to 3 factors that are influencing the implementation of the KODI namely:
user awareness of open data, data use and FOI legislation.
1.11 Definition of significant of terms used in the study
Data use – refers to utilization of data on the KODI portal.
Implementation of KODI – refers to the successful operation of the open data initiative.
FOI legislation – refers to laws governing the distribution and freedom of information.

10
Open government – consists of transparency, participation and collaboration of the state
towards third actors like the economy or the citizenship.
Open data – non-privacy-restricted and non-confidential data which is produced with public
money and is made available without any restrictions on its usage or distribution.
User awareness of open data – refers to the user’s familiarity with the concept of open data.
1.12 Organization of the study
The study was organized into five chapters. Chapter one dealt with the general introduction,
background to the study, statement of the problem, purpose of the study, research objectives,
questions, limitations and delimitations, definition of significant terms and organization of
the study. Chapter two highlighted the review of literature while chapter three dealt with the
research design and methodology. Research findings and discussion were presented in
chapter four and chapter five handled summary of the study, discussion, conclusions,
recommendations and suggestions for further research.

11
CHAPTER TWO
LITERATURE REVIEW
2.1 Introduction
This chapter deals with review of related literature under the following sub-headings:
introduction, open data and open government, user awareness of open data and
implementation of open data initiatives, data use and implementation of open data initiatives
and FOI legislation and implementation of open data initiatives. This chapter also covers the
theoretical framework, conceptual framework, explanation of relationships between variables
in the conceptual framework, gaps in the reviewed literature and summary of reviewed
literature.
2.2 Open data and open government
Open data and open government have recently risen on the international agenda. Many
countries are moving towards availing public data on online portals in a bid to foster open
governments. The Kenya Open Data Initiative is driven both by an interest in innovation and
government modernization and by an interest in determining whether government is
delivering services effectively and accountably (Weinstein & Goldstein, 2012). However,
several studies have found that the Kenya open data portal is failing (Brown, 2013;
Kapchanga, 2013; Hargreaves, 2013 & Mugai, 2014). Open data and open government are
two terms that are often linked to each other. Although the terms are often used together, they
can exist independent of each other. Open Government Data website (n.d.) defines open data
as data that is produced or commissioned by government or government controlled entities
and can be used, reused and redistributed by anyone. Open data mends the traditional
separation between public organizations and users. The opening of data leads to two
important assumptions about government. First, it assumes the readiness of public agencies
for an opening process which considers influences, discourses and exchanges as constructive
and welcomes opposing views and inputs. Second, it assumes that government is to give up
control, at least to some extent demanding considerable transformations of the public sector
(Janssen, Charalabidis & Zuiderwijk, 2012). The Open Knowledge Foundation (2012)
outlines the following as the areas where open data is creating value: transparency and
democratic control, participation, self-empowerment, improved or new private products and
services, innovation, improved efficiency of government services, improved effectiveness of

12
government services, impact measurement of policies and new knowledge from combined
data sources and patterns in large data volumes. Open Government Data website (n.d.)
outlines three main reasons why government data should be open. To start with, is
transparency. In a well-functioning, democratic society, citizens need to know what their
government is doing. To do that, they must be able to freely access government data and
information and to share that information with other citizens. Transparency isn’t just about
access, it is also about sharing and reuse – often, to understand material it needs to be
analyzed and visualized and this requires that the material be open so that it can be freely
used and reused. Second, is releasing social and commercial value. In a digital age, data is a
key resource for social and commercial activities. Everything from finding your local post
office to building a search engine requires access to data, much of which is created or held by
government. By opening up data, government can help drive the creation of innovative
business and services that deliver social and commercial value. Lastly, is participatory
governance. Much of the time citizens are only able to engage with their own governance
sporadically – maybe just at an election every 4 or 5 years. By opening up data, citizens are
enabled to be much more directly informed and involved in decision-making. This is more
than transparency: it’s about making a full “read/write” society, not just about knowing what
is happening in the process of governance but being able to contribute to it.
Open government on the other hand is said to be a government with high levels of
transparency and mechanisms for public scrutiny and oversight in place, with an emphasis on
government accountability. Transparency is considered the traditional hallmark of an open
government, meaning that the public should have access to government-held information and
be informed of government proceedings. In recent years, however, the definition of open
government has expanded to include expectations for increased citizen participation &
collaboration in government proceedings through the use of modern, open technologies
(Chernoff, n.d.). She further states that the 2009 US Open Government Directive identifies
transparency, participation, and collaboration as the key principles of an open government.
Noveck (2011) defines open government as an innovative strategy for changing how
government works. By using network technology to connect the public to government and to
one another informed by open data, an open government asks for help in solving problems.
The end result is more effective institutions and more robust democracy. Heller (2012) notes
that open government combines three elements: information transparency: that the public
understands the workings of their government including freedom of information initiatives;

13
open data and Big [Public] Data efforts, including open data portals; procurement, budget,
and policy transparency like voting records, meeting minutes, political finance transparency;
public engagement: that the public can influence the workings of their government by
engaging in governmental policy processes and service delivery programs (including e-
government services; open311 and service delivery feedback loops; stakeholder and
participatory processes like participatory budgeting, town hall meetings, both online and
offline; electoral processes); and accountability: that the public can hold the government to
account for its policy and service delivery performance (including anti-corruption
mechanisms such as auditing, ombudsmen; conflicts of interest and influence peddling
safeguards). GovLab (2013) argues that defining what open government means is
complicated by the range of definitions, meanings and motivations that exist – with new ones
still emerging. However, they point out that the definitions may focus to varying degrees on
the key elements of transparency, citizen participation and collaboration, among others,
depending on the context.
According to Janssen et al. (2012), open data should result in open government in which the
government acts as an open system and interacts with its environment. Weinstein &
Goldstein (2012) opine that open data is a precursor to open government. It can be argued
that most open data initiatives are geared towards achieving an open government. In the
recent past, open data and open government have been put under the same roof, with open
data seen as a means to achieve open government. However, Robinson and Yu argue that
bringing open data and open government under a single banner, leads to conceptual muddling
that ultimately impedes progress for both projects. A central element of their argument is the
notion that while governments may increasingly deliver open data, such initiatives are not
necessarily conducive to achieving accountability goals. They argue that open government
used to refer to politically sensitive disclosures of government information, used in the 1950s
in the debates leading up to passage of the Freedom of Information Act. But over the last few
years, that traditional meaning has blurred, and has shifted toward government data released
openly through technology. Recent public policies have stretched the label open government
to reach any public sector use of these technologies. Thus, the term open government data
might refer to data that makes the government as a whole more open (that is, more publicly
accountable), or instead might refer to politically neutral public sector disclosures that are
easy to reuse, even if they have nothing to do with public accountability. They argue that
today, a regime can call itself “open” if it builds the right kind of website – even if it does not

14
become more accountable or transparent. This shift in vocabulary makes it harder for
policymakers and activists to articulate clear priorities and make cogent demands. Given the
ambiguity of the term open government data, they argue, public sector actors may project a
veneer of openness by publishing data that has little or nothing to do with accountability.
They mention that in October 2010, president Obama addressing the UN General assembly
stated that “In all parts of the world, we see the promise of innovation to make government
more open and accountable. And now, we must build on that progress. And when we gather
back here [in 2011], we should bring specific commitments to promote transparency; to fight
corruption; to energize civic engagement; and to leverage new technologies so that we
strengthen the foundation of freedom in our own countries, while living up to ideals that can
light the world.” They state that following up on this idea, the U.S. State Department
organized a series of meetings leading to what became the multilateral Open Government
Partnership (OGP). They claim that the multilateral initiative, instigated by the United States,
has dramatically accelerated the spread of these ideas over the past years. They further
contend that the ambiguity of open government remains alive and well in the international
sphere. They also state that to some ears, the idea of open government data has also
developed a more threatening cast. Wikileaks, first launched in 2008, has created what some
call “involuntary transparency,” reshaping the conversation over leaks of secret government
information to the press.
Heller (2011) echoes the views of Robinson and Yu. He points out that the obvious
explanation for why open data gets so much attention in the context of open government is
that it is the sexiest, flashiest reform of the bunch. He opines that it’s much cooler and frankly
less politically controversial for any government to put government health databases online
than it is for the same government to provide greater transparency around the financing of
political parties in the country. He notes that there was a concern shared amongst some OGP
parties that open data provides an easy way out for some governments to avoid the much
harder and likely more transformative, open government reforms that should probably be
higher up on their lists. Instead of fetishizing open data portals for the sake of having open
data portals, he’d rather see governments incorporating open data as a way to address more
fundamental structural challenges around extractives (through maps and budget data), the
political process (through real-time disclosure of campaign contributions), or budget
priorities (through online publication of budget line-items). He also questions whether the
time, expenses, and political capital devoted to building the KODI portal were really the best

15
uses of resources. According to him, Kenya has a range of governance and open government
challenges that go far beyond the lack of a website where citizens (many of whom are not
online) can chart government datasets.
In response to Robinson and Yu's, 'The new ambiguity to open government', Weinstein and
Goldstein (2012) drawing on their experiences with the Kenya Open Data Initiative and the
Open Government Partnership argue that bringing open data and open government under a
single banner, does not lead to conceptual muddling. They express forth three arguments:
first, they maintain that a commitment to open data involves reorienting the production of
information in a public bureaucracy in ways that have the potential to institutionalize a
commitment to openness. Second, they note that an open data campaign can accelerate
demand for information and generate a public conversation about what kind of data matter for
accountability. Finally, they note that the two movements may be stronger together. The open
data movement helps open government advocates focus on the end user’s needs and the
possibilities of new technologies, while open government campaigners challenge open data
advocates to focus on how transparency and technology can be leveraged for civic
accountability. They say that while it is too early to tell how these movements will play out,
they believe that bringing these movements under the same big tent, coherently aligning their
strategies, goals, and priorities, might ultimately be helpful for citizens interested in
promoting openness in their own countries. They conclude that conceptual clarity about the
distinct meanings of open data and open government will benefit everyone. But the power of
a close partnership between these two movements is also becoming evident. The big tent is
strengthening both movements and creating opportunities for progress in places where
traditional reforms have stalled or failed to fulfil their promises. While clarity about distinct
goals and policies is welcome, separation risks setting back an emerging, more unified
movement that is bringing technology and innovation to the age-old task of making
government work for people.
Also in response to Robinson and Yu, Piexoto (2013) contends that the authors ignore the
enabling conditions under which transparency may lead to accountability, notably the
publicity and political agency conditions. The publicity condition is the extent to which
disclosed information actually reaches and resonates with its intended audiences while the
political agency condition refers to mechanisms through which citizens can sanction or
reward public officials. He states that the authors disregard the possibility that even when
publishing adaptable data that could promote public accountability (as advocated in their

16
essay), actual accountability still might be far from being achieved. He further argues that
Robinson and Yu also overlook the role of participatory mechanisms as an essential element
in unlocking the potential for open data to produce better government decisions and policies.
He maintains that it is the combination of (publicized) transparency and institutions that
promote governmental responsiveness and empower citizens to partake in public decision
making that leads to substantive accountability. He sums it up by stating that the nature of the
data is as relevant as the context in which this data is disclosed. He argues that in the absence
of a free press, open data stands little chance of entering the public arena to foster
accountability. In a similar vein, he argues that in the absence of an environment that enables
citizens to hold rulers accountable, express preferences, and influence policy, little can be
achieved.
2.3 User awareness of open data and implementation of open data initiatives
Open data is a great phenomenon that if fully tapped into will revolutionize the way citizens
and their governments relate with each other. It will open up an avenue for collaboration,
participation and foster transparency in government. The benefits of open data will only be
realized once stakeholders: citizens, CSOs, private sector, government and developers are
familiar with the concept of open data and put it to use. Although KODI was lauded
internationally, it seems to be operating in obscurity in the host nation. Weinsten and
Goldstein (2012); Mutuku and Mahihu (2014) note that despite the efforts to avail
government datasets openly through KODI, utilization of data from the portal was not as
widespread instantly as expected. Therefore, a fellowship and outreach initiative,
Code4Kenya was conceptualized. This initiative in the form of a preincubator was launched
and run from July to November 2012 in a bid to test a model that could potentially increase
uptake of government datasets by creating technology based applications, services and
platforms. Code4Kenya was also created to accelerate the awareness and ability of the public
to make sense of data and to promote engagement around critical public issues. Kapchanga
(2013) reports that Jesuit Hakimani: a research body says that most Kenyans do not know of
the open data government portal. As a result, they have not used it. According to Muigai
(2014), the ICT board had an active communications office through which information about
the platform and the initiative was disseminated, and carried out activities aimed to grow
awareness of the portal within different parts of the ecosystem (academia, technology, media,
etc) and engage with communities. Despite this engagement, however, as Mutuku and
Mahihu’s study found, few people were aware of the initiative. Kwamboka (2014) cites lack

17
of an informed and motivated citizenry as one of the challenges facing the KODI. She
maintains that citizens, globally, are generally less informed or motivated to demand for their
right to access information. She claims that someone would argue that the average Kenyan is
more concerned about matters of food, education, health, rent and livelihood to care about as
opposed to their right to have access to information. She suggests that there needs to be a
complete overhaul to this notion by synthesizing this data and translating it to reflect the
matters that directly affect the citizens to create its demand. In a study carried out by the
Global Open Data Initiative [GODI] (n.d.) in 23 countries, many respondents claimed that
while a majority of government employees knew nothing or very little about open data, the
specific individuals working on technology and open government are more familiar with the
concept. As expected, knowledge of open data is typically isolated within relevant
departments and branches of government.
Muigai (2014) opines that open data has been ‘siloed’ as a technology conversation and this
could be contributing to its low awareness. She states that open data is much more than
building an open data portal, releasing data and building apps. She suggests that in pursuit of
a more transparent, accountable and effective government, the conversations that surround
open data go beyond just the technology itself. By fostering inclusion by bringing in together
stakeholders and formulating solid legal, policy and institutional frameworks will prove to be
the way forward in strengthening the open data movement. Similarly, Hammer (2013) states
that while the “opening” has generated excitement from development experts, donors, several
government champions, and the increasingly mighty geek community, the hard reality is that
much of the public has been left behind, or tacked on as an afterthought. He poses the
question: ‘So how can we support “data-literacy” across the full spectrum of users, including
media, NGOs, labor unions, professional associations, religious groups, universities, and the
public at large? He suggests working more with journalists and civic groups. He says Knight
Fellow Justin Arenstein calls these folks “mass mobilizers” of information and O’Reilly
Media’s Alex Howard points to these groups in particular because they can help demystify
data, to make it understandable by populations and not just statisticians. Pak (2014) shares the
sentiments of Hammer and Muigai by agreeing that regular people don't know what “open
data” means. He notes that actually, they probably don't care what we call it and don't know if
they need it. He states that Apple’s Steve Jobs said that a lot of times, people don't know
what they want until you show it to them. He suggests that we need to stop telling them they
need it and start showing them why they need it, through actionable user experience. He

18
further states that part of the reasons people don't embrace concepts such as open data is
because it is part of a lingo that has nothing to do with them. No empathy is involved. He
instead suggests that we start talking about people's right to know and use the data generated
by governments for instance as Tim O'Reilly puts it: "Government as a Platform for
Greatness," with examples we can relate to, instead of dead PDF's and dirty databases.
OKF (2012) suggests that if you open up a bunch of datasets, it’s definitely worth spending a
bit of time to make sure that people know (or at least can find out) that you’ve done so. In
addition to things like press releases, announcements on your website, and so on, you may
consider: contacting prominent organizations or individuals who work/are interested in this
area, contacting relevant mailing lists or social networking groups and directly contacting
prospective users who you know may be interested in this data. Also, GovDelivery (2015)
notes that it’s clear that open data is a powerful tool in the public sector. It connects citizens
with government data, enabling developers to build innovative apps, all while promoting
transparency. But there’s one catch. Open data unlocks its power when audiences actually
know about it and use it! Similarly GODI, (n.d.) notes that governments have a lot to gain
from making data openly available, which makes it even more important for the global
community working to open data to communicate more effectively with elected officials.
This also suggests that government-wide outreach and education will be a necessary step
forward for the global open data community. Kapchanga reports that because of the low
awareness about the KODI, Kenyans may fail to realize the potential returns of this initiative.
Therefore, it is imperative that the government through the ministry of ICT scales up its
efforts to promote KODI to the public.
2.4 Data use and implementation of open data initiatives
The government is compared to an oyster that automatically closes up when approached.
Managers and other public servants often have the tendency to avoid opening their data, as
this would provide the public with new insights which might in turn result in critical
questions (Janssen et al., 2012). However, data: its quality and use is crucial in the success of
open data initiatives.
Robinson and Yu (2012) observe that the internet’s power to make government information
more available and useful has, in the last several years, become a topic of keen interest for
citizens, scholars, and policymakers alike. This has acted as a catalyst for a data revolution in
governments around the world. Capgemini, (2013); Jurisch and Kautz and Wolf and

19
Kremar (2015) state that government agencies worldwide have embarked on initiatives of
open government for making their data and related information available to the public.
Today, governments rely on ICT to support the processes connected to opening up their data
as well as involving the public in democratic processes. Government data is now made
accessible online and in machine-readable formats through the use of ICT where businesses
as well as citizens can access and re- use these data to create innovative value-added products
and services (Robison, Yu, Zeller & Felten, 2009; Janssen, 2011; Robinson & Yu, 2012 &
Palka, Jurisch, Leicht, Wolf & Krcmar, 2013)..
Many governments are striving to release more datasets but the question is whether the data
is comprehensible and meaningful to the users. According to Dawes (2010), open
government initiatives received critique for being too often just one-dimensional, for their
lack of usability, weak application of stewardship principles, lack of improvement
mechanisms and providing inadequate meta-data. Hammer (2013) states that in the last two
years, central and local governments and multilateral organizations around the world have
opened a range of data – information on budgets, infrastructure, health, sanitation, education,
and more online, for free. The data are not perfect, but then perfection is not the goal. Rather,
the goal is for this data to become actionable intelligence: a launch pad for investigation,
analysis, triangulation, and improved decision making at all levels.
Kwamboka (2014) also shares the view that data provided has to be meaningful. She asserts
that a truly successful data revolution means not only that the people have access to data but
that this data can be turned into information that can be used to improve the quality of life of
the people by helping them make more informed decisions and for their leaders to be able to
make better resource allocation decisions and that these efforts will most importantly lower
poverty levels. Citizens that can use data to improve their lives are more likely to move to a
next step that is being able to hold their governments accountable to improve transparency,
resource allocation and governance, particularly in developing and emerging markets. She
however states that not all potential data users have the ability to understand what data
means. She suggests that there needs to be an interpretation mechanism that turns data into
information that is more relevant and applicable to the everyday user, within their context and
ability. She opines that when citizens are left with the responsibility of understanding data
that is released and made available to them in its raw format, the most common reaction is to
repel the data. If they cannot relate to the data as it is, they will have no interest in demanding
for more or using the existing data.

20
Data in itself is of no value if it does not serve any purpose; hence it has to be used. This is
supported by Janssen et al. (2012) who maintain that open data on its own has little intrinsic
value; the value is created by its use. Supporting use should not be viewed as secondary to
publicizing data. The publicizing of data needs to be accompanied by an infrastructure which
is able to handle the data in an easy-to-use way to lower the user threshold. They further state
that too often governments only publish vast amounts of their data without actively involving
the public for feedback to improve their own government action and processes. Not
surprisingly, the use and participation of users is frequently low. Carter and Bélanger (2005)
claim that existing open government initiatives often lack adequate incentives or provide no
added value for users to make further use of them. However, the success and acceptance of
open government initiatives are contingent upon the public’s willingness to use and further
exploit these data sets. Sharing the same views are Weinstein and Goldstein (2012) who state
that governments worldwide engage in open government initiatives for making their data and
related information available to the public. But the success of open government is contingent
upon the public’s willingness to use and exploit these data sets. Open Data Barometer [ODB]
(2015) suggests that in order to increase the availability of open data and amplify the power
of citizens to use this data effectively, enhance the ability of government, civil society and
entrepreneurs to understand and use data effectively. Resources dedicated to building the
capacity of data users both inside and outside the government are critical to maintaining a
supply-demand data balance and an increase in this understanding and ability can be
accomplished through trainings and adapting open data tools to local needs.
The government of Kenya availed public data via the KODI portal. Majeed (2012) reports
that a year after the launch, it was noted by the former PS for the ministry of ICT that
software developers, the media and the public had not used the open data portal as widely as
they had anticipated. The ICT board reported that as of June 2012, it had no data on
commitments from civil society groups or even government ministries to use data from the
site. While new activity was triggered from the catalytic effect of the government rolling out
open data portals in other departments such as the Ministry of Health, it didn’t take long for
domestic disillusion to be realized. The primary audience targeted by the initiative
(particularly journalists and software developers) did not consume the data in the way that
was originally anticipated, and most felt that high value data remained elusive (Muigai,
2014). Following the claims, it can be argued that the use of data on the KODI platform has
been dismal and the quality of data is questionable.

21
2.5 FOI legislation and implementation of open data initiatives
The World Bank (2013) provides a readiness assessment framework for a country that wants
to come up with an open data initiative. Among the requirements is a legal framework. It
states that open government data programs often face resistance both from bureaucratic
forces within government with a culture of secrecy, and by actors inside and outside
government who have benefited from privileged access to data. Strong, sustained, political
leadership is therefore important in overcoming resistance and giving cover to political and
other risks from opening up government information. Open government data programs
should wherever possible work within and leverage existing legal codes and policies,
especially in the start-up phase. This greatly reduces the legal/policy impediments and lead
times, means that the initiative can work with relevant policy experts and that any
policy/legal changes needed for steady-state sustainability can be based on practical
experience. Conversely, it is important to identify at an early stage actual or perceived
“blockers” in order that policy or legal change can be initiated early if essential.
Under former President Daniel arap Moi (1978–2002), the government restricted the free
flow of information and clamped tight restrictions on Kenya’s few private radio and
television networks. In addition to stifling the media, the Moi government also barred civil
servants from sharing data outside the government. Tight restrictions on information sharing
permeated the government. Civil servants in ministries and departments had a silo mentality
and closely guarded all kinds of information. The Official Secrets Act, a holdover from
Kenya’s colonial era, gave the government the ostensible authority to withhold data. With
more than 300 members, the Kenyan chapter of the International Commission of Jurists had
campaigned for a Freedom of Information Act since 2000 and had circulated drafts in 2005,
2007 and 2011, but the act remained stuck in Parliament in 2012 (Majeed, 2012).
As of the launch of KODI in 2011, Kenya did not have a Freedom of Information (FOI) act
but still went ahead to launch the initiative becoming the first in Sub-Saharan Africa. Majeed
(2012) quotes one of the volunteer task force members of the KODI, “It would be nice to
have a more systematic approach; have a policy; then create the structures; then the rest,” he
said. “But my experience is that things often do not work that way. You have to be
opportunistic (p. 18).” He further quotes Ndemo: former PS for the ministry of ICT and a
champion of open data who said, “In government, you seize the moment and the opportunity
when you get it. How do you do it? You do the end first, and then you can put the rest in
place later. You simply must deal with the why you need something, then think about [the]

22
how later (p. 18).” He states that instead of waiting for the passage of the Freedom of
Information Act, which had languished in Parliament for more than a decade, Ndemo decided
to anchor his open data initiative to the 2010 constitution, which called for the government to
“publish and publicize any important information affecting the nation.”
At a roundtable meeting to enrich KODI and on behalf of CSOs and other stakeholders, Ntale
and Adieno (2012) note that the FOI bill 2012 and the Data Protection bill 2012 are both
presented in line with Article 35 of the constitution and Articles 31 (c) and (d) of the
constitution respectively. In particular, the FOI bill aims to: give effect to the right of access
to information by citizens as provided under article 35 of the constitution; require public
entities and private bodies to proactively disclose information they hold and to provide
information on request in line with the constitution; to create a framework to facilitate access
to information held by private bodies in compliance with any rights protected by the
constitution and any other law; to promote routine and systematic disclosure by public
service and private service on constitutional principles relating to accountability,
transparency and public participation and access to information; provide for the protection of
persons who release information for public interest in good faith and provide a framework to
facilitate public education on the right to access this information under this Act.
Openness is not just about governments putting meaningful government data out in the public
domain, but also about making the public meaningfully engage with governments through
use of open government data. This requires policies that will require the observance of open
government data standards and a capacity building process to ensure that the public, to whom
the data is intended, are aware and able to use the data in ensuring more transparent and
accountable governance (Canares, Guia, Narca & Arawiran, 2014). Also ODB (2015) states
that implementing the requirement to disclose and regularly update open data in law or policy
as part of a wider right to information ensures that data is available, open and accurate. At the
same time, governments must work to ensure that strong privacy protections are in place and
respected. It opines that high-level political commitment is key in achieving this. Similarly,
Development Initiatives (2014) notes that the presence of a legal framework is a key cog in
the open data ecosystem, facilitating provision of data and information to the public. Ubaldi
(2013) notes that having a consistent legal framework in place is critical to facilitate
government data accessibility and re-use, and to improve secure data sharing between public
authorities and the wider community to improve insights, results, impact and inform better
policy making.

23
Kwamboka (2013) cites lack of complete legislation as one of the challenges facing the
KODI. She points out that Article 35 of the Kenyan Constitution states that every Kenyan
citizen has a right to information but the process of getting that information is still long,
painful and costly. This, she says is because the FOI bill is not law and there is nothing that
binds any civil servant to freely and actively provide information. Muigai (2014) also points
out the same, a phenomenon she calls the 'data hugging syndrome'. She states that on the
supply side of the open data spectrum, getting data released from publishers is almost like
pulling teeth. In the absence of clear policy, the initiative has been starved of its critical
supply of data by the culture of data hugging. This goes to show that legislation is a great
impediment to fully implementing open data and open government. Despite this set back, the
initiative still lives on and open data champions are pushing for agenda. Weinsten and
Goldstein maintain that while Parliament waits to debate Kenya’s Freedom of Information
Bill, an effort to codify transparency in law, early adopters across the bureaucracy are already
taking steps to leverage open data in ways that matter to citizens. Without a legal framework
in place, it was found that efforts to setup KODI were largely attributed to an open data
“champion” in government, who intensely lobbied for support from the executive to birth the
initiative (Development Initiatives, 2014; Ntale, Mugambe, Sabiti & Nganwa, 2014). Brown
(2013) notes that before, during and after the 2013 elections, little attention was paid to the
open data platform and the excitement seen around its launch quickly faded. The current
president, Uhuru Kenyatta, has however, shown some interest in opening up government,
reigniting hope in the revival of the initiative. The current government through their Jubilee
party manifesto, pledged to increase transparency in government as well as promote
information sharing within public institutions (Mutuku & Mahihu, 2014). Citizens have
expectations for an effective government as the president promised to digitize government,
by cleaning up and managing databases that will be stored in a secure and centralized
location and which can be accessed and used by all ministries and branches of government in
order to make government more efficient” (Jubilee Coalition, 2012, p.41). It is evident that
one of the keys to successful implementation of KODI is legislation. Thus, the ball is in the
courts of the government to see to it that there is the political will to push for the FOI bill to
be law.
2.6 Theoretical framework
This study was guided by the system and institutional theories. Systems theory is the
transdisciplinary study of the abstract organization of phenomena, independent of their

24
substance, type, or spatial or temporal scale of existence. It investigates both the principles
common to all complex entities, and the (usually mathematical) models which can be used to
describe them. Systems theory was proposed in the 1940's by the biologist Ludwig von
Bertalanffy (General Systems Theory, 1968), and furthered by Ross Ashby (Introduction to
Cybernetics, 1956). von Bertalanffy was both reacting against reductionism and attempting to
revive the unity of science. He emphasized that real systems are open to, and interact with,
their environments, and that they can acquire qualitatively new properties through
emergence, resulting in continual evolution. Rather than reducing an entity e.g. the human
body to the properties of its parts or elements e.g. organs or cells, systems theory focuses on
the arrangement of and relations between the parts which connect them into a whole. This
particular organization determines a system, which is independent of the concrete substance
of the elements e.g. particles, cells, transistors, people, etc. Thus, the same concepts and
principles of organization underlie the different disciplines physics, biology, technology,
sociology, etc., providing a basis for their unification. Systems concepts include: system-
environment boundary, input, output, process, state, hierarchy, goal-directedness, and
information. By opening data, a move from a traditionally closed to open systems is made.
Systems theory states that these will impact the governance and feedback loops in which the
government can learn from the public.
2.6.1 Moving from closed to open systems
By publicizing data, a new situation is created in which the public can use and create
information through collaborative networking (Chun, Shulman, Sandoval, & Hovy, 2010).
The public is outside the organizational boundaries and outside the control of the hierarchy.
In fact the public becomes part of the data processing system and might process data, enrich
data, combine it with other sources and might even collect their own data for example
through the use of their mobile phones. This resembles a change in the traditional boundaries
between public organizations and the public in which virtually anybody in the world has
access to the data. The traditional system boundaries are vanishing and the system is opened.
Systems theory draws attention to the important distinction between systems which are open
to their environment and those which are closed (Jackson, 2003). Closed systems are much
easier to manage, as they are not affected by external factors which are often unpredictable in
nature. Central planning and control can be used, as there is less disruption from the
environment. In contrast, the flow in open systems cannot be predefined but only guided. The
opening of a system is often heralded for bringing in additional views, which has a positive
25
impact on its problem solving capacity (Surowiecki, 2004); and the opening of data for its use
in ways that are not considered or anticipated in advance (Arzberger et al., 2004).
The notion of feedback is important in open systems and refers to the situation in which
activity within a system is the result of the influence of one element on another (Jackson,
2003). The implication of the notion of feedback in systems theory is that in opening their
data, governments should not simply instigate one-way communication of their data but
should expect or actively solicit feedback and be able to make sense of this feedback. The
opening of systems provides the opportunity for creating feedback loops in which the
government can learn from the public. By embedding hermeneutics, the closed system is
placed in the social context. The consequence is that the social context will also influence the
(formerly) closed system. This implies that the relationship between a government and its
environment is subject to change and that the government needs to accept that traditional
planning and control instruments are no longer suitable. Opening a system typically requires
a shift from mechanistic control to an evolutionary perspective which is dominated by self
organization. New governance mechanisms, capabilities and processes are necessary for
dealing with these feedback loops. The nature of the response depends on the available
organizational arrangements that make a response possible (Jackson, 2003; Janssen et al.,
2012).
Institutional theory, on the other hand, attends to the deeper and more resilient aspects of
social structure. It considers the processes by which structures, including schemas; rules,
norms, and routines, become established as authoritative guidelines for social behaviour. It
inquires into how these elements are created, diffused, adopted, and adapted over space and
time; and how they fall into decline and disuse (Richard, 2004). Institutional theory is used to
predict that the opening of data will reinforce existing structures instead of changing them
and transformation is needed to take advantage of open data.
2.6.2 Reinforcing and transforming institutional structures
Institutional theory analyzes the deeper and more resilient aspects of social structure by
considering the processes by which structures become established. Institutional environments
reward normative requirements of appropriateness and legitimacy and, in some cases,
conformity to procedures, presentations, symbols and rhetoric (Scott, 1995). In institutional
theory, ICT is perceived, implemented and used in virtue of pre-existing institutional

26
arrangements (sociological, cultural, legal and formal aspects) that grant stability. Stability is
necessary for organizations to operate. Orlikowski (2000) argues that the development of
technology is heavily influenced by the actions (including decisions) of human agents, and
that technology enacts structures. This suggests that institutions might both enable and
constrain the adoption of open data. The outcomes stemming from the enactment of
technology are difficult to predict because of multiple and unanticipated effects influenced by
rational, social, and political logics (Orlikowski, 2000). Nevertheless, institutional theory
suggests that the introduction of IT does not often change institutions but rather reinforces
current work practices and organizational structures (Fountain, 2001; West, 2004; Kraemer &
King, 2006; Janssen et al., 2012).
In opening data to the public, public managers (and politicians) find themselves in the midst
of networks that might help them to reach advantages of open data at the expense of less
control. Institutional theory argues that in open systems different steering instruments are
required. Outside the boundaries of government, command and control mechanisms cannot
be used. Public managers find themselves confronted with having to deal with a variety of
stakeholders (possibly unknown) that might help them to achieve the benefits of open data
but might also be viewed as a threat if not properly handled. In open data the allocation of the
roles of provider, processor, owner and maintainer complicates accountability issues. Which
party is to blame when results of the processing of open data are incorrect? No one has an
overview of what is done with the open data, and even having such an overview might violate
the basic idea of open data. Whether the opening of data will unambiguously lead to a more
transparent, interactive, open and hence accountable government, it is challenged from this
perspective. Although the use of open data looks like collective accountability, it is likely that
if something happens, society will expect intervention from the government and will hold it
responsible (Janssen et al., 2012).

27
2.7 Conceptual framework
Independent variables Moderating variable
Dependent variable
Figure 2: Conceptual Framework
2.8 Explanation of the relationship between variables in the conceptual framework
Figure 2 shows the relationship between factors influencing the implementation of an open
data initiative. There are three independent variables namely: user awareness of open data,
data use and FOI legislation. Implementation of KODI is the independent variable. The
outcome of implementing an open data initiative is an open government. The level of
openness of a government is assessed using the indicators: transparency, collaboration and
participation. Implementation of the KODI is dependent on user awareness of open data, data
use and FOI legislation. Political support is the moderating variable.
Implementation of KODI Level of transparency Level of participation Level of collaboration
User awareness of open data Knowledge of KODI Technology literacy Source of government
information
FOI legislation Level of awareness of
constitutional right to information
Level of political will to promote FOI
Level of perceived outcome of enacting FOI
Data use KODI portal use Level of ease of data
reuse Level of data
availability Level of detail displayed
Political support

28
2.9 Knowledge gap
Table 2.1: Knowledge gaps
Variable Author and Year Findings Knowledge gap
User awareness of open data
Mutuku & Mahihu (2014)
Found that citizens access and use government data but know little about KODI.
This study used a descriptive survey design and a larger sample of 132 compared to 71. It concentrated on Nairobi County.
Data use Jansen et al. (2012), Capgemini (2013)
It identified data use as a barrier to the adoption of open data. Found that data portal usability is key for a government to realize the economic benefit of open data.
There was need to explore these findings in the context of the KODI.
FOI legislation Jansen et al. (2012) It identified legislation as a barrier to the adoption of open data.
This study focused on FOI legislation with regard to the KODI
2.10 Summary of literature review
This chapter has dealt with the factors that influence the implementation of an open data
initiative with emphasis on the KODI. Open data and open government have been fully
described. It has been noted that the two are distinct and can exist independently. However,
lately, with the rise of open data on the international agenda, open data and open government
have been placed under the same banner. Open data is viewed as a contributor to open
government. Many governments are working towards availing government data to the
citizens through online data portals. User awareness of open data has been discussed as one
of the factors that influences the implementation of an open data initiative. The benefits of
open data are unlocked once users become aware of it and use it. It has been noted by various
studies that little is known about KODI.
Data use is also highlighted as one of the factors that influences the implementation of an
open data initiative. It has been observed that governments are releasing datasets online to the
public. However, some researchers argue that in as much as it is important to release data, it
is also important to ensure that the data is in a form that is understandable and useful to the
29
users. In addition, some say that the type of data released to the public matters. They opine
that government should not only release data that improves service delivery but also that
which will promote political accountability. The use of data was also pointed out by many
researchers. They maintain that open data is of no value if it is not put to use. It was evident
that data use in the KODI portal was below expectations and the quality of data provided
questionable. Another factor that has been reviewed as one that influences the
implementation of an open data initiative is the FOI legislation. It has been noted that
legislation is key in implementing successful open data initiatives. However, Kenya remains
as one of the countries without a FOI act in place. The birth of KODI is credited to the new
constitutional dispensation which pushed for the right to information. Lack of a legal
framework continues to be an impediment to the KODI especially when it comes to getting
data from providers.
Lastly, knowledge gaps are cited. Mutuku & Mahihu (2014) found that citizens access and
use government data but know little about KODI. This study used a descriptive survey design
and a larger sample of 132 compared to 71. It concentrated on Nairobi County. A study by
Jansen et al. (2012) identified data use as a barrier to the adoption of open data while that by
Capgemini (2013) found that data portal usability is key for a government to realize the
economic benefit of open data. There was need to explore these findings in the context of the
KODI. Jansen et al. (2012) identified legislation as a barrier to the adoption of open data.
This study focused on FOI legislation with regard to the KODI.
30
CHAPTER THREE
RESEARCH METHODOLOGY
3.1 Introduction
This chapter discusses the main research methodology that was followed in carrying out the
study. The research design, sample size and sampling procedures, target population, research
instrument, validity and reliability of research instruments, data collection procedures, data
analysis, ethical considerations and operational definition of variables have been discussed in
this chapter.
3.2 Research Design
The study adopted a descriptive survey design. Orodho (2005) observes that descriptive
survey involves collecting information about people’s attitudes, opinions, habits or any
variety of social issues by interviewing or administering a questionnaire to a sample of
individuals. Kombo and Tromp (2006) point out that the major purpose of descriptive
research is the description of the state of affairs as it exists. They further stress that
descriptive studies are not only restricted to fact findings but may often result in the
formulation of important principles of knowledge and solutions to significant problems and
involve measurement, classification, analysis, comparison and interpretation of data. In this
study, the researcher carried out an in-depth investigation to determine the factors that
influence the implementation of the KODI in Nairobi County.
3.3 Target population
The study targeted KODI stakeholders namely: private sector organizations, civil society
organizations, government and citizens within Nairobi County. To ensure that the population
was representative, three private sector organizations in the banking and IT sector; two CSOs/
NGOs that are in partnership with the OGP; three government ministries and five
organizations drawn from learning institutions and the informal sector were chosen to
participate in the study.

31
Table 3.1: Target population
Sector Number of organizations expected to participate in the study
Expected population size from each sector
Private sector organizations 3 40 CSOs/ NGOs 2 15 Government ministries 3 45 Citizens 5 100
3.4 Sample size and sampling procedures
3.4.1 Sample size
The researcher used random sampling and to select the sample, Krejcie and Morgan (1970)
formula for determining the sample size was used.
The study used 95% confidence level, a standard deviation/ population proportion of 0.5, and
a margin of error (confidence interval) of +/- 5%.
푛 =푋 푁푃(1− 푃)
푀퐸 (푁 − 1) + 푋 푃(1− 푃)
Where:
n = Sample size
X2 = Chi-square for the specified confidence level at 1 degree of freedom
N = Population size
P = Population proportion
ME = Margin of error
=3.841 ∗ 200 ∗ 0.5(0.5)
0.05 (200− 1) + (3.841 ∗ 0.5(0.5)
= 132
132 respondents were needed for the study.
3.4.2 Sampling procedure
Stratified random sampling was used to select the sample for the study. First, the population
was divided into four different strata based on KODI stakeholders namely: private sector
organizations, civil society organizations, government and citizens. A random sample was
then drawn from each organization chosen to participate in the study. Each member in the
population was assigned a number. Using R statistical package, the researcher drew random
32
numbers from all the numbers assigned. The selected members participated in the study as
respondents.
3.5 Data collection instrument
The researcher used a questionnaire as the main research instrument. The research instrument
used an ordinal scale, nominal and open ended questions to collect and measure the variables
of the study. Part 1 of the questionnaire contained questions regarding the independent
variables: user awareness of open data, data quality and use and legal framework to be filled
in by the respondent while part 2 contained statements that were designed to indicate the
respondents’ opinion about the implementation of the KODI.
3.5.1 Pilot testing of the instrument
After being granted permission from relevant university and government authorities, a pilot
study was carried out among random respondents who were not involved in the actual study.
This was intended to check for ambiguity and poorly prepared items and eventually
reviewing them. The questionnaires were pre-tested on a selected small sample that was not
involved in the actual study and the procedures used in pre-testing them were identical to
those that were used during the actual study. Pre-testing questionnaires was important
because of the following reasons as described by Orodho (2005): unclear directions,
insufficient space to write response, clustered questions and wrong phrasing of questions
were detected; vague questions were revealed in the sense that respondents interpreted them
differently and this allowed the researcher to rephrase the questions until they conveyed the
same meaning to all subjects and this enhanced validity of the instrument and piloting
revealed if the anticipated analytical techniques were appropriate.
3.5.2 Validity of the instrument
The validity of the questionnaires was determined by pre-testing on a small sample of
respondents not involved in the actual study; responses were assessed, wrongly prepared
items were reviewed and ambiguous questions rephrased thus enhancing the validity.
3.5.3 Reliability of the instrument
Reliability refers to a measure degree to which a research instrument yields consistent results
or data after repeated trials (Mugenda & Mugenda, 1999). A test-retest technique was used to
test the reliability of the questionnaires using the following steps outlined by Orodho (2005):
the developed questionnaires were given to a few identical subjects who did not take part in
actual study; the answered questionnaires were scored manually; the same questionnaires
were administered to the same group of subjects after two weeks and the questionnaires

33
responses were scored manually and then a comparison made between answers obtained in
both cases. A Pearson product moment formula was used to compute a correlation co-
efficient to find out if the contents of the questionnaires were consistent in eliciting the same
response every time the instrument was administered. Orodho further points out that a
correlation co-efficient of about 0.8 is considered high enough to judge the instrument as
reliable for the study. The researcher obtained a correlation co-efficient of 0.89 and
concluded that the questionnaire was reliable.
3.6 Data collection procedures
A proper protocol was followed in the process of data collection. First, an approval for the
collection of data was obtained from the National Commission for Science, Technology and
Innovation in Kenya. Upon receiving the approval, the researcher visited private
organizations, civil society organizations, government offices and other organizations
selected to participate in the study. The researcher explained the purpose of the visit to the
administration and created a rapport with the officials as well the respondents. Thereafter, the
researcher administered the questionnaires and came to collect them after an agreed time
period.
3.7 Data analysis techniques
The following statistics were used in data analysis. Descriptive statistics was used in
presenting information collected from the study in order to describe the characteristics of
information of samples by using frequency, percentage, mean and standard deviation.
Inferential statistics by using Mann Whitney u-test and Kruskal Wallis test was used to
compare how user awareness of open data, data use and FOI legislation framework influence
the implementation of the KODI.
3.8 Ethical considerations
The researcher first obtained a research permit from the National Commission for Science,
Technology and Innovation before proceeding with the research. The researcher then wrote
an introductory letter to respondents which assured them that the research was purely for
academic purposes. The research process and procedures used were based on voluntary
informed consent and employed a valid research design with a sample selection that was
appropriate for the purpose of the study. The researcher also treated the information provided
by the respondents with utmost confidentiality.

34
3.9 Operational definition of the variables
Table 3.2: Operational definition of the variables Research objective
Variable Indicator Measurement Scale Tools of analysis
Type of analysis
To establish the influence of user awareness of open data on the implementation of the KODI.
Independent variable
The number of people aware of the open data initiative
- Number of government outreach and education campaigns on KODI. - Press releases and announcement about open data. -Number of people who understand their need for government information.
Ordinal Nominal
- Percentage - Frequency distribution - Mean - Mann Whitney u-test
Quantitative Qualitative
To determine the influence of data use on the implementation of the KODI.
Independent variable
- The number of people aware of the open data initiative - The number of people using the KODI portal
- Number of people that have accessed the portal in a certain period of time. - Feedback on the quality of datasets. - Request for datasets. - Innovative apps to visualize data. - Data feeds about new datasets.
Ordinal - Percentage - Frequency distribution - Mean - Mann Whitney u-test
Quantitative

35
To determine the influence of FOI legislation on the implementation of the KODI.
Independent variable
- A FOI act - The number of people demanding for their right to government information.
- Political support for FOI. - The level of freedom of information in the country.
Ordinal - Mean - Kruskal Wallis test
Quantitative
Dependent variable
-Transparency -Participation -Collaboration
- Number of people that have access to government held. information - Number of people informed of government proceedings. - Number of people engaged in public decision making and policy formulation - Number of people of organizations engaging in government through the use of innovative tools, methods and systems.
Ordinal -Mean - Mann Whitney u-test - Kruskal Wallis test
Quantitative
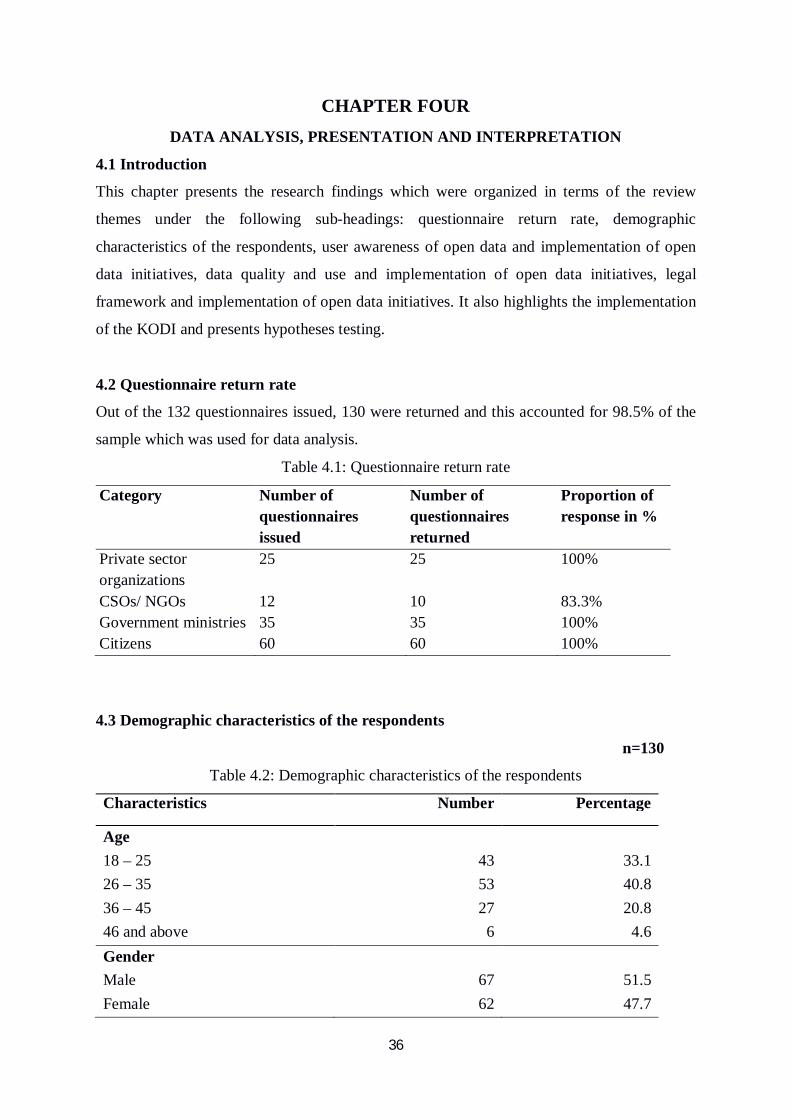
36
CHAPTER FOUR DATA ANALYSIS, PRESENTATION AND INTERPRETATION
4.1 Introduction
This chapter presents the research findings which were organized in terms of the review
themes under the following sub-headings: questionnaire return rate, demographic
characteristics of the respondents, user awareness of open data and implementation of open
data initiatives, data quality and use and implementation of open data initiatives, legal
framework and implementation of open data initiatives. It also highlights the implementation
of the KODI and presents hypotheses testing.
4.2 Questionnaire return rate
Out of the 132 questionnaires issued, 130 were returned and this accounted for 98.5% of the
sample which was used for data analysis.
Table 4.1: Questionnaire return rate
Category Number of questionnaires issued
Number of questionnaires returned
Proportion of response in %
Private sector organizations
25 25 100%
CSOs/ NGOs 12 10 83.3% Government ministries 35 35 100% Citizens 60 60 100%
4.3 Demographic characteristics of the respondents
n=130
Table 4.2: Demographic characteristics of the respondents
Characteristics Number Percentage
Age 18 – 25 43 33.1 26 – 35 53 40.8 36 – 45 27 20.8 46 and above 6 4.6 Gender Male 67 51.5 Female 62 47.7

37
Professional class White collar 61 46.9 Blue collar 5 3.8 Entrepreneur/ Self employed 15 11.5 Unemployed 12 9.2 Student 33 25.4 Sector Private 25 19.2 Government 35 26.9 NGO/CSO 10 7.7 Other 60 46.2
Although it was not part of the purpose of the study, this set of data was intended to describe
demographic variables of the sample and to assess for any influence on the research findings.
The demographic data consisted of age, gender, professional class and sector. The
demographic characteristics of the data were analyzed using frequency and percentage. Age
and gender had 1 missing value while professional class 4 missing values.
The research finding about age showed that out of 130 respondents, 33.1% which constituted
43 respondents fell in the age group between 18 – 25 years. 40.8% which constituted 53
respondents fell in the age group between 26 – 35 years. 20.8% which constituted 27
respondents fell in the age group between 36 – 45 years and 4.6% which constituted 6
respondents fell in the age group 46 years and above. The sample had more male
respondents: 51.5% which constituted 67 respondents and 47.7% female, which constituted
62 respondents. With regard to professional class, 61 respondents out of the 126 which is
46.9% of the sample had white collar jobs, 5 respondents which is 3.8% of the sample had
blue collar jobs, 15 respondents which is 11.5% of the sample were self employed, 12
respondents which is 9.2% of the sample were unemployed, and 33 respondents which is
25.4% of the sample were students. The result indicated that majority of the KODI
stakeholders: 46.2% which constituted 60 respondents were citizens. 19.2% which
constituted 25 respondents were stakeholders from the private sector; 26.9% which
constituted 35 respondents were stakeholders from the government sector and 7.7% which
constituted 10 respondents were stakeholders from the NGO sector.

38
4.4 User awareness of open data and implementation of the KODI
Table 4.3: Familiarity with the KODI
Characteristics Number Percentage
Familiarity with the KODI Yes 32 24.6 No 98 75.4
As can be seen from the table, out of the 130 respondents, 26.4% which constitutes 32
respondents are familiar with the KODI while 75.4% which constitutes 98 respondents and is
the bulk of the sample are not familiar with the initiative. This shows that the awareness
levels about the KODI are very low.
Table 4.4: Devices a respondent is able to access
Characteristics Number Percentage
Devices one is able to access Computer 2 1.5 Mobile phone 22 16.9 Computer and mobile phone 38 29.2 Computer, mobile phone and tablet
68 52.3
In terms of devices one is able to access; most respondents at 52.3% which is 68 respondents
indicated that they were able to access all devices namely: computer, mobile phone and
tablet. 1.5% which is 2 respondents indicated that they were able to access only a computer;
16.9% which is 22 respondents indicated that they were able to access only a mobile phone
and 29.2% which is 38 respondents indicated that they were able to access both a computer
and a mobile phone. The findings indicate that majority of the respondents are able to access
computer-like gadgets.

39
Table 4.5: Devices a respondent is able use
Characteristics Number Percentage
Devices one is able to use Computer 6 4.6 Mobile phone 9 6.9 Computer and mobile phone 30 23.1 Computer, mobile phone and tablet
85 65.4
On the other hand, majority of the respondents at 65.4% which is 85 respondents indicated
that they were able to use all devices namely: computer, mobile phone and tablet. 4.6% which
is 6 respondents indicated that they were able to use only a computer; 6.9% which is 9
respondents indicated that they were able to access only a mobile phone and 23.1% which is
30 respondents indicated that they were able to access both a computer and a mobile phone.
The findings indicate that majority of the respondents are able to use computer-like gadgets.
The mean score was considered from the score of the answers and was classified into 5 levels
to Best’s (1977) criteria as follows:
퐻푖푔ℎ푠푐표푟푒 − 퐿표푤푠푐표푟푒푁푢푚푏푒푟표푓푙푒푣푒푙푠
=5 − 1
5
=45
= 0.80

40
Table 4.6: Criteria for understanding the mean score
Mean scores Level of agreement
1.00 – 1.80 Highly disagree
1.81 – 2.60 Disagree
2.61 – 3.40 Unsure
3.41 – 4.20 Agree
4.21 – 5.00 Highly agree
Table 4.7: Internet access and use and government information access
Statement x̅ S.D Meaning
1. You have access to the internet. 4.49 0.77 Highly agree 2. You able to use the internet. 4.64 0.61 Highly agree 3. You have access to government information. 3.26 1.41 Unsure
Note: 1.00 – 1.80 = highly disagree, 1.80 – 2.60 = disagree, 2.61 – 3.40 = unsure, 3.41 – 4.20 = agree, 4.21 – 5.00 = highly disagree
The table indicates that the respondents highly agree that they have access to the internet with
a mean score of 4.49 and a SD of 0.77. The respondents highly agree that they are able to use
the internet with a mean score of 4.64 and a SD of 0.61. They however are unsure about their
access to government information with a mean score of 3.26 and a SD of 1.41. The
respondents strongly rated that they are able to access and use the internet.
Table 4.8: Preferred way of accessing the internet
Characteristics Number Percentage
Preferred way of accessing the internet
Computer 56 43.1 Mobile phone 47 36.2 Tablet 6 4.6 Computer and mobile phone 19 14.6 Computer and tablet 1 0.8 Computer, mobile phone and tablet
1 0.8

41
With regard to preferred way of accessing the internet, majority of the respondents at 43.1%
which is 56 respondents indicated that they prefer accessing the internet using a computer.
This was followed by 36.2% which is 47 respondents who prefer to access the internet using
a mobile phone; followed by 14.6% which is 9 respondents who prefer to access the internet
using both a computer and mobile phone; followed by 4.6% which is 6 respondents who
prefer to access the internet using a tablet and at the bottom of the list is 0.8% which is 1
respondent who prefer to access the internet using either both a computer and tablet or all
devices: computer, mobile phone and tablet respectively. The findings indicate that most
respondents can access the web-based KODI portal via their mobile phones or computers.
The KODI should therefore tailor their website to be device friendly so that it is clear on a
device of any size.
Table 4.9: Source of government information
Characteristics Number Percentage
Source of government information
Mass media 56 43.1 The government printer 2 1.5 Social media 26 20 KODI portal 1 0.8 Online sources 11 8.5 Mass and social media 4 3.1 Mass media and KODI portal 2 1.5 Mass media and online sources 16 12.3 Social media and online sources 2 1.5
Mass media, social media and online sources
6 4.6
Mass media, social media, KODI portal and online sources
1 0.8
Mass media, government printer, social media and online sources
1 0.8
Source of government information contained 2 missing values. Out of the 128 respondents,
56 which is 43.1% of the sample indicate that their source of government information is mass
media. 26 which is 20% of the sample indicate that their source of government information is
social media; 16 which is 12.3% of the sample indicate that their source of government

42
information is a combination of both mass media and online sources; 11 which is 8.5% of the
sample indicate that their source of government information is online sources; 6 which is
4.6% of the sample indicate that their source of government information is a combination of
mass media, social media and online sources; 2 which is 1.5% of the sample indicate that
their source of government information is the government printer; 2 which is 1.5% of the
sample indicate that their source of government information is a combination of both mass
media and KODI portal; 2 which is 1.5% of the sample indicate that their source of
government information is a combination of both social media and online sources and 1
which is 0.8% of the sample indicate that their source of government information is a
combination of mass media, social media, KODI portal and online sources or mass media,
government printer, social media and online sources respectively.
Table 4.10: Information respondents are interested in
Characteristics Number Percentage
Government information respondents are interested in
Health 4 3.1 Education 16 12.3 Governance 22 16.9 Budget allocation/ expenditure 12 9.2 Water & sanitation 4 3.1 Economic 18 13.8 Health and education 5 3.8 Health and governance 1 0.8
Health and budget allocation/ expenditure
2 1.5
Education and governance 4 3.1 Education and budget allocation/ expenditure
1 0.8
Education and water & sanitation 1 0.8 Education and economic 2 1.5 Governance and budget allocation/ expenditure
3 2.3
Governance and economic 2 1.5 Budget allocation/ expenditure and water & sanitation
1 0.8

43
Budget allocation/ expenditure and economic
5 3.8
Education, governance, water & sanitation and economic
2 1.5
Education, governance, budget allocation/ expenditure and economic
1 0.8
Health, education, governance, budget allocation/ expenditure and water & sanitation
1 0.8
Health, education, governance and economic
2 1.5
Health, education and governance 2 1.5 Governance, budget allocation/ expenditure and economic
2 1.5
Health, education and water & sanitation
1 0.8
Health, education, budget allocation/ expenditure and economic
1 0.8
Health, education, governance and budget allocation/ expenditure
2 1.5
Health, governance and budget allocation/ expenditure
2 1.5
Health, education, governance, budget allocation/ expenditure and economic
1 0.8
Governance, budget allocation/ expenditure, water & sanitation and economic
1 0.8
Health, education and economic 1 0.8 Health, education, governance, budget allocation/ expenditure, water & sanitation and economic
2 1.5
Information respondents are interested in had 1 missing value. The study shows that 22
respondents (16.9%) are interested in governance information; 18 respondents (13.8%) are
interested in economic information. 16 respondents (12.3%) are interested in education
information; 12 respondents (9.2%) are interested in budget allocation/ expenditure
information while two sets of 5 respondents (3.8%) are interested in a combination of health

44
and education and budget allocation/ expenditure and economic information respectively.
Three sets of 4 respondents (3.1%) are interested in health, water and sanitation and a
combination of education and governance information. 3 respondents (2.3%) are interested in
a combination of governance and budget allocation/ expenditure information. Ten sets of 2
respondents (1.5%) are interested in a combination of health and budget allocation/
expenditure; education and economic, governance and economic; education, governance,
water & sanitation and economic; health, education, governance and economic; health,
education and governance; governance, budget allocation/ expenditure and economic; health,
education, governance and budget allocation/ expenditure; health, governance and budget
allocation/ expenditure; and health, education, governance, budget allocation/ expenditure,
water & sanitation and economic information respectively. Eleven sets of 1 respondent each
(0.8%) are interested in a combination of health and governance; education and budget
allocation/ expenditure; education and water & sanitation; budget allocation/ expenditure and
water & sanitation; education, governance, budget allocation/ expenditure and economic;
health, education, governance, budget allocation/ expenditure and water & sanitation; health,
education and water & sanitation; health, education, budget allocation/ expenditure and
economic; health, education, governance, budget allocation/ expenditure and economic;
governance, budget allocation/ expenditure, water & sanitation and economic; and health,
education and economic information respectively.
Other information that respondents are interested in included: security; land issues; integrity,
transparency and accountability issues of state officers; art and tourism; government policy;
devolution; agriculture, transport and communication. The findings indicate that different
respondents are interested in diversified information from the government with the most
popular being governance. Mutuku and Mahihu (2014) survey found that the respondents
were interested in information related to ministries, their various programs and the services
they offer such as youth fund, education, census, security, health business and training. The
respondents in this study were interested in the information they selected because they are
associated, work or are interested in the field. They also indicated that there was inadequate
information about that field hence the reason for their choice. Security information was
ranked highest among the other information requested. This might be due to the security
challenges Kenya has been experiencing in the recent past.

45
4.5 Data use and implementation of the KODI
Table 4.11: Usage of the KODI portal
Characteristics Number Percentage
Usage of KODI portal Yes 24 18.5 No 106 81.5
Only 18.5% which constitutes 24 respondents out of the 130 that took part in the study
reported to have used the KODI portal. On the other hand, 106 which is majority of the
respondents (81.5%) have not used the portal. The findings indicate low usage of the portal.
The results also show that out of the 32 who are aware about the KODI, only 24 have used
the portal. This goes to show that awareness about the initiative will not necessarily translate
in people using the portal.
Table 4.12: KODI data characteristics
Statement x̅ S.D Meaning
1. The data provided on the KODI portal is relevant, that is what you wanted.
3.52 1.04 Agree
2. It is easy to find information on the portal. 3.70 0.82 Agree 3. The dataset available free of charge. 3.64 0.79 Agree 4. The level of detail in the data released is helpful to provide insight.
3.68
0.99
Agree
Note: 1.00 – 1.80 = highly disagree, 1.80 – 2.60 = disagree, 2.61 – 3.40 = unsure, 3.41 – 4.20 = agree, 4.21 – 5.00 = highly disagree
Table 4.11 shows the KODI data characteristics that dictate the data use. All the four items
fall under the agree category. The results indicate that the respondents agree that the data
provided on the KODI portal is relevant with a mean score of 3.52 and a SD of 1.04. The
respondents agree that it is easy to find information on the portal; the dataset available free of
charge and the level of detail in the data released is helpful to provide insight with a mean
score of 3.7 and a SD of 0.82, mean score of 3.64 and a SD of 0.79 and a SD of 0.64 and
mean score of 3.68 and a SD of 0.99 respectively.

46
4.6 FOI legislation and implementation of the KODI
Table 4.13: FOI legislation
Statement x̅ S.D Meaning
1. You have a constitutional right to access government information.
4.45
0.77
Highly agree
2. The government of Kenya is a champion of freedom of information.
2.91
1.14
Unsure
3. The Kenyan parliament is committed to enacting the Freedom of Information (FOI) bill into law.
3.02
1.02
Unsure 4. Having a FOI law will improve the dissemination of information thus enhance the impact of KODI in promoting an open government and general freedom of information in Kenya.
3.78
1.06
Agree Note: 1.00 – 1.80 = highly disagree, 1.80 – 2.60 = disagree, 2.61 – 3.40 = unsure, 3.41 – 4.20 = agree, 4.21 – 5.00 = highly disagree
Table 4.12 shows that the respondents are unsure about the role of the Kenyan government as
a champion of freedom of information with a mean score of 2.91 and a SD of 1.14, they are
also unsure about the commitment of the Kenyan government to enact the FOI bill into law
with a mean score of 3.02 and a SD of 1.02. The respondents agree with a mean score of 3.78
and a SD of 1.06 that having a FOI law will improve the dissemination of information thus
enhance the impact of KODI in promoting an open government and general freedom of
information in Kenya. The respondents highly agree that they have a constitutional right to
access government information with a mean score of 4.45 and a SD of 0.77.

47
4.7 Implementation of the KODI
Table 4.14: Implementation of KODI on transparency
Statement x̅ S.D Meaning
1. Opening up government data enables you to easily access government information.
4.20
0.78
Agree
2. Opening up government data enables equal access of government information by all.
3.83
1.04
Agree
3. Open data allows you to access data sources and perform analyses.
4.05
0.82
Agree
4. Opening up government data enables you to monitor the actions politicians and public administration.
3.71
0.99
Agree 5. Opening up government data gives you an improved opportunity to participate with, understand and critique government actions.
3.95
0.90
Agree Average 3.95 0.91 Agree
Note: 1.00 – 1.80 = highly disagree, 1.80 – 2.60 = disagree, 2.61 – 3.40 = unsure, 3.41 – 4.20 = agree, 4.21 – 5.00 = highly disagree
The table shows the implementation of the KODI on transparency. The results indicate that
the respondents rate the impact of the implementation of KODI on transparency at agree level
on all aspects of transparency as shown by items 1 to 5. The overall mean score was 3.95
with a SD of 0.91; this implies that the respondents agree that the implementation of the
KODI will result in transparency.
Table 4.15: Implementation of KODI on collaboration
Statement x̅ S.D Meaning
1. Open data provides a platform for open innovation of applications and mashups in partnership citizens.
3.78
0.80
Agree 2. Opening up government data enables collaborative administration through platforms for complaints, reporting corruption etc.
3.81
0.91
Agree

48
3. Open data fosters collaborative democracy through participatory budgeting, ideanation contests and interactive legislation and urban planning projects.
3.76
0.93
Agree Average 3.78 0.88 Agree
Note: 1.00 – 1.80 = highly disagree, 1.80 – 2.60 = disagree, 2.61 – 3.40 = unsure, 3.41 – 4.20 = agree, 4.21 – 5.00 = highly disagree
The table shows the implementation of the KODI on collaboration. The results indicate that
the respondents rate the impact of the implementation of KODI on collaboration at agree
level on all aspects of collaboration as shown by items 1 to 3. The overall mean score was
3.78 with a SD of 0.88; this implies that the respondents agree that the implementation of the
KODI will result in collaboration.
Table 4.16: Implementation of KODI on participation
Statement x̅ S.D Meaning
1. Opening data increases public participation in the political-administrative process.
3.85
0.97
Agree
2. Open data enables citizens to actively engage in the decision-making process of the government through online communication.
3.84
0.96
Agree 3. Open data enables citizens to articulate their opinions and interact with the public administration and parliamentarians.
3.83
0.90
Agree 4. Opening up government data enables citizens to give feedback to the government
3.99
0.85
Agree
5. Open data platforms increase the acceptance of political decisions by citizenry as they are part of the process.
3.75
1.03
Agree Average 3.85 0.94 Agree
Note: 1.00 – 1.80 = highly disagree, 1.80 – 2.60 = disagree, 2.61 – 3.40 = unsure, 3.41 – 4.20 = agree, 4.21 – 5.00 = highly disagree
The table shows the implementation of the KODI on participation. The results indicate that
the respondents rate the impact of the implementation of KODI on participation at agree level
on all aspects of participation as shown by items 1 to 5. The overall mean score was 3.85 with
a SD of 0.94; this implies that the respondents agree that the implementation of the KODI
will result in participation.

49
Table 4.17: Summary of the overall implementation of the KODI
Statement x̅ S.D Meaning
1. Transparency 3.95 0.91 Agree 2. Collaboration. 3.78 0.88 Agree 3. Participation. 3.85 0.94 Agree Average 3.86 0.91 Agree
Note: 1.00 – 1.80 = highly disagree, 1.80 – 2.60 = disagree, 2.61 – 3.40 = unsure, 3.41 – 4.20 = agree, 4.21 – 5.00 = highly disagree The table shows the summary of the overall implementation of the KODI. All the three
aspects of an open government were rated at the agree level. Transparency had a mean score
of 3.95 with a SD of 0.91, collaboration had a mean score of 3.78 with a SD of 0.88 and
participation had a mean score of 3.85 with a SD of 0.94. The results show an overall mean
score of 3.86 with a SD of 0.91, this implies that the respondents agree that implementation
of KODI will result in an open government.
4.8 Hypotheses testing
Table 4.18: Awareness of open data and the implementation of the KODI
Awareness of open data
n z u p-value
Yes 32 8.4716 0.0000 3.83e-31
No 98 The hypothesis was validated at 0.05 level of significance
Table 4.18 indicates the implementation of the KODI with regard to user awareness of open
data. The findings indicate that it has a statistically significant difference. The p-value for
0.000 is 3.83e-31, so the test statistic is significant at that level. The u-value is 0 and the
distribution is approximately normal, therefore z-value can also be used. Since the p-value is
less than the level of significance we reject the null hypothesis and accept the alternate
hypothesis. This means that user awareness of open data influences the implementation of the
KODI.

50
Table 4.19: Data use and the implementation of the KODI
Use of open data n z u p-value
Yes 24 7.6298 0.0000 1.10e-26
No 106 The hypothesis was validated at 0.05 level of significance
Table 4.19 indicates the implementation of the KODI with regard to open data use. The
findings indicate that it has no statistically significant difference. The p-value for 0.0000 is
1.10e-26, so the test statistic is significant at that level. The u-value is 0 and the distribution is
approximately normal, therefore z-value can also be used. Since the p-value is less than the
level of significance we reject the null hypothesis and accept the alternate hypothesis. This
means that open data use influences the implementation of the KODI.
Table 4.20: FOI legislation and the implementation of the KODI
Level of influence of FOI legislation on KODI
n x2
chi-square
H p-value
Highly agree 41 129 134 5.43e-028 Agree 37 Unsure 39 Disagree 9 Highly disagree 4
The hypothesis was validated at 0.05 level of significance
Table 4.11 indicates the implementation of the KODI with regard FOI legislation. The
findings indicate that it has a statistically significant difference. The p-value for 134 is 5.43e-
028, so the test statistic is significant at that level. The p-value, which is based on the Chi-
square distribution with 4 degrees of freedom, is less than 0.05. The value of the test statistic
H is greater than the chi-square tabulation. Since the calculated statistic is greater than the
chi-square tabulation and the p-value is less than the level of significance we reject the null
hypothesis and accept the alternate hypothesis. The null hypothesis was rejected, concluding
that there is strong evidence that the expected values in the five groups differ. This means
that FOI legislation influences the implementation of the KODI.

51
CHAPTER FIVE
SUMMARY OF FINDINGS, DISCUSSION, CONCLUSIONS AND
RECOMMENDATIONS
5.1 Introduction
This chapter gives a summary of the research findings in terms of the study objectives,
discussion, conclusions and recommendations. The conclusions were drawn from the study
findings and several recommendations made by the researcher. Suggestions for further
research have been incorporated in this chapter.
5.2 Summary of findings
The purpose of this study was to investigate the factors that influence the implementation of
the Kenya Open Data Initiative in Nairobi County. A descriptive survey design was used as
the research method and a questionnaire was developed and used as the key instrument.
Descriptive statistics: frequency, percentage, mean and standard deviation was used in
presenting information collected from the study in order to describe the characteristics of
information of samples. Mann Whitney u-test and Kruskal Wallis test were used in
comparing the user awareness of open data, open data use and FOI legislation with regard to
implementation of the KODI. The population of study comprised organizations that are
KODI stakeholders: private sector organizations, civil society organizations, government and
citizens within Nairobi County and the sample size was 132 respondents. Questionnaire
return rate was 98.5% which constituted 130 respondents.
Out of the 130 respondents, 19.2% were from the private sector, 26.9% were from
government institutions, 7.7% were from the NGO/CSOs and 46.2% were citizens. The
sample had more male respondents at 51.5% compared to female respondents at 47.7%.
33.1% of the respondents were aged between 18 – 25 years; 40.8% of the respondents were
aged between 26 – 35 years; 20.8% of the respondents were aged between 36 – 45 years and
4.6% of the respondents were above 45 years of age. Almost half of the respondents at 46.9%
had white collar jobs; 3.8% had blue collar jobs; 11.5% were self employed; 9.2% were
unemployed and 25.4% were students. In terms of awareness about KODI, only 24.6% of the
respondents were familiar within the initiative while 75.4% were not familiar. The
respondents highly agreed that they had access and could use the internet with a mean score
of 4.49 and 4.64 respectively. The respondents were however unsure about their access to

52
government information hence rating the item with a mean score of 3.26. When it comes to
the source of government information, mass media is the most popular at 43.1% followed by
social media at 20%, KODI ranks last as a source of government information at 0.8%. Only
18.5% of the respondents have used the KODI portal while 81.5% have not used the portal.
All the 4 items on data characteristics were given a mean score of between 3.41 and 4.20
meaning that the data quality is generally good. The respondents are highly aware of their
constitutional right to government information and gave a mean score of 4.45 to the item.
They agree that having a FOI law will improve dissemination of information by rating the
item with a mean score of 3.78. They are however unsure about the role of the Kenyan
government as a champion of freedom of information and parliament's commitment to pass
the FOI bill into law with a mean score of 2.91 and 3.02 respectively.
The respondents agree the implementation of KODI will foster transparency, collaboration
and participation with a mean score of 3.95, 3.78 and 3.85 respectively. Overall, the
respondents agree that the implementation of KODI will result into an open government with
a mean score of 3.86. The findings indicated that implementation of KODI with regard to
user awareness of open data was statistically significant with a p-value of 3.83e-31 and a u-
statistic of 0. It also indicated implementation of KODI with regard to open data use was
statistically significant with a p-value of 1.10e-26 and a u-statistic of 0. It also indicated
implementation of KODI with regard to a legal framework was statistically significant with a
p-value of 5.43e-028 and an H-statistic of 134.
5.3 Discussion
The research findings indicate that the awareness levels about the KODI are very low. The
findings corroborate Mutuku and Mahihu (2014) baseline survey and a report by Kapchanga
(2013) which found that citizens new little about the KODI. A reasonable explanation of
these results could be the treatment of KODI as a technology conversation involving experts
in the field which resulted in other stakeholders being left out. Another explanation could be
the lack of community participation at the onset of the project as well as lack of massive
campaigns after the launch of the initiative. Majority of the respondents are able to access and
use computers, mobile phones and tablets. This can be attributed to an influx of affordable
gadgets in the market which makes them easily accessible hence majority of the respondents
are able to learn how to use them. They are also able to access and use the internet. This
could be due to fact that most are able to access and use computer-like gadgets. It could also

53
be due to cheap access to the internet in cyber cafes as well as telecommunication providers.
This indicates that given the KODI domain, the respondents will be able to access the KODI
portal. They are however unsure whether they have access to government information;
low awareness about the KODI could explain this. This is a surprising finding considering
that the KODI is meant to make government information easily accessible yet even with the
availability of the portal, the respondents are not certain they have access to government
information. The findings show that mass media is most popular, followed by social media
when it comes to getting government information while KODI is ranked last. A survey by
Mutuku and Mahihu (2014), found that media was the most popular of information though at
75% followed by online sources at 54%. This study found that social media comes second;
this could be attributed to the popularity of social media platforms such as twitter, facebook,
instagram through which people share important information about the government. This
finding is deemed worrying given that KODI is meant to be the prime source of government
information. This could be attributed to the low awareness about the initiative. It could also
be attributed to respondents not being certain of where to find government information.
Hypothesis result indicates that user awareness of open data has a statistically significant
difference. This means that user awareness of open data influences the implementation of the
KODI. The finding corroborates other researches: Kapchanga (2013), Mutuku and Mahihu
(2014) and Muigai (2014) that indicate that user awareness of open data has an influence on
the implementation of an open data initiative.
The findings indicate low usage of the portal. The results also show that out of the 32 who are
aware about the KODI, only 24 have used the portal. This goes to show that awareness about
the initiative will not necessarily translate in people using the portal. Jannssen et al. (2012)
note that open data on its own has little intrinsic value; the value is created by its use. The
low usage of data on the portal means that the stakeholders may fail to realize the potential
returns of the initiative. The results corroborate a report by Kapchanga (2013) and studies by
Brown (2013) and Majeed (2012) that reported low traffic on the KODI portal as a result of
low usage. This can be attributed partly to lack of awareness about the initiative or it could
also be that the respondents don't see why they need the information on the portal hence they
see no need of using the portal. Another probable reason is the culture of complacent with
government and its activities; hence a passive approach when it comes to matters concerning
the government. Hypothesis result indicates open data use has a statistically significant
difference. This means that open data use influences the implementation of the KODI. The

54
research findings corroborate Carter and Belanger (2005), Jansen et al. (2012) and Weinstein
and Goldstein (2012) who state that the success of open government is contingent upon the
public's willingness to use and exploit datasets.
Ntale and Adieno (2012) and Kwamboka (2014) note that Article 35 of the new constitutional
dispensation gives citizens the right to information. The findings show that the respondents
are highly aware of their right to access government information. The respondents are also
sceptical about the government championing freedom of information and enacting the FOI
bill into law. This can be attributed to the FOI bill languishing in parliament for decades as
noted by Majeed (2012) study. The respondents agree that having a FOI law will improve the
dissemination of information thus enhance the impact of KODI in promoting an open
government and general freedom of information in Kenya. This is in line with the
Institutional theory (Scott 1995) which predicts that opening up government data will
reinforce existing structures. Open data in Kenya calls for enacting of a FOI act which will
make release and access to data easier. The respondents agree that implementation of KODI
will result in an open government. According to Janssen et al. (2012), open data should result
in open government in which the government acts as an open system and interacts with its
environment. The findings agree with the study, as the respondents are of the opinion that
opening up government data will promote transparency, collaboration and participation
between citizens and government. This could be attributed to the fact that before, the
government had been closed up and mostly allowed interaction with citizens during election
periods. By providing information that can give insight about the government, the
respondents might now be holding the opinion that the government is becoming more open.
This is also in agreement with the Systems theory (von Bertalanffy, 1958) which states that
real systems are open and interact with the environment. By opening up government data, a
move from a traditionally closed to open system is made (Jansen et al., 2012). Hypothesis
result indicates open data use has a statistically significant difference. This means that FOI
legislation influences the implementation of the KODI. This corroborates other researches by:
Development Initiatives (2014), Ubaldi (2013), Kwamboka (2013) and World Bank (2013)
that indicate that the presence of a legal framework is critical for an open data ecosystem to
thrive.

55
5.4 Conclusions The study revealed that there was low awareness about the open data initiative in Kenya. The
study found out that there is a significant relationship between user awareness of open data
and the implementation of the KODI. This means that user awareness of open data influences
and the implementation of the KODI.
The study also revealed that the usage of the portal is very minimal and that awareness about
the initiative does not necessarily translate in usage of the portal. The hypothesis result
showed that there is a significant relationship between open data use and the implementation
of the KODI.
The research findings indicate that the respondents agree that having a FOI law will improve
the dissemination of information thus enhance the impact of KODI in promoting an open
government and general freedom of information in Kenya. It is also shows a significant
relationship between a FOI legislation and the implementation of the KODI. The findings
also indicated that the respondents agree that opening up government information will result
in an open government that fosters transparency, collaboration and participation between
government and citizens.
5.5 Recommendations
Following the conclusions, the following are recommendations for KODI:
1) There is very little awareness about the open data initiative. Thus, the KODI should
enhance support for civic education on open data, its availability and use.
2) The KODI should enhance collaborations and partnerships between stakeholders
within the open data ecosystem. This will ensure that all stakeholders are equally
aware about the initiative and its potential benefits when put into use.
3) User awareness of open data does not necessarily translate to using the open data
portal. Thus, the users should not only be told why they need the data but should also
be shown why they need the data through actionable user experience. This will
enhance their chances of using the portal.
4) While noted it did not hinder the setup of KODI, the enactment of an access to
information law is needed to provide a policy framework for data provision and use,
and safeguard the initiative.

56
5.6 Suggestions for further research
1) Since the research covered only Nairobi County, there is need to carry out a similar
research in other parts of the country because different geographical locations have
distinct characteristics.
2) There is also need to carry out research on other factors that might influence the
implementation of an open data initiative that were not covered in this study namely:
financing, demand for open data, and national technology skills and infrastructure.
3) Research can also be carried out to determine the impact of KODI on the level of
openness in the Kenyan government.

57
REFERENCES
Best, J. W. (1977). Research in education. Eaglewood Cliffs, New Jersey: Prentice Hall. Brown, G. (2013, September 23). Why Kenya's open data portal is failing – and why it can
succeed. The Sunlight Foundation. Retrieved from http://sunlightfoundation.com/blog/2013/09/23/why-kenyas-open-data-portal-is-failing-and-why-it-can-still-succeed/
Canares, M. P., Guia, J., Narca, M. & Arawiran, J. (2014). Opening the gates: will open data initiatives make local governments in Philippines more transparent? Retrieved from http://www.opendataresearch.org/sites/default/files/publications/Opening%20the%20Gates%-20-%20Will%20Open%20Data%20Initatives%20Make%20Local%20Government%20in%20the%20Philippines%20More%20Transparent.pdf
Capgemini. (2013). The open data economy: Unlocking economic value by opening government and public data. Retrieved from http://www.capgemini-consulting.com/resource-file-access/resource/pdf/opendata_pov_6feb.pdf
Carter, L. & Bélanger, F. (2005).The utilization of e-government services: citizen trust,
innovation and acceptance factors, Information Systems Journal, 15(1), 5–25. Chernoff, M. (n.d.). What is open government? Retrieved from http://opensource.com/resources/open-government Chun, S. A., Shulman, S., Sandoval, R., & Hovy, E. (2010). Government 2.0: Making
connections between citizens, data and government. Information Polity, 15(1/2), 1-9.
Civic Dynamics. (2014). Dynamic open data. Retrieved from http://civic-dynamics.com/overview/dynamic-open-data
Dawes, S. S. (2010). Stewardship and usefulness: Policy principles for information-based transparency, Gov. Inf. Q., 27(4), 377–383. Davies, T. (2012). How might open data contribute to good governance? Commnwealth
Governance Handbook 2012/2013, 148-150.
Development Initiatives. (2014, June 19). Tracing the evolution of open data in Kenya. Retrieved from http://devinit.org/#!/post/tracing-evolution-open-data-kenya
Fountain, J. E. (2001). Building the virtual state. Information technology and institutional change. Washington DC: Brookings Institution Press.
Global Open Data Initiative. (n.d.). Global Open Data Initiative survey and interview report.
Retrieved from http://globalopendatainitiative.org/survey-and-interview-report/ GovDelivery. (2015, January 12). 5 ways to build engaged communities around open data.
Retrieved from http://www.govdelivery.com/blog/2015/01/5-ways-to-build-engaged-communities-around-open-data/

58
GovLab. (2013, August 5). Open Government-Whats in a name? Retrieved from http://thegovlab.org/open-government-whats-in-a-name/ Hammer, C. (2013, May 29). Open data has little value if people can't use it. Harvard
Business Review. Retrieved from https://hbr.org/2013/03/open-data-has-little-value-if Hare, J. (2014, December 14). The global open pulse from the 2014 Open Data Index.
Retrieved from: http://opensource.com/government/14/12/open-knowledge-publishes-2014-open-data-index
Hargreaves, N. (2013, August 16). The missing link in Kenya's open data story. Open Institute. Retrieved from http://openinstitute.com/the-missing-link-in-kenyas-open-data-story/
Heller, N. (2011, September 15). Is open data a good idea for the Open Government
Partnership? Global Integrity Commons. Retrieved from http://www.globalintegrity.org/blog/open-data-for-ogp
Heller, N. (2012, May 23). A working definition of open government. Global Integrity
Commons. Retrieved from https://www.globalintegrity.org/posts/working-definition-opengov/ Internet World Stats. (2015, March 19). Internet Usage Statistics for Africa. Retrieved from: http://www.internetworldstats.com/africa.htm#k Jackson, M. C. (2003). Systems thinking: Creative holism for managers. Chichester: John
Wiley.
Janssen, K. (2011). The influence of the PSI directive on open government data: An overview of recent developments. Gov. Inf. Q., 28, 446–456.
Janssen, M., Charalabidis, Y. & Zuiderwijk, A. (2012). Benefits, adoption barriers and
myths of open data and open government. Information Systems Management (ISM), 29(4), 258-268.
Jubilee Coalition. (2012). Transforming Kenya, securing Kenya's prosperity. Retrieved from http://journal.okal.me/post/44376796359/links-to-downloadable-party-manifestos-for-the
Jurisch, M. C., Kautz, M., Wolf, P. & Krcmar, H. (2015). An international survey of the factors influencing the intention to use open Open Government. 2015 48th Hawaii International Conference on System Sciences. DOI: 10.1109/HICSS.2015.262
Kapchanga, M. (2013, September 13). Survey – Kenyans not using the state data portal. The
Standard Newspaper. Retrieved from: http://www.standardmedia.co.ke/?articleID=2000093448&story_title=survey-kenyans-not-using-state-data-portal&pageNo=1
Kenya Open Data. (n.d.). About Kenya Open Data. Retrieved from

59
https://www.opendata.go.ke/page/about
Kombo, K. D., & Tromp, L. A. (2006). Proposal and Thesis Writing: An introduction. Nairobi: Paulines Publications Africa.
Kraemer, K., & King, J. L. (2006). Information technology and administrative reform: Will e-government be different? International Journal of Electronic Government Research, 2(1), 1-20.
Krejcie, R. V. & Morgan, D. W. (1970). Determining sample size for research activities. Educational and Psychological Measurement, 30, 607-610. Kwamboka, L. (2013). Open Data – How Kenya did it. Retreved from
http://datascience.co.ke/wp-content/uploads/2013/04/Open-Data-%D4%C7%F4How-Kenya-Did-It.pdf
Kwamboka, L. (2014). The data revolution: A framework for Africa. Development Initiatives. Retrieved from http://datascience.co.ke/journals-and-publications/ Majeed, R. (2012). Disseminating the power of information: Kenya Open Data Initiative,
2011-2012. Innovations for Successful Societies. Retrieved from http://successfulsocieties.princeton.edu/publications/disseminating-power-information-kenya-open-data-initiative-2011-2012
Mugenda, O. M. & Mugenda, A. G. (1999). Research methods: Quantitative and qualitative
approaches. Nairobi: Acts Press. Muigai, A. (2014, May 26). A look back at Kenya's open data journey. Open Institute.
Retrieved from http://openinstitute.com/a-look-back-at-kenyas-open-data-journey/ Mutuku, L., Colaco, J., & Omenya, R. (2013). An Evaluation Report on the Open Data Pre-
Incubator. Research, iHub , Nairobi. Mutuku, L. & Mahihu, C. M. (2014, August). Open data in developing countries:
Understanding the impacts of Kenya open data applications and services. Retrieved from http://www.opendataresearch.org/sites/default/files/publications/ODDC%20Report%20iHub.pdf
Ntale, C. L. & Adieno, D. (2012, November 21). Memorandum on the freedom of
information and data protection bills. Development Initiatives. Retrieved from http://datascience.co.ke/journals-and-publications/
Ntale, C. L., Mugambe, B., Sabiti, B. & Nganwa, P. (2014). Understanding how open data
could impact resource allocation for poverty eradication in Kenya and Uganda. Retrieved from http://www.opendataresearch.org/sites/default/files/publications/Open%20Data%20for%20Poverty%20Eradication%20-%20DRAFT.pdf
Noveck, B. S. (2011, July 4). What's in a name? Open gov and good gov. Retrieved from

60
http://www.huffingtonpost.com/beth-simone-noveck/whats-in-a-name-open-gov-b_845735.html
Open Data Barometer. (2015, January 9). The need for governments to increase open data efforts. Retrieved from http://webfoundation.org/2015/01/open-data-barometer-second-edition/
Open Government Data. (n.d.). What is Open Government Data? Retrieved from http://opengovernmentdata.org/ Open Knowledge Foundation. (2012, November 14). Open Data Handbook Documentation.
Release 1.0.0 Retrieved from: http://opendatahandbook.org/pdf/OpenDataHandbook.pdf
Open Knowledge Foundation. (n.d). The Open Definition. Retrieved from
http://opendefinition.org/od/ Orlikowski, J. W. (2000). Using technology and constituting structures: A practice lens for
studying technology in organizations. Organization Science, 11(4), 404-428. Orodho, A. J. (2005). Elements of Education and Social Science Research Methods. 1st ed.
Nairobi: Masola Publishers Palka, W., Jurisch, M. C., Leicht, M., Wolf, P. & Krcmar, H. (2013). Classification Schemes
for Open Government Data Provision. 13th European Conference on eGovernment (ECEG).
Paz, M. (2014, February 13). 11 ways to rethink open data. Retrieved from
http://ijnet.org/en/blog/11-ways-rethink-open--and-make-it-reledatavant-public Peixoto, T. (2013). The uncertain relationship between open data and accountability. UCLA
Law Review Discourse, 60(14), 200-213. Retrived from http://www.uclalawreview.org/pdf/discourse/60-14.pdf
Press Release, White House Office of the Press Secretary. (2010, September 23). Remarks by
the President to the United Nations General Assembly. Retrieved from: http://www.whitehouse.gov/the-press-office/2010/09/23/remarks-president-united-nations general-assembly
Richard, S. W. (2004). Institutional theory. In Encyclopedia of Social Theory. (pp. 408-414)
George Ritzer, ed. Thousand Oaks, CA: Sage.
Robinson, D., Yu, H., Zeller, W. P. & Felten, W. E. (2009). Government data and the invisible hand. Yale Journal of Law and Technology, 11(1), Article 4. Available at
http://digitalcommons.law.yale.edu/yjolt/vol11/iss1/4 Robinson, D. G. & Yu, H. (2012). The new ambiguity of Open Government. UCLA Law
Review Discourse, 59(11), 178-230. Retrieved from http://www.uclalawreview.org/pdf/discourse/59-11.pdf

61
Schwegmann, C. (2013, February). Open data in developing countries. (ePSIplatform Topic Report No: 2013 / 02). Retrieved from http://www.epsiplatform.eu/sites/default/files/127790068-Topic-Report-Open-Data-in-Developing-Countries.pdf
Scott, W. R. (1995). Institutions and organizations. Thousand Oaks, CA: Sage. Surowiecki, J. (2004). The wisdom of crowds: Why the many are smarter than the few
and how collective wisdom shapes business economies, societies and nations: Doubleday.
Tauberer, J. (2014). Open government data: The book (2nd ed). Retrieved from
https://opengovdata.io/ Ubaldi, B. (2013). Open government data: Towards empirical analysis of open
government data initiatives, OECD Working Papers on Public Governance, No. 22, OECD Publishing. http://dx.doi.org/10.1787/5k46bj4f03s7-en
von Bertalanffy, L. (1968). General system theory: Foundations, developments,
applications. New York: Braziller. Weinstein, J. & Goldstein, J. (2012). The benefits of a big tent: Opening up government in developing countries.” UCLA Law Review Discourse, 60(30), 38-48. Retrived from http://www.uclalawreview.org/pdf/discourse/60-3.pdf West, D. M. (2004). E-government and the transformation of service delivery and citizen
attitudes. Public Administration Review, 64(1), 15-27. Wonderlich, J. (2010, August 11). Sunlight Foundation: Ten principles for opening up
government information. Retrieved from http://sunlightfoundation.com/policy/documents/ten-open-data-principles/
World Bank. (2013, January 7). Open data readiness assessment tool. Available at http%3A%2F%2Fdata.worldbank.org%2Fsites%2Fdefault%2Ffiles%2F1%2Fod_readiness_- _revised_v2.doc

62
APPENDIX ONE RESEARCH QUESTIONNAIRE
Please note that the information you will provide is for the purpose of a research study and it will be treated with utmost confidentiality.
Part 1
Demographic factors Please fill in the following information in the spaces provided or indicate with a tick [√] where necessary. 1. Age ………………… years
2. Gender Male [ ] Female [ ]
3. Professional class
White collar [ ] Blue collar [ ] Entrepreneur/ Self employed [ ] Unemployed [ ] Student [ ]
4. Sector
Private Sector [ ] Government [ ] NGO/CSO [ ] None [ ]
User awareness of open data
5. Are you familiar with the Kenya Open Data Initiative (KODI)?
Yes [ ] No [ ]
6. Which of the following devices and their related applications are you able to access?
Computer [ ] Mobile phone [ ] Tablet [ ] All [ ]
7. Which of the following devices and their related applications are you able to use?
Computer [ ] Mobile phone [ ] Tablet [ ] All [ ]
Note: 1 = highly disagree, 2 = disagree, 3 = unsure, 4 = agree and 5 = highly agree. Statement Level of agreement
1 2 3 4 5 8. You have access to the internet. 9. You able to use the internet. 10. You have access to government information.
11. What is your is preferred way of accessing the internet?
Mobile phone [ ] Computer [ ] Tablet [ ]

63
12. What is your source of government information?
Mass media [ ] The government printer [ ] Social media [ ] KODI portal [ ] Online sources [ ]
13. What government information are you interested in? Health [ ] Education [ ] Governance [ ] Budget allocation/ expenditure [ ] Water & Sanitation [ ] Economic [ ] Other (specify)……...
................................................................................................................................................
Why are you interested in the information indicated?
………………………………………………………………………………………………………………………………………………………………………………………………………………………………………………………………………………………………………………………………………………………………………………………………………………………………………………………………………………………………………………………………………………………………………………………………………………
Data quality and use
14. Have you ever used the Kenya Open Data Initiative portal (www.opendata.go.ke)?
Yes [ ] No [ ]
If your answer to question 14 is yes, kindly answer questions 15 – 22. Note: 1 = highly disagree, 2 = disagree, 3 = unsure, 4 = agree and 5 = highly agree.
Statement Level of agreement 1 2 3 4 5
15. The data provided was sufficient to create computer or mobile applications.
16. It was easy to find information on the portal. 17. The dataset was available free of charge. 18. The level of detail in the data released is helpful to provide insight.

64
Legal framework
Note: 1 = highly disagree, 2 = disagree, 3 = unsure, 4 = agree and 5 = highly agree. Statement Level of agreement
1 2 3 4 5 19. You have a constitutional right to access government information.
20. The government of Kenya is a champion of freedom of information.
21. The Kenyan parliament is committed to enacting the Freedom of Information (FOI) bill into law.
22. Having a FOI law will improve the dissemination of information thus enhance the impact of KODI in promoting an open government and general freedom of information in Kenya.
Part 2 Implementation of KODI The statements below are designed to indicate your perception on how the implementation of KODI by opening up government data will contribute having an open government: one that is transparent and fosters participation and collaboration. Read carefully and indicate with a tick [√] against the appropriate answers.
Note: 1 = highly disagree, 2 = disagree, 3 = unsure, 4 = agree and 5 = highly agree. Statement Level of agreement
1 2 3 4 5 Transparency 1. Opening up government data enables you to easily access government information.
2. Opening up government data enables equal access of government information by all.
3. Open data allows you to access data sources and perform analyses.
4. Opening up government data enables you to monitor the actions of politicians and public administration.
5. Opening up government data gives you an improved opportunity to participate with, understand and critique government actions.
Collaboration 1. Open data provides a platform for open innovation of applications and mashups in partnership citizens.
2. Opening up government data enables collaborative administration through platforms for complaints, reporting corruption etc.

65
3. Open data fosters collaborative democracy through participatory budgeting, ideanation contests and interactive legislation and urban planning projects.
Participation 1. Opening data increases public participation in the political-administrative process.
2. Open data enables citizens to actively engage in the decision-making process of the government through online communication.
3. Open data enables citizens to articulate their opinions and interact with the public administration and parliamentarians.
4. Opening up government data enables citizens to give feedback to the government.
5. Open data platforms increase the acceptance of political decisions by citizenry as they are part of the process.

66
APPENDIX TWO
LETTER OF INTRODUCTION
P.O. BOX 372 – 00100,
Nairobi.
30th June 2015.
TO WHOM IT MAY CONCERN
Dear Sir/Madam,
RE: PERMISSION TO CARRY OUT RESEARCH
I am a post graduate student at the University of Nairobi pursuing Masters of Arts in Project
Planning and Management. I am carrying out a research study titled: Factors influencing the
implementation of the Kenya Open Data Initiative: A case of Nairobi County. I would wish
to conduct research in your organization. The research is strictly for academic purposes and
the data collected will be treated with utmost confidentiality.
I would be grateful if you accord me permission to undertake the research in your
organization.
Yours Faithfully,
Christine Oyatsi.
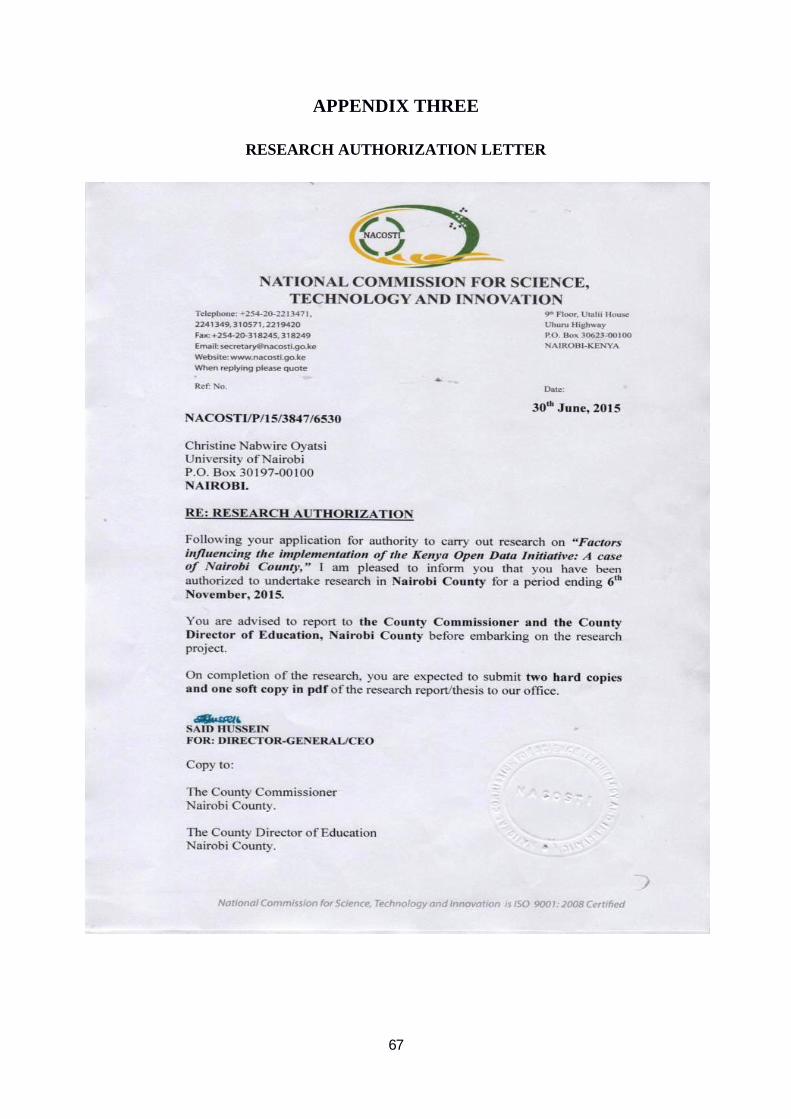
67
APPENDIX THREE
RESEARCH AUTHORIZATION LETTER

68
APPENDIX FOUR
RESEARCH PERMIT


