FACILITY LAYOUT IMPROVEMENT USING SYSTEMATIC LAYOUT
PLANNING (SLP) AND ARENA
CHEE AILING
A thesis submitted in fulfillment of the requirements for the award degree of
Masters of Engineering (Industrial Engineering)
Faculty of Mechanical Engineering
Universiti Teknologi Malaysia
May 2009

iii
ACKNOWLEDGEMENT
I would like to express my utmost gratitude and appreciation to my thesis
lecturer, Dr Wong Kuan Yew, with his dedication and invaluable guidance through
out the challenging process of completing this Masters Project. I would like to thank
him for his prompt response in providing guidelines whenever I m faced with
obstacles which has been an important source of motivation.
I also wish to thank the staff of Agilent, especially my operating manager
who agrees for me to disclose the information of Agilent product line only for the
purpose of this Masters project. Not to forget also the production line operators who
have spent their valuable time in assisting me to collect the cycle time data for the
process.
Last but not least, is to my family who has been the source of motivation,
support and care. Their support has always been the pillar of strength for me
throughout this project.

iv
ABSTRACT
The objective of this thesis is to improve the production floor layout of the
MTA department and to evaluate the proposed alternative layouts using ARENA
simulation. This project is conducted at Agilent Technologies, Inc., an Electronics
Manufacturing company located in Bayan Lepas, Penang. The major problem faced
by the company is high cross-over frequency for E-Cal and Coaxial Waveguide
Adapter products between two buildings. There is high flow intensity between
departments which have high interrelationship. This leads to high travelling time and
high travelling cost. Two alternative layouts are proposed using the 11 steps in
Systematic Layout Planning, which is a systematic way of generating layout
alternatives. The proposed alternative layout involves transferring the departments
which have high interrelationship close to each other. The proposed alternative
layouts are evaluated using ARENA simulation student version. The best alternative
is chosen based on the performance measures which have the most significant
improvement, which are total travel distance, total travel time, total travel cost,
number of cross-over, output, average resource utilization, total average WIP level,
total average waiting time and total time spent in the system. The best alternative
layout is Layout Design 2, which does not need extra space for re-layout. Total travel
distance for Coaxial Waveguide Adapter will reduce significantly by 78.1% and for
E-Cal the total travel distance will reduce by 62.87%. Total travel time for coaxial
waveguide adapter is reduced by 86.42 % while for e-cal is reduced by 75.17%. This
will subsequently reduce cost of travel for coaxial waveguide adapter by 86.42% and
for E-cal is reduce by 68.09%. The output for coaxial waveguide adapter will
increase 55.30 % as well. For e-cal the output will increase by 9.05 %.

v
ABSTRAK
Objektif projek ini adalah untuk memperbaiki susunatur jabatan produksi
MTA dan memilih cadangan layout terbaik menggunakan simulasi ARENA. Kajian
kes ini dilaksanakan di Agilent Technologies, Inc.,sebuah kilang elektronik di Bayan
Lepas, Pulau Pinang. Masalah utama adalah bilangan ulang alik yang tinggi antara
dua bangunan bersebelahan bagi produk Coaxial Waveguide Adapter dan E-Cal.
Bahagian yang mempunyai hubungan ulang alik yang banyak terletak berjauhan. Ini
mengakibatkan masa pengangkutan yang panjang dan kos yang tinggi. Kaedah
Systematic Layout Planning digunakan untuk menghasilkan 2 cadangan alternatif
susunatur.Dua cadangan ini bertujuan untuk menukar kedudukan stesen yang terletak
berjauhan . Simulasi digunakan untuk memilih antara dua alternatif ini. Alternatif
terbaik dipilih berdasarkan jumlah jarak pengangkutan,jumlah kos pengangkutan
manual, bilangan ulang alik,jumlah masa pengangkutan,output, purata penggunaan
sumber, purata WIP, purata masa menunggu dan purata masa dalam sistem.
Susunatur cadangan kedua merupakan pilihan yang terbaik kerana tidak memerlukan
ruangan yang lebih. Jumlah jarak pengangkutan bagi Coaxial Waveguide Adapter
akan kurang 78.1% manakala bagi E-Cal akan kurang 62.87%. Jumlah masa
pengangkutan bagi coaxial waveguide adapter akan kurang sebanyak 86.42% dan
untuk E-Cal akan kurang 75.17%.Ini akan mengurangkan kos untuk mengangkut
coaxial waveguide adapter sebanyak 86.42, untuk E-Cal akan kurang sebanyak
68.09%. Output untuk coaxial waveguide adapter akan bertambah sehingga 55.30%
manakala untuk E-Cal akan bertambah 9.05%.

vi
TABLE OF CONTENTS
CHAPTER TITLE PAGE
DECLARATION ii
ACKNOWLEDGEMENTS iii
ABSTRACT iv
ABSTRAK v
TABLE OF CONTENTS vi
LIST OF TABLES xii
LIST OF FIGURES xiii
LIST OF APPENDICES xvi
1 INTRODUCTION
1.1 Background of the problem 1
1.2 Statement of problem 3
1.3 Objective 3
1.4 Scope 4
1.5 Methodology 4
1.6 Relevant literature 7
1.7 Significance of study 8
1.8 Arrangement of thesis 9
1.9 Conclusions 11
vii
2 LITERATURE REVIEW
2.1 Introduction 12
2.2 Plant layout 12
2.3 Facility layout planning 13
2.3.1 Objectives of facility layout planning 14
2.3.2 Factors affecting facility layout planning 15
2.3.2.1 Material 15
2.3.2.2 Machinery 15
2.3.2.3 Labor 16
2.3.2.4 Material handling 16
2.3.2.5 Waiting time 16
2.3.3 Importance of plant layout 17
2.4 Traditional types of facilities layout 17
2.4.1 Process ( Job shop ) layout 18
2.4.1.1 Advantages of process layout 19
2.4.1.2 Disadvantages of process layout 19
2.4.2 Product (Flow shop ) layout 20
2.4.2.1 Advantages of product layout 21
2.4.2.2 Disadvantages of product layout 21
2.4.3 Fixed position layout 22
2.4.3.1 Advantages of fixed position 22
layout
2.4.3.2 Disadvantages of fixed position 23
layout
2.4.4 Group technology layout 23
2.4.4.1 Advantages of cellular layout 24
2.4.4.2 Disadvantages of cellular layout 25
2.5 Non-traditional types of facility layout 26
2.6 Review on previous layout planning techniques 26
2.7 Systematic layout planning 29
2.8 Tools for layout design 39
viii
2.8.1 Definition of simulation 40
2.8.2 Trends in simulation 40
2.8.3 Uses of simulation 42
2.8.4 When should simulation be used 42
2.8.5 Simulation methodology 43
2.8.5.1 Problem formulation and setting 44
of objectives
2.8.5.2 Model boundary and scope 45
2.8.5.3 Conceptual model and assumption 45
Document
2.8.5.4 Model development 46
2.8.5.5 Data collecting cleansing and 47
analysis
2.8.5.6 Model verification 47
2.8.5.7 Model validation 48
2.8.5.8 Experimental design 48
2.8.5.9 Experimentation 49
2.8.5.10 Analysis 49
2.8.5.11 Reporting 50
2.9 Advantages and disadvantages of simulation 50
2.10 ARENA 51
2.10.1 ARENA reputation 52
2.10.2 ARENA methodology 53
2.10.3 ARENA technology 53
2.11 Previous projects 55
2.11.1 Systematic layout plan for Baystate 57
services
2.11.2 Systematic layout planning : A study on 58
Semiconductor wafer fabrication facilities.
2.11.3 An empirical study using a modified SLP 58
procedure
2.11.4 Facility planning for a gas manufacturing 59
plant

ix
2.11.5 The carbolite case study: Lean approach 60
To Systematic layout planning
2.12 Comparisons between my work and previous 62
works
2.13 Conclusions 62
3 COMPANY BACKGROUND
3.1 Introduction 64
3.2 General information 64
3.2.1 Business group 65
3.2.2 Strategy 66
3.2.3 Market leadership 66
3.2.4 History 66
3.2.5 Microwave test accessories(MTA) 67
3.2.6 Strategy 67
3.2.7 MTA Charter 68
3.2.8 MTA vision 68
3.2.9 Key products 68
3.3 Company Structure 69
3.4 Factory layout 70
3.5 Manufacturing process 70
3.5.1 Electronic Calibration Kit 71
3.5.2 Coaxial waveguide adapter 72
3.6 Conclusions 73
4 PROBLEM IDENTIFICATION
4.1 Introduction 74
4.2 Cross-over diagram 74
4.2.1 Electronic calibration kit 74
4.2.2 Coaxial waveguide adapter 76
4.3 Quantity of cross-over chart 78
4.4 Travel cost 78
x
4.5 From-To-Chart 79
4.6 Overall From-To Chart 81
4.7 Overall From To-Chart(with closeness ratings) 82
4.8 Conclusions 83
5 SYSTEMATIC LAYOUT PLANING
5.1 Introduction 84
5.2 Input data 85
5.2.1 Standard time 85
5.2.2 Flow of materials 88
5.3 Activity relationship chart 90
5.4 Relationship diagram 92
5.5 Space requirements 93
5.6 Space available 94
5.7 Space relationship diagram 96
5.8 Modifying constraints 98
5.9 Practical limitations 98
5.10 Develop layout alternatives 99
5.11 Conclusions 100
6 DATA ANALYSIS AND MODELLING
6.1 Introduction 101
6.2 Conceptual Model 101
6.3 Performance measures 102
6.4 Conceptual model validation 103
6.5 Model description 105
6.6 Assumptions 106
6.7 Model construction 107
6.7.1 Basic process 108
6.7.2 Advanced transfer 108
6.8 Model verification 109
6.9 Model validation 113

xi
6.10 Steady state system 117
6.10.1 Warm up period 117
6.10.2 Obtaining sample observation 119
6.10.3 Simulation run length 119
6.11 Number of replication determination 120
6.12 Conclusions 122
7 SIMULATION EXPERIMENTATION AND RESULTS
7.1 Introduction 123
7.2 Experimentation 123
7.3 Experiment 1 : Layout Design 1 124
7.4 Experiment 2 : Layout Design 2 129
7.5 Discussion 134
7.6 Conclusion 138
8 CONCLUSIONS AND RECOMMENDATIONS
8.1 Introduction 139
8.2 Project Summary 139
8.3 Findings 140
8.4 Further recommendations 141
8.5 Conclusions 141
REFERENCES 142
APPENDICES 146

xii
LIST OF TABLES
TABLE NO. TITLE PAGE
2.1 Summary of Layout Planning 27
Techniques
2.2 Simulation Software 52
2.3 Summary of previous projects 56
5.1 PQRST Analysis for E-Cal 87
5.2 PQRST Analysis for Coaxial 87
Waveguide Adapter
5.3 Space requirements information 94
6.1 Output of 10 replications 121
7.1 Performance measures for coaxial waveguide 127
adapter Layout Design 1
7.2 Performance measures for E-cal Layout Design 1 128
7.3 Performance measures for coaxial waveguide 132
adapter Layout Design 2
7.4 Performance measures for E-cal Layout Design 2 133
7.5 Performance measures for Coaxial Waveguide 135
Adapter
7.6 Performance measures for E-cal 136

xiii
LIST OF FIGURES
FIGURE NO. TITLE PAGE
1.1 Project Methodology 5
2.1 Process Layout 18
2.2 Product Layout 20
2.3 Fixed Position Layout 22
2.4 Group Technology Layout 24
2.5 Types of Layout 25
2.6 Non traditional types of facilities layout 26
2.7 Steps for Systematic Layout Planning 30
2.8 Activity Relationship Chart 32
2.9 Relationship Chart 33
2.10 Relationship Chart 34
2.11 Relationship Diagram 35
2.12 Space Requirements 35
2.13 Space Available 36
2.14 Activity Relationship Diagrams 37
2.15 Block Plan 38
2.16 Detailed Layout 39
2.17 Tools and Techniques for Layout Design 39
2.18 Simulation Methodology 44
3.1 Department Structure 69
3.2 Production Plant Layout 70
4.1 Cross-over diagram for e-cal 77
4.2 Cross-over diagram for coaxial waveguide 77
adapter

xiv
4.3 Flow Intensity Matrix 79
4.4 Inter department Distance Matrix 80
4.5 Calculation of Overall From-To-Chart 81
4.6 Overall From-To Chart (with closeness ratings) 82
5.1 Product Flow for E-Cal 89
5.2 Product Flow for Coaxial Waveguide Adapter 90
5.3 Activity Relationship Diagram 91
5.4 Relationship Diagram 92
5.5 Extra space available 95
5.6 No Extra Space Available 96
5.7 Space relationship diagram(Option 1) 97
5.8 Space relationship diagram(Option 2) 97
5.9 Layout Alternative 1 99
5.10 Layout Alternative 2 100
6.1 Conceptual Model For Coaxial Waveguide 102
Adapter
6.2 Conceptual Model For E-Cal 102
6.3 Statistical Input of ARENA Input Analyzer 104
6.4 Block modules for coaxial waveguide adapter 105
6.5 Block modules for E-Cal 106
6.6 Basic Process and Advanced Transfer Panel 107
6.7 Station marker placement for coaxial waveguide 109
adapter
6.8 Step button location in ARENA 110
6.9 Set maximum arrival 110
6.10 Screen shot of increase / decrease IAT 111
6.11 SIMAN language window 113
6.12 Historical Data Comparisons 114
6.13 Average resource utilization 115
6.14 Graphical comparisons between actual output 116
and model output
6.15 Comparisons of actual total travel time for 116
coaxial waveguide adapter and simulated total
travel time

xv
6.16 Average resource utilization versus time(minutes) 118
for coaxial waveguide adapter( Design 1)
6.17 Average resource utilization versus time(minutes) 118
for coaxial waveguide adapter (Design 2)
6.18 Average resource utilization versus time(minutes) 118
for E-Cal (Design 1)
6.19 Average resource utilization versus time(minutes) 119
for E-Cal (Design 2)
7.1 Simulation model for coaxial waveguide adapter 125
design 1
7.2 Simulation model for e-cal design 1 125
7.3 Route and station placement for coaxial 126
waveguide adapter design 1
7.4 Route and station placement for e- cal design 2 126
7.5 Simulation model for coaxial waveguide adapter 129
design 2
7.6 Simulation model for e-cal design 2 130
7.7 Route and station placement for coaxial 130
waveguide adapter design 2
7.8 Route and station placement for e-cal design 2 131

xvi
LIST OF APPENDICES
APPENDIX TITLE PAGE
A Process flow diagram of e-cal and coaxial 146
waveguide adapter
B Calculation of number of cross-over 148
C Travelling cost calculation 150
D Department Distance Calculation 151
E Cycle Time and Sample Size Calculation 152
F Additional process cycle time (40 observations) 160
G ARENA Input Analyzer Analysis for E-Cal and 167
H ARENA Input Analyzer Analysis for 175
Coaxial Waveguide Adapter
I Data Collection for walking time Design 1 181
J Input Analyzer distribution for walking time 188
Design 1
K Data Collection for walking time Design 2 191
L New process cycle time Design 1 197
M New process cycle time Design 2 198
CHAPTER I
INTRODUCTION
1.1 Background of the problem
In the 21st century business world, companies are exposed to continuous
challenges. One of it is to equip organizations with the ability to compete in a global
marketplace. (Schonberger, 1986) states ..world class performance is dedicated to
serving the customer. Thus, in order to keep track of performance, organizations
must develop measures of performance. The current trend in the electronics industry,
which is experiencing very competitive era like many others is striving hard to
reduce manufacturing costs, improve quality and customer satisfaction.
Materials handling equipment and the facilities it operates can contribute to as
much as 70 percent of the total cost of the manufactured product (Tompkins et al,
1996). Facilities layout design is part of facilities planning (Tompkins et al, 1996). It
is the arrangement of work space which, in general terms smoothes the way to access
facilities that have strong interactions. The main concern with the plant facility layout
planning is to reduce the cost of materials handling as poor materials handling can
generate business problems. As Sims (Industrial Engineering May 1990) states
The best material handling is no handling . Subsequently, a good layout will enable
the manufacture of the product economically in the required volume and variety.
2
Other objectives can be stated as effective utilization of manpower, space and
infrastructure, as well as providing overall wellbeing and morale of the worker.
Today s manufacturing industry is facing problems that have been growing in
size and complexity over the last several years. As a result, there is an immediate
need for procedures or techniques in solving various problems encountered in today s
manufacturing arena without extended shutdown s or expensive modifications (
Clark ,1996). Computer simulation is a powerful tool that allows experimentation
with various manufacturing techniques and layout without actual implementation.
Simulation can be used as a stochastic model to evaluate the randomness of events
which exists. Simulation predicts the behavior of complex manufacturing systems by
determining the movement and interactions of system components. It is capable of
aiding in the design of the most complex layout and also allows the user to evaluate
alternative solutions to examine the flexibility of a design ( Eneyo and
Pannirselvam,1998).
Based on the above facts, it is obvious that layout optimization and simulation
are two tasks that are crucial to any facility planning and layout study (Grajo, 1996).
If not tackled in the early phases, it can generate logistics implications for the
company involved.
1.2 Statement of the problem
Agilent Technologies, Inc. is an electronics manufacturing company located in
Bayan Lepas. It has numerous business units where the problem area which is
Microwave Test Accessories (MTA) department will be discussed here. MTA has 2
main buildings, Building 5 and Building 6.Frequency of cross over is high between
the two buildings as stations for some products are located in both buildings.
3
Processes which have high interdependency are not located close to each other. This
causes high travelling time for the operator as they have to travel to and fro from
building 5 to building 6. The labor cost of each product is also high due high
travelling cost.
In response to the above problems, the need for facilities layout optimization
and a model capable of simulating workstation production on new layout proposals
to evaluate the performance measures related to the manufacturing goals of the
company is needed. This thesis proposes to use Systematic Layout Planning (SLP) as
the infrastructure for layout optimization. Subsequently simulation using ARENA is
then used to systematically to examine the role and impact of product complexity and
other key variables on factory performance. The factory performance improvements
are in terms of cycle time reduction, productivity increase, reduction in travelling
cost and reduction in travelling distance.
1.3 Objective
i. To improve the production floor layout at the MTA department.
ii. To evaluate the proposed alternative layouts using simulation.
1.4 Scope
In this thesis, the case study is limited to the MTA production floor of Agilent
Technologies, Inc. The products selected will be only Electronic Calibration Kit and
Coaxial Waveguide Adapter. This work focuses on improving the facilities design of
the production floor. The layout of the production is process oriented layout. The

4
Systematic Layout Planning (SLP) methodology will be utilized in this case study as
part of the strategy to portrait the relationship between each department to generate
improved layout alternatives. The future layout alternative will be evaluated using
simulation software ARENA.
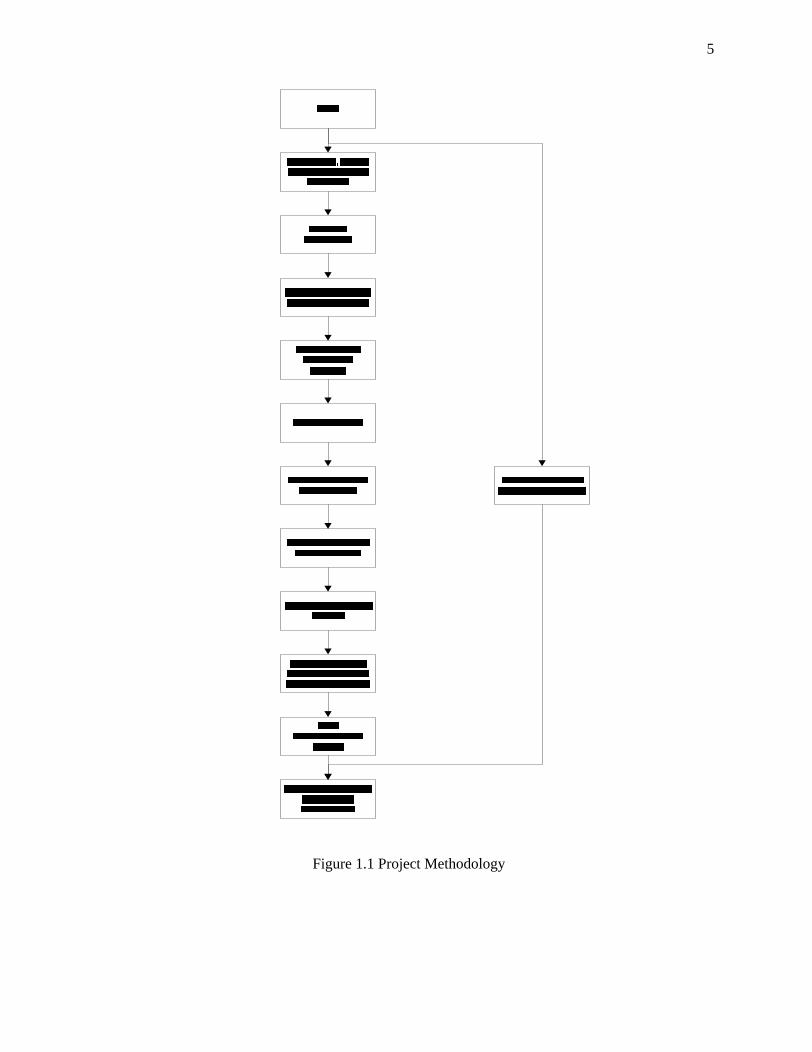
1.5 Methodology
This project is divided into Masters Project I and Masters Project II, which has
to be completed in Semester I and Semester II respectively. The methodology for this
project is stated in Figure 1.1 on the next page.
5
Figure 1.1 Project Methodology

6
Literature review would be done throughout the 2 semesters to have a more
detailed background and theoretical knowledge regarding Facilities Planning,
Systematic Layout Planning and simulation ARENA. This would provide evidence
of familiarity with the areas covered in this study and its classifications. Apart from
that, current trends, direction and research issues were identified. Previous studies,
journal papers, online articles were reviewed critically. Subsequently, evidence of not
repeating what others have done will guide in the formulation of problem statement
and the justification of proper selection of tools and techniques to be used.
After reviewing previous journals and studies, a company is selected to be
studied. The company background is discussed briefly. It covers the company profile,
organization structure of the company, understanding the current layout of the
company, its manufacturing process and its policies.
Subsequently, the problems faced by the company will be identified. The
scope will be limited to the facilities layout of the company and two of the major
high revenue products. The process flow for each of the product will be observed and
documented. The distance travelled by the operator is calculated. Tools such as
crossover chart/spaghetti diagram, From-To-Chart are used. Time studies will be
used as the method of cycle time calculation.
Following that, the Systematic Layout Planning (SLP) will be used for the
generation of layout alternatives in Chapter 5. Systematic Layout Planning is used in
this case study as it is a procedural approach which incorporates both qualitative and
quantitative data. It is a proven tool in providing layout design guidelines in practice
in the past few decades. At the end of the first semester, new layout proposals will be
proposed to improve the facilities layout of the company. Other than that, simulation
software, ARENA will be learnt to enhance skills of constructing the model of the
layout plan and flow of product for semester two. A draft report will be send to the
supervisor.
7
In Masters Project II, the model of the proposed improvement layouts will be
modeled using ARENA. The types of data distribution will be justified. The models
will be validated and verified. Experimentation of each layout proposal will be done
using the simulation model. The results will be analyzed and compared with the
existing layout.
Finally the results of each alternative layout are compared to select the one
with the most significant improvement to the company. The full report will be
submitted to the supervisor upon completion.
1.6 Relevant Literature
Global competitiveness and advances in technology have given rise to the
need for effective space utilization ( Muther, 1976). Immer (1950) presented the
basic steps in the layout planning as related to material handling and outlined the
need for the representation of the flow and its depiction in terms of the output
produced by equipment. In the early days of research pertaining to plant layout, the
approach was typically one of minimizing the distance traveled between work
centers.
Reed (1961) devised a layout planning chart as the single most important
phase of systematic planning in plant layout. Other approaches are such as
Systematic Layout Planning (Muther, 1973), steepest descent search method by pair-
wise exchange, graph based construction method, Tabu search, simulated annealing
and genetic algorithms.

8
Other computer aided layout techniques have been developed as well such as
CRAFT, ALDEP, COFAD, CORELAP, MULTIPLE, BLOCPLAN. There are also a
few commercial packages available for facility layout design namely, PROMODEL,
LayOPT, FactoryPLAN and Factory modeler.
From the review of the literature, it can be concluded that layout design
problem has been an active research area in the past few decades ( Meller and Gau,
1996). However, most of the research does not integrate the layout improvement
methodology together with simulation. Therefore the following paragraph
summarizes the significance of this case study by using the SLP methodology and
simulation using ARENA for optimization.
1.7 Significance of Study
An approach from Muther (1973), Systematic Layout Planning (SLP) is used
as the improvement method. It uses a graphical representation and builds up a
proximity matrix which represents the closeness of each facility. Flowcharts can also
be developed showing quantitative relationships.
From the above proximity matrix a trial and error process can be used to
generate the layout but again this approach has not been shown to be a particularly
efficient method in practice. Simulation provides a more powerful tool (a 6 sigma
capable tool) than those commonly used in a lean 6 sigma process. Simulation is
uniquely able to support achieving a corporate goal of finding a correct or at least a
very good solution that meets the system design and operation requirements before
implementation at minimal cost. Therefore simulation using ARENA is used as tool
in this study to address issues that the Systematic Layout Planning approach failed to
identify and could not solve.
9
This case study which focuses on manufacturing activities in the electronics
industry can also be easily applied with minimal modification in other types of
facilities such as offices where workflow processes may be present. Thus the model
described possesses a general applicability in other domains that can be achieved
through mapping of equivalent governing parameters to those that have been
identified in the manufacturing sector.
1.8 Arrangement of Thesis
This project report consists of 8 chapters. Chapter 1 begins with an overview
of Facilities Layout Planning definitions and its principles. Objectives and Scope of
the case study are also well defined. Subsequently, some relevant literature is
reviewed to justify the significance of this study.
Chapter 2 will be the literature review on facilities layout planning with the
focus area in Systematic Layout Planning methodology, simulation techniques and its
importance. Other than that the integration of Layout design and Simulation will also
be discussed. Finally, relevant research and previous journals will be summarized
with emphasis on the strengths and gaps. Subsequently evidence of the strength of
this project compared to the previous studies will be highlighted.
Chapter 3 will discuss about the methodology of the thesis, including types of
data to be collected, tools and techniques used to solve the problem and performance
measures.
10
Chapter 4 will review on the background of the company. The company s
profile, policies, current layout structure will be described. The problem
identification will also be discussed. Cross over diagrams, process flow mapping and
travelling cost calculation will be utilized to describe the problem of the production
line.
Chapter 5 will adopt the Systematic Layout Planning (SLP) methodology to
generate preliminary proposed layout alternatives to the current production line.
Chapter 6 will be the data analysis and modeling. Cycle time data will be
collected and the distribution for each product will be determined. The existing and
proposed layout will be modeled. Verification and validation of the model will be
included as well.
Chapter 7 will discuss on the simulations experiments which also covers the
results generated for the existing layout and the proposed layout. The results of the
simulation using ARENA are discussed. The comparisons of the existing model and
the improved model will be conducted
Chapter 8 will discuss on the best model (layout) to be selected It will
summarize the findings from this study and recommendation for future work will be
proposed.
11
1.9 Conclusion
In the beginning of this chapter, an overview of the facilities layout planning
and its importance to existing companies is written to further enhance the importance
for using it as the main principle for this project. The objectives are also defined to be
linked to the deliverables in this case study. The boundary of this project is also
defined based on the statement of problem .Some justifications of conducting this
case study and its importance is also discussed. At the end of this chapter, the overall
structure of the thesis is stated to provide the reader a helicopter s view of the whole
thesis.
Subsequently, the literature review of facilities planning, SLP and simulation
will be discussed in the following chapter to further enhance the reader s
understanding.


