
EXPERIMENTAL SITE WIND AVAILABILITY
STUDY FOR
TSEUNG KWAN O, HONG KONG
INVESTIGATION REPORT WWTF016-2009 August 2009
Submitted to Department of Architecture,
The Chinese University of Hong Kong
i
EXECUTIVE SUMMARY
At the request of the Department of Architecture, The Chinese University of Hong
Kong, on behalf of Planning Department of The Government of Hong Kong Special
Administrative Region, a study of wind availability and characteristics for a
nominated Study Area in Tseung Kwan O was conducted by the CLP Power
Wind/Wave Tunnel Facility (WWTF) at The Hong Kong University of Science and
Technology, as part of the “Urban Climate Map and Standards for Wind
Environment – Feasibility Study”. The study was undertaken in accordance with the
requirements stipulated in the Australasian Wind Engineering Society Quality
Assurance Manual, AWES-QAM-1-2001 (2001) and the American Society of Civil
Engineers Manual and Report on Engineering Practice No. 67 for Wind Tunnel
Studies of Buildings and Structures (1999). The study was also conducted in
accordance with the recommendations of Planning Department’s Feasibility Study for
Establishment of Air Ventilation Assessment System – Final Report (2005) and
Technical Guide for Air Ventilation Assessment for Developments in Hong Kong
(2006).
A 1:2000 scale topography study was undertaken to determine the effects of local
topography and the surrounding urban environment on mean wind direction, mean
wind speed and turbulence intensity at a nominated Study Area in Tseung Kwan O.
A miniature dynamic pressure (Cobra) probe was used to take measurements of the
longitudinal, lateral and vertical components of wind speed, at 22.5° increments for
the full 360° azimuth, i.e. for sixteen (16) wind directions, and at nine (9) elevations
to determine profiles of mean wind speed and turbulence intensity above the Study
Area. The results will be used as input boundary conditions for subsequent detailed
benchmarking studies. The 1:2000 scale topographical model included the
surrounding area up to a distance of approximately 10 km from the Study Area.
The topography study results were combined with WWTF’s statistical model of the
Hong Kong non-typhoon wind climate, based on measurements of non-typhoon winds
taken by Hong Kong Observatory at Waglan Island during the period of 1953 – 2006

ii
inclusive, to determine wind roses corresponding to annual and summer mean wind
speeds at the Study Area.
In general, the annual prevailing and summer wind characteristics corresponding to
non-typhoon winds at an elevation of 500 mPD above the Tseung Kwan O Study
Area were similar to the overall characteristics of non-typhoon winds approaching the
Hong Kong region, although the magnitudes of the directional wind speeds were
slightly affected by topographical effects.
Significant reductions in the measured magnitudes of wind speed below an elevation
of 200 mPD were mainly caused by the mountains to the southwest to northwest of
the Study Area. Those mountains significantly affected the directional characteristics
for wind directions of 202.5º, 225º, 247.5°, 270º, 315° and 337.5°. Winds
approaching the Study Area from 90° were the least affected due to the relatively
open sea exposure at Silverstrand.

iii
TABLE OF CONTENTS
1 INTRODUCTION 1
2 ANALYSIS OF THE HONG KONG WIND CLIMATE 2
3 WIND TUNNEL STUDY 5
3.1 Modelling the Natural Wind 5
3.2 Physical Model of the Study Area 8
3.3 Experimental and Analysis Procedures 9
4 EXPERIMENTAL RESULTS AND DISCUSSION 10
4.1 Wind characteristics of the Tseung Kwan O Study Area 11
5 CONCLUSIONS 14
6 REFERENCES 16
APPENDIX A TABULATED RESULTS FOR TSEUNG KWAN O 50
APPENDIX B AXIS SYSTEM OF THE COBRA PROBE 58

iv
LIST OF FIGURES
Figure 1: Tseung Kwan O Study Area 20
Figure 2: Location of the Tseung Kwan O Study Area 21
Figure 3: Wind rose for annual non-typhoon winds, Waglan
Island, corrected to 500 mPD above open sea, 1953-
2006 22
Figure 4: Wind rose for summer non-typhoon winds, Waglan
Island corrected to 500 mPD above open sea, 1953-
2006 23
Figure 5: Wind tunnel test sections at the CLP Power Wind/Wave
Tunnel Facility 24
Figure 6: Simulated mean wind speed and turbulence intensity
profiles of approach wind 25
Figure 7: Longitudinal turbulence spectrum of approach wind 25
Figure 8: 1:2000 scale topographical model of Tseung Kwan O in
low speed test section of the CLP Power Wind/Wave
Tunnel Facility 26-27
Figure 9a: Wind characteristics for Tseung Kwan O, 22.5° 28
Figure 9b: Mean wind directions for Tseung Kwan O, 22.5° 28
Figure 10a: Wind characteristics for Tseung Kwan O, 45° 29
Figure 10b: Mean wind directions for Tseung Kwan O, 45° 29
Figure 11a: Wind characteristics for Tseung Kwan O, 67.5° 30
Figure 11b: Mean wind directions for Tseung Kwan O, 67.5° 30
Figure 12a: Wind characteristics for Tseung Kwan O, 90° 31
Figure 12b: Mean wind directions for Tseung Kwan O, 90° 31
Figure 13a: Wind characteristics for Tseung Kwan O, 112.5° 32
Figure 13b: Mean wind directions for Tseung Kwan O, 112.5° 32
Figure 14a: Wind characteristics for Tseung Kwan O, 135° 33
Figure 14b: Mean wind directions for Tseung Kwan O, 135° 33
Figure 15a: Wind characteristics for Tseung Kwan O, 157.5° 34
Figure 15b: Mean wind directions for Tseung Kwan O, 157.5° 34
Figure 16a: Wind characteristics for Tseung Kwan O, 180° 35
Figure 16b: Mean wind directions for Tseung Kwan O, 180° 35

v
Figure 17a: Wind characteristics for Tseung Kwan O, 202.5° 36
Figure 17b: Mean wind directions for Tseung Kwan O, 202.5° 36
Figure 18a: Wind characteristics for Tseung Kwan O, 225° 37
Figure 18b: Mean wind directions for Tseung Kwan O, 225° 37
Figure 19a: Wind characteristics for Tseung Kwan O, 247.5° 38
Figure 19b: Mean wind directions for Tseung Kwan O, 247.5° 38
Figure 20a: Wind characteristics for Tseung Kwan O, 270° 39
Figure 20b: Mean wind directions for Tseung Kwan O, 270° 39
Figure 21a: Wind characteristics for Tseung Kwan O, 292.5° 40
Figure 21b: Mean wind directions for Tseung Kwan O, 292.5° 40
Figure 22a: Wind characteristics for Tseung Kwan O, 315° 41
Figure 22b: Mean wind directions for Tseung Kwan O, 315° 41
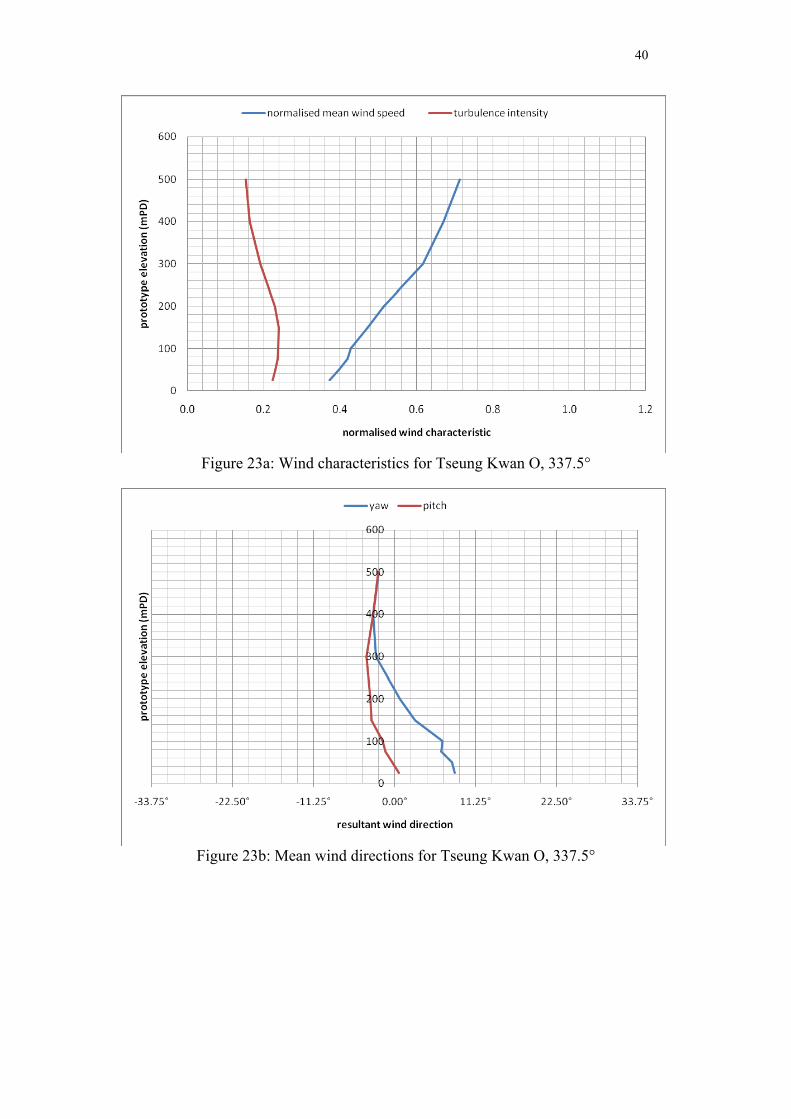
Figure 23a: Wind characteristics for Tseung Kwan O, 337.5° 42
Figure 23b: Mean wind directions for Tseung Kwan O, 337.5° 42
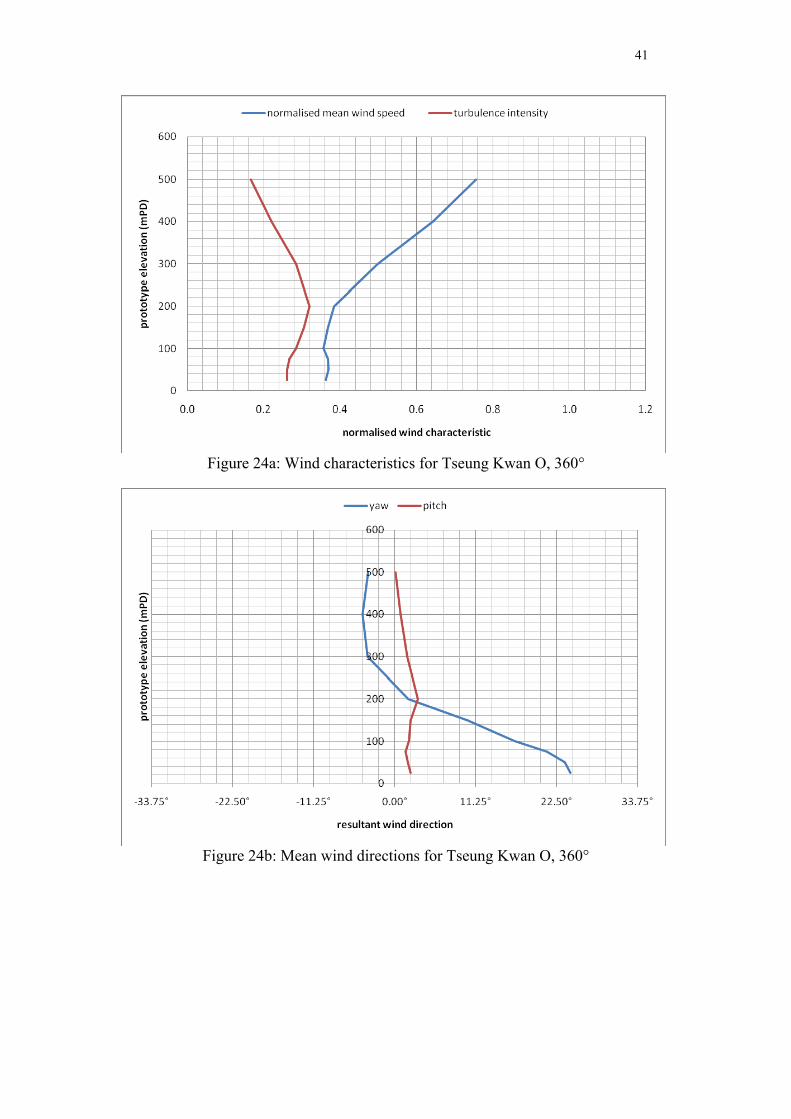
Figure 24a: Wind characteristics for Tseung Kwan O, 360° 43
Figure 24b: Mean wind directions for Tseung Kwan O, 360° 43
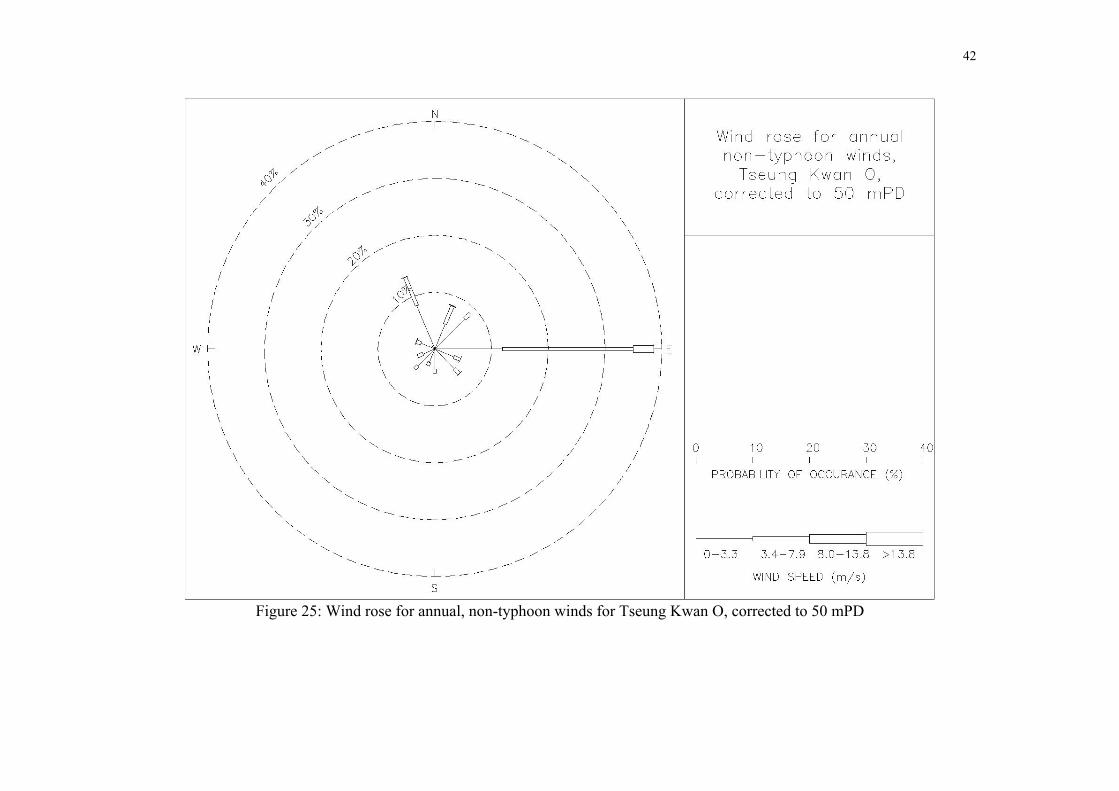
Figure 25: Wind rose for annual, non-typhoon winds for Tseung
Kwan O, corrected to 50 mPD 44
Figure 26: Wind rose for annual, non-typhoon winds for Tseung
Kwan O, corrected to 100 mPD 45
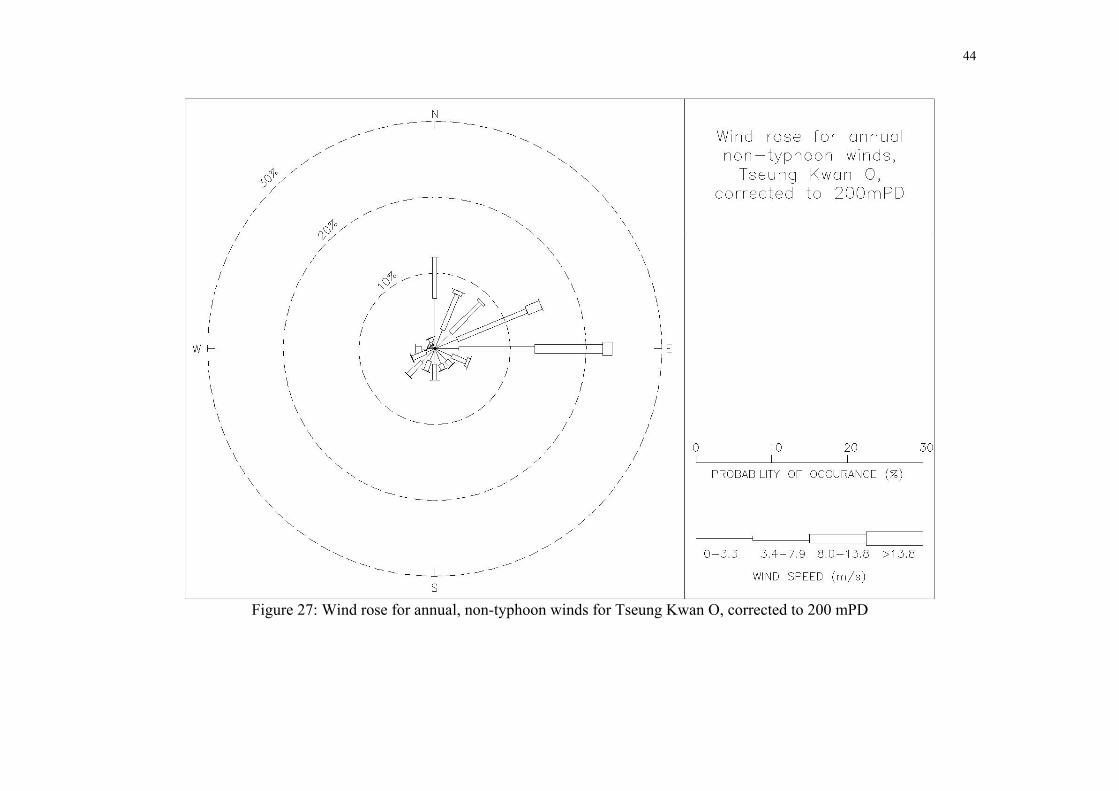
Figure 27: Wind rose for annual, non-typhoon winds for Tseung
Kwan O, corrected to 200 mPD 46
Figure 28: Wind rose for annual, non-typhoon winds for Tseung
Kwan O, corrected to 500 mPD 47
Figure 29: Wind rose for summer, non-typhoon winds for Tseung
Kwan O, corrected to 50 mPD 48
Figure 30: Wind rose for summer, non-typhoon winds for Tseung
Kwan O, corrected to 100 mPD 49
Figure 31: Wind rose for summer, non-typhoon winds for Tseung
Kwan O, corrected to 200 mPD 50
Figure 32: Wind rose for summer, non-typhoon winds for Tseung
Kwan O, corrected to 500 mPD 51

vi
LIST OF TABLES
Table A1: Site wind characteristics of Tseung Kwan O at 22.5° 50
Table A2: Site wind characteristics of Tseung Kwan O at 45° 50
Table A3: Site wind characteristics of Tseung Kwan O at 67.5° 50
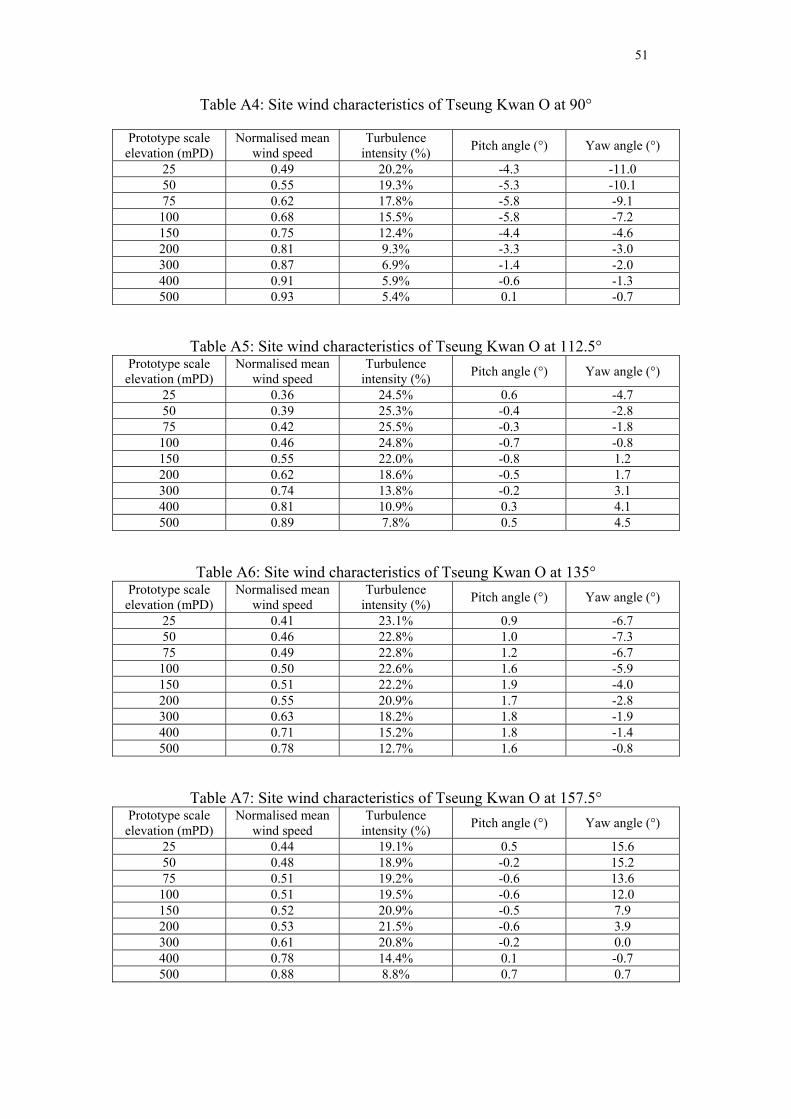
Table A4: Site wind characteristics of Tseung Kwan O at 90° 51
Table A5: Site wind characteristics of Tseung Kwan O at 112.5° 51
Table A6: Site wind characteristics of Tseung Kwan O at 135° 51
Table A7: Site wind characteristics of Tseung Kwan O at 157.5° 51
Table A8: Site wind characteristics of Tseung Kwan O at 180° 52
Table A9: Site wind characteristics of Tseung Kwan O at 202.5° 52
Table A10: Site wind characteristics of Tseung Kwan O at 225° 52
Table A11: Site wind characteristics of Tseung Kwan O at 247.5° 52
Table A12: Site wind characteristics of Tseung Kwan O at 270° 53
Table A13: Site wind characteristics of Tseung Kwan O at 292.5° 53
Table A14: Site wind characteristics of Tseung Kwan O at 315° 53
Table A15: Site wind characteristics of Tseung Kwan O at 337.5° 53
Table A16: Site wind characteristics of Tseung Kwan O at 360° 54
Table A17: Percentage occurrence for annual, non-typhoon directional winds at
50 mPD 54
Table A18: Percentage occurrence for annual, non-typhoon directional winds at
100 mPD 54
Table A19: Percentage occurrence for annual, non-typhoon directional winds at
200 mPD 55
Table A20: Percentage occurrence for annual, non-typhoon directional winds at
500 mPD 55
Table A21: Percentage occurrence for summer, non-typhoon directional winds
at 50 mPD 56
Table A22: Percentage occurrence for summer, non-typhoon directional winds
at 100 mPD 56
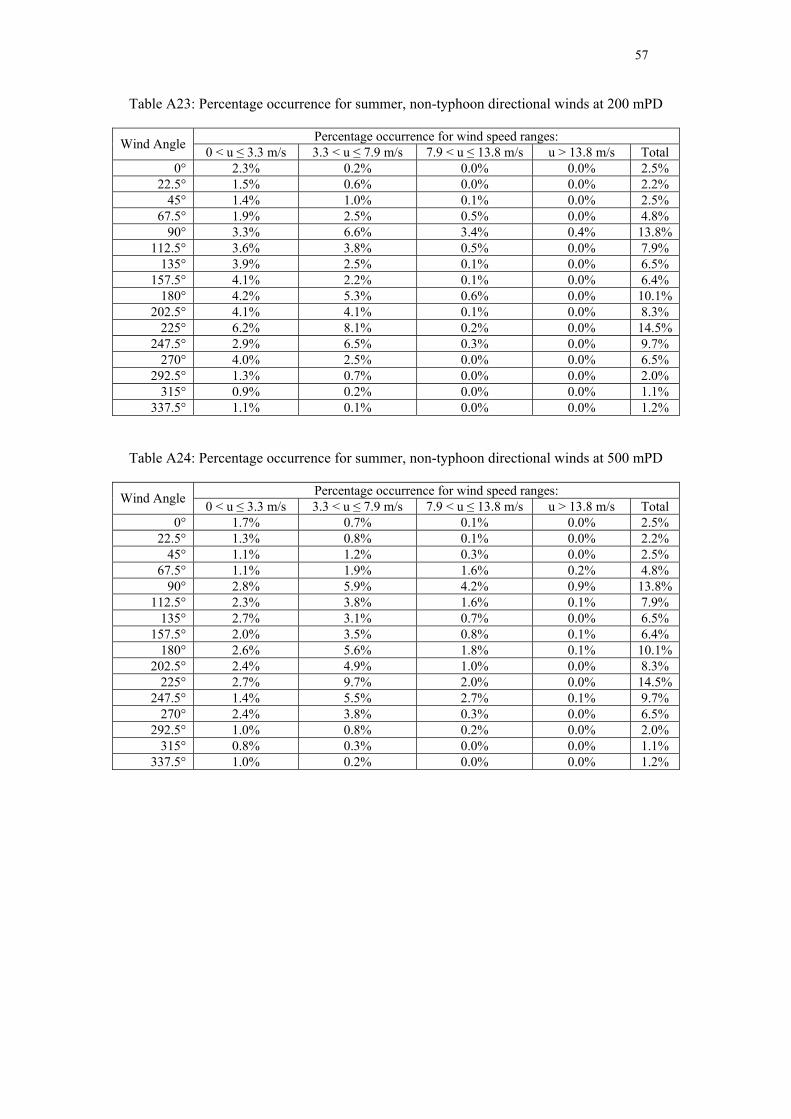
Table A23: Percentage occurrence for summer, non-typhoon directional winds
at 200 mPD 57
Table A24: Percentage occurrence for summer, non-typhoon directional winds
at 500 mPD 57

vii
1
1 INTRODUCTION
At the request of the Department of Architecture, The Chinese University of Hong
Kong, on behalf of Planning Department of The Government of Hong Kong Special
Administrative Region, a study of wind availability and characteristics was conducted
by the CLP Power Wind/Wave Tunnel Facility (WWTF) at The Hong Kong
University of Science and Technology for a nominated Study Area in Tseung Kwan O,
as part of the “Urban Climate Map and Standards for Wind Environment – Feasibility
Study”. The study was undertaken in accordance with the requirements stipulated in
the Australasian Wind Engineering Society Quality Assurance Manual, AWES-
QAM-1-2001 (2001) and the American Society of Civil Engineers Manual and Report
on Engineering Practice No. 67 for Wind Tunnel Studies of Buildings and Structures
(1999). The study was also conducted in accordance with the recommendations of
Planning Department’s Feasibility Study for Establishment of Air Ventilation
Assessment System – Final Report (2005) and Technical Guide for Air Ventilation
Assessment for Developments in Hong Kong (2006).
The Study Area of Tseung Kwan O, centred close to the S.T.F.A. Leung Kit Wah
Primary School, has a diameter of approximately 1000 m, as shown in Figures 1 and 2.
A 1:2000 scale topography study was undertaken to determine the effects of local
topography and the surrounding urban environment on mean wind speeds and
turbulence intensities at the Study Area. The topography study results were combined
with WWTF’s statistical model of the Hong Kong non-typhoon wind climate, based
on measurements of non-typhoon winds taken by Hong Kong Observatory at Waglan
Island during the period of 1953 – 2006 inclusive, to determine site-specific annual
and summer wind roses for hourly mean wind speeds.

2
2 ANALYSIS OF THE HONG KONG WIND CLIMATE
Waglan Island, located approximately 5 km southeast of Hong Kong Island, has been
used by Hong Kong Observatory (HKO), formerly The Royal Observatory, Hong
Kong, for the collection of long-term wind data since December 1952. Due to its
location, relative lack of development over the past 50 years and its generally
uninterrupted exposure to winds, data collected at Waglan Island is considered to be
of the highest quality available for wind engineering purposes in Hong Kong and
representative of winds approaching the Hong Kong region. Wind speed and
direction measurements at Waglan Island are essentially free from the interference
effects of nearby developments and they can be position corrected to account for the
effects of the location and height of the anemometer stations and the effects of the
surrounding topography and buildings.
Waglan Island wind records have been analysed previously in studies of the Hong
Kong wind climate, most notably by Davenport et al. (1984), Melbourne (1984) and
Hitchcock et al. (2003). Melbourne (1984) conducted wind tunnel model studies to
determine directional factors relating wind speeds at each anemometer location to the
wind speed at an elevation equivalent to 50 mPD in the free stream flow and
concluded that:
• Measurements taken during the period 1 January 1964 to 11 July 1966
inclusive were directly and adversely affected by the effects of the building on
which it was mounted; therefore, records from that period were excluded from
that study.

3
• The anemometer correction factors for mean wind speeds show some
sensitivity to the modelled approach flow but they are not strongly dependent
on the modelled approach profiles.
• The largest magnitude speed-up effects occur for winds approaching from
approximately 67.5°, 180°, 270° and 360°.
• The largest magnitude slow-down effects occur for winds approaching from
approximately 112.5°, 225° and 315°.
In the study conducted by Hitchcock et al. (2003), wind tunnel tests were undertaken
to correct wind records for position and topographical effects at the four anemometer
locations used since 1952, with the exception of the location used during the period 1
January 1964 to 11 July 1966 inclusive. In that study, thermal (hotwire) anemometer
measurements were taken at 22.5° intervals for the full 360° azimuth relating wind
speeds at anemometer height to wind speeds at an elevation equivalent to 200 mPD in
the free stream. The directional characteristics of the former anemometer sites were
found to be similar to those discussed by Davenport et al. (1984) and Melbourne
(1984), whereas the current anemometer site is much less affected than its
predecessors, due mainly to its additional height.
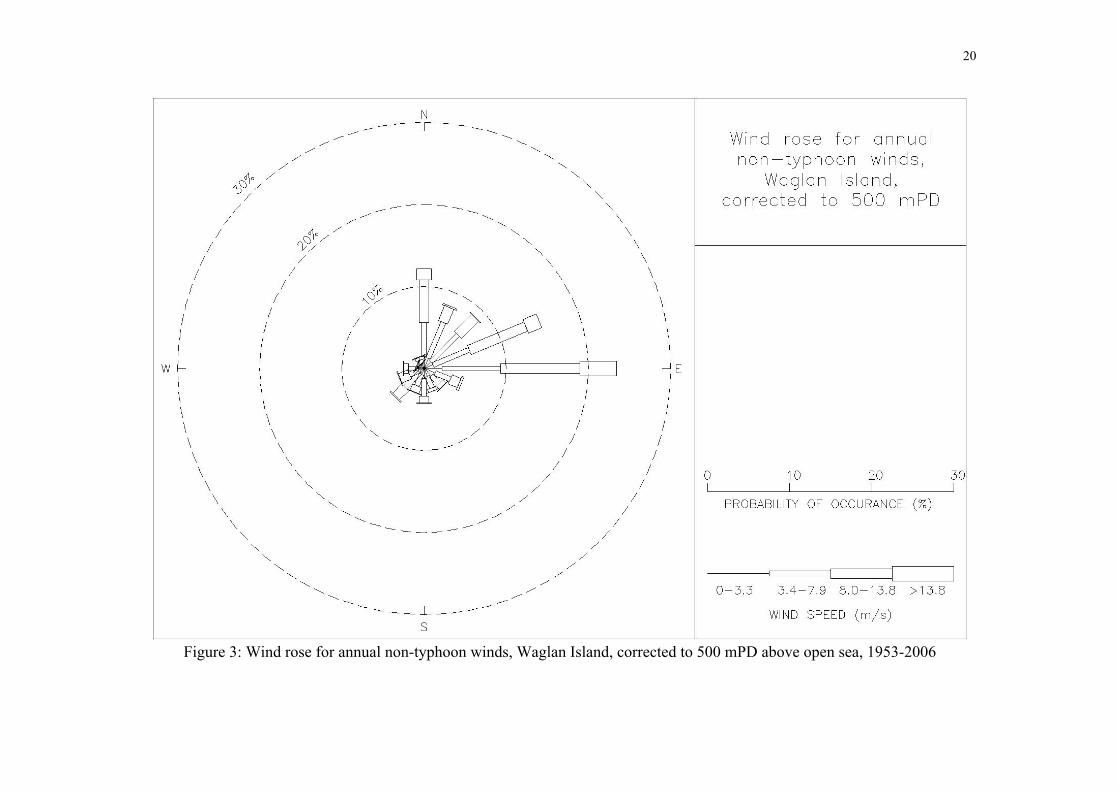
Correction factors were determined and subsequently applied to non-typhoon wind
data collected at Waglan Island to determine a probability distribution of directional
mean wind speeds for Hong Kong. The corresponding annual wind rose for mean
wind speeds at an elevation equivalent to 500 mPD above open sea is presented in
Figure 3 and indicates that, on an annual basis, prevailing and strong non-typhoon
winds approaching Hong Kong occur mainly from the north-east quadrant and, to a

4
lesser extent, the south-west. The summer (i.e. June, July, August) wind rose for
mean wind speeds at an elevation equivalent to 500 mPD above open sea is presented
in Figure 4. In contrast to the corresponding annual wind rose, prevailing and strong
non-typhoon winds approaching Hong Kong during summer months occur mainly
from the south-east and south-west quadrants.
In Figures 3 and 4, mean wind speeds are segregated into four categories (0 – 3.3 m/s,
3.4 – 7.9 m/s, 8.0 – 13.8 m/s and greater than 13.8 m/s) that are indicated by the
thickness of the bars for the 16 cardinal wind directions. The length of the bars
indicates the average percentage of occurrence per year. For example, Figure 3
illustrates that, on an annual basis, east winds occur approximately 24% of the time
and hourly mean wind speeds exceed 13.8 m/s approximately 6% of the time at an
elevation of 500 mPD.

5
3 WIND TUNNEL STUDY
The wind tunnel test techniques used in this investigation are in accordance with the
procedures and recommendations of the Australasian Wind Engineering Society
Quality Assurance Manual, AWES QAM-1-2001 (2001) and the American Society of
Civil Engineers Manual and Report on Engineering Practice No. 67 for Wind Tunnel
Studies of Buildings and Structures (1999). Those requirements cover the satisfactory
modelling of the turbulent natural wind, the accuracy of the wind tunnel models,
experimental and analysis procedures, and quality assurance.
3.1 Modelling the Natural Wind
Air moving relative to the Earth’s surface has frictional forces imparted on it, which
effectively cause it to be slowed down. These forces have a decreasing effect on
airflow as the height above ground increases, generally resulting in mean wind speed
increasing with height to a point where the effects of surface drag become negligible.
In wind engineering, a convenient measure of the thickness of the atmospheric
boundary layer is commonly referred to as the gradient height, which will vary
depending on the surrounding surface roughness over which the air will flow.
Obstacles to air flow can vary from relatively large expanses of smooth, open water,
to vegetation such as forests, built-up environments such as city centres, and large,
rugged mountain ranges. The resulting gradient heights typically vary from several
hundred metres to in excess of 1000 m.
Winds within the atmospheric boundary layer are usually highly turbulent or gusty.
Turbulence intensity is a measure of the gustiness of wind due to eddies and vortices

6
generated by frictional effects at surface level, the roughness of the terrain over which
air is flowing and convective effects due to opposing movements of air masses of
different temperature. In typical atmospheric boundary layer flow, turbulence
intensity generally decreases with height. Closer to the ground, at pedestrian level for
example, the magnitude of the turbulence intensity can be very large due to the effects
of wind flowing around buildings and other structures.
In conducting wind tunnel model studies of wind characteristics and wind effects on
and around tall buildings and other structures on the surface of the Earth, it is
necessary to adequately simulate the relevant characteristics of atmospheric boundary
layer flow. WWTF’s boundary layer wind tunnel test sections can be used to simulate
atmospheric boundary layer flow over various types of terrain, ranging from open
terrain, such as open water, to urban or mountainous terrain.
WWTF comprises two long fetch boundary layer wind tunnel test sections as shown
in Figure 5. The 28 m long high speed test section has a 3 m wide × 2 m high
working section and a maximum free stream wind speed of approximately 30 m/s.
The 40 m long low speed test section has a 5 m wide × 4 m high working section and
a maximum free-stream wind speed of approximately 10 m/s. Various terrains can be
modelled in either test section at length scales ranging from approximately 1:5000 to
1:50.
The characteristics of the wind flow in the low speed test section can be modified
through the use of devices such as spires, grids, and fences to model various
atmospheric boundary layer flows. For the current study, WWTF’s low speed test
section was calibrated by using various roughness elements to simulate the wind

7
speed and turbulence intensity characteristics corresponding to wind flow above open
water. The mean wind speed profile of the wind flow approaching the Study Area
was simulated in accordance with the power law expression, defined in Equation (1),
specified in Planning Department’s Feasibility Study for Establishment of Air
Ventilation Assessment System – Final Report (2005).
α
refopenref,
openz,
zz
VV
⎟⎟⎠
⎞⎜⎜⎝
⎛= (1)
where
Vz,open = mean wind speed at a height z above open water terrain (m/s);
Vref,open = mean wind speed at a height zref above open water terrain (m/s);
z = height above zero plane displacement height (m);
zref = a suitable reference height above open water terrain (m);
α = a power law exponent, which is a constant commensurate with the terrain
roughness, taken as 0.15 for this study.
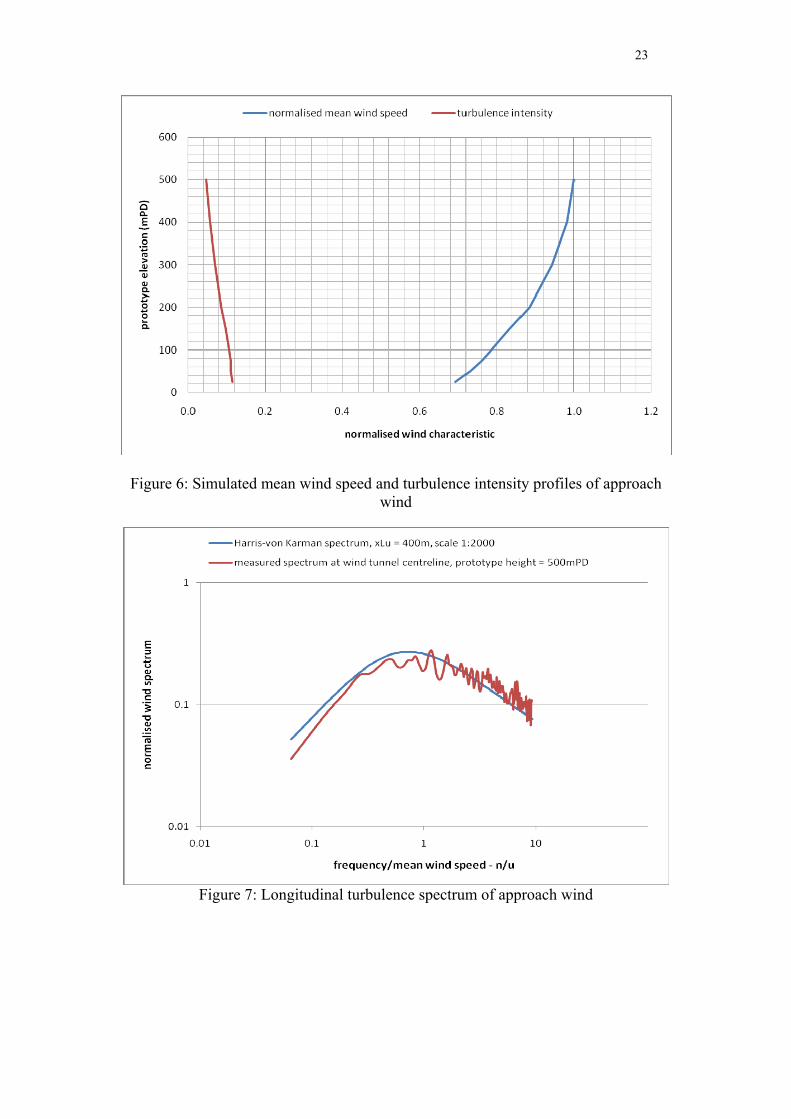
The turbulence intensity profile of the approaching wind flow was simulated in
accordance with Terrain category 2 stipulated in Australian/New Zealand Standard
AS/NZS 1170.2:2002, i.e. corresponding to non-typhoon wind flow above rough open
water surfaces.
The simulated mean wind speed and turbulence intensity profiles were generally
within ±10% of the target mean speed and turbulence intensity profiles and they are
presented in Figure 6. The spectrum of longitudinal turbulence of the approaching

8
wind flow measured at an elevation equivalent to 500 mPD in prototype scale is
presented in Figure 7.
3.2 Physical Model of the Study Area
WWTF has a 1:2000 scale topographical model of the New Territories, Kowloon and
Hong Kong Island fabricated at 20 m contour intervals from information acquired
from the Survey and Mapping Office of The Government of the Hong Kong Special
Administrative Region (HKSAR) Lands Department. The relevant sections of the
topographical model were updated to include all known current buildings and the
major topographical features in the urban landscapes of Hong Kong Island, Kowloon
Peninsula and the New Territories. For all wind directions tested, the wind tunnel
model included surrounding areas within a distance of up to approximately 10 km
from the Study Area.
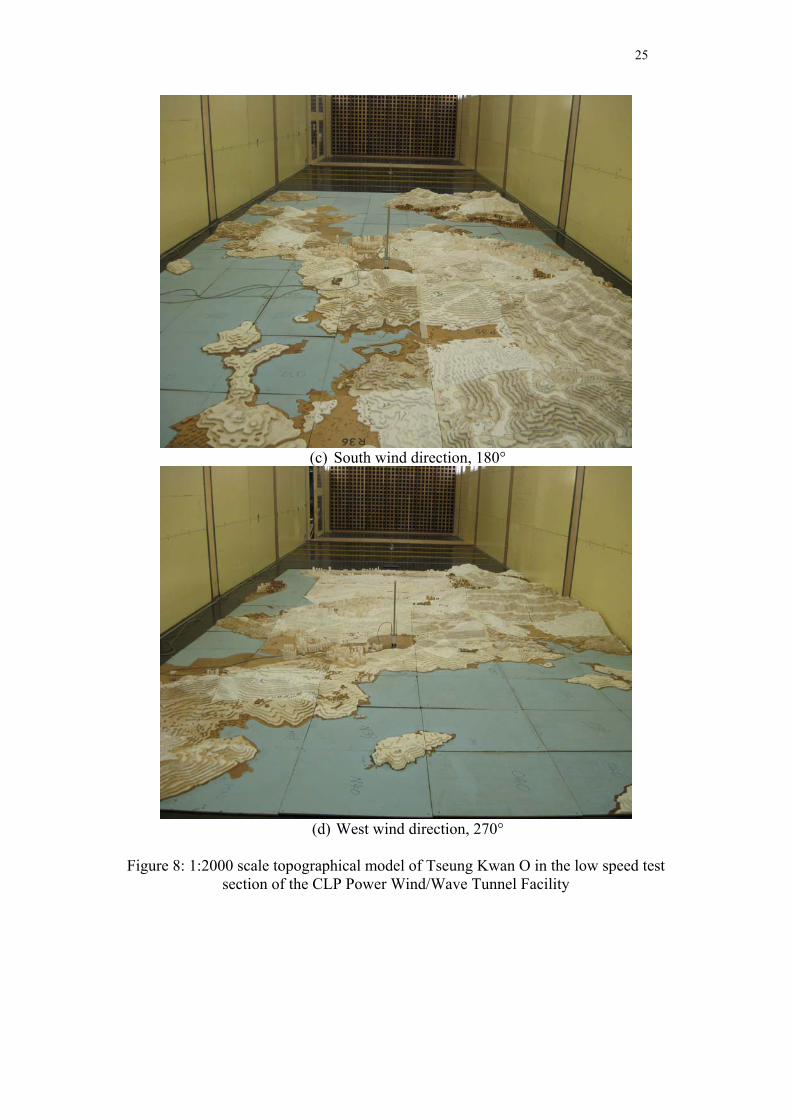
The topographical model was updated to include greater detail within a zone from 500
m up to approximately 1000 m from the Study Area. In accordance with information
supplied by the Department of Architecture of The Chinese University of Hong Kong
during the period between 13 January 2009 to 10 March 2009, all specified committed
developments and all known existing buildings and structures at the time of testing
were included in the model to represent their effects on wind flow approaching the
Study Area. Beyond the 1000 m radius, the topographical model included roughness
representative of the surrounding areas. A representative view of the 1:2000 scale
topographical model used in the current study is shown in Figure 8.

9
3.3 Experimental and Analysis Procedures
The terrain surrounding the Study Area comprises complex mixtures of open water,
urban and built-up environment, and mountainous areas on New Territories, Kowloon
Peninsula and Hong Kong Island. Winds approaching the modelled region were
scaled to simulate non-typhoon winds flowing over open water and the topographical
model was used to determine the modifying effects of the surrounding complex
terrain on the wind speed and turbulence intensity above the Study Area.
Wind tunnel measurements were taken using a miniature dynamic pressure probe, a
Cobra probe manufactured by Turbulent Flow Instrumentation Pty Ltd, at 22.5°
intervals for the full 360° azimuth (i.e. 16 wind directions), where a wind direction of
0° or 360° corresponds to an incident wind approaching the Study Area directly from
the north, 90° corresponds to an incident wind approaching the Study Area directly
from the east, etc. For each wind direction tested, mean wind speeds and turbulence
intensities were measured at elevations equivalent to 25, 50, 75, 100, 150, 200, 300,
400 and 500 mPD in prototype scale, above the centre of the Study Area.
While measurements were taken at the Study Area, all buildings within a diameter of
1000 m of the centre of the Study Area were removed from the wind tunnel model for
all measured wind directions. All buildings within the diameter of 1000 m will be
included in the proximity model for the 1:400 scale detailed benchmarking study to
directly account for their effects on the wind flow within the Study Area.
10
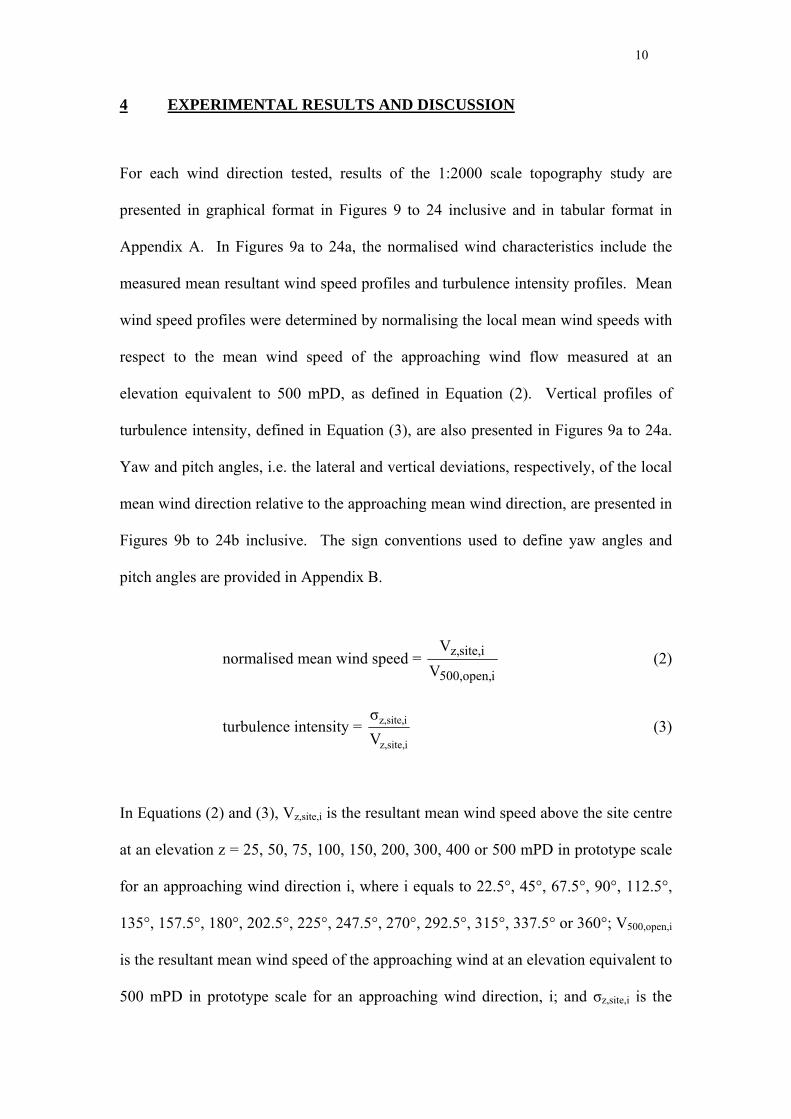
4 EXPERIMENTAL RESULTS AND DISCUSSION
For each wind direction tested, results of the 1:2000 scale topography study are
presented in graphical format in Figures 9 to 24 inclusive and in tabular format in
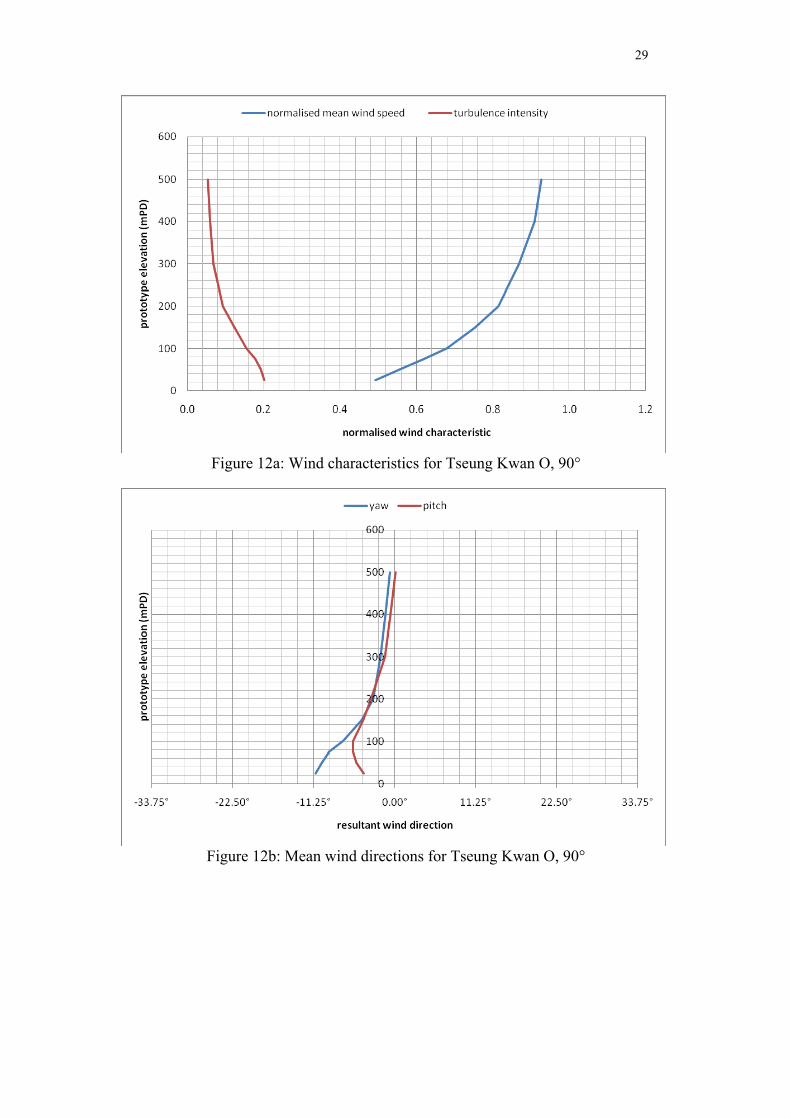
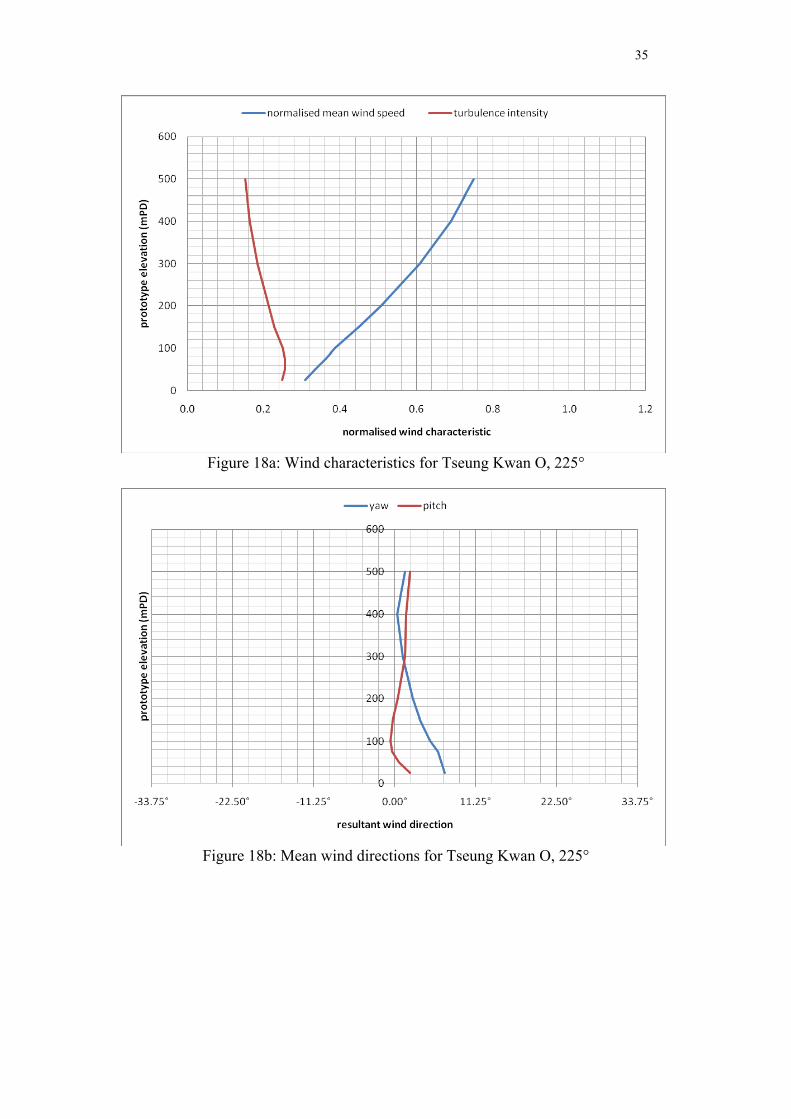
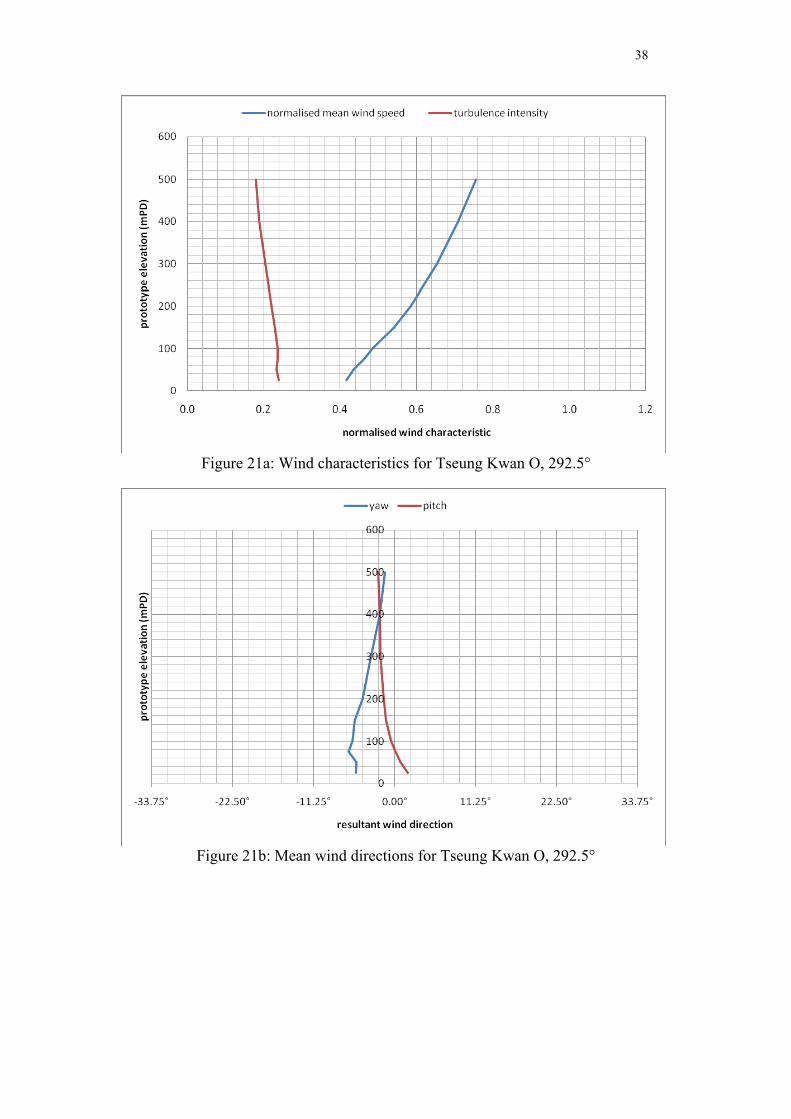
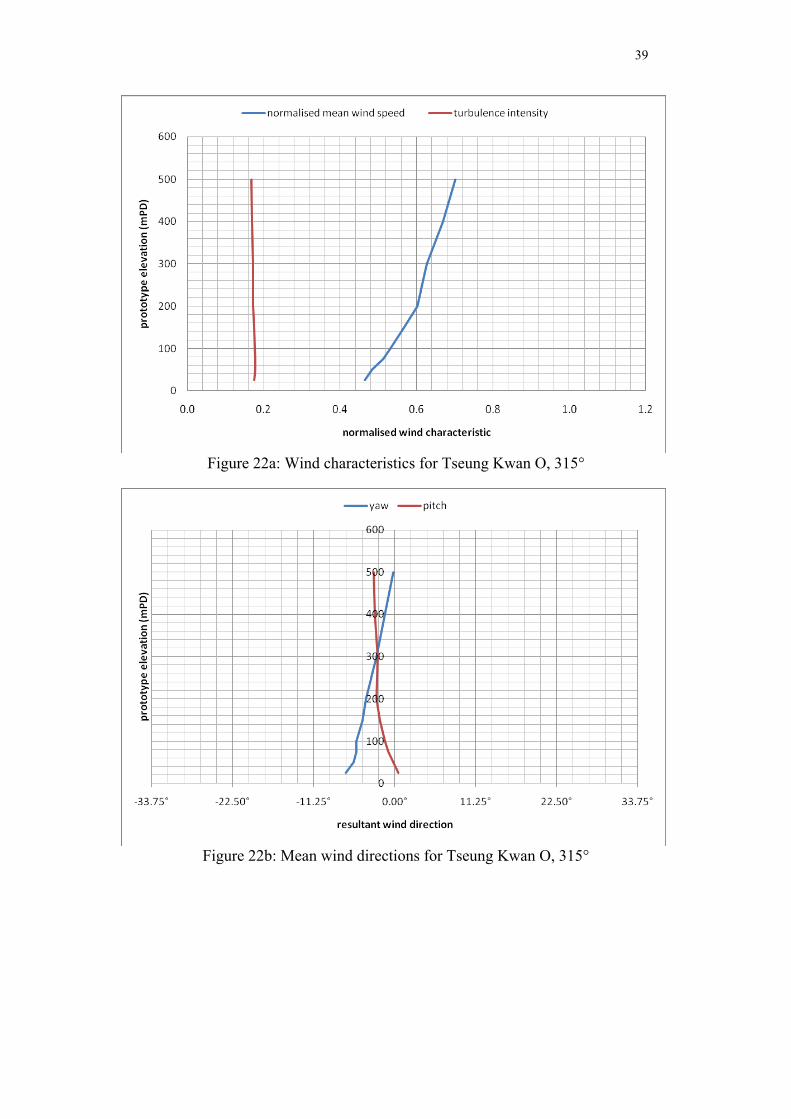
Appendix A. In Figures 9a to 24a, the normalised wind characteristics include the
measured mean resultant wind speed profiles and turbulence intensity profiles. Mean
wind speed profiles were determined by normalising the local mean wind speeds with
respect to the mean wind speed of the approaching wind flow measured at an
elevation equivalent to 500 mPD, as defined in Equation (2). Vertical profiles of
turbulence intensity, defined in Equation (3), are also presented in Figures 9a to 24a.
Yaw and pitch angles, i.e. the lateral and vertical deviations, respectively, of the local
mean wind direction relative to the approaching mean wind direction, are presented in
Figures 9b to 24b inclusive. The sign conventions used to define yaw angles and
pitch angles are provided in Appendix B.
normalised mean wind speed = i500,open,
isite,z,V
V (2)
turbulence intensity = isite,z,
isite,z,
Vσ
(3)
In Equations (2) and (3), Vz,site,i is the resultant mean wind speed above the site centre
at an elevation z = 25, 50, 75, 100, 150, 200, 300, 400 or 500 mPD in prototype scale
for an approaching wind direction i, where i equals to 22.5°, 45°, 67.5°, 90°, 112.5°,
135°, 157.5°, 180°, 202.5°, 225°, 247.5°, 270°, 292.5°, 315°, 337.5° or 360°; V500,open,i
is the resultant mean wind speed of the approaching wind at an elevation equivalent to
500 mPD in prototype scale for an approaching wind direction, i; and σz,site,i is the

11
standard deviation of the fluctuating resultant wind speed above the site for an
approaching wind direction i. The profiles of resultant mean wind speed and
turbulence intensity will be used as input boundary conditions for the detailed
benchmarking study for the Study Area.
The topography study measurements were also used to determine directional factors
for the 16 measured wind directions, relating the mean wind speeds at elevations
equivalent to 50, 100, 200 and 500 mPD above the Study Area to the mean wind
speed of the approach flow at a reference height of 500 mPD. Those directional
factors were then applied to WWTF’s Hong Kong non-typhoon wind climate model,
derived from HKO’s Waglan Island wind data as discussed in Section 2 of this report,
to determine site-specific wind roses pertaining to annual and summer hourly mean
wind speeds at elevations of 50, 100, 200 and 500 mPD above the Study Area. The
annual wind roses are presented in Figures 25 to 28 inclusive for elevations of 50, 100,
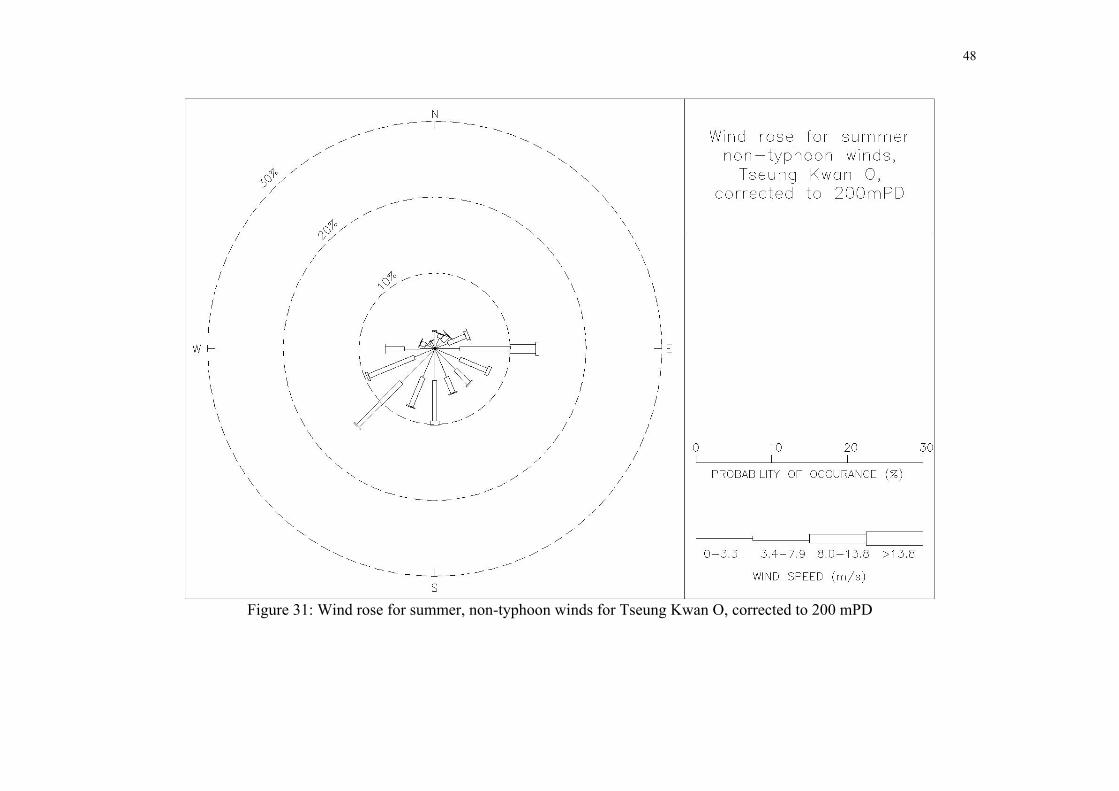
200 and 500 mPD above the Tseung Kwan O Study Area, respectively. The summer
wind roses are presented in Figures 29 to 32 inclusive for elevations of 50, 100, 200
and 500 mPD above the Tseung Kwan O Study Area, respectively. Wind rose data
are presented in tabular format in Appendix A.
4.1 Wind characteristics of the Tseung Kwan O Study Area
The nominated Study Area in Tseung Kwan O is located approximately 1.7 km to the
east of Silverstrand. It is surrounded by mountains ranging from the south to east, as
shown in Figures 1 and 2. The major mountains are Mau Wu Shan, approximately
1.3 km to the south of the Study Area with an elevation of 233 mPD; Black Hill,
approximately 1.9 km to the southwest of the Study Area with an elevation of 304

12
mPD; Tai Sheung Tok, approximately 1.9 km to the west of the Study Area with an
elevation of 419 mPD; Hebe Hill, approximately 2.6 km to the northwest of the Study
Area with an elevation of 346 mPD; and Razor Hill, approximately 1.8 km to the
north of the Study Area with an elevation of 432 mPD. A number of smaller hills,
with elevations ranging from 148 mPD to 196 mPD, are located approximately 0.9
km to the northeast to east of the Study Area. The regions to the southeast of the
Study Area are occupied by medium-rise residential buildings.
Significant overall reductions to the magnitude of the mean wind speed profiles were
measured for wind directions of 202.5°, 225°, 247.5°, 270°, 292.5°, 315°, 337.5° and
360° (0°) for all measured elevations due to the effects of the surrounding mountains.
The most significant reduction was measured at a wind direction of 270°, with
magnitudes of turbulence intensity of around 28%. This is attributed to the flow
separation created by the topography of Tai Sheung Tok.
For wind directions of 22.5°, 45°, 67.5° and 112.5°, mean wind speeds measured
below an elevation of 200 mPD were reduced significantly, with correspondingly
higher magnitudes of turbulence intensity, which is attributed to the hilly terrain to the
north-east of the Study Area. Similar effects were observed at wind directions of
135°, 157.5° and 180°, for which the corresponding mean wind speeds are affected by
a combination of the surrounding mountains and the buildings in Tiu Keng Leng and
Hang Hau.
Winds approaching the Study Area from a direction of 90° are the least affected,
particularly at higher elevations, due to the fetch of open sea at the Silverstrand. At
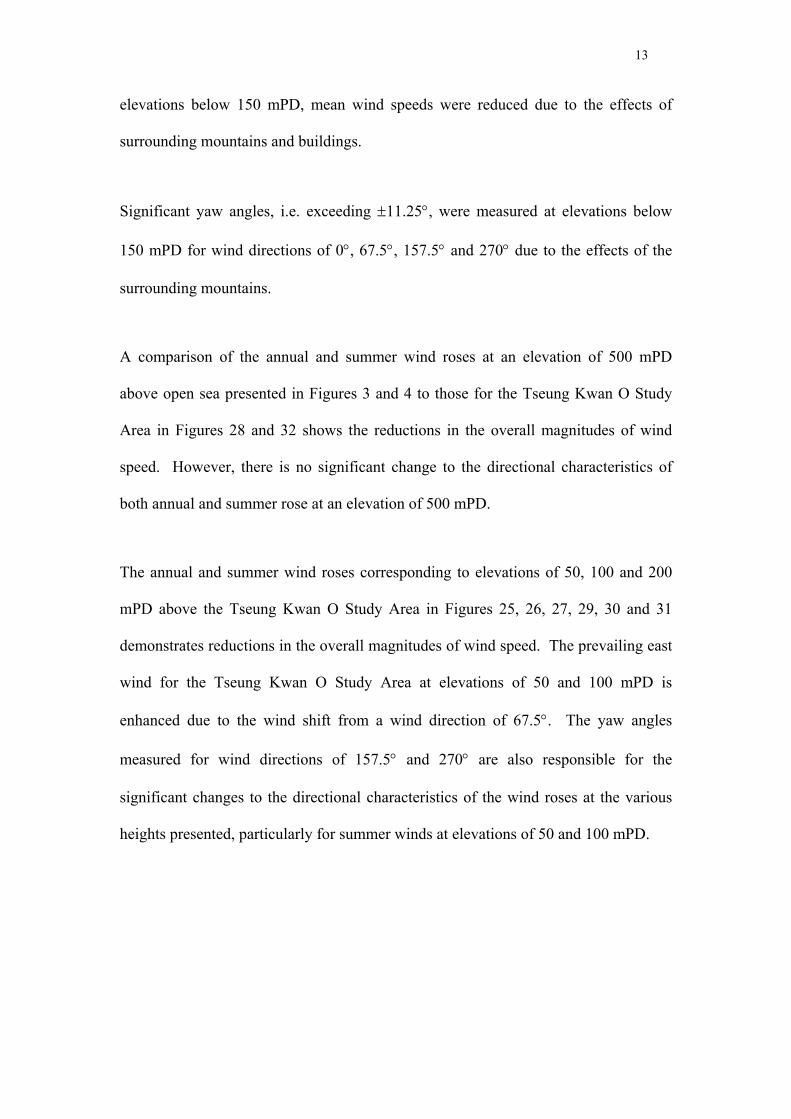
13
elevations below 150 mPD, mean wind speeds were reduced due to the effects of
surrounding mountains and buildings.
Significant yaw angles, i.e. exceeding ±11.25°, were measured at elevations below
150 mPD for wind directions of 0°, 67.5°, 157.5° and 270° due to the effects of the
surrounding mountains.
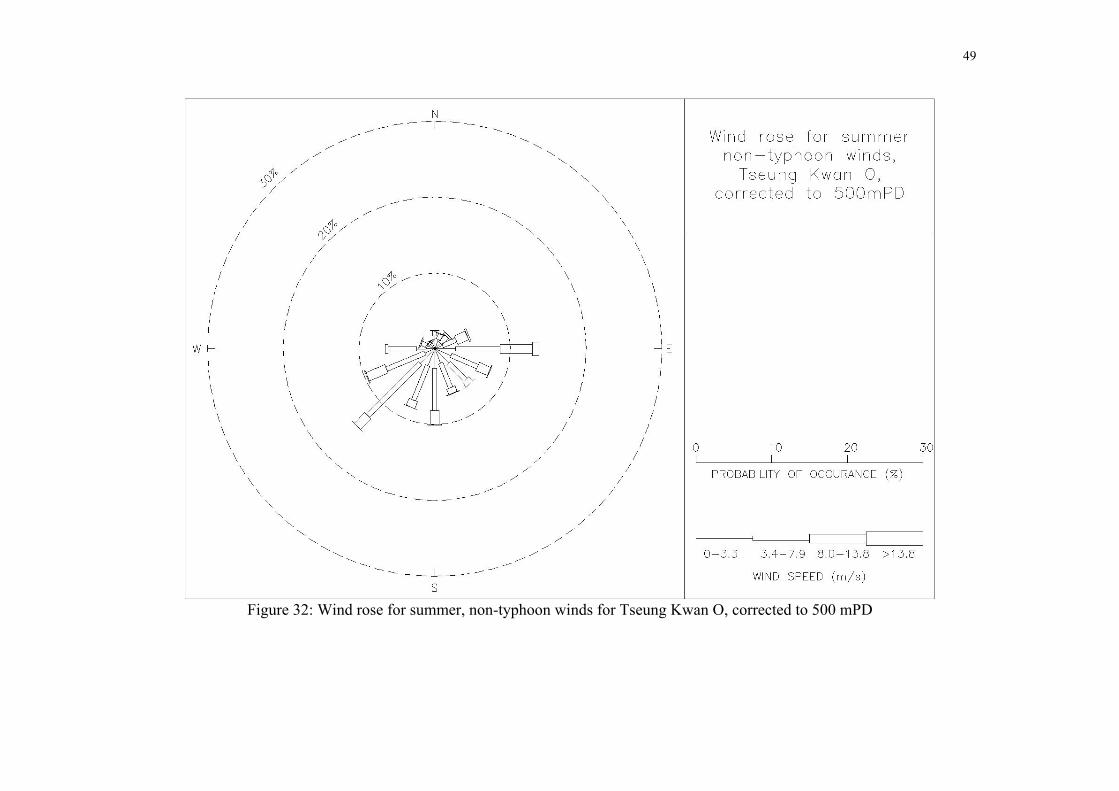
A comparison of the annual and summer wind roses at an elevation of 500 mPD
above open sea presented in Figures 3 and 4 to those for the Tseung Kwan O Study
Area in Figures 28 and 32 shows the reductions in the overall magnitudes of wind
speed. However, there is no significant change to the directional characteristics of
both annual and summer rose at an elevation of 500 mPD.
The annual and summer wind roses corresponding to elevations of 50, 100 and 200
mPD above the Tseung Kwan O Study Area in Figures 25, 26, 27, 29, 30 and 31
demonstrates reductions in the overall magnitudes of wind speed. The prevailing east
wind for the Tseung Kwan O Study Area at elevations of 50 and 100 mPD is
enhanced due to the wind shift from a wind direction of 67.5°. The yaw angles
measured for wind directions of 157.5° and 270° are also responsible for the
significant changes to the directional characteristics of the wind roses at the various
heights presented, particularly for summer winds at elevations of 50 and 100 mPD.
14
5 CONCLUSIONS
A study of wind availability and characteristics was conducted by the CLP Power
Wind/Wave Tunnel Facility at The Hong Kong University of Science and Technology
for the nominated Study Area in Tseung Kwan O as part of the “Urban Climate Map
and Standards for Wind Environment – Feasibility Study”. The study was conducted
at the request of the Department of Architecture, The Chinese University of Hong
Kong, on behalf of Planning Department of The Government of Hong Kong Special
Administrative Region.
A 1:2000 scale topography study was undertaken to determine the effects of local
topography and the surrounding urban environment on mean wind speeds and
turbulence intensities above the Study Area. The topography study results were
subsequently combined with a statistical model of the Hong Kong wind climate,
based on measurements of non-typhoon winds taken by Hong Kong Observatory at
Waglan Island, to determine directional wind characteristics and availability for the
Tseung Kwan O Study Area.
In general, the annual and summer prevailing wind characteristics corresponding to
non-typhoon winds at an elevation of 500 mPD above the Tseung Kwan O Study
Area were similar to the overall characteristics of non-typhoon winds approaching the
Hong Kong region, although the magnitudes of the directional wind speeds were
reduced by the topographical effects.
Significant reductions in the measured magnitudes of wind speed below an elevation
of 200 mPD were caused by the mountains located to the southwest and to the

15
northwest of the Study Area. Those mountains significantly affected the directional
characteristics for wind directions of 202.5º, 225º, 247.5°, 270º, 315° and 337.5°.
Winds approaching the Study Area from 90° were the least affected due to the
relatively open sea exposure at Silverstrand.

16
6 REFERENCES
Australasian Wind Engineering Society (2001), Wind Engineering Studies of
Buildings, AWES-QAM-1-2001.
Buildings Department (HKSAR) (2004), Code of Practice on Wind Effects in Hong
Kong.
Davenport, A.G., Georgiou, P.N., Mikitiuk, M., Surry, D. and Kythe, G. (1984), The
wind climate of Hong Kong, Proceedings of the Third International Conference on
Tall Buildings, Hong Kong and Guangzhou, pp 454 – 460.
Hitchcock, P.A., Kwok, K.C.S. and Yu, C.W. (2003), A study of anemometer
measurements at Waglan Island, Hong Kong, Technical Report WWTF002-2003,
CLP Power Wind/Wave Tunnel Facility, The Hong Kong University of Science and
Technology.
Manual of practice for wind tunnel studies of buildings and structures (1999), Editor
Nicholas Isyumov, Task Committee on Wind Tunnel Testing of Buildings and
Structures, Aerodynamics Committee, Aerospace Division, American Society of Civil
Engineers.
Melbourne, W.H. (1984), Design wind date for Hong Kong and surrounding coastline,
Proceedings of the Third International Conference on Tall Buildings, Hong Kong and
Guangzhou, pp 461 – 467.

17
Planning Department, The Government of the Hong Kong Special Administrative
Region (2005), Feasibility Study for Establishment of Air Ventilation Assessment –
Final Report, Department of Architecture, The Chinese University of Hong Kong.
Planning Department, The Government of the Hong Kong Special Administrative
Region (2006), Technical Guide for Air Ventilation Assessment for Developments in
Hong Kong.
Planning Department, The Government of the Hong Kong Special Administrative
Region (2006), Urban Climatic Map and Standards for Wind Environment-
Feasibility Study (Inception Report), The Chinese University of Hong Kong.
Planning Department, The Government of the Hong Kong Special Administrative
Region (2006), Urban Climatic Map and Standards for Wind Environment-
Feasibility Study (Working Paper 2A: Methodologies of Area Selection for
Benchmarking), The Chinese University of Hong Kong.
Standards Australia/Standards New Zealand (2002), Australia/New Zealand Standard
Structural design actions Part 2: Wind actions, AS/NZS 1170.2:2002.

18
Figure 1: Tseung Kwan O Study Area
Silverstrand
Po Lam MTR Station
Po Lam Estate
S.T.F.A. Leung Kit Wah Primary School
Mau Wu Shan
Black Hill
Tai Sheung Tok
Hebe Hill Razor Hill
Tseung Kwan O Study Area
Tiu Keng Leng
Hang Hau
HKUST
Tseung Kwan O Study Area

19
Figure 2: Location of the Tseung Kwan O Study Area
20
Figure 3: Wind rose for annual non-typhoon winds, Waglan Island, corrected to 500 mPD above open sea, 1953-2006

21
Figure 4: Wind rose for summer non-typhoon winds, Waglan Island corrected to 500 mPD above open sea, 1953-2006

22
Large Scale Test Section
Heat Exchanger
High Speed Test Section
Flow Direction
Flow Direction
FanHoneycomband Screens
61.5 m
16.5
m
3 m x 2 mCross Section
5 m x 4 mCross Section
Purg
e D
oors
Figure 5: Wind tunnel test sections at the CLP Power Wind/Wave Tunnel Facility
23
Figure 6: Simulated mean wind speed and turbulence intensity profiles of approach wind
Figure 7: Longitudinal turbulence spectrum of approach wind

24
(a) North wind direction, 360°
(b) East wind direction, 90°
25
(c) South wind direction, 180°
(d) West wind direction, 270°
Figure 8: 1:2000 scale topographical model of Tseung Kwan O in the low speed test
section of the CLP Power Wind/Wave Tunnel Facility

26
Figure 9a: Wind characteristics for Tseung Kwan O, 22.5°
Figure 9b: Mean wind directions for Tseung Kwan O, 22.5°

27
Figure 10a: Wind characteristics for Tseung Kwan O, 45°
Figure 10b: Mean wind directions for Tseung Kwan O, 45°

28
Figure 11a: Wind characteristics for Tseung Kwan O, 67.5°
Figure 11b: Mean wind directions for Tseung Kwan O, 67.5°
29
Figure 12a: Wind characteristics for Tseung Kwan O, 90°
Figure 12b: Mean wind directions for Tseung Kwan O, 90°

30
Figure 13a: Wind characteristics for Tseung Kwan O, 112.5°
Figure 13b: Mean wind directions for Tseung Kwan O, 112.5°

31
Figure 14a: Wind characteristics for Tseung Kwan O, 135°
Figure 14b: Mean wind directions for Tseung Kwan O, 135°

32
Figure 15a: Wind characteristics for Tseung Kwan O, 157.5°
Figure 15b: Mean wind directions for Tseung Kwan O, 157.5°

33
Figure 16a: Wind characteristics for Tseung Kwan O, 180°
Figure 16b: Mean wind directions for Tseung Kwan O, 180°

34
Figure 17a: Wind characteristics for Tseung Kwan O, 202.5°
Figure 17b: Mean wind directions for Tseung Kwan O, 202.5°
35
Figure 18a: Wind characteristics for Tseung Kwan O, 225°
Figure 18b: Mean wind directions for Tseung Kwan O, 225°

36
Figure 19a: Wind characteristics for Tseung Kwan O, 247.5°
Figure 19b: Mean wind directions for Tseung Kwan O, 247.5°

37
Figure 20a: Wind characteristics for Tseung Kwan O, 270°
Figure 20b: Mean wind directions for Tseung Kwan O, 270°
38
Figure 21a: Wind characteristics for Tseung Kwan O, 292.5°
Figure 21b: Mean wind directions for Tseung Kwan O, 292.5°
39
Figure 22a: Wind characteristics for Tseung Kwan O, 315°
Figure 22b: Mean wind directions for Tseung Kwan O, 315°
40
Figure 23a: Wind characteristics for Tseung Kwan O, 337.5°
Figure 23b: Mean wind directions for Tseung Kwan O, 337.5°
41
Figure 24a: Wind characteristics for Tseung Kwan O, 360°
Figure 24b: Mean wind directions for Tseung Kwan O, 360°
42
Figure 25: Wind rose for annual, non-typhoon winds for Tseung Kwan O, corrected to 50 mPD

43
Figure 26: Wind rose for annual, non-typhoon winds for Tseung Kwan O, corrected to 100 mPD
44
Figure 27: Wind rose for annual, non-typhoon winds for Tseung Kwan O, corrected to 200 mPD

45
Figure 28: Wind rose for annual, non-typhoon winds for Tseung Kwan O, corrected to 500 mPD

46
Figure 29: Wind rose for summer, non-typhoon winds for Tseung Kwan O, corrected to 50 mPD

47
Figure 30: Wind rose for summer, non-typhoon winds for Tseung Kwan O, corrected to 100 mPD
48
Figure 31: Wind rose for summer, non-typhoon winds for Tseung Kwan O, corrected to 200 mPD
49
Figure 32: Wind rose for summer, non-typhoon winds for Tseung Kwan O, corrected to 500 mPD

50
APPENDIX A
TABULATED RESULTS FOR TSEUNG KWAN O
Table A1: Site wind characteristics of Tseung Kwan O at 22.5° Prototype scale
elevation (mPD) Normalised mean
wind speed Turbulence
intensity (%) Pitch angle (°) Yaw angle (°)
25 0.47 24.5% -1.1 -6.0 50 0.51 23.8% -2.6 -6.7 75 0.57 22.3% -3.6 -7.2
100 0.60 21.7% -4.3 -6.6 150 0.67 18.7% -4.7 -5.7 200 0.71 16.8% -4.8 -4.3 300 0.76 13.0% -3.6 -2.3 400 0.80 10.9% -2.1 -1.4 500 0.85 9.8% -1.3 -1.0
Table A2: Site wind characteristics of Tseung Kwan O at 45° Prototype scale
elevation (mPD) Normalised mean
wind speed Turbulence
intensity (%) Pitch angle (°) Yaw angle (°)
25 0.31 27.7% 0.5 4.0 50 0.34 29.1% -0.9 5.3 75 0.40 29.6% -2.6 5.0
100 0.45 28.2% -2.9 5.1 150 0.55 25.1% -3.3 2.9 200 0.63 21.3% -2.9 0.4 300 0.76 14.0% -1.5 -2.1 400 0.81 10.3% -0.2 -1.0 500 0.82 9.5% 0.2 0.1
Table A3: Site wind characteristics of Tseung Kwan O at 67.5° Prototype scale
elevation (mPD) Normalised mean
wind speed Turbulence
intensity (%) Pitch angle (°) Yaw angle (°)
25 0.40 24.6% 0.2 -19.1 50 0.42 25.1% -1.6 -16.8 75 0.43 25.9% -2.6 -14.2
100 0.45 26.2% -4.2 -11.7 150 0.51 25.4% -5.1 -6.8 200 0.59 22.6% -5.1 -3.4 300 0.82 12.3% -2.4 -0.9 400 0.89 6.9% -0.6 -1.9 500 0.92 5.8% -0.1 -2.0
51
Table A4: Site wind characteristics of Tseung Kwan O at 90°
Prototype scale elevation (mPD)
Normalised mean wind speed
Turbulence intensity (%) Pitch angle (°) Yaw angle (°)
25 0.49 20.2% -4.3 -11.0 50 0.55 19.3% -5.3 -10.1 75 0.62 17.8% -5.8 -9.1
100 0.68 15.5% -5.8 -7.2 150 0.75 12.4% -4.4 -4.6 200 0.81 9.3% -3.3 -3.0 300 0.87 6.9% -1.4 -2.0 400 0.91 5.9% -0.6 -1.3 500 0.93 5.4% 0.1 -0.7
Table A5: Site wind characteristics of Tseung Kwan O at 112.5° Prototype scale
elevation (mPD) Normalised mean
wind speed Turbulence
intensity (%) Pitch angle (°) Yaw angle (°)
25 0.36 24.5% 0.6 -4.7 50 0.39 25.3% -0.4 -2.8 75 0.42 25.5% -0.3 -1.8
100 0.46 24.8% -0.7 -0.8 150 0.55 22.0% -0.8 1.2 200 0.62 18.6% -0.5 1.7 300 0.74 13.8% -0.2 3.1 400 0.81 10.9% 0.3 4.1 500 0.89 7.8% 0.5 4.5
Table A6: Site wind characteristics of Tseung Kwan O at 135° Prototype scale
elevation (mPD) Normalised mean
wind speed Turbulence
intensity (%) Pitch angle (°) Yaw angle (°)
25 0.41 23.1% 0.9 -6.7 50 0.46 22.8% 1.0 -7.3 75 0.49 22.8% 1.2 -6.7
100 0.50 22.6% 1.6 -5.9 150 0.51 22.2% 1.9 -4.0 200 0.55 20.9% 1.7 -2.8 300 0.63 18.2% 1.8 -1.9 400 0.71 15.2% 1.8 -1.4 500 0.78 12.7% 1.6 -0.8
Table A7: Site wind characteristics of Tseung Kwan O at 157.5° Prototype scale
elevation (mPD) Normalised mean
wind speed Turbulence
intensity (%) Pitch angle (°) Yaw angle (°)
25 0.44 19.1% 0.5 15.6 50 0.48 18.9% -0.2 15.2 75 0.51 19.2% -0.6 13.6
100 0.51 19.5% -0.6 12.0 150 0.52 20.9% -0.5 7.9 200 0.53 21.5% -0.6 3.9 300 0.61 20.8% -0.2 0.0 400 0.78 14.4% 0.1 -0.7 500 0.88 8.8% 0.7 0.7

52
Table A8: Site wind characteristics of Tseung Kwan O at 180° Prototype scale
elevation (mPD) Normalised mean
wind speed Turbulence
intensity (%) Pitch angle (°) Yaw angle (°)
25 0.35 25.4% -1.1 -3.6 50 0.40 25.9% -2.8 -1.8 75 0.46 25.1% -3.8 -1.1
100 0.50 24.1% -4.5 -1.0 150 0.59 20.7% -4.5 -1.0 200 0.67 17.1% -3.7 -0.9 300 0.81 11.6% -2.8 -0.5 400 0.90 8.0% -2.0 -0.2 500 0.93 6.3% -1.4 0.2
Table A9: Site wind characteristics of Tseung Kwan O at 202.5° Prototype scale
elevation (mPD) Normalised mean
wind speed Turbulence
intensity (%) Pitch angle (°) Yaw angle (°)
25 0.35 28.8% 1.4 -0.3 50 0.38 28.9% 0.6 -0.5 75 0.39 28.7% -0.1 -1.7
100 0.40 28.7% -0.1 -1.4 150 0.48 26.5% -1.8 -1.6 200 0.54 24.0% -1.4 -1.1 300 0.64 19.6% -0.7 -1.7 400 0.70 16.8% -0.4 -2.3 500 0.77 14.9% -0.5 -1.8
Table A10: Site wind characteristics of Tseung Kwan O at 225° Prototype scale
elevation (mPD) Normalised mean
wind speed Turbulence
intensity (%) Pitch angle (°) Yaw angle (°)
25 0.31 24.9% 2.1 6.9 50 0.33 25.5% 0.6 6.5 75 0.36 25.5% -0.4 6.0
100 0.39 25.0% -0.6 4.9 150 0.45 22.8% -0.3 3.5 200 0.51 21.4% 0.4 2.5 300 0.61 18.4% 1.4 1.1 400 0.69 16.4% 1.6 0.3 500 0.75 15.2% 2.1 1.4
Table A11: Site wind characteristics of Tseung Kwan O at 247.5° Prototype scale
elevation (mPD) Normalised mean
wind speed Turbulence
intensity (%) Pitch angle (°) Yaw angle (°)
25 0.36 30.0% 0.7 -0.3 50 0.38 29.8% -1.5 0.7 75 0.41 29.3% -2.7 1.3
100 0.44 29.0% -3.3 1.3 150 0.50 26.7% -4.6 2.6 200 0.55 24.7% -4.3 2.5 300 0.66 20.5% -3.1 1.9 400 0.76 16.1% -2.1 1.5 500 0.84 12.6% -1.3 0.9

53
Table A12: Site wind characteristics of Tseung Kwan O at 270° Prototype scale
elevation (mPD) Normalised mean
wind speed Turbulence
intensity (%) Pitch angle (°) Yaw angle (°)
25 0.42 24.1% 2.1 -20.6 50 0.44 24.6% 0.0 -20.5 75 0.45 25.0% -0.7 -19.5
100 0.45 26.2% -1.5 -16.9 150 0.45 27.4% -1.7 -11.6 200 0.46 28.2% -1.7 -6.7 300 0.48 29.2% -2.6 -0.2 400 0.54 27.6% -3.5 3.4 500 0.67 23.6% -3.4 4.6
Table A13: Site wind characteristics of Tseung Kwan O at 292.5° Prototype scale
elevation (mPD) Normalised mean
wind speed Turbulence
intensity (%) Pitch angle (°) Yaw angle (°)
25 0.42 23.9% 1.8 -5.4 50 0.44 23.4% 0.8 -5.3 75 0.46 23.6% 0.1 -6.4
100 0.49 23.6% -0.5 -5.9 150 0.54 22.9% -1.2 -5.6 200 0.58 22.1% -1.5 -4.5 300 0.65 20.5% -2.0 -3.3 400 0.71 18.8% -2.1 -2.1 500 0.76 18.0% -2.3 -1.4
Table A14: Site wind characteristics of Tseung Kwan O at 315° Prototype scale
elevation (mPD) Normalised mean
wind speed Turbulence
intensity (%) Pitch angle (°) Yaw angle (°)
25 0.46 17.5% 0.5 -6.8 50 0.48 17.8% -0.2 -5.7 75 0.51 17.8% -0.9 -5.3
100 0.53 17.7% -1.4 -5.3 150 0.57 17.5% -2.1 -4.5 200 0.60 17.2% -2.5 -4.0 300 0.63 17.2% -2.4 -2.5 400 0.67 17.0% -2.8 -1.4 500 0.70 16.8% -2.9 -0.2
Table A15: Site wind characteristics of Tseung Kwan O at 337.5° Prototype scale
elevation (mPD) Normalised mean
wind speed Turbulence
intensity (%) Pitch angle (°) Yaw angle (°)
25 0.37 22.3% 0.6 8.3 50 0.40 23.1% -0.4 7.9 75 0.42 23.7% -1.3 6.5
100 0.43 23.8% -1.7 6.6 150 0.47 23.9% -3.2 2.8 200 0.51 22.9% -3.4 0.7 300 0.62 19.2% -3.9 -2.6 400 0.67 16.4% -3.0 -3.0 500 0.71 15.3% -2.3 -2.2

54
Table A16: Site wind characteristics of Tseung Kwan O at 360° Prototype scale
elevation (mPD) Normalised mean
wind speed Turbulence
intensity (%) Pitch angle (°) Yaw angle (°)
25 0.36 26.1% 2.2 24.4 50 0.37 26.2% 1.8 23.6 75 0.37 26.8% 1.5 21.1
100 0.36 28.5% 2.0 16.6 150 0.37 30.6% 2.2 10.1 200 0.38 32.0% 3.2 1.9 300 0.50 28.5% 1.7 -3.8 400 0.64 22.0% 0.8 -4.5 500 0.76 16.6% 0.1 -3.7
Table A17: Percentage occurrence for annual, non-typhoon directional winds at 50 mPD Percentage occurrence for wind speed ranges: Wind Angle 0 < u ≤ 3.3 m/s 3.3 < u ≤ 7.9 m/s 7.9 < u ≤ 13.8 m/s u > 13.8 m/s Total
0° 0.0% 0.0% 0.0% 0.0% 0.0% 22.5° 4.8% 3.4% 0.1% 0.0% 8.3%
45° 7.5% 1.3% 0.0% 0.0% 8.8% 67.5° 0.0% 0.0% 0.0% 0.0% 0.0%
90° 11.9% 23.0% 3.6% 0.0% 38.6% 112.5° 3.6% 1.2% 0.0% 0.0% 4.9%
135° 4.8% 1.3% 0.0% 0.0% 6.1% 157.5° 0.0% 0.0% 0.0% 0.0% 0.0%
180° 3.5% 0.7% 0.0% 0.0% 4.3% 202.5° 2.5% 0.6% 0.0% 0.0% 3.1%
225° 4.2% 0.8% 0.0% 0.0% 4.9% 247.5° 2.2% 1.0% 0.0% 0.0% 3.2%
270° 0.0% 0.0% 0.0% 0.0% 0.0% 292.5° 2.6% 0.9% 0.0% 0.0% 3.5%
315° 0.6% 0.1% 0.0% 0.0% 0.6% 337.5° 8.3% 5.4% 0.0% 0.0% 13.7%
Table A18: Percentage occurrence for annual, non-typhoon directional winds at 100 mPD Percentage occurrence for wind speed ranges: Wind Angle 0 < u ≤ 3.3 m/s 3.3 < u ≤ 7.9 m/s 7.9 < u ≤ 13.8 m/s u > 13.8 m/s Total
0° 0.0% 0.0% 0.0% 0.0% 0.0% 22.5° 3.7% 4.3% 0.2% 0.0% 8.3%
45° 5.4% 3.4% 0.0% 0.0% 8.8% 67.5° 0.0% 0.0% 0.0% 0.0% 0.0%
90° 9.6% 21.2% 7.6% 0.2% 38.6% 112.5° 3.3% 1.5% 0.1% 0.0% 4.9%
135° 4.6% 1.5% 0.0% 0.0% 6.1% 157.5° 0.0% 0.0% 0.0% 0.0% 0.0%
180° 2.9% 1.3% 0.0% 0.0% 4.3% 202.5° 2.4% 0.8% 0.0% 0.0% 3.1%
225° 3.6% 1.4% 0.0% 0.0% 4.9% 247.5° 1.8% 1.4% 0.0% 0.0% 3.2%
270° 0.0% 0.0% 0.0% 0.0% 0.0% 292.5° 2.5% 0.9% 0.0% 0.0% 3.5%
315° 0.5% 0.1% 0.0% 0.0% 0.6% 337.5° 8.6% 5.1% 0.0% 0.0% 13.7%

55
Table A19: Percentage occurrence for annual, non-typhoon directional winds at 200 mPD
Percentage occurrence for wind speed ranges: Wind Angle 0 < u ≤ 3.3 m/s 3.3 < u ≤ 7.9 m/s 7.9 < u ≤ 13.8 m/s u > 13.8 m/s Total 0° 6.6% 5.5% 0.0% 0.0% 12.1%
22.5° 2.7% 5.0% 0.5% 0.0% 8.3% 45° 3.0% 5.5% 0.3% 0.0% 8.8%
67.5° 3.3% 9.9% 2.0% 0.0% 15.1% 90° 3.2% 10.1% 9.0% 1.2% 23.4%
112.5° 2.5% 2.0% 0.4% 0.0% 4.9% 135° 2.2% 0.9% 0.0% 0.0% 3.1%
157.5° 2.2% 0.8% 0.0% 0.0% 3.0% 180° 2.0% 2.0% 0.2% 0.0% 4.3%
202.5° 1.7% 1.4% 0.0% 0.0% 3.1% 225° 2.4% 2.5% 0.0% 0.0% 4.9%
247.5° 1.2% 2.0% 0.1% 0.0% 3.2% 270° 1.7% 0.8% 0.0% 0.0% 2.5%
292.5° 0.7% 0.3% 0.0% 0.0% 1.0% 315° 0.5% 0.1% 0.0% 0.0% 0.6%
337.5° 1.0% 0.6% 0.0% 0.0% 1.5%
Table A20: Percentage occurrence for annual, non-typhoon directional winds at 500 mPD
Percentage occurrence for wind speed ranges: Wind Angle 0 < u ≤ 3.3 m/s 3.3 < u ≤ 7.9 m/s 7.9 < u ≤ 13.8 m/s u > 13.8 m/s Total 0° 2.2% 6.5% 3.3% 0.1% 12.1%
22.5° 1.9% 5.2% 1.1% 0.1% 8.3% 45° 1.8% 5.6% 1.3% 0.0% 8.8%
67.5° 1.4% 5.7% 7.1% 1.0% 15.1% 90° 2.5% 8.3% 9.8% 2.8% 23.4%
112.5° 1.7% 2.2% 0.9% 0.1% 4.9% 135° 1.6% 1.3% 0.2% 0.0% 3.1%
157.5° 1.2% 1.5% 0.2% 0.0% 3.0% 180° 1.4% 2.2% 0.6% 0.0% 4.3%
202.5° 1.1% 1.7% 0.3% 0.0% 3.1% 225° 1.2% 3.1% 0.6% 0.0% 4.9%
247.5° 0.7% 1.8% 0.8% 0.0% 3.2% 270° 1.1% 1.3% 0.1% 0.0% 2.5%
292.5° 0.6% 0.3% 0.1% 0.0% 1.0% 315° 0.5% 0.1% 0.0% 0.0% 0.6%
337.5° 0.8% 0.6% 0.2% 0.0% 1.5%

56
Table A21: Percentage occurrence for summer, non-typhoon directional winds at 50 mPD
Percentage occurrence for wind speed ranges: Wind Angle 0 < u ≤ 3.3 m/s 3.3 < u ≤ 7.9 m/s 7.9 < u ≤ 13.8 m/s u > 13.8 m/s Total 0° 0.0% 0.0% 0.0% 0.0% 0.0%
22.5° 1.9% 0.3% 0.0% 0.0% 2.2% 45° 2.3% 0.3% 0.0% 0.0% 2.5%
67.5° 0.0% 0.0% 0.0% 0.0% 0.0% 90° 8.2% 9.3% 1.1% 0.0% 18.6%
112.5° 5.8% 2.1% 0.0% 0.0% 7.9% 135° 9.2% 3.7% 0.1% 0.0% 12.9%
157.5° 0.0% 0.0% 0.0% 0.0% 0.0% 180° 7.9% 2.2% 0.0% 0.0% 10.1%
202.5° 6.4% 1.9% 0.0% 0.0% 8.3% 225° 11.9% 2.6% 0.0% 0.0% 14.5%
247.5° 6.1% 3.6% 0.0% 0.0% 9.7% 270° 0.0% 0.0% 0.0% 0.0% 0.0%
292.5° 5.9% 2.7% 0.0% 0.0% 8.6% 315° 1.0% 0.2% 0.0% 0.0% 1.1%
337.5° 3.5% 0.2% 0.0% 0.0% 3.7%
Table A22: Percentage occurrence for summer, non-typhoon directional winds at 100 mPD
Percentage occurrence for wind speed ranges: Wind Angle 0 < u ≤ 3.3 m/s 3.3 < u ≤ 7.9 m/s 7.9 < u ≤ 13.8 m/s u > 13.8 m/s Total 0° 0.0% 0.0% 0.0% 0.0% 0.0%
22.5° 1.7% 0.4% 0.0% 0.0% 2.2% 45° 1.9% 0.6% 0.0% 0.0% 2.5%
67.5° 0.0% 0.0% 0.0% 0.0% 0.0% 90° 6.8% 9.2% 2.6% 0.1% 18.6%
112.5° 5.1% 2.7% 0.1% 0.0% 7.9% 135° 8.6% 4.2% 0.1% 0.0% 12.9%
157.5° 0.0% 0.0% 0.0% 0.0% 0.0% 180° 6.4% 3.6% 0.1% 0.0% 10.1%
202.5° 6.0% 2.4% 0.0% 0.0% 8.3% 225° 10.0% 4.5% 0.0% 0.0% 14.5%
247.5° 4.9% 4.8% 0.0% 0.0% 9.7% 270° 0.0% 0.0% 0.0% 0.0% 0.0%
292.5° 5.6% 2.9% 0.0% 0.0% 8.6% 315° 0.9% 0.2% 0.0% 0.0% 1.1%
337.5° 3.5% 0.2% 0.0% 0.0% 3.7%
57
Table A23: Percentage occurrence for summer, non-typhoon directional winds at 200 mPD
Percentage occurrence for wind speed ranges: Wind Angle 0 < u ≤ 3.3 m/s 3.3 < u ≤ 7.9 m/s 7.9 < u ≤ 13.8 m/s u > 13.8 m/s Total 0° 2.3% 0.2% 0.0% 0.0% 2.5%
22.5° 1.5% 0.6% 0.0% 0.0% 2.2% 45° 1.4% 1.0% 0.1% 0.0% 2.5%
67.5° 1.9% 2.5% 0.5% 0.0% 4.8% 90° 3.3% 6.6% 3.4% 0.4% 13.8%
112.5° 3.6% 3.8% 0.5% 0.0% 7.9% 135° 3.9% 2.5% 0.1% 0.0% 6.5%
157.5° 4.1% 2.2% 0.1% 0.0% 6.4% 180° 4.2% 5.3% 0.6% 0.0% 10.1%
202.5° 4.1% 4.1% 0.1% 0.0% 8.3% 225° 6.2% 8.1% 0.2% 0.0% 14.5%
247.5° 2.9% 6.5% 0.3% 0.0% 9.7% 270° 4.0% 2.5% 0.0% 0.0% 6.5%
292.5° 1.3% 0.7% 0.0% 0.0% 2.0% 315° 0.9% 0.2% 0.0% 0.0% 1.1%
337.5° 1.1% 0.1% 0.0% 0.0% 1.2%
Table A24: Percentage occurrence for summer, non-typhoon directional winds at 500 mPD
Percentage occurrence for wind speed ranges: Wind Angle 0 < u ≤ 3.3 m/s 3.3 < u ≤ 7.9 m/s 7.9 < u ≤ 13.8 m/s u > 13.8 m/s Total 0° 1.7% 0.7% 0.1% 0.0% 2.5%
22.5° 1.3% 0.8% 0.1% 0.0% 2.2% 45° 1.1% 1.2% 0.3% 0.0% 2.5%
67.5° 1.1% 1.9% 1.6% 0.2% 4.8% 90° 2.8% 5.9% 4.2% 0.9% 13.8%
112.5° 2.3% 3.8% 1.6% 0.1% 7.9% 135° 2.7% 3.1% 0.7% 0.0% 6.5%
157.5° 2.0% 3.5% 0.8% 0.1% 6.4% 180° 2.6% 5.6% 1.8% 0.1% 10.1%
202.5° 2.4% 4.9% 1.0% 0.0% 8.3% 225° 2.7% 9.7% 2.0% 0.0% 14.5%
247.5° 1.4% 5.5% 2.7% 0.1% 9.7% 270° 2.4% 3.8% 0.3% 0.0% 6.5%
292.5° 1.0% 0.8% 0.2% 0.0% 2.0% 315° 0.8% 0.3% 0.0% 0.0% 1.1%
337.5° 1.0% 0.2% 0.0% 0.0% 1.2%

58
APPENDIX B
AXIS SYSTEM OF THE COBRA PROBE
The following figures show the standard axis system of the Cobra Probe:
Figure B1: (a) Flow axis system with respect to the Cobra Probe head
(b) Positive flow pitch and yaw angles
Note: Yaw angle is technically ‘azimuth’ (rotation angle about the z-axis); Pitch angle is technically ‘elevation’ (the angle between the flow velocity vector V and the X-Y plane).


