
EU ETS – broken beyond repair? An analysis based on FASTER principlesXavier Timbeau Paweł Wiejski
SCIENCES PO OFCE WORKING PAPER n° 24, 2017/10/26

EDITORIAL BOARD
Chair: Xavier Ragot (Sciences Po, OFCE)
Members: Jérôme Creel (Sciences Po, OFCE), Eric Heyer (Sciences Po, OFCE), Lionel Nesta (Université Nice Sophia Antipolis), Xavier Timbeau (Sciences Po, OFCE)
CONTACT US
OFCE 10 place de Catalogne | 75014 Paris | France Tél. +33 1 44 18 54 24
www.ofce.fr
WORKING PAPER CITATION
This Working Paper: Xavier Timbeau, Paweł Wiejski, EU ETS – broken beyond repair? An analysis based on FASTER principles Sciences Po OFCE Working Paper, n°24, 2017-10-26. Downloaded from URL: www.ofce.sciences-po.fr/pdf/dtravail/WP2017-24.pdf DOI - ISSN
© 2017 OFCE

3
ABOUT THE AUTHORS
Xavier Timbeau*, OFCE, Sciences Po Paris, France Email Address: mailto:[email protected] Paweł Wiejski*: mailto:[email protected]
ABSTRACT The EU ETS is one of the main European climate policies, covering 45 percent of EU’s greenhouse gas emissions. Its main goal is to limit emissions cost-effectively, and to trigger innovations using a strong price signal, making low-carbon technologies more competitive. While emissions reduction targets for 2020 have already been achieved, the exact role of the ETS in this success remains controversial. The assessment is crucial, as more and more countries and regions plan to adopt similar policies to achieve their targets expressed in the Intended Nationally Determined Contributions, communicated at the Paris Conference of the Parties. The EU ETS, as the longest running and largest carbon market in the world, will undoubtedly serve as a point of reference. This paper attempts to provide a comprehensive analysis of the policy. First part outlines the historical development of emission trading systems, as well as the development of the EU ETS since its inception in 2005. Second part uses FASTER principles developed by the World Bank and the OECD to perform a multi-criteria, qualitative analysis of the EU ETS in its current form. Third part concentrates on the upcoming revision for the fourth phase, evaluating whether the proposals correctly address the policy’s shortcomings. It also provides some alternative reform proposals.
KEY WORDS Cap-and-trade, EU ETS, Market stability reserve, Carbon price.
JEL
H23, H87, Q56. * This paper is based on the work of Pawel Wiejski for the Master in European Affairs programme of Sciences Po Paris, under the supervision of Xavier Timbeau.

4
Table of Contents 1. Theoretical roots and historical developments of the EU ETS ....................................................... 6
1.1. Principles of carbon pricing..................................................................................................... 7
1.2. Historical development of emission trading systems .............................................................. 9
1.3. Use of Emission Trading for GHG emissions ....................................................................... 10
1.4. Current state of carbon pricing .............................................................................................. 12
1.5. Successful carbon pricing: FASTER principles .................................................................... 13
1.6. History of the EU ETS. ......................................................................................................... 15
1.6.1. Inclusion of aviation ...................................................................................................... 19 1.6.2. Phase 3 ........................................................................................................................... 20
2. Analysis based on FASTER principles ......................................................................................... 22 2.1. Fairness .................................................................................................................................. 24
2.1.1. Polluter-pays principle................................................................................................... 25 2.1.2. Cost distribution ............................................................................................................ 26 2.1.3. Costs for customers ....................................................................................................... 28
2.2. Alignment of policies and objectives .................................................................................... 30
2.2.1. EU policies .................................................................................................................... 31 2.2.2. National policies ............................................................................................................ 32
2.3. Stability and predictability .................................................................................................... 33
2.3.1. Intermediate reforms ..................................................................................................... 34 2.3.2. Predictability ................................................................................................................. 35
2.4. Transparency ......................................................................................................................... 36
2.4.1. The Union Registry ....................................................................................................... 36 2.4.2. Monitoring, reporting and verification .......................................................................... 37 2.4.3. Market oversight ............................................................................................................ 38
2.5. Efficiency and cost-effectiveness .......................................................................................... 39
2.5.1. Efficiency ...................................................................................................................... 39 2.5.2. Cost-effectiveness ......................................................................................................... 41
2.6. Reliability and environmental integrity ................................................................................. 42
2.6.1. Local benefits – impacts on air pollution ...................................................................... 42 2.6.2. International credits ....................................................................................................... 43
3. Revision for phase four: reform, not revolution ........................................................................... 44 3.1. Market Stability Reserve – a small step in a right direction .................................................. 45
3.2. Cap decrease picking up the pace .......................................................................................... 47
3.3. Carbon leakage and free allocation reform............................................................................ 48
3.4. Revenues and new support mechanisms ............................................................................... 49
3.5. Reform not sufficient to answer to challenges ...................................................................... 51
Bibliography .......................................................................................................................................... 58

5
The Emission Trading System of the European Union (EU ETS) is one of the most important
climate policies implemented by the EU. It is also the first and, as of today, the largest carbon
market in the world. Its uniqueness draws attention of researchers, policy analysts and
policymakers. As carbon pricing becomes more and more popular, regulators willing to
implement emission trading are looking for models to follow. Thus, the importance of the EU
ETS exceeds the Old Continent. The questions arising from the functioning of the system are
therefore of the utmost importance.
In the view of growing importance of carbon pricing, and the central role that the EU ETS
plays in this development, assessment of its functioning is imperative. The programme has
been functioning for 12 years now, but to some extent it remains experimental, and is
constantly changing in the spirit of “learning-by-doing”. From the very beginning the system
was plagued with issues and controversies. From initial overallocation, through the impact of
the economic crisis, to VAT fraud scandal and lower-than-expected prices – the choice of this
system as a primary tool of climate policy has frequently been called into question. Over the
years, the EU ETS went through number of reforms. At the time of writing, a structural
reform and a revision for the fourth phase (2021-2030) is being considered. It is an
appropriate moment to look back at the functioning of the system so far, and to consider
proposed reforms. This exercise serves to answer the research question, which may be
formulated as follows:
Given the functioning of the system hitherto and the proposals for a structural reform
currently under consideration, is the EU ETS as a policy aiming at reducing greenhouse gases
emissions a model worth following?
The structure of this dissertation reflects the necessary steps to answer this question. The first
part reconstructs the theoretical roots and historical developments of carbon pricing and
trading. Growing importance of emissions trading is deeply rooted in the development of
economic thought, particularly in the US. The first part explores how theory was turned into
practice, and how emission trading was applied to greenhouse gases (GHG). Afterwards, the
analytical framework for the subsequent part of the dissertation is established, based on the
FASTER principles established by the World Bank and the OECD. Finally, to provide further
context, the development of the EU ETS to this day is presented.
Second part consists of a multi-criteria, literature-based analysis of the EU ETS in its current
form. The analysis of the ETS is oftentimes limited to its ability to deliver results in terms of
emission reductions. This approach can be misleading. In the multitude of factors influencing

6
emissions, it is difficult to isolate the influence of the ETS. Besides, the effects of the policy
are not limited to emission reduction. It is necessary to consider the EU ETS from a broader
perspective, taking into consideration issues concerning its fairness, integrity, stability, as well
as its effects on innovativeness and long-term investments in low-carbon technology.
FASTER principles framework is a useful tool to perform such multi-faceted analysis.
The issues revealed by the analysis in the second part of the dissertation will constitute a point
of departure for the third. The most important proposals of reform currently discussed in the
EU institutions will be analysed in order to assess to what extent do they address
shortcomings of the EU ETS in specific areas exposed in the analysis. The final part will
complete the analysis, giving enough information to attempt an answer to the research
question.
1. Theoretical roots and historical developments of the EU ETS
Climate change has emerged as one of the greatest challenges the world is facing today. In
recent years, an unprecedented global cooperation on the issue, led to ratification of the Paris
Agreement on October 5th 2016. Nevertheless, a path to low-carbon future remains a turbulent
one. Intended nationally determined contributions (INDCs) submitted by parties of the Paris
agreement fall short of the agreed-upon goal of holding the increase in global average
temperature to well below 2 °C above pre-industrial levels.
Transition will without a doubt be costly, both economically and politically. International
Energy Agency estimated that in order to keep the pledges made in Paris, countries would
have to invest 13.5 trillion dollars between 2015 and 2030 in the energy industry alone
(International Energy Agency, 2015). It is necessary to underline that action outlined by
INDCs will not be enough to limit global warming below 2 degrees. According to the
UNFCC secretariat report on aggregate effect of INDCs, in order to do achieve this goal,
countries will need to “scale up and accelerate efforts before and after 2030” (UNFCCC,
2015, p.14). This conclusion would suggest that countries taking climate change seriously
have to be prepared to spend even more with time.
Facing such overwhelming costs policy-makers are eager to find cost-effective solutions.
Current technological development, while an important factor, does not in itself provide
sufficient potential for emission reduction. Price of fossil fuels remains low compared to
sustainable energy sources. Producers have therefore little incentive to switch to alternative
energy sources and to invest in innovative technologies. Burden of transformation to low-

7
carbon economy is predominantly borne by governments. Economic policies, such as carbon
pricing, are designed to achieve emission reduction goals at least price using market
mechanisms. That is why around a 100 countries, representing 58 percent of emissions,
included carbon pricing initiatives in their INDCs (World Bank, 2016).
Among these initiatives, the EU Emission Trading System may be considered unique. It was
the first ETS for greenhouse gases and to this day remains the largest in terms of covered
emissions (World Bank, 2016). It operates in 31 countries, covers over 11 000 installations
and airlines operating flights between adherent countries, and has just entered its twelfth year
of existence. Despite its singularities, it is necessary to consider EU ETS from a wider
perspective. This part provides such context, outlining theoretical foundations of emission
trading systems, and a brief history of trading systems put in practice. Further on, a set of
criteria for assessment of the ETS is proposed, based on guidelines provided by the World
Bank and OECD. Finally, the development of the EU ETS up to today is described.
1.1. Principles of carbon pricing
Carbon pricing is an economic policy aimed at reducing greenhouse gases emissions.
Greenhouse gases, most importantly CO2, but also others (methane, nitrous oxide, ozone,
CFCs), are uniformly mixed accumulative pollutants. It means that the location in which these
gases are emitted does not impact their overall level in the atmosphere. It is also important to
underline that they are accumulative – the assimilative capacity of the atmosphere is not
sufficient to absorb them. Therefore, the total amount of these gases in the atmosphere
increases with time (Tietenberg, 2006). In this case, traditional command-and-control
policies, such as design standards or performance standards, are in principle neither efficient
nor cost-effective. Marginal costs of reducing emissions differ greatly not only between, but
even inside installations. For the regulator command-and-control policies would require a
nearly unattainable level of information.
Economic policies allow for more flexibility when it comes to reducing emissions. There are
two main types of these policies, drawing from two economic concepts on dealing with
negative externalities. Carbon taxes (and subsidies) are based on Pigouvian approach to social
cost. Greenhouse gas emissions create costs that are not borne by the emitter, but rather by
humanity as a whole. Therefore, a market equilibrium is not equivalent to the socially
desirable equilibrium. Pigouvian approach would require the regulator to apply taxes in order
to force producers to internalize negative externalities. The value of said tax should be equal

8
to the social cost created by the externality (Pigou, 1972). In practice, taxes are levied based
on the desired outcome in emission reduction rather than on actual estimate of social cost.
Subsidy reform is another example of economic policy aimed at reducing emissions, strongly
related to carbon taxes. Subsidies are common in the energy sector. On the consumption side,
subsidies are given in order to reduce price paid by the consumer below supply cost.
Subsidies on the production side are less significant, and consist in directly or indirectly
increasing profitability via direct transfers, tax exemptions and other means. Since subsidies
for producers affect prices for consumers, these two types of subsidies overlap. Some
researchers and policy-makers include externalities of energy production in their estimates of
subsidies. From this perspective, costs borne directly by governments (such as health care for
people affected by air pollution, or adaptation costs connected to rising temperatures caused
by greenhouse effect), as well as all other social costs are considered post-tax subsidies. Thus,
Pigouvian carbon tax may actually be considered as subsidy reform – as it aims at making
polluter pay for externalities resulting from his activity. According to the International
Monetary Fund, pre-tax energy subsidies constitute a mere 0.4% of global GDP. But when
post-tax subsidies are taken into account, this figure rises to 6.5%. Reducing either type of
subsidies leads to fiscal benefits, but also to reduction of environmental impacts (Coady et al.,
2015).
Carbon trading is substantially different from both carbon taxes and subsidies. Its theoretical
roots can be traced back to an influential article “The problem of Social Cost” by Ronald
Coase, criticising Pigouvian approach as too narrow. Coase argued that placing a tax on a
polluter does not necessarily lead to desirable results. It would be preferable, he claimed, to
treat externalities as any other factors of production, and thus as explicit and transferrable
property rights. Corrective measures (such as Pigouvian taxes or command-and-control
regulations) may be more costly than the “nuisance” resulting from economic activity of the
polluter (Coase, 2013). Incorporating externalities as factors of production with appropriate
cost would lead to an efficient, market-based allocation.
Idea proposed by Coase led J.H. Dales to develop theoretical foundations of emission trading
system. Taking water waste as an example he argued that the government should take a
decision on how much waste can be safely released in a given period during a given time, and
put an appropriate amount of “pollution rights” for sale. Firms whose production process
involves releasing waste into the water would have to buy these pollution rights. If their initial
estimate of how much waste they will produce proves to be inaccurate, they may acquire
9
additional rights, or sell ones that are superfluous. In order for the price to be positive, overall
amount of pollution permits should be smaller than the amount of waste produced before
introduction of the system (Dales, 1968).
Although theory of pollution rights trading evolved greatly in subsequent decades,
incorporating air pollution and, most importantly, greenhouse gases, the basic scheme remains
similar to the one proposed by Dales. In principle carbon trading allows for even more
flexibility than other economic policies. It also addresses the main problem of carbon taxes:
determining their level. These qualities were recognised initially by American policymakers,
and led to experiments that introduced emission trading into the policy debate worldwide.
1.2. Historical development of emission trading systems
Emission trading was first introduced in the United States of America. In 1970 amendments to
Clean Air Act set maximum standards for concentration of SO2, CO, NO2, lead, particulates
and ozone. Compliance with these standards was mostly a role of the states. By 1975 it
became clear that some regions will not be able to attain goals before deadlines foreseen by
the Clean Air Act. In order not to hinder economic growth and to allow for establishment of
new entities, in 1976 amendment was introduced, allowing companies to voluntarily reduce
emissions in return for reduction credits, certified by the Environmental Protection Agency
(EPA). These credits could be purchased by companies willing to create new sources of
pollution. These companies needed to secure 120 percent worth of pollution credits for their
foreseen emissions. That additional 20 percent allowed for an overall reduction in pollution in
a given region. This innovation was known as the “offset policy” (Tietenberg, 2006)
The EPA used forms of tradeable pollution permits throughout the 1980’s. The phase-out of
leaded gasoline was attained inter alia using a trading system. It is an interesting example for
two reasons. Firstly, the policy targeted input material, rather than emissions themselves.
Refineries received a number of quarterly permits for lead in gasoline depending on their
historical production. Secondly, for the first time this type of policy resulted in a complete
elimination of a pollutant (Kerr & Mare, 1998). Emission trading was also used to phase out
ozone-depleting chlorofluorocarbons (CFC) in order to implement the Montreal Protocol
(Staving, 1998).
A trading system on a far larger scale was introduced by 1990 Clean Air Act Amendment.
Title IV of said legislative act introduced the US Acid Rain Program. Over a decade of
environmental activism in this field led the US government to implement a comprehensive

10
policy aimed at reducing primary causes for acid rain, that is SO2 and NOx (nitrous oxides)
emissions. These emissions were attributable mostly to coal-fired power plants. Contrary to
previous air pollution regulations, Acid Rain Program set a cap on aggregate emissions of
SO2, instead of dealing with emissions by individual sources. Trading was much more flexible
than in any previous programs. Allowances were traded nationally, without need for approval
on the part of EPA. Remarkably, individuals were able to buy allocations as well, in order to
resell them, or retire them completely (Ellerman, 2000).
Figure 1. Trends in electricity generation, fossil energy use and emissions from the electric power industry, 1990-2006. (Napolitano et. al. 2007)
Sulphur Dioxide emission trading system is broadly considered a success (Staving, 1998;
Ellerman, 2000; Tietenberg, 2006; Napolitano et al., 2007). The policy has led to a significant
decrease of SO2 and NOx emissions and, in consequence, to a mitigation of acid rain. At the
same time, total amount electricity generated increased, while electricity prices remained at
more or less the same level.
1.3. Use of Emission Trading for GHG emissions
At the time the first Conference of the Parties (COP) of the United Nations Framework
Convention on Climate Change (UNFCCC) took place, the United States already had sizeable
experience with emission trading. Successful experiments, especially the Acid Rain Program,
led the US representatives to advance proposals to include emission trading in the Kyoto
Protocol. Emission trading was first mentioned during the third Ad Hoc Group on the Berlin
Mandate meeting in March 1996. At the COP 2 later that year, the US representative linked
his country’s support for binding targets with the inclusion of emission trading. The proposal
was initially opposed by G-77 countries and China, noting its complexity and the danger that
it would transform emission reduction obligations into commercial transactions (Depledge,

11
2000). The EU also voiced its concerns, especially concerning the “hot air” problem. If for
some countries targets set out in the Kyoto protocol were to be higher than business-as-usual
emissions, these countries could sell emission rights without any effort to lower their
emissions. The “hot air” problem considered especially countries in transition, such as Russia
and Ukraine. Due to difficult economic situation, they were allowed a stabilization target. But
the baseline for the target was the year 1990, and in the 1990’s these countries experienced a
sharp economic decline, which led to a significant emission reduction. This emission gap was
unlikely to be sealed before the Kyoto protocol would enter into force (Woerdman, 2005)
In the end, emission trading clause was adopted. At the time, United States were the biggest
GHG emitter in the world, only to be surpassed by China in 2005.2 Despite objections voiced
by other countries, emission trading found its way to the Protocol in return for binding targets
and participation of the US. Ironically, the US failed to ratify the Kyoto protocol.
Nevertheless, after significant delay, Kyoto protocol entered into force in February 2005
(Depledge, 2005).
There are three mechanisms involving tradeable permits in the Kyoto Protocol. Targets for
emission reductions are given as a “carbon budget” to each country included in Annex B –
that is countries deemed developed enough to be given binding emission targets. These
budgets are calculated in units called AAUs (Assigned Amount Units), each of which is
equivalent to one tonne of CO2e (CO2 equivalent). Under article 17 of the Protocol, countries
listed in Annex B may sell unused units to countries struggling to meet their own emission
targets.
The second mechanism involving tradeable permits is the Joint Implementation. This one is
also reserved for Annex B countries. A country struggling to meet its emission target may
finance a project in another Annex B country, and obtain Emission Reduction Units (ERUs),
which are equivalent to AAUs. It can either be a project aiming at reducing GHG emissions,
or increasing carbon sinks – a removal of GHG gases from the atmosphere.
The third process involving tradeable permits is the CDM – Clean Development Mechanism.
Contrary to the previous two, CDM requires participation of the non-annex B countries. A
country can increase its carbon budget by investing in emission reduction project in a country
that does not have a commitment under Kyoto protocol, in exchange for Certified Emission
2 WRI, CAIT. 2014. Climate Analysis Indicators Tool: WRI’s Climate Data Explorer. Washington, DC: World Resources Institute. Available at: http://cait2.wri.org.

12
Reductions (CERs), also equivalent to AAUs. In this case, carbon sinks projects are not
acceptable (Tietenberg, 2006).
1.4. Current state of carbon pricing
Emission trading have seen considerable development since the Kyoto protocol negotiations.
As of late 2016, 36 countries have implemented or scheduled for implementation some form
of emission trading systems (of which 31 take part in the EU ETS). In addition, there have
been 24 such initiatives on a subnational level. ETS are considered in many other countries,
most notably in China. If Chinese ETS is indeed implemented, it will dethrone the EU ETS as
the largest carbon market in the world, and increase the share of GHG emissions covered by
carbon pricing initiatives from 13 percent to 20, or even 25 percent (World Bank, 2016).
Albeit popular, ETS is not the only economic policy aimed at reducing GHG emissions.
Several countries have implemented carbon taxes, most of them in addition to ETS. With
these policies often going in parallel, it is useful to consider them together when analysing the
optimal price for carbon. Both carbon taxes and emission trading systems aim at making
polluters pay for damage caused by GHG emissions. Carbon taxes allow the regulator to
explicitly set carbon prices at a given level. By contrast, in the ETS prices are determined by
market forces, and the regulator can only influence them by controlling the quantity of
emission permits issued.
Most important difference between emission trading systems and carbon taxes is the method
of establishing the price of emissions, and reaching a goal in terms of emission reduction. In
the case of emission trading systems, the price of emission permits is beyond regulator’s
control, but the overall emission reduction remains fixed. It is important to note that it is fixed
in both ways: if emission permits are overallocated and banking is permitted, firms will use
the excess permits in later years. In other words, it is impossible to achieve higher level of
reduction than the one projected in the design of the system, even if external situation
changes, for example due to an economic downturn.
In the case of carbon taxes, the regulator only sets the carbon price, without being able to fully
control the overall emissions reduction. There is no consensus when it comes to establishing
the optimal rate of carbon tax. Two approaches can be distinguished. The first one
concentrates on estimating the real damage caused by GHG emissions, taking into account
healthcare costs, adaptation to higher temperatures or extreme weather events. It may be
referred to as the Pigouvian approach. The second one estimates the optimal carbon price

13
based on the desired policy outcome, for example emission reduction sufficient to limit global
warming below certain level (functionalist approach). There is also no agreement among
researchers whether or not the carbon price should be stable, or should it increase over time.
As of 2016, a lower end estimate for optimal carbon price based on the Pigouvian approach
suggests the benchmark price of 30€ per tonne of CO2e (OECD, 2016).
Even considering this low estimate of carbon price, there are few countries that meet it. An
OECD report covering 41 countries responsible for over 80 percent of global emissions found
that 90 percent of carbon rates do not exceed 30€. If we exclude road transport, where specific
taxes on energy are broadly applied and are usually significant, but seldom are motivated by
climate policy, this figure rises to 96 percent (OECD, 2016). The EU ETS is no exception –
currently, allowance prices oscillate around 5€ per tonne of CO2e at the time of writing (see:
Figure 2.).
1.5. Successful carbon pricing: FASTER principles
Low prices are hardly the only problem of economic policies aiming at mitigation of climate
change. Many other issues will be discussed at length in the second part of this paper.
Catalogue of difficulties includes overallocation, grandfathering of permits, fraudulent offset
programs, carbon leakage and many others. In connection to the Paris COP 21, researchers of
World Bank and OECD created FASTER principles of for successful carbon pricing –
framework useful for both assessment of existing carbon pricing initiatives (carbon taxes and
emission trading systems), and planning new ones (World Bank & OECD, 2015). It consists
of six principles.
The first principle is fairness. Transition to low-carbon economy is costly, and carbon pricing
initiatives should be designed in a way that reflects the “polluter pays” rule. Taxes and trading
systems can lead to higher energy prices, potentially increasing levels of energy poverty. At
least in the short term they may also have adverse effect on labour markets, it is therefore
necessary to assist transition of jobs to emerging, low-carbon sectors.
Second principle is strongly connected with the first one. Alignment of policy and objectives
relies on the conviction that carbon pricing is only one element in the broader policy mix, and
cannot be taken out of context. Some policies may aid reduction of emissions, and help
achieve sustainable, long-term solutions. Other may hinder emission reduction efforts – for
example fossil fuel subsidies.
14
Carbon pricing initiatives should also be stable and productive. A point especially pertinent
for the EU ETS; successful ETS and carbon taxes should send a stable and gradually
increasing price signal to the economy, to allow companies and individuals to plan out deep
and long-lasting transition processes.
Fourth principle – transparency – is important both for stakeholders and for general public.
Stakeholders, such as companies subject to carbon pricing, should be informed early and
comprehensively about the program even before its introduction. The process should be
transparent also for the public, to assure trust and allow scrutiny.
Next principle – efficiency and cost-effectiveness – reflects the main goal of carbon pricing.
Its flexible design is supposed to help achieve emission reductions at least cost. It is also
important to take cost-effectiveness during the design phase. When it comes to coverage of
carbon pricing, the more numerous and diverse the sources, the better. Efficiency can further
be increased by productive use of revenues from taxes or emission trading. Cost-effectiveness
can be increased by international cooperation, for example through linking of emission
trading systems.
Finally, the sixth principle involves reliability and environmental integrity. This principle
encompasses all previous ones. Ideal carbon pricing initiative should cover all the emission
sources. Regulator should also ensure that a low-carbon alternative to existing modes of
production is readily accessible, what brings us back to alignment of policy and objectives.
Carefully designed carbon pricing initiatives can also contribute to other problems, helping
reduce air pollution or improving energy independence of a given country.
Assessment of carbon pricing initiatives is not an easy task. Situation of each country or
region deciding to introduce carbon tax or emission trading system is different. Economic
policies are usually only elements of a broader policy mix. Emission levels can be influenced
by many factors, often independent from policymakers, which was clearly demonstrated
during the crisis of 2008. Judging a carbon-pricing policy just based on attainment of
emission reduction targets is an oversimplification. FASTER framework allows for a more in-
depth analysis of a functioning of carbon pricing initiatives. In addition, it does not
differentiate between carbon taxes and emission trading, which allows researchers to compare
these two distinctive approaches. That is why the analysis of the EU ETS presented in this
paper will be based on FASTER principles.

15
1.6. History of the EU ETS.
Efforts of the EU regarding climate change mitigation go a long way back. But Europe was
slow to accept Emission Trading as a method. It does not mean, however, that it didn’t try to
implement carbon pricing. EU institutions recognised climate change as a threat and
recommended policy action even before the International Panel on Climate Change (IPCC)
was created. First non-binding documents were released in the 1980s. First proposals to
introduce a carbon tax surfaced in 1991 (Skjaerseth, 1994). The Commission was trying to
gather support of the Council to propose a carbon tax to be implemented simultaneously by all
OECD countries to avoid competitive advantage of free-riders. Due to extensive lobbying
activities and fierce opposition to the idea by some Member States, the Commission failed not
only to mention carbon tax during international negotiations at the UN Conference on
Environment and Development in 1992, but also to implement any form of carbon taxation. In
order to introduce fiscal measures at the EU level unanimity is required. The United Kingdom
was firmly opposed to any such measures, and some poorer countries (Portugal, Ireland,
Spain and Greece) demanded additional cohesion fund to recompense the resulting tax
burden. The failure to introduce carbon tax went hand in hand with cuts to the budgets of
existing programs aiming at reducing emissions – SAVE, concerning energy efficiency and
ALTENER, promoting use of renewables. The idea of carbon tax was finally abandoned in
the late nineties (Skjaerseth & Wettestad, 2009).
Kyoto Protocol marked a change of approach of the European Commission. Initially opposed
to the idea of emission trading, the Commission embraced it shortly after the end of the
Conference. Two political motives seem decisive. Firstly, failure of a union-wide carbon tax
led to a realisation that any policy instrument involving fiscal measures (that is: requiring
unanimity under the Maastricht Treaty) is unlikely, if not impossible, to pass. Secondly,
negotiations in Kyoto, and US insistence on introducing trading mechanisms into the final
text brought emission trading into the global discourse. Moreover, for the EU-15 there was
already a binding target of 8 percent reduction of emissions compared to 1990 levels,
provided by the Kyoto Protocol. In addition, after the US finally rejected Kyoto in 2001, the
EU took leadership to assure ratification of the Protocol. In order to achieve that, at least 55
countries representing at least 55 percent of 1990 emissions needed to finalise their
ratification processes. At the time the US was responsible for 34 percent of global emissions,
which reveals the scale of this challenge. To convince Japan, Russia, Canada and many other
countries, the EU needed to lead by example. As Frank J. Convery puts it: “(…) the EU ETS

16
moved to centre stage as the core evidence that the European Union could be innovative,
courageous and effective in ensuring that its own performance matched its rhetoric”
(Convery, 2009, p.396).
Background of EU ETS implementation is crucial for understanding its further development.
Emission trading was not a first-choice policy for the Commission. Its rise to prominence
resulted from several factors – which is not surprising in the multi-level governance
framework of the Community. Although Kyoto Protocol negotiations played a significant
role, it would be an oversimplification to treat it as the only cause. Institutional setup of the
EU, virtually disallowing fiscal measures as policy tools, combined with the will of Member
States and lobbying efforts of industries – all of these factors need to be taken into account.
Shortly after Kyoto, in 1998, the Commission released a document in which it argued that the
EU could introduce internal emission trading scheme before Kyoto protocol would enter into
force in 2008. Starting the programme in 2005 would give the Community practical
experience, streamlining of monitoring system and promote “the achievement of targets in a
cost-effective way” (European Commission, 1998, p.20) It took two years to release a green
paper, outlining details of the system.
Finally, the Directive 2003/87/EC of the European Parliament and the Council of 13 October
2003 establishing a scheme for greenhouse gas emissions trading within the Community came
into effect. The initial phase was scheduled to begin in January 2005. The Directive gathered
widespread support among Member States and in the European Parliament, as well as from
some major environmental non-governmental organisations, such as World Wildlife Fund
(WWF), or Foundation for International Environmental Law and Development (FIELD)
(Convery, 2009).
The second piece of legislation crucial for the functioning of the ETS, concerning linking the
European trading system to Kyoto protocol mechanisms (Joint Implementation and Clean
Development Mechanism), was met with far stronger opposition both by Member States and
NGOs. At the same time, representatives of the industries included in the ETS were strongly
supporting unlimited access to international credits. Germany and the third sector voiced their
concerns, arguing that opening the ETS for credits from Kyoto mechanisms will lead to a
price collapse and will decrease the effectiveness of the system. Nevertheless, the legislation
was adopted, leaving limiting access to JI and CDM to Member States, with oversight of the
Commission (Convery, 2009).

17
The Directive 2003/87/EC outlined general rules for the first two phases of the ETS. First
phase was designed to last three years, starting in 2005. In this pilot period, emission permits
(European Union Allowances – EUAs) were distributed in decentralized way. Member States
needed to present a national allocation plan (NAP), according to specific criteria outlined in
Annex III of the directive. NAPs comprised allocations for the whole period of the ETS, and
were to be presented to the Commission at least 18 months before the start of the period. The
Commission would then evaluate the plan on the basis of criteria listed in Annex III, and then
accept, or reject it – fully or partially. The Commission had a final say in the process. At least
95 percent of allocations were to be given for free (‘grandfathered’).
The ETS intentionally did not cover all the emissions. In order to limit monitoring costs,
mostly large combustion installations were targeted. Initially, only CO2 emissions were
covered. The scope of the ETS accounted for about 50 percent of CO2 emissions, coming
from 11,500 installations in 27 Member States. Interestingly, article 24 introduced an opt-in
clause – Member States could voluntary include additional installations in the ETS. These
installations did not have to fulfil conditions outlined in Annex III of the directive. This
possibility was used by Austria, Finland, Latvia, Slovenia and Sweden (Ellerman et al., 2010).
In order to monitor, report on and verify emissions, each Member State established a registry.
National registries included data on creation, surrender and transfer of permits in a given
country. Aside from national registries, a central log – the Community Independent
Transaction Log (CITL) – was created. Its role was to register all transactions in the EU.
National registries could not give the full picture of the market, because they did not take
international transactions into account. A verification process was also set up, and
independent verifiers had to certify the actual emissions level in each plant. Companies with
emissions exceeding its permits at the end of the year had to buy deficit permits and was
liable to a penalty of €40 per EUA. (Ellerman et al., 2010).
The first period was supposed to be a pilot one. The purpose was to establish institutional
setup of the system, to put mechanism to a test before it was to be fully implemented as a
Kyoto compliance tool. That is why EU cap was close to the business-as-usual scenario. The
estimates were not only low, but also inaccurate. Member States did not have much time for
an ambitious task of verifying levels of historical emissions in ETS sectors. The problem was
even deeper in new Member States, where economic situation was still volatile shortly after
structural transformation (Ellerman et al., 2010). In effect, EAUs were greatly overallocated,

18
what led to a quick decline in prices. Banking over to the second phase of ETS was not
permitted, causing the price to drop nearly to €0 towards the end of the first phase.
Figure 2. EAU price in the first two phases of the ETS (Venmans 2012)
The second period was planned over five years, starting in 2008, the year when Kyoto
protocol entered into force. As the legal basis for the system remained the same, most of the
institutional setup of the programme did not change. NAPs were still responsible for
allocation of permits. Their initial allocation was higher than in the first phase, reaching 2325
million EUAs per year. The Commission review brought down this number by over 10
percent, or 245 million tonnes per year. The proportion of obligatory grandfathering was
reduced to 90 percent of permits. As with the first phase, few Member States chose to
organise auctions. Only 3.1 percent of EUAs were auctioned, most of them in Germany and
the UK (Venmans, 2012)
As the Kyoto protocol came into force, offsetting mechanisms foreseen by this agreement –
Clean Development Initiative and Joint Implementation – were introduced to the European
ETS. In accordance with the Linking Directive, the NAPs determined maximum share of
these so called ‘Kyoto credits’ for each sector. Unsurprisingly, the initial cap of 374 million
credits proposed by the NACs was lowered by 100 million by the Commission. Still, the
Kyoto credits constituted a significant part of permits in the EU, increasing total emission cap
by over ten percent.
In order to prevent price drop from the pilot phase at the end of the five-year period, banking
of permits was allowed. Unused allowances were permitted to be used in the third phase,
starting in 2013. However, prices of EUAs continued to fall. From the highest point at €27,

19
price decreased quickly to under €10 at the beginning of 2009. Naturally, the main reason for
this price drop was the economic crisis of 2008, and overall reduced productivity. Afterwards,
the price stabilised at around €15, to fall again in 2012 following the foreign debt crisis and
VAT fraud breakdown (Venmans, 2012).
Besides the economic crisis, fraudulent activity also influenced the functioning of the ETS.
Money laundering and VAT fraud committed via the missing trader system accounted for the
majority of transactions on the emissions market. The scale of this criminal activity was
overwhelming. Losses in tax revenues between 2008 and 2009 were estimated at 5 billion
euros. After several countries implemented measures to prevent fraud using emission trading,
market volume dropped by as much as 90 percent (Frunza, 2013). The scandal undermined
the EU ETS’ credibility. As the volumes on the spot market fell, the prices plunged even
further, falling below 10€ in June 2011.
1.6.1. Inclusion of aviation
In 2012, aviation sector was partially included in the ETS. Aviation sector is under a slightly
different regime than other ETS sectors. Directive 2008/101/EC introduces a new chapter to
the ETS directive, For the first year, cap was set at 97 percent of the historical emissions
(taking 2010 as reference year); 85 percent of permits were to be grandfathered. Aviation
sector could use Kyoto credits to offset emissions, but unlike other sectors, the maximum
percentage of offsets was set by the Commission. Limit for the first year was set at 15
percent; for subsequent years the Commission was obliged to publish the limit at least six
months before the start of each period. Monitoring and enforcement was left to the Member
States. Aviation is a highly internationalised sector, so clear rules concerning assignment of
companies to Member States had to be established. For aircraft operators based in the EU, the
country issuing the licence was determining the “nationality” of an airline.
Initially, all flights to and from European airports were included in the ETS. This triggered a
fierce reaction from the international community, especially the US. Fearing potential losses
to American aviation sector, the Congress passed the European Union Emissions Trading
Scheme Prohibition Act in 2011. The US and other countries argued that the EU threatened
their sovereignty by effectively taxing emissions resulting from activity effectuated over
international waters and their territory. Succumbing to these pressures, as well as to protests
on the part of industry, the EU regulator limited the scope of the ETS for aviation to flights
between airports of the countries participating in the system from 2013 to 2016 (European
Commission, 2015a). Development of EU policy concerning aviation has to be considered

20
alongside negotiations inside the International Civil Aviation Organisation (ICAO). Failure to
reach global agreement on limiting aviation emissions was an impulse that pushed the EU to
take leadership in the matter. Current negotiations concerning implementation of a global
market-based measure led the Commission to propose a continuation of current scope of ETS
until 2021. The proposal is currently discussed in the parliamentary committee.3
1.6.2. Phase 3
Problems with overallocation, price volatility and fraud in the first two phases of the ETS led
the Commission to introduce significant reforms in the third phase, as set out in the Directive
2009/29/EC. The scope of the system was broadened to include carbon capture and storage.
The structure of the system has been centralised. A single, union-wide cap was implemented,
replacing National Allocation Plans. Importantly, the cap was designed to decrease with time,
by 1.74 percent per year. Base year was set in the middle of the second phase of the ETS: in
2010. A central registry replaced the Community Independent Transaction Log. This time, an
online database held not only transaction logs, but also other information: the list of
installations covered by the ETS in each country, accounts of companies and individuals
holding allowances and verified CO2 emissions. An account in the Union registry became
indispensable to participate in the allowances market.
Auctioning became the main method of allowances assignment. The transition from the
previous phases, during which free allocation was dominant, was to be progressive. Free
allocation rules were the same for the whole Union. For the manufacturing sector, the system
was designed to promote carbon-efficient installations. Technical benchmarks were
developed, based on the 10 percent best-performing installations. In the manufacturing
industry, these installations received all of their allowances for free. Others had to buy a
proportion of their permits on public auctions. The exception was made for industries deemed
at risk by carbon leakage – these received a higher proportion of allowances for free.
Allowances for the power generation sector in the third phase were supposed to be assigned
uniquely by auctioning. An exception was set out in article 10c for some Member States,
taking into account their economic performance, energy mix, and the degree of integration
with European electricity network through the Union for the Coordination of Transmission of
Electricity.
3 Proposal for a Regulation of the European Parliament and of the Council amending Directive 2003/87/EC to continue current limitations of scope for aviation activities and to prepare to implement a global market-based measure from 2021, 2017/0017 (COD)

21
Figure 3. EU Emission Allowances, spot secondary market. Source: EEX
Reform of the ETS in the third phase did not solve all of the system’s problems. In fact, prices
did not increase after 2013, oscillating between 5€ and 8€, much lower than the minimal price
of 30€ recommended by the OECD. This price was judged as too low not only for reasons
concerning estimated social cost of emissions, but more importantly because of presumed lack
of incentive for economic actors to invest in low-carbon technology. At the beginning of the
third phase there was an estimated surplus of 2.1 billion allowances. According to European
Commission, this surplus would grow to 2.3 billion (Erbach, 2014). That is why the
Commission proposed two reforms in order to address this surplus. Firstly, in 2013, a
‘backloading’ amendment was introduced (after being initially rejected, and then significantly
modified by the European Parliament), delaying the auctioning of 900 million allowances that
was supposed to take place in 2014-2016 until the end of phase three.4 Secondly, as a more
systemic and long-term solution, the Commission proposed a Market Stability Reserve that
would automatically and temporarily remove excess allowances from the market. This
measure is being planned as an element of the ETS reform for phase four, and as such will be
considered in detail in the third part of this paper.
4 Commission Regulation No 176/2014 of 25 February 2014 amending Regulation (EU) No 1031/2010 in particular to determine the volumes of greenhouse gas emission allowances to be auctioned in 2013-20

22
2. Analysis based on FASTER principles
In the view of the European Commission, the EU ETS is considered to be a “cornerstone of
the EU’s policy to combat climate change” and a proof that “putting a price on carbon and
trading in it can work”.5 While acknowledging its shortcomings (volatility of prices in
particular), Commission upholds a view that the ETS serves it purpose. The Commission
estimates that by 2020 the system will lead to a 21% decrease of emissions compared to 2005
in the covered sectors, thus fulfilling the intended target.
This assessment, however, does not seem sufficient. Reaching targets should be an important,
but not the only factor taken into account while analysing an environmental policy. The ETS
does not exist in a vacuum; there are several other factors influencing emissions, such as
economic growth, technological developments, demography, and even other EU policies.
Achievement of targets can be easily examined; determining the exact impact of the ETS on
emission levels is an entirely different matter. It is also necessary to underline that emission
reductions are not the only consequences of the trading system. Directly and indirectly, the
ETS can affect and interact with inequalities, economic efficiency, competitiveness, labour
market, energy policy – to name just a few.
With the ETS escaping simple, one-dimensional analysis, a different approach seems
necessary. Researchers developed a great number of multi-criteria methods, and there is no
consensus concerning the most appropriate method of assessment of environmental policies.
International Panel on Climate Change combined most prevalent ideas to create a coherent,
four-criteria method intended for policy-makers to choose optimal environmental policy, and
to evaluate existing ones (Gupta et al., 2007). These criteria are: environmental effectiveness,
cost-effectiveness, distributional considerations and institutional feasibility. Some researchers
already used these criteria to assess the EU ETS (Venmans, 2012).
This study is based on the FASTER principles, outlined in the first part of the paper. It is an
approach very closely related to the one proposed by the IPCC. Environmental effectiveness
and cost-effectiveness are combined into one principle. Distributional considerations are
present in several others, including reliability and environmental integrity, and fairness.
FASTER principles also contain criteria absent from methodology proposed by the IPCC that
are relevant to the analysis of the ETS. Most notably, issues of transparency, stability, and
5 The EU Emissions Trading System (EU ETS), European Commission, Access: March 2016 https://ec.europa.eu/clima/policies/ets_en

23
alignment of policies and objectives, seem necessary to fully assess the EU ETS. The
importance of institutional feasibility has been demonstrated in the first part. It will not by
itself constitute a criteria for analysis in this chapter; it is more relevant for assessment of
proposed carbon pricing mechanisms. Since the EU ETS is already in place, its institutional
feasibility is incontestable.
The table below summarises the results of the analysis. The criteria of the analysis are
qualitative. Assessment is a result of the analysis performed comparing criteria provided by
the World Bank and the OECD with the functioning of the ETS. The last column –
assessment – reflects in simple terms the informed opinion of the author on the results of the
analysis.
Principle Positive elements Negative elements Assessment Fairness Redistribution
between countries, revenues used for climate and energy policy objectives
Low EUA prices, offsets, windfall profits, free allocation and carbon leakage rules, no revenues used for the most affected customers
Mixed/Negative
Alignment of policies and objectives
- Cancelling out effects of renewable and efficiency targets. National policies undermining the ETS
Negative
Stability and predictability
- Price volatility, surplus, ad-hoc policy fixes (backloading).
Negative
Transparency Centralised Union Registry, clear monitoring, reporting and verification rules, market oversight development, transparency constantly improving
Excessive use of international credits, VAT fraud
Positive
Efficiency and cost-effectiveness
Some abatement, low operational costs – only large emitters covered, but in many countries
Abatement small compared to the effects of the crisis; cancelling out other policies outweighs the effectiveness; little to no proof regarding
Mixed/Negative

24
inducing innovation
Reliability and environmental integrity
Some positive effect on local air pollution
Use of doubtful international credits; instability and low effectiveness
Mixed/Negative
2.1. Fairness
The first principle suggested by the OECD and the World Bank for successful carbon pricing
is also the most difficult to assess. It is based on the polluter-pays principle – a conviction that
the costs of transformation should be primarily borne by entities responsible for emissions. In
a sense, carbon pricing restores fairness: it annuls the competitive advantage of polluting
industries which do not take into account costs they inflict onto the society. The problem is
the most visible if we consider energy production. Let us take Germany as an example. At 3
percent discount rate, levelised cost of electricity production (LCOE) for a hard coal plant is
estimated at 34.24 EUR/MWh. LCOE for an offshore wind plant is much larger: 71.38
EUR/MWh (IEA; NEA; OECD, 2015). At this price level there is hardly any incentive to
invest in renewable energy. However, if we include a carbon price in our estimates of LCOE,
the results are radically different. Even with lower-end estimate of 30€ mentioned in the first
part of this paper, prices of these two energy sources converge.
It does not necessarily mean that carbon price should be equivalent to actual social cost
caused by GHG emissions in order for the system to be fair. Especially emission trading
systems do not fix carbon price at any level, concentrating instead on quantities of GHG
emitted. It does not change the fact that successful carbon pricing initiatives should make
polluting activities less profitable, as compared to low-emission or carbon-neutral activities.
Fairness of carbon pricing can also be understood as equitable cost distribution. Even though
in the long run emission reduction, and thus climate change mitigation, may help avoid
significant costs, in the short run transition costs are high, especially for sectors with high
emissions levels. This translates into two effects. Firstly, considering that carbon pricing
initiatives are not homogenous across the world, companies covered by such policies may
face unfair competition from enterprises in other countries or regions, which do not have to
bear the cost of carbon price. It creates an incentive for domestic companies to delocalise in
order to avoid these costs. This phenomenon, known as carbon leakage, is especially
pertinent for sectors that already are heavily traded and emission-intensive, such as steel or
cement. On the other hand, this problem is nearly non-existent in the energy sector, where

25
production is very difficult to delocalise. Secondly, in countries in which energy production is
emission-intensive, carbon pricing may lead to higher prices for consumers. This may
disproportionally impact lower-impact households; especially electricity and heating fuels
price increase has a strongly regressive effect (Thomas & Flues, 2015).
Another issue concerning fairness of carbon pricing is linked to revenues from such policies.
Not only carbon taxes bring revenues; in emission trading systems permits can be auctioned,
also providing income for the budget. When permits are traded, they are usually treated as any
other commodity, and thus they are susceptible to taxation, for instance via the value added
tax. That creates several issues concerning fairness: from distribution and uses of these
revenues, through grandfathering of permits for some companies in order to prevent carbon
leakage, to issues connected with taxation of emission trading.
2.1.1. Polluter-pays principle
At the end of each year, installations covered by the ETS need to return a number of
allowances equivalent to the amount of GHG they emitted. If their emissions exceed their
allowances, they must purchase additional permits on the market. If they fail to do so as well,
they have to face a fine of 100 €/tonne of CO2e, adjusted by inflation since 2013.
Additionally, the fine does not comprise emission permits costs; excess emissions are added
to the target for the following year. Furthermore, producers and aircraft operators that fail to
surrender appropriate amount of emission permits are subject to the “name-and-shame”
sanction – Member States have to publicly disclose their names (Directive 2003/87/EC,
Article 16).
It would appear that, at least in principle, polluter does pay in the sectors covered by the EU
ETS. One way or another, emitting installations need to acquire enough allowances to cover
their emissions. However, the EU ETS is not creating a level-playing field between polluting
and non-polluting sectors due to its low price levels. In order to fully internalize the
environmental externality, marginal cost of producing a unit of pollution should be equal to
the marginal social damage it causes. Such level of prices would create incentives for
producers to innovate and develop low-carbon technology (Nordhaus, 2011). Estimates of
social cost of GHG emissions vary, but there can be no doubt that the current price of between
5€ and 8€ per tonne of CO2e does not even come close to that level.
While due to low prices the “polluter” does pay, but not enough to foster innovation in low-
carbon technologies, there are cases where polluters pay even less, or are not required to pay

26
at all. Despite significant increase of the amount of allocations that are being auctioned, over
the 2013-2020 period 43 percent of allocations are still distributed for free.6 This is mostly
explained by carbon leakage threat that will be discussed further on. But even producers that
do not receive allocations for free do not necessarily have to pay the market price for them.
Market participants may use international credits from the Kyoto protocol in the place of
EUAs. These credits, theoretically representing offsets elsewhere on the Planet, were largely
used especially during the second phase of the ETS, after the Commission announced that
some of these offsets will no longer be accepted as of beginning of phase three. In the second
phase, offsets from Kyoto protocol represented around 1 Gt of CO2e. The price of these
offsets was lower still than the price of EU allowances. Owing to the fact that the EU was the
only major participant in the Kyoto offset market, price of international credits oscillated
below 1€/tonne (de Perthuis & Trotignon, 2014).
2.1.2. Cost distribution
From the perspective of fairness, cost distribution in the EU ETS can be understood in two
ways. Firstly, it concerns cost distribution between companies, both inside and outside of the
EU. Secondly, it concerns cost distribution within the society.
The ETS purposely does not comprise all economic agents in the EU. Only the most GHG-
intensive sectors are covered. Initially, the ETS included the power sector (combustion plants
of over 20 MW) and parts of manufacturing industry, including oil refineries, coke ovens,
glass, lime, ceramics, cement production, and iron and steel plants. From 2012 the aviation
sector was added, but only for flights between participating countries. Phase three saw some
other sectors covered, including aluminium, petrochemicals and CO2 capture and storage. All
that accounts for around 50 percent of GHG emissions in participating countries (European
Commission, 2015a). Targeting the biggest and the most polluting installations makes
oversight and management of the system much easier. It is unlikely that EU ETS will include
many other sectors in the future.
Not all installations get equal treatment. As mentioned above, in the third phase a significant
number of allowances is given out for free (grandfathered). Given that the EU ETS is by far
the largest carbon pricing initiative in the world, companies could be incentivised to move
their production to a region without such environmental policies in place. This potential
6 Free allocation, European Commission, access: March 2017 https://ec.europa.eu/clima/policies/ets/allowances_en

27
problem affects some sectors more than others; energy production, for instance, is very
difficult to move abroad.
Free allocation in the EU ETS is based on benchmarks, which are fixed for the whole third
phase of the program. Benchmarks are defined in tonnes of CO2 per 1000 tonnes produced
(that is: how many tonnes of CO2 is emitted while producing 1000 tonnes of product), and are
based on 10 percent most carbon-efficient producers. In other words, the more carbon-
efficient production process, the more allowances are allocated for free. In principle,
electricity producers do not receive any free allowances, with an exception of 8 EU countries
that joined the Union in 2004 and receive conditional free allowances for the modernisation of
their energy sectors. Most other sectors receive some free allowances based on their carbon-
efficiency. The proportion of free allowances is decreasing with time. In 2013 it was 80
percent of the benchmark; the proportion is decreasing linearly to reach 30 percent in 2030.
Finally, some sectors, deemed particularly exposed to carbon leakage risks, receive 100
percent of the benchmark value for free. Current list of such sectors for the period of 2015-
2019 is outlined in the Commission Decision of 27 October 20147, and is based on article 10a
of the ETS Directive.8
Choice of the sectors exposed to carbon leakage is based on a set of seemingly objective
criteria. Two factors are taken into account: direct and indirect costs borne by companies
because of the participation in the ETS, and trade intensity with non-EU countries. However,
these criteria are questionable and there are important doubts concerning the very existence of
the ‘carbon leakage’ phenomenon. In particular, the costs of ETS participation for companies
are calculated based on assumed carbon price of 30 €. The actual price of ETS allowances is
several times lower, oscillating between5€ and 8€ at the time of writing (EEX Primary
Auction Market, August 2017). Not to mention that even sectors absent from the carbon
leakage list receive a proportion of their allowances for free. This price is justified in the
Decision by a conviction that the price is going to increase in the future, given the ambitious
target for emission reductions in the period between 2020 and 2030, and the proposed
7 Commission Decision of 27 October 2014 determining, pursuant to Directive 2003/87/EC of the European Parliament and of the Council, a list of sectors and subsectors which are deemed to be exposed to a significant risk of carbon leakage, for the period 2015 to 2019, 2014/746/EU 8 Directive 2003/87/EC of the European Parliament and of the Council of 13 October 2003 establishing a scheme for greenhouse gas emission allowance trading within the Community and amending Council Directive 96/61/EC

28
establishment of Market Stability Reserve. This argument is dubious as best, considering the
current Decision only concerns the period of 2015-2019.9
Furthermore, researchers and analysts have called the importance of carbon leakage threat
into question. A review of literature conducted by the OECD found no evidence of
economically meaningful effects of carbon pricing initiatives on competitiveness. Some
studies compared firms receiving preferential treatment to companies having to pay full rate,
and found no difference in competitive position in either of these groups (Arlinghaus, 2015).
It may be explained by low carbon price levels or by the importance of other factors
influencing investment decisions, such as availability of capital and skilled workforce, quality
of institutions or proximity to markets (World Bank & OECD, 2015). Regardless of the
explanation, current carbon leakage rules raise many questions concerning fairness. In a
sense, grandfathering of permits resembles tax expenditure, because potential revenues from
auctioning are forgone (OECD, 2016). Thus, any decision concerning free allocation should
be based on strong argumentation, which is clearly not the case in the EU ETS. Moreover, the
sectors not included in the carbon leakage list are treated unfairly, given that they are the ones
bearing the costs of continuously increasing proportion of auctioned allowances.
2.1.3. Costs for customers
When it comes to distributional effects of EU ETS, there is a great discrepancy between
income groups. In the long run, poorer households benefit from climate policies, because they
are the ones that are the most vulnerable to risks caused by negative externalities of GHG
emissions: from local pollution to exposure to extreme weather events. Paradoxically, in the
short run, these income groups are most likely to be negatively affected by climate policies.
There is a non-negligible risk of carbon price being translated into higher energy cost (World
Bank & OECD, 2015). Lower income groups spend the biggest share of their disposable
income on energy, thus transition costs fall disproportionately on them. The extent of this
disproportion varies across sectors; while transport fuel taxes in developed countries may
have a proportional, or even progressive effect, taxes on heating fuels, and especially
electricity taxes, tend to have a regressive effect (Thomas & Flues, 2015). Aside from
distribution among income groups, the EU ETS faces a challenge of fair distribution among
participating countries. Member States differ with regard to economic performance, energy
mix and historical emissions.
9 Commission Decision of 27 October 2014…

29
Due to low prices and widespread grandfathering, one may assume that costs for the
customers, as for the countries, are negligible. Actual costs are difficult to quantify, and the
issue requires further investigation, but there are reasons to expect the prices to increase even
in sectors benefiting from free allocation. The effect of passing through the cost of allocations
received for free is called “windfall profits”. Energy generation is excluded from
grandfathering, but there is evidence that indicates that low-carbon electricity producers
(nuclear, for instance) also pass through the costs onto customers, profiting from competitive
advantage induced by the ETS (Venmans, 2012).
Unfair cost distribution can be dealt with using revenues from auctioning. That is the case in
several carbon pricing initiatives around the world. In the North-eastern US, the Regional
Greenhouse Gas Initiative invests profits from its ETS into energy efficiency programs and
direct rate relief for customers in need. British Columbia’s carbon tax program foresees a tax
credit for low-income households that is in fact greater than costs borne by these households
due to carbon tax (World Bank & OECD, 2015)
The EU ETS does have a revenue distribution system in place, but it is targeting countries,
rather than affected groups of population. The ETS Directive regulates the distribution of
allowances to be auctioned by each member state. 88 percent of these allowances are
allocated according to the amount of verified emissions at the beginning of the ETS, 10
percent is given to the least wealthy Member States for the purpose of solidarity and growth,
and 2 percent constitute a bonus for these participating countries whose emissions in 2005
were at least 20 percent below their Kyoto emission targets. The use of revenues is
determined by participating countries. However, at least 50 percent of revenues has to be used
for policies related to climate and energy, specified in the Directive. Member States have to
report on the amount raised from auctioning and the use of revenue in their yearly reports10.
In 2015, for instance, Member States reported €4.9 billion of revenues from auctioning of
emission allowances. Member States exceeded the required percentage of revenues to be used
for climate related purposes, spending (or at least declaring to spend) 77 percent of revenue
for such policies. Proportion of revenues spent on specific areas vary across the participating
countries. On average, Member States choose mainly investments in renewable energy and
energy efficiency (European Commission, 2016)
10 Article 17 of Regulation (EU) No 525/2013 of the European Parliament and of the Council of 21 May 2013

30
Revenues are, therefore, used for the purposes of climate change mitigation, which may prove
profitable for the least wealthy households in the long run. They are also to some extent
redistributed between countries according to their prosperity. On the other hand, the short-
term issue of passing through the cost of ETS onto consumers, disproportionately affecting
the lowest income groups, is not addressed on the EU level. There is also a question of limited
size of these revenues, caused by both free allocation and low prices of allowances.
The question of revenues has to be juxtaposed with the issue of VAT fraud. According to
some estimates, the possible losses of European taxpayers only between 2008 and 2009 may
have reached € 6-8 billion, if we include over-the-counter transactions (Frunza & Guegan,
2011). Aside from dealing an enormous blow to credibility and integrity of the ETS, the
missing trader fraud scheme costed more than yearly revenues from the ETS in its third phase.
Not to mention that in previous phases (before 2013) revenues from auctioning were even
smaller, as an even greater proportion of allocations was grandfathered. While after the
breakdown of the VAT fraud scandal measures were implemented to prevent the phenomenon
from repeating itself, such as reverse charge mechanism, a report of European Court of
Auditors in 2015 found that in some countries such preventive measures were still not
implemented. Therefore, the EU ETS is still at risk of VAT fraud (European Court of
Auditors, 2015).
To conclude, the principle of fairness is multi-dimensional and difficult to assess. However, it
would appear that in every aspect – polluter-pays principle, distribution of costs among
participants and protection from disproportional effects on the least wealthy parts of the
population – the EU ETS has its shortcomings.
2.2. Alignment of policies and objectives
The EU ETS is not the only climate policy of the European Union. Policies employed in the
same domain interact with each other in various ways. Some complement the trading system,
facilitating long-term investments in low-carbon technologies, increasing the impact of carbon
pricing in the economy. Others have the opposite effect, directly or indirectly undermining the
effectiveness and efficiency of the ETS. The case of the EU is particularly complex, because
both energy and environmental policies are shared competences11. It means that not only other
EU policies affect the ETS, but also the ones conducted by individual Member States.
11 Articles 191 and 194 of the Treaty on the Functioning of the European Union

31
2.2.1. EU policies
Climate policy objectives in the EU are constructed around three targets: GHG emissions
reductions, percentage of renewables in energy production and improvement in energy
efficiency. Current targets for 2020 are conveniently set at 20 percent for each area. Targets
for 2030 are set at 40 percent for GHG emissions reduction and at 27 percent for both share of
renewable energy and improvement in energy efficiency. The latter targets are not yet
confirmed by legislation, but the European leaders declared their commitment to them in
European Council (European Council, 2014).
Consequentially, the EU Climate legislation can also be divided between three areas.
Emission reduction is dealt with mostly by the ETS, and for the sectors not participating in
emission trading – the effort sharing decision (ESD). The ESD outlines emission reduction
targets for each individual member state, based on their relative wealth. Poorest countries are
allowed to increase their emissions in these sectors, while the richest ones have to make
additional efforts. The ESD only outlines the targets; it is for the Member States to implement
policies in order to meet them.12
For the energy efficiency targets, the Member States do have some flexibility, but the EU
legislation is far more strict. Most important piece of legislation, Energy Efficiency
Directive13, outlines specific measures that have to be implemented by Member States, such
as energy savings made by energy distribution, increasing energy efficiency and thermal
performance of publicly owned buildings, enabling citizens access to data on energy
efficiency so that they can better manage consumption, and others. Every three years Member
States have to draw up plans containing measures they want to implement, and every year
they have to report the progress towards targets outlined in the directive. Energy Efficiency
Directive is the main, but not the only legislative act influencing energy efficiency. Others
include directives on Eco-design, energy labelling and energy performance of buildings.
12 Decision No 406/2009/EC of the European Parliament and of the Council of 23 April 2009 on the effort of Member States to reduce their greenhouse gas emissions to meet the Community’s greenhouse gas emission reduction commitments up to 2020 13 Directive 2012/27/EU of the European Parliament and of the Council of 25 October 2012 on energy efficiency, amending Directives 2009/125/EC and 2010/30/EU and repealing Directives 2004/8/EC and 2006/32/EC Text with EEA relevance

32
The renewables directive14 indicates national targets for the percentage of renewable energy,
but leaves the attainment of these targets to the Member States. Additionally, it establishes
procedures allowing countries to cooperate. Under statistical transfers mechanisms, countries
that have exceeded their targets can “sell” the excess proportion to other countries. That way,
countries with bigger potential for renewables, such as Spain with solar energy, are
encouraged to invest despite having achieved their targets. Moreover, other countries can
attain their targets in a cheaper way. Member States are also encouraged to engage in
cooperative projects via Joint Projects and Joint Support Schemes mechanisms.
While the ESD may not have a direct impact on the ETS, because it concerns different
sectors, other policies do influence the system in a major way. The list of policies interfering
with the ETS is by no means complete. All in all, the outcome of these policies is an emission
reduction, also in the ETS sectors. These emission reductions are putting a downward
pressure on already low prices of allowances, and lead to accumulation of allowances, which,
considering the possibility of banking these allowances, threatens to “lock-in” emission
reductions for the future. Additionally, overlap of the ETS and other policies could be
cancelling out some of the effects of the latter. Extent of the overlap is controversial. Höhne
et. al. (2011) suggest that full implementation of renewable energy and efficiency legislation
on themselves would lead to an emission reduction of 30 percent by 2020 (instead of 20
percent foreseen for that period). Morris (2013) estimates that between 2008 and 2020, the
ETS cancels out 700 million tonnes of emission reductions delivered by other policies,
making the ETS effectively an anti-climate policy.
2.2.2. National policies
The EU is active in the field of climate policies, but it does not stop some Member States
from implementing their own measures. Such policies may have distortionary effects on the
EU ETS. If one Member State implements a policy that would impose emission reduction for
domestic companies, it causes an excess of EU allowances in that country. It can cause an
internal “emission leakage” – companies would sell unused allowances to other countries,
putting a downward pressure on allowance prices (Goulder, 2013). That was exactly the case
when the UK implemented a carbon tax for energy production, independent from EU ETS.
Since 2013 energy producers in the UK have to pay a “Climate Change Levy”, depending on
14 Directive 2009/28/EC of the European Parliament and of the Council of 23 April 2009 on the promotion of the use of energy from renewable sources and amending and subsequently repealing Directives 2001/77/EC and 2003/30/EC

33
the carbon content of primary fuel. Essentially it creates a unilateral carbon price floor. While
the policy should indeed decrease emissions in the UK, it will cause a further decrease in
EUA’s price, reduce the economic efficiency of the EU ETS and decrease revenue from
auctioning for other Member States (Sartor & Berghmans, 2011).
Climate policies of individual Member States, such as the British carbon tax, distort the
functioning of the ETS despite having similar goals. However, some countries implement
policies that go directly against the goals of the ETS, leading to increased emissions. Fossil
fuel subsidies are a good example. While fossil fuel subsidies in the EU are relatively small
compared to other regions (Bárány & Grigonytė, 2015) they are not completely absent.
ECOFYS report (Alberici et al., 2014) found that in 2012 support for fossil fuels (excluding
transport) amounted to €16.3 billion, of which €9.7 billion went to coal and the rest to natural
gas. The European Commission recognised the counterproductivity of fossil fuel subsidies in
the view of emission reduction goals and is working to curb them, for example by limiting
state aid for uncompetitive coal mines.15
Of all issues and weaknesses of the EU ETS, the alignment and policies and objectives is
especially worrying. Despite having been adopted as a “climate and energy package”, EU
legislation on renewable subsidies, energy efficiency and emission trading is uncoordinated.
Policy measures not only do not complement each other; there is evidence that indicates that
to some extent they undermine each other’s effectiveness. On the level of coordination of
national policies the EU takes steps to curb fossil fuel subsidies and other harmful measures.
At the same time, individual countries’ climate policies are making a disservice to the entirety
of ETS, contributing to problems already faced by the system.
2.3. Stability and predictability
The question of stability and predictability of carbon prices is a key issue for economic
policies aimed at emissions reduction. The trade-off between price stability and flexibility is
the key difference between carbon taxes and trading systems. Carbon taxes give the regulator
complete control of carbon price. It does not, however, guarantee results in terms of
quantities; emission reduction depends on various exogenous factors. Conversely, emission
trading ensures the quantity of emissions reduction, but leaves the price to the market forces.
Controlling quantities has a considerable advantage in situations in which marginal utility of
15 Council Decision 2010/787/EU of 10 December 2010 on State aid to facilitate the closure of uncompetitive coal mines

34
an additional amount of pollution can change drastically after exceeding some critical point,
as it may well be with GHG emissions. As Weitzman puts it in his pivotal paper Prices Vs.
Quantities: “(…) Our intuitive feeling, which is confirmed by the formal analysis, is that it
doesn’t pay to ‘fool around’ with prices in such situations” (Weitzman, 1974, p.486).
It is not always optimal for the prices to be entirely market-based in emission trading systems.
There are important arguments for a stable and gradually increasing carbon price. Such price
promotes long-term investments in sustainable technologies, allowing both firms and
consumers to adapt at least cost. It promotes innovation and increases social and business
support for the system.
The EU ETS is a part of a larger framework with clearly set targets for emissions reduction.
The EU-wide cap on emissions since the beginning of the third phase decreases by 1.74
percent every year, compared to the average cap during second phase. And yet, the carbon
price is neither stable nor decreasing. Over the course of the functioning of the system the
price has fallen and risen repeatedly, reaching almost € 30 in 2008 and falling to nearly € 3 in
2013 (see figures 2 and 3). Volatility of prices can be explained by a variety of factors. A
regression analysis prepared by Koch et. al. (2014) proved a statistically significant
relationship between EUA prices and economic performance, wind and solar energy
deployment, and (to a lesser extent) amount of surrendered international credits and fuel
prices. Still, the model only explained approximately 10 percent of variation of EUA prices.
2.3.1. Intermediate reforms
Price instability was recognised as a problem from the very beginning. After an EU-wide,
decreasing cap introduced by the third phase failed to deliver a reliable and stable price
increase, a temporary reform was introduced by the means of backloading. It was decided that
between 2014 and 2016 auctioning of 900 million of allowances will be postponed. The
Commission was hoping to increase the prices and to decrease the amount of surplus, which
has accumulated to over 2 billion EUAs.

35
Figure 4. Emissions, allowances, surplus and prices in the EU ETS, 2005–2015 (EEA 2016)
Indeed, the surplus of allowances decreased for the first time as a result of backloading.
Initially the EUA prices also increased, but only to return to the level of around € 5 at the
beginning of 2016 (Figure 3). It is a logical consequence of backloading policy: market
participants knew that allowances removed from the market will be returned between 2019
and 2020. It made sense to use accumulated allowances, with the perspective of restocking
reserves in the near future.
2.3.2. Predictability
Backloading reform was intended to be a short-term solution. Regardless of its effectiveness,
it is necessary to underline its impact on the predictability of the EU ETS. Backloading
amendment came into force only a year after the beginning of the third phase of the ETS. A
phase which brought major changes itself. Even though the reforms, due to the institutional
decision-making process of the EU, take significant time between announcement and
implementation, the legislative process in itself is a factor contributing to price volatility in
the ETS, especially given the fact that the ETS is a highly contentious issue. Koch et. al.
(2015) analysed market reactions to the legislative process behind backloading reform. Initial
announcement of the Commission’s proposal resulted in a modest price increase on the first
day, followed by a drastic decrease in the following days. Afterwards, an unexpected vote of

36
the European Parliament rejecting the first of Commission’s backloading proposals led to a 43
percent decrease in EUA’s futures price in only one day. On the other hand, when the
backloading reform finally did get adopted, the price increase was negligible. Overall, the
whole process did not increase level of prices, but contributed to volatility and further
decreased predictability of the ETS.
Stability and predictability issues are inherent to the flexible design of an emission trading
system. There are several instruments design to limit this problem, from price floors, ceilings
or collars to market oversight bodies, able to intervene in the market but independent from
political forces. The EU ETS reform foresees a long-term solution in the form of Market
Stability Reserve. This policy choice will be assessed in the final part of this paper.
2.4. Transparency
Transparency and clarity are essential in the design of an ETS. Communication with
stakeholders and their involvement in the consultations increases trust and allows for a
smoother transition into the low-carbon economy. Market oversight and clear monitoring,
reporting and verification (MRV) rules are necessary to avoid abuse and ensure a level-
playing field for participants. The system should be easy to understand and all relative
information should be made publicly available. All this does not only ensure support of
stakeholders, such as affected companies, environmental organisations and business interest
groups, but also provides foundations for a wider public support.
2.4.1. The Union Registry
The approach to registering allowances and transactions in the EU ETS evolved over time.
During the first two phases the registering system was designed to match decentralised
structure of the ETS. Emission caps were set on the country-level, and so were registries.
Community Independent Transaction Log aggregated the data from national registries. With
the introduction of an EU-wide cap, the system was centralised, and its scope was broadened.
Today, the Union registry holds data on all allowances and transfers happening in the system.
Every participant has to have an account – it concerns operators covered by the ETS, but also
banks, brokers and individuals willing to participate in trading. While most of the trading is
now dealt with on the European Energy Exchange (EEX), an exchange market, most shares
ofwhich are held by a Deutsche Börse subsidiary, all transactions have to be approved by an
automatic EU Transaction Log. In order to prevent fraudulent activities the system is
frequently updated, and involves several security features, such as a two-step authentication

37
and a pending period for transactions of allowances (Delbeke & Vis, 2015). The data from the
registry is publicly available.16
The registry is connected to the International Transaction Log, which is a registry of
international credits under the Kyoto protocol, and is managed by the UNFCCC Secretariat.
Use of international credits causes problems for the EU ETS transparency and integrity, as
verification of these credits is beyond the Union’s control. With growing controversies about
international credits, their use in the ETS has become more and more restricted.
Environmental integrity concerns regarding international credits will be explained in the sixth
chapter of this part.
2.4.2. Monitoring, reporting and verification
Similarly to the Union Registry, MRV rules underwent an evolution since the beginning of
the ETS. The necessity to establish a stringent framework for MRV became apparent after the
first phase (2005-2007). Initially, the allocation was based on historical emissions. The
schedule for implementation of the ETS proved to be too ambitious for the Member States
who did not previously gather such information to establish a dedicated legal authority.
Therefore, emission data needed to be gathered in cooperation with the industry. Relatively
few instances of fraudulent submissions were reported (Ellerman & Buchner, 2007).
However, the data for the initial year of the functioning of the system does appear inflated
when compared to the date for subsequent years. It is clear that there were incentives in the
industry to report higher emissions in order to receive more allocations (Anderson & Di
Maria, 2011).
In the third phase of the ETS auctioning became the default method of allocation and up to
this day grandfathered allowances are based on performance benchmarks rather than on
historical emissions. Still, accurate measurement of emissions remains necessary. Technical
rules on monitoring and reporting of emissions are regulated by the Commission.17 The EU
ETS requires also an independent, third-party verification. Verifiers have to be accredited;
16 Climate Action, European Union Transaction Log, access: April 2017 http://ec.europa.eu/environment/ets/welcome.do?languageCode=en 17 Commission Regulation (EU) No 601/2012 of 21 June 2012 on the monitoring and reporting of greenhouse gas emissions pursuant to Directive 2003/87/EC of the European Parliament and of the Council

38
common rules apply in all participating countries when it comes to accreditation process and
recognition of accreditation from other countries.18
2.4.3. Market oversight
Emission trading for greenhouse gasses is a relatively new policy and the EU ETS was one of
the first of such schemes introduced in practice. In addition to the lack of previous experience,
the unique, multi-level structure of the European Union added complication to the case. It
comes as no surprise that so many rules were developed and changed between the phases of
the ETS. It was not different when it comes to market oversight. On some levels the existing
framework for financial instruments was sufficient to prevent fraud and money laundering.
Most trade in the EUAs takes place on the “futures” market – where buyer acquires an
emission permit that is delivered on a future fixed date. This market was sufficiently protected
by pre-existing rules (Delbeke & Vis, 2015).
However, the spot market for emission permits was initially far less regulated. Emission
permits have a double status: they may be treated as a commodity, or as a financial instrument
(Frunza & Guegan, 2011). The VAT fraud, discussed above, was the result. Following the
scandal more strict rules were introduced, including reverse charging for VAT and a
centralised registry, allowing for a closer and more precise verification of transactions on the
EUA market. Each year, the Commission has to report on the functioning of the carbon
market (Delbeke & Vis, 2015) Market oversight over the ETS is still a work in progress.
Measures preventing speculation, money loundering, and further improving transparency are
to come into effect in 2018.19
Despite initial hurdles with historical emission data, the costly VAT fraud scandal, and
questionable offset usage, the EU ETS has to be lauded for its transparency. Continuous
efforts are made to make information full and accessible for all participants, as for general
public. Monitoring, reporting and verification rules are consistent and clear, assuring a
reliable information about emissions. Frequency of reforms, although damaging for stability
and predictability, creates conditions for continuous improvements and learning-by-doing.
Mistakes are made, but (at least in this field) they are being swiftly corrected.
18 Commission Regulation (EU) No 600/2012 of 21 June 2012 on the verification of greenhouse gas emission reports and tonne-kilometre reports and the accreditation of verifiers pursuant to Directive 2003/87/EC of the European Parliament and of the Council 19 Ensuring the integrity of the European carbon market, European Commission, access: April 2017; https://ec.europa.eu/clima/policies/ets/oversight_en

39
2.5. Efficiency and cost-effectiveness
Cost-effectiveness is at the very core of carbon pricing initiatives, and of economic climate
policies as a whole. The promise behind such policies is to deliver desired results cheaper
than the command-and-control approach policies, using market forces. Aside from that, cost-
effectiveness includes minimisation of administrative cost, for economic policies require less
information than direct regulation. Revenues from carbon taxes or auctioning of emission
permits, if used productively, can further decrease policy costs.
Cost-effectiveness of an emission trading system depends on a variety of factors. It can be
amplified by increasing the number of sectors covered, increasing their heterogeneity,
choosing the right method of allocation of allowances and ensuring international cooperation.
But in principle, cost-effectiveness is about delivering results at least cost. Therefore, before
engaging in an analysis of cost effectiveness, it is necessary to determine to what extent did
the EU ETS contribute to emission reduction.
2.5.1. Efficiency
Targets for emission reduction for 2020 have already been exceeded in the European Union.
As of 2014, GHG emissions decreased by 22.9 percent, or by 1 136 million tonnes of CO2e,
compared to the baseline year of 1990. It is unclear how much of this reduction can be
attributed to emission trading. A review of (surprisingly scarce) literature performed by Laing
et. al. (2014) shows about 40-80 million tonnes of emission reductions attributable to the ETS
per year, but only for the first phase between 2005 and 2007. Afterwards, the abatement
becomes even more difficult to approximate, given the immense impact of the economic
crisis. Bel and Joseph (2015) attempt to evaluate abatement in the EU ETS in the first two
phases (2005 – 2012), and to disentangle emission reduction resulting from the policy from
those resulting from economic downturn. Using historical data and a dynamic regression
model authors estimate that of 294.5 million tonnes CO2e of recorded reductions, between
33.78 and 40.76 million tonnes may be attributed to the ETS. The authors note that the crisis
had a much larger role in emission reductions in the examined period, and that ex-ante
analyses of EU ETS grossly overestimated the reductions resulting from the policy. These
emission reductions have to be juxtaposed with the potential cancellation of emissions
resulting from other policies, particularly from renewable energy and efficiency targets. The
issue requires more research, but if the data of UK-based think tank Sandbag is to be believed,
the ETS will cancel out 700 million tonnes of CO2e emissions resulting from other policies
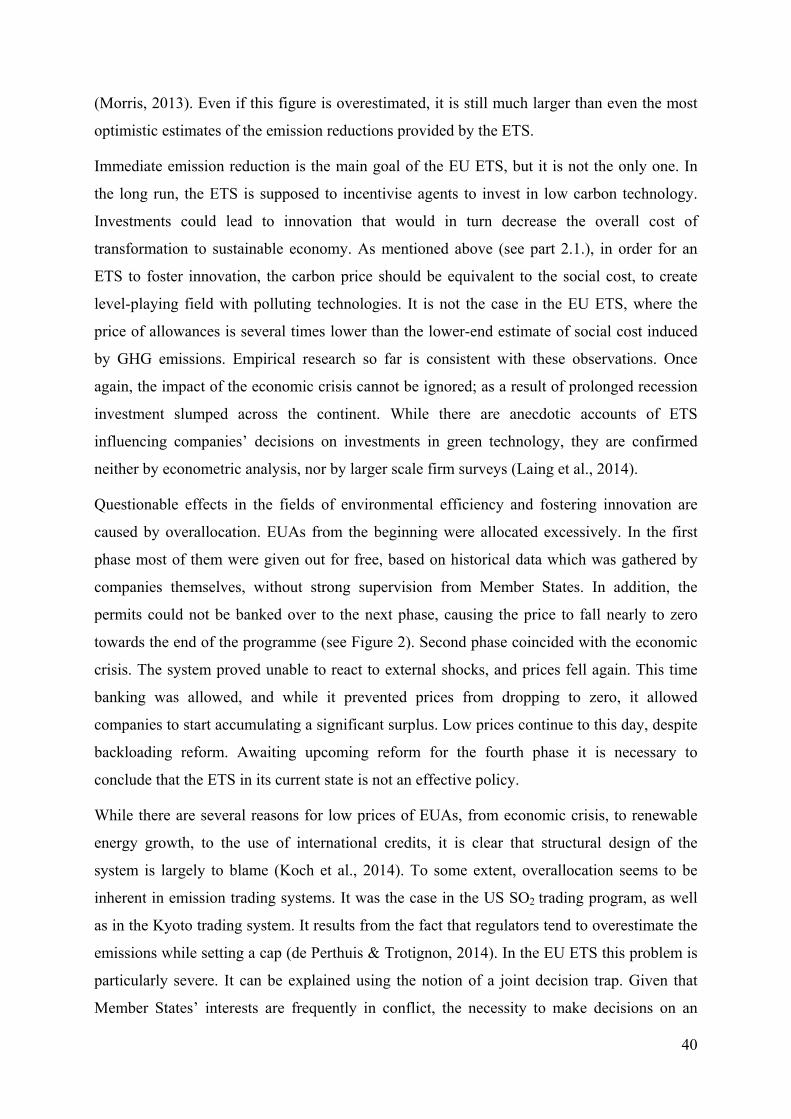
40
(Morris, 2013). Even if this figure is overestimated, it is still much larger than even the most
optimistic estimates of the emission reductions provided by the ETS.
Immediate emission reduction is the main goal of the EU ETS, but it is not the only one. In
the long run, the ETS is supposed to incentivise agents to invest in low carbon technology.
Investments could lead to innovation that would in turn decrease the overall cost of
transformation to sustainable economy. As mentioned above (see part 2.1.), in order for an
ETS to foster innovation, the carbon price should be equivalent to the social cost, to create
level-playing field with polluting technologies. It is not the case in the EU ETS, where the
price of allowances is several times lower than the lower-end estimate of social cost induced
by GHG emissions. Empirical research so far is consistent with these observations. Once
again, the impact of the economic crisis cannot be ignored; as a result of prolonged recession
investment slumped across the continent. While there are anecdotic accounts of ETS
influencing companies’ decisions on investments in green technology, they are confirmed
neither by econometric analysis, nor by larger scale firm surveys (Laing et al., 2014).
Questionable effects in the fields of environmental efficiency and fostering innovation are
caused by overallocation. EUAs from the beginning were allocated excessively. In the first
phase most of them were given out for free, based on historical data which was gathered by
companies themselves, without strong supervision from Member States. In addition, the
permits could not be banked over to the next phase, causing the price to fall nearly to zero
towards the end of the programme (see Figure 2). Second phase coincided with the economic
crisis. The system proved unable to react to external shocks, and prices fell again. This time
banking was allowed, and while it prevented prices from dropping to zero, it allowed
companies to start accumulating a significant surplus. Low prices continue to this day, despite
backloading reform. Awaiting upcoming reform for the fourth phase it is necessary to
conclude that the ETS in its current state is not an effective policy.
While there are several reasons for low prices of EUAs, from economic crisis, to renewable
energy growth, to the use of international credits, it is clear that structural design of the
system is largely to blame (Koch et al., 2014). To some extent, overallocation seems to be
inherent in emission trading systems. It was the case in the US SO2 trading program, as well
as in the Kyoto trading system. It results from the fact that regulators tend to overestimate the
emissions while setting a cap (de Perthuis & Trotignon, 2014). In the EU ETS this problem is
particularly severe. It can be explained using the notion of a joint decision trap. Given that
Member States’ interests are frequently in conflict, the necessity to make decisions on an
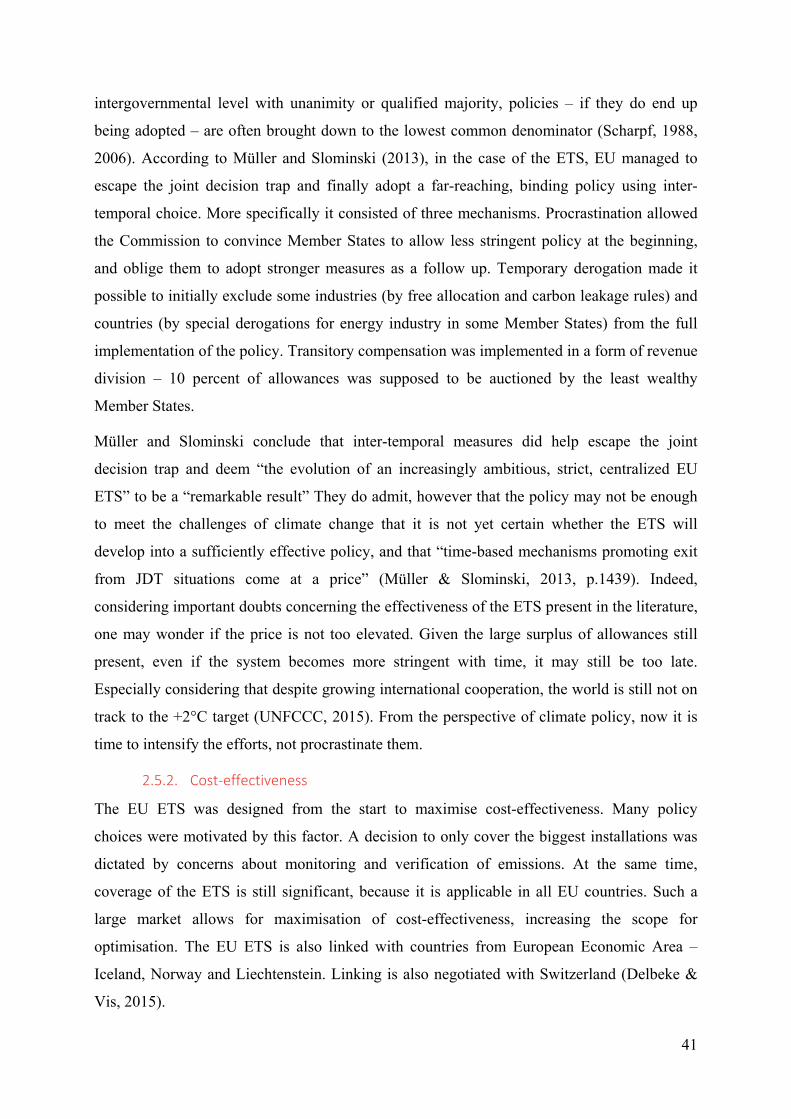
41
intergovernmental level with unanimity or qualified majority, policies – if they do end up
being adopted – are often brought down to the lowest common denominator (Scharpf, 1988,
2006). According to Müller and Slominski (2013), in the case of the ETS, EU managed to
escape the joint decision trap and finally adopt a far-reaching, binding policy using inter-
temporal choice. More specifically it consisted of three mechanisms. Procrastination allowed
the Commission to convince Member States to allow less stringent policy at the beginning,
and oblige them to adopt stronger measures as a follow up. Temporary derogation made it
possible to initially exclude some industries (by free allocation and carbon leakage rules) and
countries (by special derogations for energy industry in some Member States) from the full
implementation of the policy. Transitory compensation was implemented in a form of revenue
division – 10 percent of allowances was supposed to be auctioned by the least wealthy
Member States.
Müller and Slominski conclude that inter-temporal measures did help escape the joint
decision trap and deem “the evolution of an increasingly ambitious, strict, centralized EU
ETS” to be a “remarkable result” They do admit, however that the policy may not be enough
to meet the challenges of climate change that it is not yet certain whether the ETS will
develop into a sufficiently effective policy, and that “time-based mechanisms promoting exit
from JDT situations come at a price” (Müller & Slominski, 2013, p.1439). Indeed,
considering important doubts concerning the effectiveness of the ETS present in the literature,
one may wonder if the price is not too elevated. Given the large surplus of allowances still
present, even if the system becomes more stringent with time, it may still be too late.
Especially considering that despite growing international cooperation, the world is still not on
track to the +2°C target (UNFCCC, 2015). From the perspective of climate policy, now it is
time to intensify the efforts, not procrastinate them.
2.5.2. Cost-effectiveness
The EU ETS was designed from the start to maximise cost-effectiveness. Many policy
choices were motivated by this factor. A decision to only cover the biggest installations was
dictated by concerns about monitoring and verification of emissions. At the same time,
coverage of the ETS is still significant, because it is applicable in all EU countries. Such a
large market allows for maximisation of cost-effectiveness, increasing the scope for
optimisation. The EU ETS is also linked with countries from European Economic Area –
Iceland, Norway and Liechtenstein. Linking is also negotiated with Switzerland (Delbeke &
Vis, 2015).

42
The insistence on cost-effectiveness also led to some of the issues described in other parts of
this paper. International credits were such an initiative, providing firms with even cheaper
emission allowances. Due to environmental concerns, most of the international credits were
forbidden from the ETS after phase two. In addition, their usage further lowered EUA prices
and undermined the polluter-pays principle (see part 2.1.1.). Carbon leakage rules, designed to
avoid costs linked with industry delocalising to regions without similar regulations, are also
questionable due to unconfirmed scope of the phenomenon and the negative impact for
competition inside of the EU.
Overall, possibilities of a cost-effectiveness analysis of the EU ETS are limited, due to
questionable environmental efficiency, both in terms of reducing emissions reduction and in
fostering innovation. At the same time, it is important to observe that cost-effectiveness
concerns are behind some reasons of the EU ETS’ underperformance. Grandfathering of
permits and overallocation was motivated by a desire to put as little pressure as possible on
the manufacturing sector. In consequence, the small burden that was put on the industry’s
shoulders resulted in a comparatively small achievements in terms of emissions reduction.
2.6. Reliability and environmental integrity
The sixth and final principle for successful carbon pricing draws heavily from previous ones.
The question of reliability concerns the ability of the system to deliver desired results. To that
extent, it overlaps with efficiency and environmental efficiency. Furthermore, reliable carbon
pricing instrument requires a stable and consistent price signal, building trust among
participants and fostering long-term investments in low-carbon technologies. In that part, it
overlaps with alignment of policies and objectives, as well as with stability and predictability,
and to some measure with transparency. Environmental integrity concerns side effects of the
ETS, its potential benefits and threats. To avoid repetition, this part will concentrate on
environmental integrity, especially the effects of the ETS on air pollution and questions of
environmental integrity, before briefly summarising the reliability of the ETS using
argumentation developed in previous principles.
2.6.1. Local benefits – impacts on air pollution
In order to fully assess the impact of the EU ETS it is necessary to go beyond emission
reductions it provokes. Even more so if, as proven above, the ETS contribution to emission
reductions is questionable. Potential environmental effects of a trading system may go beyond
yearly emission reductions. There are local, positive externalities to reducing GHG emissions,
like air pollution reduction or energy savings. These effects should not be overestimated in the

43
context of the EU ETS. Firstly direct local policies can address these problems more
effectively (World Bank & OECD, 2015). Secondly, the EU ETS concerns large emitters,
while local problems such as air pollution are often caused by small-scale combustion,
especially in transport sector, as well as commercial, institutional and individual buildings.
Nevertheless, industry and energy production still contribute to a large part of some pollutant
emissions, especially particulate matters (PM) and sulphur dioxide (SO2) (EEA, 2016).
The EU ETS impact on air pollution is difficult to disentangle from other EU policies in this
area. There is a correlation between the carbon price and the reduction of air pollutants,
especially in oil refineries, but this correlation is weak, and could be partially explained by
other EU policies implemented around the same time as the ETS (Fisher, 2012). The exact
impact of the ETS on air pollution requires more research, but given the low carbon prices
and higher effectiveness of directed policies aiming at reducing pollution, the impact of the
ETS should not be overestimated.
2.6.2. International credits
Use of international credits in the EU ETS has had an impact on lowering the prices and
accumulating surplus allowances. It also negatively impacted transparency of the system, as
verification of the offsets was in the hands of neither EU institutions, nor Member States.
From the point of view of environmental integrity, the excessive use of international credits
caused two more problems. The amount of offsets not only further weakened the polluter-
pays principle of the ETS, but also jeopardised some countries’ compliance with international
law. According to the Kyoto protocol, international credits may only constitute less than half
of the reductions to meet Kyoto reduction targets. It was not the case with Poland and
Slovenia, nor with EU-15 countries20 (Morris, 2013).
GHG are uniformly mixed accumulative pollutants, therefore the geographical location of an
emission reduction does not matter. This is a strong argument for international offsets: it
allows for emission reductions at least cost. The problem with the Kyoto offset system is that
due to the lack of transparency and weak monitoring and verification rules, there is no
guarantee that emission reductions actually take place. The EU was well aware of the
problem. It suffices to say that out of 1.1 billion credits surrounded in the EU ETS during the
20 At the time of signing of the Kyoto protocol, all the then 15 Member States committed to one, common target (and, as a consequence, common offset use).

44
second phase (2008-2012), 85 percent came from projects that were subsequently blocked by
the EU on the basis of environmental concerns (Morris, 2013).
Considering the relatively low impact on emission reductions, frequent reforms, low
incentives for long-term investments and misalignment with other EU policies, it is safe to
conclude that the ETS has a lot of shortcomings when it comes to reliability. It may have
some effects on lowering air pollution, but they have to be further examined, and considering
low allowances prices, they are not likely to be significant. International credits constitute a
serious threat to environmental integrity of the system. Fortunately, the EU policymakers are
aware of issues with international credits, and most of the least reliable ones have already
been discontinued, and there is a possibility that they will no longer be used in the fourth
phase of the ETS (see part 3.5.).
3. Revision for phase four: reform, not revolution
Final part of this paper is a practical application of the framework developed in the first and
second part. After having understood the roots and developments of the EU ETS in its current
form, and after having assessed it using FASTER principles, it convenes to consider the future
of the programme. A structural reform is currently underway, with Market Stability Reserve
already adopted and set to be operational from 1st of January 2019, and with an upcoming
reform for the fourth phase from 2021 to 2030. For the latter, the legislative process closing
towards the end, with the final Commission proposal submitted in July 2015, and with the
European Parliament having adopted a resolution in the first reading. At the moment of
writing, the legislative proposal entered the first reading in the Council. While exact details of
the proposition are not yet determined, the Commission proposal and positions of the
Parliament and the Council do give insight at least into the areas concerned by the reform.
This part is therefore trying to answer the question whether the upcoming reform can hope to
improve the shortfalls of the system, in the categories outlined in part two, following the
FASTER principles. As concluded in the previous part, the ETS’ performance in the field of
fairness, efficiency and cost-effectiveness, as well as reliability and environmental integrity is
mixed at best, while when it comes to alignment of policies and objectives, and stability it
requires deep changes. At the same time, achievements of the ETS in the field of transparency
are commendable.

45
Structure of this part follows the main changes introduced by the reform: market stability
reserve, growing rate of cap decrease, carbon leakage rules reform and new support
mechanisms: innovation and modernisation funds. Each of these changes will be analysed in
order to determine to what extent it will influence the functioning of the ETS. Later, the
entirety of the proposed reform in its current shape will be assessed. Clearly, such ex ante
analysis is limited, because the real effects of the reform will only be known after its
implementation, therefore the analysis will concentrate on determining whether EU ETS
problems are correctly identified and addressed by the reform. Finally, some alternative
reform proposals present in the literature will be discussed.
3.1. Market Stability Reserve – a small step in a right direction
Introduction of a Market Stability Reserve is a natural continuation of backloading reform,
which was mentioned in Part One. Backloading amendment to the ETS Auctioning
Regulation.21 As a result, 900 million EUAs that were supposed to be auctioned between 2014
to 2016, were temporarily removed from the market. Removal resulted in a slight decrease of
the surplus of allowances, but did not have a lasting effect on prices (see Figures 3 and 4) In
the initial amendment these allowances were supposed to be reintroduced to the market
between 2019 and 2020, before the end of the third phase. Meanwhile, a supposedly long-
term solution to low-prices problems – the MSR – was proposed, further postponing the
reintroduction of backloaded allowances.
The MSR is a volume-based measure aimed at stabilising the price of EUAs by reducing their
amount on the market when the surplus exceeds a certain point, namely 833 million tonnes of
CO2e. If it happens, a number of allowances equivalent to 12 percent of all the EUAs
currently on the market is taken from the sum of EUAs that were supposed to be auctioned in
a given year. Conversely, if the amount of allowances on the market falls under 400 million
tonnes, 100 million tonnes are released from the reserve and auctioned. That way the system
gains resilience, both from excessive surplus and from insufficient number of allowances on
the market (should it ever occur). On the 1st of January 2019 the reserve will start functioning,
21 Commission Regulation (EU) No 176/2014 of 25 February 2014 amending Regulation (EU) No 1031/2010 in particular to determine the volumes of greenhouse gas emission allowances to be auctioned in 2013-20 Text with EEA relevance

46
and will already contain the 900 million allowances removed from the market as a result of
backloading.22
This measure will not only be a novelty for the EU ETS – in fact it has never been
implemented before. While it is interfering with the functioning of the emission permits’
market, it is not direct price intervention. Alternative approaches to the problem of oversupply
of allocations involved some kind of intervention: whether it was a price floor, a price collar
or a permanent removal of a certain number of allowances from the market (Fell, 2016)– all
of these measures threaten to undermine the market-based cost-efficiency of the ETS. It
would also mean transforming the ETS into a hybrid, price-quantity policy. Some price-
controlling measures are still on the table, however. In the Council’s position, an amendment
adds a possibility (from 2024) of permanent removal of allowances from the MSR if the
amount of allowances in the reserve exceeds the total number of allowances auctioned in the
previous year (Council of the European Union, 2017).
As it is an innovative instrument, there is no consensus concerning its effectiveness. Its
uniqueness brought on interest of researchers. A number of studies has been released, aiming
to assess its potential effects on the ETS. According to the impact assessment accompanying
the MSR decision, a “(…) market stability reserve is likely to smooth out the price pattern
over time avoiding extremes” (European Comission, 2014, p.47). Some researchers hold
different views. Perino and Wilner (2016) in an article tellingly entitled “Procrastinating
reform: The impact of the market stability reserve on the EU ETS” find that MSR may have
an upward impact on prices, but only temporarily, just as allowances are not permanently
removed. This may have some positive effects on short-term low-carbon investments, but
may negatively affect long-term ones. Richestein et. al. (2015) argue that the MSR may
actually increase the EUA price volatility, because the system is too rigid and reacts with a
delay. Fell (2016) compares MRS with other policy options, such as price collars and
permanent reduction of the number of allowances. He finds that the MRS may be less
effective than a price collar (or a price floor), but it may still be effective, and if a price collar
is politically infeasible, then the MRS should be implemented.
Despite doubts to the actual effects of the MSR, the fact of implementation of this instrument
proves that the Commission is well aware of the issues with the ETS. Growing surplus and
22 Decision 2015/1814 of the European Parliament and of the Council of 6 October 2015 concerning the establishment and operation of a market stability reserve for the Union greenhouse gas emission trading scheme and amending Directive 2003/87/EC

47
slumping prices negatively affect alignment of policies and objectives, and efficiency and
cost-effectiveness. When it comes to stability, an automatic measure such as MSR is certainly
more reassuring than backloading reform, which could undermine trust of the participants.
Still, it is an experiment, and if it fails, we may expect another reform even before the
subsequent phase of the ETS. Additionally, the MSR appears as a lowest common
denominator policy, characteristic for a joint decision trap. Price collar would probably be
more effective, and even temporary removal of allowances (which is the purpose of the MSR)
could be done in a more flexible and dynamic way using a quasi-central bank, which would
independently decide how many allowances should be auctioned in any given moment (de
Perthuis & Trotignon, 2014).
3.2. Cap decrease picking up the pace
Remaining changes for phase four are much less complex and innovative than the Market
Stability Reserve. The most straightforward change is the rate at which the cap decreases each
year. During phase three it was 1.74 percent; phase four will see a 2.2 percent yearly decrease.
The change was hardly unexpected – it is in line with emission reduction targets set for the
EU in the 2030 perspective. An overall reduction of 40 percent compared to 1990 levels
requires, according to Commission’s estimates, a 43 percent decrease in the ETS sectors,
compared to 2005 levels23 (European Commission, 2015).
The change is expected to bring additional 556 million tonnes of CO2e emission reductions
over the period of 2021-2030 compared to the 1.74 percent cap decrease. Aside from
consistency with long-term targets, this reform is motivated similarly to the MSR. The
Commission acknowledges that while there is evidence that the ETS is responsible for some
of the emission reductions, large investments in GHG efficiency “still remain the exception”
(European Commission, 2015c, p.5).
More stringent cap is hoped to deliver higher carbon prices, increasing incentives of the
industry to invest in low-carbon technologies. Given the size of the surplus, however, a short-
term effect on prices is unlikely (Clò et al., 2013). Nevertheless, in the longer term it could be
expected to put some upward pressure on prices.
Given the long-term targets of the European Union a quicker decline in the cap seems not
only natural, but also necessary. It gives a clear and consistent signal to the companies
23 The year 1990 is used for overall targets for emission reductions, while 2005 is used for the ETS. It results from the lack of data concerning ETS sectors in 1990.

48
regarding the future climate policies. Companies can expect the cap not only to decrease, but
also to decrease at an increased rate with time. On the contrary, should the Union fail to
implement policies consistent with previously agreed targets, it would create uncertainty and
decrease trust.
Coming back to the FASTER principles, the more stringent cap is likely to address some of
the issues regarding efficiency and cost-effectiveness, as well as reliability and environmental
integrity. It is also crucial for stability and predictability. It does not, however, address the
misalignment of policies and objectives. Fragments of explanatory memorandum
accompanying Commission’s ETS reform proposal show that this issue has not at all been
considered. Quite the opposite: according to the Commission, both the renewables and energy
efficiency policies “fully support the environmental effectiveness of the EU ETS, and the
synergies between these policies and the EU ETS have been strengthened through the recently
agreed Market Stability Reserve” (European Commission, 2015c). As shown in the second
part of this paper, this position does not seem defendable.
3.3. Carbon leakage and free allocation reform
In the revision for phase 3, auctioning became the default method of allocation, and carbon
leakage list was introduced. Current reform introduces much smaller changes. In the third
phase, approximately 57 percent of allocations were auctioned. The Commission’s proposal
contains a provision that this proportion should remain the same over the period of 2021-
2030. As in previous phases, free allocation does not concern the power sector (except for the
least wealthy Member States), and for the industrial sectors is determined using benchmarks
and carbon leakage list. Sectors not mentioned on the carbon leakage list will receive 30
percent of the benchmark value. Unlike the previous phase, this proportion will not decrease
with time. On the other hand, benchmarks will be updated more frequently in order to reflect
technological advancements – in general they will decrease by 0.5-1.5 percent per year.
Carbon leakage rules are to be made more specific, and concern smaller number of sectors. In
the third phase, 97 percent of industrial production sectors were covered by carbon leakage
rules. For 2014-2019 the list enumerates 175 sectors and subsectors. For the next period, the
Commission proposes to reduce that number to around 50 and to focus on sectors facing the

49
highest carbon leakage risk.24 Both overall level of free allocation and carbon leakage list may
still change during the negotiations.
Motivation for carbon leakage prevention in proposed form remains unclear, and it can be
speculated that it is of a rather political nature. The proposal for a Directive states that
“Experience gathered during the operation of the EU ETS confirmed that sectors and sub-
sectors are at risk of carbon leakage to varying degrees, and that free allocation has prevented
carbon leakage.” (European Commission, 2015c, p.13) However, the Impact Assessment of
that very Directive quotes a study from 2013, according to which “(…)no conclusive evidence
of carbon leakage occurrence can be found.” (European Commission, 2015b, p.13).
Compared to the reform for the third phase, which brought a significant change in the method
of allocation, this revision’s changes are rather cosmetic. They are unlikely to considerably
increase auctioning revenues, nor to influence prices in any way. Without a doubt, political
feasibility influenced the shape of the Commission’s proposal in this field. The exact shape of
reform is still being discussed at the moment, but it is difficult to imagine any radical changes
coming from Parliament’s and Council’s amendments25. Thus, in terms of FASTER
principles, this reform is not going to address any issues concerning method of allocation.
Fairness is likely to remain one of the areas in which the EU ETS fares least well.
3.4. Revenues and new support mechanisms
In the area of revenue redistribution, the fourth phase represents continuity rather than change.
Like in previous phases, 50 percent of the revenue needs to be used for goals concerning
climate and energy policy. Three possible goals are added to the list: financial support for
sectors or subsectors at risk from carbon leakage passed on through higher electricity prices
(indirect carbon leakage), climate-related investments in third countries, and skill formation
and reallocation of workers affected by the transition to low-carbon economy26. Distribution
24 Revision for phase 4 (2021-2030), European Commission, access: April 2017 https://ec.europa.eu/clima/policies/ets/revision_en 25 While significant change of the ETS in the upcoming reform remains unlikely, there are some reasons to believe otherwise. In the first reading the Parliament adopted an amendment proposal to permanently remove 800 million permits from the MSR (see: http://www.europarl.europa.eu/sides/getDoc.do?type=TA&reference=P8-TA-2017-0035&language=EN&ring=A8-2017-0003). On the side of the Council, ambition is being presented especially by France. French Prime Minister Emmanuel Macron in his speech in Sorbonne mentioned a necessity of a carbon price greater than 25-30 € and explicitly mentioned a price floor to that end (see: http://www.elysee.fr/declarations/article/initiative-pour-l-europe-discours-d-emmanuel-macron-pour-une-europe-souveraine-unie-democratique/). 26 Article 1 (4), Directive of the European Parliament and of the Council amending Directive 2003/87/EC to enhance cost-effective emission reductions and low-carbon investments

50
of auctioning revenues between Member States remains largely the same: 90 percent is
allocated to Member States according to historical emissions and 10 percent is redistributed
for the purposes of solidarity and growth. The 2 percent “bonus” for countries exceeding their
Kyoto commitment is no longer applicable.
There are two new instruments that affect the redistribution of revenues. First one is
Modernisation Fund. It is to be established from 2 percent of the total EU allowances (both
auctioned and allocated) and its revenues are to be used to promote investments in
modernisation of energy sectors of Member States with GDP below 60 percent of EU
average. Contrary to the funds previously distributed for the purposes of solidarity and
growth, this fund is to be governed independently from Member States. Modalities of the fund
are likely to change during the legislative process, and details will be established by the
Commission’s delegated acts. Nonetheless, it can be interpreted as an attempt to create a form
of aid for the least wealthy countries that is more focused on promoting investments in low-
carbon electricity production than previously existing tools.
Innovation fund is the second new instrument proposed by the Commission. It consists of 400
million tonnes of CO2 allowances that are supposed to be made available for investments in
low-carbon technology, carbon capture and storage (CCS), and renewable energy. The fund
overlaps with existing EU funding for renewables and CCS, in particular the NER 300
programme, which was partially financed through auctioning of allowances for new entrants
to the ETS.27
As with carbon leakage reform, revenue distribution will not see drastic changes under phase
four. Some of fairness-related issues are tackled, especially concerning revenue redistribution.
Innovation fund is an attempt to align policies and objectives, and to encourage more long-
term investments. On the other hand, like other policies promoting renewable energy, it may
contribute to downward pressure on EUA prices. Modernisation fund is a more reliable and
transparent way of redistributing revenues between Member States, while ensuring their use
for climate-related purposes. However, both funds do not replace previous instruments with
the same purpose; they are an addition, creating unnecessary complications and adversely
affecting transparency, which is the strongest feature of the EU ETS. The system may still be
27 2010/670/EU: Commission Decision of 3 November 2010 laying down criteria and measures for the financing of commercial demonstration projects that aim at the environmentally safe capture and geological storage of CO2 as well as demonstration projects of innovative renewable energy technologies under the scheme for greenhouse gas emission allowance trading within the Community established by Directive 2003/87/EC of the European Parliament and of the Council
51
simplified during the legislative process, but in the shape put forward in the Commission
proposal it is not likely to adequately address the flaws of the ETS.
3.5. Reform not sufficient to answer to challenges
Of the four major changes of the EU ETS for the fourth phase, there can be no doubt that the
Market Stability Reserve is the most important one. It is significant that as a matter of fact the
MSR precedes the actual revision of the system that it is introduced separately, and that it
comes into force before the beginning of the next phase. It demonstrates both the relative
audacity of the reform, deserving special treatment, and its urgency, requiring earlier
implementation. All the same, the MSR may prove to fall short of expectations, especially in
the long run. The allowances are only temporarily removed from the market, and rational
market participants can expect them to be reintroduced.
As for other changes, it is safe to say that they will not fundamentally change the functioning
of the ETS. A more rapidly decreasing cap was a necessity to keep in line with 2030 targets.
More stringency gives hope for higher prices, but overlapping policies have not been taken
into account. Besides, the existing surplus of allowances is likely to limit its effect on prices.
Carbon leakage and free allowances rules see minor changes, especially compared to previous
reforms. And while modernisation and innovation funds may have some positive effects on
(respectively) fairness and long-term efficiency, they greatly increase the complexity of the
system, making accounting more burdensome, and the system less transparent.
Paradoxically, one of the most important changes to the ETS is not even mentioned in the
revision proposal. In 2020, the second commitment period of the Kyoto protocol will end. It
means that rules concerning international credits will no longer apply, and will be replaced by
a new system, based on the Paris agreement, which is still taking shape amid negotiations. But
the previous system, mostly based on CDM and JI mechanisms, is going to be removed; it
was based on the two-tiered scheme where only developed countries had reduction targets,
which is no longer the case. The Paris Agreement encourages cooperation between countries
with carbon pricing mechanisms in place. It also proposes the Sustainable Development
Mechanism (SDM), which is supposed to aim at reducing overall emissions, and not only
transferring it from one place to another (Kachi, 2017).
The use of carbon credits contributed to many issues of the EU ETS, including fairness,
transparency, efficiency and environmental integrity. Shortcomings of international credit
system were recognised by the EU; as mentioned above, a majority of carbon credits was

52
successively prohibited by the EU due to environmental concerns. Still, a complete
discontinuation of international credits will make the ETS fairer and more effective. Even if
SDM will, in fact, become as problematic as its predecessor, it is possible that the EU will not
even participate in the new mechanism. According to the Commission’s website, the EU does
not envisage to continue using international credits after the end of second commitment
period of the Kyoto protocol.28
To sum up, the reform does to some extent address the most important issues facing the EU
ETS that were outlined in the second part of this dissertation. However, solutions proposed by
this reform do not go deep enough to turn the ETS into a fair, stable, reliable and effective
policy, well aligned with other climate policies of the EU and its Member States. Some of the
elements of the reform in its current form even threaten to undermine the elements of the
system that can be positively appraised. New innovation and modernisation funds add
unnecessary complexity to the revenue distribution, which worsens transparency.
Additionally, innovation fund may lead to further misalignment of policies and objectives. At
the same time, it is important to underline that all change may still be modified before the
legislative act is adopted and comes into force.
3.6. Other reform proposals
At the time of writing, the negotiations of the ETS reform are still under way. As mentioned
above, while details might change, it is highly unlikely that the basic features of the reform
will be drastically altered. However, the analysis conducted in this part of the paper clearly
indicates that these reforms fail to address fundamental flaws of the programme. Increasing
rate at which the cap will decrease in the fourth phase will put a downward pressure on EUA
prices, but its effect will be restrained by the existing surplus. The surplus itself is addressed
by the Market Stability Reserve, but temporarily removing allowances from the market will
only move the problem in time, in an effort which can only be described as procrastinating
reform. Other elements of the reform are likely to bring mixed results, perhaps contributing to
redistribution of transition costs at the price of decreased transparency.
The Commission’s proposal proves that the European regulator is well aware of most of the
problems with the ETS demonstrated in the second part of this paper. The reform in its current
shape simply does not go far enough to mitigate these problems. However, there are
28 Use of international credits, European Commission, access: April 2017, https://ec.europa.eu/clima/policies/ets/credits_en#tab-0-0
53
alternative proposals for reform, coming from many sources: from the European Parliament,
from some national governments, as well as from researchers and policy analysts. These
proposals are numerous and varied, but can be grouped in three general types: permanent
removal of allowances from the market, price control in the form of price floor or price collar,
and introduction of independent market authority.
Permanent removal of allowances is not necessarily incompatible with the Market Stability
Reserve. In fact, it was introduced as an amendment in the first reading in the EP, in which
the Parliament proposed to permanently withdraw 800 million EUAs from the MSR on the 1st
of January 2021.29 This move would not affect the current surplus still present on the market;
it would only concern allowances already retired from the market through backloading and
automatic functioning of the MSR. It would, however, shape expectations of market
participants and perhaps put downward pressure on prices. Within the current reform, any
allowances removed from the market were to be re-introduced as soon as surplus would
decrease below a certain level. The solution provided by the one-off removal does not create
such expectations. On the flip side, it does contribute to the uncertainty and may increase
price volatility. The purpose of the MSR was to create a clearly defined mechanism that
would make one-off interventions like backloading unnecessary; one-off removal of EUAs
goes directly against that goal.
Permanent removal of allowances could be implemented in a systematic way in the MSR.
Allowances could be automatically annulled after a certain period in the reserve, or after
reaching a certain number of allowances retired from the market. Aside from that, MSR
would need other modifications to become effective. In its current form, the MSR only
removes allowances from the market two years after it is observed that the surplus have
reached the threshold of 833 million EUAs. It is far too late to effectively react to potential
shocks. Another problem is posed by the potential release of the allowances held by the MSR,
which may provoke a price collapse (Richstein et al., 2015).
Another group of solutions concerns prices and could be implemented independently of the
MSR. A price floor aims at establishing a minimal price of emission allowances. It can be
done by simply setting up a minimal price in the public auction. This solution would not
directly affect secondary market, but as the demand for primary-market allowances would
collapse, the increased demand on the secondary market would force prices up, eventually
29 See note 25.

54
reaching an equilibrium as surplus allowances deplete. In addition, a regulator could buy
surplus allowances at a higher-than-market price to support the price floor on the secondary
market. Price floor could increase with time in order to reach a desired outcome.
Price floor can be accompanied by a price ceiling (together forming a price collar). Price
ceiling consists of automatically injecting additional allowances to the market in case price
reaches a certain level. In the absence of exogenous shocks, however, this situation is highly
unlikely, as demonstrated by Fell (2016) in his analysis; allowance price in his model tends to
stay close to the price floor level. Fell concludes his analysis with a recommendation: “If the
goal is to truly stabilize prices and remove some of the perceived over-allocation, results
presented here suggest that a price collar, and in particular a price floor could achieve these
goals at the lowest expected abatement costs” (Fell 2016, p. 68).
Price floor or collar would effectively turn the ETS into a hybrid between a carbon tax and a
trading system, between price-based and quantity-based policy. While in terms of effects it
could contribute to improving the EU ETS as a policy, it would be difficult to implement it.
Even if the Member States would recognise price collar as a means of making the ETS
effective, it would move the policy dangerously close to a fiscal measure, which requires
unanimity in the Council to be approved. Some Member States which now oppose even the
reform in its current form as too stringent, would certainly use this opportunity to undermine
its legality.
In case the price floor is not feasible in institutional terms, another solution might be an
independent authority tasked with management of the policy. An interesting proposal for such
a body was made by de Perthuis and Trotignon (2014). Drawing from the Central Bank’s role
in monetary policy, authors propose an Independent Carbon Market Authority (ICMA). It
would be a body much more sophisticated than the Market Stability Reserve. It would
monitor the market, collecting and analysing data taken from national and European
registries, and pursue price objectives controlling amount of allocations on primary market. In
de Perthuis’ and Trotignon’s project it would not directly interfere with the secondary market,
but of course, its mandate could take another form. The strong point of this solution is its
flexibility: it could react to exogenous factors (such as a potential reintroduction of
international credits), it could also ensure coordination between policies of the Union. It
would also be politically easier to implement than the price floor.
Neither of the alternative solutions is going to solve all of the problems faced by the EU ETS.
However, they do have an edge over the reform tabled by the European Commission in the

55
revision for the fourth period of the programme, and can address at least some of the problems
demonstrated by the analysis conducted in the second part of this paper.
Conclusion
Dynamically changing shape of the EU ETS makes it a very difficult policy to assess. First
part of the dissertation was aimed at developing a solid base for the analysis. Carbon trading
is a relatively new policy, but its roots can be traced back to the 1960’s. It was developed by
economists to finally be applied (with considerable success) to SO2 emissions in the US, and
then to other pollutants. Experience of US programmes led to implementation of emission
trading for GHG emissions in the Kyoto protocol, despite initial opposition from the EU,
China and developing countries. Finally, the EU embraced emissions trading, partially due to
previous failed attempts to implement carbon tax. All of these developments influenced the
current shape of the EU ETS.
The actual analysis was performed using a recent framework developed by the World Bank
and the OECD: the FASTER principles for successful emission trading. This multi-
dimensional approach allowed for an in-depth analysis of the many aspects of the policy. The
results are mixed. Transparency is the only category for which the EU ETS can be praised.
The Union Registry is well-functioning, monitoring, reporting and verification rules are clear
and consistently applied. But even in this area the system is imperfect, with excessive use of
international credits and VAT fraud scandal impairing its reputation. Still, especially in
transparency, the EU ETS is constantly improving, exemplifying the learning-by-doing
method.
In most of other principles, the ETS’ performance can be assessed as mixed, leaning towards
negative. Fairness is undermined by low allowance prices, windfall profits, free allocation and
carbon leakage rules. However, there is some redistribution of revenues between Member
States. When it comes to efficiency and cost-effectiveness, there is some evidence of emission
reduction resulting from the EU ETS. On the other hand, there is little to no impact on
innovativeness and investment in low-carbon technology. Impact on emissions is
insignificant, when compared to the influence of the economic crisis and when juxtaposed
with potential impediment of the effectiveness of other climate policies of the EU. Similarly,
when it comes to reliability and environmental integrity, the EU ETS shows some promise
with potential impact on local pollution. Nonetheless, reliability is undermined by lack of

56
stability and frequent changes, as well as by low effectiveness in delivering emission
reductions. Environmental integrity of the programme can be challenge on the basis of
excessive use of questionable international credits.
In the other two principles – alignment of policies and objectives, and stability and
predictability – evaluation of the EU ETS is overwhelmingly negative. The EU ETS coexists
with other climate and energy policies of the EU and of its Member States. There is no
synergy, however. There is evidence that the system, due to its overallocation and low prices,
is impeding the effectiveness of renewables and energy efficiency polices. At the same time,
the ETS is further destabilised by the policies of Member States. That brings us to the issue of
stability. The EU ETS is an experimental policy, and as such it underwent many changes.
Given the current shortcomings of the system, it is plausible that this situation will continue.
Overall functioning of the policy is therefore disappointing. EU ETS is unlikely to repeat the
success of US programmes for emission trading. In many ways, it is broken. The currently
negotiated structural reform is an attempt to fix it. And as demonstrated in the third part, the
reform may fall short of its goal. Four main elements of the reform – Market Stability
Reserve, increase of the pace of cap decline, carbon leakage and free allocation change, and
modernisation and innovation funds – correctly identify failings of the ETS in its current
form, but it is unlikely that they will drastically change the assessment of the system. Of
course, it is necessary to refrain from decisive judgment as long as all details of the reform are
not known.
This dissertation was an attempt to answer the question, whether the EU ETS is a model
worth following. Taking into account the current functioning of the system, as well as
proposed reforms, the answer to this question is negative. Unless the ETS undergoes a reform
much deeper than the one currently negotiated, it should not serve as a model example of an
economic climate policy.
The EU ETS is of great interest to researchers and policy analysts, but several areas remain
where the research is still underdeveloped. More empirical exploration is needed, among
others, in the areas of abatement, impact on innovations and interactions with other policies.
The system is constantly changing, and it is a great challenge for the academia and for
policymakers to closely follow and analyse the impact of each reform. Even if there are many
voices critical of the very idea of emission trading, one fact remains undisputable: the
popularity of this policy is growing nearly exponentially. Facing the existential threat of

57
climate change, it is crucial to conceive a way to make emission trading as effective in
reducing emissions as possible.

58
Bibliography 1. Alberici, S., Boeve, S., Breevoort, P. Van, Deng, Y., Förster, S., Gardiner, A., van Gastel, V.,
Grave, K., Groenenberg, H., de Jager, D., Klaassen, E., Pouwels, W., Smith, M., de Visser, E., Winkel, T. & Wouters, K. (2014). Subsidies and costs of EU energy. p.p. 71.
2. Anderson, B. & Di Maria, C. (2011). Abatement and Allocation in the Pilot Phase of the EU ETS. Environmental and Resource Economics. 48 (1). p.pp. 83–103.
3. Arlinghaus, J. (2015). Impacts of Carbon Prices on Indicators of Competitiveness: a Review of Empirical Findings. OECD Environment Working Papers. [Online]. (87). p.p. 36. Available from: http://www.oecd.org/officialdocuments/publicdisplaydocumentpdf/?cote=ENV/WKP(2015)8&docLanguage=En.
4. Bárány, A. & Grigonytė, D. (2015). Measuring fossil fuel subsidies. ECFIN Economic Brief. 40 (40). p.pp. 1–13.
5. Bel, G. & Joseph, S. (2015). Emission abatement: Untangling the impacts of the EU ETS and the economic crisis. Energy Economics. [Online]. 49. p.pp. 531–539. Available from: http://dx.doi.org/10.1016/j.eneco.2015.03.014.
6. Clò, S., Battles, S. & Zoppoli, P. (2013). Policy options to improve the effectiveness of the EU emissions trading system: A multi-criteria analysis. Energy Policy. 57. p.pp. 477–490.
7. Coady, D., Parry, I., Sears, L. & Shang, B. (2015). How Large Are Global Energy Subsidies ?, International Monetary Fund
8. Coase, R.H. (2013). The Problem of Social Cost. The Journal of Law & Economics. 56 (4). p.pp. 837–877.
9. Convery, F.J. (2009). Origins and development of the EU ETS. Environmental and Resource Economics. 43 (3). p.pp. 391–412.
10. Council of the European Union (2017). Outcome of Proceedings 6841/17. 2017 (March). p.pp. 1–46.
11. Dales, J.H. (1968). Pollution, property and prices /. Canadian university Paperbooks. Toronto: University of Toronto Press.
12. Delbeke, J. & Vis, P. (2015). EU Climate Policy Explained. European Union. 13. Depledge, J. (2005). The organization of global negotiations: constructing the climate change
regime. Earthscan, London 14. Depledge, J. (2000). Tracing the origins of the Kyoto Protocol: an article by article textual
history. [Online]. (August 1999). p.p. 135. Available from: http://www.unfccc.int. 15. EEA (2016). Air quality in Europe — 2016 report, European Parliamentary Research Service 16. Ellerman, A.D. (2000). Bibliogr. Index. Markets for clean air : the US acid rain program.
Cambridge: Cambridge University Press. 17. Ellerman, A.D. & Buchner, B.K. (2007). The European Union Emissions Trading Scheme:
Origins, Allocation, and Early Results. Review of Environmental Economics and Policy. [Online]. 1 (1). p.pp. 66–87. Available from: http://reep.oxfordjournals.org.are.uab.cat/content/1/1/66%5Cnhttp://reep.oxfordjournals.org.are.uab.cat/content/1/1/66.full.pdf.
18. Ellerman, A.D., Convery, F.J. & de Perthuis, C. (2010). Pricing Carbon. The European Union Emissions Trading Scheme. Cambridge: Cambridge University Press.
19. Erbach, G. (2014). Reform of the EU carbon market From backloading to the market stability reserve.
20. European Comission (2014). Impact assessment accompanying the document Proposal for a Decision of the European Parliament and of the Council concerning the establishment and operation of a market stability reserve for the Union greenhouse gas emission trading scheme and amending Di. Brussels.
21. European Commission (1998). Climate change–towards an EU post-Kyoto strategy.. Brussels. 22. European Commission (2015a). EU ETS Handbook. Climate Action. [Online]. p.p. 138.
Available from: http://ec.europa.eu/clima/publications/docs/ets_handbook_en.pdf. 23. European Commission (2015b). Impact Assessment accompanying the document

59
Proposal for a Directive of the European Parliament and of the Council amending Directive 2003/87/EC to enhance cost-effective emission reductions and low- carbon investments
24. European Commission (2016). Implementing the Paris Agreement - Progress of the EU towards the at least -40% target. Brussels.
25. European Commission (2015c). Proposal for a Directive of the European Parliament and the Council amending Directive 2003/87/EC to enhance cost-effective emission reductions and low- carbon investments.
26. European Council (2014). 23 and 24 October 2014 - Conclusions. European Council. EUCO 169/14
27. European Court of Auditors (2015). Special Report - The integrity and implementation of the EU ETS. [Online]. Available from: http://www.eca.europa.eu/Lists/ECADocuments/SR15_06/SR15_06_EN.pdf.
28. Fell, H. (2016). Comparing policies to confront permit over-allocation. Journal of Environmental Economics and Management. [Online]. 80. p.pp. 53–68. Available from: http://dx.doi.org/10.1016/j.jeem.2016.01.001.
29. Fisher, M. (2012). Clearing the Air. Carbon pricing and local air pollution in California. Climate Policy Initiative
30. Frunza, M. (2013). Aftermath of the VAT fraud on carbon emissions markets. Journal of Financial Crime. 20 (2). p.pp. 222–236.
31. Frunza, M. & Guegan, D. (2011). Missing trader fraud on the emissions market. Journal of Financial Crime. 18 (2). p.pp. 183–194.
32. Goulder, L.H. (2013). Markets for Pollution Allowances: What Are the (New) Lessons? The Journal of Economic Perspectives. 27 (1). p.pp. 87–102.
33. Gupta, S., Tirpak, D.A., Burger, N., Gupta, J., Höhne, N., Boncheva, A.I., Kanoan, G.M., Kolstad, C., Kruger, J.A., Michaelowa, A., Murase, S., Pershing, J., Saijo, T. & Sari, A. (2007). Policies, Instruments and Co-operative Arrangements. [Online]. Available from: http://www.ipcc.ch/publications_and_data/ar4/wg3/en/ch13.html.
34. Höhne, N., Hagemann, M., Moltmann, S. & Escalante, D. (2011). Consistency of policy instruments How the EU could move to a -30% greenhouse gas reduction target. Ecofys.
35. IEA; NEA; OECD (2015). Projected Costs of Generating Electricity. p.p. 16. 36. International Energy Agency (2015). World Energy Outlook Special Briefing for COP 21.
[Online]. p.p. 7. Available from: www.worldenergy.org. 37. Kachi, A. (2017). Good-Bye Kyoto: Transitioning away from offsetting after 2020. 38. Kerr, S. & Mare, D.C. (1998). Transaction Costs and Tradable Permit Markets: The United
States Lead Phasedown. Motu Economic and Public Policy Research Draft Manuscript. 39. Koch, N., Fuss, S., Grosjean, G. & Edenhofer, O. (2014). Causes of the EU ETS price drop:
Recession, CDM, renewable policies or a bit of everything?-New evidence. Energy Policy. p.pp. 676–685.
40. Koch, N., Grosjean, G. & Fuss, S. (2015). Politics matters: Regulatory events as catalysts for price formation under cap-and-trade. Journal of Environmental Economics and Management 78, p. pp. 121-139
41. Laing, T., Sato, M., Grubb, M. & Comberti, C. (2014). The effects and side-effects of the EU emissions trading scheme. Wiley Interdisciplinary Reviews: Climate Change. 5 (4). p.pp. 509–519.
42. Morris, D. (2013). Drifting toward disaster ? The ETS adrift in Europe ’ s climate efforts The 2013 Environmental Outlook for the EU ETS. Sandbag report
43. Müller, P. & Slominski, P. (2013). Agree now – pay later: escaping the joint decision trap in the evolution of the EU emission trading system. Journal of European Public Policy. 20 (10). p.pp. 1425–1442.
44. Napolitano, S., Schreifels, J., Stevens, G., Witt, M., LaCount, M., Forte, R. & Smith, K. (2007). The U.S. Acid Rain Program: Key Insights from the Design, Operation, and Assessment of a Cap-and-Trade Program. Electricity Journal. 20 (7). p.pp. 47–58.
45. Nordhaus, W. (2011). Designing a friendly space for technological change to slow global warming. Energy Economics. 33 (4). p.pp. 665–673.

60
46. OECD (2016). Effective Carbon Rates: Pricing CO2 through Taxes and Emissions Trading Systems.
47. Perino, G. & Willner, M. (2016). Procrastinating reform: The impact of the market stability reserve on the EU ETS. Journal of Environmental Economics and Management. 80. p.pp. 37–52.
48. de Perthuis, C. & Trotignon, R. (2014). Governance of CO2 markets: Lessons from the EU ETS. Energy Policy. 75 (2014). p.pp. 100–106.
49. Pigou, A.C. (1972). The Economics of Welfare. Business Horizons. 15 (6). p.pp. 17–22. 50. Richstein, J.C., Chappin, É.J.L. & de Vries, L.J. (2015). The market (in-)stability reserve for
EU carbon emission trading: Why it might fail and how to improve it. Utilities Policy. 35. p.pp. 1–18.
51. Sartor, O. & Berghmans, N. (2011). Carbon Price Flaw ? The impact of the UK’s CO2 price support on the EU ETS. CDC Climat Research. [Online]. (March 2011). Available from: http://www.cdcclimat.com/IMG/pdf/11-06_climate_brief_6_-_uk_carbon_price_floor.pdf.
52. Scharpf, F.W. (2006). The joint-decision trap revisited. Journal of Common Market Studies. 44 (4). p.pp. 845–864.
53. Scharpf, F.W. (1988). The Joint Decision Trap: Lessons From German Federalism and European Integration. Public Administration. 66 (3). p.pp. 239–278.
54. Skjaerseth, J.B. (1994). The Climate Policy of the EC: Too Hot to Handle? Journal of Common Market Studies. 32 (1).
55. Skjaerseth, J.B. & Wettestad, J. (2009). The Origin, Evolution and Consequences of the EU Emissions Trading System. Global Environmental Politics. [Online]. 9 (2). p.pp. 101–122. Available from: http://www.mitpressjournals.org/doi/abs/10.1162/glep.2009.9.2.101.
56. Staving, N. (1998). The SQ2 Allowance Trading System and Its Performance. 12 (3). p.pp. 69–88.
57. Thomas, A. & Flues, F. (2015). The distributional effects of energy taxes. OECD Taxation Working Papers. [Online]. Paris. Available from: http://www.oecd-ilibrary.org/taxation/the-distributional-effects-of-energy-taxes_5js1qwkqqrbv-en.
58. Tietenberg, T.H. (2006). Emissions Trading: Principles and Practice (2nd edn.). Resources. Washington, DC.
59. UNFCCC (2015). Synthesis report on the aggregate effect of the intended nationally determined contributions. [Online]. Available from: http://iclq.oxfordjournals.org/cgi/doi/10.1093/iclqaj/24.3.577.
60. Venmans, F. (2012). A literature-based multi-criteria evaluation of the EU ETS. Renewable and Sustainable Energy Reviews. [Online]. 16 (8). p.pp. 5493–5510. Available from: http://dx.doi.org/10.1016/j.rser.2012.05.036.
61. Weitzman, M.L. (1974). Prices vs. Quantities. The Review of Economic Studies. 41 (4). p.pp. 477–491.
62. Woerdman, E. (2005). Hot air trading under the Kyoto Protocol: An environmental problem or not? European Environmental Law Review. 14 (3). p.pp. 71–77.
63. World Bank (2016). State and Trends of Carbon Pricing. 64. World Bank & OECD (2015). The FASTER principles for successful carbon pricing : An
approach based on initial experience. [Online]. (September). Available from: http://documents.worldbank.org/curated/en/2015/09/25060584/faster-principles-successful-carbon-pricing-approach-based-initial-experience.

ABOUT OFCE
The Paris-based Observatoire français des conjonctures économiques (OFCE), or French Economic Observatory is an independent and publicly-funded centre whose activities focus on economic research, forecasting and the evaluation of public policy.
Its 1981 founding charter established it as part of the French Fondation nationale des sciences politiques (Sciences Po), and gave it the mission is to “ensure that the fruits of scientific rigour and academic independence serve the public debate about the economy”. The OFCE fulfils this mission by conducting theoretical and empirical studies, taking part in international scientific networks, and assuring a regular presence in the media through close cooperation with the French and European public authorities. The work of the OFCE covers most fields of economic analysis, from macroeconomics, growth, social welfare programmes, taxation and employment policy to sustainable development, competition, innovation and regulatory affairs..
ABOUT SCIENCES PO
Sciences Po is an institution of higher education and research in the humanities and social sciences. Its work in law, economics, history, political science and sociology is pursued through ten research units and several crosscutting programmes. Its research community includes over two hundred twenty members and three hundred fifty PhD candidates. Recognized internationally, their work covers a wide range of topics including education, democracies, urban development, globalization and public health. One of Sciences Po’s key objectives is to make a significant contribution to methodological, epistemological and theoretical advances in the humanities and social sciences. Sciences Po’s mission is also to share the results of its research with the international research community, students, and more broadly, society as a whole.
PARTNERSHIP


