
Form DOF F 1700.7 (8-72) Reproduction of completed page authorized.
1. Report No.
SWUTC/16/600451-00085-1
2. Government Accession No.
3. Recipient's Catalog No.
4. Title and Subtitle
THE CONTRIBUTION OF MICRO- AND MACRO-TEXTURE TO THE
SKID RESISTANCE OF FLEXIBLE PAVEMENT
5. Report Date
February 2016 6. Performing Organization Code
7. Author(s)
Pedro A. Serigos, Prasad Buddhavarapu, Grant M. Gorman, Feng Hong, and
Jorge A. Prozzi
8. Performing Organization Report No.
600451-00085-1
9. Performing Organization Name and Address
Center for Transportation Research
University of Texas at Austin
1616 Guadalupe Street, Suite 4.200
Austin, Texas 78701
10. Work Unit No. (TRAIS)
11. Contract or Grant No.
DTRT12-G-UTC06
12. Sponsoring Agency Name and Address
Southwest Region University Transportation Center
Texas A&M Transportation Institute
Texas A&M University System
College Station, Texas 77843-3135
13. Type of Report and Period Covered
Final Report
14. Sponsoring Agency Code
15. Supplementary Notes
Project supported by general revenues from the U.S. Department of Transportation, University of Transportation
Centers Program, and general revenues from the State of Texas.
Project title: Effect of Aggregate Micro- and Macro-texture on Pavement Skid Resistance 16. Abstract
Skid resistance is an important characteristic of the pavement surface to reduce the number of road accidents. The
mechanisms involved in the activation of the frictional force required for a safe braking of the vehicle depend on both
the macro- and the micro-texture of the pavement surface. The state-of-the-practice methodologies commonly used for
measuring pavement texture at highway speeds only account for the macro-texture, which alone might not be sufficient
to effectively characterize skid resistance. This study explored different ways to characterize the micro-texture of
pavement surfaces with the main objective of quantifying the effect of accounting for both the micro and the macro
components of the texture, rather than just the macro-texture, on the prediction of skid resistance.
The friction and texture data analyzed in this study were collected from an experiment conducted on in-service flexible
pavement surfaces. Surface friction was measured using a British Pendulum Tester whereas texture data was collected
using a Circular Track Meter and a Laser Texture Scanner. The surface micro-texture was characterized by different
texture parameters calculated in both the spectral and the spatial domain. The impact of incorporating the micro-texture
on the prediction of skid resistance was evaluated by analyzing a series of models specified by each of the proposed
parameters. The results of the analyses show a significant improvement in predicting the surface friction when
accounting for both components of the surface texture, as opposed to only the macro-texture. Furthermore, the
parameters calculated on the frequency domain led to a better prediction power.
17. Key Words
Micro-texture, Macro-texture, Skid Resistance, Laser
Texture Scanner, Spectral Analysis
18. Distribution Statement
No restrictions. This document is available to the public
through NTIS:
National Technical Information Service
5285 Port Royal Road
Springfield, Virginia 22161 19. Security Classif.(of this report)
Unclassified
20. Security Classif.(of this page)
Unclassified
21. No. of Pages
54
22. Price
Technical Report Documentation Page

ii

iii
THE CONTRIBUTION OF MICRO- AND MACRO-TEXTURE
TO THE SKID RESISTANCE OF FLEXIBLE PAVEMENT
By
Pedro A. Serigos
Prasad Buddhavarapu
Grant M. Gorman
Feng Hong
Jorge A. Prozzi, Ph.D.
SWUTC/14/600451-00085-1
Project 161328 & 600451-00085
Effect of Aggregate Micro- and Macro-texture on Pavement Skid Resistance
Southwest Region University Transportation Center
Center for Transportation Research
The University of Texas at Austin
Austin, Texas 78712
February 2016

iv

v
EXECUTIVE SUMMARY
Skid resistance is an important characteristic of the pavement surface to reduce the
number of road accidents. The mechanisms involved in the activation of the frictional force
required for a safe braking of the vehicle depend on both the macro-texture (wavelengths
between 50mm to 0.5mm) and the micro-texture (wavelengths less than 0.5mm) of the pavement
surface. The state-of-the-practice methodologies commonly used for measuring pavement texture
at highway speeds only account for the macro-texture, which alone might not be sufficient to
effectively characterize skid resistance. However, as technology advances and sensors with
higher sampling rate and resolution become available, it will be possible to capture both the
macro- and the micro-texture of the pavement. This study explored different ways to characterize
the micro-texture of pavement surfaces with the main objective of quantifying the effect of
accounting for both the micro and the macro components of the texture, rather than just the
macro-texture, on the prediction of skid resistance. The different methods to characterize the
micro-texture were compared in order to determine which one better predicts pavement friction.
The friction and texture data analyzed in this study were collected from an experiment
which included a total of 28 different flexible pavement surfaces. The tested pavement surfaces
covered a wide range of friction values, and a number of cases for each possible combination of
fine and coarse macro-texture and smooth and sharp micro-texture. The data collection consisted
of field measurement of friction and texture performed on the same spot at each the test surfaces.
The skid resistance was evaluated under wet condition of the surface using a British Pendulum
Tester. The macro-texture was characterized using a Circular Track Meter, while the micro-
texture was characterized by a series of different parameters calculated using the surface
coordinates scanned by a Laser Texture Scanner.
The scanned test surfaces using the Laser Texture Scanner were transformed to the
frequency domain using Fourier Transform and then filtered using an ideal low-pass filter in
order to decompose the spatial coordinates into two profiles, each containing the wavelengths of
the macro and micro component of the texture respectively. A number of different parameters to
characterize the roughness of the profiles were then computed from the scanned surfaces in both
the spatial and in the frequency domain. Examples of the computed parameters are the Mean
Profile Depth, commonly used by pavement engineers, and the coefficients of the linearized
Power Spectral Density. Since there is currently no standard or specification to process and

vi
analyze micro-texture profiles, the study evaluated different configurations, such as different
lengths of the segment of analysis, and provides recommendations.
The polishing effect of traffic on the aggregates of the pavement surface might result in
lower micro-texture on the higher points of the surface for some types of aggregates. Since all of
the surfaces tested for this study consist of in-service pavement surfaces, additional analyses
were performed to determine both whether the values of the micro-texture parameters at the
peaks of the profiles differed from the ones at the valleys, and how to better characterize the
micro-texture in order to improve the prediction of the skid resistance if that occurs. Since only
the micro-texture of the contact area between the vehicle tire and the pavement surface affects
the development of the frictional forces attributed to the micro-texture asperities, an additional
set of micro-texture parameters was evaluated considering only the estimated portion of the
surface in contact with the tire patch.
The authors concluded that accounting for both the macro- and the micro-texture
components of the surface will significantly enhance the prediction of skid resistance of flexible
pavements as oppose to accounting solely for the macro-texture component. Furthermore, the
performed analyses showed that the parameters calculated on the frequency domain led to a
better prediction power than the parameters calculated in the spatial domain. Such improvement
will allow transportation agencies to better manage skid resistance and therefore to improve road
safety. Regarding the characterization of the surface micro-texture, the authors strongly
recommend accounting for the actual contact area between tire and pavement. In addition, it is
recommended to determine the value of the surface micro-texture parameter as the median of the
individual segments of analysis using a 1 mm baseline, in order to mitigate the effect of outliers
in the texture measurements.

vii
Table of Contents
Chapter 1. Introduction ............................................................................................................... 1
Chapter 2. Background ................................................................................................................ 3 2.1 Components of Frictional Force ............................................................................................3 2.2 Relationship between Pavement Texture and Surface Friction .............................................4 2.3 Measuring Skid Resistance of Pavements .............................................................................4
2.4 Measuring Texture of Pavement Surfaces .............................................................................5 2.4.1 Aggregate Imaging Measurement System (AIMS) ....................................................... 6 2.4.2 Laser Texture Scanner (LTS) ......................................................................................... 9
2.5 Processing of Scanned Pavement Surfaces ..........................................................................10
2.5.1 Fourier Transform ........................................................................................................ 10
Chapter 3. Texture and friction data collection ....................................................................... 13 3.2 Friction Measurements ........................................................................................................14
3.3 Texture Measurements .........................................................................................................15 3.3.1 Macro-Texture Measurements. .................................................................................... 16
3.3.2 Micro-Texture Measurements. ..................................................................................... 17 3.3.3 Summary Statistics of Collected Data ......................................................................... 19
Chapter 4. Characterization and Processing of Micro-Texture Data .................................... 21 4.1 Processing of Texture Data ..................................................................................................21
4.1.1 Spectral Analysis. ........................................................................................................ 21
4.1.2 Processing in Spatial Domain. ..................................................................................... 23
4.2 Calculation of Micro-Texture Parameters ...........................................................................23
4.2.1 Spectral Parameters ...................................................................................................... 24 4.2.2 Amplitude Parameters. ................................................................................................. 24
4.2.3 Slope Parameters. ......................................................................................................... 24 4.2.4 Accounting for Contact Area between Vehicle Tire and Pavement Surface. .............. 25
Chapter 5. Analyses of Micro-Texture Data ............................................................................ 27 5.1 Skid Resistance as a Function of Macro-Texture ................................................................27 5.2 Effect of Incorporating the Micro-Texture Parameters on Prediction of Skid
Resistance ..................................................................................................................................29
5.2.1 Spectral Parameters. ..................................................................................................... 29 5.2.2 Spatial Parameters ........................................................................................................ 30
5.3 Effect of Accounting for Contact Area on Prediction of Skid Resistance ...........................32
5.3.1 Variation of Micro-Texture between Surface’s Peaks and Valleys ............................. 32 5.3.2 Spatial Parameters Calculated on Active Area. ........................................................... 33
Chapter 6. Summary and Conclusions ..................................................................................... 35
References .................................................................................................................................... 39
viii
List of Figures
Figure 2.1: Main components of frictional forces between pavement and vehicle (Moore,
1972) ................................................................................................................................... 3
Figure 2.2: Dynamic Friction Tester ............................................................................................... 5
Figure 2.3: AIMS device (Mahmoud et al., 2010) .......................................................................... 6
Figure 2.4: Coarse Aggregate Image .............................................................................................. 7
Figure 2.5: Coarse Aggregate Texture ............................................................................................ 8
Figure 2.6: Two-level Wavelet Transformation (Masad et al., 2005) ............................................ 8
Figure 2.7: Laser Texture Scanner (AMES, 2010) ......................................................................... 9
Figure 2.8: (a) Plot of a abs(sin(2πx/400)) on the left; (b) PSD of this signal on the right .......... 11
Figure 3.1: Pavement surfaces for each of the combination of micro- and macro-texture
levels ................................................................................................................................. 14
Figure 3.2: British Pendulum Tester ............................................................................................. 15
Figure 3.3: Circular Texture Meter ............................................................................................... 16
Figure 3.4: Screenshot of CTR output with scanned coordinates on the right ............................. 17
Figure 3.5: Laser Texture Scanner used in the study .................................................................... 18
Figure 3.6: 3D coordinates of scanned surface using the LTS ..................................................... 18
Figure 4.1: Power Spectral Densities of four scanned surfaces .................................................... 22
Figure 4.2: (a) Line scan of pavement surface with filtered micro- and macro-texture
components (above) and (b) close up of line scan profile (below) ................................... 22
Figure 4.3: Contact area between the tire and the pavement (adapted from Moore, 1980) .......... 25
Figure 5.1: Relationship between skid resistance and macro-texture MPD ................................. 27
Figure 5.2: Relationship between skid resistance and micro-texture MPD .................................. 28

ix
List of Tables
Table 3.1: Combination of fine and coarse macro-texture and smooth and rough micro-
texture ............................................................................................................................... 13
Table 3.2: Texture and Friction Characteristics of the Evaluated Pavement Surfaces ................. 19
Table 3.3: Summary Statistics of Collected Texture and Friction Data ....................................... 20
Table 5.1: Summary Statistics of Estimated Reference Model .................................................... 29
Table 5.2: Summary Statistics of the Estimated Models Incorporating the Micro-Texture
Spectral Parameters ........................................................................................................... 30
Table 5.3: Adjusted R2 and t-statistic (in brackets) of the Estimated Models Incorporating
the Micro-Texture Spatial Parameters .............................................................................. 31
Table 5.4: Summary Statistics of the Estimated Models Calculated on the Active Area ............. 34

x
DISCLAIMER The contents of this report reflect the views of the authors, who are responsible for the facts and
the accuracy of the information presented herein. This document is disseminated under the
sponsorship of the Department of Transportation, University Transportation Centers Program, in
the interest of information exchange. Mention of trade names or commercial products does not
constitute endorsement or recommendation for use.
ACKNOWLEDGEMENTS
The authors recognize that support for this research was provided by a grant from the U.S.
Department of Transportation, University Transportation Centers Program to the Southwest
Region University Transportation Center which is funded, in part, with general revenue funds
from the State of Texas.

1
Chapter 1. Introduction
There is currently a high demand for safer roads and a need for more effective methods to
monitor pavement safety parameters at a network level. Several studies show an increase in the
number of crashes as the skid resistance of the pavement decreases (Hall et al., 2009).
Monitoring and managing the skid resistance of the highway network is therefore important in
order to control and reduce the number of road accidents.
Adequate pavement surface friction is required to provide a satisfactory skid resistance
needed to perform a safe braking maneuver. It is well known that the friction coefficient of a
surface is affected by texture, among other factors; the rougher the texture, the higher the friction
of the surface (Masad et al., 2009). Texture measurements of the pavement surface might then be
used to evaluate and monitor skid resistance.
A pavement surface is usually divided into four categories for analysis: unevenness
(wavelengths greater than 500 mm), mega-texture (wavelengths between 500 and 50 mm),
macro-texture (wavelengths between 50 to 0.5 mm), and micro-texture (wavelengths less than
0.5 mm). The two components of the surface texture that affect skid resistance of the pavement
are the macro-texture and the micro-texture (PIARC, 1987). The scale of the macro-texture
component focuses on the contact area between the vehicle tire and the pavement surface, while
the scale of the micro-texture range of wavelengths focuses on the asperities of the pavement
aggregates.
The state-of-the-practice methodologies commonly used for measuring pavement texture
at highway speeds only account for the macro-texture, which alone might not be sufficient to
effectively characterize skid resistance. However, as technology advances and sensors with
higher sampling rate and resolution become available, it will be possible to capture both the
macro- and the micro-texture of the pavement. The incorporation of the micro-texture is
expected to enhance the prediction of the skid resistance, making it possible to monitor the skid
resistance of the highway network using a high-speed non-contact method.
This study uses spot measurements of friction and texture collected at in-service
pavements with the objective of quantifying the improvement on the prediction of skid resistance
when accounting for both the macro- and the micro-texture of the surface as opposed to only

2
considering the macro-texture component. The study also explores and compares different ways
to characterize the surface micro-texture in order to determine which one better predicts surface
friction.
The next chapter of this report contains the background and a literature review of the
relationship between pavement surface friction and texture, methodologies to measure friction
and texture, and a description of current methods to process the measured pavement surface in
order to characterize both the micro- and macro-texture components. Chapters 3 describes the
data collection procedures used in this study and provides the main characteristics of the
measured pavement surfaces.
Chapters 4 and 5 present the processing and analyses of the field measurements of
surface friction and texture in order to evaluate the improvement on the prediction of skid
resistance when accounting for both the macro- and the micro-texture of the surface as opposed
to only considering the macro-texture component. The different methods to characterize the
micro-texture were compared in order to determine which one better predicts pavement friction.
The last chapter of this report provides the main findings from the assessment of the separate
contribution of micro-and macro-texture to the skid resistance of flexible pavement, and
recommendations for the calculation of micro-texture parameters.

3
Chapter 2. Background
This Chapter provides the main concepts and a literature review for establishing the
separate contribution of micro- and macro-texture on the skid resistance of flexible pavements.
2.1 Components of Frictional Force
The frictional forces activated on the pavement surface during the skidding of a vehicle
are divided into two major components: hysteresis and adhesion forces (Figure 2.1) (Moore and
Geyer, 1974; Choubane et al., 2004). Although other mechanisms can be used to explain the loss
in kinetic energy of the vehicle, such as abrasion or shear of the tire material, their contribution is
negligible compared to the hysteresis and the adhesion mechanisms (Hall et al., 2009). The
hysteresis mechanism considers the energy dissipated due to the deformation of the tire material
when in contact with the pavement surface. The adhesion mechanism considers the bond atomic
forces between the tire and the pavement materials occurring at the micro asperities of the
surface (Moore and Geyer, 1974; Persson, 1998).
Figure 2.1: Main components of frictional forces between pavement and vehicle (Moore, 1972)

4
2.2 Relationship between Pavement Texture and Surface Friction
The skid resistance of pavements is affected by both the macro- and the micro-texture
components of its surface. Each of the texture components plays a different role in skid
resistance. On the one hand, the macro-texture provides the channels for the rapid drainage of
water on the surface, reducing the chances of hydroplaning. Also, the rougher the surface macro-
texture, the more the tire material is deformed, and therefore the greater the magnitude of the
hysteresis component of the frictional force. On the other hand, the sharper the micro-texture
asperities, the greater the surface area between the tire and the pavement, and therefore the
greater the magnitude of the adhesion component of the frictional force. For the case of wet
pavements, the micro-texture contributes to skid resistance by breaking the thin layer of water on
the surface, promoting contact between pavement and tire necessary for developing the inter-
atomic attractive forces of the adhesion component (Masad et al. 2009; Noyce et al. 2005; Do et
al., 2000).
The adhesion component of the frictional force relates to the actual contact area between
the vehicle tire and the pavement surface (Choubane et al., 2004). Therefore, a micro-texture
parameter designed with the objective of explaining skid resistance of the pavement should
account for the portion of the pavement in contact with the vehicle tire.
2.3 Measuring Skid Resistance of Pavements
Some of the commonly used methods for the evaluation of the skid resistance of
pavements are the British Pendulum Tester (BPT), the Dynamic Friction Tester (DFT, see Figure
2.2) and the Locked-Wheel Skid Trailer. The BPT and the DFT provide a spot measurement of
the surface friction and they can be used either in the laboratory or in the field. The former
measures the friction coefficient at a skidding speed of approximately 10 km/hr (Henry, 2000),
and therefore evaluates the skid resistance at lower speeds. The latter allows for measuring the
friction of the surface as a function of speed, for a range of different speeds.

5
Figure 2.2: Dynamic Friction Tester
The Locked-Wheel Skid Trailer instead evaluates the high-speed skid resistance (usually
performed at 64 km/hr) of the pavement wet surface, using a locked wheel with typically a
ribbed or smooth tire skidding along a stretch of pavement. This test is usually used to conduct
network surveys. However, the portion of the highway network surveyed is limited by the
practical limitation of having to refill the Locked-Wheel Skid Trailer water tank after a number
of tests.
2.4 Measuring Texture of Pavement Surfaces
Traditional methods to measure the surface texture of a pavement are the Sand Patch, the
Grease Patch or the Outflow Meter. These methods provide an indirect measurement of the
surface depth at a discrete spot on the pavement and are not sensitive to the micro-texture
asperities. Detailed information about these methods can be found in the NCHRP Synthesis 291
(Henry, 2000). More modern methods instead scan the surface coordinates using a laser sensor
and calculate parameters to characterize the texture of the pavement, e.g. the Mean Profile Depth
(MPD). Some of these methods provide a spot measurement of the pavement, such as the
Circular Track Meter (CTM), while others are capable of measuring the texture continuously
along the road at highway speeds, such as the INO Laser Cracking Measuring System (LCMS)
or the Texas Department of Transportation’s (TxDOT) 3D Texture Scanner (TTS).

6
Therefore, although current technologies allow for measuring the pavement texture of the
road continuously at highway speed, none of them are capable of capturing the micro-texture
component of the surface.
The following two sections describe two different devices used to quantify pavement
micro-texture statically: Aggregate Imaging Measurement System (AIMS) and Laser Texture
Scanner (LTS).
2.4.1 Aggregate Imaging Measurement System (AIMS)
Pavement surface texture is influenced by many factors, such as aggregate type and size,
mixture gradation, and texture orientation among others. The AIMS (Figure 2.3) is designed to
analyze, using camera, lighting, and microscope technology, the particle geometry of coarse and
fine aggregates through three independent properties: form, angularity (or roundness), and
surface texture. Coarse aggregates sizes passing the 37.5 mm sieve and retained on the 4.75 mm
(No. 4) sieve can be evaluated, as well as fine aggregate passing the 4.75 mm (No. 4) sieve and
retained on the 0.075 mm (No. 200) sieve.
Figure 2.3: AIMS device (Mahmoud et al., 2010)

7
The classification methodology can be used for evaluating the effect of different
processes, such as crushing techniques and blending, on aggregate shape distribution, and for the
development of aggregate specifications based on the distribution of shape characteristics
(Masad et al., 2005). It also has the capability to characterize the surface of asphalt cores for
micro- and macro- texture parameters.
In order to perform this analysis, the device captures images at different resolutions with
a camera, and uses different arrangements of lightning (bottom and top lightning) to provide
uniform illumination. In this way, different image analysis techniques can provide accurate
results.
AIMS uses a three dimensional analysis of coarse particles, which allows distinguishing
between flat, elongated, or flat and elongated particles. On the other hand, a two dimensional
analysis is used for fine particles. In addition, by using the fundamental gradient and wavelet
methods, it quantifies angularity and the surface texture respectively (Masad et al., 2005).
Pavement micro-texture can be described by the surface texture of the aggregates.
If the particles analyzed are coarse, black and white images are used to quantify form and
angularity (Figure 2.4), while gray images are used for texture (Figure 2.5). These aggregates are
analyzed individually by placing them in a backlighting sample tray which has marked grid. On
the other hand, black and white images are used to evaluate all these properties in fine particles.
In this case, the particles are randomly placed on the aggregate tray with the backlight turned on.
Figure 2.4: Coarse Aggregate Image

8
Figure 2.5: Coarse Aggregate Texture
The AIMS angularity chart provides objective characterization of the material edge
characteristics. AIMS angularity characterizes the particle edge sharpness characteristics on a
scale of 0-10000.
To describe the texture content at a given resolution or decomposition level, a parameter
called the wavelet texture index is defined. The texture index at any given decomposition level is
the arithmetic mean of the squared values of the detail coefficients at that level. The texture
information lies in the detail coefficients LH, HL, and HH (Figure 2.6). The LH coefficients pick
up the high frequency content in the vertical direction, the HL coefficients pick up the high
frequency content in the horizontal direction, and the HH coefficients pick up the high frequency
content in the diagonal direction (Masad et al., 2005).
Figure 2.6: Two-level Wavelet Transformation (Masad et al., 2005)

9
2.4.2 Laser Texture Scanner (LTS)
The LTS (Figure 2.7) is a lightweight and portable equipment produced by Ames
Engineering, designed to scan the pavement surface coordinates in order to characterize its
texture content. The resolution of the LTS allows to measure and describe the two decades of the
macro-texture (wavelengths from 50 mm to 5 mm and from 5 mm to 0.5mm) and the first decade
of the micro-texture (wavelengths from 0.5 mm to 0.05 mm). This device uses a laser sensor to
scan the surface coordinates of parallel straight lines with a sampling rate of one point every
approximately 0.015 mm. It has a maximum scan length of 4.1 in (104.14 mm), and a maximum
scan width of 3.0 in (76.20 mm), which allows a maximum of 1200 line scans (spacing of 0.064
mm between lines). The scanner will perform the selected amount of lines scans of equal spacing
over the width. The LTS is placed on the surface through three point contact legs.
Figure 2.7: Laser Texture Scanner (AMES, 2010)
The LTS has the ability to control the intensity of the laser spot. Half power setting works
best when scanning bright white surfaces with no sunlight striking the surface of the scan area.
Direct sunlight will cause spikes to occur in the data and will elevate the measurements being
made. On the other hand, the full power setting works best for very dark surfaces, or for scanning
outside in the sunlight. If full power is used on very white surfaces, small spikes may occur in
the scan data. Spikes occur when the laser cannot see the bottom of a deep crack because of the
angle of the returning light to the detector. The sensor increases the intensity of the laser light

10
causing the crack in the scanned surface to glow, which confuses the detector and creates a spike
in the data (AMES, 2010). In addition, the LTS is equipped with rechargeable batteries and a
GPS receiver which allows to track the location of each texture measurement taken in the field.
2.5 Processing of Scanned Pavement Surfaces
This section discusses the motivation, and limitations of the two different methods for
characterizing the micro-texture contained in the Laser Texture Scanner (LTS) pavement surface
profiles. The pavement surface scans produced by the LTS system consist of parallel line scans
of the profile elevation as a function of the longitudinal distance along the pavement surface.
This provides a profile elevation of the entire surface. The transforms used in this study are all
compatible with one dimensional signals, so the individual line scans of the pavement surface
were analyzed independently.
2.5.1 Fourier Transform
The FT transforms a signal into a sum of sinusoidal waves, which is accomplished by
projecting the signal onto sinusoidal waves of different frequency content. Sine and cosine
waves of frequency content differing by an integer multiple are orthogonal functions, so the FT
uses an infinite number of these waves as basis functions that span all of function space. Thus,
the output of the FT consists of the amplitudes corresponding to each frequency. This
information can be displayed in Power Spectral Density (PSD) plot, in which the square of the
amplitude is plotted against its corresponding frequency.
Due to the discrete nature of the scans produced by the LTS, the Discrete Fourier
Transform (DFT) is used in this study. An important property of the DFT is that it obeys the
Nyquist Sampling Theorem, which states that the sampling frequency should be at least twice the
highest frequency contained in the original signal. An alternate way to interpret this statement is
that the smallest wavelength that can be obtained from a discrete signal is twice the sample
spacing. The smallest wavelength in the first decade of micro-texture wavelengths (i.e. 0.05
mm) is greater than two scanned points, and therefore, the FT captures all the information in this
frequency range.

11
Another important property of the FT is that its basis functions are continuous functions
and, therefore, an infinite number of continuous functions would be required to accurately
describe sharp edges and other discontinuities potentially present in a scanned pavement surface.
Figure 2.8 illustrates this limitation, in which the FT of a sinusoidal wave of one frequency with
discontinuities produces relatively large amplitudes for frequencies not contained in the original
signal. These frequencies are called harmonics, and occur because of the discontinuities caused
by the absolute value operation. The power of these harmonics extend into the micro-texture
region of the PSD, which could potentially hide or confound the information contained in the
actual signal.
Figure 2.8: (a) Plot of a abs(sin(2πx/400)) on the left; (b) PSD of this signal on the right
Another limitation of the FT approach is given by the non-stationary nature of small
selections of a surface scan. A stationary signal is a signal such that the elevation probability
distribution of an analyzed window of the signal does not change as the window is translated
longitudinally. FT assumes that the signal is stationary which might not be the case for short
segment of pavement surface profiles and therefore the FT approach does not always produce
ideal results.
0 100 200 300 400 500 600 700 800 900 10000
0.1
0.2
0.3
0.4
0.5
0.6
0.7
0.8
0.9
1
Longitudinal Displacement
Ele
vatio
n
100
101
102
103
10-35
10-30
10-25
10-20
10-15
10-10
10-5
100
105
1010
log(P
ow
er)
log(Frequency)

12

13
Chapter 3. Texture and friction data collection
The data used in the current study consisted of spot measurements of surface texture and
friction performed on twenty-eight different in-service flexible pavements located in Texas near
Austin, Yoakum, and San Antonio. Twenty-four of these test surfaces were used for a different
research project, in which the objective was to evaluate equipment for the light texturing of
pavement surfaces. This set of data included the measurement of texture and friction before and
after applying the texturing treatment (twelve sections for each case). The remaining surfaces
were specially selected in order to obtain a final dataset that covers a wide range of friction
coefficient values and includes different cases for each possible combination of fine and coarse
macro-texture and smooth and rough micro-texture (Table 3.1). Figure 3.1 shows examples of
pavement surfaces for each of the combination of micro- and macro-texture levels.
This section describes the methodologies used to evaluate the skid resistance of the
pavement, documents the equipment and methodologies used to characterize the surface texture
and presents the summary statistics of the collected data for the twenty-eight pavement surfaces.
Table 3.1: Combination of fine and coarse macro-texture and smooth and rough micro-
texture
Types of Pavement surface
texture
MACRO-TEXTURE
FINE COARSE
MIC
RO
-
TE
XT
UR
E
SMOOTH
SHARP

14
MACRO-TEXTURE
FINE COARSE
MIC
RO
-TE
XT
UR
E S
MO
OT
H
SH
AR
P
Figure 3.1: Pavement surfaces for each of the combination of micro- and macro-texture levels
3.2 Friction Measurements
The skid resistance of the pavement surfaces was evaluated using the British Pendulum
Tester shown in Figure 3.2. The device was calibrated just before performing the tests and a new
rubber pad was conditioned using sand paper as indicated in the annex of the ASTM E303-98
specification.
Each test was performed following the procedure indicated in ASTM E303-98 for the
case of field measurements and wet condition of the pavement surface. The British Pendulum
Number (BPN) of the test surface was computed as the mean value of the individual BPN of five
consecutive swings. All test surfaces were tested in the direction of traffic.

15
Figure 3.2: British Pendulum Tester
An additional number of friction tests were carried out on four of the test surfaces to
estimate the testing error specific to the conditions of our data collection. Nine friction tests were
performed on each of the four test surfaces for both the wet and dry condition of the pavement.
The testing error of each of the tests was computed as indicated in the ASTM E303 specification;
i.e., the standard deviation of the BPNs from the five swings divided by the square root of the
number of swings, and multiplied by 1.96 to obtain the upper limit of the 95% confidence
interval of the error. The mean testing error of the 36 (= 9 tests/surface * 4 surfaces) friction tests
was 0.93 for the dry condition and 0.65 for the wet condition. Therefore, the testing error fell
within 1.00 BPN at a 95 % confidence level.
3.3 Texture Measurements
The texture data collection consisted of scanning the surface coordinates in order to
calculate the parameters to characterize the macro and micro components of the texture
separately. The coordinates of each test surface were scanned using a Circular Texture Meter
(CTM) and a Laser Texture Scanner (LTS). The CTM is widely used by researchers and
transportation agencies to measure texture whereas the LTS has been recently developed by
AMES Engineering.

16
3.3.1 Macro-Texture Measurements.
Figure 3.3 shows the CTM used in the experiment. The CTM is a laser scanner that scans
a 892 mm long circumference of the pavement with a sampling rate of 1 point every 0.87 mm.
The scanned circumference is further divided into eight 100 mm long segments for analysis.
Therefore, the CTM describes the wavelengths between 1.7 mm and 100.0 mm for each of the
segments and, as such, is used to characterize the macro-texture of the pavement.
Figure 3.4 shows a screenshot of the software used to operate the CTM and calculate the
Mean Profile Depth (MPD) for each of the eight segments of the scanned circumference. These
MPD values were calculated according to ASTM E1845-09, and averaged to obtain the MPD of
the test surface. The macro-texture MPD used in the analyses consisted of the average value of
three test replicates. Figure 3.4 shows the scanned coordinates of the circumference for the three
replicates of one of the tests.
Figure 3.3: Circular Texture Meter

17
Figure 3.4: Screenshot of CTR output with scanned coordinates on the right
3.3.2 Micro-Texture Measurements.
Figure 3.5 shows the Laser Texture Scanner (LTS) used to collect micro-texture data for
the study. The LTS uses a laser to scan the coordinates of parallel straight lines with a sampling
rate of 1 point every approximately 0.015 mm. The length of each scanned line can be set to a
maximum of 4.1 inches (104.1 mm), resulting in a maximum of 7212 points per profile. The
number of parallel scanned lines can be set to a maximum of 800 lines within a distance of 3
inches (76.2mm), resulting in a minimum distance between parallel lines of 0.09 mm.
The time required for the LTS used in the experiment to scan eight hundred 100 mm long
lines is greater than 2 hours. Due to time constrains and since the LTS data was used only to
characterize micro-texture, the number of lines was set to 400 lines within 2 inches (50.8 mm)
and the length of the lines was set to 2 inches (50.8 mm). Therefore, the LTS was set to scan a
50.8 mm long and 50.8 mm wide area of the pavement. Figure 3.6 shows the scanned 3D
coordinates of one of the tests surfaces. All test surfaces were scanned in the direction of traffic.
The high sampling rate of the LTS makes it possible to describe the wavelengths of the surface
between 0.03 mm to 50 mm, and therefore it can be used to characterize the first decade of the
micro-texture (wavelengths between 0.05 mm to 0.50 mm). The coordinates of the 400 scanned

18
lines were used to calculate a series of parameters to characterize micro-texture. The definitions
and calculations of these parameters are described in the next section of the paper.
Figure 3.5: Laser Texture Scanner used in the study
Figure 3.6: 3D coordinates of scanned surface using the LTS

19
3.3.3 Summary Statistics of Collected Data
Table 1 presents the friction and texture characteristics of the 28 tests surfaces collected
for the study. All test sections consisted of dense-graded hot-mix asphalt pavements. The second
column of the table indicates whether the pavement surface has been treated or not; the third
column reports the friction values measured using a BPT; and the fourth and fifth columns
present the MPD values of the surface macro- and micro-texture.
Table 3.2: Texture and Friction Characteristics of the Evaluated Pavement Surfaces
Test
Section
Texture
Treatment
Friction Texture (MPD)
Test
Section
Texture
Treatment
Friction Texture (MPD)
Macro Micro Macro Micro
BPT CTM LTS BPT CTM LTS
# - BPN mm mm # - BPN mm mm
1 unmilled 78 2.60 0.732 15 unmilled 65 0.73 0.157
2 unmilled 74 2.95 0.474 16 unmilled 80 1.02 0.694
3 unmilled 70 0.67 0.180 17 milled 105 2.97 0.777
4 unmilled 70 0.94 0.194 18 milled 85 3.13 0.950
5 unmilled 65 0.89 0.322 19 milled 93 3.41 0.627
6 unmilled 55 1.12 0.284 20 milled 65 1.01 0.139
7 unmilled 60 1.01 0.198 21 milled 68 1.05 0.207
8 unmilled 56 0.93 0.153 22 milled 88 1.81 0.443
9 unmilled 55 0.88 0.130 23 milled 68 2.13 0.193
10 unmilled 55 1.12 0.161 24 milled 85 3.11 0.581
11 unmilled 55 0.86 0.169 25 milled 90 2.08 0.232
12 unmilled 58 0.98 0.167 26 milled 73 1.62 0.493
13 unmilled 58 1.00 0.166 27 milled 71 1.95 0.185
14 unmilled 60 1.13 0.175 28 milled 80 1.83 0.315
Parameter Units # Obs Mean Std Dev Min Max
Friction – BPN BPN 28 71 13.4 55 105
Macro-texture – MPD mm 28 1.60 0.86 0.67 3.41
Micro-texture – MPD mm 28 0.028 0.005 0.021 0.041
The measurements of friction, and texture were all performed in the same spot at each of
the 28 test surfaces. Texture data was always collected prior to friction to ensure the dry
condition during the scanning of the surface. The surface coordinates scanned by the CTM were

20
used to calculate the MPD of the macro-texture. The surface coordinates scanned using the LTS
were used to calculate different parameters to characterize the micro-texture, such as the MPD
and the Root Mean Squared (RMS).
Table 1 presents the summary statistics of the friction and texture data collected for the
study. Among the several calculated micro-texture parameters, the one used to describe the tests
surfaces of the study is the MPD with a 1 mm baseline.
Table 3.3: Summary Statistics of Collected Texture and Friction Data
Parameter Units Obs Mean Std Dev Min Max
Skid Resistance – BPN - 28 71 13.4 55 105
Macro-texture - MPDmacro mm 28 1.60 0.86 0.67 3.41
Micro-texture - MPDmicro mm 28 0.028 0.005 0.021 0.041

21
Chapter 4. Characterization and Processing of Micro-Texture Data
The scanned test surfaces using the LTS were decomposed into two profiles, each
containing the wavelengths of the macro and micro component of the texture respectively. The
calculated parameters and analyses performed to characterize the micro-texture of each test
surface were applied to the filtered profiles. This section describes the processing applied to the
scanned surfaces and presents the calculated parameters.
4.1 Processing of Texture Data
The spatial coordinates scanned by the LTS were processed in order to filter the micro-
texture component of the surface texture. The scanned lines were transformed to the frequency
domain using Fourier Transform and then filtered using an ideal low-pass filter. The profiles in
the frequency domain were cut off between the wavelengths 0.05 mm to 0.50 mm to obtain the
micro-texture profile and between 0.50 mm and 50.0 mm to obtain the macro-texture profile.
4.1.1 Spectral Analysis.
The Power Spectral Density (PSD) was calculated for each of the test surfaces in order to
analyze the relative impact of a group of frequencies on the surface friction as measured by the
BPT. The PSD of each test surface was estimated as the mean of the individual PSDs for the 400
scanned lines per surface, as proposed by Elson et al., (1995). Figure 4.1 presents the PSD of
four test surfaces as a function of frequency (and wavelength) in a double logarithmic scale. This
graph includes the frequencies corresponding to the first decade of the macro- and micro-texture
respectively.
A linear relationship between the log of the PSD and the log of the frequency is noted in
Figure 4.1. The correlation coefficient between the set of log(PSD) and log(frequency) was
observed to be greater than 0.98 for the 28 test surfaces, indicating a strong linear relationship
between them for all surfaces. This implies that the micro-texture of the test surfaces can be
characterized in the frequency domain using two parameters: the slope and “y” intercept of a
straight line fitting the observed log(PSD) and log(Frequency).

22
Figure 4.1: Power Spectral Densities of four scanned surfaces
Figure 4.2: (a) Line scan of pavement surface with filtered micro- and macro-texture components
(above) and (b) close up of line scan profile (below)
101
102
103
10-1
100
101
102
103
104
105
106
log(Frequency) [cycles/period]
log(P
SD
)
section 1
section 2
section 3
section 4
micro 1st decade
0.5mm
macro 1st decade
50mm
0 5 10 15 20 25 30 35 40 45 50-0.1
-0.05
0
0.05
0.1
Longitudinal coordinate (mm)
Su
rface h
eig
ht
(mm
)
35 36 37 38 39 40
-5
0
5
10
15
x 10-3
Longitudinal coordinate (mm)
Su
rface h
eig
ht
(mm
)
micro
macro
profile
MICRO-TEXTURE MACRO-TEXTURE
5.00 0.50 mm
0.05
log (Wavelength) [mm]
close up
Baseline = 5 mm
Baseline = 1 mm
Baseline = 20 mm Baseline = 10 mm
Active
Area

23
4.1.2 Processing in Spatial Domain.
The filtered profiles were then transformed back to the spatial domain, obtaining the
coordinates of profiles formed only by the wavelengths of the first decade of the micro-texture.
Since the ringing artifacts due to having applied an ideal low-pass filter were more evident in the
extremes of the lines, the micro-texture profiles of each test surface were truncated by not
considering the first and last 5 mm of each profile. Therefore, the micro-texture profiles used for
the calculation of parameters in the spatial domain were 40 mm long each.
Figure 4.2 shows the coordinates of a scanned line (in red) along with the filtered macro-
texture (in green) and micro-texture profiles (in blue). The graph at the top (Figure 4.2-a) shows
the coordinates for the entire 50.8 mm whereas the graph at the bottom (Figure 4.2-b) shows a
close-up of the scanned line between the longitudinal coordinates of 35 mm and 40 mm. The
macro-texture profile is formed by subtracting the higher frequencies, which provide the fine
details of the curve (asperities of the surface), from the original profile. Therefore, the macro-
texture is a smoothed version of the scanned profile, as it can be noted from the close-up figure
(Figure 4.2-b).
The next step in the processing of the scanned surfaces consisted of dividing the micro-
texture profiles into shorter segments for their characterization. While the standard to calculate
the MPD of macro-texture profiles (ASTM E1845-09) specifies to analyze the surface profile in
segments 100 mm long, there is currently no specified baseline for the analysis of the micro-
texture profile. Each micro-texture parameter was calculated using four different baselines: 1
mm, 5 mm, 10 mm and 20 mm. These four baselines are illustrated in Figure 4.2. Since the
sampling rate of the LTS was 70 coordinates per millimeters, the shortest baseline (1 mm)
comprises 70 points and the longest one (20 mm) comprises 1,400 points.
4.2 Calculation of Micro-Texture Parameters
Once the micro-texture profiles of each test surface were segmented adopting the
different baselines, a series of parameters to characterize the roughness of the profiles were
calculated. These parameters can be categorized into spectral and spatial parameters depending
on whether they were calculated in the frequency or in the spatial domain. The spectral
parameters consisted of the intercept and slope of the PSD as a function of the frequency on a

24
log-log scale. The spatial parameters can be further divided into the amplitude and the slope
parameters depending on whether they were calculated using the amplitude or the slopes of the
profiles.
4.2.1 Spectral Parameters
The intercept and slope of the linearized PSD were obtained by estimating the parameters
of a linear model predicting the logarithm of the PSD as a function of the logarithm of the
frequency for each surface. The parameters of the models were estimated using Ordinary Least
Square (OLS) regression.
4.2.2 Amplitude Parameters.
The amplitude parameters use the height values of the filtered profiles to characterize the
micro-texture. The formulae of each of the calculated amplitude parameters are the following:
Mean Profile Depth: 𝑀𝑃𝐷 =1
2[max(ℎ1, . . , ℎ𝑁/2) + max(ℎ𝑁/2+1, . . , ℎ𝑁)] (1)
Root Mean Squared: 𝑅𝑀𝑆 = √1
𝑁∑ ℎ𝑖
2𝑁𝑖=1 (2)
Maximum Height of the Profile: 𝑀𝑃𝐻 = max(ℎ𝑖) − min(ℎ𝑖) , 𝑖 = 1. . 𝑁 (3)
Where ℎ𝑖 is the height value for coordinate “i”, and N is the number of coordinates within the
baseline.
4.2.3 Slope Parameters.
The slope (or spacing) parameters use the slope values of the micro-texture profiles. The
slopes values were calculated using two different formulae. One measures the slopes between
two consecutive points as the difference in height between two consecutive coordinates divided
by the horizontal distance between them (Equation 4). The second calculates the slopes using a
weighted sum of the height values of six coordinates divided by the horizontal distance between

25
them (Equation 5), as proposed in ASME B46.1 (2009). The slope parameters for each test
surface were calculated for each of the four analyzed baselines.
The formulae of each of the slope parameters calculated for the study are the following:
Two-Points Slope Variance: 𝑆𝑉2𝑝𝑡𝑠 = √1
𝑁∑ (
ℎ𝑖+1+ℎ𝑖
∆𝑥)
2𝑁𝑖=1 (4)
Six-Points Slope Variance:
𝑆𝑉6𝑝𝑡𝑠 = √1
𝑁∑ (
ℎ𝑖+3−9∗ℎ𝑖+2+45∗ℎ𝑖+1−45∗ℎ𝑖−1+9∗ℎ𝑖−2−ℎ𝑖−3
60∗∆𝑥)
2𝑁𝑖=1 (5)
Where ∆𝑥 is the horizontal distance between coordinates.
The representative value of each test surface was determined as both the mean and the
median of the set of parameters calculated for the individual segments of the micro-texture
profiles. Thus, two different sets of results were produced for each baseline and parameter in
order to evaluate whether using the median or the mean leads to a better prediction of the surface
friction.
4.2.4 Accounting for Contact Area between Vehicle Tire and Pavement Surface.
An additional set of each of the presented micro-texture spatial parameters was calculated
for each test surface considering only the portion of the surface in contact with the tire patch
(active area).
The active area was estimated as the portion of the surface above the mean height of each
of the scanned profiles (Figure 4.3). Since the scanned profiles were normalized with respect to
their average height, the active area comprised the coordinates having a positive height value
(Figure 4.2-a). Therefore, the micro-texture parameters were calculated using only the subset of
segments that have a mean height greater than zero for each of the adopted baselines.
Figure 4.3: Contact area between the tire and the pavement (adapted from Moore, 1980)

26

27
Chapter 5. Analyses of Micro-Texture Data
This section presents the analyses conducted on the micro-texture profiles obtained by
processing field measurements of pavement surface coordinates. The analyses explore different
ways to characterize the micro-texture of pavements and evaluate which ones better predict the
skid resistance of the pavement surface.
5.1 Skid Resistance as a Function of Macro-Texture
Figures 5.1 and 5.2 present the relationship between the skid resistance and the macro-
texture (on the left) along with the skid resistance and the micro-texture (on the right) for the 28
tested pavement surfaces respectively. From both graphs in Figures 5.1 ad 5.2 it is observed that
the skid resistance increased linearly as both the micro- and the macro-texture increased.
Therefore, the skid resistance will be explained by means of the texture components of the
surface using linear regression models.
Figure 5.1: Relationship between skid resistance and macro-texture MPD

28
Figure 5.2: Relationship between skid resistance and micro-texture MPD
A linear model between the skid resistance and the macro-texture was estimated and used
as the reference when evaluating the impact of incorporating the micro-texture parameters into
the prediction. Since the set of tested surfaces comprises some surfaces that have received a light
texturing treatment and some others that have not, an indicator variable was included in order to
capture the effect of the treatment on the BPN.
The specification of the reference model is the following:
𝐵𝑃𝑁 = 𝛼 + 𝛽𝑀𝑎𝑐𝑟𝑜𝑀𝑃𝐷∗ 𝑀𝑎𝑐𝑟𝑜𝑀𝑃𝐷 + 𝛽𝑡𝑟𝑒𝑎𝑡 ∗ 𝑇𝑟𝑒𝑎𝑡 (6)
Where 𝑀𝑎𝑐𝑟𝑜𝑀𝑃𝐷 is the MPD value of the surface macro-texture, and 𝑇𝑟𝑒𝑎𝑡 is a dummy
variable that takes the values of 1 when the section has received light texturing and 0 otherwise.
The parameters of the linear regression model were estimated using Generalized Least
Squares (GLS) estimation, and the results are presented in Table 2. From the table it is observed
that both the macro-texture MPD and the treatment indicator were significant in explaining the
measured BPN with more than a 90% confidence level. It can also be observed that the BPN
increased as the macro-texture MPD increased, as expected, and that the BPN was greater, on
average, for the section that received treatment.

29
Table 5.1: Summary Statistics of Estimated Reference Model
Variable t-stat p-value Adjusted R2
𝛽𝑀𝑎𝑐𝑟𝑜𝑀𝑃𝐷 4.84 0.00
0.670 𝛽𝑇𝑟𝑒𝑎𝑡 2.61 0.02
5.2 Effect of Incorporating the Micro-Texture Parameters on Prediction of
Skid Resistance
The impact of incorporating the micro-texture on the prediction of skid resistance was
studied by analyzing the statistics of a series of linear models specified by adding each of the
calculated micro-texture parameters to the reference model (Equation 6). Each of these models
was also estimated using GLS.
5.2.1 Spectral Parameters.
The specification of the model including the spectral parameters of the micro-texture
was:
𝐵𝑃𝑁 = 𝛼 + 𝛽𝑀𝑃𝐷𝑚𝑎𝑐𝑟𝑜∗ 𝑀𝑎𝑐𝑟𝑜𝑀𝑃𝐷 + 𝛽𝑡𝑟𝑒𝑎𝑡 ∗ 𝑇𝑟𝑒𝑎𝑡 +
𝛽𝑙𝑃𝑆𝐷𝑖𝑛𝑡𝑒𝑟𝑐𝑒𝑝𝑡∗ 𝑙𝑃𝑆𝐷𝑖𝑛𝑡𝑒𝑟𝑐𝑒𝑝𝑡 + 𝛽𝑙𝑃𝑆𝐷𝑠𝑙𝑜𝑝𝑒
∗ 𝑙𝑃𝑆𝐷𝑠𝑙𝑜𝑝𝑒 (7)
Where 𝑙𝑃𝑆𝐷𝑖𝑛𝑡𝑒𝑟𝑐𝑒𝑝𝑡 and 𝑙𝑃𝑆𝐷𝑠𝑙𝑜𝑝𝑒 are the intercept and slope respectively of the
linearized PSD of the surface micro-texture.
The results of the estimation of the model including the spectral parameters (Equation 7)
are presented in Table 3, under the columns of “Model A”. From Table 3 it is observed that the
Adjusted R2 of the Model A increased with respect to the reference model, implying that the
incorporation of the micro-texture spectral parameters improved the prediction of the skid
resistance of the pavement. It is also observed that the intercept of the linearized PSD
significantly affected the BPN whereas the slope didn’t. Therefore, the slope of the linearized
PSD of the micro-texture was removed from the previous specification and the results of this
new model are presented in Table 3, under the columns of “Model B”. It can be observed from

30
the table that this model presents a higher Adjusted R2, and that the BPN increased as the value
of the intercept of the linearized PSD increased.
Table 5.2: Summary Statistics of the Estimated Models Incorporating the Micro-Texture
Spectral Parameters
Variable Model A Model B
t-stat p-value Adjusted R2
t-stat p-value Adjusted R2
𝛽𝑀𝑎𝑐𝑟𝑜𝑀𝑃𝐷 2.22 0.04
0.764
2.63 0.01
0.775 𝛽𝑇𝑟𝑒𝑎𝑡 4.06 0.00 4.19 0.00
𝛽𝑙𝑃𝑆𝐷𝑖𝑛𝑡𝑒𝑟𝑐𝑒𝑝𝑡 2.52 0.02 3.16 0.00
𝛽𝑙𝑃𝑆𝐷𝑠𝑙𝑜𝑝𝑒 -0.08 0.94 - -
Note: Adjusted R2 before incorporating micro-texture parameters = 0.670
5.2.2 Spatial Parameters
The specification of the models including the spatial parameters of the micro-texture for
each of the four adopted baselines was:
𝐵𝑃𝑁 = 𝛼 + 𝛽𝑀𝑃𝐷𝑚𝑎𝑐𝑟𝑜∗ 𝑀𝑎𝑐𝑟𝑜𝑀𝑃𝐷 + 𝛽𝑡𝑟𝑒𝑎𝑡 ∗ 𝑇𝑟𝑒𝑎𝑡 + 𝛽𝑡𝑟𝑒𝑎𝑡 ∗ 𝑀𝑖𝑐𝑟𝑜𝑝𝑎𝑟𝑎𝑚𝑖
𝑏𝑎𝑠𝑒𝑙𝑖𝑛𝑒𝑗 (8)
Where 𝑀𝑖𝑐𝑟𝑜𝑝𝑎𝑟𝑎𝑚𝑖
𝑏𝑎𝑠𝑒𝑙𝑖𝑛𝑒𝑗 is the micro-texture spatial parameter “i” computed using the baseline “j”.
Since the value for each spatial parameter was determined using both the mean and the
median of the set of calculated values for the 400 micro-texture profiles of the scanned surface,
two different models were estimated for each baseline in order to evaluate whether using the
median or the mean leads to a better prediction of the BPN. The Adjusted R2 and the t-statistic of
the micro-texture parameter for each of the estimated models are presented in Table 4.
As it can be observed from Table 4, both the Adjusted R2 and the t-statistic decrease as
the baseline increases in length. Therefore, using a shorter baseline to characterize the micro-
texture made each parameter a better predictor of the BPN. Another interesting observation from
Table 4 is that the spatial parameters improved the prediction of the BPN when calculated as the
median of the values for the individual micro-texture profiles with respect to the mean approach.
31
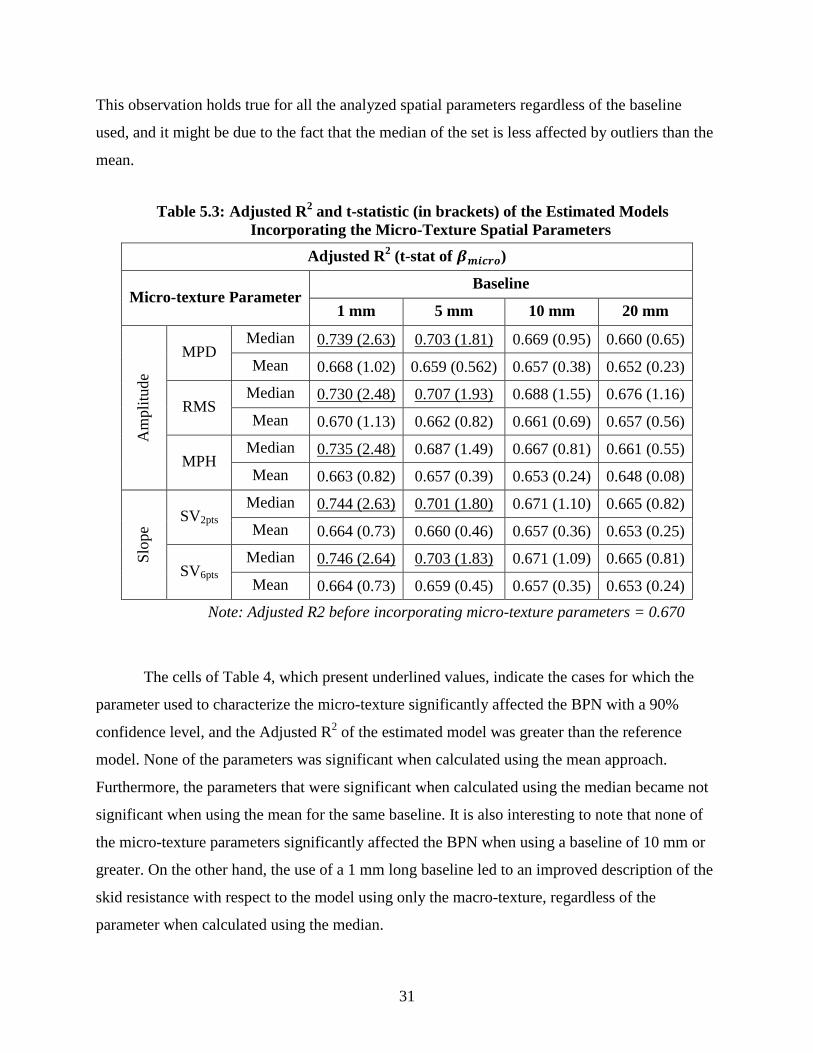
This observation holds true for all the analyzed spatial parameters regardless of the baseline
used, and it might be due to the fact that the median of the set is less affected by outliers than the
mean.
Table 5.3: Adjusted R2 and t-statistic (in brackets) of the Estimated Models
Incorporating the Micro-Texture Spatial Parameters
Adjusted R2 (t-stat of 𝜷𝒎𝒊𝒄𝒓𝒐)
Micro-texture Parameter Baseline
1 mm 5 mm 10 mm 20 mm
Am
pli
tude
MPD Median 0.739 (2.63) 0.703 (1.81) 0.669 (0.95) 0.660 (0.65)
Mean 0.668 (1.02) 0.659 (0.562) 0.657 (0.38) 0.652 (0.23)
RMS Median 0.730 (2.48) 0.707 (1.93) 0.688 (1.55) 0.676 (1.16)
Mean 0.670 (1.13) 0.662 (0.82) 0.661 (0.69) 0.657 (0.56)
MPH Median 0.735 (2.48) 0.687 (1.49) 0.667 (0.81) 0.661 (0.55)
Mean 0.663 (0.82) 0.657 (0.39) 0.653 (0.24) 0.648 (0.08)
Slo
pe
SV2pts Median 0.744 (2.63) 0.701 (1.80) 0.671 (1.10) 0.665 (0.82)
Mean 0.664 (0.73) 0.660 (0.46) 0.657 (0.36) 0.653 (0.25)
SV6pts Median 0.746 (2.64) 0.703 (1.83) 0.671 (1.09) 0.665 (0.81)
Mean 0.664 (0.73) 0.659 (0.45) 0.657 (0.35) 0.653 (0.24)
Note: Adjusted R2 before incorporating micro-texture parameters = 0.670
The cells of Table 4, which present underlined values, indicate the cases for which the
parameter used to characterize the micro-texture significantly affected the BPN with a 90%
confidence level, and the Adjusted R2 of the estimated model was greater than the reference
model. None of the parameters was significant when calculated using the mean approach.
Furthermore, the parameters that were significant when calculated using the median became not
significant when using the mean for the same baseline. It is also interesting to note that none of
the micro-texture parameters significantly affected the BPN when using a baseline of 10 mm or
greater. On the other hand, the use of a 1 mm long baseline led to an improved description of the
skid resistance with respect to the model using only the macro-texture, regardless of the
parameter when calculated using the median.

32
When comparing the parameters calculated using the median value and a 1 mm baseline,
it is observed that the adjusted R2 of the models using the slope parameters are slightly greater
than the ones using the amplitude parameters. This observation implies that characterizing the
surface micro-texture using the slope values of the profiles predicts the BPN better than when
using the amplitude values. In addition, it is observed that the MPD was the most significant in
explaining the BPN among the models using amplitude parameters whereas the summary
statistics between the two models with slope parameters were similar to each other.
The highest adjusted R2 among the models using spatial parameters was 0.746, which is
lower than the one obtained using spectral parameters. Therefore, the micro-texture parameters
computed in the frequency domain were better in predicting the pavement BPN than the
parameters calculated using the spatial coordinates.
5.3 Effect of Accounting for Contact Area on Prediction of Skid Resistance
The polishing effect of traffic on the aggregates of the pavement surface might result in
lower micro-texture on the higher points of the surface for some types of aggregates. Since all of
the surfaces tested for this study consist of in-service pavement surfaces, additional analyses
were performed to determine both whether the values of the micro-texture parameters at the
peaks of the profiles differed from the ones at the valleys, and how to better characterize the
micro-texture in order to improve the prediction of the skid resistance if that occurs.
5.3.1 Variation of Micro-Texture between Surface’s Peaks and Valleys
In order to analyze whether the micro-texture at the peaks of the profiles was different
than at the valleys, the micro-texture MPD (using a 1 mm baseline length) was regressed on the
corresponding macro-texture mean height value for the segments of each test surface (Equation
9).
𝑀𝑖𝑐𝑟𝑜𝑀𝑃𝐷 = 𝛼 + 𝛽 ∗ 𝑀𝑎𝑐𝑟𝑜𝑚𝑒𝑎𝑛_ℎ𝑒𝑖𝑔ℎ𝑡 (9)
Where 𝑀𝑖𝑐𝑟𝑜𝑀𝑃𝐷 is the set of calculated micro-texture MPD values using a 1 mm
baseline, and 𝑀𝑎𝑐𝑟𝑜𝑚𝑒𝑎𝑛_ℎ𝑒𝑖𝑔ℎ𝑡 is the set of macro-texture mean height value for the
corresponding 1 mm long segments.

33
The parameters of the linear model (Equation 9) were estimated for each test surfaces
using GLS. The t-statistic of the parameter was less than -1.96 for 26 of the 28 tests surfaces of
the study, being between -1.96 and 1.96 for the two remaining. Therefore, the micro-texture at
the peaks of the surface (active area) was significantly lower than at the valleys for the majority
of the tested surfaces.
5.3.2 Spatial Parameters Calculated on Active Area.
Only the micro-texture of the contact area between the vehicle tire and the pavement
surface (active area) affects the development of the frictional forces attributed to the micro-
texture asperities. Therefore, the use of calculated micro-texture parameters accounting for the
active area of the surface is expected to improve the prediction of the skid resistance.
The specification of the models including the micro-texture spatial parameters calculated
on the active area was:
𝐵𝑃𝑁 = 𝛼 + 𝛽𝑀𝑃𝐷𝑚𝑎𝑐𝑟𝑜∗ 𝑀𝑎𝑐𝑟𝑜𝑀𝑃𝐷 + 𝛽𝑡𝑟𝑒𝑎𝑡 ∗ 𝑇𝑟𝑒𝑎𝑡 + 𝛽𝑡𝑟𝑒𝑎𝑡 ∗ 𝑀𝑖𝑐𝑟𝑜𝑝𝑎𝑟𝑎𝑚𝑖
𝐴𝑐𝑡𝑖𝑣𝑒𝐴𝑟𝑒𝑎 (10)
Where 𝑀𝑖𝑐𝑟𝑜𝑝𝑎𝑟𝑎𝑚𝑖
𝐴𝑐𝑡𝑖𝑣𝑒𝐴𝑟𝑒𝑎 is the set of values for the micro-texture parameters “i” calculated on the
active area using the median of the 1 mm long segments for each test surface.
The Adjusted R2 and the t-statistic of the estimated linear models for each micro-texture
parameter are presented in Table 5. The summary statistics of the models using the spatial
parameters calculated using the entire profiles are also included in the table for comparison. It
can be observed from the table that both the Adjusted R2 and the t-statistic are greater for the
models using the parameters calculated only on the active area. Therefore, accounting for the
contact area between the pavement and the vehicle tire improved the prediction of the skid
resistance. The highest adjusted R2 among the models calculated on the active area was 0.776
which is similar to the one obtained using spectral parameters.

34
Table 5.4: Summary Statistics of the Estimated Models Calculated on the Active Area
Micro-texture
Parameters
calculated for
Adjusted R2 (t-stat of 𝜷𝒎𝒊𝒄𝒓𝒐)
Amplitude Slope
MPD RMS MPH SV2pts SV6pts
Entire Profile 0.739 (2.63) 0.730 (2.48) 0.735 (2.48) 0.744 (2.63) 0.746 (2.64)
Active Area 0.763 (3.07) 0.762 (3.01) 0.761 (2.95) 0.772 (3.09) 0.776 (3.14)
Note: Adjusted R2 before incorporating micro-texture parameters = 0.670

35
Chapter 6. Summary and Conclusions
This study explored different ways to characterize the micro-texture of pavement surfaces
with the main objective of quantifying the effect of accounting for both the micro and the macro
components of the texture, rather than just the macro-texture, on the prediction of BPN skid
resistance. The different methods to characterize the micro-texture were compared in order to
determine which one better predicts the skid resistance of the wet pavement surfaces at low
speeds.
A total of 28 different pavement surfaces were included in the study, covering a wide
range of BPN values, and a number of cases for each possible combination of fine and coarse
macro-texture and smooth and sharp micro-texture. Some of the test surfaces were measured
after applying a light texturing treatment. The data collection consisted of field measurement of
friction and texture performed on the same spot at each the test surfaces. The friction was
measured under wet condition of the surface using a BPT, which evaluates the skid resistance of
the pavement at lower speeds. The macro-texture was characterized using a CTM, while the
micro-texture was characterize by a series of different parameters calculated using the surface
coordinates scanned by the LTS.
The following list contains the main conclusions and observations of the study, which
apply to the conditions described above:
The skid resistance at low speeds of the wet pavement surfaces was significantly affected
by both the micro- and the macro-texture of the pavement surface.
Incorporating the characterization of the surface micro-texture to the macro-texture
significantly improved the prediction of the pavement skid resistance.
Among the micro-texture parameters calculated using the frequencies of the micro-
texture profile:
o The intercept of the linearized PSD significantly affected the BPN. The greater
the value of the PSD, the greater the low-speed skid resistance of the pavement.
o The slope of the linearized PSD was found to not significantly affect the low-
speed skid resistance, contrary to expectations.

36
Among the micro-texture parameters calculated using the spatial coordinates of the entire
micro-texture profile:
o Regardless of the parameter, the prediction of the skid resistance drastically
improved when its value for each test surface was calculated using the median of
the individual profiles instead of the mean.
o Regardless of the parameter, the baseline that produced the best prediction of the
skid resistance was the 1 mm baseline. None of the parameters significantly
explained the BPN when using a baseline of 10 mm or larger.
o The MPD was the most significant in explaining the BPN among the models
using amplitude parameters.
o Among the slope parameters, the one calculated using six points was similar to
the one calculated using two points in the prediction of the BPN.
o Among the micro-texture spatial parameters, the ones calculated using the slope
values of the profiles predicted the BPN better than the ones using the amplitude
values.
o The micro-texture parameters computed in the frequency domain were better in
predicting the pavement BPN than the parameters calculated using the spatial
coordinates on the entire micro-texture profiles.
The micro-texture at the surfaces peaks (active area) was found to be significantly lower
than at the valleys for the large majority of the tested surfaces.
Accounting for the contact area between the pavement and the vehicle tire significantly
improved the prediction of the BPN. The prediction of the pavement skid resistance using
micro-texture spatial parameters calculated on the active area was as good as the one
using the spectral parameters.
The authors conclude that accounting for both the macro- and the micro-texture
components of the surface will significantly enhance the prediction of BPN of flexible
pavements as oppose to accounting solely for the macro-texture component. Such improvement
will allow transportation agencies to better manage skid resistance and therefore to improve road
safety. Regarding the characterization of the surface micro-texture, the authors strongly

37
recommend accounting for the actual contact area between tire and pavement. In addition, it is
recommended to determine the value of the surface micro-texture parameter as the median of the
individual segments of analysis using a 1 mm baseline, in order to mitigate the effect of outliers
in the texture measurements.


39
References
AMES Engineering (2010). Laser Texture Scanner User Manual. Iowa.
ASME B46.1 (2009). Surface Texture (Surface Roughness, Waviness, and Lay). The American
Society of Mechanical Engineers. New York, NY.
ASTM E303-98 (1998). Standard Test Method for Measuring Surface Frictional Properties
Using the British Pendulum Tester. ASTM Standards.
ASTM E1845-09 (2009). Standard Practice for Calculating Pavement Macrotexture Mean
Profile Depth. ASTM Standards.
Choubane, B., Holzschuher, C.R., and Gokhale, S. (2004). Precision of Locked-Wheel Testers
for Measurement of Roadway Surface Friction Characteristics. Transportation Research
Record, 1869.
Do, M.T., H. Zahouani, and R. Vargiolu, (2000). Angular Parameter for Characterizing Road
Surface Microtexture. Transportation Research Record, 1723.
Elson, J.M. and J.M. Bennett (1995). Calculation of the power spectral density from surface
profile data. Applied Optics. 34, No. 1.
Hall, J.W., K.L. Smith, J.C. Wambold, T.J. Yager and Z. Rado (2009). Guide for Pavement
Friction. NCHRP Web-Only Document 108. National Cooperative Highway Research
Program, Washington, D.C.
Henry, J.J. (2000). Evaluation of Pavement Friction Characteristics. NCHRP Synthesis 291.
National Cooperative Highway Research Program, Washington, D.C.
Mahmoud, E., Gates, L., Masad, E., Erdoğan, S., and Garboczi, E. (2010). Comprehensive
Evaluation of AIMS Texture, Angularity, and Dimension Measurements. J. Mater. Civ.
Eng., 22(4), 369–379.
Masad, E., A. Rezaei, A. Chowdhury, and P. Harris (2009). Predicting Asphalt Mixture Skid
Resistance Based on Aggregate Characteristics. FHWA/TX-09/0-5627-1. Texas
Transportation Institute. College Station, Texas.
Moore D.F. (1972). The Friction and Lubrication of Elastomers, Pergamon Press, Oxford.

40
Moore D.F. and W. Geyer (1974). A review of hysteresis theories for elastomers, Wear 30, 1-34.
Moore D.F. (1980). Friction and Wear in Rubbers and Tyres, Wear 61, 273-282.
Noyce D.A., H.U. Bahia, J.M. Yambó, and Kim, G. (2005). Incorporating Road Safety into
Pavement Management: Maximizing Asphalt Pavement Surface Friction for Road Safety
Improvements. Report Number MRUTC 04-04. Midwest Regional University
Transportation Center Traffic Operations and Safety (TOPS) Laboratory.
Persson, B.N.J. (1998). Sliding Friction: Physical Principles and Applications. Springer, Berlin,
Germany.
PIARC, (1987). Optimization of Pavement Surface Characteristics, PIARC Technical
Committee on Surface Characteristics, Report to the XVIIIth World Road Congress,
Brussels, Belgium.


