Cupolex Floors: Static Behaviour Analysis
Padua, November 30th, 2003
Research project: ‘Cupolex floor:static behawiour analysis’ Pag. 2
SUMMARY
1 INTRODUCTION........................................................................................3
2 TEST RESULTS ........................................................................................10
3 INTERPRETATION OF COLLAPSE.......................................................12 3.1 RESULTS OF NUMERICAL ANALYSIS WITH A REDUCED SOIL
COEFFICIENT OF ELASTICITY............................................................ 16
4 NUMERICAL MODEL AND VERIFICATION ......................................17 4.1 PUNCHING VERIFICATION.................................................................. 18
5 CONCLUSIONS........................................................................................20
6 BIBLIOGRAPHY ......................................................................................24
ENCLOSED A: BREAKING TESTS RESULTS ..............................................25
ENCLOSED B: GEOTECHNICAL REPORT- TEST REPORT.......................30
ENCLOSED C: EXPERIMENTAL TESTS RESULTS.....................................31
ENCLOSED D: PHOTO GALLERY.................................................................35
Research project: ‘Cupolex floor:static behawiour analysis’ Pag. 3
1 INTRODUCTION
We report here the results of a study conducted for the Pontarolo Company about the static behaviour of concrete slabs made by employing Cupolex modules.
This research aims at the definition of numerical models as well as their experimental validation with tests in situ. A characteristic attribute of this product is its modular dome made of plastic materials with plan dimensions of about 56x56 cm.
The modules are variously interlinked to create a formwork for successive complete concrete casting.
The slabs, thanks to the distinctive domed shape of the modular elements, provide an internal orthogonal mesh allowing for air-circulation ducts. The project data refers to the concrete over layer and to the level of reinforcement needed, as established according to the soil characteristics and loading types and levels. For a more detailed description of the construction methods employed, please visit the manufacturer’s Internet site: www.pontarolo.com.
The main steps used in the experimental and numeric investigations are listed
below: o Bibliography research and definition of analytical-numerical models o Definition of a validation method and design of the experimental equipment o Definition of tests and their implementation o Execution of geotechnical investigations for ground characterization where
testing should be conducted o Numerical simulation of experimental testing by using the results of geotechnical
investigations for ground characterization. o Execution of ultimate load testing. o Study of the experimental curves obtained:
- analysis of the experimental data in comparison with the results of the single tests and notation of any anomalies,
- initial considerations on the geometry of distorted slabs, - qualitative evaluation of ultimate load limits
o Comparison of numerical and experimental data along with the consequent validation of the numerical models. By now, about 24 stress-rupture tests have been conducted on artefacts with
various reinforcements, thickness and geometry. The test is conducted by loading the artefact with a hydraulic jack until a break
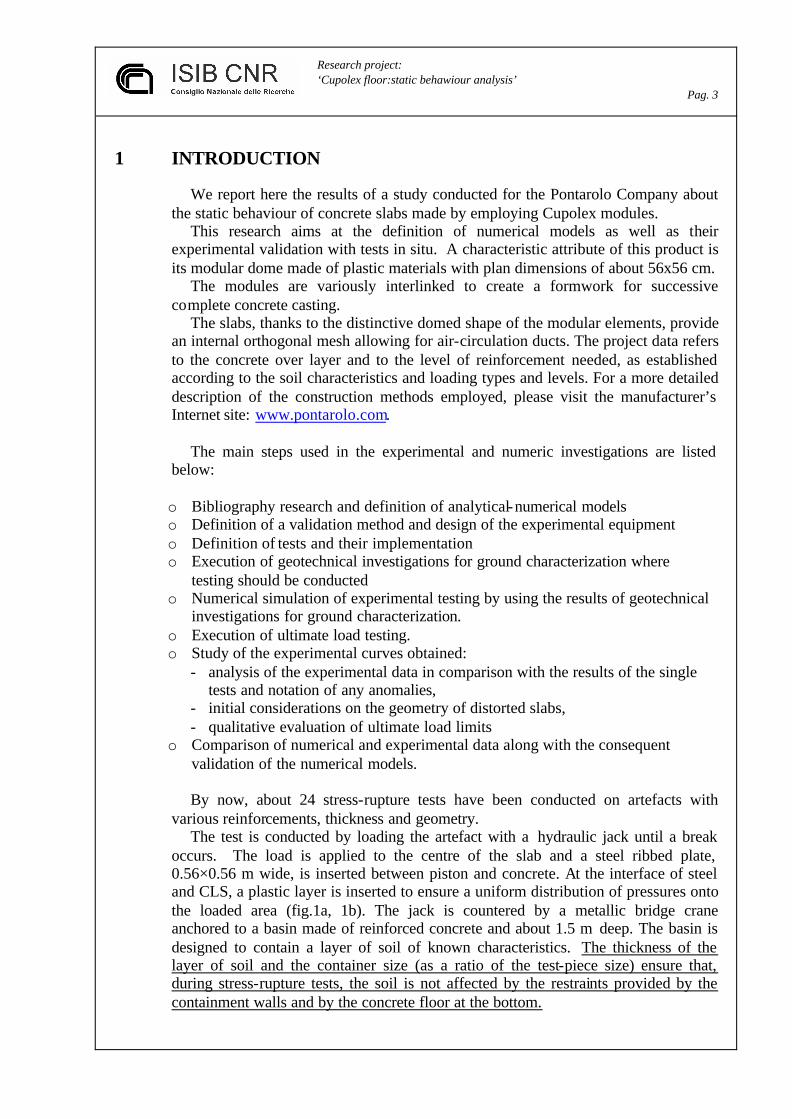
occurs. The load is applied to the centre of the slab and a steel ribbed plate, 0.56×0.56 m wide, is inserted between piston and concrete. At the interface of steel and CLS, a plastic layer is inserted to ensure a uniform distribution of pressures onto the loaded area (fig.1a, 1b). The jack is countered by a metallic bridge crane anchored to a basin made of reinforced concrete and about 1.5 m deep. The basin is designed to contain a layer of soil of known characteristics. The thickness of the layer of soil and the container size (as a ratio of the test-piece size) ensure that, during stress-rupture tests, the soil is not affected by the restraints provided by the containment walls and by the concrete floor at the bottom.

Research project: ‘Cupolex floor:static behawiour analysis’ Pag. 4
This statement has been verified through a finite element model in which the soil is represented as a homogeneous material with linear elastic behaviour.
7.45m
2.39
m
6.60m
6.00m
6.30
m
3.92
m
3.92 m
Subgrade
Fig. 1a Plan and cross-section of the testing basin.
Research project: ‘Cupolex floor:static behawiour analysis’ Pag. 5
1
32
5
4
6
Global comparators: 1,2,3,4 Local comparators: 5,6
DZ
5, D
Z6
DZ
2, D
Z3
DZ
1, D
Z4
3.92
m
3.92m
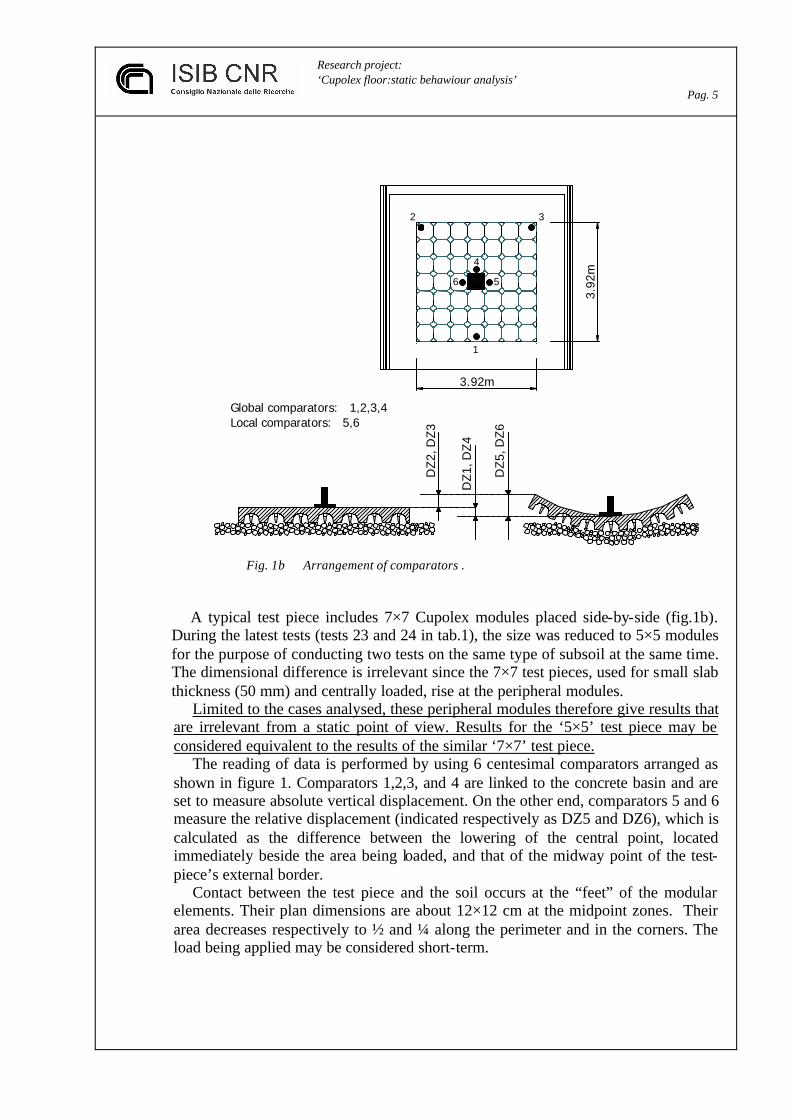
Fig. 1b Arrangement of comparators .
A typical test piece includes 7×7 Cupolex modules placed side-by-side (fig.1b). During the latest tests (tests 23 and 24 in tab.1), the size was reduced to 5×5 modules for the purpose of conducting two tests on the same type of subsoil at the same time. The dimensional difference is irrelevant since the 7×7 test pieces, used for small slab thickness (50 mm) and centrally loaded, rise at the peripheral modules.
Limited to the cases analysed, these peripheral modules therefore give results that are irrelevant from a static point of view. Results for the ‘5×5’ test piece may be considered equivalent to the results of the similar ‘7×7’ test piece.
The reading of data is performed by using 6 centesimal comparators arranged as shown in figure 1. Comparators 1,2,3, and 4 are linked to the concrete basin and are set to measure absolute vertical displacement. On the other end, comparators 5 and 6 measure the relative displacement (indicated respectively as DZ5 and DZ6), which is calculated as the difference between the lowering of the central point, located immediately beside the area being loaded, and that of the midway point of the test-piece’s external border.
Contact between the test piece and the soil occurs at the “feet” of the modular elements. Their plan dimensions are about 12×12 cm at the midpoint zones. Their area decreases respectively to ½ and ¼ along the perimeter and in the corners. The load being applied may be considered short-term.

Research project: ‘Cupolex floor:static behawiour analysis’ Pag. 6
By way of experimental testing, we wanted to re-create a typical mechanism of slab shear-bending rupture. As a matter of fact, during actual utilization, the most significant load distributions are those that maximize (positive and negative) bending moment; the break generally occurs when exceeding the flexural strength.
The ultimate load varies in relation to slab geometry, quality of concrete, type of soil and any reinforcement levels of the concrete.
The test is devised so that, after an initial loss of stiffness due to the flexural rupture, the load may increase again to trigger other shear/punching rupture mechanisms.
The punching rupture generally follows the flexural one. Experimentally, the following variables were considered:
- Type of Cupolex - Thickness of slab - Levels of reinforcement - Type of soil
Specifically, the following values were employed:
• Dome geometry:
- H 9.5 - H 13 - H 26
Fig. 2 Cupolex 9.5
Research project: ‘Cupolex floor:static behawiour analysis’ Pag. 7
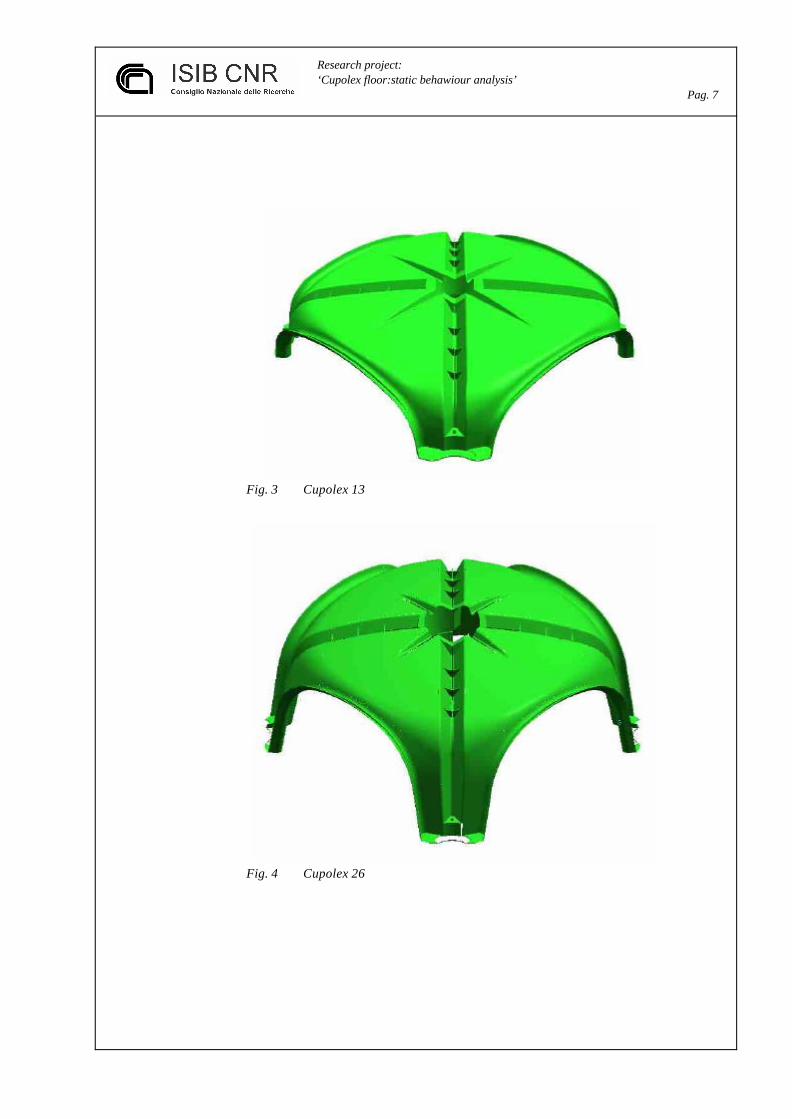
Fig. 3 Cupolex 13
Fig. 4 Cupolex 26
Research project: ‘Cupolex floor:static behawiour analysis’ Pag. 8
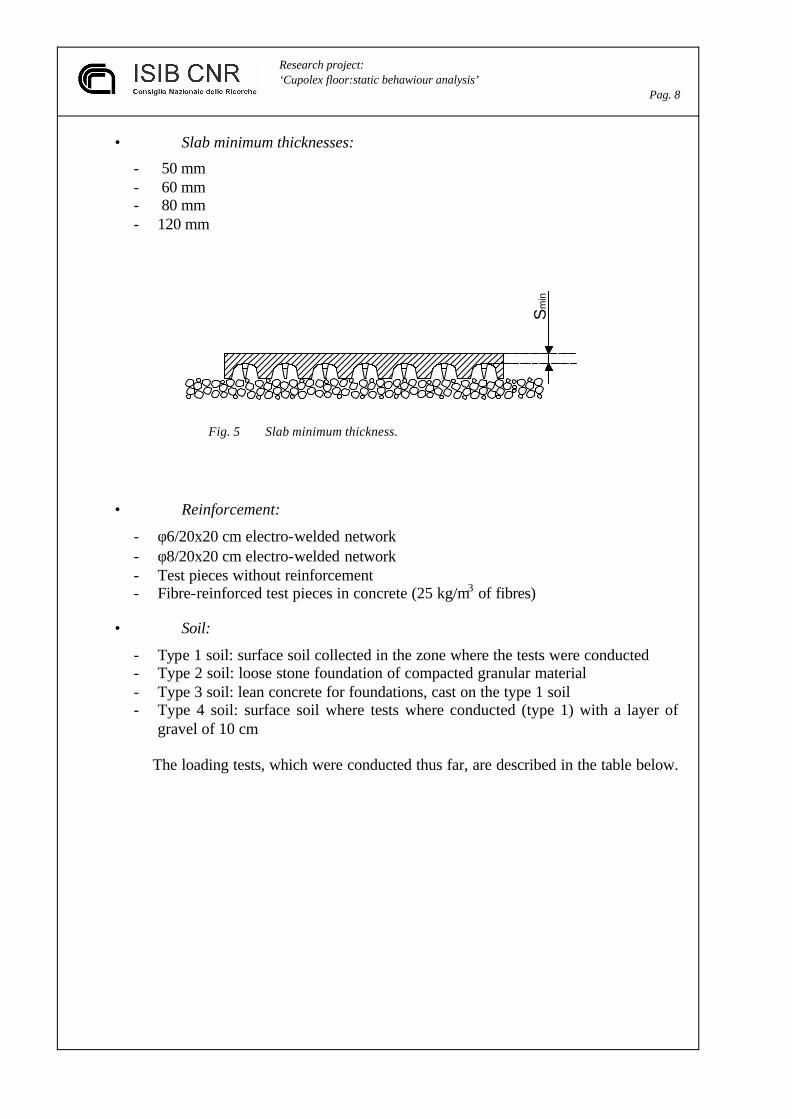
• Slab minimum thicknesses:
- 50 mm - 60 mm - 80 mm - 120 mm
Sm
in
Fig. 5 Slab minimum thickness.
• Reinforcement:
- φ6/20x20 cm electro-welded network - φ8/20x20 cm electro-welded network - Test pieces without reinforcement - Fibre-reinforced test pieces in concrete (25 kg/m3 of fibres)
• Soil:
- Type 1 soil: surface soil collected in the zone where the tests were conducted - Type 2 soil: loose stone foundation of compacted granular material - Type 3 soil: lean concrete for foundations, cast on the type 1 soil - Type 4 soil: surface soil where tests where conducted (type 1) with a layer of
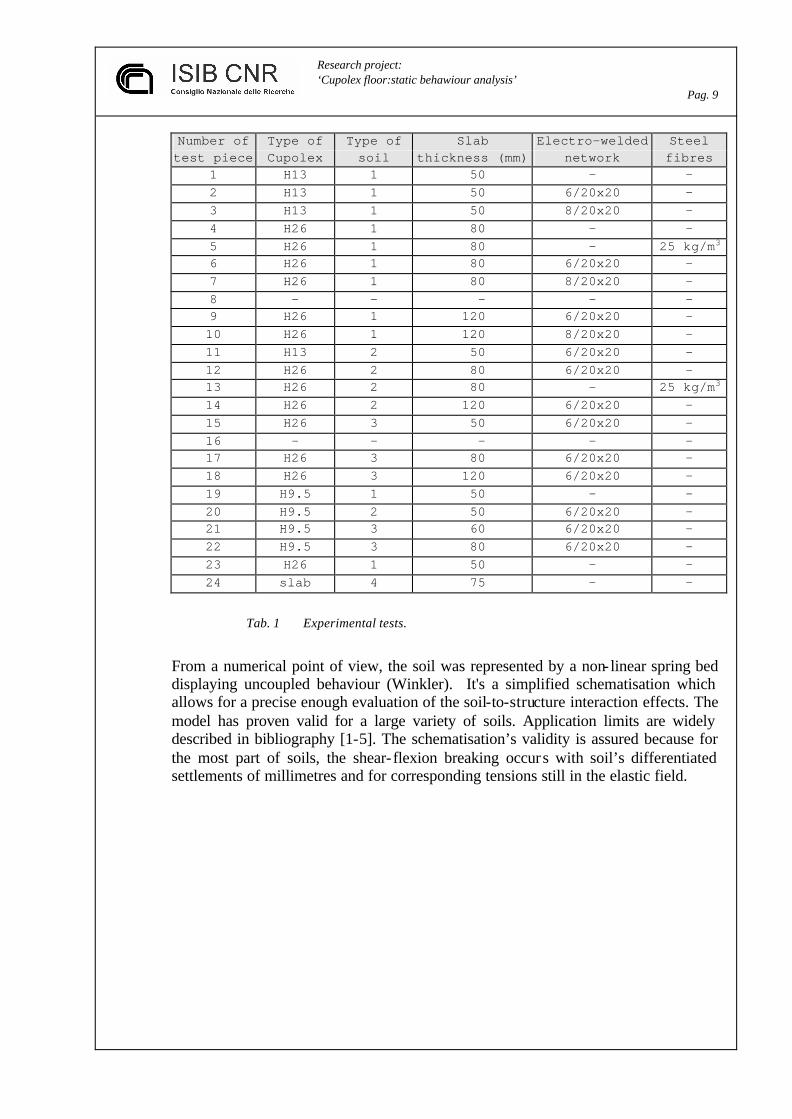
gravel of 10 cm The loading tests, which were conducted thus far, are described in the table below.
Research project: ‘Cupolex floor:static behawiour analysis’ Pag. 9
Number of Type of Type of Slab Electro-welded Steel test piece Cupolex soil thickness (mm) network fibres
1 H13 1 50 - - 2 H13 1 50 6/20x20 - 3 H13 1 50 8/20x20 - 4 H26 1 80 - - 5 H26 1 80 - 25 kg/m3 6 H26 1 80 6/20x20 - 7 H26 1 80 8/20x20 - 8 - - - - - 9 H26 1 120 6/20x20 - 10 H26 1 120 8/20x20 - 11 H13 2 50 6/20x20 - 12 H26 2 80 6/20x20 - 13 H26 2 80 - 25 kg/m3 14 H26 2 120 6/20x20 - 15 H26 3 50 6/20x20 - 16 - - - - - 17 H26 3 80 6/20x20 - 18 H26 3 120 6/20x20 - 19 H9.5 1 50 - - 20 H9.5 2 50 6/20x20 - 21 H9.5 3 60 6/20x20 - 22 H9.5 3 80 6/20x20 - 23 H26 1 50 - - 24 slab 4 75 - -
Tab. 1 Experimental tests.
From a numerical point of view, the soil was represented by a non- linear spring bed displaying uncoupled behaviour (Winkler). It's a simplified schematisation which allows for a precise enough evaluation of the soil-to-structure interaction effects. The model has proven valid for a large variety of soils. Application limits are widely described in bibliography [1-5]. The schematisation’s validity is assured because for the most part of soils, the shear- flexion breaking occurs with soil’s differentiated settlements of millimetres and for corresponding tensions still in the elastic field.
Research project: ‘Cupolex floor:static behawiour analysis’ Pag. 10
2 TEST RESULTS
In this chapter we analyse the results of test n. 23 and n. 24. These tests are particularly important because we can compare directly the behaviour of a full slab (n. 24) with that of a floor Cupolex (n. 23). In both cases the slab are without reinforcements.
In enclosed A there are also the other concise test results. We established the soil characteristics by employing a test on an ASTM φ30 cm
plate which gave an initial coefficient of subgrade soil reaction of about 0.075 N/mm3. In enclosed B there are results of the geotechnic test.
For a more detailed description of the geotechnic tests, see the report of Prof. Simonini of the University of Padova.
The graph (fig.6) shows the patterns of the DZ5 relative displacement. In test piece 23, the first macroscopic rupture occurs at about 80 kN of load, corresponding at a rupture for shear/flexion. Then the curve continues to climb with a lower slope up to about 160 kN, at which load the final rupture occurs due to punching of the damaged area (photo D.27, D.28, D.29).
Test piece 24 (full slab, 75 mm thick) shows an almost constant rigidity up to 170 kN, at which limit an immediate and sudden loss of bearing capacity occurs.
The full slab shows therefore behaviour of the fragile type, while the rupture of the Cupolex slab shows higher ductility. The experimental numeric data referring to two examined cases are shown in enclosed C.
Also, regardless of the fact that the Cupolex slab transfers the load to the soil only spottily, through its feet distant 0.58 m, it displays an initial stiffness similar, if not slightly higher, than that of the full slab on compacted gravel. In both cases, the load/unload curves do not show significant stiffness variations up to loads at the levels of 60-80 kN. The behaviour is different only in the post elastic phase.

Research project: ‘Cupolex floor:static behawiour analysis’ Pag. 11
0
20
40
60
80
100
120
140
160
180
0 5 10 15 20 25 30
DZ [mm]
P [k
N]
2324
Fig. 6 Load-displacement curves – Tests 23 and 24
Research project: ‘Cupolex floor:static behawiour analysis’ Pag. 12
3 INTERPRETATION OF COLLAPSE
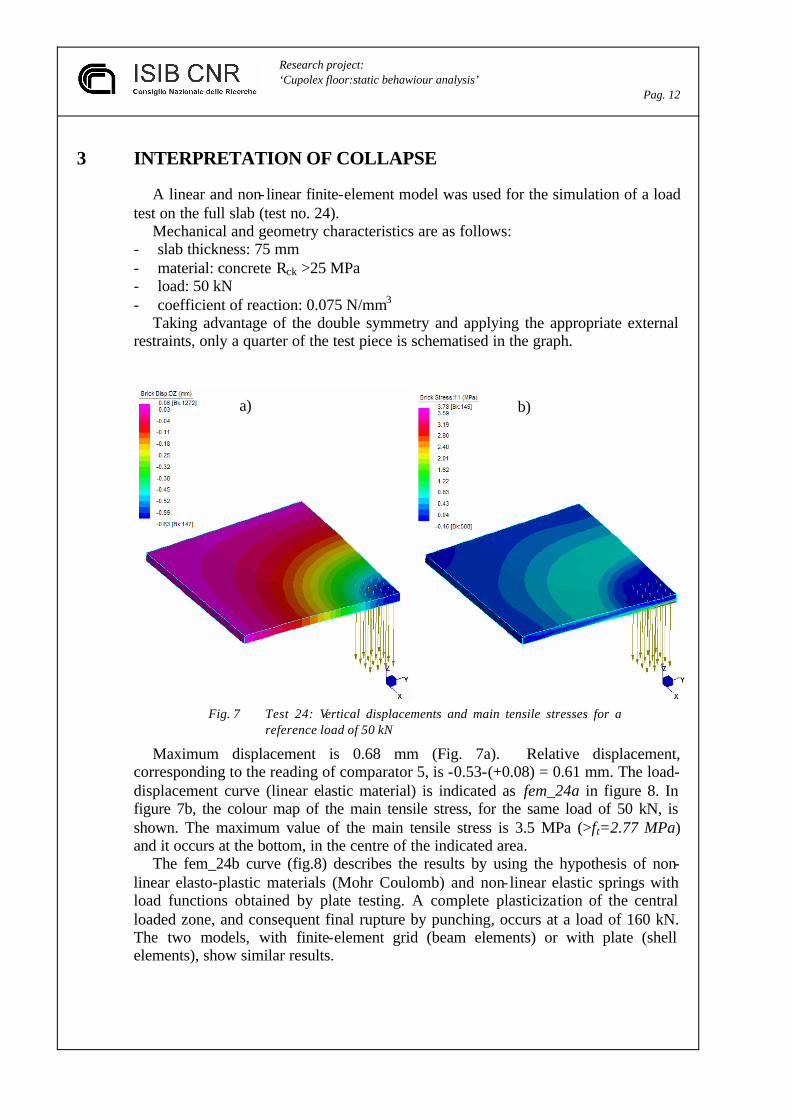
A linear and non- linear finite-element model was used for the simulation of a load test on the full slab (test no. 24).
Mechanical and geometry characteristics are as follows: - slab thickness: 75 mm - material: concrete Rck >25 MPa - load: 50 kN - coefficient of reaction: 0.075 N/mm3
Taking advantage of the double symmetry and applying the appropriate external restraints, only a quarter of the test piece is schematised in the graph.
Fig. 7 Test 24: Vertical displacements and main tensile stresses for a
reference load of 50 kN
Maximum displacement is 0.68 mm (Fig. 7a). Relative displacement, corresponding to the reading of comparator 5, is -0.53-(+0.08) = 0.61 mm. The load-displacement curve (linear elastic material) is indicated as fem_24a in figure 8. In figure 7b, the colour map of the main tensile stress, for the same load of 50 kN, is shown. The maximum value of the main tensile stress is 3.5 MPa (>ft=2.77 MPa) and it occurs at the bottom, in the centre of the indicated area.
The fem_24b curve (fig.8) describes the results by using the hypothesis of non-linear elasto-plastic materials (Mohr Coulomb) and non- linear elastic springs with load functions obtained by plate testing. A complete plasticization of the central loaded zone, and consequent final rupture by punching, occurs at a load of 160 kN. The two models, with finite-element grid (beam elements) or with plate (shell elements), show similar results.
a) b)
Research project: ‘Cupolex floor:static behawiour analysis’ Pag. 13
0
20
40
60
80
100
120
140
160
180
0 10 20 30DZ [mm]
P [k
N] 23
fem_23a
fem_23b
0
20
40
60
80
100
120
140
160
180
0 2 4 6DZ [mm]
P [k
N]
24
fem_24a
fem_24b
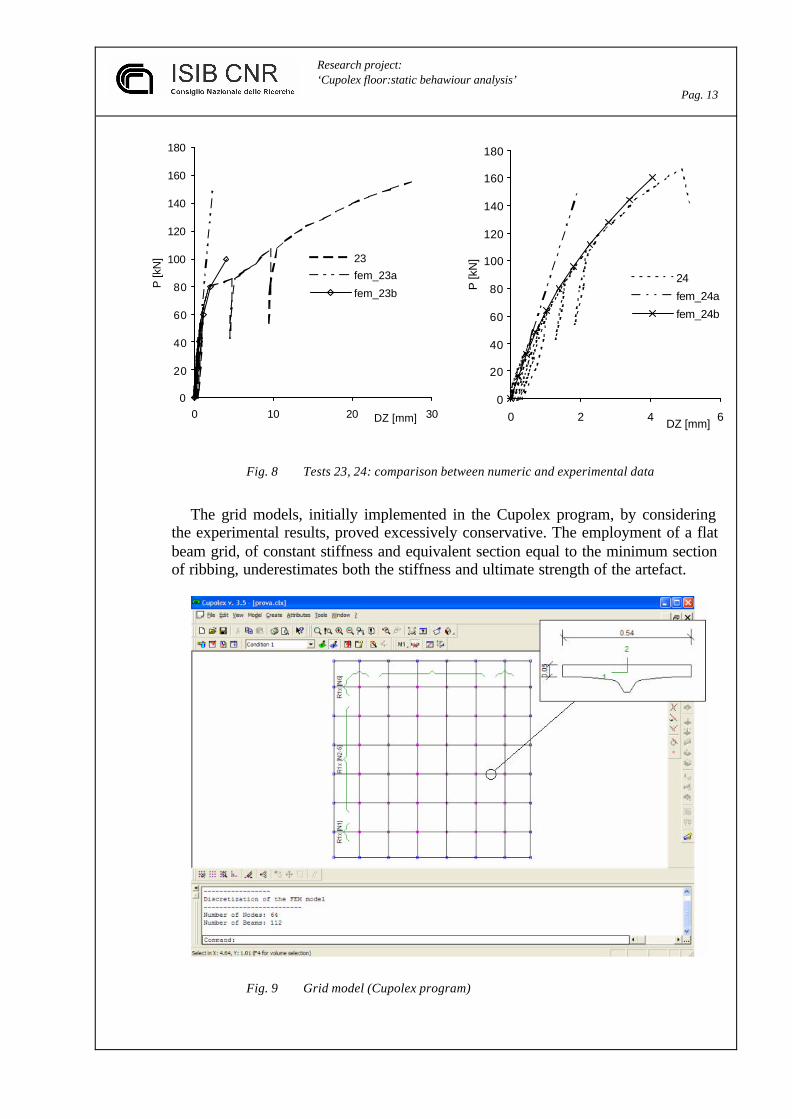
Fig. 8 Tests 23, 24: comparison between numeric and experimental data
The grid models, initially implemented in the Cupolex program, by considering
the experimental results, proved excessively conservative. The employment of a flat beam grid, of constant stiffness and equivalent section equal to the minimum section of ribbing, underestimates both the stiffness and ultimate strength of the artefact.
Fig. 9 Grid model (Cupolex program)
Research project: ‘Cupolex floor:static behawiour analysis’ Pag. 14
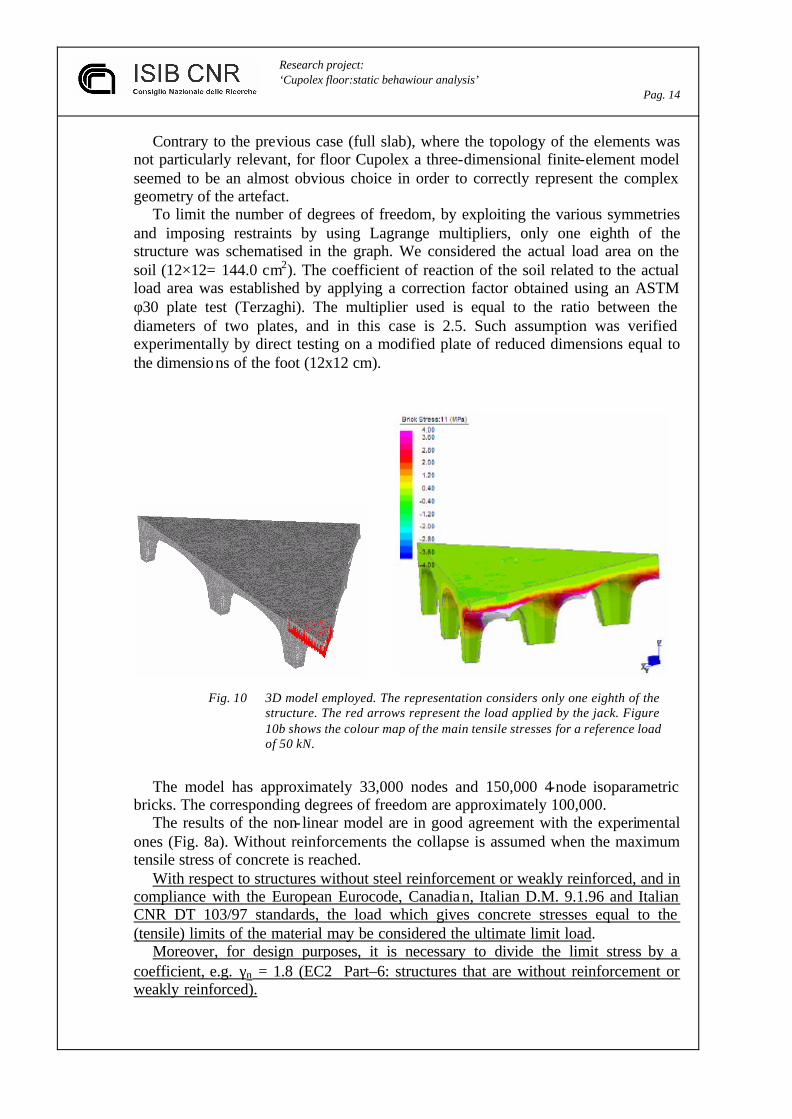
Contrary to the previous case (full slab), where the topology of the elements was not particularly relevant, for floor Cupolex a three-dimensional finite-element model seemed to be an almost obvious choice in order to correctly represent the complex geometry of the artefact.
To limit the number of degrees of freedom, by exploiting the various symmetries and imposing restraints by using Lagrange multipliers, only one eighth of the structure was schematised in the graph. We considered the actual load area on the soil (12×12= 144.0 cm2). The coefficient of reaction of the soil related to the actual load area was established by applying a correction factor obtained using an ASTM φ30 plate test (Terzaghi). The multiplier used is equal to the ratio between the diameters of two plates, and in this case is 2.5. Such assumption was verified experimentally by direct testing on a modified plate of reduced dimensions equal to the dimensions of the foot (12x12 cm).
Fig. 10 3D model employed. The representation considers only one eighth of the structure. The red arrows represent the load applied by the jack. Figure 10b shows the colour map of the main tensile stresses for a reference load of 50 kN.
The model has approximately 33,000 nodes and 150,000 4-node isoparametric
bricks. The corresponding degrees of freedom are approximately 100,000. The results of the non- linear model are in good agreement with the experimental
ones (Fig. 8a). Without reinforcements the collapse is assumed when the maximum tensile stress of concrete is reached.
With respect to structures without steel reinforcement or weakly reinforced, and in compliance with the European Eurocode, Canadian, Italian D.M. 9.1.96 and Italian CNR DT 103/97 standards, the load which gives concrete stresses equal to the (tensile) limits of the material may be considered the ultimate limit load.
Moreover, for design purposes, it is necessary to divide the limit stress by a coefficient, e.g. γn = 1.8 (EC2 Part–6: structures that are without reinforcement or weakly reinforced).

Research project: ‘Cupolex floor:static behawiour analysis’ Pag. 15
The ultimate load limit that we see from the load-displacement curve is about of 80 kN, and can be determined by using non- linear material analyses or by making use of the science of fracture mechanics, which is particularly helpful in describing the behaviour of stressed concrete, the fragility of which appears to increase in the absence of reinforcements.
As we can see from numerical ana lysis the material’s limit traction is reached for lower load and is non directly legible in experimental curves.
The elastic-plastic analyses are important only for the purpose of scientific research; as we said, for design purposes, instead, we must cons ider the elastic limit of material.
Fig. 11 Colour map of the main tensile stresses for a load of 140 kN.
Viewed from below and above.

Research project: ‘Cupolex floor:static behawiour analysis’ Pag. 16
With respect to the Cupolex slabs, in determining the limits of the crack opening, the secondary concrete ribs corresponding to the stiffeners of the plastic cast may be considered ‘non-structural’ (fig.12). Those protrusions contribute only to a secondary stiffness and do not constitute crack tips in terms of fracture propagation. In any case, in order to optimise slab performance, anomalies in geometry should be limited so that smooth and cut- free cast surfaces may be obtained.
Fig. 12 Secondary ribs not considerated during calculation and verification
With regard to the cases of full slabs and Cupolex slabs analysed, limited to the particular load conditions considered, the ultimate stress of the material is exceeded respectively at loads of 40 kN and 30 kN. These values numerically calculated have been obtained considering a characteristic tensile stress (γn = 1).
The resulting working load is, in both cases, much lower than that which may be deduced on the basis of the experimental load-displacement curves only (Fig. 8).
Full slab Floor Cupolex
First cracks (*) 40 kN 30 kN Loss of stiffness --- 80 kN First crack in extrados Break for shear-punching 170 kN 160 kN
(*) Numerically calculated; the first cracks come on the central inferior superficies
of plate and are not visible.
3.1 RESULTS OF NUMERICAL ANALYSIS WITH A REDUCED SOIL COEFFICIENT OF ELASTICITY
The numerical analyses have been repeated considering a halved soil coefficient
of elasticity (kw ≅ 0.035 N/mm3). The first crack is reduced of 12%, from 30 to 26.8 kN.
Research project: ‘Cupolex floor:static behawiour analysis’ Pag. 17
4 NUMERICAL MODEL AND VERIFICATION
The numerical model that better suits the experimental results is the one with
brick elements in non- linear method. For the design, in order to accelerate the model elaboration and solution time, we
suggest a uniformly distributed plate finite elements model on an independent springs bed (Winkler), with the following coefficient of elasticity:
For subgrade of lean concrete (at least 5 cm for standard houses):
kw = kw0 without poor concrete:
kw = kw0·Ap/Am where:
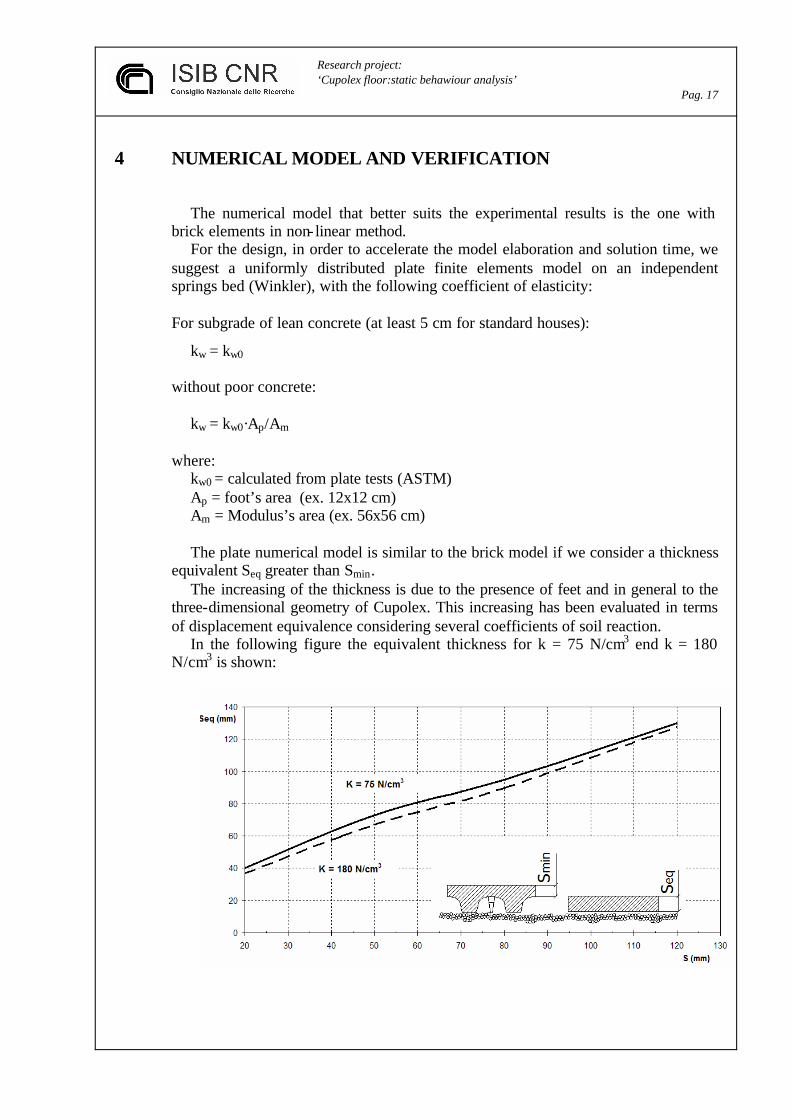
kw0 = calculated from plate tests (ASTM) Ap = foot’s area (ex. 12x12 cm) Am = Modulus’s area (ex. 56x56 cm) The plate numerical model is similar to the brick model if we consider a thickness
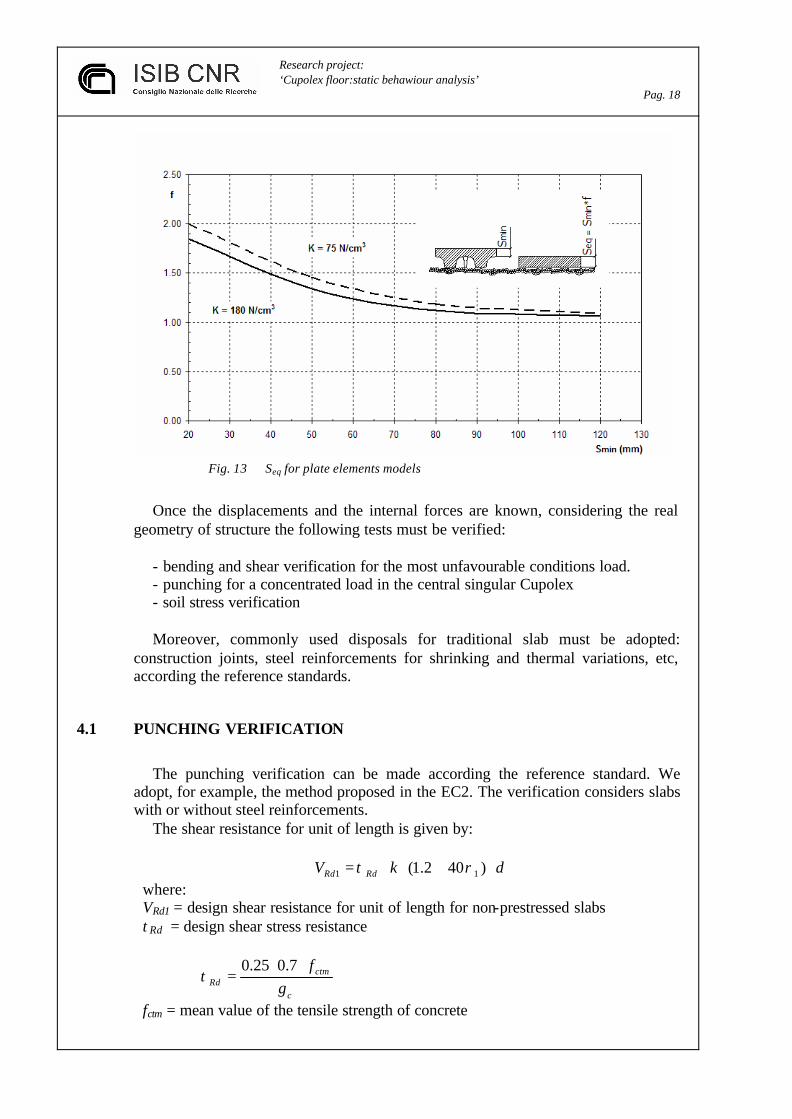
equivalent Seq greater than Smin. The increasing of the thickness is due to the presence of feet and in general to the
three-dimensional geometry of Cupolex. This increasing has been evaluated in terms of displacement equivalence considering several coefficients of soil reaction.
In the following figure the equivalent thickness for k = 75 N/cm3 end k = 180 N/cm3 is shown:
Research project: ‘Cupolex floor:static behawiour analysis’ Pag. 18
Fig. 13 Seq for plate elements models
Once the displacements and the internal forces are known, considering the real
geometry of structure the following tests must be verified: - bending and shear verification for the most unfavourable conditions load. - punching for a concentrated load in the central singular Cupolex - soil stress verification Moreover, commonly used disposals for traditional slab must be adopted:
construction joints, steel reinforcements for shrinking and thermal variations, etc, according the reference standards.
4.1 PUNCHING VERIFICATION
The punching verification can be made according the reference standard. We
adopt, for example, the method proposed in the EC2. The verification considers slabs with or without steel reinforcements.
The shear resistance for unit of length is given by:
dkV RdRd ⋅+⋅⋅= )402.1( 11 ρτ where: VRd1 = design shear resistance for unit of length for non-prestressed slabs τRd = design shear stress resistance
c
ctmRd
fγ
τ⋅⋅
=7.025.0
fctm = mean value of the tensile strength of concrete
Research project: ‘Cupolex floor:static behawiour analysis’ Pag. 19
3 227.0 ckctm Rf ⋅= Rck= characteristic cubic compressive strength of concrete γc = 1.8 (material safety coefficient) d = slab effective height
1)6.1( ≥−= dk (d in meters)
015.0111 ≤⋅= yx ρρρ
ρ1x, ρ1y = steel area in direction x and y divided by concrete area The punching verification is satisfied if:
sdRd NuV <⋅1
Where: u = critical perimeter Nsd = design load defined in EC2
The critical perimeter for circular or rectangular areas far from free edges is defined as the perimeter of the loaded area at a distance of 1.5 d.
The punching limit, for load area (projected) wider than 30×30 cm, is reached at
higher loads than those causing an initial crack. Checks may be conducted locally, at the level of a single module, by placing the load in the most unfavourable position.

Research project: ‘Cupolex floor:static behawiour analysis’ Pag. 20
5 CONCLUSIONS
The research project has given a general and easy to apply method to calculate and verify Cupolex floors variously loaded.
• The static behaviour of the Cupolex floor depends on the following factors:
1) geometry:
- dome geometry - minimum thickness of the slab
2) type of soil 3) position of loads
• Three different schematisations have been considered: 1) Beam grid model (fig. 9) 2) Plate model (fig. 14) 3) 3D model (fig. 15) The suggested schematisation for practical applications is that with plate elements
with equivalent thickness, ref. §4.
Figure 14 Plate model (1/4).
Research project: ‘Cupolex floor:static behawiour analysis’ Pag. 21
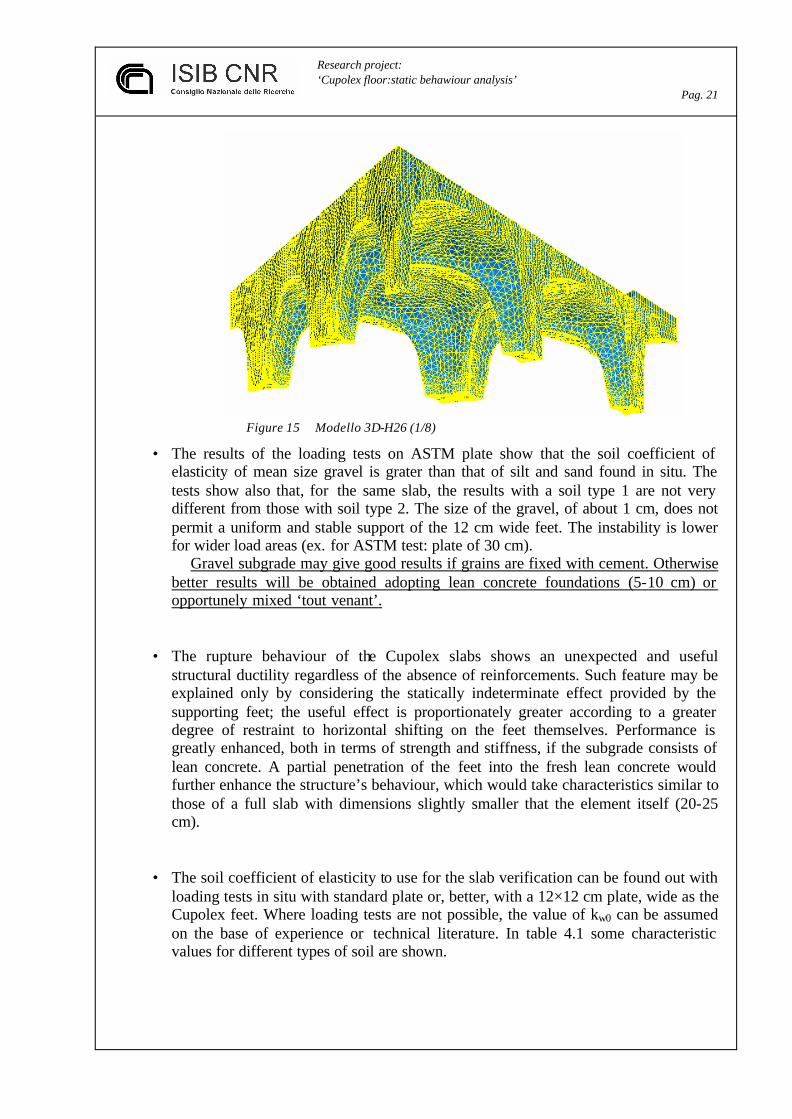
Figure 15 Modello 3D-H26 (1/8)
• The results of the loading tests on ASTM plate show that the soil coefficient of elasticity of mean size gravel is grater than that of silt and sand found in situ. The tests show also that, for the same slab, the results with a soil type 1 are not very different from those with soil type 2. The size of the gravel, of about 1 cm, does not permit a uniform and stable support of the 12 cm wide feet. The instability is lower for wider load areas (ex. for ASTM test: plate of 30 cm).
Gravel subgrade may give good results if grains are fixed with cement. Otherwise better results will be obtained adopting lean concrete foundations (5-10 cm) or opportunely mixed ‘tout venant’.
• The rupture behaviour of the Cupolex slabs shows an unexpected and useful structural ductility regardless of the absence of reinforcements. Such feature may be explained only by considering the statically indeterminate effect provided by the supporting feet; the useful effect is proportionately greater according to a greater degree of restraint to horizontal shifting on the feet themselves. Performance is greatly enhanced, both in terms of strength and stiffness, if the subgrade consists of lean concrete. A partial penetration of the feet into the fresh lean concrete would further enhance the structure’s behaviour, which would take characteristics similar to those of a full slab with dimensions slightly smaller that the element itself (20-25 cm).
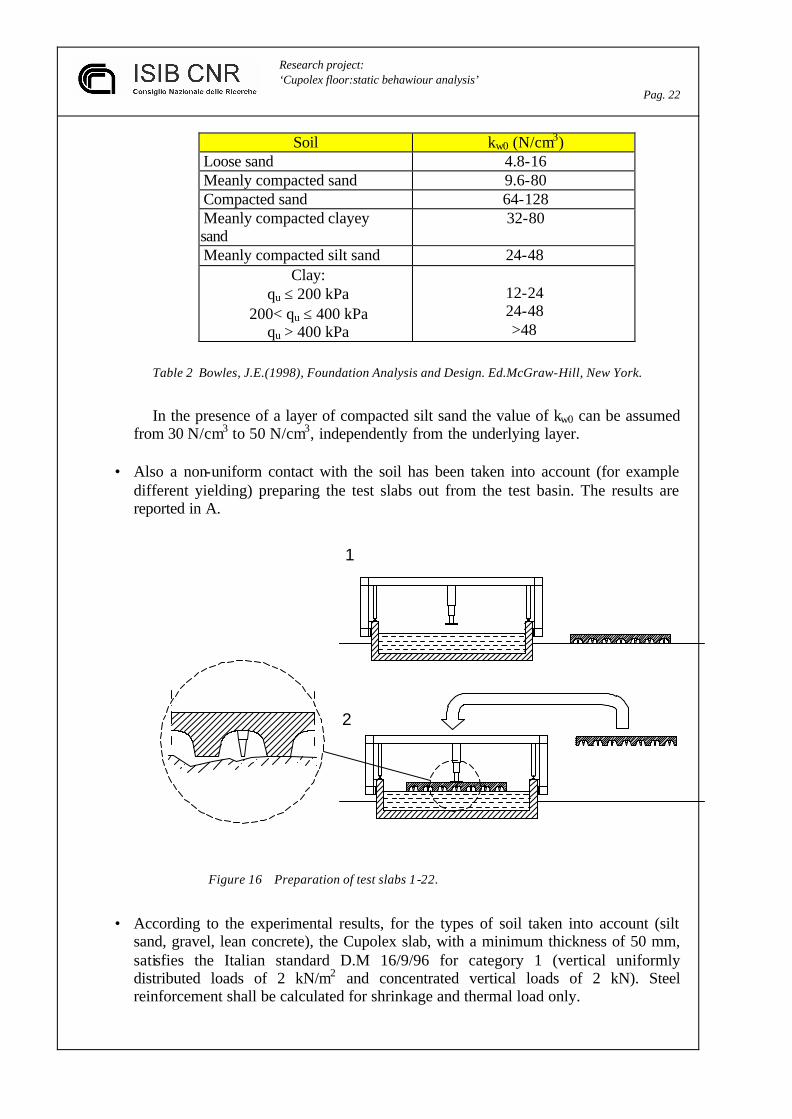
• The soil coefficient of elasticity to use for the slab verification can be found out with loading tests in situ with standard plate or, better, with a 12×12 cm plate, wide as the Cupolex feet. Where loading tests are not possible, the value of kw0 can be assumed on the base of experience or technical literature. In table 4.1 some characteristic values for different types of soil are shown.
Research project: ‘Cupolex floor:static behawiour analysis’ Pag. 22
Soil kw0 (N/cm3) Loose sand 4.8-16 Meanly compacted sand 9.6-80 Compacted sand 64-128 Meanly compacted clayey sand
32-80
Meanly compacted silt sand 24-48 Clay:
qu ≤ 200 kPa 200< qu ≤ 400 kPa
qu > 400 kPa
12-24 24-48 >48
Table 2 Bowles, J.E.(1998), Foundation Analysis and Design. Ed.McGraw-Hill, New York.
In the presence of a layer of compacted silt sand the value of kw0 can be assumed
from 30 N/cm3 to 50 N/cm3, independently from the underlying layer.
• Also a non-uniform contact with the soil has been taken into account (for example different yielding) preparing the test slabs out from the test basin. The results are reported in A.
1
2
Figure 16 Preparation of test slabs 1-22.
• According to the experimental results, for the types of soil taken into account (silt
sand, gravel, lean concrete), the Cupolex slab, with a minimum thickness of 50 mm, satisfies the Italian standard D.M 16/9/96 for category 1 (vertical uniformly distributed loads of 2 kN/m2 and concentrated vertical loads of 2 kN). Steel reinforcement shall be calculated for shrinkage and thermal load only.

Research project: ‘Cupolex floor:static behawiour analysis’ Pag. 23
• For loads of greater intensity we suggest to find out the stress, strain, displacements and pressure on the soil from the ‘plate’ model described in §4. Verifications shall be carried out according to the reference standards.
Research project: ‘Cupolex floor:static behawiour analysis’ Pag. 24
6 BIBLIOGRAPHY
[1] Heténey M. [1946]. Beams on Elastic Foundation. Ann Arbour: The University of Michigan
[2] Selvadurai A.P.S. [1979] Elastic Analysis of Soli-Foundation Interaction [3] Miranda C. Nair K. [1966] Finite beams on elastic foundation. J.Struct.Div.ASCE [4] Ting B.T. [1982] Finite beams on elastic foundation with restarints. .
J.Struct.Div.ASCE [5] Eisenberg M. Yankelevsky D.Z. [1985] Exact stiffness matrix for beams on
elastic foundation. Comp. & Struc. [6] Bowles [1985] Foundation Analysis and Design. Ed.McGraw-Hill, New York

ENCLOSED A: BREAKING TESTS RESULTS
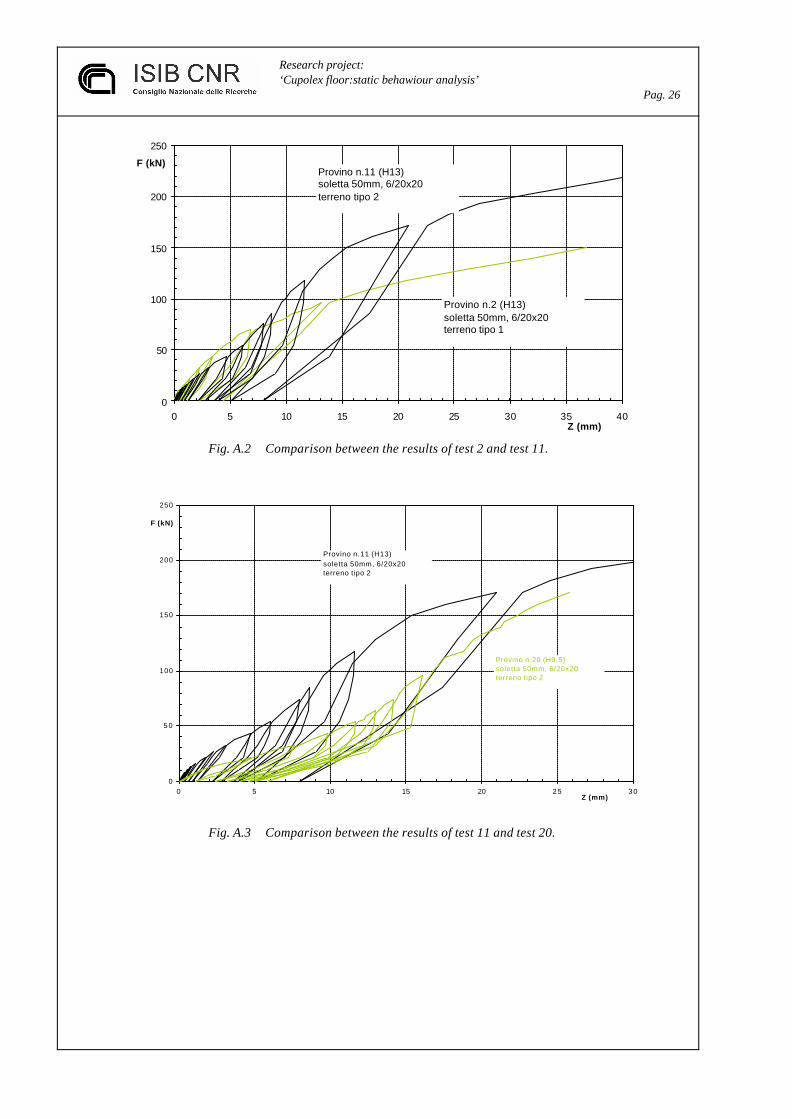
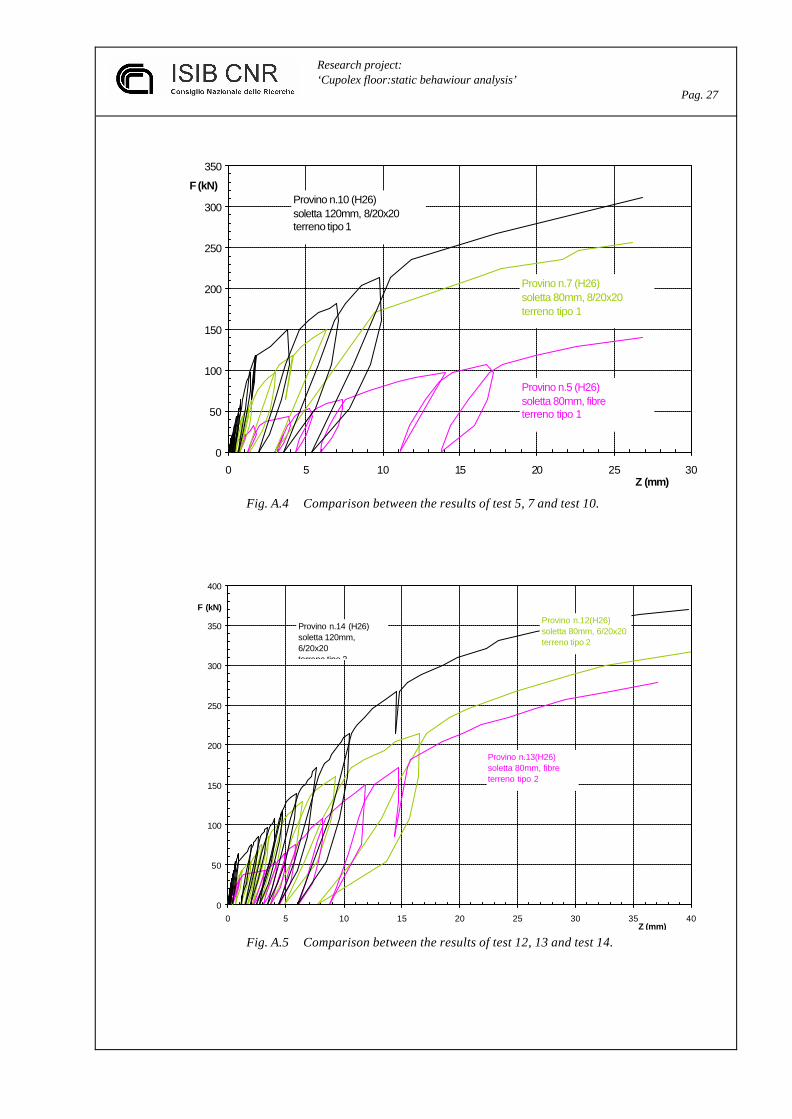
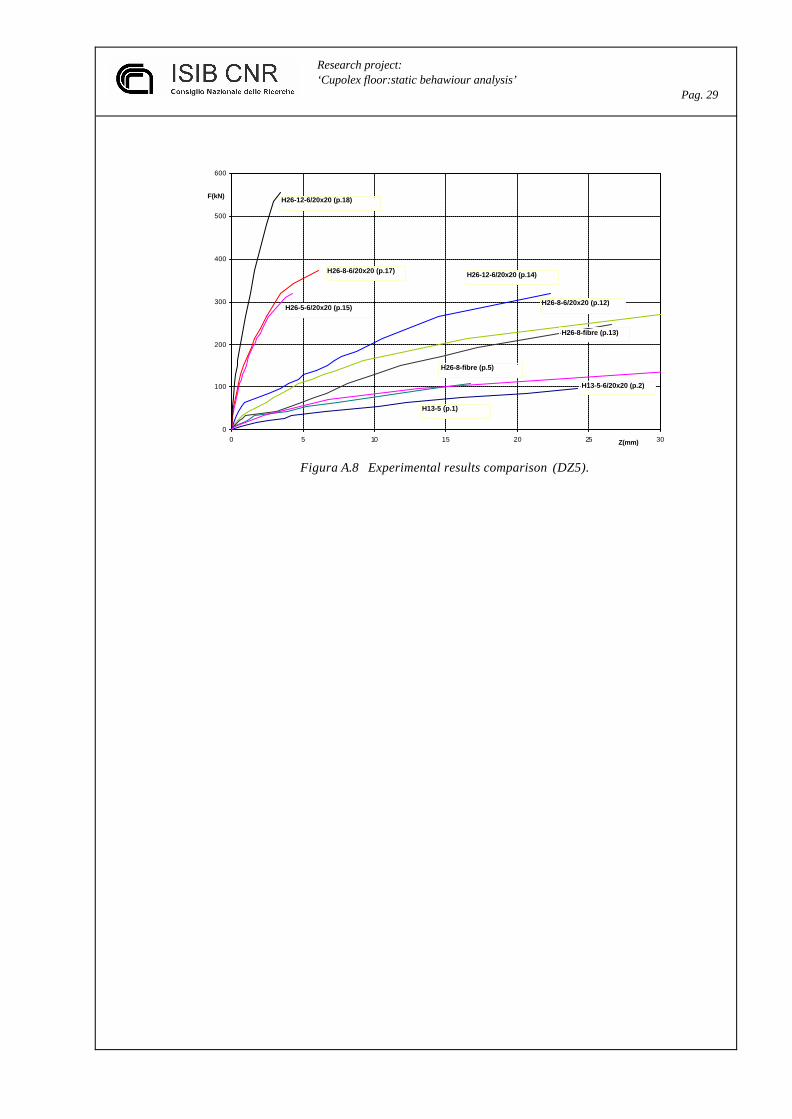
In the following figures the graphs of the displacements (DZ5) for some test slabs are reported. A direct comparison of the different bending stiffness of the slabs can be made.
The test slabs 23 and 24 have been made in sito. The test slabs 1-22 have been instead made out of the basin test. After 28 days each slab has been lifted and put on the basin for the braking test. The experimental results show, with respect to slabs 23 and 24, a decrease of the bearing load.
The cause is that the contact with the soil is not perfect for each foot of these slabs, with a consequent decrease of the first crack load.
Also numerical results show that a gap of some millimetres between a foot and the soil, in particular on soils of good mechanical characteristics, strongly decreases the bearing load of the artefact.
0
20
40
60
80
100
120
140
160
0 5 10 15 20 25 30 35 40Z (mm)
F (kN)
Provino n.1 (H13)soletta 50mm, senza armaturaterreno tipo 1
Provino n.2 (H13)soletta 50mm, 6/20x20terreno tipo 1
Fig. A.1 Comparison between the results of test 1 and test 2.
Research project: ‘Cupolex floor:static behawiour analysis’ Pag. 26
0
50
100
150
200
250
0 5 10 15 20 25 30 35 40Z (mm)
F (kN)Provino n.11 (H13)soletta 50mm, 6/20x20terreno tipo 2
Provino n.2 (H13)soletta 50mm, 6/20x20terreno tipo 1
Fig. A.2 Comparison between the results of test 2 and test 11.
0
5 0
100
150
200
250
0 5 10 15 20 2 5 3 0Z (mm)
F (kN)
Provino n.11 (H13)soletta 50mm, 6/20x20terreno tipo 2
Provino n.20 (H9,5)soletta 50mm, 6/20x20terreno tipo 2
Fig. A.3 Comparison between the results of test 11 and test 20.
Research project: ‘Cupolex floor:static behawiour analysis’ Pag. 27
0
50
100
150
200
250
300
350
0 5 10 15 20 25 30Z (mm)
F (kN)Provino n.10 (H26)soletta 120mm, 8/20x20terreno tipo 1
Provino n.7 (H26)soletta 80mm, 8/20x20terreno tipo 1
Provino n.5 (H26)soletta 80mm, fibreterreno tipo 1
Fig. A.4 Comparison between the results of test 5, 7 and test 10.
0
50
100
150
200
250
300
350
400
0 5 10 15 20 25 30 35 40Z (mm)
F (kN)
12Provino n.14 (H26)soletta 120mm, 6/20x20terreno tipo 2
Provino n.12(H26)soletta 80mm, 6/20x20terreno tipo 2
Provino n.13(H26)soletta 80mm, fibreterreno tipo 2
Fig. A.5 Comparison between the results of test 12, 13 and test 14.

Research project: ‘Cupolex floor:static behawiour analysis’ Pag. 28
0
100
200
300
400
500
600
0 1 2 3 4 5 6 7 8 9 10Z (mm)
F (kN)
Provino n.18 (H26)soletta 120mm, 6/20x20terreno tipo 3
Provino n.17 (H26)soletta 80mm, 6/20x20terreno tipo 3
Provino n.15 (H26)soletta 50mm, 6/20x20terreno tipo 3
Fig. A.6 Comparison between the results of test 15, 17 and test 18.
0
100
200
300
400
500
600
0 5 10 15 20 25 30Z(mm)
F(kN)H26-120-6/20x20 (p.18)
H26-80-6/20x20 (p.17)
H26-50-6/20x20 (p.15)
H26-120-6/20x20 (p.14)
H26-120-6/20x20 (p.12)
H26-80-fibre (p.13)
H26-80-fibre (p.5)
H13-50-8/20x20 (p.2)
H13-50 (p.1)
Fig. A.7 Experimental results comparison (DZ4).
Research project: ‘Cupolex floor:static behawiour analysis’ Pag. 29
0
100
200
300
400
500
600
0 5 10 15 20 25 30Z(mm)
F(kN) H26-12-6/20x20 (p.18)
H26-8-6/20x20 (p.17)
H26-5-6/20x20 (p.15)
H26-12-6/20x20 (p.14)
H26-8-6/20x20 (p.12)
H26-8-fibre (p.13)
H26-8-fibre (p.5)
H13-5-6/20x20 (p.2)
H13-5 (p.1)
Figura A.8 Experimental results comparison (DZ5).

Research project: ‘Cupolex floor:static behawiour analysis’ Pag. 30
ENCLOSED B: GEOTECHNICAL REPORT - TEST REPORTS


University of Padova – Faculty of Engineering Science DEPARTMENT Of HYDRAULIC, MARITIME, ENVIRONMENTAL AND GEOTECHNICAL ENGINEERING Via Ognissanti, 39, 35129 Padova – ITALY – tel. +39-049-8277980 – fax. +39-049-8277988
FOREWORD
This study deals with the geotechnical characterization of the soils forming the
subgrades supporting the elements CUPOLEX.
The in-situ and laboratory tests, necessary to characterize the soil properties and
described in the following, have been carried out according to the requirements of the
Pontarolo Engineering.
Three types of soil have been selected and referred as soil subgrade N. 1, 2 and 4.
An additional subgrade N. 3, consisting of an unreinforced concrete slab has been also
prepared and tested.
The three soil subgrades have been prepared by moist compaction in a test tank by
the Pontarolo Engineering.
On the subgrades 1, 2, 3 and 4 the geotechnical tests reported below have been
performed (in parenthesis the ASTM standard practice and test methods assumed as
reference methods) :
• Tests for Particle-Size Analysis of Soil (D421-85; D422-90; D1140-92);
• Test for Laboratory Compaction Characteristics of Soil using Modified Effort (D
1557-91);
• Test for Water Content by Direct Heating Method (D4959);
• Density and Unit Weight of Soil in Place by the Sand-Cone Method (D1556-90);
• Nonrepetitive Static Plate Load Tests of Soil Flexible Pavement Components
(D1196-93);
• N. 1 Special Static Plate Load Test.
The Static Plate Load Tests have been carried out by using a rigid circular steel plate of
300 mm diameter and 25 mm thickness. The load has been applied through a 100 kN
hydraulic jack and the vertical displacements of the plate have been measured using three
mechanical dial gauges located at the vertexes of an equilateral triangle. The pressure
readings have been taken from a manometer connected at the pressure generator. The load
has been applied in steps (50 or 100 kPa); after each step the load has been maintained

constant not less than 15 min and/or when the measured settlement rate was less than 0.03
mm in 3 minutes.
In addition, special plate tests have been carried out to reproduce as close as
possible the interaction between the base of the elements Cupolex and the soil. To this
purpose a small stiff square steel plate (width = 120 mm) have been prepared and subjected
to vertical load transmitted through an hydraulic jack. The test procedure is the same used
for the standard static plate load tests, except that the vertical pressure was driven to higher
value.
In the following sections the results of the in-situ and laboratory tests are reported.

University of Padova – Faculty of Engineering Science DEPARTMENT Of HYDRAULIC, MARITIME, ENVIRONMENTAL AND GEOTECHNICAL ENGINEERING Via Ognissanti, 39, 35129 Padova – ITALY – tel. +39-049-8277980 – fax. +39-049-8277988
CHARACTERISTICS OF SUBGRADE N. 1
Subgrade N. 1 is composed by a unique layer of natural medium-fine silty sand,
coming from a site close to the test area. It has been placed in the test tank and compacted
reaching a height of 80 cm.
On the material forming the soil bed the following tests have been carried out:
• N. 1 Test for Particle-Size Analysis of Soil (D421-85; D422-90; D1140-92);
• N. 1 Test for Laboratory Compaction Characteristics of Soil using Modified Effort
(D 1557-91);
• N. 3 Tests for Water Content by Direct Heating Method (D4959);
• N. 3 Tests for Density and Unit Weight of Soil in Place by the Sand-Cone Method
(D1556-90);
• N. 2 Tests for Nonrepetitive Static Plate Load Tests of Soil and Flexible Pavement
Components (D1196-93)
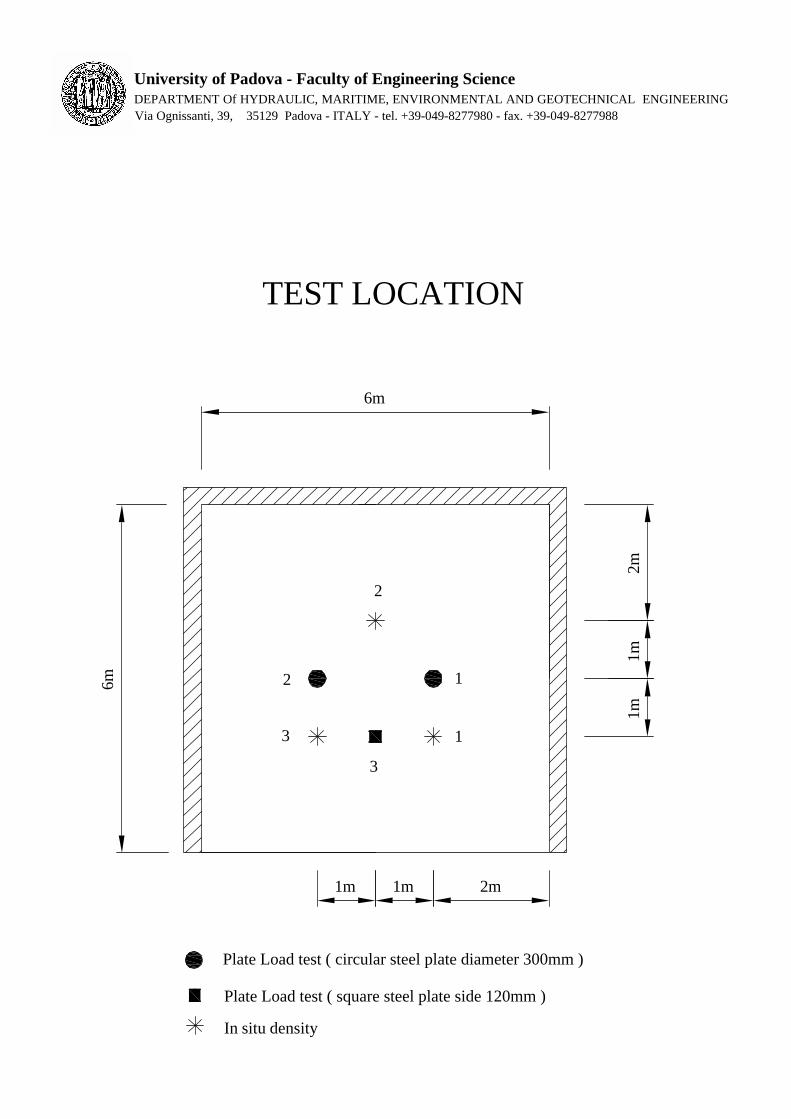
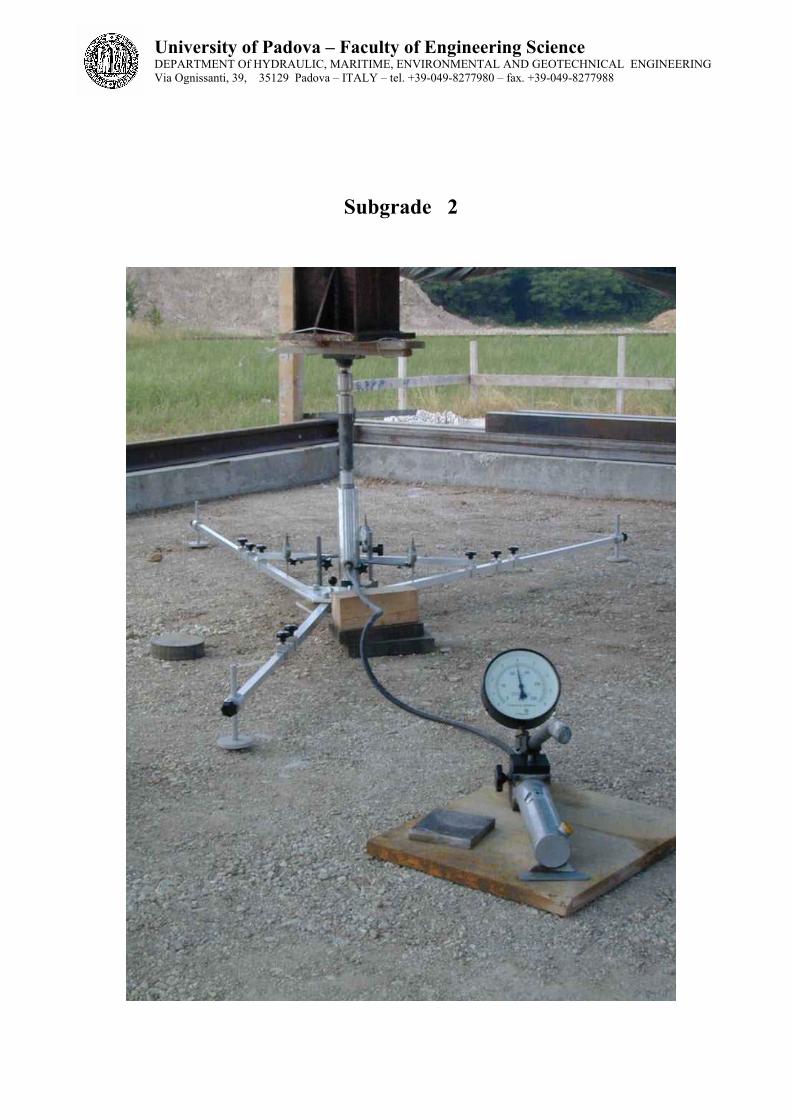
A photographic view of test tank with the 300 mm diameter plate resting on the subgrade is
reported at the end of this section.
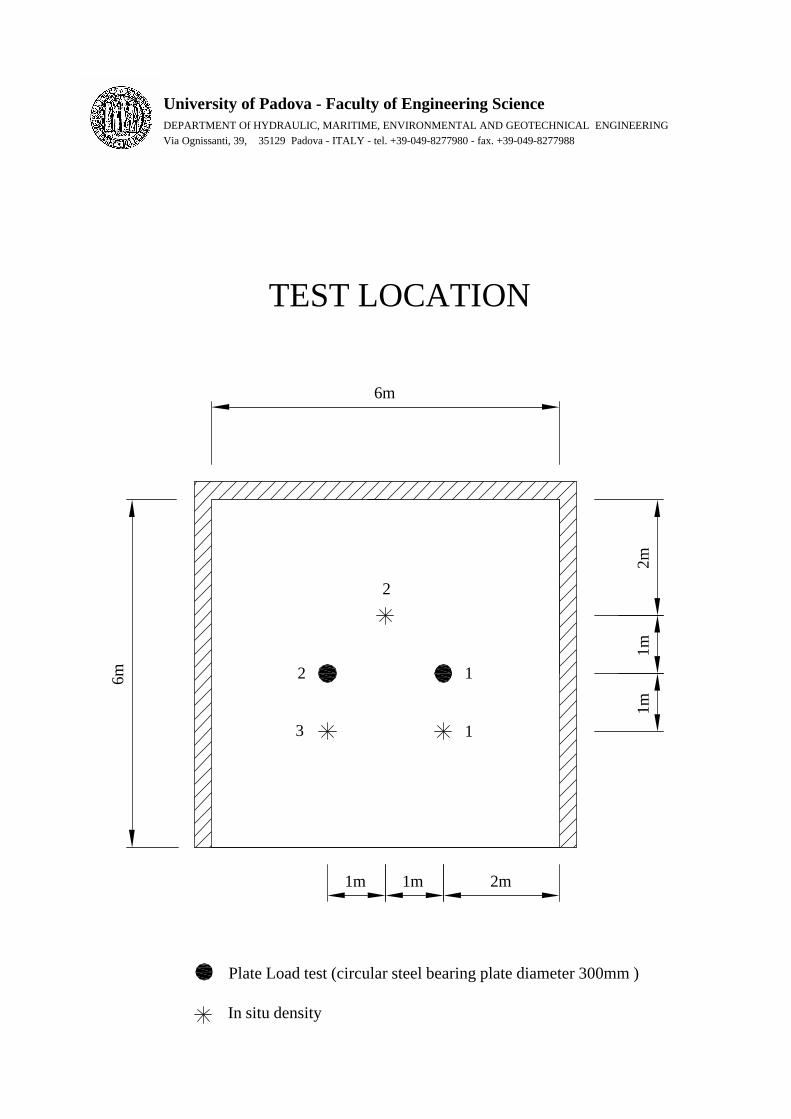
Plate Load test (circular steel bearing plate diameter 300mm )
In situ density
TEST LOCATION
6m
2m1m 1m
6m
1
12
3
2
1m1m
2m
University of Padova - Faculty of Engineering ScienceDEPARTMENT Of HYDRAULIC, MARITIME, ENVIRONMENTAL AND GEOTECHNICAL ENGINEERINGVia Ognissanti, 39, 35129 Padova - ITALY - tel. +39-049-8277980 - fax. +39-049-8277988
University of Padova – Faculty of Engineering Science DEPARTMENT Of HYDRAULIC, MARITIME, ENVIRONMENTAL AND GEOTECHNICAL ENGINEERING Via Ognissanti, 39, 35129 Padova – ITALY – tel. +39-049-8277980 – fax. +39-049-8277988
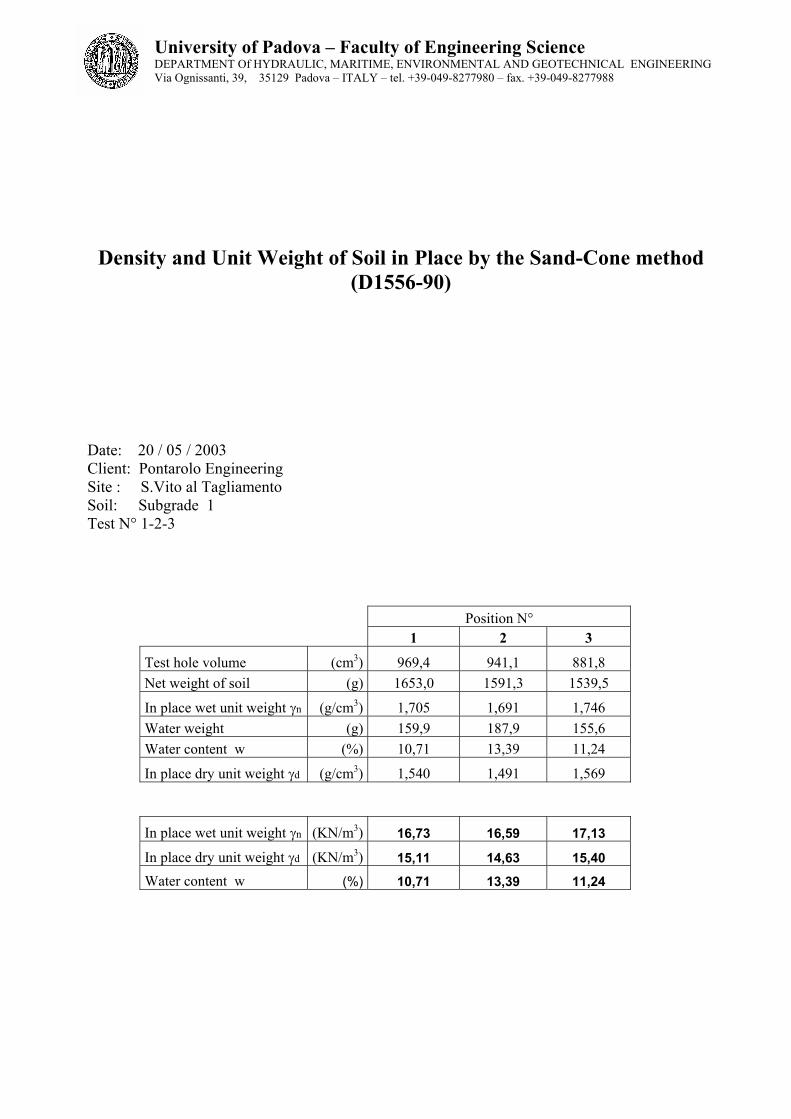
Density and Unit Weight of Soil in Place by the Sand-Cone method (D1556-90)
Date: 20 / 05 / 2003 Client: Pontarolo Engineering Site : S.Vito al Tagliamento Soil: Subgrade 1 Test N° 1-2-3
Position N° 1 2 3
Test hole volume (cm3) 969,4 941,1 881,8 Net weight of soil (g) 1653,0 1591,3 1539,5
In place wet unit weight γn (g/cm3) 1,705 1,691 1,746 Water weight (g) 159,9 187,9 155,6 Water content w (%) 10,71 13,39 11,24
In place dry unit weight γd (g/cm3) 1,540 1,491 1,569
In place wet unit weight γn (KN/m3) 16,73 16,59 17,13
In place dry unit weight γd (KN/m3) 15,11 14,63 15,40
Water content w (%) 10,71 13,39 11,24

University of Padova – Faculty of Engineering Science DEPARTMENT Of HYDRAULIC, MARITIME, ENVIRONMENTAL AND GEOTECHNICAL ENGINEERING Via Ognissanti, 39, 35129 Padova – ITALY – tel. +39-049-8277980 – fax. +39-049-8277988
Clie
ntPo
ntar
olo
Engi
neer
ing
Dat
e22
/05/
2003
Site
S.V
ito a
l Tag
liam
ento
Dry
Bor
ehol
eSa
mpl
eSu
bgra
de 1
Dep
thW
etX
Des
crip
tion
of d
epth
:G
ross
wei
ghtg
.45
0,0
PA
RT
ICL
E-S
IZE
AN
AL
YSI
STa
re w
eigh
tg.
150,
0N
et w
eigh
tg.
300,
0
AST
M S
ieve
n.
Dia
met
erN
et w
eigh
t (g)
% T
ratte
nuto
% P
assi
ng
4"10
1,6
0,00
100,
00
3"76
,20,
0010
0,00
2"50
,80,
0010
0,00
1" 1
/238
,10,
0010
0,00
1"25
,40,
0010
0,00
3/4"
19,1
0,00
100,
00
1/2"
12,7
0,00
100,
00
3/8"
9,52
0,00
100,
00
44,
760,
00,
0010
0,00
102
0,3
0,10
99,9
0
200,
840,
60,
2099
,70
400,
421,
40,
4799
,23
600,
257,
32,
4396
,80
800,
177
25,5
8,50
88,3
0
140
0,10
535
,811
,93
76,3
7
200
0,07
423
,17,
7068
,67
University of Padova – Faculty of Engineering Science DEPARTMENT Of HYDRAULIC, MARITIME, ENVIRONMENTAL AND GEOTECHNICAL ENGINEERING Via Ognissanti, 39, 35129 Padova – ITALY – tel. +39-049-8277980 – fax. +39-049-8277988
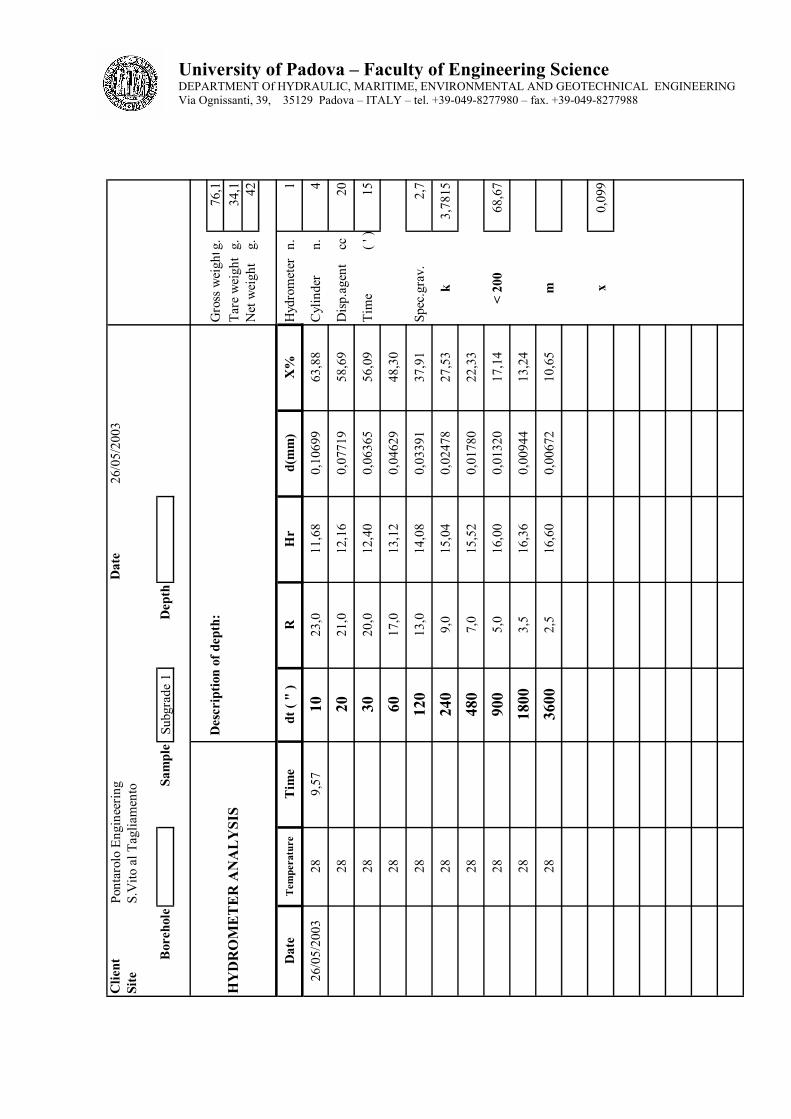
Clie
ntPo
ntar
olo
Engi
neer
ing
Dat
e26
/05/
2003
Site
S.V
ito a
l Tag
liam
ento
Bor
ehol
eSa
mpl
eSu
bgra
de 1
Dep
th
Des
crip
tion
of d
epth
:G
ross
wei
ghtg
.76
,1H
YD
RO
ME
TE
R A
NA
LY
SIS
Tare
wei
ght
g.34
,1N
et w
eigh
tg.
42
Dat
eT
empe
ratu
reT
ime
dt (
" )
RH
rd(
mm
)X
%H
ydro
met
ern.
1
26/0
5/20
0328
9,57
1023
,011
,68
0,10
699
63,8
8C
ylin
der
n.4
2820
21,0
12,1
60,
0771
958
,69
Dis
p.ag
ent
cc20
2830
20,0
12,4
00,
0636
556
,09
Tim
e( '
)15
2860
17,0
13,1
20,
0462
948
,30
2812
013
,014
,08
0,03
391
37,9
1Sp
ec.g
rav.
2,7
2824
09,
015
,04
0,02
478
27,5
3k
3,78
15
2848
07,
015
,52
0,01
780
22,3
3
2890
05,
016
,00
0,01
320
17,1
4<
200
68,6
7
2818
003,
516
,36
0,00
944
13,2
4
2836
002,
516
,60
0,00
672
10,6
5m x
0,09
9
University of Padova – Faculty of Engineering Science DEPARTMENT Of HYDRAULIC, MARITIME, ENVIRONMENTAL AND GEOTECHNICAL ENGINEERING Via Ognissanti, 39, 35129 Padova – ITALY – tel. +39-049-8277980 – fax. +39-049-8277988
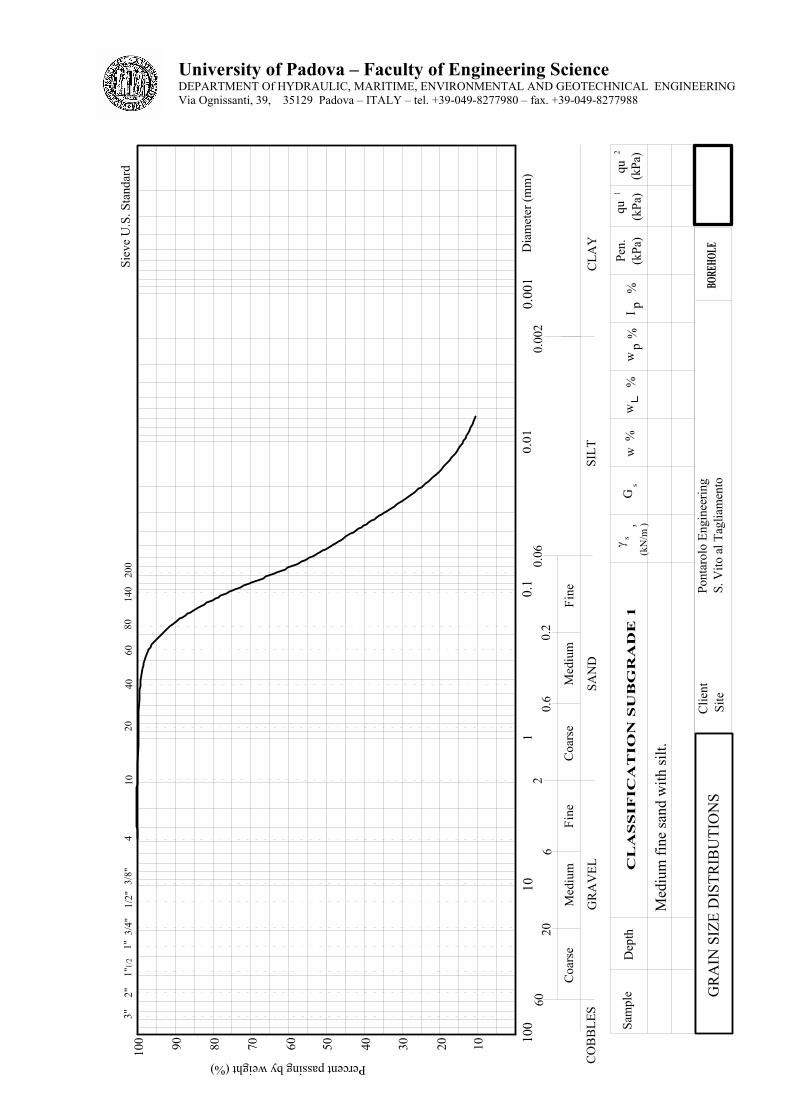
100
101
0.1
0.01
0.00
1
3"2"
Dia
met
er (m
m)
100 90 80 70 60 50 40 30 20 10
Percent passing by weight (%)
1"1/
21"
3/4"
1/2"
3/8"
410
2040
6080
140
200
Siev
e U
.S. S
tand
ard
6020
62
0.6
0.2
0.06
Coa
rse
Med
ium
Fine
Coa
rse
Med
ium
Fine
GR
AV
ELSA
ND
0.00
2
SILT
CLA
YC
OB
BLE
S
Sam
ple
Dep
thC
LA
SS
IFIC
AT
ION
SU
BG
RA
DE
1γ s
(kN
/m )3
Gs
w %
ww
p%
%I p
%Pe
n.(k
Pa)
qu1
2
BORE
HOLE
Pont
arol
o En
gine
erin
gS.
Vito
al T
aglia
men
to
Med
ium
fine
sand
with
silt.
GR
AIN
SIZ
E D
ISTR
IBU
TIO
NS
Clie
ntSi
te
(kPa
)(k
Pa)
qu

University of Padova – Faculty of Engineering Science DEPARTMENT Of HYDRAULIC, MARITIME, ENVIRONMENTAL AND GEOTECHNICAL ENGINEERING Via Ognissanti, 39, 35129 Padova – ITALY – tel. +39-049-8277980 – fax. +39-049-8277988
Test for Laboratory Compaction Characteristics of Soil using Modified Effort
(D 1557-91)
Date: 26 / 5 / 2003 Client: Pontarolo Engineering Site : S.Vito al Tagliamento Soil: Subgrade 1 Test N° 1
Water content w (%) Dry Unit Weight γd (kN/m3) 7.97 19.03 9.3 20.01 10.2 19.91 11.0 19.52 13.7 18.34
w optimum = 9.6 %
γ dry,optimum = 20.04 kN/m3
18,20
18,40
18,60
18,80
19,00
19,20
19,40
19,60
19,80
20,00
20,20
7 7,5 8 8,5 9 9,5 10 10,5 11 11,5 12 12,5 13 13,5 14W%
γdry(kN/m3)

University of Padova – Faculty of Engineering Science DEPARTMENT Of HYDRAULIC, MARITIME, ENVIRONMENTAL AND GEOTECHNICAL ENGINEERING Via Ognissanti, 39, 35129 Padova – ITALY – tel. +39-049-8277980 – fax. +39-049-8277988
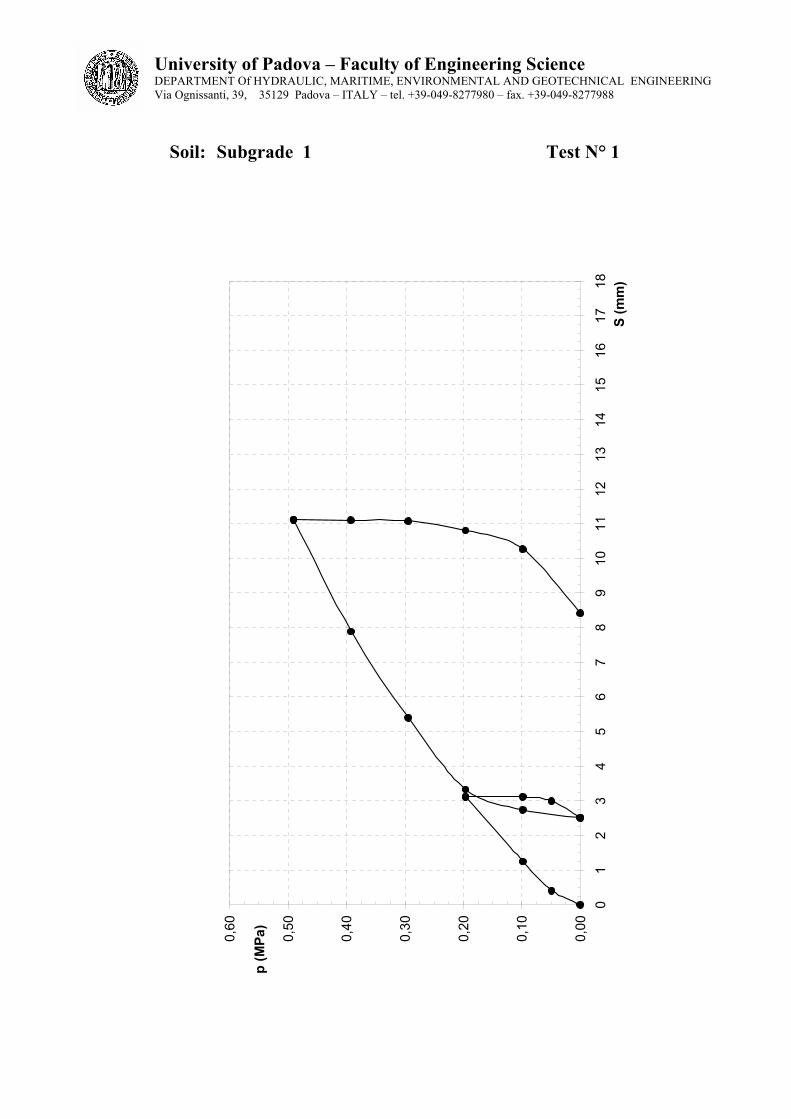
Test for Nonrepetitive Static Plate Load Tests of Soils and Flexible Pavement Components
(D 1196-93)
Date: 20 / 05 / 2003 Client: Pontarolo Engineering Site : S.Vito al Tagliamento Soil: Subgrade 1 Test N° 1
Circular steel plate – diameter 300 mm
p = vertical pressure S = vertical settlement
p S (MPa) (mm) 0,00 0,00 0,05 0,41 0,10 1,26 0,20 3,11 0,10 3,12 0,05 3,00 0,00 2,51 0,10 2,74 0,20 3,34 0,29 5,40 0,39 7,88 0,49 11,12 0,39 11,10 0,29 11,08 0,20 10,81 0,10 10,27 0,00 8,42
University of Padova – Faculty of Engineering Science DEPARTMENT Of HYDRAULIC, MARITIME, ENVIRONMENTAL AND GEOTECHNICAL ENGINEERING Via Ognissanti, 39, 35129 Padova – ITALY – tel. +39-049-8277980 – fax. +39-049-8277988
Soil: Subgrade 1 Test N° 1
0,00
0,10
0,20
0,30
0,40
0,50
0,60
01
23
45
67
89
1011
1213
1415
1617
18S
(mm
)
p (M
Pa)
University of Padova – Faculty of Engineering Science DEPARTMENT Of HYDRAULIC, MARITIME, ENVIRONMENTAL AND GEOTECHNICAL ENGINEERING Via Ognissanti, 39, 35129 Padova – ITALY – tel. +39-049-8277980 – fax. +39-049-8277988
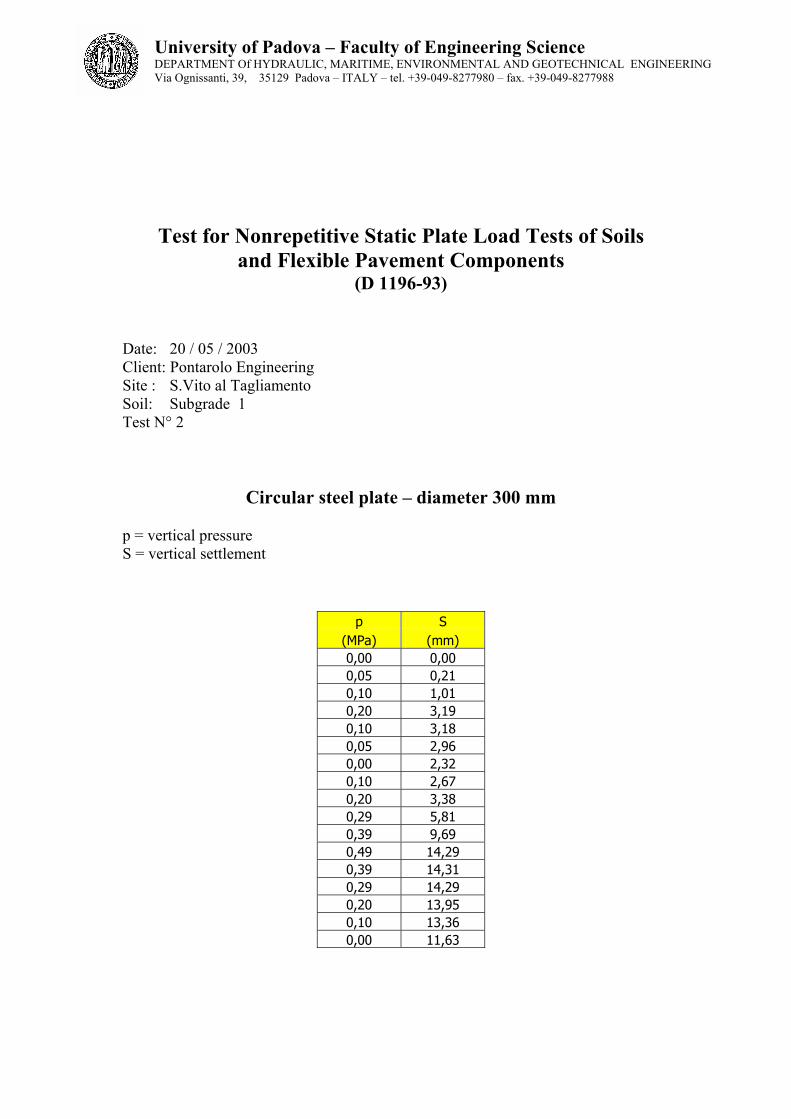
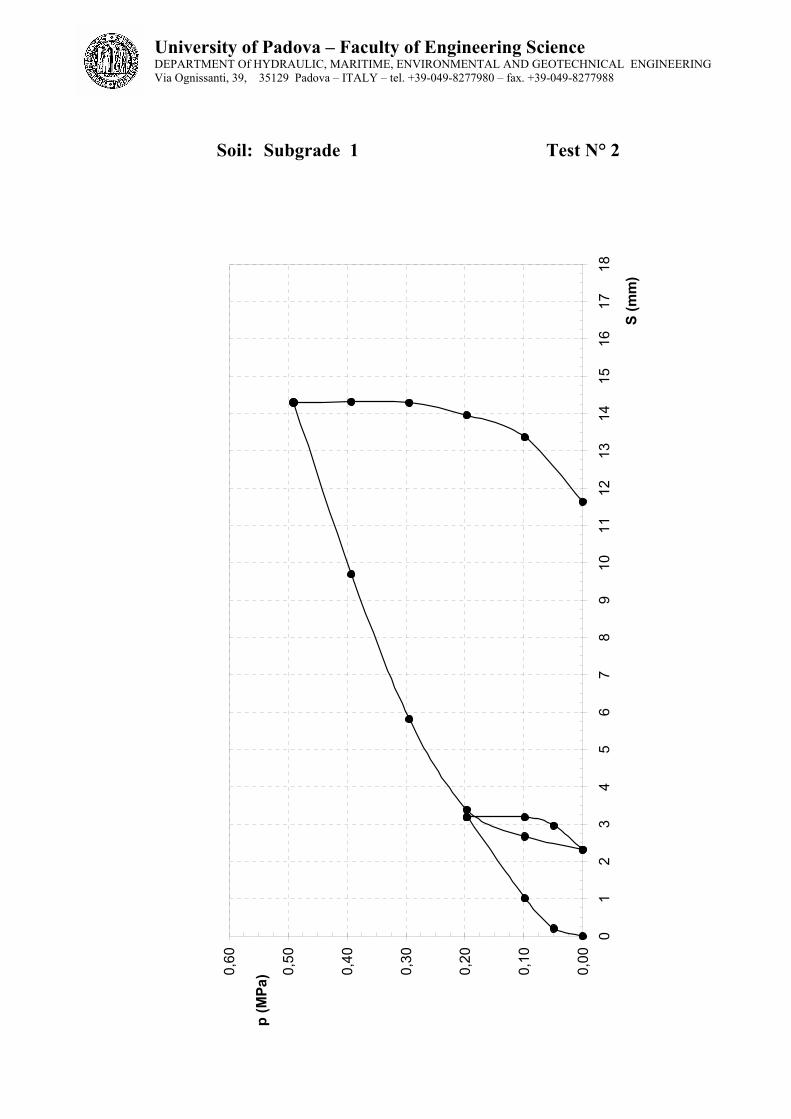
Test for Nonrepetitive Static Plate Load Tests of Soils and Flexible Pavement Components
(D 1196-93)
Date: 20 / 05 / 2003 Client: Pontarolo Engineering Site : S.Vito al Tagliamento Soil: Subgrade 1 Test N° 2
Circular steel plate – diameter 300 mm p = vertical pressure S = vertical settlement
p S (MPa) (mm) 0,00 0,00 0,05 0,21 0,10 1,01 0,20 3,19 0,10 3,18 0,05 2,96 0,00 2,32 0,10 2,67 0,20 3,38 0,29 5,81 0,39 9,69 0,49 14,29 0,39 14,31 0,29 14,29 0,20 13,95 0,10 13,36 0,00 11,63
University of Padova – Faculty of Engineering Science DEPARTMENT Of HYDRAULIC, MARITIME, ENVIRONMENTAL AND GEOTECHNICAL ENGINEERING Via Ognissanti, 39, 35129 Padova – ITALY – tel. +39-049-8277980 – fax. +39-049-8277988
Soil: Subgrade 1 Test N° 2
0,00
0,10
0,20
0,30
0,40
0,50
0,60
01
23
45
67
89
1011
1213
1415
1617
18
S (m
m)
p (M
Pa)

University of Padova – Faculty of Engineering Science DEPARTMENT Of HYDRAULIC, MARITIME, ENVIRONMENTAL AND GEOTECHNICAL ENGINEERING Via Ognissanti, 39, 35129 Padova – ITALY – tel. +39-049-8277980 – fax. +39-049-8277988
Subgrade 1

University of Padova – Faculty of Engineering Science DEPARTMENT Of HYDRAULIC, MARITIME, ENVIRONMENTAL AND GEOTECHNICAL ENGINEERING Via Ognissanti, 39, 35129 Padova – ITALY – tel. +39-049-8277980 – fax. +39-049-8277988
CHARACTERISTICS OF SUBGRADE N. 2
Subgrade N. 2 was placed on subgrade N. 1. The layer is composed by a medium fine
sandy gravel, compacted to reach a thickness of 30 cm. The total thickness of both layers is
110 cm. On the soil bed the following tests have been carried out:
• N. 1 Test for Particle-Size Analysis of Soil (D421-85; D422-90; D1140-92);
• N. 1 Test for Laboratory Compaction Characteristics of Soil using Modified Effort
(D 1557-91);
• N. 3 Tests for Water Content by Direct Heating Method (D4959);
• N. 3 Tests for Density and Unit Weight of Soil in Place by the Sand-Cone Method
(D1556-90);
• N. 2 Tests for Nonrepetitive Static Plate Load Tests of Soil and Flexible Pavement
Components (D1196-93);
• N. 1 Special Static Plate Load Test with the square steel plate (width = 120 mm).
A photographic view of test tank with the 300 mm diameter plate resting on the subgrade is
reported at the end of this section.
16m
1
2
3
2
6m
2m1m
1m
2m1m1m
3
Plate Load test ( circular steel plate diameter 300mm )
Plate Load test ( square steel plate side 120mm )
In situ density
TEST LOCATION
University of Padova - Faculty of Engineering ScienceDEPARTMENT Of HYDRAULIC, MARITIME, ENVIRONMENTAL AND GEOTECHNICAL ENGINEERINGVia Ognissanti, 39, 35129 Padova - ITALY - tel. +39-049-8277980 - fax. +39-049-8277988

University of Padova – Faculty of Engineering Science DEPARTMENT Of HYDRAULIC, MARITIME, ENVIRONMENTAL AND GEOTECHNICAL ENGINEERING Via Ognissanti, 39, 35129 Padova – ITALY – tel. +39-049-8277980 – fax. +39-049-8277988
Density and Unit Weight of Soil in Place by the Sand-Cone method (D1556-90)
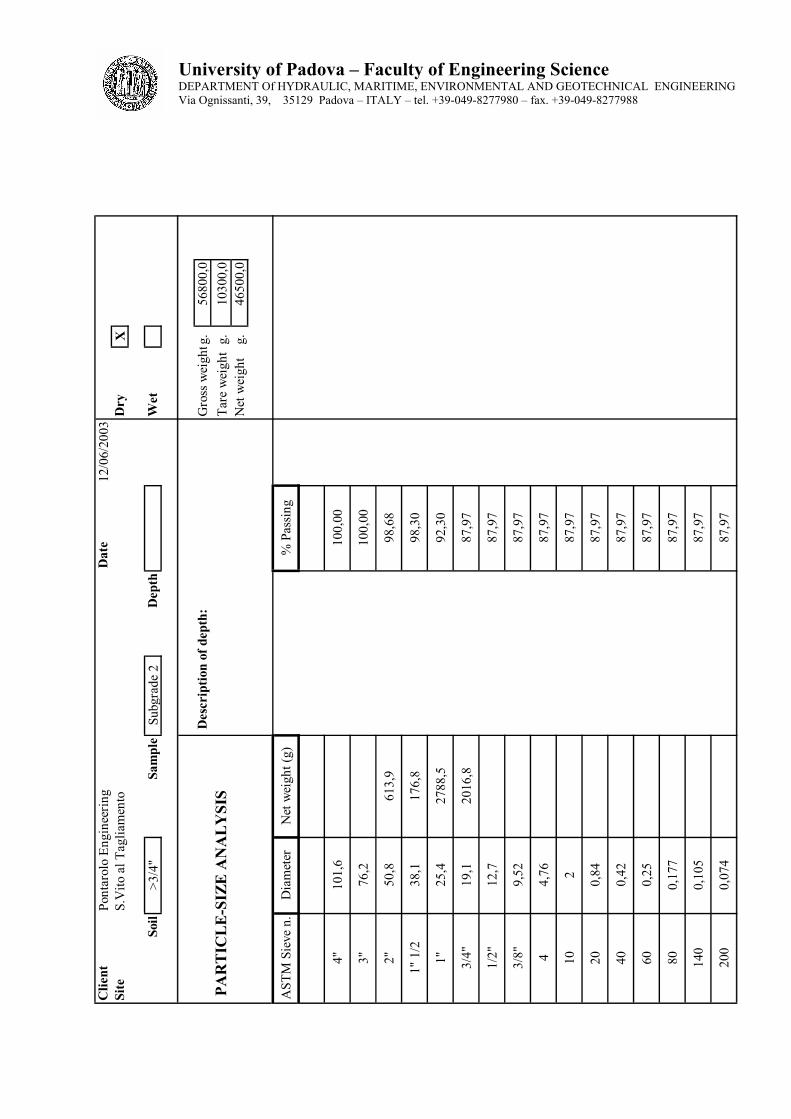
Date: 04 / 06 / 2003 Client: Pontarolo Engineering Site : S.Vito al Tagliamento Soil: Subgrade 2 Test N° 1-2-3
Position N° 1 2 3
Test hole volume (cm3) 622,9 756,4 819,2 Net weight of soil (g) 1338,5 1557,8 1749,0
In place wet unit weight γn (g/cm3) 2,149 2,060 2,135 Water weight (g) 43,6 43,9 45,0 Water content w (%) 3,37 2,90 2,64
In place dry unit weight γd (g/cm3) 2,079 2,002 2,080
In place wet unit weight γn (KN/m3) 21,08 20,20 20,94
In place dry unit weight γd (KN/m3) 20,39 19,63 20,41
Water content w (%) 3,37 2,90 2,64
University of Padova – Faculty of Engineering Science DEPARTMENT Of HYDRAULIC, MARITIME, ENVIRONMENTAL AND GEOTECHNICAL ENGINEERING Via Ognissanti, 39, 35129 Padova – ITALY – tel. +39-049-8277980 – fax. +39-049-8277988
Clie
ntPo
ntar
olo
Engi
neer
ing
Dat
e12
/06/
2003
Site
S.V
ito a
l Tag
liam
ento
Dry
X
Soil
>3/4
"Sa
mpl
eSu
bgra
de 2
Dep
thW
et
Des
crip
tion
of d
epth
:G
ross
wei
ghtg
.56
800,
0 P
AR
TIC
LE
-SIZ
E A
NA
LY
SIS
Tare
wei
ght
g.10
300,
0N
et w
eigh
tg.
4650
0,0
AST
M S
ieve
n.
Dia
met
erN
et w
eigh
t (g)
% T
ratte
nuto
% P
assi
ng
4"10
1,6
0,00
100,
00
3"76
,20,
0010
0,00
2"50
,861
3,9
1,32
98,6
8
1" 1
/238
,117
6,8
0,38
98,3
0
1"25
,427
88,5
6,00
92,3
0
3/4"
19,1
2016
,84,
3487
,97
1/2"
12,7
0,00
87,9
7
3/8"
9,52
0,00
87,9
7
44,
760,
0087
,97
102
0,00
87,9
7
200,
840,
0087
,97
400,
420,
0087
,97
600,
250,
0087
,97
800,
177
0,00
87,9
7
140
0,10
50,
0087
,97
200
0,07
40,
0087
,97

University of Padova – Faculty of Engineering Science DEPARTMENT Of HYDRAULIC, MARITIME, ENVIRONMENTAL AND GEOTECHNICAL ENGINEERING Via Ognissanti, 39, 35129 Padova – ITALY – tel. +39-049-8277980 – fax. +39-049-8277988
Clie
ntPo
ntar
olo
Engi
neer
ing
Dat
e12
/06/
2003
Site
S.V
ito a
l Tag
liam
ento
Dry
Soil
<3/4
"Sa
mpl
eSu
bgra
de 2
Dep
thW
etX
Des
crip
tion
of d
epth
:G
ross
wei
ghtg
.31
00,0
PA
RT
ICL
E-S
IZE
AN
AL
YSI
STa
re w
eigh
tg.
100,
0N
et w
eigh
tg.
3000
,0
AST
M S
ieve
n.
Dia
met
erN
et w
eigh
t (g)
% T
ratte
nuto
% P
assi
ng
4"10
1,6
0,00
100,
00
3"76
,20,
0010
0,00
2"50
,80,
0010
0,00
1" 1
/238
,10,
0010
0,00
1"25
,40,
0010
0,00
3/4"
19,1
0,00
100,
00
1/2"
12,7
158,
85,
2994
,71
3/8"
9,52
139,
84,
6690
,05
44,
7649
9,7
16,6
673
,39
102
754,
425
,15
48,2
4
200,
8460
3,0
20,1
028
,14
400,
4235
4,1
11,8
016
,34
600,
2510
1,5
3,38
12,9
6
800,
177
29,2
0,97
11,9
8
140
0,10
527
,80,
9311
,06
200
0,07
413
,20,
4410
,62

University of Padova – Faculty of Engineering Science DEPARTMENT Of HYDRAULIC, MARITIME, ENVIRONMENTAL AND GEOTECHNICAL ENGINEERING Via Ognissanti, 39, 35129 Padova – ITALY – tel. +39-049-8277980 – fax. +39-049-8277988
100
101
0.1
0.01
0.00
1
3"2"
Dia
met
er (m
m)
100 90 80 70 60 50 40 30 20 10
Percent passing by weight (%)
1"1/
21"
3/4"
1/2"
3/8"
410
2040
6080
140
200
Siev
e U
.S. S
tand
ard
6020
62
0.6
0.2
0.06
Coa
rse
Med
ium
Fine
Coa
rse
Med
ium
Fine
GR
AV
ELSA
ND
0.00
2
SILT
CLA
YC
OB
BLE
S
Sam
ple
Dep
thC
LA
SS
IFIC
AT
ION
SU
BG
RA
DE
2γ s
(kN
/m )3
Gs
w %
ww
p%
%I p
%Pe
n.(k
Pa)
qu1
2
BORE
HOLE
Pont
arol
o En
gine
erin
gS.
Vito
al T
aglia
men
to
Med
ium
-fin
e sa
ndy
grav
el.
GR
AIN
SIZ
E D
ISTR
IBU
TIO
NS
Clie
ntSi
te
(kPa
)(k
Pa)
qu

University of Padova – Faculty of Engineering Science DEPARTMENT Of HYDRAULIC, MARITIME, ENVIRONMENTAL AND GEOTECHNICAL ENGINEERING Via Ognissanti, 39, 35129 Padova – ITALY – tel. +39-049-8277980 – fax. +39-049-8277988
Test for Laboratory Compaction Characteristics of Soil using Modified Effort
(D 1557-91)
Date: 12 / 06 / 2003 Client: Pontarolo Engineering Site : S.Vito al Tagliamento Soil: Subgrade 2 Test N° 1
Water content w (%) Dry Unit Weight γd (kN/m3)
3,12 21,56
4,72 22,99
6,46 23,11
7,99 22,07
w optimum = 5.75 % γ dry,optimum = 23.21 kN/m3
21,40
21,60
21,80
22,00
22,20
22,40
22,60
22,80
23,00
23,20
23,40
3 3,5 4 4,5 5 5,5 6 6,5 7 7,5 8 8,5 9W%
γdry(kN/m3)

University of Padova – Faculty of Engineering Science DEPARTMENT Of HYDRAULIC, MARITIME, ENVIRONMENTAL AND GEOTECHNICAL ENGINEERING Via Ognissanti, 39, 35129 Padova – ITALY – tel. +39-049-8277980 – fax. +39-049-8277988
Test for Nonrepetitive Static Plate Load Tests of Soils and Flexible Pavement Components
(D 1196-93)
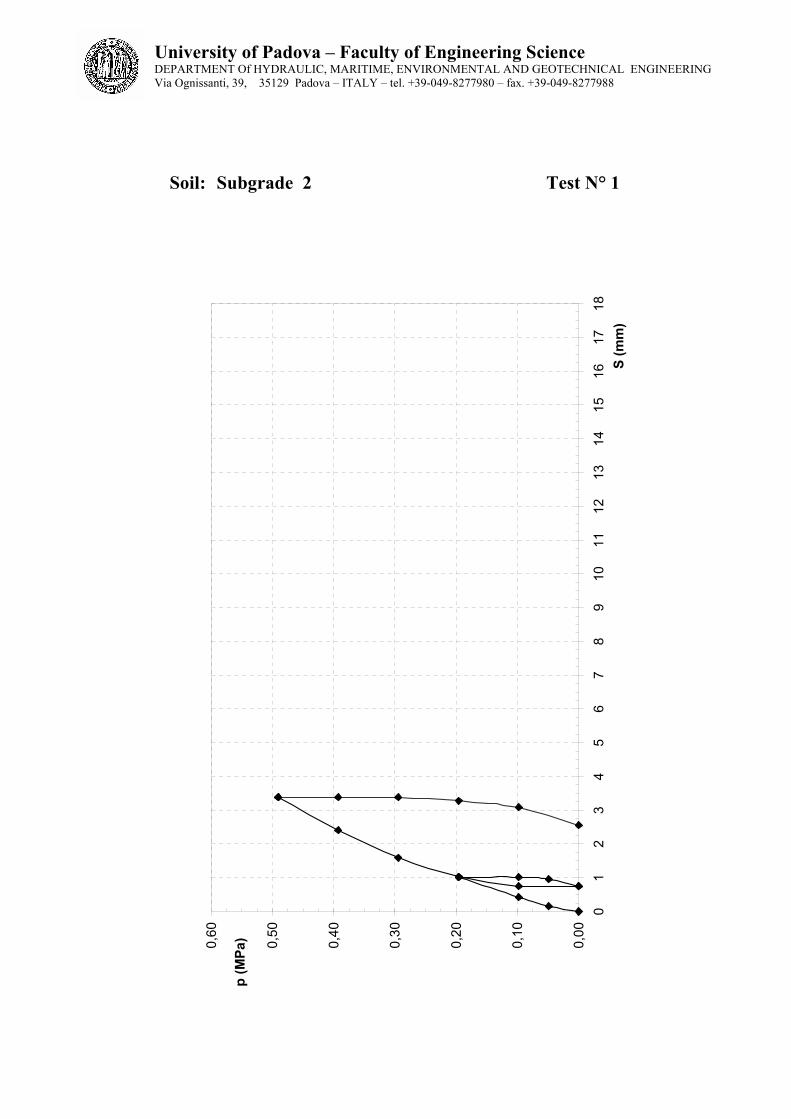
Date: 04 / 06 / 2003 Client: Pontarolo Engineering Site : S.Vito al Tagliamento Soil: Subgrade 2 Test N° 1
Circular steel plate – diameter 300 mm
p = vertical pressure S = vertical settlement
p S (MPa) (mm)
0,00 0,00 0,05 0,15 0,10 0,42 0,20 1,02 0,10 1,02 0,05 0,96 0,00 0,75 0,10 0,75 0,20 1,03 0,29 1,60 0,39 2,40 0,49 3,37 0,39 3,37 0,29 3,37 0,20 3,27 0,10 3,08 0,00 2,55
University of Padova – Faculty of Engineering Science DEPARTMENT Of HYDRAULIC, MARITIME, ENVIRONMENTAL AND GEOTECHNICAL ENGINEERING Via Ognissanti, 39, 35129 Padova – ITALY – tel. +39-049-8277980 – fax. +39-049-8277988
Soil: Subgrade 2 Test N° 1
0,00
0,10
0,20
0,30
0,40
0,50
0,60
01
23
45
67
89
1011
1213
1415
1617
18S
(mm
)
p (M
Pa)
University of Padova – Faculty of Engineering Science DEPARTMENT Of HYDRAULIC, MARITIME, ENVIRONMENTAL AND GEOTECHNICAL ENGINEERING Via Ognissanti, 39, 35129 Padova – ITALY – tel. +39-049-8277980 – fax. +39-049-8277988
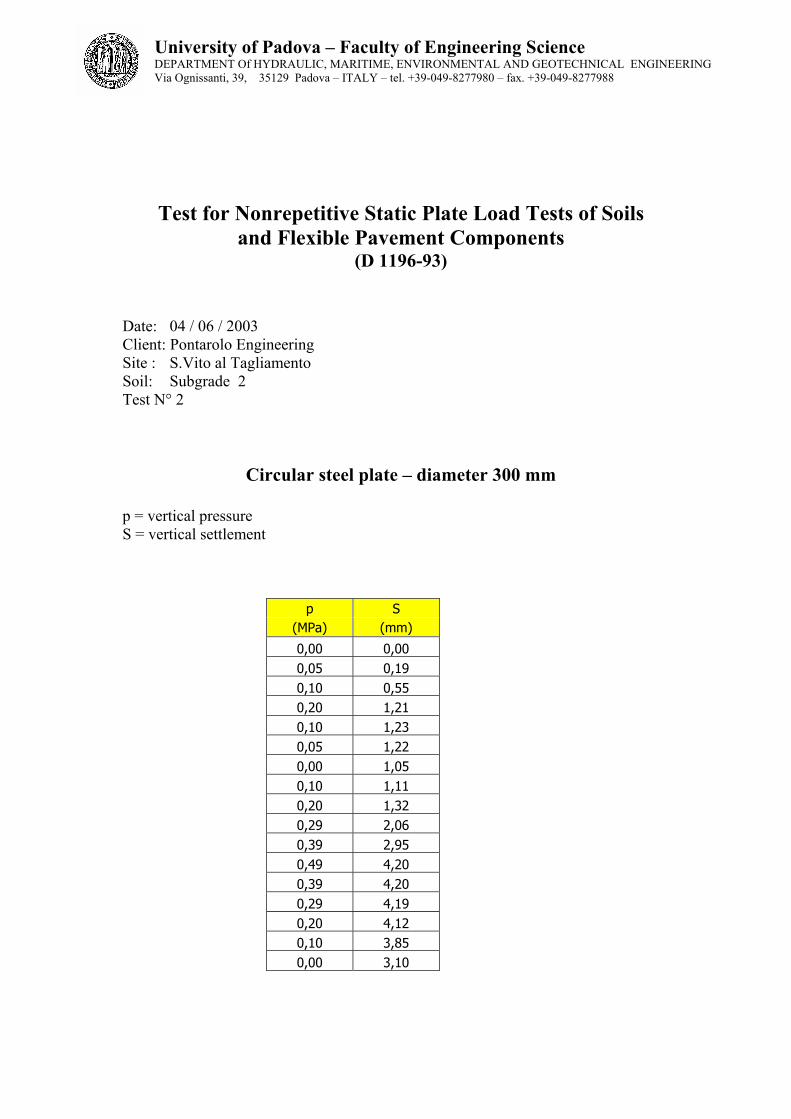
Test for Nonrepetitive Static Plate Load Tests of Soils and Flexible Pavement Components
(D 1196-93)
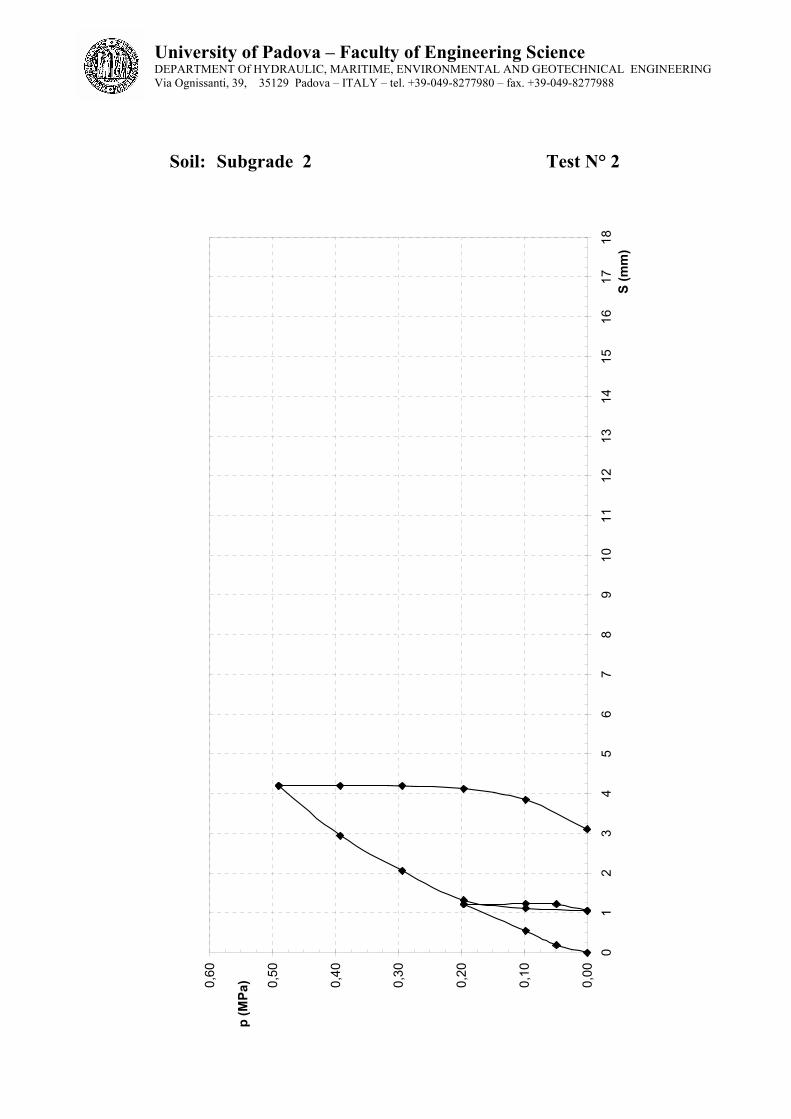
Date: 04 / 06 / 2003 Client: Pontarolo Engineering Site : S.Vito al Tagliamento Soil: Subgrade 2 Test N° 2
Circular steel plate – diameter 300 mm
p = vertical pressure S = vertical settlement
p S (MPa) (mm)
0,00 0,00 0,05 0,19 0,10 0,55 0,20 1,21 0,10 1,23 0,05 1,22 0,00 1,05 0,10 1,11 0,20 1,32 0,29 2,06 0,39 2,95 0,49 4,20 0,39 4,20 0,29 4,19 0,20 4,12 0,10 3,85 0,00 3,10
University of Padova – Faculty of Engineering Science DEPARTMENT Of HYDRAULIC, MARITIME, ENVIRONMENTAL AND GEOTECHNICAL ENGINEERING Via Ognissanti, 39, 35129 Padova – ITALY – tel. +39-049-8277980 – fax. +39-049-8277988
Soil: Subgrade 2 Test N° 2
0,00
0,10
0,20
0,30
0,40
0,50
0,60
01
23
45
67
89
1011
1213
1415
1617
18S
(mm
)
p (M
Pa)
University of Padova – Faculty of Engineering Science DEPARTMENT Of HYDRAULIC, MARITIME, ENVIRONMENTAL AND GEOTECHNICAL ENGINEERING Via Ognissanti, 39, 35129 Padova – ITALY – tel. +39-049-8277980 – fax. +39-049-8277988
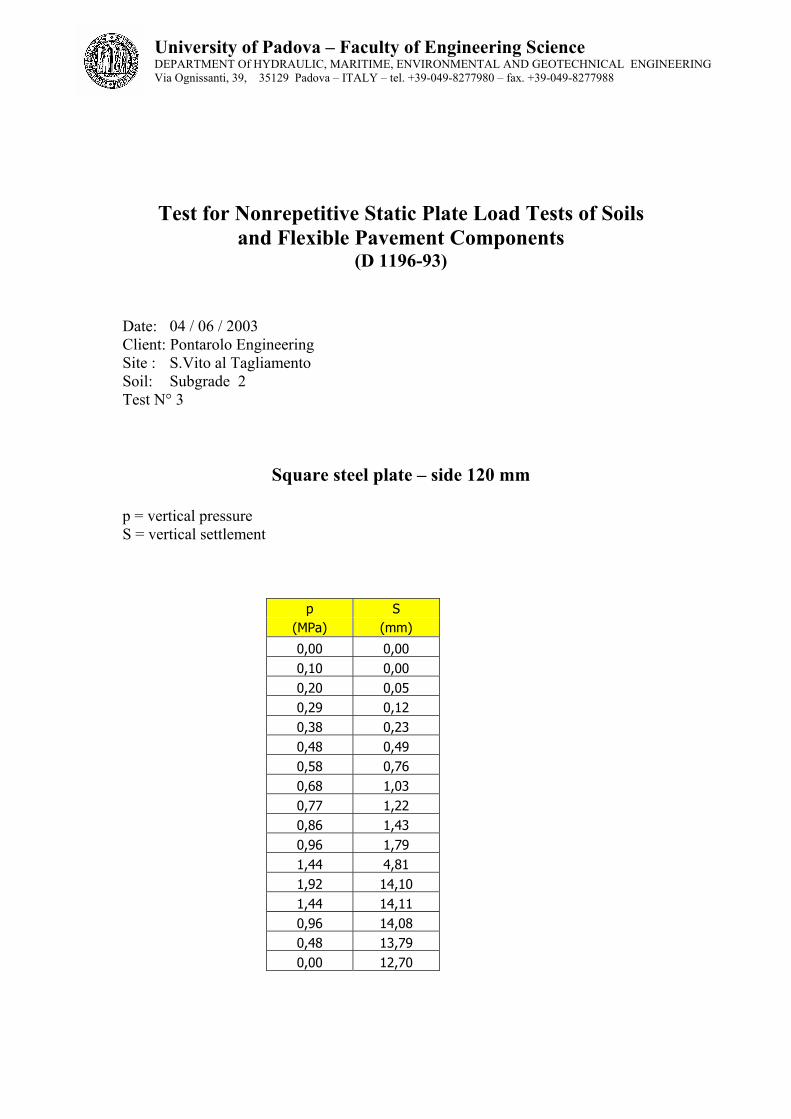
Test for Nonrepetitive Static Plate Load Tests of Soils and Flexible Pavement Components
(D 1196-93)
Date: 04 / 06 / 2003 Client: Pontarolo Engineering Site : S.Vito al Tagliamento Soil: Subgrade 2 Test N° 3
Square steel plate – side 120 mm
p = vertical pressure S = vertical settlement
p S (MPa) (mm)
0,00 0,00 0,10 0,00 0,20 0,05 0,29 0,12 0,38 0,23 0,48 0,49 0,58 0,76 0,68 1,03 0,77 1,22 0,86 1,43 0,96 1,79 1,44 4,81 1,92 14,10 1,44 14,11 0,96 14,08 0,48 13,79 0,00 12,70

University of Padova – Faculty of Engineering Science DEPARTMENT Of HYDRAULIC, MARITIME, ENVIRONMENTAL AND GEOTECHNICAL ENGINEERING Via Ognissanti, 39, 35129 Padova – ITALY – tel. +39-049-8277980 – fax. +39-049-8277988
Soil: Subgrade 2 Test N° 3
0,00
0,50
1,00
1,50
2,00
2,50
3,00
01
23
45
67
89
1011
1213
1415
1617
18
S (m
m)
p (M
Pa)
University of Padova – Faculty of Engineering Science DEPARTMENT Of HYDRAULIC, MARITIME, ENVIRONMENTAL AND GEOTECHNICAL ENGINEERING Via Ognissanti, 39, 35129 Padova – ITALY – tel. +39-049-8277980 – fax. +39-049-8277988
Subgrade 2

University of Padova – Faculty of Engineering Science DEPARTMENT Of HYDRAULIC, MARITIME, ENVIRONMENTAL AND GEOTECHNICAL ENGINEERING Via Ognissanti, 39, 35129 Padova – ITALY – tel. +39-049-8277980 – fax. +39-049-8277988
CHARACTERISTICS OF SUBGRADE N. 3
The layer forming the subgrade N. 2 was removed and then an unreinforced concrete slab
having a thickness of 10 cm was realized. On the concrete slab the following tests have
been carried out:
• N. 1 Test for Nonrepetitive Static Plate Load Tests of Soil and Flexible Pavement
Components (D1196-93)
• N. 1 Special Static Plate Load Test with the square steel plate (width = 120 mm)
A photographic view of test tank with the 300mm diameter plate resting on the subgrade is
reported at the end of this section.
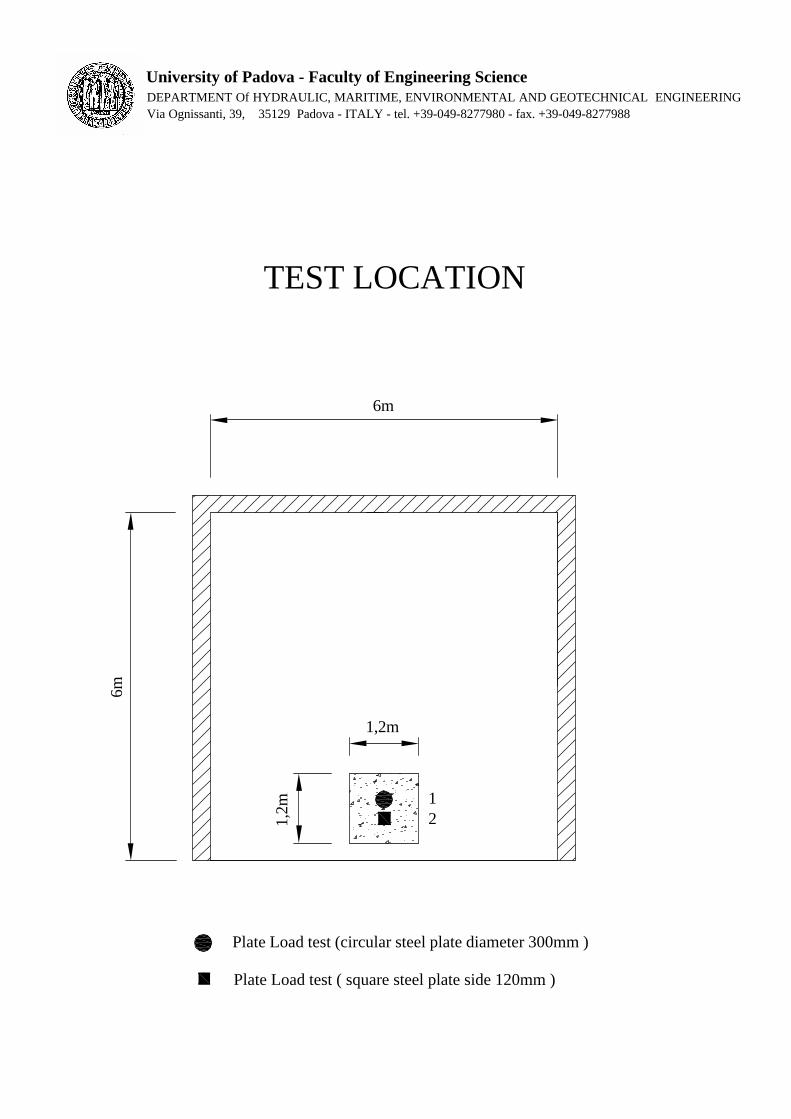
1,2m
6m
Plate Load test ( square steel plate side 120mm )
Plate Load test (circular steel plate diameter 300mm )
6m
21
1,2m
TEST LOCATION
University of Padova - Faculty of Engineering ScienceDEPARTMENT Of HYDRAULIC, MARITIME, ENVIRONMENTAL AND GEOTECHNICAL ENGINEERINGVia Ognissanti, 39, 35129 Padova - ITALY - tel. +39-049-8277980 - fax. +39-049-8277988
University of Padova – Faculty of Engineering Science DEPARTMENT Of HYDRAULIC, MARITIME, ENVIRONMENTAL AND GEOTECHNICAL ENGINEERING Via Ognissanti, 39, 35129 Padova – ITALY – tel. +39-049-8277980 – fax. +39-049-8277988
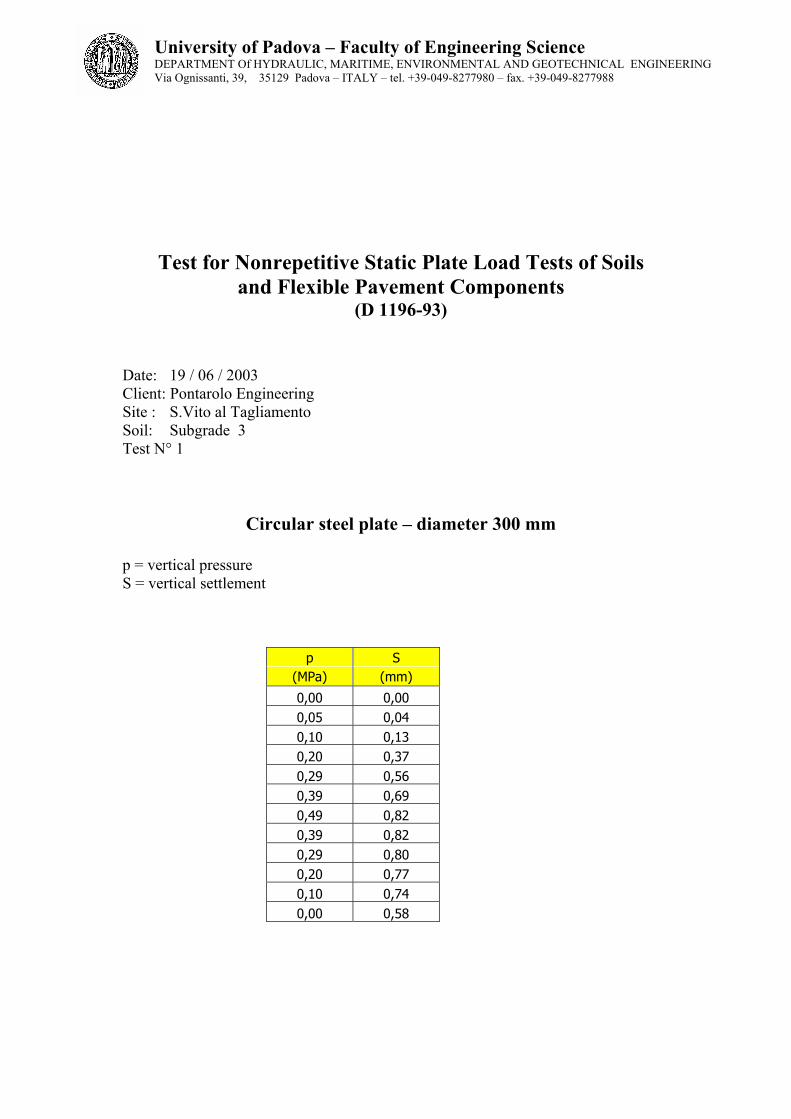
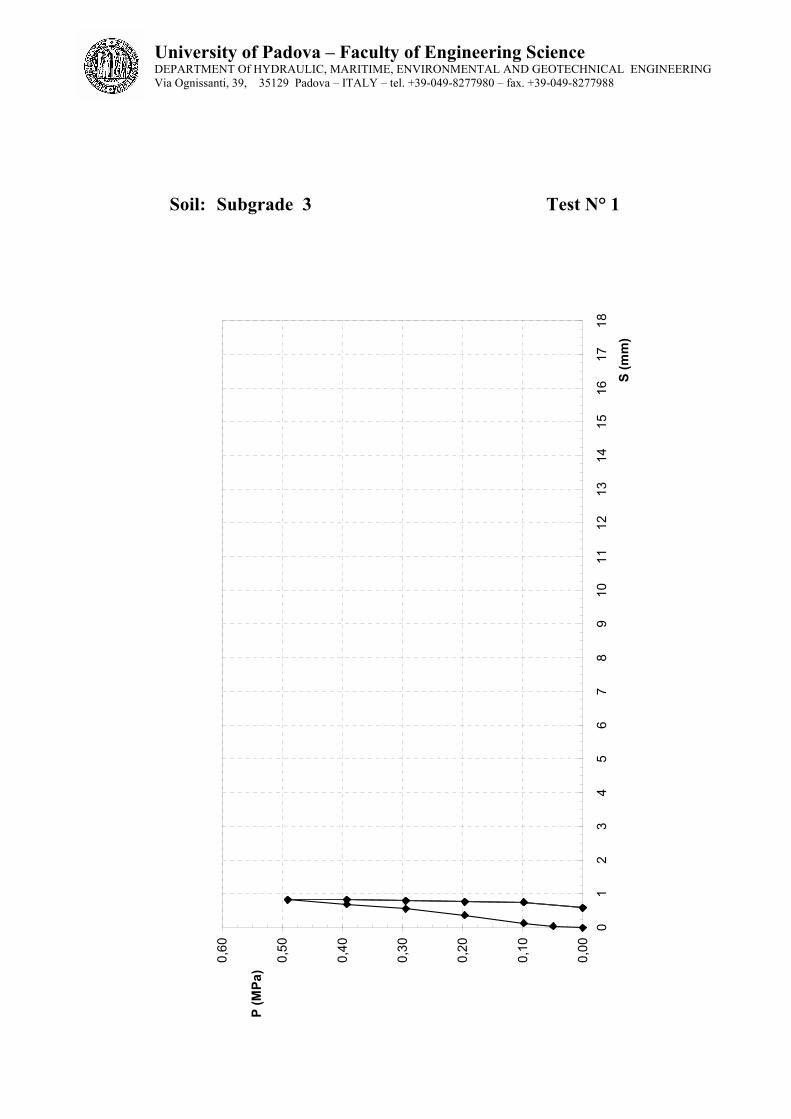
Test for Nonrepetitive Static Plate Load Tests of Soils and Flexible Pavement Components
(D 1196-93)
Date: 19 / 06 / 2003 Client: Pontarolo Engineering Site : S.Vito al Tagliamento Soil: Subgrade 3 Test N° 1
Circular steel plate – diameter 300 mm
p = vertical pressure S = vertical settlement
p S (MPa) (mm)
0,00 0,00 0,05 0,04 0,10 0,13 0,20 0,37 0,29 0,56 0,39 0,69 0,49 0,82 0,39 0,82 0,29 0,80 0,20 0,77 0,10 0,74 0,00 0,58
University of Padova – Faculty of Engineering Science DEPARTMENT Of HYDRAULIC, MARITIME, ENVIRONMENTAL AND GEOTECHNICAL ENGINEERING Via Ognissanti, 39, 35129 Padova – ITALY – tel. +39-049-8277980 – fax. +39-049-8277988
Soil: Subgrade 3 Test N° 1
0,00
0,10
0,20
0,30
0,40
0,50
0,60
01
23
45
67
89
1011
1213
1415
1617
18
S (m
m)
P (M
Pa)
University of Padova – Faculty of Engineering Science DEPARTMENT Of HYDRAULIC, MARITIME, ENVIRONMENTAL AND GEOTECHNICAL ENGINEERING Via Ognissanti, 39, 35129 Padova – ITALY – tel. +39-049-8277980 – fax. +39-049-8277988
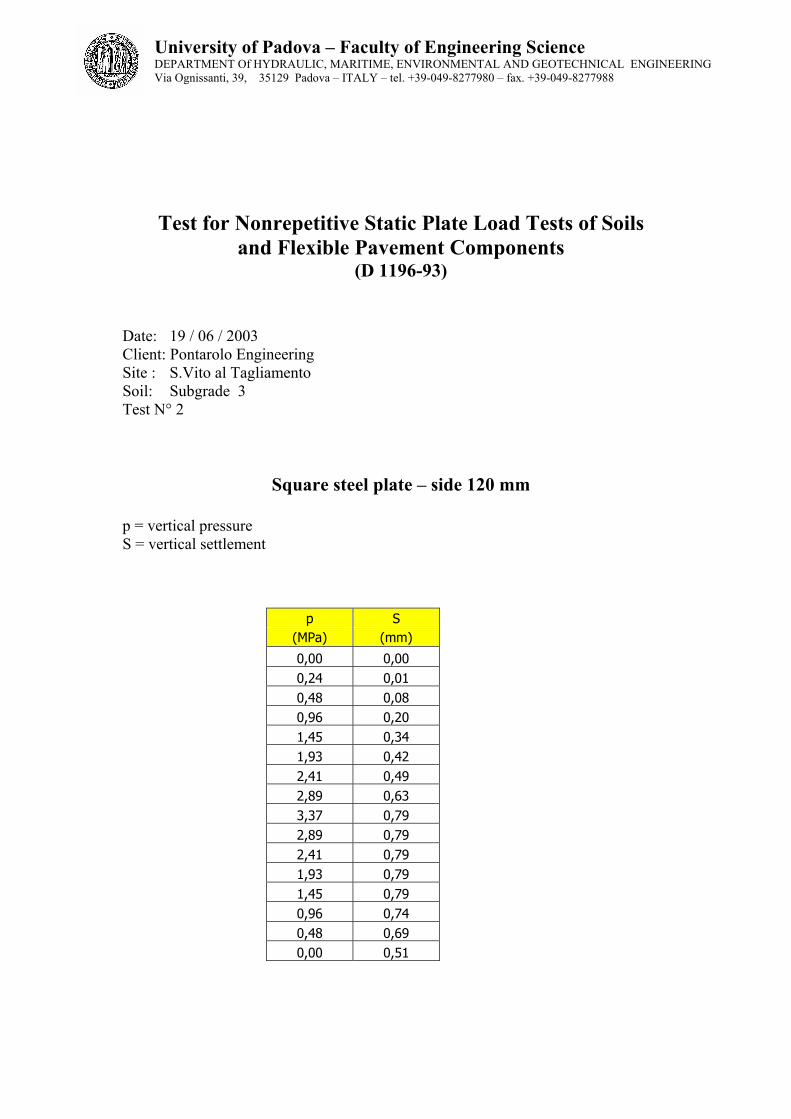
Test for Nonrepetitive Static Plate Load Tests of Soils and Flexible Pavement Components
(D 1196-93)
Date: 19 / 06 / 2003 Client: Pontarolo Engineering Site : S.Vito al Tagliamento Soil: Subgrade 3 Test N° 2
Square steel plate – side 120 mm
p = vertical pressure S = vertical settlement
p S (MPa) (mm)
0,00 0,00 0,24 0,01 0,48 0,08 0,96 0,20 1,45 0,34 1,93 0,42 2,41 0,49 2,89 0,63 3,37 0,79 2,89 0,79 2,41 0,79 1,93 0,79 1,45 0,79 0,96 0,74 0,48 0,69 0,00 0,51

University of Padova – Faculty of Engineering Science DEPARTMENT Of HYDRAULIC, MARITIME, ENVIRONMENTAL AND GEOTECHNICAL ENGINEERING Via Ognissanti, 39, 35129 Padova – ITALY – tel. +39-049-8277980 – fax. +39-049-8277988
Soil: Subgrade 3 Test N° 2
0,00
1,00
2,00
3,00
4,00
5,00
6,00
01
23
45
67
89
1011
1213
1415
1617
18S
(mm
)
p (M
Pa)
University of Padova – Faculty of Engineering Science DEPARTMENT Of HYDRAULIC, MARITIME, ENVIRONMENTAL AND GEOTECHNICAL ENGINEERING Via Ognissanti, 39, 35129 Padova – ITALY – tel. +39-049-8277980 – fax. +39-049-8277988
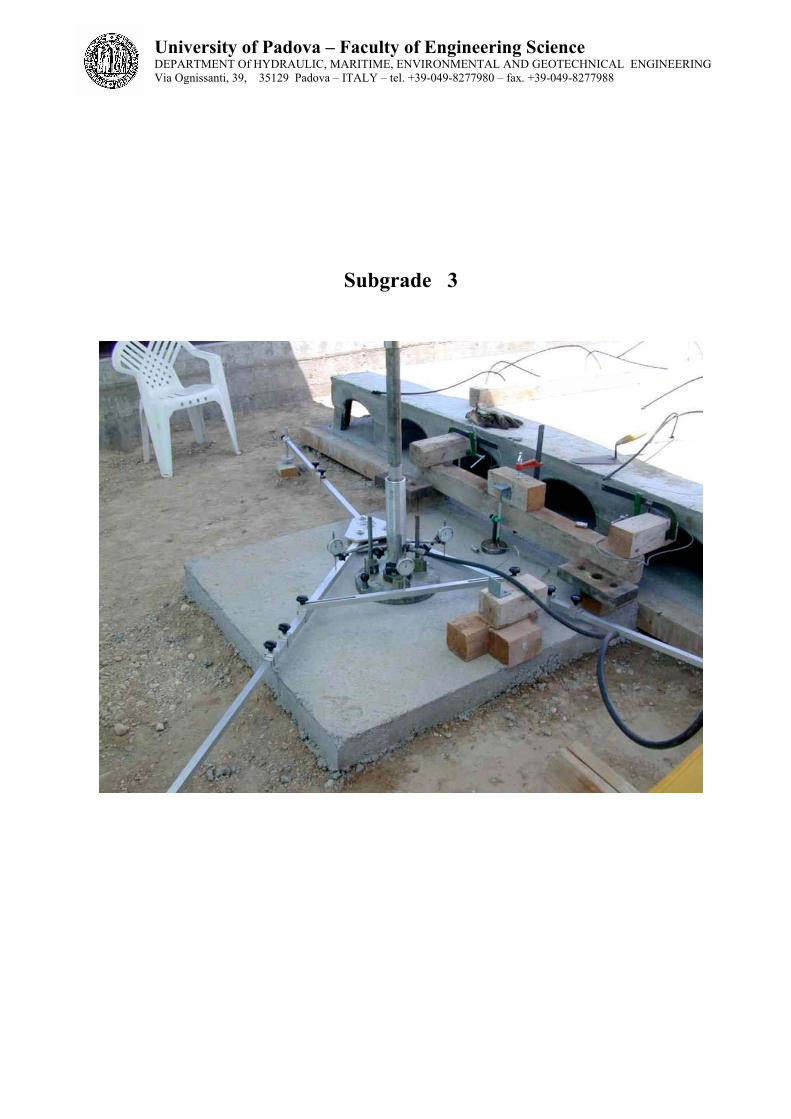
Subgrade 3
University of Padova – Faculty of Engineering Science DEPARTMENT Of HYDRAULIC, MARITIME, ENVIRONMENTAL AND GEOTECHNICAL ENGINEERING Via Ognissanti, 39, 35129 Padova – ITALY – tel. +39-049-8277980 – fax. +39-049-8277988
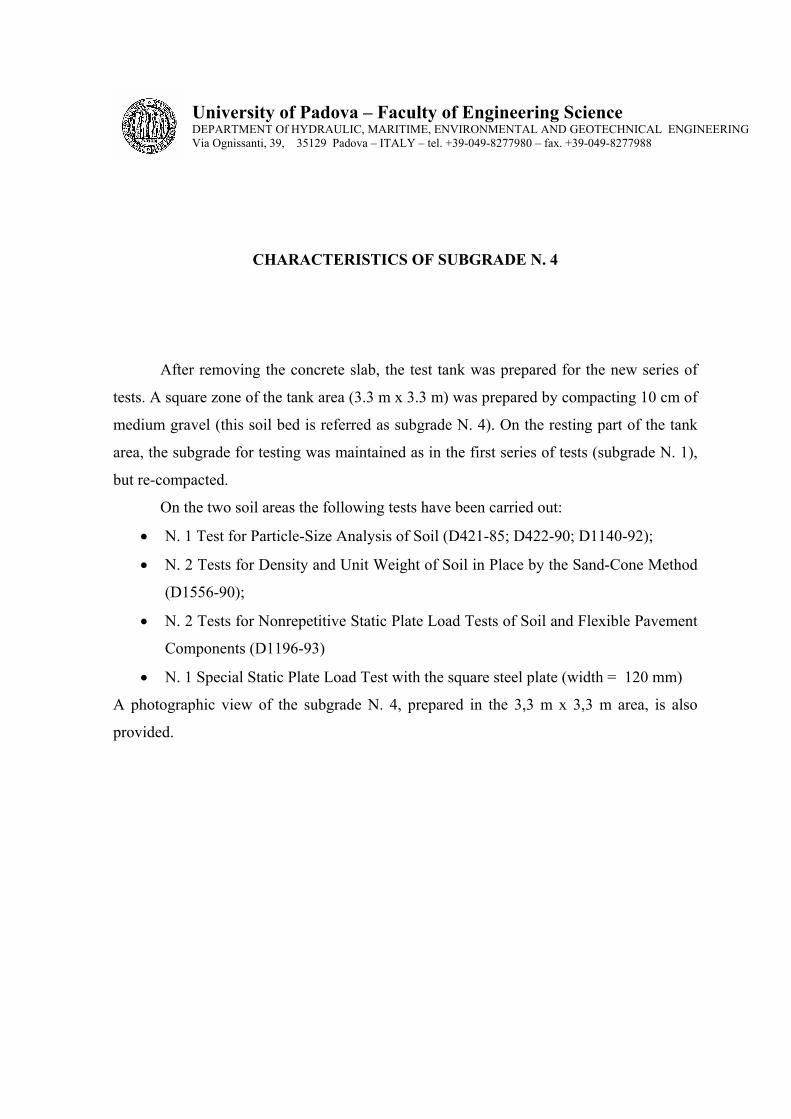
CHARACTERISTICS OF SUBGRADE N. 4
After removing the concrete slab, the test tank was prepared for the new series of
tests. A square zone of the tank area (3.3 m x 3.3 m) was prepared by compacting 10 cm of
medium gravel (this soil bed is referred as subgrade N. 4). On the resting part of the tank
area, the subgrade for testing was maintained as in the first series of tests (subgrade N. 1),
but re-compacted.
On the two soil areas the following tests have been carried out:
• N. 1 Test for Particle-Size Analysis of Soil (D421-85; D422-90; D1140-92);
• N. 2 Tests for Density and Unit Weight of Soil in Place by the Sand-Cone Method
(D1556-90);
• N. 2 Tests for Nonrepetitive Static Plate Load Tests of Soil and Flexible Pavement
Components (D1196-93)
• N. 1 Special Static Plate Load Test with the square steel plate (width = 120 mm)
A photographic view of the subgrade N. 4, prepared in the 3,3 m x 3,3 m area, is also
provided.

TEST LOCATION
6m
1,8m
6m
2
1,8m
1,3m
1m 2
1
11,
8m
Plate Load test ( square steel plate side 120mm )
Plate Load test ( circular steel plate diameter 300mm )
In situ density
3,3m
3,3m
1,65
m
1
1,65m
University of Padova - Faculty of Engineering ScienceDEPARTMENT Of HYDRAULIC, MARITIME, ENVIRONMENTAL AND GEOTECHNICAL ENGINEERINGVia Ognissanti, 39, 35129 Padova - ITALY - tel. +39-049-8277980 - fax. +39-049-8277988

University of Padova – Faculty of Engineering Science DEPARTMENT Of HYDRAULIC, MARITIME, ENVIRONMENTAL AND GEOTECHNICAL ENGINEERING Via Ognissanti, 39, 35129 Padova – ITALY – tel. +39-049-8277980 – fax. +39-049-8277988
Clie
ntPo
ntar
olo
Engi
neer
ing
Dat
e09
/07/
2003
Site
S.V
ito a
l Tag
liam
ento
Dry
X
Bor
ehol
eSa
mpl
eSu
bgra
de 4
Dep
thW
et
Des
crip
tion
of d
epth
:G
ross
wei
ghtg
.16
50,0
PA
RT
ICL
E-S
IZE
AN
AL
YSI
STa
re w
eigh
tg.
150,
0N
et w
eigh
tg.
1500
,0
AST
M S
ieve
n.
Dia
met
erN
et w
eigh
t (g)
% T
ratte
nuto
% P
assi
ng
4"10
1,6
0,00
100,
00
3"76
,20,
0010
0,00
2"50
,80,
0010
0,00
1" 1
/238
,10,
0010
0,00
1"25
,40,
0010
0,00
3/4"
19,1
0,00
100,
00
1/2"
12,7
610,
640
,71
59,2
9
3/8"
9,52
678,
245
,21
14,0
8
44,
7621
1,2
14,0
80,
00
102
0,00
0,00
200,
840,
000,
00
400,
420,
000,
00
600,
250,
000,
00
800,
177
0,00
0,00
140
0,10
50,
000,
00
200
0,07
40,
000,
00
University of Padova – Faculty of Engineering Science DEPARTMENT Of HYDRAULIC, MARITIME, ENVIRONMENTAL AND GEOTECHNICAL ENGINEERING Via Ognissanti, 39, 35129 Padova – ITALY – tel. +39-049-8277980 – fax. +39-049-8277988
100
101
0.1
0.01
0.00
1
3"2"
Dia
met
er (m
m)
100 90 80 70 60 50 40 30 20 10
Percent passing by weight (%)
1"1/
21"
3/4"
1/2"
3/8"
410
2040
6080
140
200
Siev
e U
.S. S
tand
ard
6020
62
0.6
0.2
0.06
Coa
rse
Med
ium
Fine
Coa
rse
Med
ium
Fine
GR
AV
ELSA
ND
0.00
2
SILT
CLA
YC
OB
BLE
S
Sam
ple
Dep
thC
LA
SS
IFIC
AT
ION
SU
BG
RA
DE
4γ s
(kN
/m )3
Gs
w %
ww
p%
%I p
%Pe
n.(k
Pa)
qu1
2
BORE
HOLE
Pont
arol
o En
gine
erin
gS.
Vito
al T
aglia
men
to
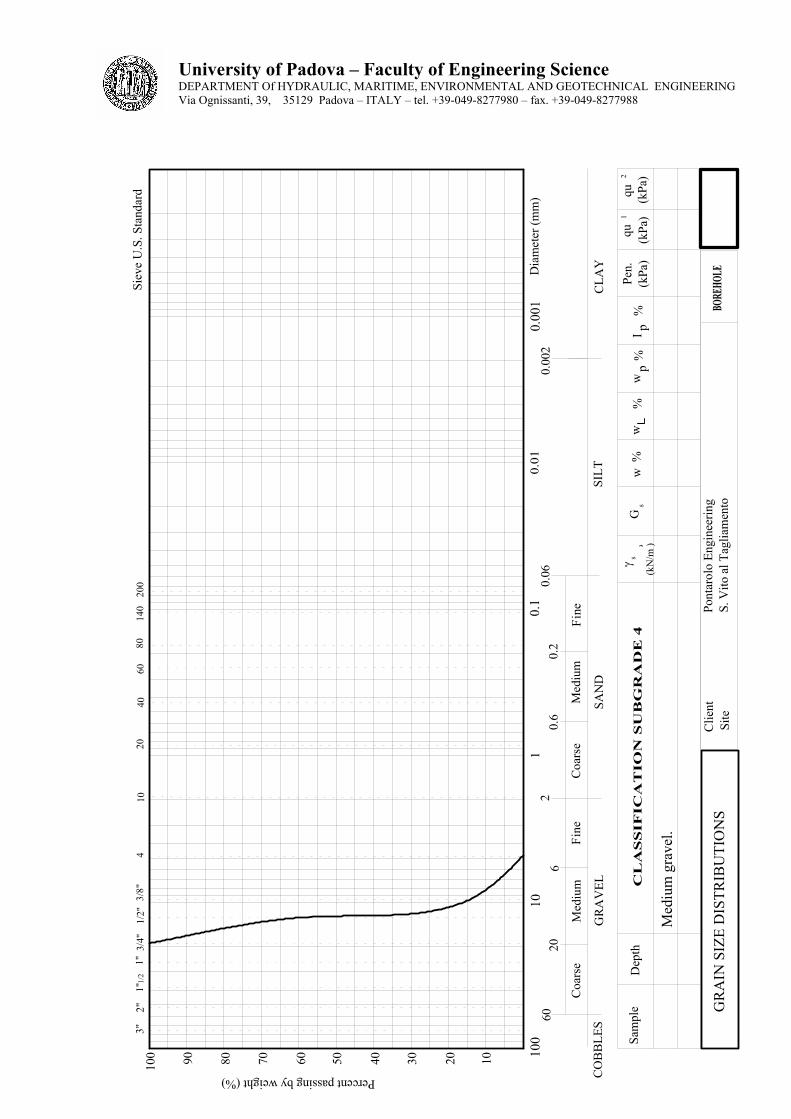
Med
ium
gra
vel.
GR
AIN
SIZ
E D
ISTR
IBU
TIO
NS
Clie
ntSi
te
(kPa
)(k
Pa)
qu
University of Padova – Faculty of Engineering Science DEPARTMENT Of HYDRAULIC, MARITIME, ENVIRONMENTAL AND GEOTECHNICAL ENGINEERING Via Ognissanti, 39, 35129 Padova – ITALY – tel. +39-049-8277980 – fax. +39-049-8277988
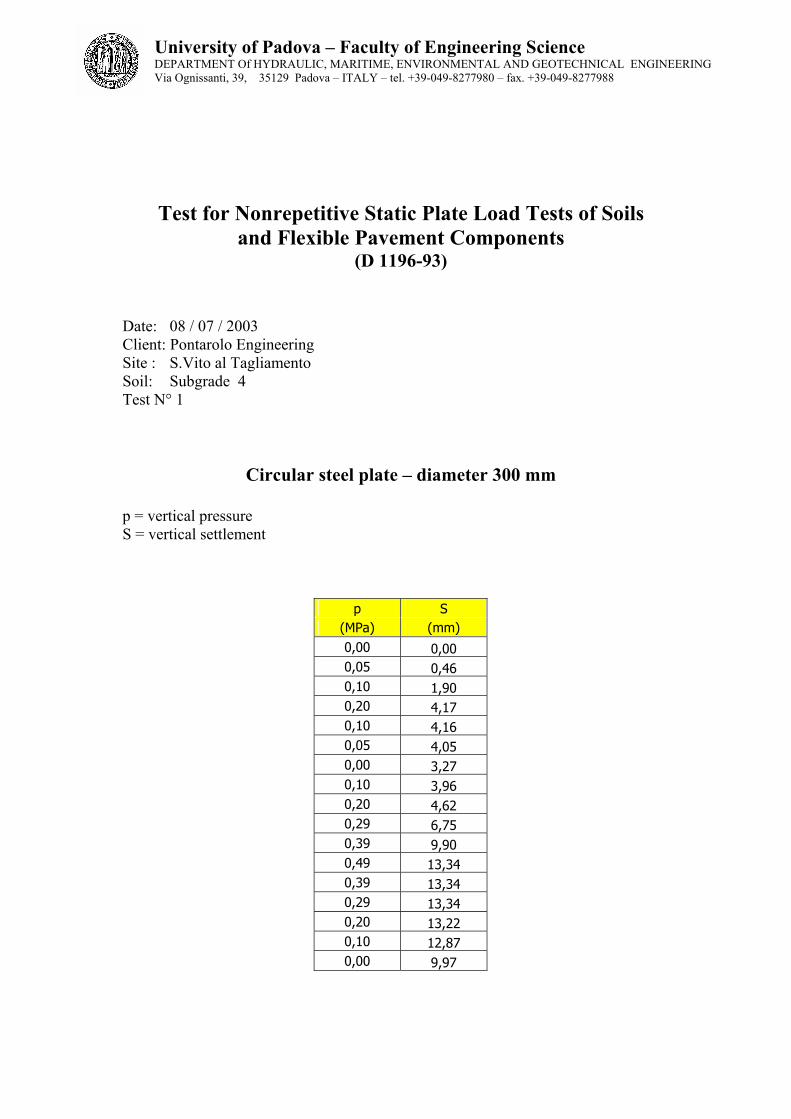
Test for Nonrepetitive Static Plate Load Tests of Soils and Flexible Pavement Components
(D 1196-93)
Date: 08 / 07 / 2003 Client: Pontarolo Engineering Site : S.Vito al Tagliamento Soil: Subgrade 4 Test N° 1
Circular steel plate – diameter 300 mm
p = vertical pressure S = vertical settlement
p S (MPa) (mm) 0,00 0,00 0,05 0,46 0,10 1,90 0,20 4,17 0,10 4,16 0,05 4,05 0,00 3,27 0,10 3,96 0,20 4,62 0,29 6,75 0,39 9,90 0,49 13,34 0,39 13,34 0,29 13,34 0,20 13,22 0,10 12,87 0,00 9,97

University of Padova – Faculty of Engineering Science DEPARTMENT Of HYDRAULIC, MARITIME, ENVIRONMENTAL AND GEOTECHNICAL ENGINEERING Via Ognissanti, 39, 35129 Padova – ITALY – tel. +39-049-8277980 – fax. +39-049-8277988
Soil: Subgrade 4 Test N° 1
0,00
0,10
0,20
0,30
0,40
0,50
0,60
01
23
45
67
89
1011
1213
1415
1617
18S
(mm
)
p (M
Pa)
University of Padova – Faculty of Engineering Science DEPARTMENT Of HYDRAULIC, MARITIME, ENVIRONMENTAL AND GEOTECHNICAL ENGINEERING Via Ognissanti, 39, 35129 Padova – ITALY – tel. +39-049-8277980 – fax. +39-049-8277988
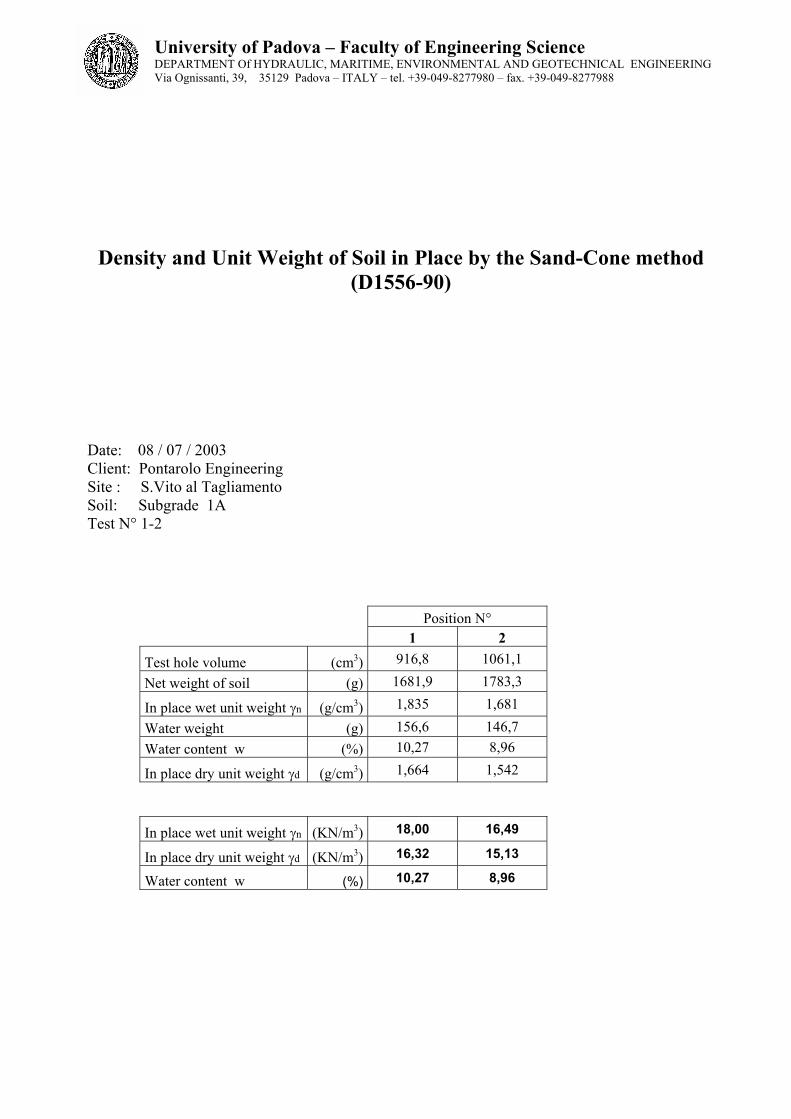
Density and Unit Weight of Soil in Place by the Sand-Cone method (D1556-90)
Date: 08 / 07 / 2003 Client: Pontarolo Engineering Site : S.Vito al Tagliamento Soil: Subgrade 1A Test N° 1-2
Position N° 1 2
Test hole volume (cm3) 916,8 1061,1
Net weight of soil (g) 1681,9 1783,3
In place wet unit weight γn (g/cm3) 1,835 1,681
Water weight (g) 156,6 146,7 Water content w (%) 10,27 8,96
In place dry unit weight γd (g/cm3) 1,664 1,542
In place wet unit weight γn (KN/m3) 18,00 16,49
In place dry unit weight γd (KN/m3) 16,32 15,13
Water content w (%) 10,27 8,96

University of Padova – Faculty of Engineering Science DEPARTMENT Of HYDRAULIC, MARITIME, ENVIRONMENTAL AND GEOTECHNICAL ENGINEERING Via Ognissanti, 39, 35129 Padova – ITALY – tel. +39-049-8277980 – fax. +39-049-8277988
Test for Nonrepetitive Static Plate Load Tests of Soils and Flexible Pavement Components
(D 1196-93)
Date: 08 / 07 / 2003 Client: Pontarolo Engineering Site : S.Vito al Tagliamento Soil: Subgrade 1A Test N° 1
Circular steel plate – diameter 300 mm
p = vertical pressure S = vertical settlement
p S (MPa) (mm)
0,00 0,00 0,05 0,21 0,10 0,70 0,20 1,87 0,10 1,87 0,05 1,86 0,00 1,45 0,10 1,56 0,20 2,01 0,29 3,27 0,39 5,00 0,49 7,37 0,39 7,37 0,29 7,30 0,20 7,23 0,10 6,83 0,00 5,63

University of Padova – Faculty of Engineering Science DEPARTMENT Of HYDRAULIC, MARITIME, ENVIRONMENTAL AND GEOTECHNICAL ENGINEERING Via Ognissanti, 39, 35129 Padova – ITALY – tel. +39-049-8277980 – fax. +39-049-8277988
Soil: Subgrade 1A Test N° 1
0,00
0,10
0,20
0,30
0,40
0,50
0,60
01
23
45
67
89
1011
1213
1415
1617
18S
(mm
)
p (M
Pa)

University of Padova – Faculty of Engineering Science DEPARTMENT Of HYDRAULIC, MARITIME, ENVIRONMENTAL AND GEOTECHNICAL ENGINEERING Via Ognissanti, 39, 35129 Padova – ITALY – tel. +39-049-8277980 – fax. +39-049-8277988
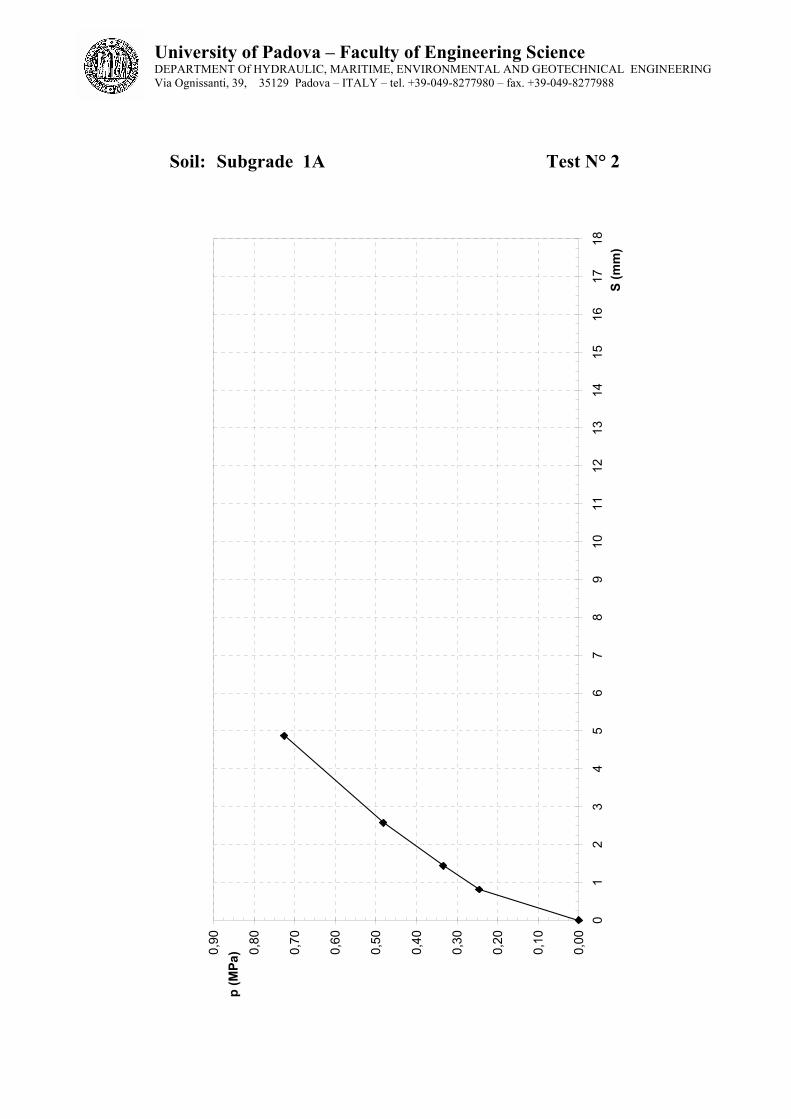
Test for Nonrepetitive Static Plate Load Tests of Soils and Flexible Pavement Components
(D 1196-93)
Date: 08 / 07 / 2003 Client: Pontarolo Engineering Site : S.Vito al Tagliamento Soil: Subgrade 1A Test N° 2
Square steel plate – side 120 mm
p = vertical pressure S = vertical settlement
p S (MPa) (mm)
0,00 0,00 0,25 0,81 0,33 1,44 0,48 2,58 0,73 4,87
University of Padova – Faculty of Engineering Science DEPARTMENT Of HYDRAULIC, MARITIME, ENVIRONMENTAL AND GEOTECHNICAL ENGINEERING Via Ognissanti, 39, 35129 Padova – ITALY – tel. +39-049-8277980 – fax. +39-049-8277988
Soil: Subgrade 1A Test N° 2
0,00
0,10
0,20
0,30
0,40
0,50
0,60
0,70
0,80
0,90
01
23
45
67
89
1011
1213
1415
1617
18S
(mm
)
p (M
Pa)

University of Padova – Faculty of Engineering Science DEPARTMENT Of HYDRAULIC, MARITIME, ENVIRONMENTAL AND GEOTECHNICAL ENGINEERING Via Ognissanti, 39, 35129 Padova – ITALY – tel. +39-049-8277980 – fax. +39-049-8277988
Subgrade 4
Research project: ‘Cupolex floor:static behawiour analysis’ Pag. 31
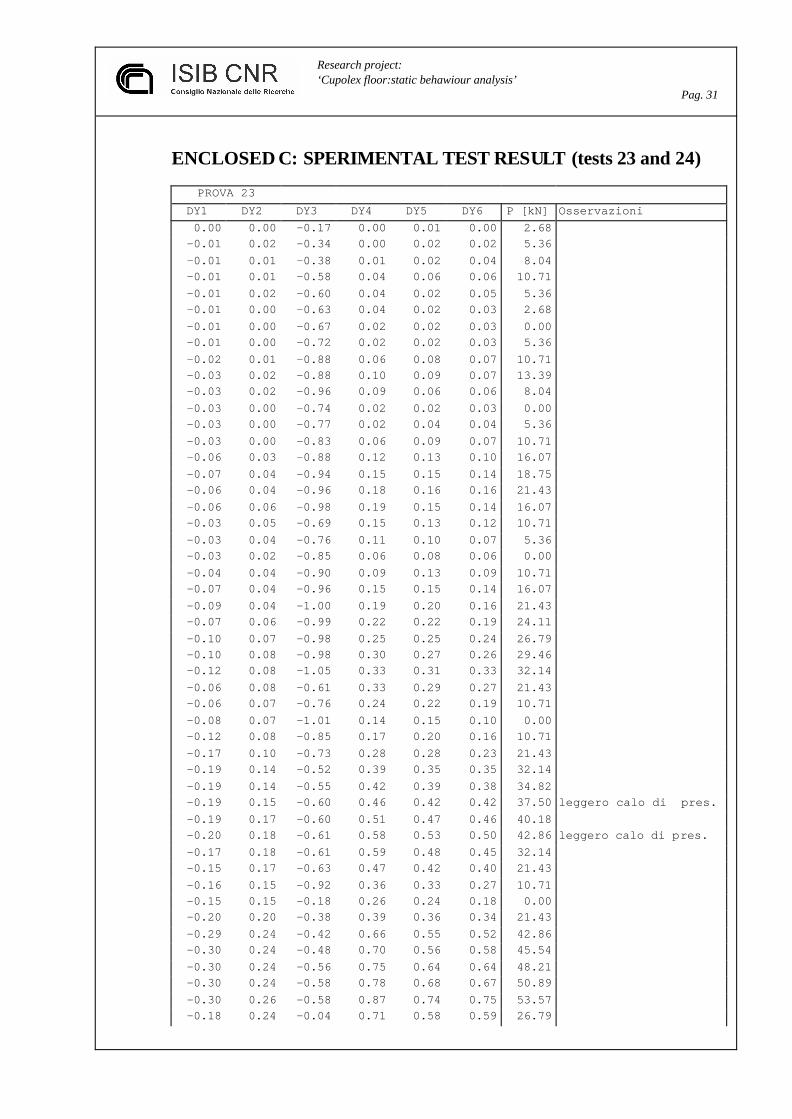
ENCLOSED C: SPERIMENTAL TEST RESULT (tests 23 and 24)
PROVA 23 DY1 DY2 DY3 DY4 DY5 DY6 P [kN] Osservazioni 0.00 0.00 -0.17 0.00 0.01 0.00 2.68 -0.01 0.02 -0.34 0.00 0.02 0.02 5.36 -0.01 0.01 -0.38 0.01 0.02 0.04 8.04 -0.01 0.01 -0.58 0.04 0.06 0.06 10.71 -0.01 0.02 -0.60 0.04 0.02 0.05 5.36 -0.01 0.00 -0.63 0.04 0.02 0.03 2.68 -0.01 0.00 -0.67 0.02 0.02 0.03 0.00 -0.01 0.00 -0.72 0.02 0.02 0.03 5.36 -0.02 0.01 -0.88 0.06 0.08 0.07 10.71 -0.03 0.02 -0.88 0.10 0.09 0.07 13.39 -0.03 0.02 -0.96 0.09 0.06 0.06 8.04 -0.03 0.00 -0.74 0.02 0.02 0.03 0.00 -0.03 0.00 -0.77 0.02 0.04 0.04 5.36 -0.03 0.00 -0.83 0.06 0.09 0.07 10.71 -0.06 0.03 -0.88 0.12 0.13 0.10 16.07 -0.07 0.04 -0.94 0.15 0.15 0.14 18.75 -0.06 0.04 -0.96 0.18 0.16 0.16 21.43 -0.06 0.06 -0.98 0.19 0.15 0.14 16.07 -0.03 0.05 -0.69 0.15 0.13 0.12 10.71 -0.03 0.04 -0.76 0.11 0.10 0.07 5.36 -0.03 0.02 -0.85 0.06 0.08 0.06 0.00 -0.04 0.04 -0.90 0.09 0.13 0.09 10.71 -0.07 0.04 -0.96 0.15 0.15 0.14 16.07 -0.09 0.04 -1.00 0.19 0.20 0.16 21.43 -0.07 0.06 -0.99 0.22 0.22 0.19 24.11 -0.10 0.07 -0.98 0.25 0.25 0.24 26.79 -0.10 0.08 -0.98 0.30 0.27 0.26 29.46 -0.12 0.08 -1.05 0.33 0.31 0.33 32.14 -0.06 0.08 -0.61 0.33 0.29 0.27 21.43 -0.06 0.07 -0.76 0.24 0.22 0.19 10.71 -0.08 0.07 -1.01 0.14 0.15 0.10 0.00 -0.12 0.08 -0.85 0.17 0.20 0.16 10.71 -0.17 0.10 -0.73 0.28 0.28 0.23 21.43 -0.19 0.14 -0.52 0.39 0.35 0.35 32.14 -0.19 0.14 -0.55 0.42 0.39 0.38 34.82 -0.19 0.15 -0.60 0.46 0.42 0.42 37.50 leggero calo di pres. -0.19 0.17 -0.60 0.51 0.47 0.46 40.18 -0.20 0.18 -0.61 0.58 0.53 0.50 42.86 leggero calo di pres. -0.17 0.18 -0.61 0.59 0.48 0.45 32.14 -0.15 0.17 -0.63 0.47 0.42 0.40 21.43 -0.16 0.15 -0.92 0.36 0.33 0.27 10.71 -0.15 0.15 -0.18 0.26 0.24 0.18 0.00 -0.20 0.20 -0.38 0.39 0.36 0.34 21.43 -0.29 0.24 -0.42 0.66 0.55 0.52 42.86 -0.30 0.24 -0.48 0.70 0.56 0.58 45.54 -0.30 0.24 -0.56 0.75 0.64 0.64 48.21 -0.30 0.24 -0.58 0.78 0.68 0.67 50.89 -0.30 0.26 -0.58 0.87 0.74 0.75 53.57 -0.18 0.24 -0.04 0.71 0.58 0.59 26.79

Research project: ‘Cupolex floor:static behawiour analysis’ Pag. 32
-0.20 0.24 -0.72 0.37 0.33 0.26 0.00 -0.30 0.24 -0.58 0.58 0.51 0.47 26.79 -0.39 0.31 0.32 0.95 0.77 0.79 53.57 calo di pressione -0.40 0.31 0.22 1.02 0.86 0.87 56.25 -0.41 0.33 0.57 1.11 0.93 0.94 58.93 calo di pressione -0.42 0.31 0.39 1.18 0.98 0.98 61.61 calo di pressione -0.44 0.31 0.11 1.27 1.07 1.07 64.29 calo di pressione -0.37 0.31 0.17 1.21 0.96 0.99 42.86 -0.30 0.30 0.20 0.96 0.77 0.76 21.43 -0.26 0.27 -0.29 0.59 0.46 0.40 0.00 -0.36 0.31 -0.16 0.90 0.75 0.71 32.14 -0.46 0.35 -0.15 1.39 1.15 1.16 64.29 calo di pressione -0.46 0.36 -0.13 1.44 1.23 1.24 66.96 -0.46 0.37 0.39 1.57 1.33 1.34 69.64 -0.47 0.37 0.82 1.67 1.43 1.44 72.32 calo di pressione -0.47 0.37 0.32 1.82 1.55 1.54 75.00 calo di pressione -0.48 0.36 -0.06 1.96 1.71 1.73 77.68 -0.46 0.31 -0.88 2.23 2.00 2.03 80.36 calo di pres. 2 bar -0.30 -0.32 -0.52 3.51 3.79 3.72 83.04 calo di pres. 3 bar -0.29 -0.65 -0.98 4.20 4.70 4.54 85.71 calo di pressione -0.26 -0.69 -1.85 4.24 4.72 4.58 64.29 -0.19 -0.68 -1.05 4.02 4.47 4.33 42.86 -0.19 -0.65 -1.66 4.07 4.59 4.45 64.29 -0.26 -0.77 -1.13 4.54 5.14 4.93 85.71 calo di pressione -0.26 -0.95 -0.14 4.95 5.72 5.47 88.39 -0.26 -1.19 -1.64 5.42 6.27 5.97 91.07 fessurato -0.26 -1.40 -0.70 5.96 6.99 6.65 93.75 -0.26 -1.69 -0.30 6.59 7.78 7.39 96.43 -0.26 -2.00 -1.01 7.21 8.56 8.13 101.79 lettura instabile -0.26 -2.52 -1.71 8.13 9.69 9.08 107.14 -0.14 -2.57 -1.81 8.19 9.69 9.10 80.36 -0.09 -2.55 -1.79 7.85 9.36 8.75 53.57 -0.10 -2.52 -1.63 7.88 9.51 8.92 80.36 -0.15 -2.74 -1.64 8.72 10.44 9.72 107.14 -0.15 -3.12 -1.21 9.41 11.41 10.57 112.50 calo di pressione -0.04 -3.74 -1.26 10.44 12.72 11.70 117.86 calo di pres. di 2.5
bar -0.01 -4.24 0.00 11.47 14.13 12.93 123.21 calo di pres. di 3 bar 0.12 -5.24 0.00 13.21 16.33 14.78 128.57 calo di pres. di 5 bar 0.19 -5.89 0.00 14.39 17.89 16.17 133.93 0.34 -6.80 0.00 16.01 19.90 17.83 139.29 calo di pres. di 5 bar 0.39 -7.74 0.00 17.67 22.04 19.64 144.64 0.44 -9.24 0.00 20.07 24.82 22.23 150.00 calo di pres. di 5 bar 0.48 -10.05 0.00 22.14 27.42 24.63 155.36 rottura a taglio
Research project: ‘Cupolex floor:static behawiour analysis’ Pag. 33
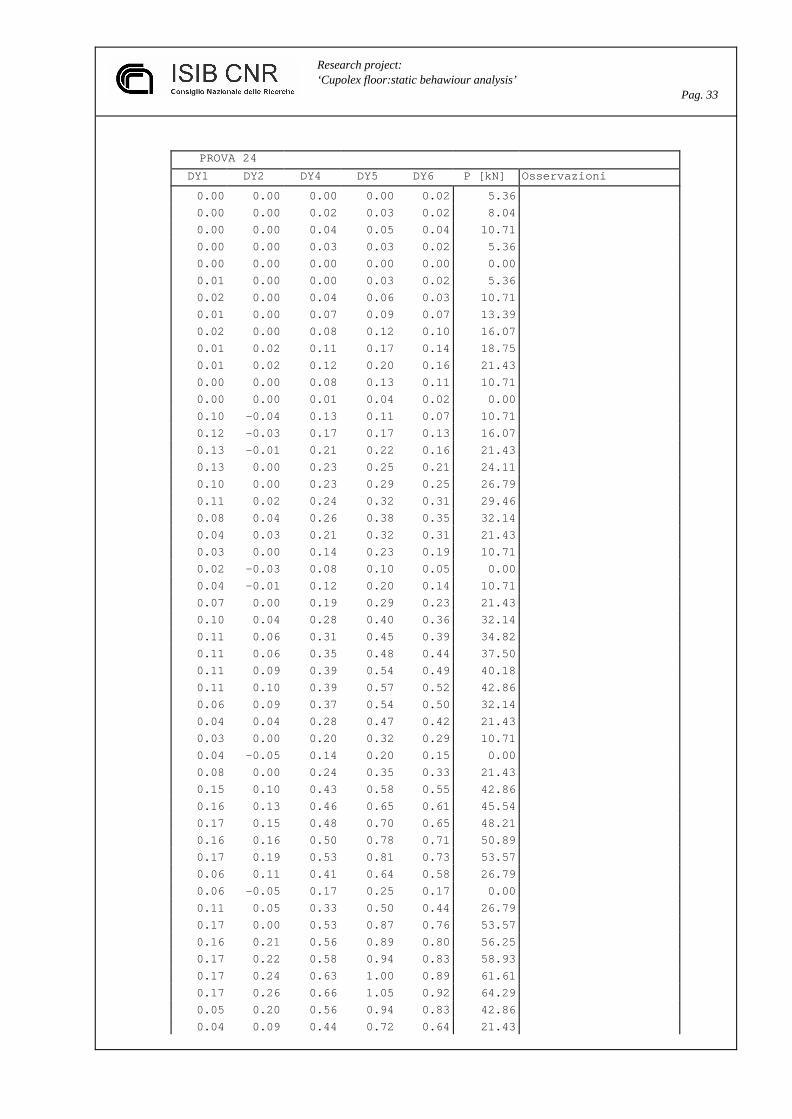
PROVA 24
DY1 DY2 DY4 DY5 DY6 P [kN] Osservazioni
0.00 0.00 0.00 0.00 0.02 5.36 0.00 0.00 0.02 0.03 0.02 8.04 0.00 0.00 0.04 0.05 0.04 10.71 0.00 0.00 0.03 0.03 0.02 5.36 0.00 0.00 0.00 0.00 0.00 0.00 0.01 0.00 0.00 0.03 0.02 5.36 0.02 0.00 0.04 0.06 0.03 10.71 0.01 0.00 0.07 0.09 0.07 13.39 0.02 0.00 0.08 0.12 0.10 16.07 0.01 0.02 0.11 0.17 0.14 18.75 0.01 0.02 0.12 0.20 0.16 21.43 0.00 0.00 0.08 0.13 0.11 10.71 0.00 0.00 0.01 0.04 0.02 0.00 0.10 -0.04 0.13 0.11 0.07 10.71 0.12 -0.03 0.17 0.17 0.13 16.07 0.13 -0.01 0.21 0.22 0.16 21.43 0.13 0.00 0.23 0.25 0.21 24.11 0.10 0.00 0.23 0.29 0.25 26.79 0.11 0.02 0.24 0.32 0.31 29.46 0.08 0.04 0.26 0.38 0.35 32.14 0.04 0.03 0.21 0.32 0.31 21.43 0.03 0.00 0.14 0.23 0.19 10.71 0.02 -0.03 0.08 0.10 0.05 0.00 0.04 -0.01 0.12 0.20 0.14 10.71 0.07 0.00 0.19 0.29 0.23 21.43 0.10 0.04 0.28 0.40 0.36 32.14 0.11 0.06 0.31 0.45 0.39 34.82 0.11 0.06 0.35 0.48 0.44 37.50 0.11 0.09 0.39 0.54 0.49 40.18 0.11 0.10 0.39 0.57 0.52 42.86 0.06 0.09 0.37 0.54 0.50 32.14 0.04 0.04 0.28 0.47 0.42 21.43 0.03 0.00 0.20 0.32 0.29 10.71 0.04 -0.05 0.14 0.20 0.15 0.00 0.08 0.00 0.24 0.35 0.33 21.43 0.15 0.10 0.43 0.58 0.55 42.86 0.16 0.13 0.46 0.65 0.61 45.54 0.17 0.15 0.48 0.70 0.65 48.21 0.16 0.16 0.50 0.78 0.71 50.89 0.17 0.19 0.53 0.81 0.73 53.57 0.06 0.11 0.41 0.64 0.58 26.79 0.06 -0.05 0.17 0.25 0.17 0.00 0.11 0.05 0.33 0.50 0.44 26.79 0.17 0.00 0.53 0.87 0.76 53.57 0.16 0.21 0.56 0.89 0.80 56.25 0.17 0.22 0.58 0.94 0.83 58.93 0.17 0.24 0.63 1.00 0.89 61.61 0.17 0.26 0.66 1.05 0.92 64.29 0.05 0.20 0.56 0.94 0.83 42.86 0.04 0.09 0.44 0.72 0.64 21.43
Research project: ‘Cupolex floor:static behawiour analysis’ Pag. 34
0.09 -0.05 0.23 0.32 0.27 0.00 0.16 0.05 0.46 0.65 0.58 32.14 0.18 0.26 0.70 1.08 0.98 64.29 0.17 0.29 0.73 1.16 1.01 66.96 0.18 0.31 0.75 1.17 1.05 69.64 0.15 0.34 0.79 1.26 1.11 72.32 0.17 0.37 0.80 1.32 1.17 75.00 0.22 0.38 0.88 1.40 0.00 77.68 0.22 0.38 0.89 1.44 0.00 80.36 0.21 0.42 0.89 1.50 0.00 83.04 0.20 0.45 0.94 1.55 0.00 85.71 0.09 0.42 0.86 1.48 0.00 64.29 0.08 0.31 0.73 1.28 0.00 42.86 0.20 0.36 0.84 1.41 0.00 64.29 0.21 0.45 0.96 1.58 0.00 85.71 0.21 0.46 0.99 1.69 0.00 88.39 0.21 0.48 1.02 1.70 0.00 91.07 0.21 0.51 1.05 1.80 0.00 93.75 0.19 0.53 1.10 1.86 0.00 96.43 0.20 0.62 1.17 2.01 0.00 101.79 0.18 0.70 1.26 2.15 0.00 107.14 0.05 0.67 1.13 2.08 0.00 80.36 0.06 0.53 0.98 1.83 0.00 53.57 0.19 0.58 1.13 1.97 0.00 80.36 0.18 0.73 1.29 2.24 0.00 107.14 0.16 0.78 1.36 2.41 0.00 112.50 0.15 0.83 1.41 2.49 0.00 117.86 leggero calo di pres.0.12 0.93 1.50 2.74 0.00 123.21 0.07 1.05 1.63 2.96 0.00 128.57 0.04 1.12 1.72 3.21 0.00 133.93 0.01 1.24 1.82 3.40 0.00 139.29 0.00 1.33 1.91 3.59 0.00 144.64 -0.06 1.51 2.07 3.92 0.00 150.00 -0.11 1.60 2.18 4.22 0.00 155.36 -0.16 1.77 2.30 4.50 0.00 160.71 -0.24 2.00 2.44 4.91 0.00 166.07 calo di pres. 30 b
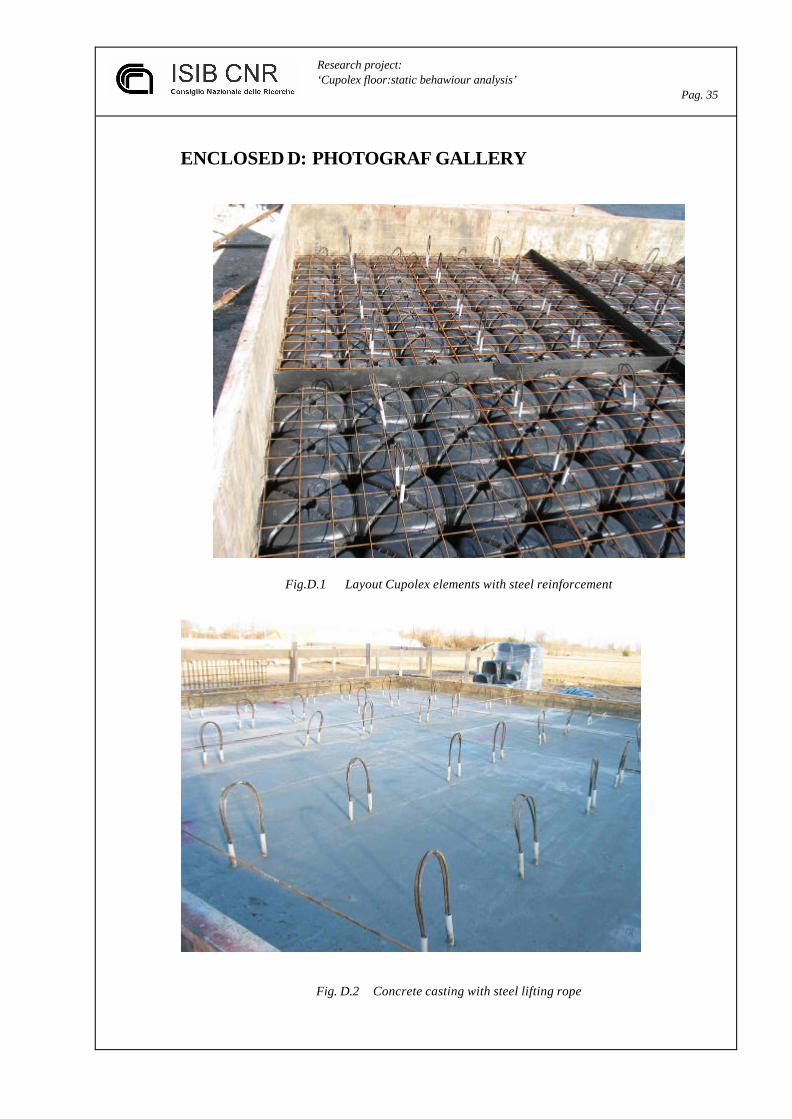
Research project: ‘Cupolex floor:static behawiour analysis’ Pag. 35
ENCLOSED D: PHOTOGRAF GALLERY
Fig.D.1 Layout Cupolex elements with steel reinforcement
Fig. D.2 Concrete casting with steel lifting rope
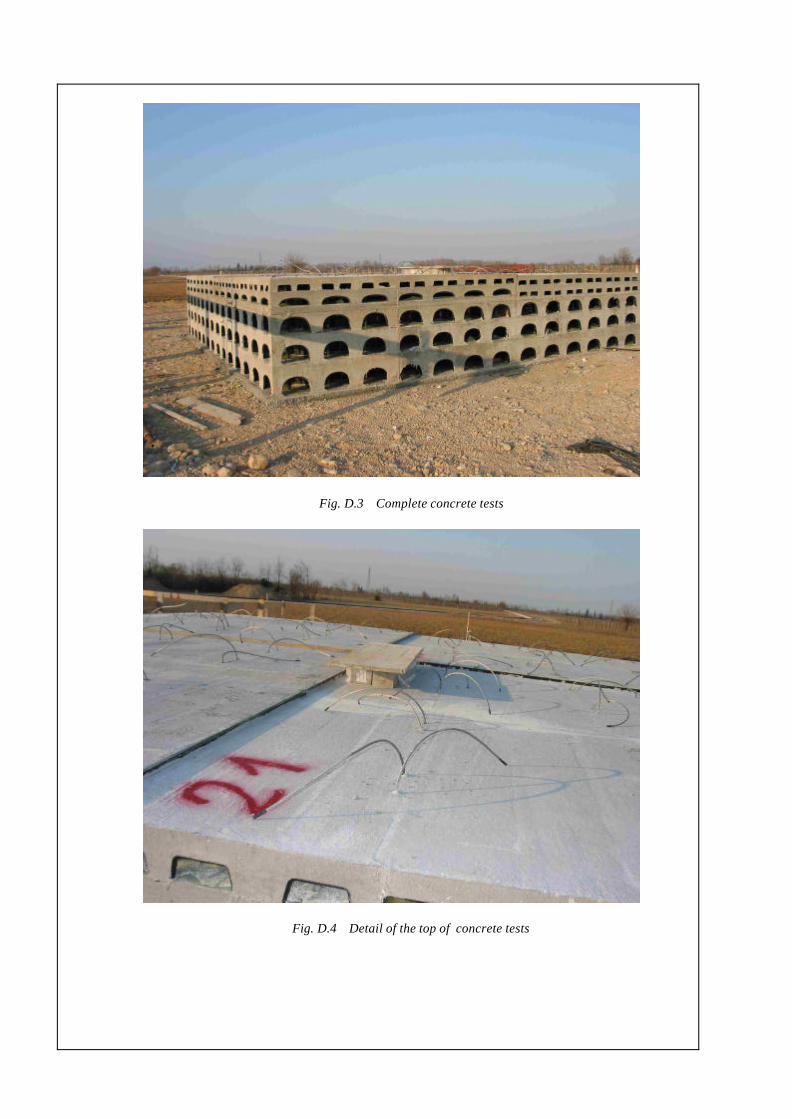
Fig. D.3 Complete concrete tests
Fig. D.4 Detail of the top of concrete tests
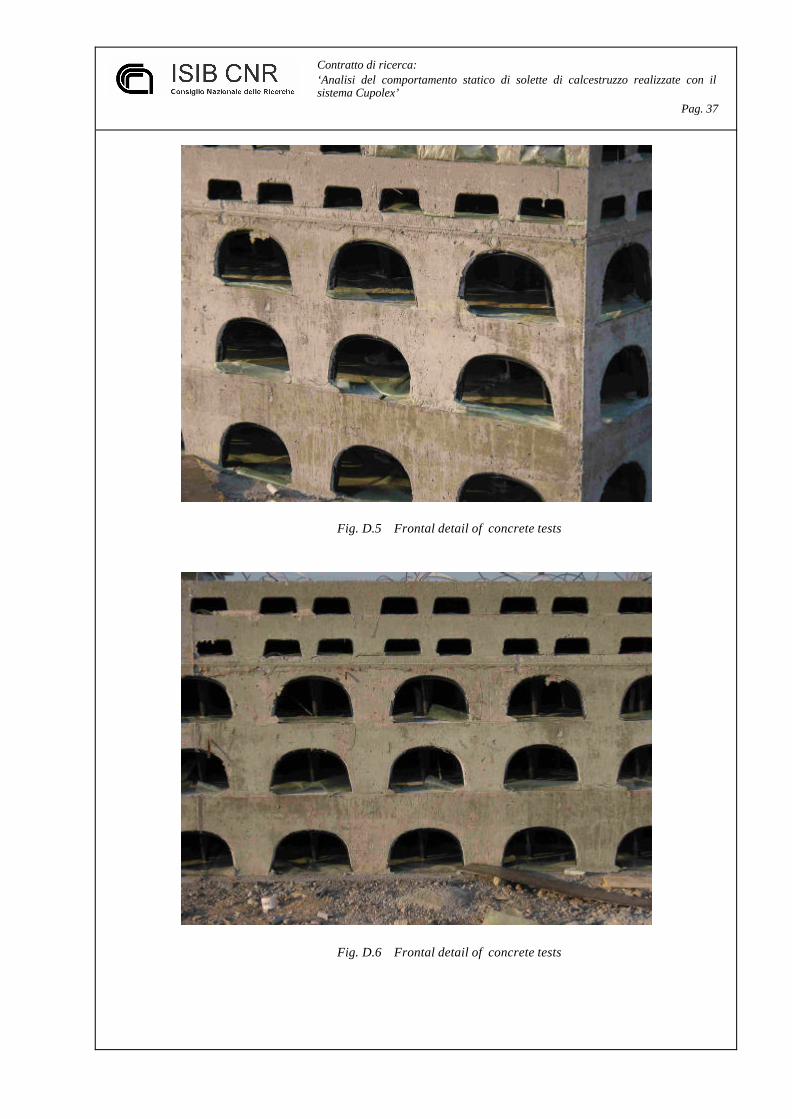
Contratto di ricerca: ‘Analisi del comportamento statico di solette di calcestruzzo realizzate con il sistema Cupolex’ Pag. 37
Fig. D.5 Frontal detail of concrete tests
Fig. D.6 Frontal detail of concrete tests

Contratto di ricerca: ‘Analisi del comportamento statico di solette di calcestruzzo realizzate con il sistema Cupolex’ Pag. 38
Fig. D.7 The preparing of the Natural soil test
Fig. D.8 Natural soil test
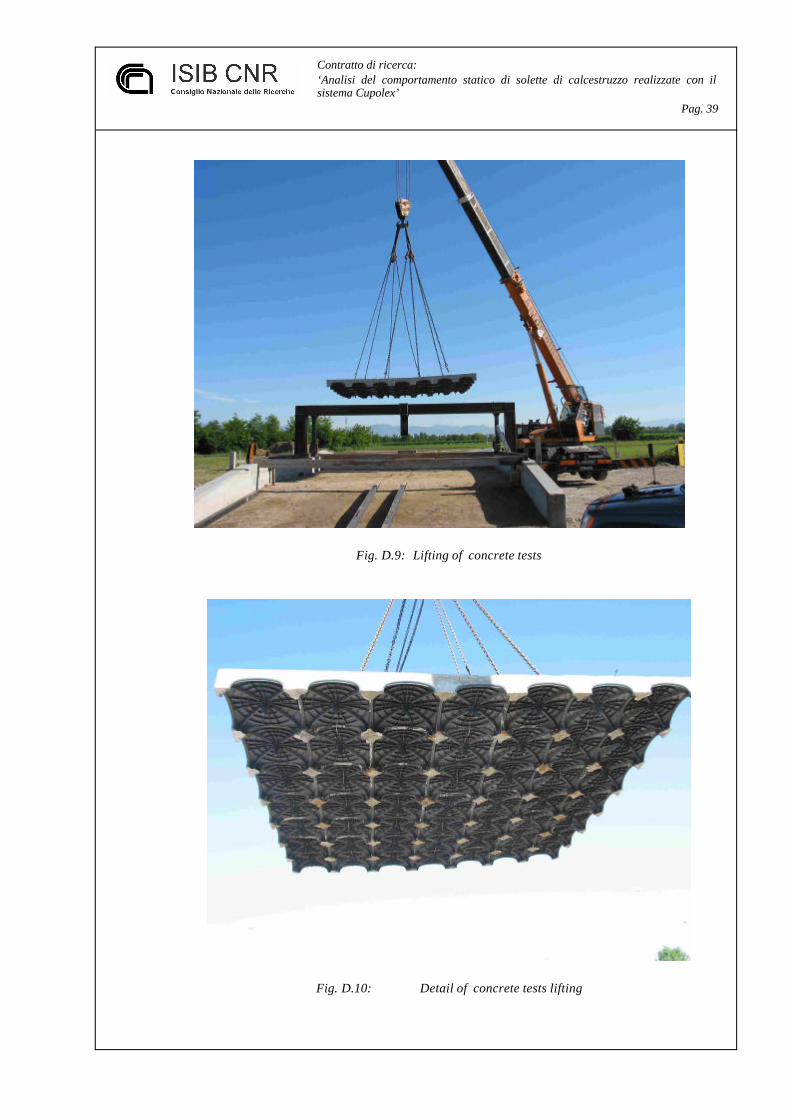
Contratto di ricerca: ‘Analisi del comportamento statico di solette di calcestruzzo realizzate con il sistema Cupolex’ Pag. 39
Fig. D.9: Lifting of concrete tests
Fig. D.10: Detail of concrete tests lifting

Contratto di ricerca: ‘Analisi del comportamento statico di solette di calcestruzzo realizzate con il sistema Cupolex’ Pag. 40
Fig. D.11 Crack line on the concrete test n°1
Fig. D.12 Crack line detail on the concrete test n°1
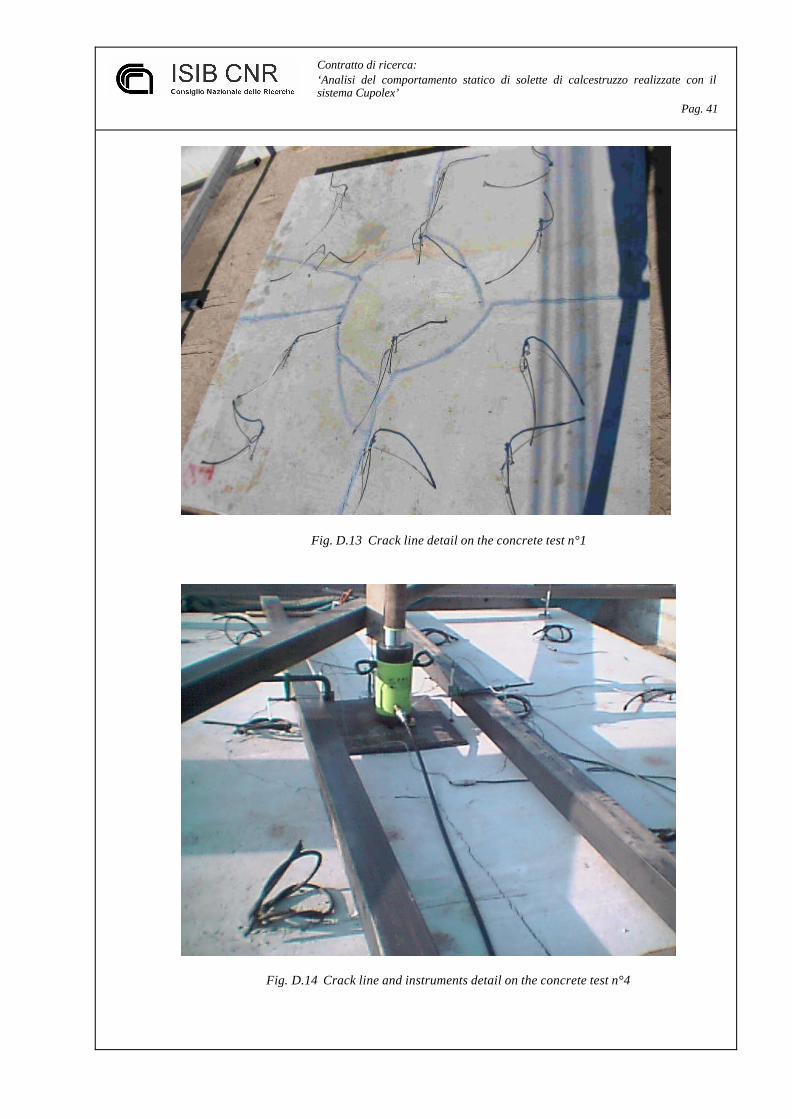
Contratto di ricerca: ‘Analisi del comportamento statico di solette di calcestruzzo realizzate con il sistema Cupolex’ Pag. 41
Fig. D.13 Crack line detail on the concrete test n°1
Fig. D.14 Crack line and instruments detail on the concrete test n°4

Contratto di ricerca: ‘Analisi del comportamento statico di solette di calcestruzzo realizzate con il sistema Cupolex’ Pag. 42
Fig. D.15 Prints on the soil of concrete test n°4
Fig. D.16 Instrument layout of concrete test n°6

Contratto di ricerca: ‘Analisi del comportamento statico di solette di calcestruzzo realizzate con il sistema Cupolex’ Pag. 43
Fig. D.17 Instrument layout of concrete test n°6
Fig. D.18 Crack line detail on the concrete test n°6

Contratto di ricerca: ‘Analisi del comportamento statico di solette di calcestruzzo realizzate con il sistema Cupolex’ Pag. 44
Fig. D.19 Details of lifting the column of the concrete test n°7
Fig. D.20 Crack line detail on the concrete test n°7

Contratto di ricerca: ‘Analisi del comportamento statico di solette di calcestruzzo realizzate con il sistema Cupolex’ Pag. 45
Fig. D.21 Punching Crack on the concrete test n°7
Fig. D.22 Concrete test n°11 on gravel subgrade

Contratto di ricerca: ‘Analisi del comportamento statico di solette di calcestruzzo realizzate con il sistema Cupolex’ Pag. 46
Fig. D.23 Details of lifting the column of the concrete test n°11
Fig. D.24 Instruments for the test
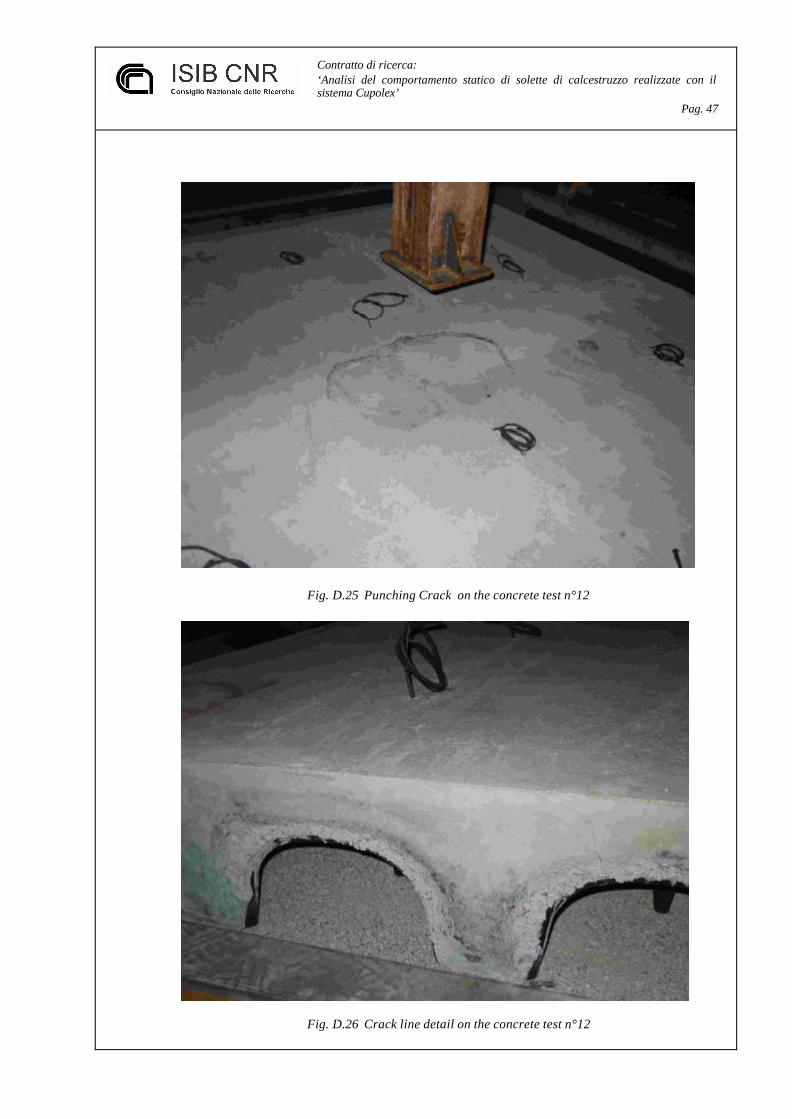
Contratto di ricerca: ‘Analisi del comportamento statico di solette di calcestruzzo realizzate con il sistema Cupolex’ Pag. 47
Fig. D.25 Punching Crack on the concrete test n°12
Fig. D.26 Crack line detail on the concrete test n°12

Contratto di ricerca: ‘Analisi del comportamento statico di solette di calcestruzzo realizzate con il sistema Cupolex’ Pag. 48
Fig. D.27 Layout tests Cupolex-slab
Fig. D.28 Crack line on the concrete slab
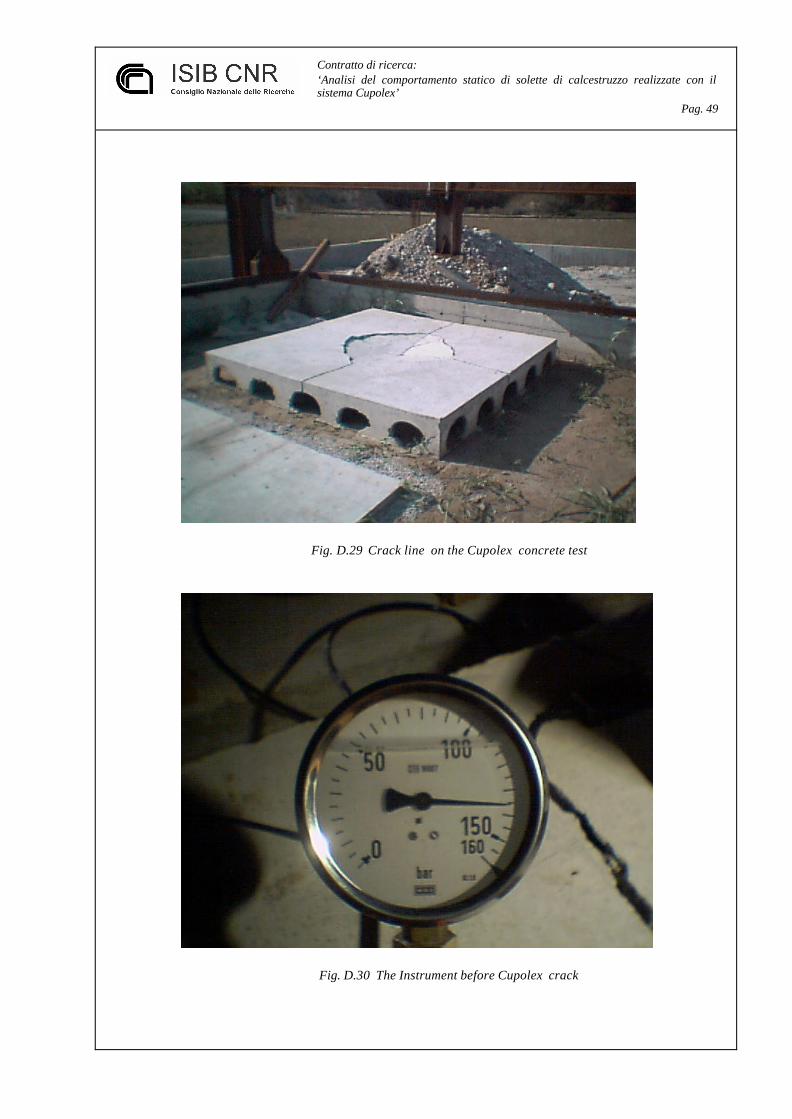
Contratto di ricerca: ‘Analisi del comportamento statico di solette di calcestruzzo realizzate con il sistema Cupolex’ Pag. 49
Fig. D.29 Crack line on the Cupolex concrete test
Fig. D.30 The Instrument before Cupolex crack
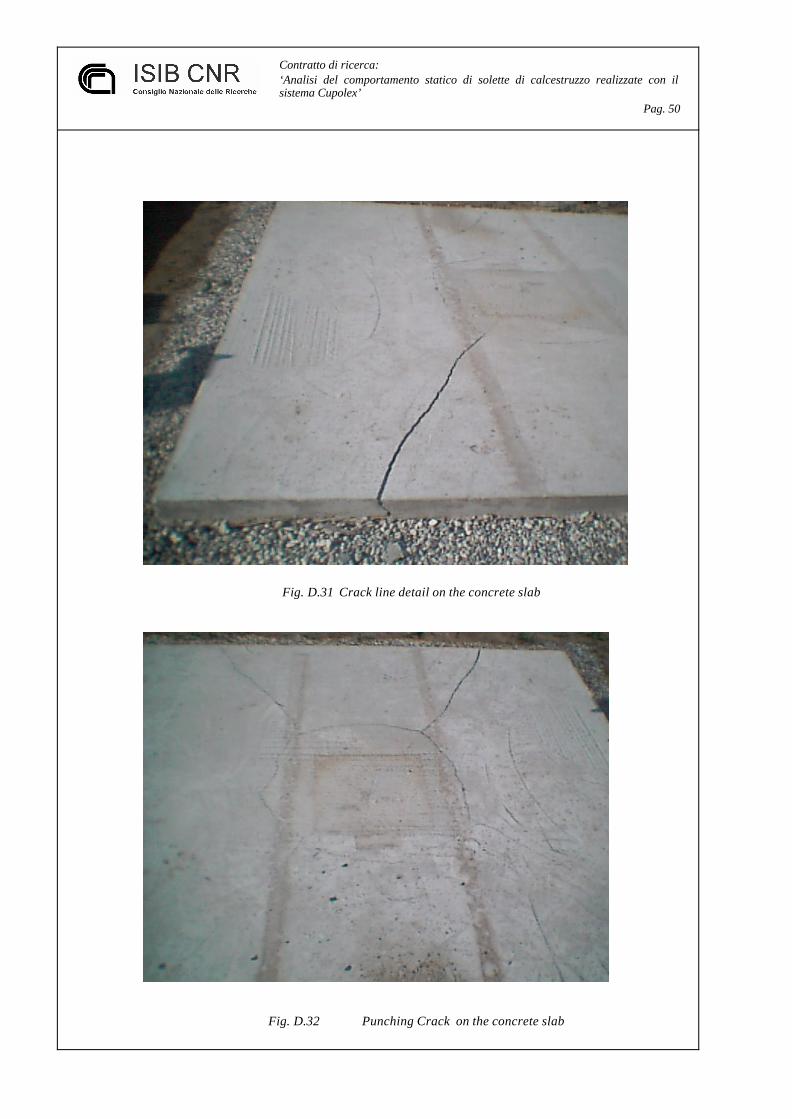
Contratto di ricerca: ‘Analisi del comportamento statico di solette di calcestruzzo realizzate con il sistema Cupolex’ Pag. 50
Fig. D.31 Crack line detail on the concrete slab
Fig. D.32 Punching Crack on the concrete slab


