
Corridor Performance Measurement and
Monitoring
Wang HongAlmaty Regional Office
Asian Development Bank
OSCE-UNECE Group of Experts: 6th SessionOn Euro-Asian Transport LinksAlmaty, 5-7 July 2011

2
Background
� Integrated Trade Facilitation
� Joint Transport and Trade Facilitation Strategy and Action Plan in 2007 and 2008
� Corridors, Investments, and Technical Assistance
� Corridor Performance Measurement Monitoring (CPMM)
� CAREC Results Framework
� Border Crossing Point Improvement and Single Window Development (Regional Improvement in Border Services) Project
� National and Regional Joint Transport and Trade Facilitation Committees

3
Corridors

4
� Transport time on Corridors 4 and 6 are volatile, making it hard to predict actual time of arrival.
I. Corridor Performance
� For road transport, travelling on Corridor 5 is fastest while travelling on Corridor 4 is the slowest
Findings
� In terms of costs incurred in transit, corridor 5 is the least expensive while Corridor 6 is the most expensive.

5
TIME CONSUMING ACTIVITIESROAD TRANSPORT RAIL TRANSPORT
1. Customs escort/convoy 1. Change of railways gauge
2. Waiting time in queue 2. Waiting time in queue
3. Loading/unloading 3. Railways security
II. Border Crossing Activities
Border crossing activities tend to reduce speed by half in most corridors.
Findings

6
MOST COSTLY ACTIVITIESROAD TRANSPORT RAIL TRANSPORT
1. Trans-shipment 1. Change of railways gauge
2. Loading and Unloading 2. Loading and Unloading
3. Customs Clearance 3. Trans-shipment
III. Costs and Overheads
When transporting a 20–ton cargo over 500km, a significant part of transport
cost is spent on border crossing activities.
Unofficial payments are common. The top five activities involving unofficial payments are police checkpoints,
border security control, customs clearance, transport/ GAI inspection and phytosanitary inspections.
Findings

7
0
1,000
2,000
3,000
4,000
5,000
6,000
7,000
Co
un
t
Policecheckpoint
Border security Customsclearance
Transport/GAIinspection
Phytosanitary
Top Five ActivitiesInvolving
Unofficial Payments
Official
Unofficial
Findings
8
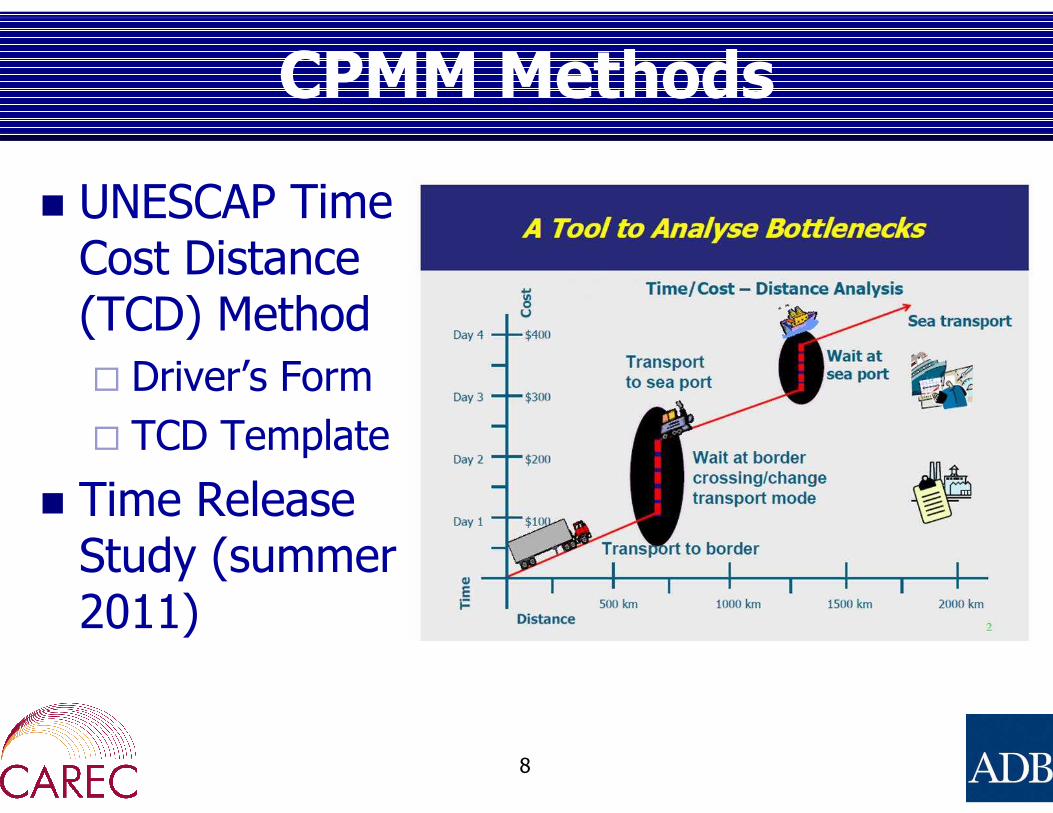
CPMM Methods
� UNESCAP Time Cost Distance (TCD) Method
� Driver’s Form
� TCD Template
� Time Release Study (summer 2011)

9
Institutional Arrangement
� Memoranda of Understanding with partner freight forwarders associations and road carrier associations
� ADB covers operational and capacity building costs
� Frequency of Collection
� Average 30 TCDs/partner association/month

10
Partner Associations
� 14 Partner Associations
−Representing 8 of 10 CAREC countries
−Afghanistan (1)
−Azerbaijan (1)
−Kazakhstan (2)
−Kyrgyz Republic (2)
−Mongolia (2)
−People’s Republic of China (Xinjiang Uyghr and Inner Mongolia Autonomous Regions) (3)
−Tajikistan (1)
−Uzbekistan (2)
� Members of the CAREC Federation of Carrier and Forwarder Associations (CFCFA)
� Cooperation with International Road Union (IRU)

11
Analysis and Reporting
� Data and statistical analyses are performed by ADB
� Reports are posted on CAREC Institute and CFCFA websites (http://www.carecinstitute.org
and http://cfcfa.net); the annual report is presented at the Ministerial Conference
� Partner associations will be trained to perform national level data analysis

12
2010 DataNumber of observations by mode of
transport
Road, 2,971 , 73%
Rail, 771 , 19%
Multimodal, 320 , 8%
Domestic, 960 , 24%
Cross-border, 3,102 , 76%
3.0%
3.1%
3.7%
4.0%
4.3%
4.8%
5.7%
5.7%
8.0%
8.9%
11.2%
17.9%
19.7%
0% 5% 10% 15% 20% 25%
Stone
Wood
Building materials
Mineral Products
Others
Products of Chemical or Allied Industries
Prepared Foodstuffs…
Metals
Consolidated goods
Textiles
Vegetable Products
General merchandise
Machinery, Mechanical Appliances
Number of observations by scope of transport
Type of goods transported by road

0.2
0.2
0.3
0.4
0.6
0.7
0.8
0.8
0.9
0.9
0.9
0.9
1.0
1.8
2.7
3.8
4.2
11.5
0 2 4 6 8 10 12 14
Detour
Transhipment
Environment/ecology checkpoint
Visa / immigration
Transport/GAI inspection
Other activities
Veterinary inspection
Weight/standard inspection
Health / quarantine
Phytosanitary
Police checkpoint / stop
Vehicle registration
Border security / control
Repair / tire replacement
Customs clearance
Loading / unloading
Waiting/ queue
Escort / convoy
13
Time/Speed
Road Speed in kph, delay in %
41.348.0 51.0
41.431.6
54.5
17.6 16.4 13.3 12.519.7 19.6
-57%-66% -74% -70%
-38%
-64%
-60
-40
-20
0
20
40
60
80
1 2 3 4 5 6
Speed without Delay Speed with Delay Delay (%)
Average duration of road activities (hours per 500 km)

14
Road Transport Costs
Cost of cargo transported by road (US$ per 20tons/500km)
Cost of road activities (US$ per 500 km)

15
Unofficial Payments
Activity Official Unofficial
Stops Count Percent Count Percent*
Environment/ecology checkpoint 295 94 31.9% 201 68.1% Transport/GAI inspection 2,998 1,134 37.8% 1,864 62.2% Police checkpoint / stop 11,202 4,483 40.0% 6,719 60.0% Border security / control 4,899 2,031 41.5% 2,868 58.5% Weight/standard inspection 2,343 990 42.3% 1,353 57.7% Phyto-sanitary 3,900 2,073 53.2% 1,827 46.8% Customs clearance 6,034 3,250 53.9% 2,784 46.1% Health / quarantine 3,311 1,853 56.0% 1,458 44.0% Vehicle registration 2,250 1,318 58.6% 932 41.4% Veterinary inspection 2,468 1,468 59.5% 1,000 40.5% Visa / immigration 765 570 74.5% 195 25.5% Repair / tire replacement 344 279 81.1% 65 18.9% Escort / convoy 51 45 88.2% 6 11.8% Loading / unloading 3,716 3,435 92.4% 281 7.6% Detour 67 65 97.0% 2 3.0% Waiting/ queue 4,415 4,386 99.3% 29 0.7% Trans-shipment 56 56 100.0% 0 0.0%
Unofficial Payments in Road Transport

16
Border Crossing Points
� BCPs are major bottlenecks
� Border Crossing Point and Single Window Development (Regional Improvement in Border Services – RIBS – Project)
� A regional loan is being formulated to improve border crossing points and help facilitate regional connectivity of single windows

17
Concluding Remarks
• Trade facilitation initiatives such as BCP infrastructure improvement, Customs Modernization, single window facilities can reduce delay and cost significantly along corridors
− Singapore reduced turn around time from 3-4 days to 15 minutes; from 24 forms to 1 form once they introduced automated system
− Average processing time at AZE BCPs were reduced from 4 days to 3 hours; forms from 40 pages to 2 pages after they adopted their single window
• Rich data from CPMM allows CAREC to conduct detailed analysis
18
Recommendations
• Improve INFRASTRUCTURE and rolling stock/vehicles
• Improve OPERATIONS at Border Crossing Points by minimizing or eliminating regulatory barriers and burdensome procedures
• Use TECHNOLOGY to make more predictable freight arrival times

19
Thank you/Спасибо
Wang Hong
Principal Regional Cooperation Specialist
Kazakhstan Resident Mission—Almaty
Tel: +7 727 3300 962
Fax: +7 727 3300 954
Email: [email protected]


