
Copyright © 2006 Global Insight, Inc.
Outlook and Risks for
The U.S. and Global Economies
Nariman Behravesh
Chief Economist
Canadian Teleconference
March 14, 2006

Copyright © 2006 Global Insight, Inc. 2 03/2006
Outline of the Presentation
Storm CloudsHigh Oil PricesHousing BubblesGrowth and Policy ImbalancesSavings “Glut”/ Investment “Dearth”
Global OutlookRelatively Clear Sailing for Another Year or Two,
Despite Serious Structural Problems
What Would It Take to Trigger a Recession?

Copyright © 2006 Global Insight, Inc.
Storm Clouds

Copyright © 2006 Global Insight, Inc. 4 03/2006
Why Oil Prices Will Stay High in the Near-Term ...But Are Not A Problem
Oil Prices Will Stay High in the Near-Term Because of Robust energy demand growth Relatively modest investment in exploration and drilling High vulnerability to (and fears of) supply disruptions No shortage of potential risks (rebel activity in Nigeria, sabotage in Iraq, nuclear
standoff with Iran) So, the risks are overwhelmingly on the upside for oil prices
Why Near-Record High Energy Prices Are Not a Problem—Yet High prices are demand driven, and growth momentum is strong Petro dollars quickly recycled through investments and financial flows Zero inflationary pressures thanks to increased global competition Prudent monetary policies induce stable inflation expectations Higher energy efficiency in most industrial economies Energy subsidies in emerging markets cushions higher costs Inflation-adjusted prices are still below their early 1980s peaks

Copyright © 2006 Global Insight, Inc. 5 03/2006
(U.S. dollar per barrel, WTI)
Oil Prices Have Tripled Since 2002…
15
30
45
60
75
2002 2003 2004 2005 2006 2007
Oil Prices

Copyright © 2006 Global Insight, Inc. 6 03/2006
In the Longer Term, the Risks for Oil Prices Are Mostly on the Downside
The longer oil prices stay high, the greater the likelihood of a crash
Oil is behaving like any other commodity
In the long run, current constraints on oil markets will not be binding (e.g. OPEC’s cartel power) — technology always comes to the rescue
Supply and demand responses to high prices are always large (in time)
Technology will reduce the dependence on oil and make alternate fuels more viable
New technologies will also likely “solve” China’s and India’s expected surge in energy demand

Copyright © 2006 Global Insight, Inc. 7 03/2006
0.4
0.6
0.8
1.0
1.2
1.4
1.6
1.8
1983 1985 1987 1989 1991 1993 1995 1997 1999 2001 2003 2005
0
10
20
30
40
50
60
70
Nonferrous Metals (Left scale) Crude Oil (Right scale)
(1994-95=1.0)
With OPEC Surplus Gone, Oil Is Now Just Another Cyclical Commodity
(WTI, $/barrel)

Copyright © 2006 Global Insight, Inc. 8 03/2006
How Big of a Threat Is Housing?
Since 1997, house prices have risen 170% in Spain, 160% in the U.K., 120% in Australia, 80% in the U.S., and 50% in Canada
While there is no national U.S. bubble, a few regional markets (the Boston to Washington corridor, Florida, and California) have valuations that are much higher than market fundamentals
The global rise in home prices has been driven by the fall in long-term interest rates
If national house prices fall by 10%, real GDP growth could be cut by 1% to 2%
While such a scenario may not happen at the national level, it could easily happen in regional housing markets

Copyright © 2006 Global Insight, Inc. 9 03/2006
Global Imbalances
Growth and Policy ImbalancesOutput gaps—divergent trends across the world Policies—U.S. too loose, Eurozone and Japan too tight Near-term growth—domestic-led in the U.S., export-led in the
rest of the worldLonger-term growth—lopsided, only 1.5% to 2% in Europe and
Japan
“Glut” of Savings or “Dearth” of Investment?The savings glut—a major factor behind falling global long-term
bond yields over the past 15 years Too little investment relative to saving in emerging marketsToo little saving relative to investment in the U.S.While this “imbalance” is unlikely to persist in the long term, it will
probably go on for some time, because it is mutually beneficial

Copyright © 2006 Global Insight, Inc.
Global Outlook: Relatively Clear Sailing for Another
Year or Two, Despite Serious Structural Problems

Copyright © 2006 Global Insight, Inc. 11 03/2006
(Real GDP, percent change)
Growth in the World Economy
0
1
2
3
4
5
1990 1992 1994 1996 1998 2000 2002 2004 2006 2008 2010

Copyright © 2006 Global Insight, Inc. 12 03/2006
Growth Remains Very Uneven Across the World
(Real GDP, percent change)
0.0
1.5
3.0
4.5
6.0
7.5
NAFTA OtherAmericas
WesternEurope
EmergingEurope
Japan OtherAsia
MiddleEast
Africa
2004 2005 2006 2007

Copyright © 2006 Global Insight, Inc. 13 03/2006
World Growth Contributions 2000–2005
(Percent)
Asia-Pacific 34
China 14
India 5
Japan 5
United States 30
Western Europe 16

Copyright © 2006 Global Insight, Inc. 14 03/2006
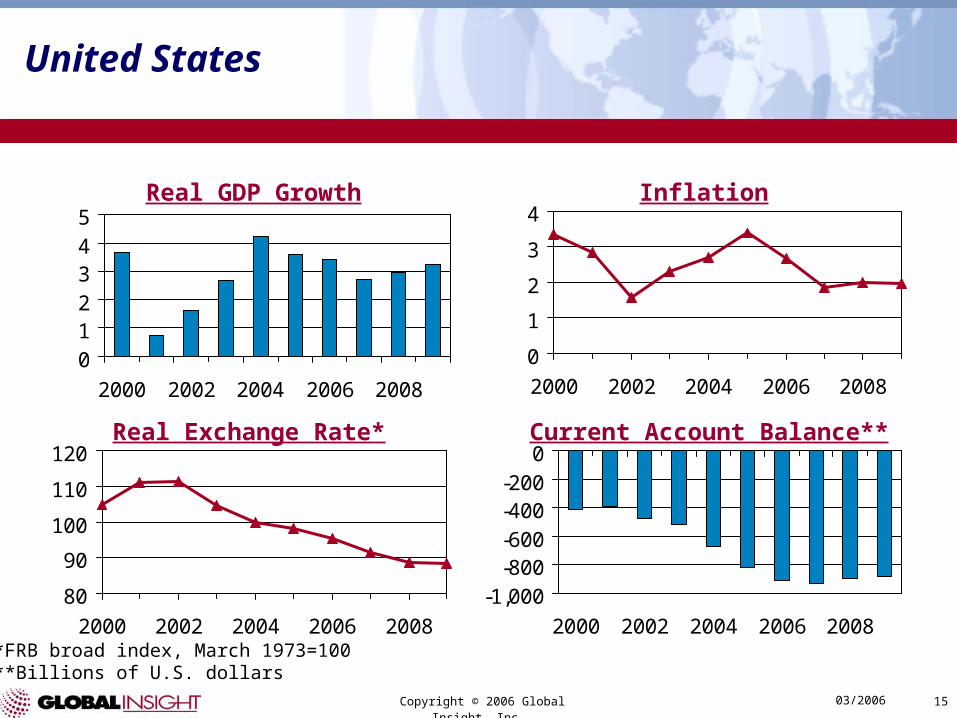
United States
A Strong Dynamic Locomotive, or… The resilience of the U.S. economy in the face of repeated shocks
has been remarkable Above average productivity growth Strong growth in exports and capital spending will offset weaker
consumer and government spending The U.S. budget deficit is a manageable problem Global savings flows into the U.S. are financing global
growth, and not American profligacy
… An Accident Waiting to Happen? The U.S. is vulnerable to higher inflation and higher interest rates Not enough of the global savings that flows into the U.S. has gone into
productive investments The U.S. is becoming increasingly vulnerable to shifts in portfolio
re-allocations
Bottom Line While the ever-growing U.S. imbalances are not sustainable in the medium
to long term, a painful unwinding is far from inevitable, given the American economy’s strong growth potential and resilience
Copyright © 2006 Global Insight, Inc. 15 03/2006
-1,000-800-600-400-200
0
2000 2002 2004 2006 2008
United States
80
90
100
110
120
2000 2002 2004 2006 2008
0
1
2
3
4
2000 2002 2004 2006 2008012345
2000 2002 2004 2006 2008
Real GDP Growth Inflation
Real Exchange Rate* Current Account Balance**
*FRB broad index, March 1973=100**Billions of U.S. dollars

Copyright © 2006 Global Insight, Inc. 16 03/2006
0
1
2
3
4
5
6
7
1999 2000 2001 2002 2003 2004 2005 2006 2007
Federal Funds 2-Year Treasury Yield 10-Year Treasury Yield
(Percent)
The Fed Has More Work to Do

Copyright © 2006 Global Insight, Inc. 17 03/2006
0 30 60 90 120 150
Italy
France
Germany
United States
Canada
United Kingdom
Japan
1991 2003
Is the U.S. Household Sector Profligate?(Household Debt as a Share of Disposable Income)
(Percent of disposable income)
Source: OECD

Copyright © 2006 Global Insight, Inc. 18 03/2006
Low Saving Rates — Not Just in the U.S.
-10
-5
0
5
10
15
1987 1989 1991 1993 1995 1997 1999 2001 2003
Australia New Zealand Canada United States
(Percent)

Copyright © 2006 Global Insight, Inc. 19 03/2006
A Low U.S. Saving Rate Limits the Recovery in Household Net Worth
-2
0
2
4
6
8
10
12
1980 1984 1988 1992 1996 2000 2004 2008
3.6
4.0
4.4
4.8
5.2
5.6
6.0
6.4
Saving Rate Household Net Worth/Disposable Income
(Percent of disposable income) (Ratio to disposable income)
Copyright © 2006 Global Insight, Inc. 20 03/2006
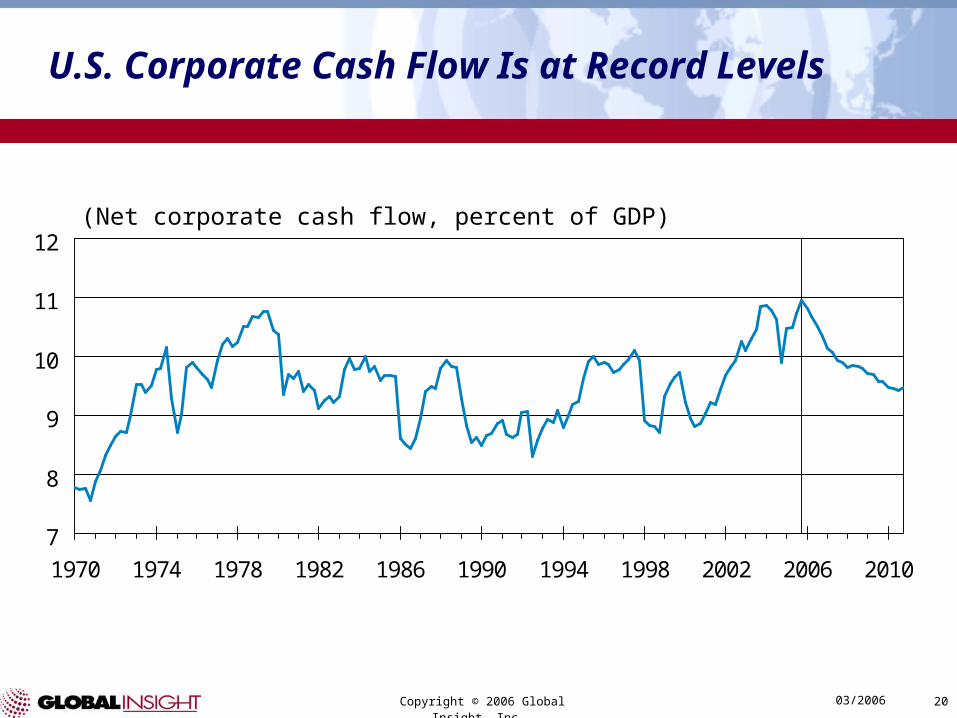
U.S. Corporate Cash Flow Is at Record Levels
(Net corporate cash flow, percent of GDP)
7
8
9
10
11
12
1970 1974 1978 1982 1986 1990 1994 1998 2002 2006 2010

Copyright © 2006 Global Insight, Inc. 21 03/2006
-600
-450
-300
-150
0
150
300
1980 1983 1986 1989 1992 1995 1998 2001 2004 2007 2010 2013
-6.0
-4.5
-3.0
-1.5
0.0
1.5
3.0
Unified Budget Deficit Deficit as % of GDP
The Federal Budget Deficit
(Billions of dollars, fiscal years) (Percent of GDP)

Copyright © 2006 Global Insight, Inc. 22 03/2006
0 30 60 90 120 150 180
United Kingdom
United States
Canada
Eurozone
Japan
1991 2004
Is the U.S. Public Sector Profligate?
Source: OECD
(Public debt as a share of GDP)

Copyright © 2006 Global Insight, Inc. 23 03/2006
The “Twin Deficits”
-7.5
-6.0
-4.5
-3.0
-1.5
0.0
1.5
3.0
1980 1983 1986 1989 1992 1995 1998 2001 2004 2007 2010
U.S. Federal Deficit to GDP Current Account Deficit as % of GDP

Copyright © 2006 Global Insight, Inc. 24 03/2006
Europe
A Source of Stability, or… Not one Europe, but many Europe is a savings surplus region, which should help it in a crisis (e.g.
an oil shock) Inflationary pressures may be more muted than in the U.S. European companies have done better than European economies
…Dangerous Stagnation? Macro policies are (still) too restrictive Recent political turmoil has more to do with weak growth
than fears of globalization and enlargement Declining productivity growth and growing output gaps
are serious political and economic threats Rising youth unemployment and low labor force participation will
increase political tensions and worsen the pensions burden Budget challenges are more daunting than the U.S. given
lower trend growth, more rapidly aging populations, and higher tax rates
Bottom Line While the doom and gloom about Europe has undoubtedly been
overdone, it faces much bigger challenges than the U.S.

Copyright © 2006 Global Insight, Inc. 25 03/2006
-60-30
0306090
2000 2002 2004 2006 2008
Eurozone
0.5
0.7
0.9
1.1
1.3
2000 2002 2004 2006 2008
1.5
1.8
2.1
2.4
2.7
2000 2002 2004 2006 20080
1
2
3
4
2000 2002 2004 2006 2008
Real GDP Growth Inflation
Exchange Rate per US$* Current Account Balance**
*Year-end**Billions of U.S. dollars

Copyright © 2006 Global Insight, Inc. 26 03/2006
Japan
Is it Different This Time, or… Japan has come a long way in cleaning up its banking system and
restructuring its corporate balance sheets Macro policies have been better than in Europe (at least recently) Proximity to China has helped Domestic demand is growing—albeit slowly Top-100 firms continue to do well
…Is This Just Another False Dawn? Highest debt levels (public and private) among the industrialized
economies One of the most rapidly aging populations—in 2005 population
actually decreased Saving and investment ratios have been falling Deflation has not yet been eliminated
Bottom Line While Japan will probably not suffer another relapse soon, and short-
term prospects are better than in Europe, long-term prospects are problematic

Copyright © 2006 Global Insight, Inc. 27 03/2006
Japan
050
100150200250
2000 2002 2004 2006 2008
75
90
105
120
135
2000 2002 2004 2006 2008
-2-10123
2000 2002 2004 2006 20080.00.51.01.52.02.53.0
2000 2002 2004 2006 2008
Real GDP Growth Inflation
Exchange Rate per US$* Current Account Balance**
*Year-end**Billions of U.S. dollars

Copyright © 2006 Global Insight, Inc. 28 03/2006
Asia
Independent Engine of Growth, or… Domestic demand in much of Asia has contributed to growth
(investment-driven in China, consumption driven in South Korea) Monetary and fiscal policies have been largely supportive of growth Inflation remains low (except in India) High oil prices have done limited damage in a few economies
(e.g. South Korea and Taiwan)
…Still Too Dependent on the U.S.? Either directly or indirectly (through China), exports still play a big role
in growth Rates of investment are too low (except for China) for economies that
are growing rapidly By preventing their exchange rates from appreciating, the Asian
economies have become part of the “global imbalance problem”
Bottom Line Asian Economies will continue to be the star performers of the world
economy, but will have to wean themselves off their “addiction” to U.S. consumer spending

Copyright © 2006 Global Insight, Inc. 29 03/2006
Real GDP Growth in Asian Economies
0
2
4
6
8
10
12
China South Korea India Taiwan Hong Kong
2004 2005 2006 2007
(Percent change)

Copyright © 2006 Global Insight, Inc. 30 03/2006
0
2
4
6
8
10
Australia Indonesia Singapore Malaysia Philippines
2004 2005 2006 2007
(Percent change)
Real GDP Growth in Asian Economies

Copyright © 2006 Global Insight, Inc.
What Would it Taketo
Trigger a Recession?

Copyright © 2006 Global Insight, Inc. 32 03/2006
No Recession in the Next Couple of Years, Without the Convergence of Two or More Big Shocks
The resilience of the U.S. and world economies allowed them to withstand a number of sizeable shocks in 2005One of the worst tsunamis on recordOne of the worst hurricanes on recordRecord-high oil prices
What would it take to trigger a recession?Oil prices over $100A wage price spiralA 300 basis point rise in long-term interest ratesA 10% drop in house prices
Fortunately, the risk of a recession in the next two years is less than 20%

Copyright © 2006 Global Insight, Inc. 33 03/2006
Recession Scenario — Oil Prices
25
50
75
100
125
2005 2006 2007 2008 2009 2010 2011 2012
World Recession Scenario Baseline
(U.S. dollar per barrel)

Copyright © 2006 Global Insight, Inc. 34 03/2006
Recession Scenario — House Prices
2006 2007–25
Great Britain -5.00 -10.00
Spain -5.00 -10.00
Australia -5.00 -10.00
France -5.00 -10.00
Italy -5.00 -10.00
United States -5.00 -10.00
Canada -5.00 -10.00
(Percent deviation)

Copyright © 2006 Global Insight, Inc. 35 03/2006
Recession Scenario — Real GDP Growth
0.00.51.01.52.02.5
2006 2008 2010 2012
1
2
3
4
5
2006 2008 2010 20121
2
3
4
5
2006 2008 2010 2012
(Percent change)World
4.5
6.0
7.5
9.0
10.5
2005 2007 2009 2011
United States
Japan China
World Recession Scenario BaselineSource: Global Insight Global Scenario Model

Copyright © 2006 Global Insight, Inc. 36 03/2006
Recession Scenario — Real GDP Growth
0.51.01.52.02.53.0
2006 2008 2010 2012
0.5
1.0
1.5
2.0
2.5
2006 2008 2010 20120
1
2
3
4
2006 2008 2010 2012
(Percent change)United Kingdom
-1
0
1
2
3
2006 2008 2010 2012
Germany
France Italy
Source: Global Insight Global Scenario ModelWorld Recession Scenario Baseline

Copyright © 2006 Global Insight, Inc. 37 03/2006
Conclusions
Higher oil prices are not a serious threat—yet Some housing bubbles are deflating—recessions will probably not follow The short- and long-term growth imbalances are a major source of
concern The savings “glut” is less of a threat than the “dearth” of investment The U.S. and China will remain the primary engines of growth for the next
year or two No recession likely in 2006, or even 2007 What could trigger a recession? A combination of:
Much higher energy prices — but not alone Rising inflation expectations Sharply higher interest rates Big drops in house prices Timing: No earlier than 2007 Probability: No more than 20%

Copyright © 2006 Global Insight, Inc.
Canadian Economic Performanceand Fiscal Policy Issues
Dale Orr
Canadian Macroeconomic Services
Global Insight

Copyright © 2006 Global Insight, Inc. 39 03/2006
Outline
1. Canada’s Economic Performance: How Are We Doing?
2. What Can We Expect In Budget 2006?
3. Conclusions
Copyright © 2006 Global Insight, Inc. 40 03/2006
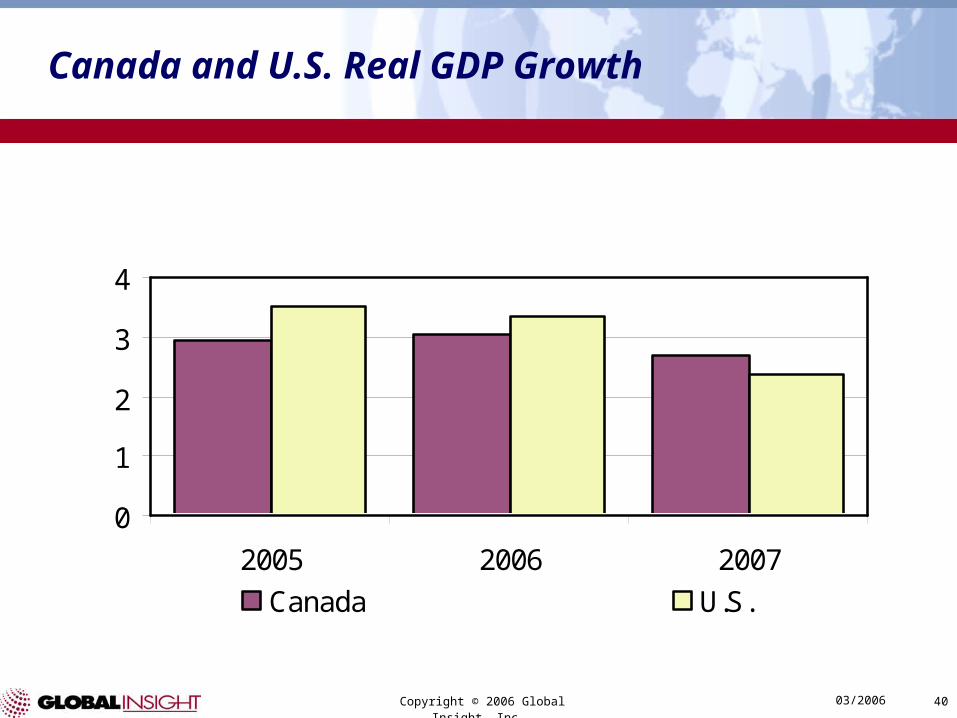
Canada and U.S. Real GDP Growth
0
1
2
3
4
2005 2006 2007
Canada U.S.
Canada Decent, But Falling Short of the U.S.(Percent)

Copyright © 2006 Global Insight, Inc. 41 03/2006
Canada: Unemployment Rate
6.5
7.5
8.5
9.5
10.5
11.5
1993
1995
1997
1999
2001
2003
2005
2007
Unemployment Rate: Falling For A Decade(Percent)

Copyright © 2006 Global Insight, Inc. 42 03/2006
Canada: Inflation
0
1
2
3
05Q
1
05Q
2
05Q
3
05Q
4
06Q
1
06Q
2
06Q
3
06Q
4
07Q
1
07Q
2
07Q
3
07Q
4
Benefitting From The GST Cut This Year(CPI, year-over-year percent change)

Copyright © 2006 Global Insight, Inc. 43 03/2006
Canadian Dollar
6064687276808488
02Q
1
02Q
3
03Q
1
03Q
3
04Q
1
04Q
3
05Q
1
05Q
3
06Q
1
06Q
3
07Q
1
07Q
3
Canadian Dollar Will Level Off Now(U.S. cents)

Copyright © 2006 Global Insight, Inc. 44 03/2006
Nominal GDP
1563
14281496
14491498
1560
1000
1100
1200
1300
1400
1500
1600
2006 2007 2008
Econ. Stat. Nov 05 March 06
The "Tax Base" Up Slightly Since Economic Statement (Billions of Dollars)

Copyright © 2006 Global Insight, Inc. 45 03/2006
Issues in Budget 2006
● Balanced Budget Every Year
● Reduce GST
● Financing GST Reduction by PIT Rollbacks
● Capital Gains
● Child Care
● Spending Plans

Copyright © 2006 Global Insight, Inc. 46 03/2006
The Plan For Program Spending
187.2
172.2 171.6170.7
189.6184.7
160165
170175180185
190195
2006/07 2008/09
1. Econ Stat Nov 05 2. Liberal Election Plan Jan 06
3. Conservative Plan Jan 06
Conservative Program Spending Plan in Perspective(Billions of dollars)

Copyright © 2006 Global Insight, Inc. 47 03/2006
Forecast Surpluses
1.7
4.7 5.0
0.0
1.0
2.0
3.0
4.0
5.0
6.0
2006/07 2007/08 2008/09
Small "Surpluses" Forecast by Conservatives Fiscal Plan(Billions of Dollars)

Copyright © 2006 Global Insight, Inc. 48 03/2006
Challenges Beyond Budget 2006
● Fiscal Imbalance
● BPA to $10,000 by 2009
● GST to 5% Over Five Years
Copyright © 2006 Global Insight, Inc. 49 03/2006
Conclusions
● Canadian Economy: The Canadian Economy is in solid shape relative to historical performance, as well as relative to other developed countries. However, growth in Canada has been a shade weaker than in the U.S. in recent years, and that will continue this year.
● Budget 2006: Budget 2006 in April will provide the promised reduction in the GST and a balanced budget every year. Financing these key objectives will be a political challenge and leave little flexibility to make progress towards other objectives, in spite of a slightly stronger economic outlook.
● Finance Minister Flaherty will have little flexibility over the next few years. There will be limited opportunities for any new tax reduction initiatives.

Copyright © 2006 Global Insight, Inc.
Canada: Prepare for the Long-Term Slowdown
Wojciech Szadurski
Senior Economist
Canadian Macroeconomic Service
March 14, 2006

Copyright © 2006 Global Insight, Inc. 51 03/2006
3% Growth Has Been the Norm
Real GDP growth bounced around 3%:Bank of Canada’s
estimate of potential.
Population growth was around 1%.
Employment grew 1.9% per year—much faster than population.
Labor productivity improved about 1.1% per year.
0
1
2
3
4
5
76-80
81-85
86-90
91-95
96-00
01-05
06-10
Real GDP Population
(Per
cent
cha
nge)

Copyright © 2006 Global Insight, Inc. 52 03/2006
Employment Will Slow More Than Population…
-1
0
1
2
3
4
76-80 86-90 96-00 06-10 16-20 26-30
Population Employment
(Per
cent
cha
nge)

Copyright © 2006 Global Insight, Inc. 53 03/2006
…as the Share of People 65-Plus Years Old in Working-Age Population Increases
As baby boomers retire, the labor force participation rate will decline from 67% currently to about 60%.
A low unemployment rate of old workers will provide a slight offset.
10
15
20
25
30
76-80
81-85
86-90
91-95
96-00
01-05
06-10
11-15
16-20
21-25
26-30
(Per
cent
)
Baby
Boomer
s
Retire

Copyright © 2006 Global Insight, Inc. 54 03/2006
A Slowdown is in Store…
Employment
-1
0
1
2
3
4
5
76-80
81-85
86-90
91-95
96-00
01-05
06-10
11-15
16-20
21-25
26-30
(Per
cent
cha
nge)

Copyright © 2006 Global Insight, Inc. 55 03/2006
…Even With Solid Productivity Growth
Employment Productivity GDP
-1
0
1
2
3
4
5
76-80
81-85
86-90
91-95
96-00
01-05
06-10
11-15
16-20
21-25
26-30
(Per
cent
cha
nge)

Copyright © 2006 Global Insight, Inc. 56 03/2006
Pressing Questions
Can immigration solve the employment problem?
How to boost productivity?
Will the standard of living for Canadians decline?
How does Canada measure up in the world?
What does this all mean for my business?

Copyright © 2006 Global Insight, Inc. 57 03/2006
Can Immigration Solve the Employment Problem?
In order to keep employment growth at 1.2%, the numbers of immigrants admitted to Canada would have to grow from about 225,000 currently to 400K+ in the next decade and 700K in the 2020s.
In such a scenario, the ratio of immigrants to 1,000 Canadians would rise from 7 to 17.
This ratio has fluctuated between 4 and 10 over the past 30 years.
Disappointing economic performance of immigrants since the 1990s favors neither adoption nor achievement of aggressive immigration targets.

Copyright © 2006 Global Insight, Inc. 58 03/2006
The Productivity Challenge
Canada has the potential for robust productivity growth.Productivity growth averaged 2.0% in 1995–99.Labor market shortages will force companies to extract
more output out of the existing workforce.
But there are good reasons not to be overly optimistic.Productivity grew only 0.7% a year in 2001–05.Productivity growth averaged 1% a year over the
past 30 years.Older societies often opt for stability rather than change,
while change is the very essence of productivity growth.

Copyright © 2006 Global Insight, Inc. 59 03/2006
What can government do?
Cut capital taxes.
– Canada has the second highest
marginal effective rate on capital
among 37 major economies.
Improve the quality of university
education, especially at the graduate
level.
– Masters and PhD program
graduates are key drivers of
innovation.
Provide a competitive tax regime to
keep most productive (high-income)
people in Canada.
What can business do? Provide employees with more capital to work with.
–Canada’s service sector badly trails the U.S. in capital intensity per worker.
Put greater emphasis on research, innovation, and technology adoption.
Focus on more value-added production.
What Can Be Done to Boost Productivity Growth?
Although there is no silver bullet, there are a number of options.

Copyright © 2006 Global Insight, Inc. 60 03/2006
Canadians’ Standard of Living Will Increase, But…
Rising productivity growth will ensure steady growth in living standards.
The gap with the United States, however, will rise from 15% currently to over 20%.20
30
40
50
60
76-80
81-85
86-90
91-95
96-00
01-05
06-10
11-15
16-20
21-25
26-30
(Tho
usan
ds o
f 199
7$ p
er c
apita
)

Copyright © 2006 Global Insight, Inc. 61 03/2006
Canada’s Long-Term Growth from Global Perspective
Copyright © 2006 Global Insight, Inc. 62 03/2006
Implications for Business
Overall domestic demand will slow,with important differences among businesses
serving particular age groups, e.g., elderly vs. youth.
Overall foreign demand will outpace domestic demand.The United States will grow faster than Canada, but
most European nations will grow slower.
Domestic labor will become scarce and older.

Copyright © 2006 Global Insight, Inc.
How Can Businesses Adjust?

Copyright © 2006 Global Insight, Inc. 64 03/2006
Framework for Analysis—Domestically-Oriented Business
Degree of Export Orientation
Ab
ilit
y to
Tap
in
to F
ore
ign
In
pu
ts,
Lab
or,
etc
. Companies serving mostly the
domestic market, e.g., in retail, construction,
business services, health-care, and
education

Copyright © 2006 Global Insight, Inc. 65 03/2006
Framework for Analysis—Export-Oriented Business
Degree of Export Orientation
Ab
ilit
y to
Tap
in
to F
ore
ign
In
pu
ts,
Lab
or,
etc
.
Companies that can plug into global supply networks; e.g., many manufacturers
Companies that have to undertake most of their production in Canada, e.g., agriculture, forestry and logging, and mining

Copyright © 2006 Global Insight, Inc. 66 03/2006
How Could Businesses Respond?
Degree of Export Orientation
Ab
ilit
y to
Tap
in
to F
ore
ign
In
pu
ts,
Lab
or,
etc
.
● Incorporate more imported inputs in production
● Offshore less value-added processes
● Increase capital intensity per worker
● Increase capital intensity per worker
● Increase reliance on foreign workers
● Scale down operations alongside slower growth
● Adjust to serve fastest growing population segments such as the elderly or children of visible minorities
● Outsource labor-intensive work offshore, e.g., Bangalore
● Explore export opportunities
Copyright © 2006 Global Insight, Inc. 67 03/2006
In Summary
As baby boomers retire over the next decade or so, Canada’s economic growth will decline.Governments could ease, but not prevent, the
slowdown in GDP and employment.
Fortunately, global demand will continue to grow at a solid pace and Canadians’ standard of living will increase.
Unfortunately, businesses will have to adjust to the increased scarcity of labor and the Canada-U.S. standard-of-living gap will widen.
Slow-growing Europe could offer valuable lessons and case studies for Canadian governments and companies.

Copyright © 2006 Global Insight, Inc. 68 03/2006
Dale Orr
Wojciech Szadurski
Nariman [email protected]
Thank you


