
- 1 -
Consolidated Financial Statements for the Second Quarter of the Fiscal Year Ending March 31, 2018
[JGAAP] November 10, 2017
Stock exchange listing: Tokyo (URL http://www.saisoncard.co.jp)
Listed company name: Credit Saison Co., Ltd. Code number: 8253 Representative: Hiroshi Rinno / President and CEO Inquiries to: Mayumi Tamura / General Manager, Public Relations Office; Phone: (03) 3982-0700 Scheduled date to submit Quarterly Securities Report: November 14, 2017
Scheduled date to commence dividend payments: –
Preparation of supplementary material on quarterly financial results: Yes
Holding of quarterly financial results presentation meeting: Yes (for institutional investors and analysts)
Note: All amounts are rounded down to the nearest million yen.
1. Consolidated Results for the Second Quarter of the Fiscal Year Ending March 31, 2018 (April 1, 2017 to September 30, 2017)
(1) Consolidated Operating Results (cumulative) (% represents year-on-year change)
Operating revenue Operating profit Ordinary profit Profit attributable to
owners of parent (Millions of yen) (%) (Millions of yen) (%) (Millions of yen) (%) (Millions of yen) (%)
2nd Quarter FY2017 145,411 6.0 26,082 2.7 36,240 16.9 32,010 13.3 2nd Quarter FY2016 137,241 1.7 25,401 (4.9) 31,006 (9.4) 28,245 22.7
(Note) Comprehensive income: 2nd Quarter FY2017 28,981 million yen [8.6%] 2nd Quarter FY2016 26,687 million yen [4.9%]
Earnings per share Earnings per share
(diluted) (Yen) (Yen)
2nd Quarter FY2017 195.98 – 2nd Quarter FY2016 172.93 169.63
(2) Consolidated Financial Position
Total assets Net assets Equity ratio Net assets per share (Millions of yen) (Millions of yen) (%) (Yen)
2nd Quarter FY2017 2,849,752 470,144 16.4 2,868.55 FY2016 2,720,051 446,882 16.4 2,724.88
(Reference) Equity: 2nd Quarter FY2017 468,528 million yen FY2016 445,063 million yen 2. Dividends
Dividends per share
End of first quarter
End of second quarter
End of third quarter
End of fiscal year Annual
(Yen) (Yen) (Yen) (Yen) (Yen)
FY2016 – 0.00 – 35.00 35.00
FY2017 – 0.00
FY2017 (Projected)
– 35.00 35.00
(Note) Revision of projected dividends most recently announced: None
《Translation of excerpted sections》
- 2 -
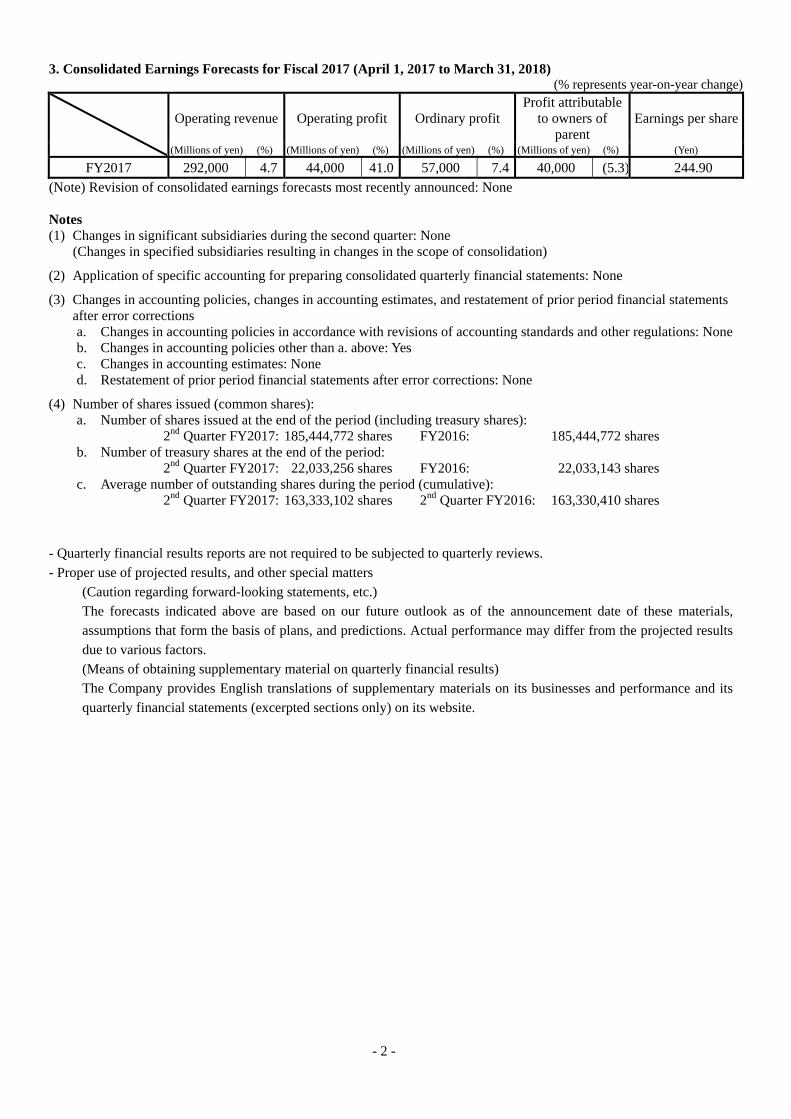
3. Consolidated Earnings Forecasts for Fiscal 2017 (April 1, 2017 to March 31, 2018) (% represents year-on-year change)
Operating revenue Operating profit Ordinary profit Profit attributable
to owners of parent
Earnings per share
(Millions of yen) (%) (Millions of yen) (%) (Millions of yen) (%) (Millions of yen) (%) (Yen)
FY2017 292,000 4.7 44,000 41.0 57,000 7.4 40,000 (5.3) 244.90
(Note) Revision of consolidated earnings forecasts most recently announced: None Notes (1) Changes in significant subsidiaries during the second quarter: None
(Changes in specified subsidiaries resulting in changes in the scope of consolidation)
(2) Application of specific accounting for preparing consolidated quarterly financial statements: None (3) Changes in accounting policies, changes in accounting estimates, and restatement of prior period financial statements
after error corrections a. Changes in accounting policies in accordance with revisions of accounting standards and other regulations: None b. Changes in accounting policies other than a. above: Yes c. Changes in accounting estimates: None d. Restatement of prior period financial statements after error corrections: None
(4) Number of shares issued (common shares): a. Number of shares issued at the end of the period (including treasury shares):
2nd Quarter FY2017: 185,444,772 shares FY2016: 185,444,772 shares b. Number of treasury shares at the end of the period:
2nd Quarter FY2017: 22,033,256 shares FY2016: 22,033,143 shares c. Average number of outstanding shares during the period (cumulative):
2nd Quarter FY2017: 163,333,102 shares 2nd Quarter FY2016: 163,330,410 shares - Quarterly financial results reports are not required to be subjected to quarterly reviews. - Proper use of projected results, and other special matters
(Caution regarding forward-looking statements, etc.) The forecasts indicated above are based on our future outlook as of the announcement date of these materials, assumptions that form the basis of plans, and predictions. Actual performance may differ from the projected results due to various factors. (Means of obtaining supplementary material on quarterly financial results) The Company provides English translations of supplementary materials on its businesses and performance and its quarterly financial statements (excerpted sections only) on its website.
- 3 -
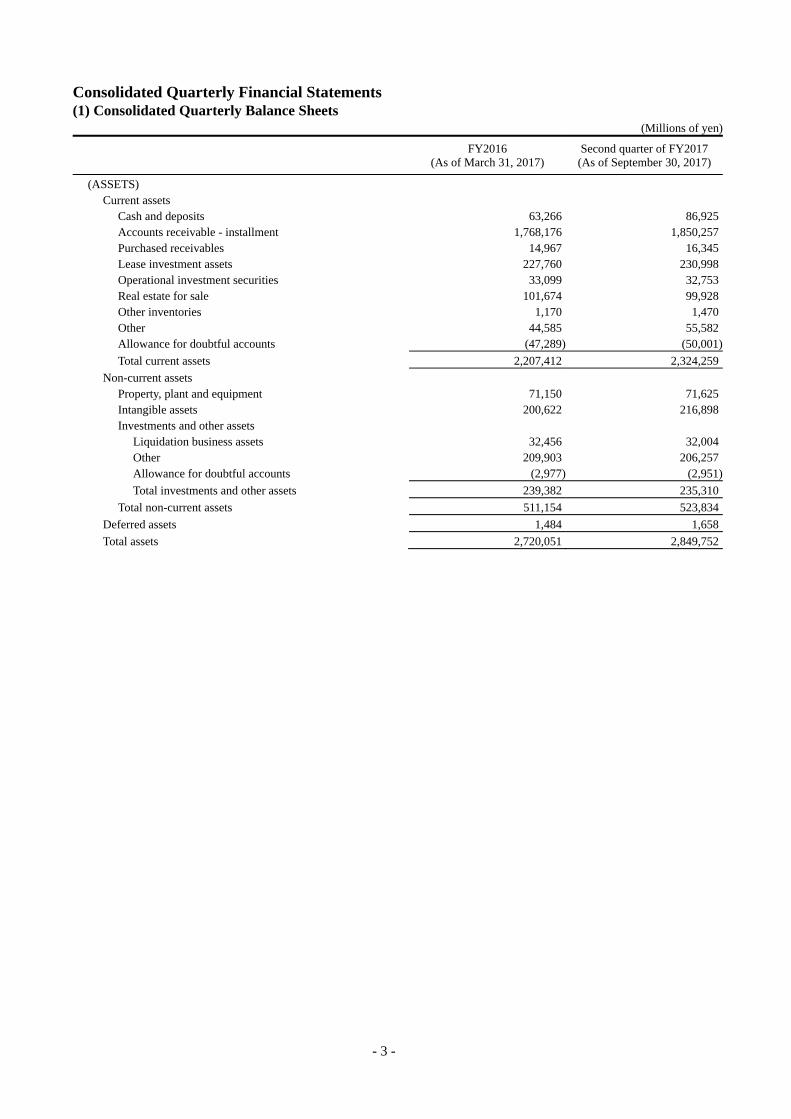
Consolidated Quarterly Financial Statements (1) Consolidated Quarterly Balance Sheets
(Millions of yen)
FY2016
(As of March 31, 2017) Second quarter of FY2017 (As of September 30, 2017)
(ASSETS) Current assets
Cash and deposits 63,266 86,925Accounts receivable - installment 1,768,176 1,850,257Purchased receivables 14,967 16,345Lease investment assets 227,760 230,998Operational investment securities 33,099 32,753Real estate for sale 101,674 99,928Other inventories 1,170 1,470Other 44,585 55,582Allowance for doubtful accounts (47,289) (50,001)
Total current assets 2,207,412 2,324,259
Non-current assets Property, plant and equipment 71,150 71,625Intangible assets 200,622 216,898Investments and other assets
Liquidation business assets 32,456 32,004Other 209,903 206,257Allowance for doubtful accounts (2,977) (2,951)
Total investments and other assets 239,382 235,310
Total non-current assets 511,154 523,834
Deferred assets 1,484 1,658
Total assets 2,720,051 2,849,752

- 4 -
(Millions of yen)
FY2016
(As of March 31, 2017) Second quarter of FY2017 (As of September 30, 2017)
(LIABILITIES) Current liabilities
Notes and accounts payable - trade 238,190 264,131Short-term loans payable 229,960 231,160Current portion of long-term loans payable 69,885 58,090Current portion of bonds 50,000 10,000Commercial papers 358,000 424,500Lease obligations 524 530Income taxes payable 9,589 6,587Provision for bonuses 2,315 2,495Provision for directors’ bonuses 157 67Provision for loss on interest repayment 9,445 8,861Allowance for losses on collecting gift tickets 144 141Deferred installment income 9,028 9,445Other 39,388 44,040
Total current liabilities 1,016,629 1,060,050
Non-current liabilities Bonds payable 255,000 300,000Long-term loans payable 852,899 870,099Long-term loans payable under credit fluidity 20,000 20,000Lease obligations 1,209 1,453Provision for directors’ retirement benefits 133 130Provision for loss on guarantees 6,418 7,039Allowance for losses on warranty of defects 14 15Provision for point card certificates 94,033 97,213Provision for loss on interest repayment 21,148 16,771Asset retirement obligations 445 465Other 5,238 6,370
Total non-current liabilities 1,256,539 1,319,557
Total liabilities 2,273,168 2,379,608

- 5 -
(Millions of yen)
FY2016
(As of March 31, 2017) Second quarter of FY2017 (As of September 30, 2017)
(NET ASSETS) Shareholders’ equity
Capital stock 75,929 75,929Capital surplus 85,634 85,634Retained earnings 302,087 328,379Treasury shares (52,879) (52,879)
Total shareholders’ equity 410,773 437,064
Accumulated other comprehensive income Valuation difference on available-for-sale securities 35,315 32,657Deferred gains or losses on hedges (649) (552)Foreign currency translation adjustment (374) (639)
Total accumulated other comprehensive income 34,290 31,464
Subscription rights to shares 0 0Non-controlling interests 1,818 1,615
Total net assets 446,882 470,144
Total liabilities and net assets 2,720,051 2,849,752
- 6 -
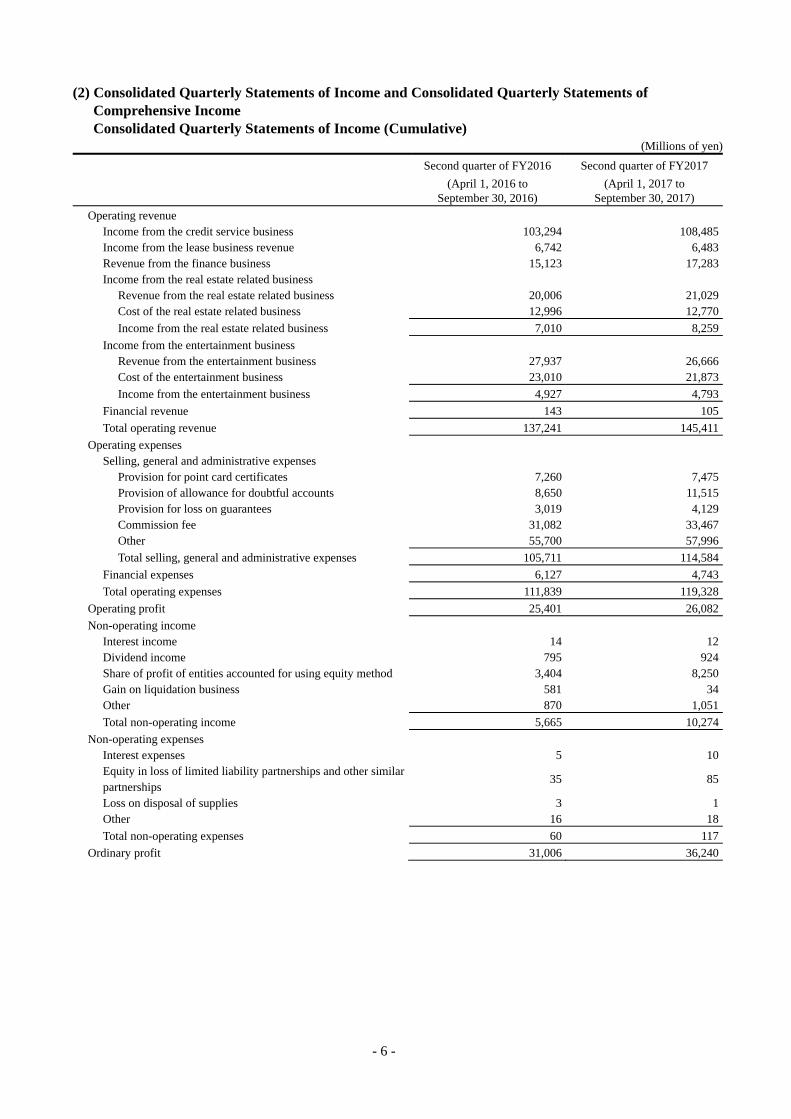
(2) Consolidated Quarterly Statements of Income and Consolidated Quarterly Statements of Comprehensive Income Consolidated Quarterly Statements of Income (Cumulative)
(Millions of yen)
Second quarter of FY2016
(April 1, 2016 to September 30, 2016)
Second quarter of FY2017
(April 1, 2017 to September 30, 2017)
Operating revenue Income from the credit service business 103,294 108,485Income from the lease business revenue 6,742 6,483Revenue from the finance business 15,123 17,283Income from the real estate related business
Revenue from the real estate related business 20,006 21,029Cost of the real estate related business 12,996 12,770
Income from the real estate related business 7,010 8,259
Income from the entertainment business Revenue from the entertainment business 27,937 26,666Cost of the entertainment business 23,010 21,873
Income from the entertainment business 4,927 4,793
Financial revenue 143 105
Total operating revenue 137,241 145,411
Operating expenses Selling, general and administrative expenses
Provision for point card certificates 7,260 7,475Provision of allowance for doubtful accounts 8,650 11,515Provision for loss on guarantees 3,019 4,129Commission fee 31,082 33,467Other 55,700 57,996
Total selling, general and administrative expenses 105,711 114,584
Financial expenses 6,127 4,743
Total operating expenses 111,839 119,328
Operating profit 25,401 26,082
Non-operating income Interest income 14 12Dividend income 795 924Share of profit of entities accounted for using equity method 3,404 8,250Gain on liquidation business 581 34Other 870 1,051
Total non-operating income 5,665 10,274
Non-operating expenses Interest expenses 5 10Equity in loss of limited liability partnerships and other similar partnerships
35 85
Loss on disposal of supplies 3 1Other 16 18
Total non-operating expenses 60 117
Ordinary profit 31,006 36,240

- 7 -
(Millions of yen)
Second quarter of FY2016
(April 1, 2016 to September 30, 2016)
Second quarter of FY2017
(April 1, 2017 to September 30, 2017)
Extraordinary income Gain on sales of investment securities – 8,481Gain on sales of non-current assets – 0Settlement received 11,475 275Other 0 17
Total extraordinary income 11,475 8,775
Extraordinary losses Loss on disposal of non-current assets 13 22Loss on valuation of investment securities 699 –
Impairment loss 0 1Other 148 –
Total extraordinary losses 862 23
Profit before income taxes 41,619 44,991
Income taxes - current 4,750 6,414Income taxes - deferred 7,123 6,759
Total income taxes 11,873 13,174
Profit 29,745 31,816
Profit (loss) attributable to non-controlling interests 1,500 (193)
Profit attributable to owners of parent 28,245 32,010

- 8 -
Consolidated Quarterly Statements of Comprehensive Income (Cumulative) (Millions of yen)
Second quarter of FY2016
(April 1, 2016 to September 30, 2016)
Second quarter of FY2017
(April 1, 2017 to September 30, 2017)
Profit 29,745 31,816Other comprehensive income
Valuation difference on available-for-sale securities (2,434) 1,524Deferred gains or losses on hedges 644 97Foreign currency translation adjustment (103) (31)Share of other comprehensive income of entities accounted for using equity method
(1,165) (4,426)
Total other comprehensive income (3,057) (2,835)
Comprehensive income 26,687 28,981
Comprehensive income attributable to Comprehensive income attributable to owners of parent 25,218 29,184Comprehensive income attributable to non-controlling interests 1,469 (203)

- 9 -
(3) Segment information, etc.
Segment information
For the second quarter ended September 30, 2016 (from April 1, 2016 to September 30, 2016)
Information regarding revenue, profit and other items by reportable segments (Millions of yen)
Reportable segments
Adjustments
Consolidated quarterly
statements of income
Credit service
Lease Finance Real estate related
Entertainment Total
Operating revenue
External revenue 103,427 6,752 15,123 7,010 4,927 137,241 – 137,241
Inter-segment revenue and transfer
519 12 – 12 – 544 (544) –
Total 103,946 6,764 15,123 7,023 4,927 137,785 (544) 137,241
Segment profit 11,090 2,624 8,155 2,857 670 25,398 3 25,401
(Notes) 1. Adjustments include inter-segment eliminations. 2. Segment profit is adjusted to total operating profit in the consolidated quarterly statements of income.
For the second quarter ended September 30, 2017 (from April 1, 2017 to September 30, 2017)
Information regarding revenue, profit and other items by reportable segments (Millions of yen)
Reportable segments
Adjustments
Consolidated quarterly
statements of income
Credit service Lease Finance
Real estate related Entertainment Total
Operating revenue
External revenue 108,586 6,487 17,283 8,259 4,793 145,411 – 145,411
Inter-segment revenue and transfer
557 9 – 11 – 578 (578) –
Total 109,143 6,497 17,283 8,270 4,793 145,989 (578) 145,411
Segment profit 11,308 2,166 7,913 4,029 663 26,081 1 26,082
(Notes) 1. Adjustments include inter-segment eliminations. 2. Segment profit is adjusted to total operating profit in the consolidated quarterly statements of income.


