Download - Committee On Electricity

Winter Committee Meetings
NARUC
Committee On
Electricity

Energy Storage:
Three Views

Moderator:Hon. Asim Haque, Ohio
Kenneth Collison, ICF International
Hon. Cheryl LaFleur, FERCNed Bartlett, Massachusetts
Energy & Environ. Affairs

Energy Storage - OutlookNARUC Winter MeetingWashington, DC
2/13/2017
Kenneth CollisonVice President, ICF

ICF proprietary and confidential. Do not copy, distribute, or disclose.ICF proprietary and confidential. Do not copy, distribute, or disclose.ICF proprietary and confidential. Do not copy, distribute, or disclose.
Current operational storage capacity Battery storage technology by sector Storage applications and advantages Costs and benefits Conclusion
5
Outline

ICF proprietary and confidential. Do not copy, distribute, or disclose.ICF proprietary and confidential. Do not copy, distribute, or disclose.ICF proprietary and confidential. Do not copy, distribute, or disclose.
1.6 GW of operational non-hydro energy storage resources in 36 states
Operational Energy Storage Technologies (Non-hydro)
6
Source: US DOE Global Energy Storage Database

ICF proprietary and confidential. Do not copy, distribute, or disclose.ICF proprietary and confidential. Do not copy, distribute, or disclose.ICF proprietary and confidential. Do not copy, distribute, or disclose.
77.5 MW of battery storage came online in California January 2017
Moving Forward – Battery energy technology is one of the fastest growing segments
Technology Type Existing (MW)
Planned 2017-20
(MW)
Total(MW)
Lithium-based Battery 475 371 846
Lead Acid Battery 87 21 108
Sodium-based battery 26 26
Nickel-based battery 27 10 37
Zinc-based Battery 3 15 18
Vanadium-based Battery 2 22 25
Total 620 441 1061
20MW, 4 hours-SCE TESLA, constructed in 88 days
20MW, 4 hours – SCEGreensmith in under 4 months
37.5MW, 4 hours – SDG&EAES (largest 30 MW installation)
7
Source: US DOE Global Energy Storage Database

ICF proprietary and confidential. Do not copy, distribute, or disclose.ICF proprietary and confidential. Do not copy, distribute, or disclose.ICF proprietary and confidential. Do not copy, distribute, or disclose.
Energy Storage: Capacity Added by Sector per Year Technology Trends:
– Lithium-ion = 96 % of 2015 deployment vs. 72 % of 2014• 50% cost decline since 2010 • High power for short-duration applications and up to 4 hours of energy for resource
adequacy contribution– Advanced lead-acid – Flow batteries
Source: GTM *Pumped hydropower storage not included
8

ICF proprietary and confidential. Do not copy, distribute, or disclose.ICF proprietary and confidential. Do not copy, distribute, or disclose.ICF proprietary and confidential. Do not copy, distribute, or disclose.
Energy Storage: Capacity Added by Sector per Year
49% BTM by 2021 (~1,019 MW)
Source: GTM*non-hydro
90% IFOM10% BTM
85% IFOM15% BTM
This graph reflects only new installations in each year
“Using energy storage to maximize self consumption of generation from a distributed PV system under a non-NEM rate is economically attractive if that same energy storage system is allowed to deliver a suite of ISO/RTO and utility services to earn revenue -RMI
Capacity Added: 2015 = 226 MW
‒ IFOM: 192 MW
‒ BTM: 34 MW
2021 = 2,081 MW
‒ IFOM: 1,061 MW
‒ BTM: 1,019 MW
9

ICF proprietary and confidential. Do not copy, distribute, or disclose.ICF proprietary and confidential. Do not copy, distribute, or disclose.ICF proprietary and confidential. Do not copy, distribute, or disclose.
The grid operates in all time scales, and Energy Storage can derive value from many applications
What Jump-Started Energy Storage in US
Applications in 2 regions gave it a jump-start: Frequency regulation in the PJM market – 15 minutes of stored energy Resource adequacy value in California – 4 hours of stored energy
10

ICF proprietary and confidential. Do not copy, distribute, or disclose.ICF proprietary and confidential. Do not copy, distribute, or disclose.ICF proprietary and confidential. Do not copy, distribute, or disclose.
Frequency Regulation Market
* A new proposal will increase the market size to 800 MW
PJM market has seen record deployments of Energy Storage.- 250 MW of Energy Storage in a market size of 700 MW*
$0
$5
$10
$15
$20
$25
$30
$35
SERC WECC FRCC CAISO PJM NYISO
Nom
$/k
W-m
onth
2012-2014 Average Regulation Compensation
Source: PJM
11

ICF proprietary and confidential. Do not copy, distribute, or disclose.ICF proprietary and confidential. Do not copy, distribute, or disclose.ICF proprietary and confidential. Do not copy, distribute, or disclose.
Resource Adequacy Value
In most markets, 4 hour energy storage resource is required for full resource adequacy contribution.
Dependable or FIRM capacity available from a resource during the time of need
• 100 MW of CC ~ 100% capacity• 100 MW of Solar PV ~ 38% capacity (PJM)• 100 MW of Wind plant ~ 13% capacity (PJM)
MarketStorage Eligible?
Minimum Availability / Operating Capacity
CAISO Yes At least 4 consecutive hours for over three consecutive days
PJM Yes Capacity assessed on performance assessment hours
ISO-NE Yes The capability is assessed based on the audit duration (2 hours)
NYISO YesThe resource must be able to provide energy for at least 4 consecutive hours
MISO YesAs a load modifying resource that can supply 4 hours of energy consecutively
12

ICF proprietary and confidential. Do not copy, distribute, or disclose.ICF proprietary and confidential. Do not copy, distribute, or disclose.ICF proprietary and confidential. Do not copy, distribute, or disclose.
Duration of Stored Energy Matters…..
The first 1-hour block provides the highest (incremental) capacity value Greater than 4-hour of Energy Storage provides ≈ 100% capacity value
Incremental Capacity Value
1st Hour Block – 46%2nd Hour Block – 20%
Saturation effect kicks in for Storage > 4Hr
46%
66%+20%
Resource Adequacy Value from Storage
13

ICF proprietary and confidential. Do not copy, distribute, or disclose.ICF proprietary and confidential. Do not copy, distribute, or disclose.ICF proprietary and confidential. Do not copy, distribute, or disclose.
Other Ancillary Services
Figure Source: Hawaii RPS Study
Hawaii RPS Study – A simulated scenario with 40% of electrical load served by solar and wind energy. Solar PV energy – 30%Wind energy – 10%
In 2015, 23.4% of Hawaii’s electricity was generated from renewables. Hawaii’s RPS goal is to achieve 100% renewable penetration by 2045
The Famous Duck Curve – It is not only a flexibility issue but can manifest as a grid stability problem. Hawaii is tackling it today!!
14
ICF proprietary and confidential. Do not copy, distribute, or disclose.ICF proprietary and confidential. Do not copy, distribute, or disclose.ICF proprietary and confidential. Do not copy, distribute, or disclose.
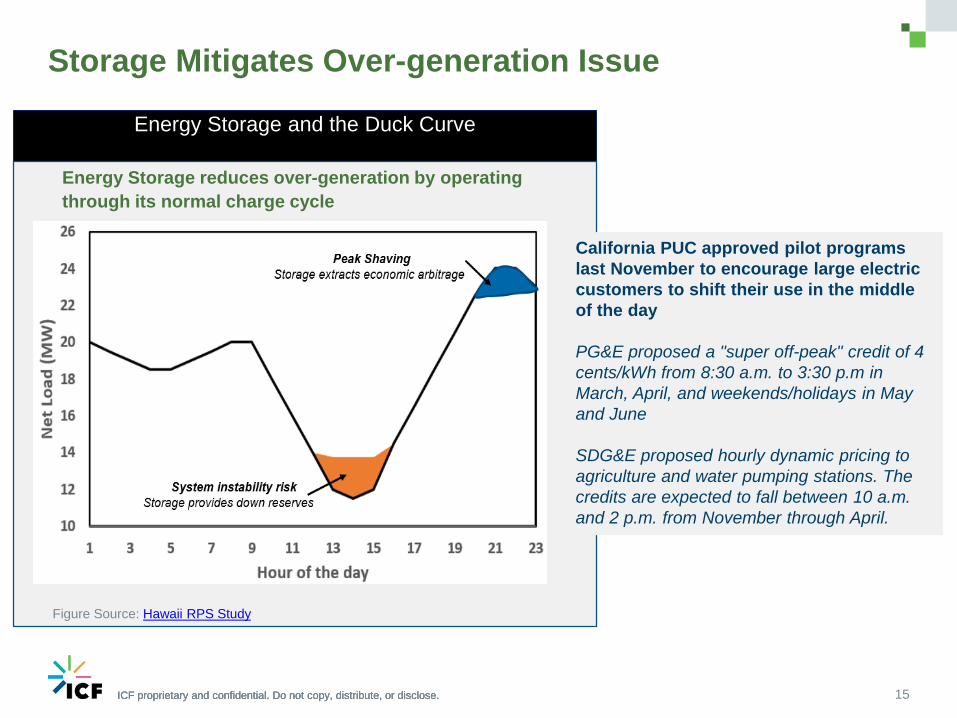
Energy Storage and the Duck Curve
Storage Mitigates Over-generation Issue
Figure Source: Hawaii RPS Study
Energy Storage reduces over-generation by operating through its normal charge cycle
California PUC approved pilot programs last November to encourage large electric customers to shift their use in the middle of the day
PG&E proposed a "super off-peak" credit of 4 cents/kWh from 8:30 a.m. to 3:30 p.m in March, April, and weekends/holidays in May and June
SDG&E proposed hourly dynamic pricing to agriculture and water pumping stations. The credits are expected to fall between 10 a.m. and 2 p.m. from November through April.
15

ICF proprietary and confidential. Do not copy, distribute, or disclose.ICF proprietary and confidential. Do not copy, distribute, or disclose.ICF proprietary and confidential. Do not copy, distribute, or disclose.
Energy Storage: Applications
Frequency regulation– CA + PJM (ex. NJ) = 92% market since 2013
Renewables integration– HI: Kauia Island Utility Cooperative (KIUC)
signed PPA for 20 MW solar + storage at 11 cents/kWh in Jan 2017
– KIUC signed a PPA of 13 cents/kWh for a 13 MW solar + storage project in Sep 2015
Investment deferral (NWA)– NY: BQDM 11MW of the 52MW consist on
non-traditional utility-side solutions (storage, CVO, fuel cells and solar PV)
Renewables integration– NY: ~ $ 2,100/KW battery storage incentive for
summer peak demand reduction– VT: Green Mountain Power offers a 3.3 kW
Tesla Powerwall to residential customers with 3 options: purchase, purchase w/power sharing which credits customers $31.76/month or leasing for $1.25/day w/sharing
End User (Behind-the-Meter) = Peak Shaving– CA, HI, NY: Stem, Green Charge Network,
Demand Energy and others deploying BTM storage for commercial customers for peak shaving
Source: GTM
In Front of Meter Behind the Meter
16

ICF proprietary and confidential. Do not copy, distribute, or disclose.ICF proprietary and confidential. Do not copy, distribute, or disclose.ICF proprietary and confidential. Do not copy, distribute, or disclose.
We are at the intersection of declining costs and development of supportive policies
www.mass.gov/eea/docs/doer/state-of-charge-report.pdf
EPRI, Energy Storage Cost Summary for Utility Planning:2016
Source: ICF Study17

ICF proprietary and confidential. Do not copy, distribute, or disclose.ICF proprietary and confidential. Do not copy, distribute, or disclose.ICF proprietary and confidential. Do not copy, distribute, or disclose.
Advanced energy storage technologies are a fast growing segment of the power markets and will become even more attractive with declining costs Given its unique characteristics, advanced energy storage technology
has the potential to provide significant benefits Market evolution would be required to fully exploit these storage
technologies Storage could be key in meeting renewable and clean energy goals
18
Key Takeaways

ICF proprietary and confidential. Do not copy, distribute, or disclose.ICF proprietary and confidential. Do not copy, distribute, or disclose.ICF proprietary and confidential. Do not copy, distribute, or disclose. 19

ICF proprietary and confidential. Do not copy, distribute, or disclose.ICF proprietary and confidential. Do not copy, distribute, or disclose.ICF proprietary and confidential. Do not copy, distribute, or disclose.
Appendix
20
ICF proprietary and confidential. Do not copy, distribute, or disclose.ICF proprietary and confidential. Do not copy, distribute, or disclose.ICF proprietary and confidential. Do not copy, distribute, or disclose.
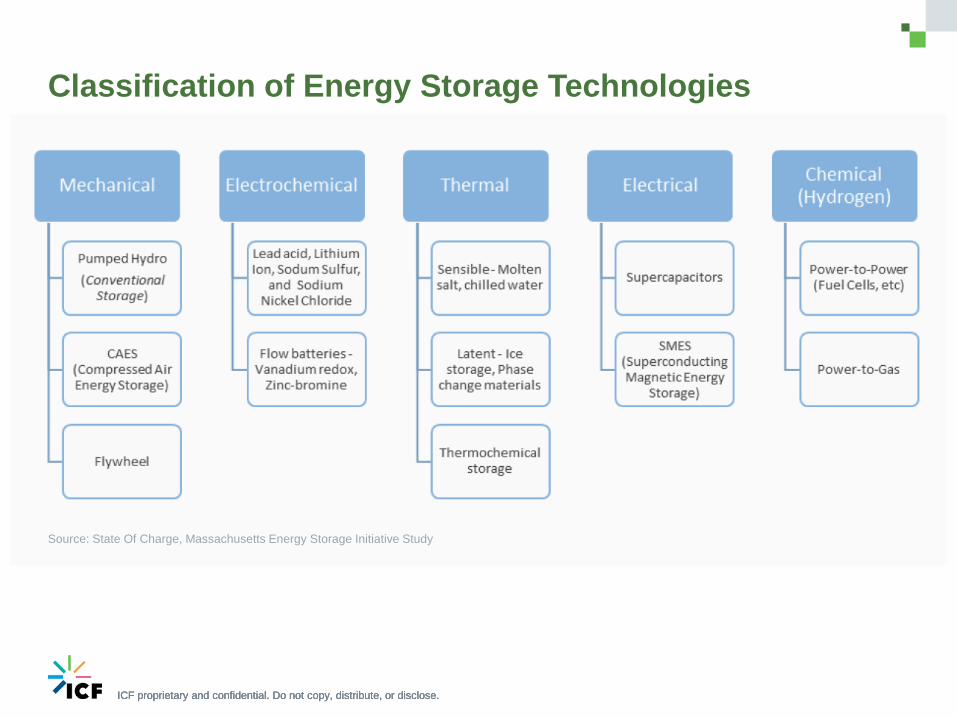
Classification of Energy Storage Technologies
Source: State Of Charge, Massachusetts Energy Storage Initiative Study

Reducing Barriers to Electric Storage Resources Providing Wholesale Services
Acting Chairman Cheryl A. LaFleur
February 13, 2017

Recent FERC Actions
• Electric Storage Participation in the Organized Wholesale Electric Markets (Docket Nos. AD16-20-000, RM16-23-000)
• Storage as Transmission Asset Technical Conference and Policy Statement (AD16-25-000, PL17-2-000)
• Reform of Generator Interconnection Procedures and Agreements (Docket Nos. RM16-12-000, RM15-21-000, RM17-8-000)
• Order Partially Granting Indianapolis Power and Light’s Complaint against MISO Tariff (EL17-8-000)
23

NOPR on Electric Storage Participation in the Organized Wholesale Electric Markets
The Commission issued a NOPR in November 2016 proposing to require each RTO and ISO to:
(1) establish a participation model consisting of market rules that accommodates the participation of storage resources in wholesale electric markets and
(2) allow distributed energy resource aggregators, including electric storage resources, to participate directly in the organized wholesale electric markets.
I issued a statement on this order because I am especially interested in comment on needed operational coordination among the RTO/ISOs, the distribution control centers, and the distributed energy resource aggregators. 24

Policy Statement on Utilization of Electric Storage as a Transmission Asset
On January 19, 2017 the Commission issued a policy statement on electric storage resources that seek to concurrently recover their costs through cost-based and market-based rates, which provided guidance related to: • double recovery of costs, • potential for adverse competitive impacts, and • the need for independence of regional grid operators
from market participants.I dissented on this order because of its broad rationale in dismissing concerns about the potential impacts of multiple payment streams on pricing in wholesale electric markets, which I think raises larger issues.
25

NOPR on Generator Interconnection Procedures and Agreements
The Commission’s December 2016 Generator Interconnection NOPR included a few proposed reforms that could particularly benefit electric storage resources:• Revising the definition of Generating Facility in the LGIA and LGIP to
explicitly include electric storage resources• Allowing interconnection customers to request interconnection service below
the rated generating facility capacity (e.g., a combined wind/storage facility)• Requiring transmission providers to establish a process for provisional
interconnection service before all network upgrades are completed• Requiring transmission providers to establish an expedited process for the
utilization of surplus interconnection service• Requiring transmission providers review and report to the Commission on
whether their modeling and study practices adequately account for the operational characteristics of electric storage resources.
26

Indianapolis Power and Light’s Complaint
• In a recent complaint, Indianapolis Power & Light argued that MISO’s Tariff is unjust and unreasonable because it fails to properly account for currently available grid-scale battery storage devices. They argued, among other things, that the MISO Tariff’s “Stored Energy Resource” resource type does not allow electric storage resources to provide all products that they are technically capable of providing.
• On this issue, the Commission granted IPL’s complaint, finding that MISO’s tariff was unjust and unreasonable because it unnecessarily restricts competition by preventing electric storage resources from providing all the services that they are technically capable of providing, which could lead to unjust and unreasonable rates. The Commission directed MISO to submit a compliance filing within 60 days.
• Note that this order is still within the rehearing window, so I can’t discuss it.
27

Winter Committee Meetings NARUC
Committee On
Electricity


