Download - Churchill Neighborhood Analysis

Analysis of Property Values Compared to Valid Sales Among Single-Family Homes
in the Churchill East Neighborhood

Overview
Churchill East is a neighborhood in transition located in the south-central urban core between two interstates, two major rail lines, the University of Louisville Belknap Campus, and in close proximity to Louisville International Airport and UPS. In addition, Churchill Downs Racetrack sits in the middle of the neighborhood, while Papa John’s Cardinal Stadium lies just to the east. The neighborhood is directly bounded on the north by the U of L campus, on the east by I-265, on the south by I-264, and west along Taylor Boulevard.

Overview

The Impact of Foreclosures on the Churchill East Neighborhood

According to the latest Census data available [Census 2000], Churchill East is a predominantly white neighborhood the majority of whose residents range in age from 25 to 55 (see the Population Pyramid Chart below). Over 50% of the population are in the low to moderate income range, 56% own their homes and 8% of the housing stock is vacant1. Although more current data is not available, it’s expected that the Churchill East neighborhood will see a decrease in homeownership, increase in vacant houses and a rise in poverty since the last census.
Demographic Profile of the Churchill East Neighborhood
12010 Census data is not available for small areas yet. The US Census Bureau is scheduled to release this data in 2011.
Under 5
5-9
10-14
15-17
18-19
20
21
22-24
25-29
30-34
35-39
40-44
45-49
50-54
55-59
60-61
62-64
65-66
67-69
70-74
75-79
80-84
85+
Male Female
Population by Age and Gender Size of Household
956
511
371
164
7936
0
200
400
600
800
1,000
1,200
Two in HHLD Three in HHLD Four in HHLD Five in HHLD Six in HHLD Seven or more in HHLD
1,829, 53%
1,609, 47%
OWNER RENTER
Owners and Renters

Analysis of Current Assessed Values of Single-Family Homes in the Churchill East
Neighborhood
PART I
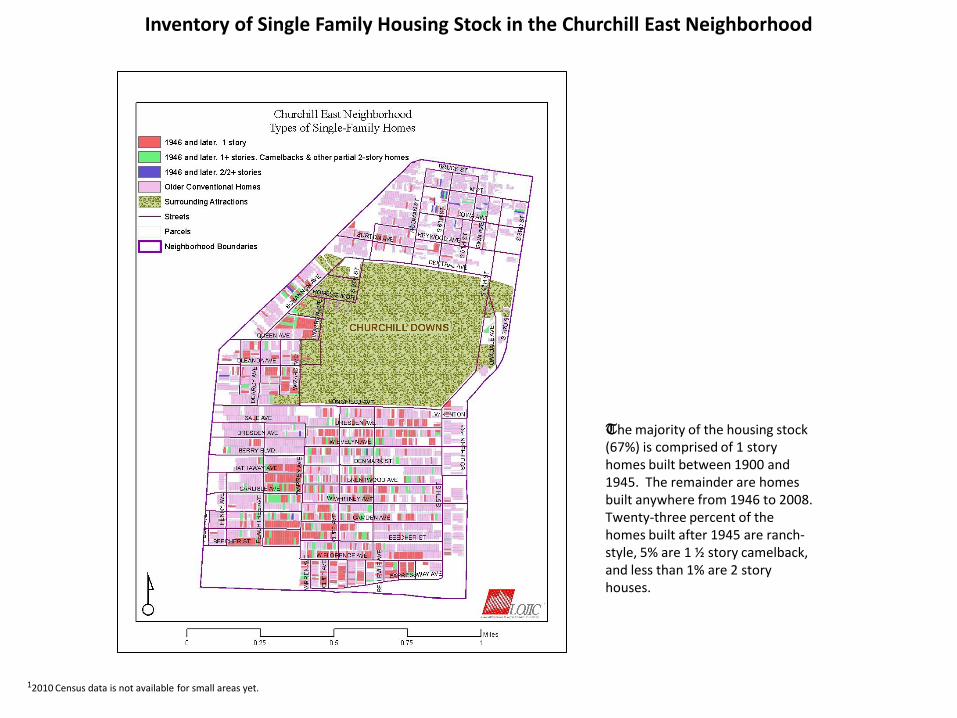
Inventory of Single Family Housing Stock in the Churchill East Neighborhood
12010 Census data is not available for small areas yet.
The majority of the housing stock (67%) is comprised of 1 story homes built between 1900 and 1945. The remainder are homes built anywhere from 1946 to 2008. Twenty-three percent of the homes built after 1945 are ranch-style, 5% are 1 ½ story camelback, and less than 1% are 2 story houses.

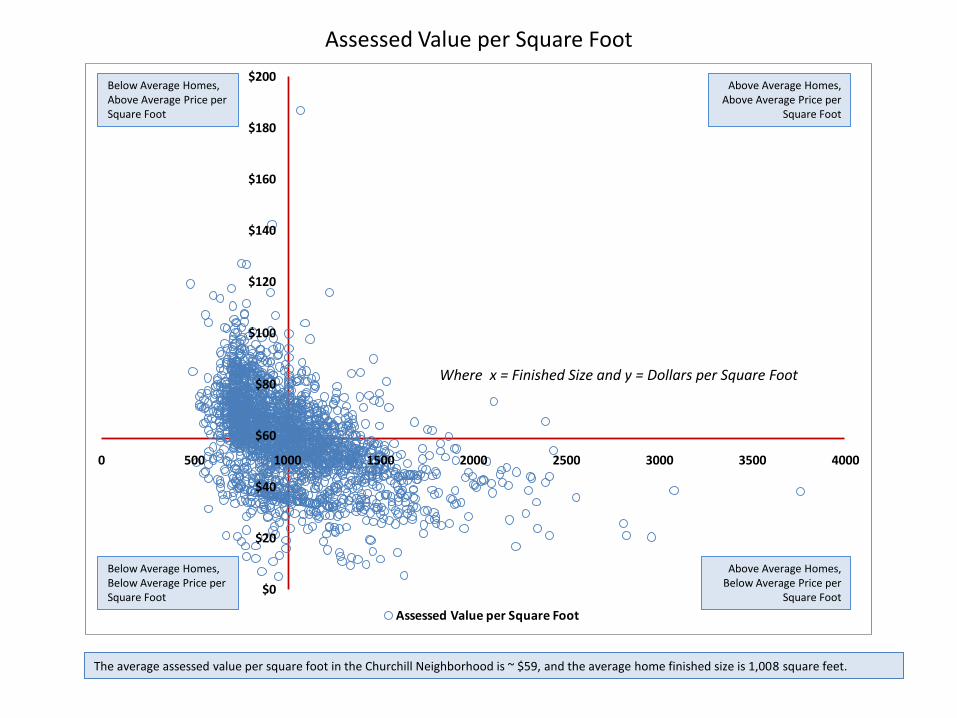
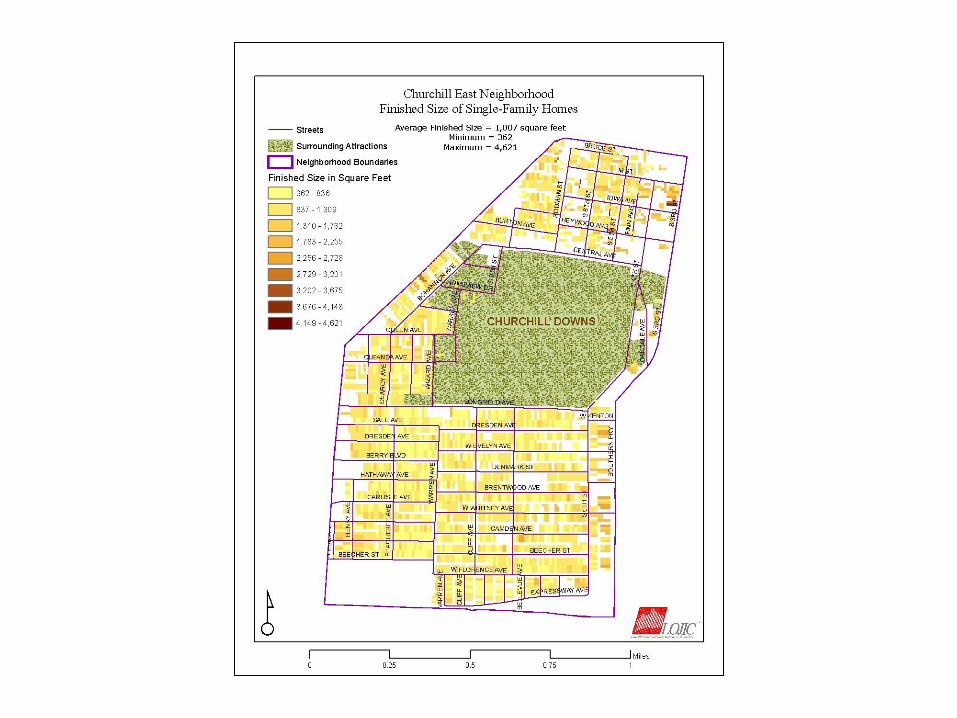
The average assessed value per square foot in the Churchill Neighborhood is ~ $59, and the average home finished size is 1,008 square feet.
$0
$20
$40
$60
$80
$100
$120
$140
$160
$180
$200
0 500 1000 1500 2000 2500 3000 3500 4000
Assessed Value per Square Foot
Below Average Homes, Below Average Price per Square Foot
Above Average Homes, Below Average Price per
Square Foot
Above Average Homes, Above Average Price per
Square Foot
Below Average Homes, Above Average Price per Square Foot
Assessed Value per Square Foot
Where x = Finished Size and y = Dollars per Square Foot


To interpret the graph above, a value of 1.0 means that the home [value per sq ft and/or finished size] is the same as the majority of homes in this neighborhood. Anything less than 1.0 means the value is less than that of the majority, and anything above 1.0 means the value is higher than the average in that neighborhhood. The average assessed value per square foot in the Churchill Neighborhood is ~ $59, and the average home finished size is 1,008 square feet. The circled area includes all homes 50% above and below the mean for home value and finished size. We will look at this range of homes, excluding all properties that don’t fall within this selection, for the 1st portion of our analysis, and look at the excluded data, the outliers, for the 2nd portion of the analysis.
0.0
0.5
1.0
1.5
2.0
2.5
3.0
3.5
4.0
0.00 0.50 1.00 1.50 2.00 2.50 3.00 3.50
Assessed Value per Square Foot and Finished Size of Home
x = assessed value per square foot in the Churchill neighborhood
y = finished size of single-family homes in the Churchill neighborhood

The homes north of Churchill Downs are generally assessed at the lowest dollar values per square foot, yet the grade is average or above average. In contrast, the homes south and west of Churchill Downs are valued higher but graded below average as Fair. This situation is being addressed by the Residential R & D Team.

Quality of Construction of Single-Family Homes in the Churchill East Neighborhood
478, 18%
37, 1%
21, 1%
1197, 46%
862, 33%
14, 1% 1, 0% 1, 0%
Average
Average -
Average +
Fair
Fair -
Fair +
Good -
Low
Quality of Construction / Grade


Analysis of Valid Sales Between July 1, 2008 and August 10, 2010
of Single-Family Homes in the Churchill East Neighborhood
PART II
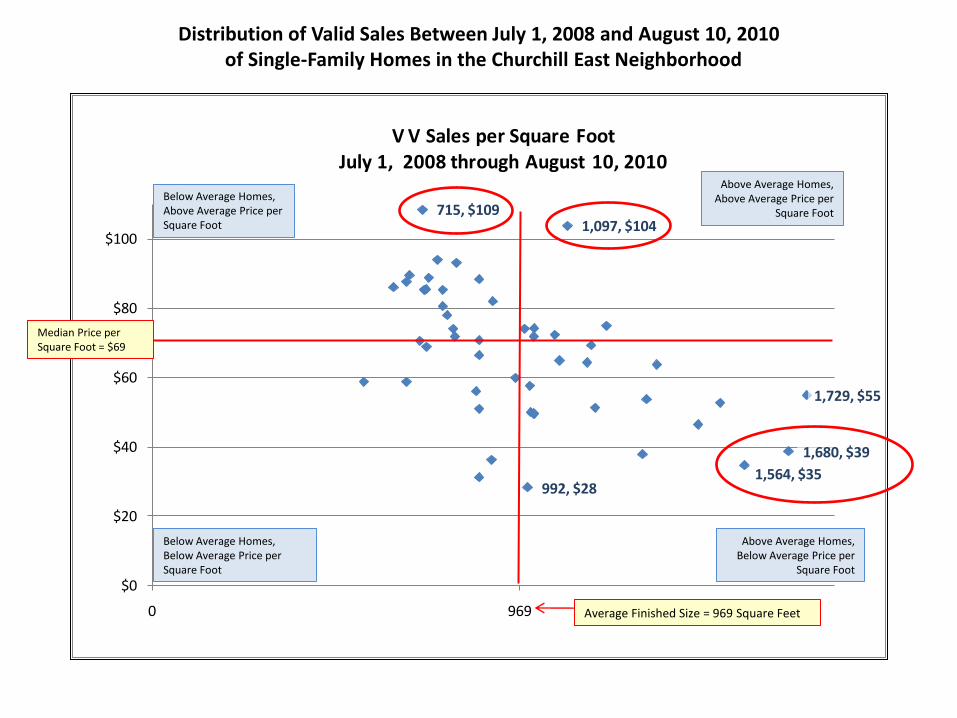
Distribution of Valid Sales Between July 1, 2008 and August 10, 2010 of Single-Family Homes in the Churchill East Neighborhood
High square footage, high price per foot
715, $109
992, $28
1,097, $104
1,564, $35
1,680, $39
1,729, $55
$0
$20
$40
$60
$80
$100
0 969
V V Sales per Square Foot July 1, 2008 through August 10, 2010
Average Finished Size = 969 Square Feet
Median Price per Square Foot = $69
Below Average Homes, Above Average Price per Square Foot
Above Average Homes, Above Average Price per
Square Foot
Above Average Homes, Below Average Price per
Square Foot
Below Average Homes, Below Average Price per Square Foot

0
10
20
30
40
50
60
70
80
90
100
25 38 36 28
43
28
17
39 47 48 38 25 23
36
36
41
28 26 28 20 26 23
34
23
25
32 22 23 16 21 18
20
32
19
32 19 19 17 19 22
23
22
18
Standardized Value per Square Foot Standardized Finished Size
Relationship Between Finished Size and Price Per Square Foot of Valid Sales Between July 1, 2008 and August 10, 2010
of Single-Family Homes in the Churchill East Neighborhood
High amount of variability in home size correlated to sale price.

Relationship Between Finished Size and Price Per Square Foot of Valid Sales Between July 1, 2008 and August 10, 2010
of Single-Family Homes in the Churchill East Neighborhood
High amount of variability in home size correlated to sale price.


