
Cork Harbour Main Drainage Scheme - EtA Modelling Study
Chapter 7 Discussion and Conclusion
7.1 Discussion
Chapter 7
The lead author of this report was commissioned by Mott MacDonald Pettit
(MMP) to undertake a detailed Environmental Impact Assessment of the likely
relative improvement in water quality as a result of the proposed Lower Harbour
Main Drainage Scheme. At present the towns of Cobh, Passage West,
Monkstown, Glenbrook, Ringaskiddy, Crosshaven and Carrigaline all discharge
untreated sewage into Cork Harbour. The proposed scheme will collect this
waste and treat it to a secondary standard at a new wastewater treatment plant
near Carrigaline. The treated effluent will be discharged through the existing
Carrigaline/Crosshaven outfall near Dognose Bank. In spite of increasing
population a marked improvement in quality is to be expected for two reasons:
(a) the reduction in pollutant load due to the treatment plant, and (b) the
increased dilution available downriver when the treated effluent is discharged
just inside the mouth of the Outer Harbour. This study quantifies the
improvement.
A computer model, called the 'OH_2' model covering an area from the Old Head
of Kinsale to the Waterworks weir in Cork City was developed. The calibration of
this model was based on that of a similar, but smaller, model of Cork Harbour
(the 'RP_2' model) which covers an area from Roches Point to the Waterworks
weir. The water level validation of the OH_2 model showed that it is capable of
reproducing the tides in Cork Harbour with an acceptable error «25cm).
The OH_2 model has been used to simulate the discharge, transport and decay
of three separate micro-organisms present in sewage from the relevant outfalls:
1. Faecal coliform bacteria - The number of faecal coliforms per 100ml
is a recognised standard in the relevant EU Directives. The I
(mandatory) and G (guide) values for the Bathing Water Directive are,
for faecal coliforms, 2000 counts per 100ml and 100 counts per 100ml
respectively. The G (guideline) values for the Shellfish Waters
143
For
insp
ectio
n pur
pose
s only
.
Conse
nt of
copy
right
owne
r req
uired
for a
ny ot
her u
se.
EPA Export 26-07-2013:02:21:41

Cork Harbour Main Drainage Scheme - EIA Modelling Study Chapter 7
Directive are, for faecal coliforms, less than 300 counts per 100ml in
the shellfish flesh and intervalvular liquid.
2. Norovirus - The Norovirus or "Winter Vomiting bug" is the primary
pathogen in outbreaks of gastroenteritis following consumption of raw
oysters. There is no standard for seawater at present due to the
difficulty of measuring its concentration.
3. Simple Nitrogen Cascade - The forcing exerted on the Harbour
ecosystem by organic nitrogen, nitrate and ammonia is examined
using a simplified nitrogen cascade model.
In order to illustrate the overall benefit of the proposed scheme a detailed
comparison was made between the case where untreated waste is being
discharged from all of the relevant outfalls in 2010 (CASE 2 in this report) and
the case where treated waste is being discharged from the single
Carrigaline/Crosshaven outfall near Dognose Bank in 2010 (CASE 3 in this
report).
The OH_2 model has a number of inherent assumptions:
• Bacteria, nitrogen, and Norovirus are neutrally buoyant.
• Adsorption onto sediment is not modelled.
• Density gradients and stratification due to variations in salinity are
excluded.
In this study we have not considered the discharges of treated effluent from
Carrigrennan, Midleton or Cloyne or the untreated discharges from the outfalls
serving the towns on the eastern side of the harbour. Neither have we
considered the intermittent discharge of storm overflows during heavy rainstorms
and/or large infiltration of groundwater into sewers. Once secondary treatment
has been introduced everywhere, these episodic discharges become important.
Therefore, the results are not representative of the absolute water quality in the
harbour and surrounding waters. They show the improvement to be expected
from the proposed treatment plant.
We have examined the measurements of background concentrations of
coliforms and nitrogen from the harbour. There are no measurements of
144
For
insp
ectio
n pur
pose
s only
.
Conse
nt of
copy
right
owne
r req
uired
for a
ny ot
her u
se.
EPA Export 26-07-2013:02:21:41

Cork Harbour Main Drainage Scheme - EIA Modelling Study Chapter 7
Norovirus in water anywhere in the world. The sampling error and the spatio
temporal variability of coliforms and nitrogen throughout the harbour make any
estimate of the background concentrations very uncertain. Consequently, in our
view, it is sufficient to model the improvement in concentrations due to the
proposed treatment plant and outfall.
It is possible to model the background concentrations but tl"lis would require
substantially more resources and time than were available for this comparative
study.
The results of the three modelled micro-organisms are discussed in the following
sections.
7.2 Faecal Coliform Results
The OH_2 model results showed that the proposed treatment plant will reduce
the number of faecal coliforms in Cork Harbour and the waters outside Roches
Point. TI-lis will lead to a considerable improvement in water quality.
The maximum number of faecal coliforms attained at each grid point of the
model for Case 2 with repeating spring tides ranged from 2 to 1500 faecal
coliforms per 100ml across the harbour. This range ignores the extremely high
concentrations in the immediate vicinity of each individual outfall. The equivalent
range with the proposed treatment plant in operation, Case 3, is 'from 2 to 400
faecal coliforms per 100ml. This represents a significant improvement in water
quality. The results of the repeating neap tides were similar.
When the average number of faecal coliforms at each grid point were compared
it was found that the range was reduced from 2 - 140 per 100ml for CASE 2 to 2
- 40 per 1OOml for Case 3.
The reduction in the number of faecal coliforms was quantified by expressing the
maximum concentrations attained at each grid point with the treatment plant in
place as a percentage of the maximum concentrations attained at each grid point
without any treatment in place. It was found that the percentage relative
reduction varied across the harbour. For Lough Mahon, the Inner harbour, the
East and West Passages as well as the area around Ringaskiddy the maximum
concentrations with the treatment plant in place were less than 5% of the
145
For
insp
ectio
n pur
pose
s only
.
Conse
nt of
copy
right
owne
r req
uired
for a
ny ot
her u
se.
EPA Export 26-07-2013:02:21:41

Cork Harbour Main Drainage Scheme - EtA Modelling Study Chapter 7
maximum concentrations with no treatment Le. there is at least a 95% relative
reduction in indicator organisms for these areas. For the rest of the harbour and
the area outside Roches Point they were less than 20% Le. there is at least an
80% relative reduction in indicator organisms for these areas.
When the averages in concentration were compared the same pattern emerged.
There was a substantial relative improvement (at least 95% relative reduction)
for Lough Mahon, the inner harbour and the East and West passages. For the
outer harbour the relative improvement was less (at least 80% relative
reduction).
This percentage relative reduction is one of the main findings of our report. The
proposed treatment plant will significantly reduce the number of indicator
organisms in the upper harbour area. It will also reduce the number of indicator
organisms in the outer harbour area and outside the harbour mouth but to a
lesser degree.
Time series of faecal coliform concentration were also presented for 15 points of
special interest. The improvement in water quality was observed from these
graphs by plotting the time series for Case 2 and Case 3 together. The
concentrations for 2030 were not presented as they are simply equivalent to the
plots for Case 3 multiplied by 1.431 .
A sensitivity analysis was carried out on the release of treated waste from the
proposed scheme with the 2010 population (Case 3). It was found that the
maximum number of faecal coliforms may increase by as much as 30 - 40 per
100ml, in certain areas of the outer harbour, when they decay with a T90 of 24
hours and not 12 hours. It was also found that the maximum number of faecal
coliforms may increase by as much as 40 - 60 per 100ml, in certain areas of the
outer harbour, with adverse wind conditions.
We have assumed that there are 1.0*107 faecal coliforms present in every 100ml
of untreated sewage. We have also assumed that the proposed wastewater
treatment plant will remove 90% of the organic matter such that there are
1.0*106 faecal coliforms present in every 100ml of treated effluent. Both of these
assumptions are conservative. In a similar study to this for a proposed
146
For
insp
ectio
n pur
pose
s only
.
Conse
nt of
copy
right
owne
r req
uired
for a
ny ot
her u
se.
EPA Export 26-07-2013:02:21:41
Cork Harbour Main Drainage Scheme - EIA Modelling Study Chapter 7
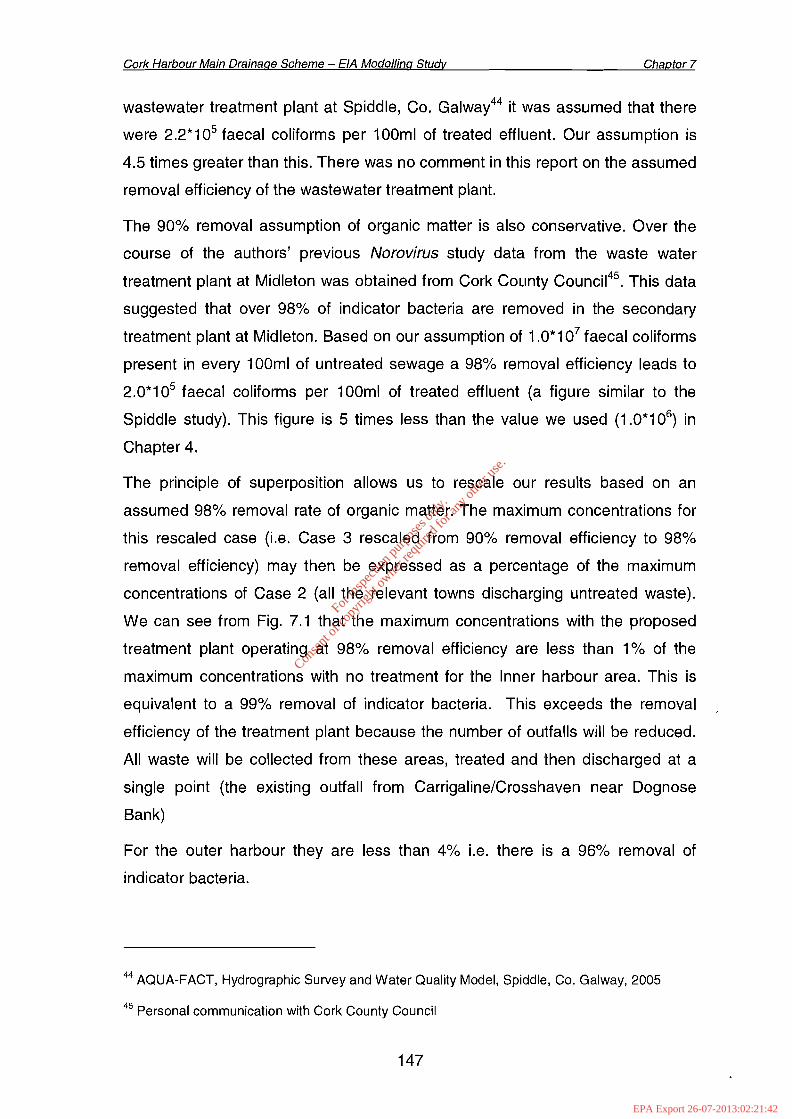
wastewater treatment plant at Spiddle, Co. Galwal4 it was assumed that there
were 2.2*105 faecal coliforms per 100ml of treated effluent. Our assumption is
4.5 times greater than this. There was no comment in this report on the assumed
removal efficiency of the wastewater treatment plant.
The 90% removal assumption of organic matter is also conservative. Over the
course of the authors' previous Norovirus study data from the waste water
treatment plant at Midleton was obtained from Cork County Council45. This data
suggested that over 98% of indicator bacteria are removed in the secondary
treatment plant at Midleton. Based on our assumption of 1.0*107 faecal coliforms
present in every 100ml of untreated sewage a 98% removal efficiency leads to
2.0*105 faecal coliforms per 100ml of treated effluent (a figure similar to the
Spiddle study). This figure is 5 times less than the value we used (1.0*106) in
Chapter 4.
The principle of superposition allows us to rescale our results based on an
assumed 98% removal rate of organic matter. The maximum concentrations for
this rescaled case (i.e. Case 3 rescaled from 90% removal efficiency to 98%
removal efficiency) may then be expressed as a percentage of the maximum
concentrations of Case 2 (all the relevant towns discharging untreated waste).
We can see from Fig. 7.1 that the maximum concentrations with the proposed
treatment plant operating at 98% removal efficiency are less than 1% of the
maximum concentrations with no treatment for the Inner harbour area. This is
equivalent to a 99% removal of indicator bacteria. This exceeds the removal
efficiency of the treatment plant because the number of outfalls will be reduced.
All waste will be collected from these areas, treated and then discharged at a
single point (the existing outfall from Carrigaline/Crosshaven near Dognose
Bank)
For the outer harbour they are less than 4% i.e. there is a 96% removal of
indicator bacteria.
44 AQUA-FACT, Hydrographic Survey and Water Quality Model, Spiddle, Co. Galway, 2005
45 Personal communication with Cork County Council
147
For
insp
ectio
n pur
pose
s only
.
Conse
nt of
copy
right
owne
r req
uired
for a
ny ot
her u
se.
EPA Export 26-07-2013:02:21:42

Cork Harbour Main Drainage Scheme - EIA Modelling Study Chapter 7
RESCAlED - Pro as %of Eld_ Ahove8
6-85-64-53-42-31- 2o Below 1
10 15 20(kllometer)
25 30
Fig. 7. 1 The maximum concentrations from the proposed treatment (98%
removal efficiency) as a percentage of the maximum concentrations with no
treatment from the relevant towns.
The predicted concentrations of faecal coliforms are compared with the
regulatory requirements in the 2 relevant EU Directives listed below.
The directives of interest are:
• Bathing Water Directive (76/160/EEC)
• Shellfish Waters Directive (79/923/EEC)
The I (mandatory) and G (guide) values for the Bathing Water Directive are, for
faecal coliforms, 2000 counts per 1OOml and 100 counts per 100ml respectively.
From the results presented in Chapter 4 we may conclude that the contribution
from the proposed treatment plant is several orders of magnitude less than these
requirements far the bathing areas.
The G (guideline) values for the Shellfish Waters Directive are, for faecal
coliforms, less than 300 counts per 100ml in the shellfish flesh and intervalvular
liquid. We can see from the results presented in Chapter 4 that the contribution
from the proposed treatment plant is several orders of magnitude less than these
requirements.
148
For
insp
ectio
n pur
pose
s only
.
Conse
nt of
copy
right
owne
r req
uired
for a
ny ot
her u
se.
EPA Export 26-07-2013:02:21:42
Cork Harbour Main Drainage Scheme - EtA Modelling Study
7.3 Norovirus Results
Chapter 7
The Norovirus was included as part of this study in order to determine the impact
of the proposed treatment plant on the oyster farms and recreational areas
present in the harbour. It was found that with the proposed scheme in place, the
number of Norovirus in Cork Harbour and the surrounding waters will be reduced
leading to a considerable improvement in water quality. The results of the model
indicate a 90 - 95% relative reduction in the maximum number of Norovirus near
the oyster farm with the introduction of the proposed treatment plant.
The maximum number of Norovirus reached at each grid point for the untreated
waste simulation (Case 2) ranged from 2 to 18,000 Norovirus per cubic metre.
This range ignores the extremely high concentrations in the immediate vicinity of
each individual outfall. The equivalent range with the proposed treatment plant in
operation (Case 3) is from 2 to 2,000 Norovirus per cubic metre indicating an
improvement in water quality.
The reduction in the number of Norovirus was quantified by dividing the
maximum values for the treated waste situation (Case 3) by the maximum values
for the untreated waste situation (Case 2) and multiplying the answer by 100.
This expressed the maximum concentrations with the treatment plant in place as
a percentage of the maximum concentrations without any treatment. It was found
that the percentage relative reduction varied across the harbour. For Lough
Mahon, the Inner harbour, the East and West Passages as well as the area
around Ringaskiddy the maximum concentrations with the treatment plant in
place were less than 10% of the maximum concentrations with no treatment i.e.
there was a 90% relative reduction in the maximum concentrations of Norovirus
in this region.
For the rest of the harbour and the area outside Roches Point they were less
than 20% i.e. there was an 80% relative reduction in the maximum
concentrations of Norovirus in this area.
Time series of Norovirus concentration were also presented for 15 points of
special interest. The improvement in water quality was observed from these
graphs by plotting the time series for Case 2 and Case 3 together. The Norovirus
149
For
insp
ectio
n pur
pose
s only
.
Conse
nt of
copy
right
owne
r req
uired
for a
ny ot
her u
se.
EPA Export 26-07-2013:02:21:42

Cork Harbour Main Drainage Scheme - EtA Modelling Study Chapter 7
plots for 2030 were not presented as they are simply equivalent to the plots for
Case 3 multiplied by 1.431.
Regulatory requirements on concentrations of Norovirus are not included in any
of the EU Directives on water quality.
7.4 Nitrogen Results
Nitrogen in different forms is an important nutrient in the coastal zone. Changes
in the speciation and distribution of nitrogen can increase or decrease primary
production by phytoplankton and macrophytes rooted to the bed of an estuary or
harbour. We have chosen to examine the impact of the proposed scheme on
such forcing by using a linear cascade model containing three species of
nitrogen: organic nitrogen, ammonia and nitrate. The model quanti'fies the
relative effect of the scheme on the concentration of these three species
throughout the harbour and adjacent coast over a test period of ten days. The
effect is with respect to an unaltered background concentration of each species
of nitrogen.
The results reported were estimates of the change in forcing, expressed as
changes in the concentrations of the three species of nitrogen, due to the
proposed scheme. They are estimates of relative changes compared to the
background concentrations of nitrogen. We have left the judgement of the wider
consequences of these relative changes in nutrient forcing to the marine
ecologists advising the project.
The time series presented in chapter 6 showed a marked reduction in
concentrations of ammonia and nitrate in all of the fifteen points of special
interest to the project compared to the unspecified background following the
introduction of treatment. In other words the desired improvement has been
demonstrated and quantified in the model under the specified conditions of tide,
river flow and wind.
The spatially varying maps of concentration showed that the proposed scheme
will reduce considerably the forcing on primary production in the inner harbour
(Lough Mahon) and in the North Channel behind Great Island. There is also an
improvement throughout the Outer Harbour with the possible exception of the
150
For
insp
ectio
n pur
pose
s only
.
Conse
nt of
copy
right
owne
r req
uired
for a
ny ot
her u
se.
EPA Export 26-07-2013:02:21:42
Cork Harbour Main Drainage Scheme - EtA Modelling Study Chapter 7
immediate vicinity of the diffuser itself. The model does not resolve the near-field
of the diffuser and results from our model very close to the diffuser may not be
accurate.
7.5 Discussion of results inside and outside the mouth
A large area outside the mouth between Ballycotton and Oysterhaven gradually
accumulates material discharged from the Outer Harbour on successive ebb
tides. During all tides we have simulated, a large anticlockwise eddy forms
immediately outside the mouth during the ebb. It is fed from the western side of
the Outer Harbour. When the tide turns all the simulations show the tide running
initially on the eastern side of the mouth and in many cases this feeds water of
oceanic quality into the Outer Harbour improving its quality. This appears to be
associated with a weak residual current along the coast to the southwest for the
period we have chosen to simulate with the model (June 2004). Data from
moored in situ devices would confirm this. This is extremely expensive and
difficult to do. There are also several smaller eddies on the eastern side of the
mouth during the flood tide as it enters the harbour.
Consequently, we are unable to indicate with confidence and precIsion what
effect the proposed scheme will have on the concentrations of coliforms and
Norovirus in the coastal waters between Ballycotton and Oysterhaven. However
the model shows a reduction in concentration.
151
For
insp
ectio
n pur
pose
s only
.
Conse
nt of
copy
right
owne
r req
uired
for a
ny ot
her u
se.
EPA Export 26-07-2013:02:21:42

Cork Harbour Main Drainage Scheme - EtA Modelling Study
152
Chapter 7
For
insp
ectio
n pur
pose
s only
.
Conse
nt of
copy
right
owne
r req
uired
for a
ny ot
her u
se.
EPA Export 26-07-2013:02:21:42

Cork Harbour Main Drainage Scheme - EtA Modelling Study Appendix A
Appendix A Calibration of the RP_2 model
The calibration and validation of the RP_2 model is described in this Appendix.
The parameters from the calibrated RP_2 model (run with recorded data) have
been exported and used in the OH_2 model (run with Proudman data).
A.1 Development of the RP_2 model
The Roches Point_2 (RP_2) model has two separate grids each of varying
resolution (see below). The outer grid has a grid spacing of 30m and covers the
outer harbour. The narrow Belvelly channel is resolved with a 10m resolution.
, ,
x~
12 :: <
" '''<~ y.:< X~,x' ,
x 'x' ,~
x:, ',y,
.xx~. x
~'X, . x~0
x. ..' .'0 2 4 6 8 10 12 14 16 18 20 22 24
(kilometer)
Bathymetry (meter)
o Above 2o 1- 2o 0- 1o -1- 0o -2--1
-4 - -2-6 - -4-8 - -6
-12 - -Bo -16--12o -20--16o -25--20o -30--25-35 - -30-40 - -35
Below-40
• x
..
~x :
.~}~'x· ,
< • x~
i~
'x •
x
:- x' ,:-< ,r'; xx:x·x.'~', . x . :x.'.
, x)(.: x-<x,
2
, .xx ' ,
10 '~ , xx
'i ;, ~x,Qi 8 ' .~ "c< x
.... ,<.- 6 '~'
~ ~0',?:><x' >O! '4 <xxx xx
Layout of the RP_2 model. The resolution of the 2 nested grids are 30m and
10m
A.2 Calibration of the RP_2 model
Previous RP model
The calibration of the RP_2 model is based on the calibration of a similar model
in the authors' previous work. This model, named the RP model, covers the
same area as the RP_2 model but is resolved with 3 separate nested grids each
with a different resolution (see next page).
153
For
insp
ectio
n pur
pose
s only
.
Conse
nt of
copy
right
owne
r req
uired
for a
ny ot
her u
se.
EPA Export 26-07-2013:02:21:42

Cork Harbour Main Drainage Scheme - EtA Modelling Study Appendix A
Cl Above 4Cl 2.7- 4
§ 1.5· 2.70.2 - 1.5
-1.1 - 0.2Cl -2.3 - -'l.1
-3.9 - -2.3-4.8 - -3.6-6.1 - -4.8-7.4 - -6.1-8.6· -7.4-9.9 - -8.6
-11.2 - -9.9-12.4--11.2
Cl -13.7 --12.4-14.9 - -13.7-16.2 - -14.9-17.5 - -16.2-18.7 - -17.5
-20 - -"18.7Below -20
2
4
6
10
14
12 -
0--, , , i I 'i i i , i I i I • i I , i I I I i i I i • i I i i i
o 2 4 6 8 10 12 14 16 18 20 22 24 26 28(kllometer)
RP model bathymetry plot from the previous study by the authors'. 3 nested
grids of varying resolution (54m, t8m & 6m) are used in this model.
The calibration and validation of the RP_2 model is very similar to that of the RP
model.
Calibration Period
The model was calibrated and validated using the data from the 1992 survey by
Irish Hydrodata. As discussed in chapter 2 six automatic water level recorders
were deployed at sites in the Inner and Outer harbour on three separate
occasions in December 1991 and January/February 1992,as well as two current
speed and direction recorders. Data from the Fort Camden gauge was used to
drive the hydrodynamics of the RP_2 model by acting as the boundary condition
at Roches Point. Data from the Pfizer (water level), Lough Mahon (water level
and current speed/direction), Belvelly (water level) and Spit Bank (current
speed/direction) gauges were used to calibrate and validate the hydrodynamic
model.
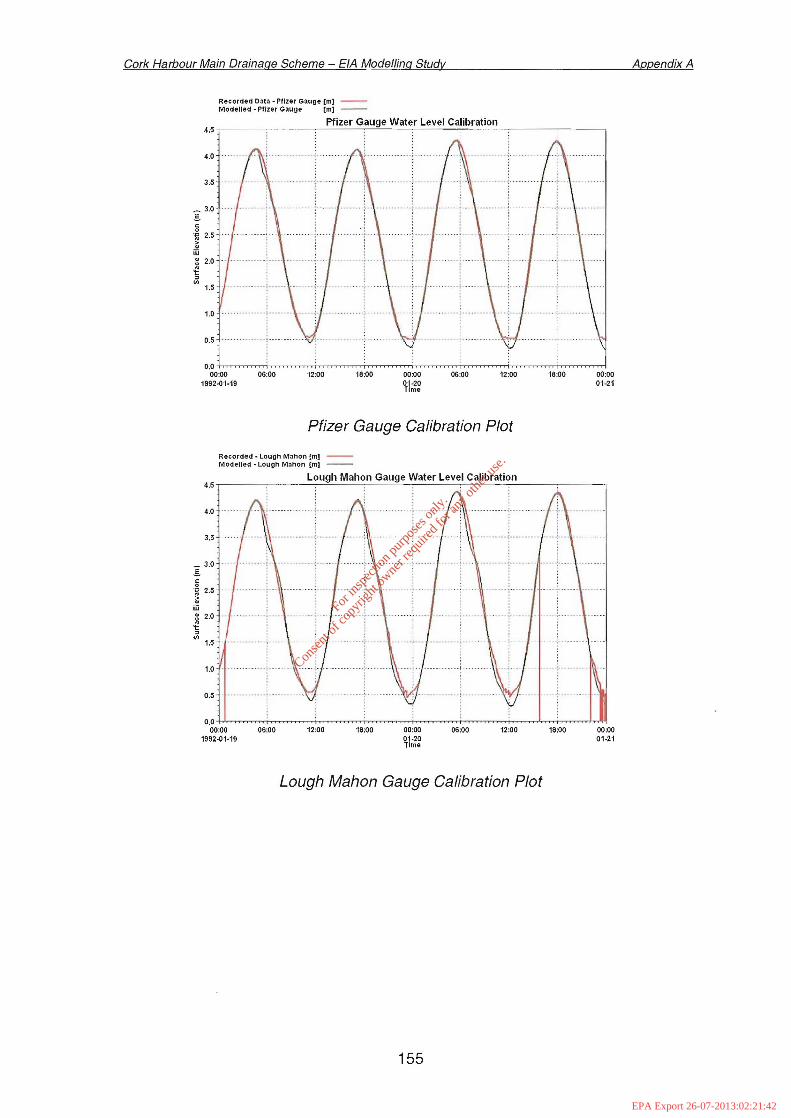
Water Level Calibration Plots
The water level calibration plots are shown below. The modelled data is plotted
with a green line while the recorded is shown with a red line. We can see from
the figures that there is a very good match between the recorded and modelled
data for all three gauges.
154
For
insp
ectio
n pur
pose
s only
.
Conse
nt of
copy
right
owne
r req
uired
for a
ny ot
her u
se.
EPA Export 26-07-2013:02:21:42
Cork Harbour Main Drainage Scheme - EIA Modelling Study Appendix A
Recorded 001ti:l - Pflzer Gauge [m] -Modelled· Ptlze, Gauge [m]--
Pfizer Gauge Water Level Calibration4.5 ,-- -,- -,-.:....:.c=.:..:........:.,..--=-_:........::........:=-=--:........:..:...:;~.:..cc_'__,____---,____--___,
4.0
3.5
_ 3.0.§.c0." 2.5N>~
w~ 2.0
of!"Ul
1.5
1.0
0.5"""r_. _ .. ~ ......•..... _-
.-:....
00:0001·21
18:0012:0000:0000:00
~1~~
18:0012:0006:00O.O-t.,-,~~~...,....~~~crr~~~......,~~~~".....~~~.,..,..,~~~...,....~~~,.....,.~=~..,..,-j
00:001992.01·19
Pfizer Gauge Calibration Plot
Recorded· Lough Mllhon [m] -Modelled· Lough MJhon [m] --
4.5 .--__---, -=Lc..;.0-=u"'g:..:hc..;.M:.:..a:::h-=o:..:n.:...G-=-=a-=ugo,-e.:...-=W.:...a-=t-=er-=L=.e.:...v-=e:,:.I...:Cc..;.a:::li-=br:...:a:..:ti:...:o-=n:........:__.,--__--.
4.0
3.5
_ 3.0.§.co'!:; 2.5~W~ 2.0
of!"Ul
1.5
1.0
0.5
00:0001·21
18:0012:0006:0000:00
~1~~
18:0012:0006:000.0-j-,1,~~~-;..,..,~~~-;..,..,~~~-;..,..,~~~-;.,..,.~~~.;..,..,.~~~.;..,..,.~...,l,.~,..,.~.....-I~
00:001992.01·19
Lough Mahon Gauge Calibration Plot
155
For
insp
ectio
n pur
pose
s only
.
Conse
nt of
copy
right
owne
r req
uired
for a
ny ot
her u
se.
EPA Export 26-07-2013:02:21:42

Cork Harbour Main Drainage Scheme - EIA Modelling Study Appendix A
Recorded Data· Bell/ally Gauge [m] Modelled - Belvelly Gouge [m]-
Belvelly Gauge Water Level Calibration4.5 ,-_-----,-__---,---_-----=-----,------=---------"-',-'-'--=.::...c....:c;~--_:__--_,____-____,
4.0
3.5
_ 3.0
.sc.~ 2.6 ----1---····::···ii;iii~ 2.0.g::JVI
1.5 .-
1.0
0.5 .. _.
00:0001·21
18:0012:0006:0018:0012:000.0f,-r-.-~-.--.--.-r~~_._._;__~~...,.,....,~,...,.,..,.,~~.......,....~~.........._~~,.........,...~......_rl
00:00 06:001992-01-19
Belvelly Gauge Calibration Plot
From these figures we can conclude that the RP_2 model can reproduce the
observed tides in Cork Harbour.
Current Speed and Direction Calibration Plots
The current speed and direction calibration plots are presented in the following
set of figures. We can see from the figures that there is an excellent match
between the modelled and the measured data for the Spit Bank gauge in the
outer harbour. The current speeds on the ebb tide for this gauge are very well
matched with the modelled data. There is slight underestimation on the flood tide
(0.1 - 0.15m/s). The time at which slack water occurs is also in very good
agreement in both the model and the data.
We can also see that there is a very good agreement between the measured
and modelled current direction for this the Spit Bank as well.
156
For
insp
ectio
n pur
pose
s only
.
Conse
nt of
copy
right
owne
r req
uired
for a
ny ot
her u
se.
EPA Export 26-07-2013:02:21:42

Cork Harbour Main Drainage Scheme - EIA Modelling Study Appendix A
Tidal Sional [In]Recorded Current Speed, Spit Bank [mfs) -Modelled Current Speed, Spit Bank [mJs] --
Spit Bank Current Speed Calibration,-----------,-------,-''---------,-----'----,-------,.------------,------r4.5
1.0
0.50.05
0.15
0.10
0.55 -----./\ ··----·i--·· {\ ---. - -J--- II' ---:.. 1"" --.-- .. - ,/,' '--r- - I '\ ---~---- ..-- .. i\ 4.0
0.50 ----1---,--·--:·-- . \... .. ~ ~. --: -1-\ I-\---T ;--\ -!--.--~-t .. \.--0.45 --A --'\""'I"~! \ -I ----\ : }--\ :--.. .. .. \--T-- -----r ,.. -- -- '--"r 3.5
~ 0.40 .. -~- ----\ ... :-- If" 1·..·· ~ .... , ~..... ~- -,--, -'--- -- .---- ./--.\. 3.0 :§:
i 0.35 . ~\---1 .:. { r t--" -(. I ' ! -.---- .. --. 2.5·~~ 0.30 r --' ~ --i !-- 1I \ '~.--- r --. t\· :---- {- ).. .' --. 1 ~l: [ '\ I \ ! ._ l-- -,'.-.' '\-\'!"::' .. ., ,;_ 2.0 ;Ut":"30.25 /'" --- \ 'j' r- -. I r .. ;-- --. 'i ,-- t TT I I
0.20 t-- .. T!' J""\ -- --\":' r- -- --\... r ·t· -'-y' ., -- 1.5 '"
---\- : ~ ..... --"I' - --'I'; --- ......\: .l.., .. \~-- "f .
.\ ----\: ---\!._--\. \- , --\--,----'i,; ------- --or '-- ~ :.\. . :.\
o.oo-t......-~~.........., .........~~.,...,....,.~~~.....,...~~~,.,..,...~~~"..,..~.----ri-..........,~~~....._t_o.o00:00 12:00 00:00 12:00 00:00 12:00 00:00 12:00
1992-01,20 01-21 01·22 01·23Time
Spit Bank Current Speed Calibration
Spit Bank Current Direction Calibration
350
300
(i)
~ 250
'"Ql
~c 2000'u~is 150
E~:;
100()
50
Ol-"N-..L--_--"'P"""""L-__-=-~l____..L.
20/01/199200:00 2010111992 12:00 21/01/1992 00:00 21/01/1992 12:00 22101/199200:00 22101/1992 12:00 23/01/199200:00
Time-
-- Recorded Current Direction --Modelled Current Direction
Spit Bank Current Direction Calibration
The current speed and direction calibration plots for the gauge in Lough Mahon
are now presented. We can see from the figures that there is a slight
underestimation of the current speed on both the flood and ebb tides. We can
see that the difference is not consistent for the different tides. It varies from 0.05
to 0.25m/s. The general directions on the flood and ebb tides of the model are in
157
For
insp
ectio
n pur
pose
s only
.
Conse
nt of
copy
right
owne
r req
uired
for a
ny ot
her u
se.
EPA Export 26-07-2013:02:21:42

Cork Harbour Main Drainage Scheme - ElA Modelling Study Appendix A
agreement with the measured but there is a slight variation in the timing of the
turning of the tide when it switches from ebb to flood.
The gauge in Lough Mahon is located in the centre of the Lough at the point
where the shallow mudflat meets the dredged channel. The flow here is quite
complicated with strong localised, subgrid hydrodynamics. Capturing this is quite
difficult because the modelled currents are averaged over a 30m grid cell. The
calibration is well within an acceptable limit of error.
Recorded Current Speed· LouO" Mahon [mJs] -Modelled Current Speed· Lough Mahon [m/S] --
Tldol Slgn.1 [m] - - -
0.90
Lough Mahon Current Speed Calibration1.00,-------:-----"'-,.-----------,--'-----------,-------,-------r5.0
••••••••• , •• , 0 •••••••••••••• _ ••••••• ~••••• _-"'_ ••• _-_ •• -.:.. - ••••• - ••~ _.(' ••••••••• 4.6
'I' '\ 1\: (\ ' f \0.80 .-/\,.. l ,'..\ : .. )-"\..-' .1\ ;. I'T ..; .. "'T'" 4.0
: \ : \: I0.70')-\'" jf- "('....·1· .. /.- \_.-.. ..... \ '\' ......('... .\" .. 3.5
i 0.60-f~\ ;. 11 \. 1 \ {... -\.. N' \.. :.- \ 3.0 IJ0.50 \ . ;"/1 L. -<-.. ._\.. . t. . .. \. ,........\ 2.5 ~
~ 0.40 ..\ i· \. L. . \ .. '.... \ -\ . - \ 2.0 ~u : : J \ I \ (I)
::~A\i Ka \T;\A\i!il/J,,\N .\,::." if \.. . V1;~ ··\V,W \ ~\ ~ ,{ .,0.00 0.0
12:00 00:00 12:00 00:00 12:00 00:00 12:001992-01·19 01·20 01-21 01-22
Time
Lough Mahon Current Speed Calibration
Lough Mahon Current Direction Calibration
350
300
-;;;-250Q)
Q)
mQ)
~200c:
0"111!
150Ci1:~
100::IU
50
0
191011199212:00 201011199200:00 2010111992 12:00
Time
211011199200:00 2110111992 12:00 22101/199200:00
- Recorded Current Direction - Modelled Current Direction
Lough Mahon Current Direction Calibration
158
For
insp
ectio
n pur
pose
s only
.
Conse
nt of
copy
right
owne
r req
uired
for a
ny ot
her u
se.
EPA Export 26-07-2013:02:21:42
Cork Harbour Main Drainage Scheme - EIA Modelling Study Appendix A
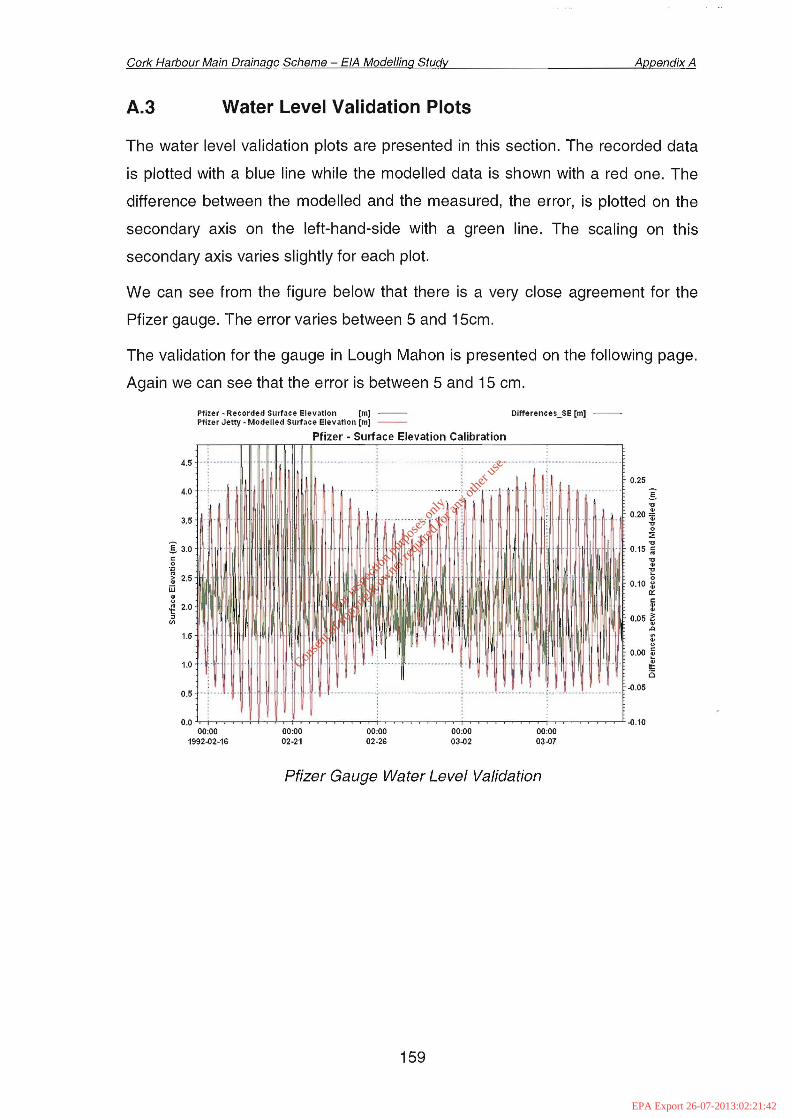
A.3 Water Level Validation Plots
The water level validation plots are presented in this section. The recorded data
is plotted with a blue line while the modelled data is shown with a red one. The
difference between the modelled and the measured, the error, is plotted on the
secondary axis on the left-hand-side with a green line. The scaling on this
secondary axis varies slightly for each plot.
We can see from the figure below that there is a very close agreement for the
Pfizer gauge. The error varies between 5 and 15cm.
The validation for the gauge in Lough Mahon is presented on the following page.
Again we can see that the error is between 5 and 15 cm.
Pllzer· Recorded Surface Elevation [Ill] -- Differences_SE [Ill] --Pllzer Jetty. Modelled Surface Elevation [Ill] --
Pfizer - Surface Elevation Calibration
4.5 - ------------_ .. ...:....------------------_ : -
4.0
3.5
g 3.0co.~~ 2.5ijj..~ 2.0::>
(/)
1.5.
1.0
0.5
... ':. ---- ---. _. ----_. - . ~ .. ... .... .0.25
-S."
0.20 ~."o
::E."
0.15 :ii."..1!o
0.10 :;:0::
~0.05 ~
.Q
......(,>
0.00 ;
~o
~.05
00:0003~7
00:0003~2
00:0002-26
00:0002·21
0.0 .1,-i-~~_:._l___r_+__.._+~~~~_.___i__~~~~~~~~~___f__,~~~_,_L~.1000:00
1992~2·16
Pfizer Gauge Water Level Validation
159
For
insp
ectio
n pur
pose
s only
.
Conse
nt of
copy
right
owne
r req
uired
for a
ny ot
her u
se.
EPA Export 26-07-2013:02:21:42

Cork Harbour Main Drainage Scheme - EIA Modelling Study
Lough M.hon - Recorded Sur1.ce Elevation [m] -- LMAHON_DIFFERENCES [m]Lough M.hon • Modelled Sur1.ce Elev.tlon [m] --
Lough Mahon • Surface Elevation Calibration
4.5 ..
Appendix A
0.25
4.0 .. ; ..... -- - -- -
3.5
3.0
2.5
2.0
1.5
1.0 - ..
- -:- ~ - ---_ (- -
·1,
1\'\ "
0.20
0.15
0.10
0.05
0.00
~.06
~.10
~.15
0.5 - - - -. -:- -. --- .. -.. - -~ -_.. . _.. --- _.. _.. ,_. .. _ .~.20
~.25
00:001992~2-16
00:0002·21
00:0002-26
00:0003~2
00:0003~7
Lough Mahon Gauge Validation
The validation for the Belvelly gauge is presented below. We can see that the
error is between 5 and 18 cm.
Belvelly Ch.nnel· Recorded Surf.ce Elev.tlon [m] BelvellLDifferences [m]Belvelly Ch.nnel· Modelled Surf.ce Elev.tlon [m]
Belvelly Channel - Surface Elevation Calibration..----------,:---------------------------r 0.20
4.5
0.154.0
3.5
:§: 3.0co..,~ 2.5iIi
'"<.>.g 2.0::J
Vi
1.5
1.0
0.5, .
•• • •• • •• ~ •• -. • •• - "I •• - • -. _ ••••.••• -_ •••• _. - - -,- - _.. ,
:§:~
0.10 ~-0o
:iE-0
0.05 ~
~'Eo
0.00 ;;:0:c
*~.05 ~..0
'"'"<.>C
-0.10 ~
lI:o-0.15
00:001992~2·16
00:0002-21
00:0002-26
00:0003-02
00:0003~7
Belvelly Gauge Validation
160
For
insp
ectio
n pur
pose
s only
.
Conse
nt of
copy
right
owne
r req
uired
for a
ny ot
her u
se.
EPA Export 26-07-2013:02:21:42
Cork Harbour Main Drainage Scheme - EtA Modelling Study Appendix A
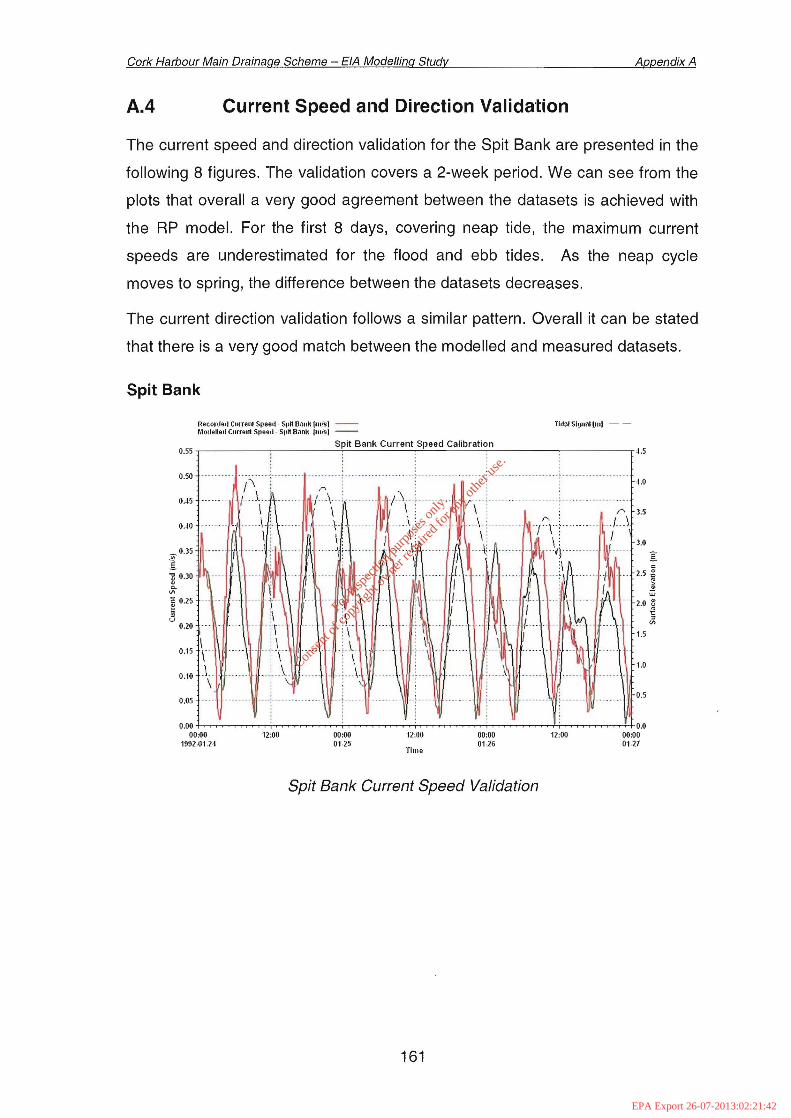
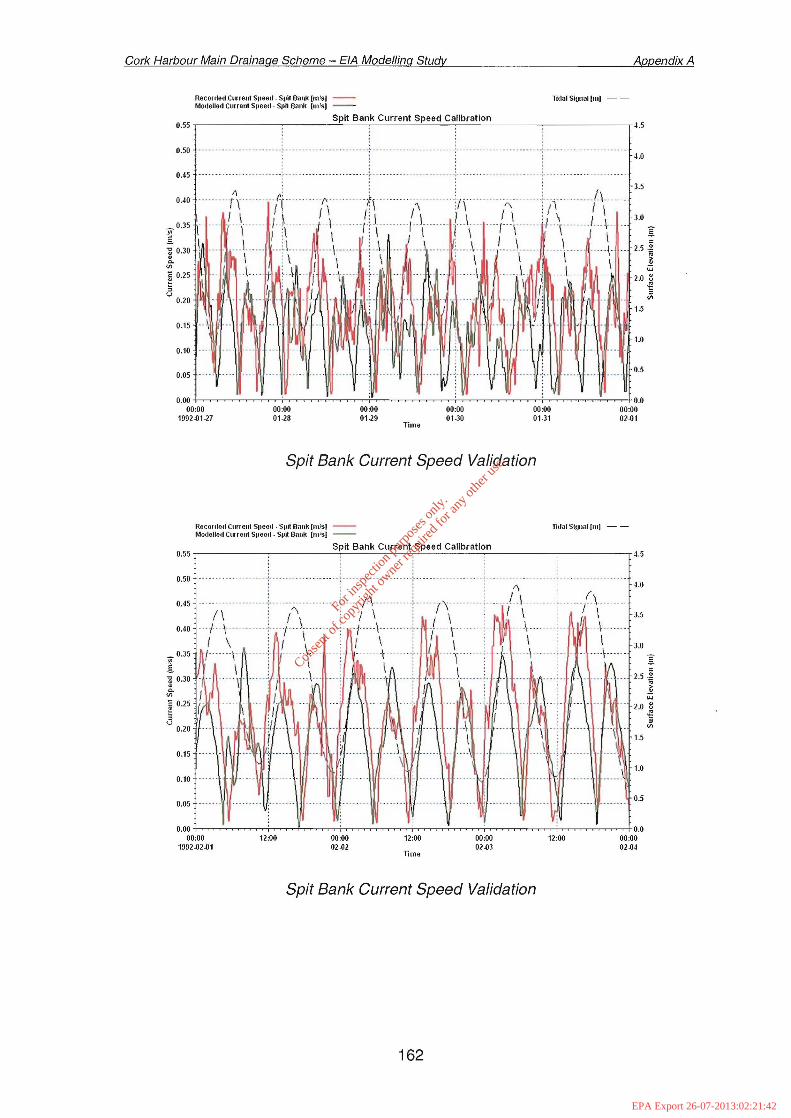
A.4 Current Speed and Direction Validation
The current speed and direction validation for the Spit Bank are presented in the
following 8 figures. The validation covers a 2-week period. We can see from the
plots that overall a very good agreement between the datasets is achieved with
the RP model. For the first 8 days, covering neap tide, the maximum current
speeds are underestimated for the flood and ebb tides. As the neap cycle
moves to spring, the difference between the datasets decreases,
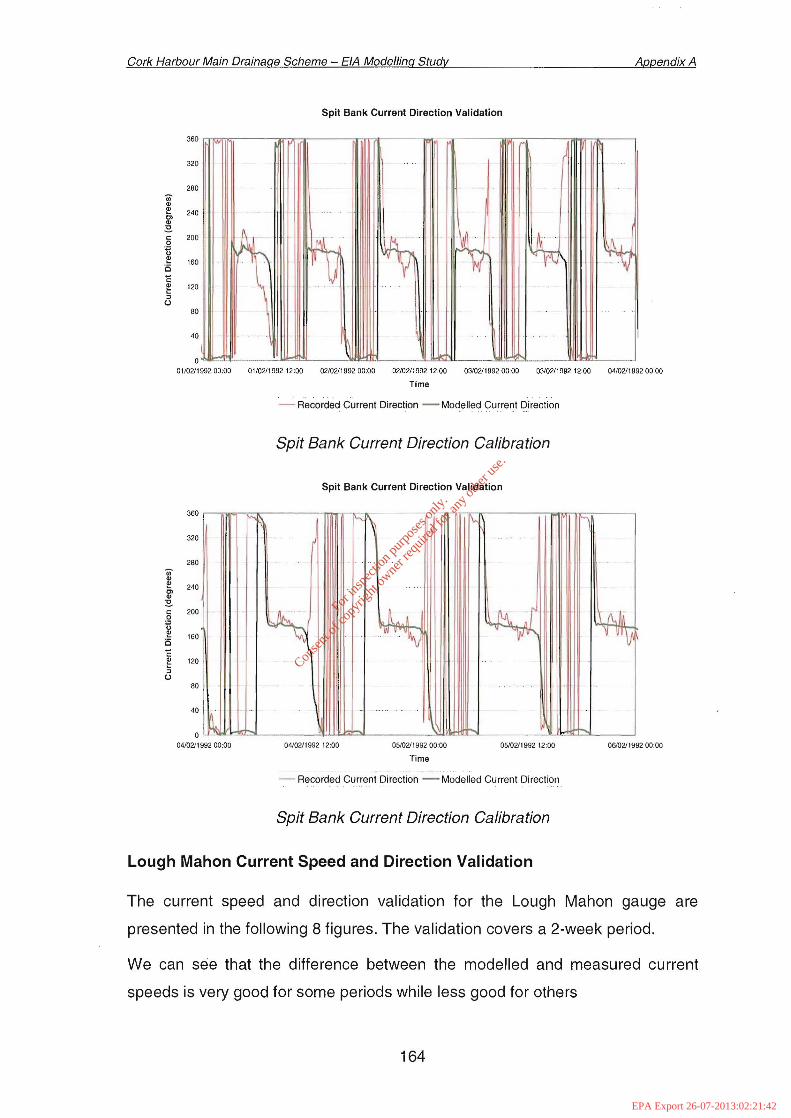
The current direction validation follows a similar pattern. Overall it can be stated
that there is a very good match between the modelled and measured datasets.
Spit Bank
Tltli.ll SiUlllllllll) --Reconletl CurreIT1 SlIeetl- 5,," Bank (lII!sl Modelletl ClInen1 SlIeetl- Slit! S.mk IllIis) -
Spit Bank Current Speed Calibration0.55 ,-------,-----------',-------,--'------'-----'-----,,----.,----------r4.5
0.50.05
\0.15 r-010 .L. \
. ,. . ,
:: /\ .,\~~/\F:·:(\L</~'/< ::-.. -.- /----\.: -..-.. . ~ ,- ---. 'A ~ \'A_ .. --f!' ..\i. ...... -~.\/l---- ....- 1 -. 3.0 I
~.-- ~~ I\--- '- ----- .-.. -- ---i --.. .. ,~M "'--1 2.5 j----1-\- ~. \ ~ - ... j--- -..- }--- - --: \"---~-" 2.0i
- .. j\ .. if' -- --- --- /..-. ... 1--- ~... ..--. 1.5 (/>
---- -- ---!.\-. 1-- .. · - .L\ - \. .\ I~ .. i --- . -- .....: \ : I : \\; 1.0
-+"\ -- ... :... \.~ ..\ :.. ---\
.. -:- .. --_. -- - ~ .. t· -. ---
_ 0.35
I] 0.30Q.
(/>
~ 0.25
<50.20
o.oo-j----.-.~~~.___;___.__~~~......;-,~~~r-r-i-~~~_.__._i_~~~-.----r+-j---,---,-~~~o.o
00:00 12:00 00:00 12:00 00:00 12:00 00:001992-01.24 01·25 01·26 01·27
Time
Spit Bank Current Speed Validation
161
For
insp
ectio
n pur
pose
s only
.
Conse
nt of
copy
right
owne
r req
uired
for a
ny ot
her u
se.
EPA Export 26-07-2013:02:21:42
Cork Harbour Main Drainage Scheme - EtA Modelling Study Appendix A
Recorded Cllrrent Slleecl- Sllit Ballk (111.151 -Modelled Current SlIeed- SI)" Bank (111.15) --
Til1al Slunill (Ill) --
Spit Bank Current Speed Calibration0.55.,....-----------''----------'---------------------,-4.5
0.50. ,-. ~. ~.:-. .. .. ~. . ---- --_. -:- -- .. - ..__ .--_. ---. , .. , 4.0
0.45 ·· ··· --··r---- --.--.-- -- .. ----~----.. -- -- : .. .
0.5
1.0
3.5
F' , 1\. --/' :1 /'1 (I 1\
"1.1\ .. ·.. ·· -l--\·····t·y·" t .\....--.r.\..... 3.0 g........ L.t. ... J...J..... I \ 0: I \ "T'" .... \ 2.5 ]
....\ " .. \.. 1 ... J __ ., .-- .. 2.0 ~
I ( I ~n, . en Vi
1.5
,; . /1'[. f'1" tl, \ ' , I: \
I J . -- -- --1----· --I .I (:1 \ : \
.. .L d..... ...-\-- ." .~.1.
\ : " I \ : \. I.... I :'~'" J ...~----. ':'" \
J: J. .~.. ..
I ... :I~NWW~. --. . '.' ..,
0.40
_ 0.35
~i 0.30
Vl
~ 0.25!;u
0.20
0.15 .. \
0.10
0.05
0.00 +-.-~~~~~i-r-~~~~~r-.-~~~~-.-;~~~~~........;_~~~.......;..~-.-+O.O00:00 00:00 00:00 00:00 00:00 00:00
1992-01.27 01-28 01-29 01-30 01.31 02-01Time
Spit Bank Current Speed Validation
Tillal Stuni'll [Ill] --Recorded Cllrrent Speetl· Spit Bnnk [111151 -Modelled Cllrrenl Speoll - Spit B'lIlk [ill/si --
Spit Bank Current Speed Calibration0.55.,....-----------''----------,---'---------------------,-4.5
4.00.50
· .· .- - .'-- - •.. --. . - - - • - - - - - _1- - - - - - - - - - -- - - - - - - -r -. --_. _. -_. -- ~ .. _.
· . /\ , (
0.45 •·•·•·· ..i· . /\" .. ··..i· /\ . '+n" . ··1····--/..\...··----~-- ..TL--.0.40 .../\ . : ./ . __ .! ~'i __ .\. : .!...-\ .....:..~~ ..\... .~ .. #. \. 3.5
_." I~/\······i 1\ . I \.l \(1 ..\......\ · ..\ ,•.
... ~ .~ N~ 2.5 i~w
2.0 8
a::\~i(~j\'\ ......\ .)1.0
0.10
0.050.5
0.00 +---~~~~.;-.-.~~~~;..,.,.~~~.,.....;c.,....~,_;._,.~........;.~~~~...,...;.~~~~40.000:00 '12:00 00:00 12:00 00:00 12:00 00:00
1992-02-01 02-02 02-03 02.04Time
Spit Bank Current Speed Validation
162
For
insp
ectio
n pur
pose
s only
.
Conse
nt of
copy
right
owne
r req
uired
for a
ny ot
her u
se.
EPA Export 26-07-2013:02:21:42

Cork Harbour Main Drainage Scheme - EIA Modelling Study Appendix A
Tldol SIUllol [1111 --Reconled Cmren1 Srleell- Spit Bank (m/s) -Mollelled Curren1 SIJeecl- $pn Btlnk Imlsl --
Spit Bank Current Speed Calibration0.55 .------:----~----'-____:_---___:_-'----'--_,__---___,__---_,__--____,_4.5
0.10
3.0
4.0
0.5
1.0
1.5
\·t ..
I,·t '
\
. \.\
,-- "'1',I;\!i
. .. ... .. , ...... ,~.. , .. , ...~ ..... , ..\' --~"
1\ : I' :.1 1I("r: ~ "\'T--~ --i"T";"" 't·: , ..1.
\ : I \ ~ fl \/. ' 'j' ~ '1"r' i '\I ~ I ~ Ir .;'" I ... .~-- I'I '1\: II ';" :- .. ,1\~: ...L "'\ '.. ..L',
\ \... , .....\ . ..\.,
\ \
- .... ~ .... "
00:00 12:00 00:00 12:0002-ll5 02-llG
Time
0.50 ","'/1,.,',.+".
1~ f\\ ..\----
I I: \0.40 --~I--'\'--:-- ~ --r--
\ I ~ \... '--\ -- '/ --I'
D/ \ I I1 r
1..."\ I \.\ j.. ,.L
I \/--.\) \
0.05
0.15
0.45
_ 0.35~S] 0.30c.
Vl
~ 0.25
5u
0.20
Spit Bank Current Speed Validation
Spit Bank Current Direction Validation
fl\i
..
~I ~ ~, .....
~ ~
l~
~..1'1
~,~I
~
\I
320
360
40
80
ce 12():;U
o27/01/1992 27/01/1992 28/01/1992 28101/1992 29/01/1992 29/01/1992 30101/1992 30101/1992 31/01/1992 31/0111992 01/0211992
00:00 12:00 00:00 12:00 00:00 12:00 00:00 12:00 00:00 12:00 00:00
Time
280lil
Cl>Cl>5> 240Cl>
~
.Q 200
;;e 16c)o
.- Recorded Current Direction - Modelled Current Direction
Spit Bank Current Direction Calibration
163
For
insp
ectio
n pur
pose
s only
.
Conse
nt of
copy
right
owne
r req
uired
for a
ny ot
her u
se.
EPA Export 26-07-2013:02:21:42
Cork Harbour Main Drainage Scheme - EIA Modelling Study Appendix A
Spit Bank Current Direction Validation
..
I
fh ~I
~. ~ ~, ~\ . -..
'-' ~ -_. ..~ _._--- ..o01/021199200:00 011021199212:00 02/021199200:00 021021199212:00 031021199200:00 03/021199212:00 04/021199200:00
Time
360
320
280
enQl
~ 240ClQl
~c: 200.2(;~ 160Cc:~ 120:;()
80
40
- Recorded Current Direction - Modelled Current Direction
Spit Bank Current Direction Calibration
Spit Bank Current Direction Validation
rv'-\~ 1'"'-~ I\., '1
I ~tJ.aj lli .ll1~~:w i'~1\\7 ~ \j~
! ....
I lI~-
..... \' ......
360
320
280
enQl
~ 240g>~c: 2000
'n~ 160C~
c:~ 120
"()80
40
o04/0211992 00:00 04/02/1992 12:00 05/021199200:00
Time
0510211992 12:00 06/021199200:00
- Recorded Current Direction - Modelled Current Direction
Spit Bank Current Direction Calibration
Lough Mahon Current Speed and Direction Validation
The current speed and direction validation for the Lough Mahon gauge are
presented in the following 8 figures. The validation covers a 2-week period.
We can see that the difference between the modelled and measured current
speeds is very good for some periods while less good for others
164
For
insp
ectio
n pur
pose
s only
.
Conse
nt of
copy
right
owne
r req
uired
for a
ny ot
her u
se.
EPA Export 26-07-2013:02:21:42

Cork Harbour Main Drainage Scheme - EIA Modelling Study Appendix A
Overall however we can state that there is a very good agreement between the
modelled and measured datasets for Lough Mahon.
Recorded Cnrretl1 Slleecl. LOIIUh Million [nlls] -Moclelled CUrfeU1 Slleed. LOIIUh Malum IlHi~1 --
1111<:11 SiUllfll[m) --
4.0
0.5
1.5
1.0
Lough Mahon Current Speed Calibration
0.30
\0.10 .\
0.50
0.60
0.20
0.70
0.80 Jy ~ -.. ~ (........ . . , 4.5
{\' ~. ., : I \: ,: , .
.. '-1-'\'" ! /--.I : I\ l "",. i.. l.J \: I \ i I \ : I \ i r\ i
... ~ ! J..\..:.. r ..J .~ ..I.\ ..; /\ ' (\ 3.5
\ i / I! \ 1 I \ i \ : / \ 3.0
......LL U. .. .. \~ -- .\1. \.~ L -\ ~\ i , i \1 l i li I -\ ' I i i li li 1 I 2.5·i
0.40 .... -- ......-\- .. ·1·, .t ...,;..~ I ~
\ \ \: i i\ J 2.0 ~_./ .... ~_._. :\ _ -----i\ _ J ~
I : II
12:0000:0001·26
12:0000:0001·25
12:00f--r-,--.:--.-~...,....,.;;,.;;..;~.,..;:..~~....,...;;~~~.,....:;:>\,...,....;.~~~,...,.!.-.--r-~...,..:,..~......:,:e.-:;-,~~~-,-;:::~o.o
00:0001.27
00:001992-01·24
Time
Lough Mahon Current Speed Validation
0.5
4.0
1.0
Tidal SI!Jlhll(ml --
0.10
Recorded ClInent Speed. LOlluh Million Imis) -fllodelled ClIrrent SIHted .lollOh M<lhon (m/si --
.--__----,- ~.--=L:,co..::.ug"'-h-=M,. a:.:.h:.:.o:.:.n...:..C.::::ur..:.re_=n...:..l...:..sp"-e:,ce..::.d-=C..:.al-=ib_=ra:.:.li..:.on'-'-------,- ----.-U0.80 • .. --.;-- ---- ~ ,
••••••••• r ••• _ •••••.••. j..•......... -~_. --_ .._ _.- ..~ .. --_.. 0 - - - - _ •• r-' --- ,.. ~ .. ~. .. -_ i· --_., ,
--....·/\·I..·....·--/\1'··!y t(-------- /\,i... --""--,/::,', /;:"\ I 3.5
I I i I \: {\ I I I :1 I 3.0
.·-r--·\: ----r--·t---- ..--r--r .. ----I--·\ --. '--T !\ --.-- -;--1·\---- -- I:-- \. --...-:- I0.40 ...... / ... -\-- I.... j\........f .... j\·...../.·--h-- --~ --.l.\ .... I.. i..·\......!.. ·~ .. ··\- .. --.. /__ 2.5 J
I :\ i : \ I : I : \ I : \ I ' \ I i \ I 2.0 ~0.30 \ .../. ...\ ... .1. - '·r ..;.. \- L \ '\ .. -- .. --.--\ ..\....1.]
1 : \ I I:: \ 1.5I .: \
0.20 \.1
0.60
0.70
0.50
12:0000:0001-30
12:0000:0001·29Time
12:0000:0001·28
12:00
f:;:;:;:;:;::;~-rl-;,~~~.-';-;:;.:,....;;~~~~~...,..r.,.:....:;:;.....~....;-.:;.,:,.,,;...,..,..,.:,....;.,.,.....;J;..,~_.'r;_~.......:...,..,.;;'_.+o.o
00:0001-31
00:001992-01.27
Lough Mahon Current Speed Validation
165
For
insp
ectio
n pur
pose
s only
.
Conse
nt of
copy
right
owne
r req
uired
for a
ny ot
her u
se.
EPA Export 26-07-2013:02:21:42

Cork Harbour Main Drainage Scheme - EIA Modelling Study Appendix A
Recorded (lIrrelll Speed, LouU11 Malloll(m/sl -Moc1elletl (IIIrenl Slleed -lough Mnllon (m/si --
Thlal Sluuol(m] --
Lough Mahon Current Speed Calibration0.60 r---.-..-...-..-..-,--~.-...-..-..-...-.-..-.--;"--------,----.--'--...-.-..-...-..-..-.. --,-.,.-..-..-.. -..-..-..-...-..-..,-•..-..-..-..-...-..-..-.-.'. ~.5
0.70
'\ ~ /\0.60 .. J.. .....-;1-..\.
\ I \\ (\
0.50 "'''''I~'\
\ I ~ \0.40 \ .
\0.30
0.20
0.10
.- ..... -"-'<\: / \
4.0
3.5
3.0
1.5
1.0
0.5
12:0000:0002-02
12:0000:0002-01
12:00h-r,....,..1,..:,..,..-.--.-'i'-r-i-~c:,....,.::,..:;:.,.~...;-.-~~~;.:,.....;-.-.....-r'~~.......:;.~~.;.::;..,~.,...;-.~~...;:....,..~+0.0
00:0002-03
00:001992-01-31
Time
Lough Mahon Current Speed Validation
3.5
3.0
TI<lal SIUn." (IIIJ --
12:0000:0002-05
12:0000:0002-04
12:0000:001992-02-03
Recorded Curren1 Speetl.lonUh Maholl [lIlfs) -Modelled Current Speetl-lolluh M.lhol1 [lIlfs) --
Lough Mahon Current Speed Calibration0.00 r.-...-..-..-...-..-_.-...-_.--,-.~-.. -...-.-.-.- . .:....-!;<....---•..'-.-----'-'.-,--.,.:....---T'-.-'-'.'-.,-,.::.:c.''''-'':'';'j'-'.'-..-.•-.. -..•-••-••-.. -•••'[.-••-...-..-••-.. -•••-.---r4.5
. .: " : ,
0.70 P ~ -fr'" :-!-.~ l./ j ./\.. f 1\·· .. ·I II ':/\ i (I i'\ :/ :/
~ I \ :I HI : I ; I : \
.• ".\ r k\ t\t ....'1. .. ··:1 A0.50 ~'\ J.~ \ r" \ t· "'~l" .~ \ ·· ..·7"·1·\ 2.5 i0.40 I'!"'i .1... ~. 1....... ~\\ \.1 : F: \ 2.0 ~
::,\\\/L~\/Hj;\~l! ·Xll/~\/: •••. \! ::.'''\v ,\·····\~\ti\f·,
h-r~,......;.~........,.~~~~....;....,.~~...,....,..::~-r-.--,~~~........;-'.-.--~...,...:..:;..,.........-+-~~~;....,...,.-+o.o
00:0002-06
Time
Lough Mahon Current Speed Validation
166
For
insp
ectio
n pur
pose
s only
.
Conse
nt of
copy
right
owne
r req
uired
for a
ny ot
her u
se.
EPA Export 26-07-2013:02:21:42

Cork Harbour Main Drainage Scheme - EIA Modelling Study
Lough Mahon Current Direction Validation
Appendix A
360
320
280CilQ)
e 240ClQ)
~<: 2000.~
e 160isCe 120:;()
80
40
o L- --'
25/01/199200:00 25/01/1992 12:00 261011199200:00 2610111992 12:00 27101/199200:00 27101/1992 12:00 28/011199200:00
Time
- Recorded Current Direction - Modelled Current Direction
360
320
280CilQ)
e 240ClQ)
~<: 200.2tie 160isCe 120:;()
80
40
Lough Mahon Current Direction Validation
Lough Mahon Current Direction Validation
o L- --'
28101/199200:00 281011199212:00 29/01/199200:00 29/01/199212:00 30101/199200:00 30101/199212:00 31/01/199200:00
Time
- Recorded Current Direction - Modelled Current Direction
Lough Mahon Current Direction Validation
167
For
insp
ectio
n pur
pose
s only
.
Conse
nt of
copy
right
owne
r req
uired
for a
ny ot
her u
se.
EPA Export 26-07-2013:02:21:42

Cork Harbour Main Drainage Scheme - EtA Modelling Study Appendix A
Lough Mahon Current Direction Validation
360 ,------------------------,..-------r------,
320
280
240
200
160
120
80
40
o '----- --'J-- ----J
01/021199200:00 01/02/1992 12:00 02/02/199200:00 02/0211992 12:00 03/021199200:00 03/02/1992 12:00 041021199200:00
Time
--Recorded Current Direction - Modelled Current Direction
Lough Mahon Current Direction Validation
Lough Mahon Current Direction Validation
360
320
280enQ)
~ 240ClQ)
~c 2000
"5~ 160CC~ 120:5(,)
80
40
o -----'--------4-----
041021199200:00 04102/1992 12:00 05/021199200:00 05/02/1992 12:00 06/021199200:00 06/02/1992 12:00 07/02/199200:00
Time
- Recorded Current Direction - Modelled Current Direction
Lough Mahon Current Direction Validation
A.S Conclusions
The RP_2 model has been calibrated and validated against water levels for a
number of locations in the harbour. Water levels recorded at the Pfizer gauge,
168
For
insp
ectio
n pur
pose
s only
.
Conse
nt of
copy
right
owne
r req
uired
for a
ny ot
her u
se.
EPA Export 26-07-2013:02:21:42

Cork Harbour Main Drainage Scheme - EIA Modelling Study Appendix A
Lough Mahon and the North Channel near the oyster farm are all in very good
agreement with the model. There is a slight error at high and low water which
varies between 1Gem and 15cm. This is well within an acceptable limit of error.
The RP model has been calibrated and validated against current speed and
directions for a number of locations in the harbour. Current readings from the
Spit Bank in the outer harbour, Lough Mahon and the Belvelly Channel all
compare very well with the output from the model. The calibration in Lough
Mahon for neap tides is not as good as for Spring tides. The error is however
well within an acceptable limit as velocities in a two-dimensional hydrodynamic
model are averaged over the grid cell. For Lough Mahon this is 18m. Strong
localised (Le. less than 18m), subgrid scale hydrodynamics cannot be resolved.
Overall we can state that there is very good agreement between the RP model
and the recorded datasets.
169
For
insp
ectio
n pur
pose
s only
.
Conse
nt of
copy
right
owne
r req
uired
for a
ny ot
her u
se.
EPA Export 26-07-2013:02:21:42


