
Challenges in the delivery of Water and Sanitation
Urban Team
Indian Council for Research on International Economic Relations
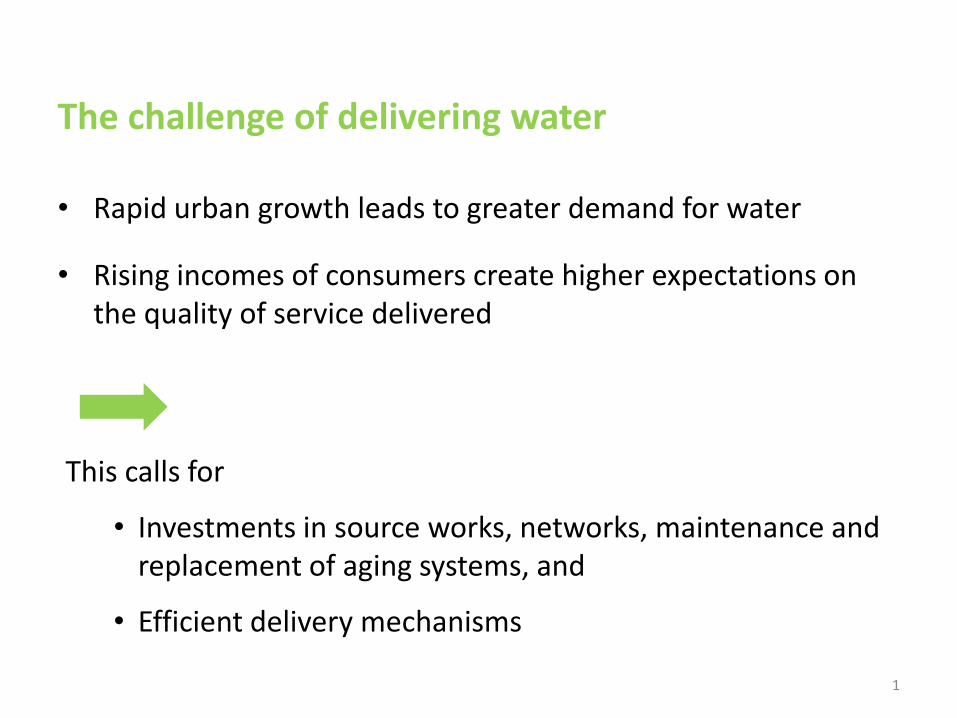
The challenge of delivering water
• Rapid urban growth leads to greater demand for water
• Rising incomes of consumers create higher expectations on the quality of service delivered
1
This calls for
• Investments in source works, networks, maintenance and replacement of aging systems, and
• Efficient delivery mechanisms
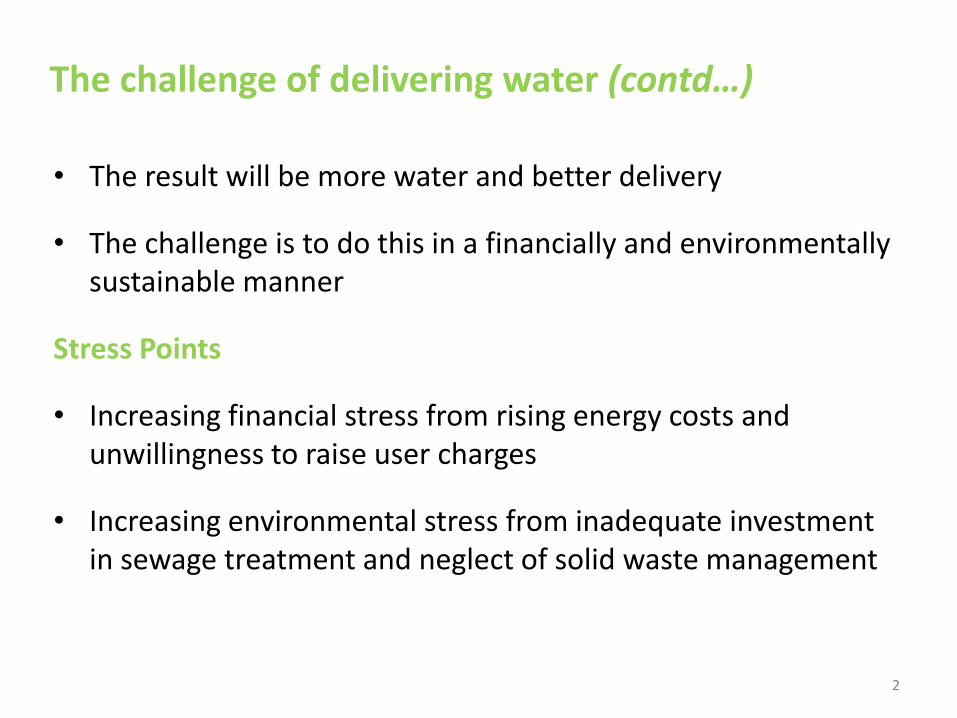
• The result will be more water and better delivery
• The challenge is to do this in a financially and environmentally sustainable manner
Stress Points
• Increasing financial stress from rising energy costs and unwillingness to raise user charges
• Increasing environmental stress from inadequate investment in sewage treatment and neglect of solid waste management
2
The challenge of delivering water (contd…)
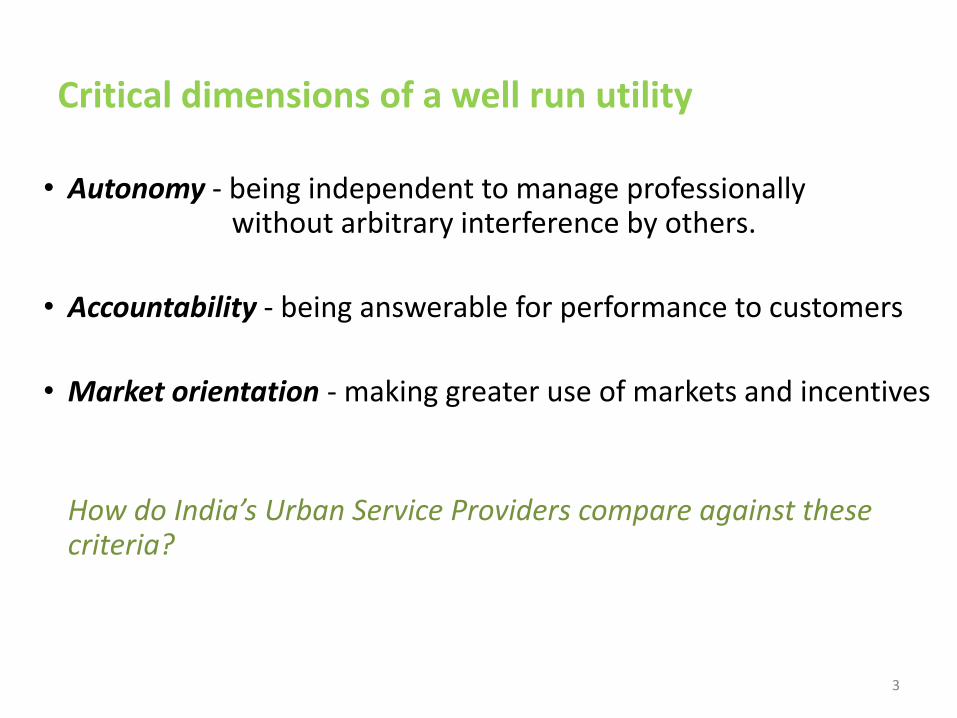
• Autonomy - being independent to manage professionally without arbitrary interference by others.
• Accountability - being answerable for performance to customers
• Market orientation - making greater use of markets and incentives
How do India’s Urban Service Providers compare against these criteria?
Critical dimensions of a well run utility
3
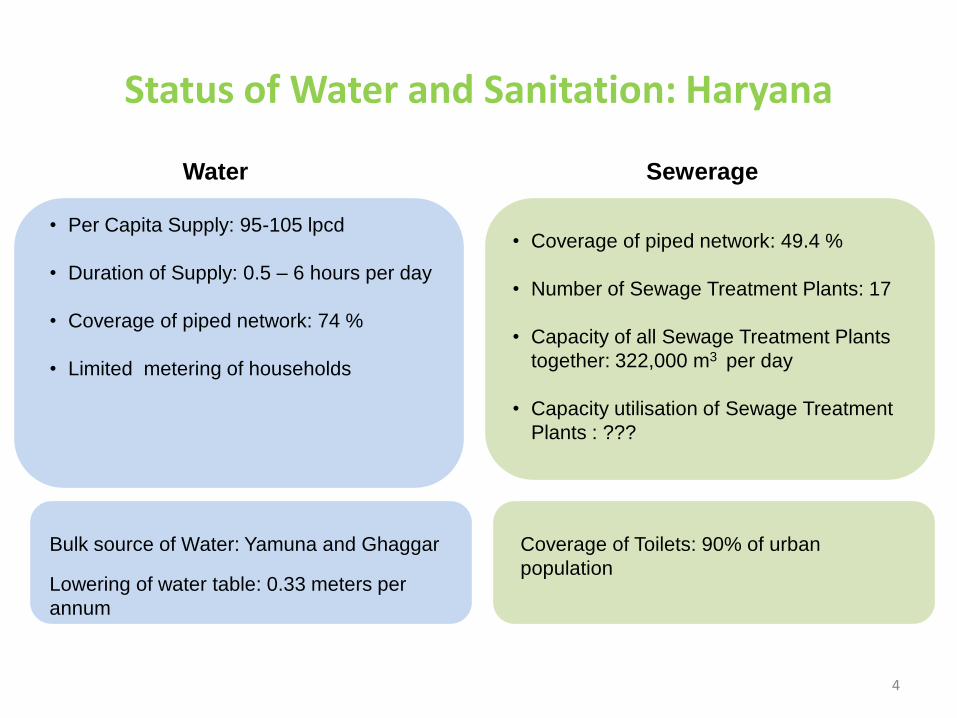
Status of Water and Sanitation: Haryana
4
• Per Capita Supply: 95-105 lpcd
• Duration of Supply: 0.5 – 6 hours per day
• Coverage of piped network: 74 %
• Limited metering of households
Water Sewerage
• Coverage of piped network: 49.4 %
• Number of Sewage Treatment Plants: 17
• Capacity of all Sewage Treatment Plants
together: 322,000 m3 per day
• Capacity utilisation of Sewage Treatment
Plants : ???
Bulk source of Water: Yamuna and Ghaggar
Lowering of water table: 0.33 meters per
annum
Coverage of Toilets: 90% of urban
population

5
Status of Water and Sanitation: Punjab
• Per Capita Supply: 128 lpcd
• Duration of Supply: 0-6 hrs
• Coverage of piped network: 68%
• Limited metering of households
Water Sewerage
• Coverage of piped network: 63.7 %
• Number of Sewage Treatment Plants: 95
• Capacity of all Sewage Treatment Plants
together: ???
• Capacity utilisation of Sewage Treatment
Plants : ???
Bulk Source of Water: Satluj and Beas
Lowering of water table: 0.5 m per annum
Coverage of Toilets: 93% of urban
population
7
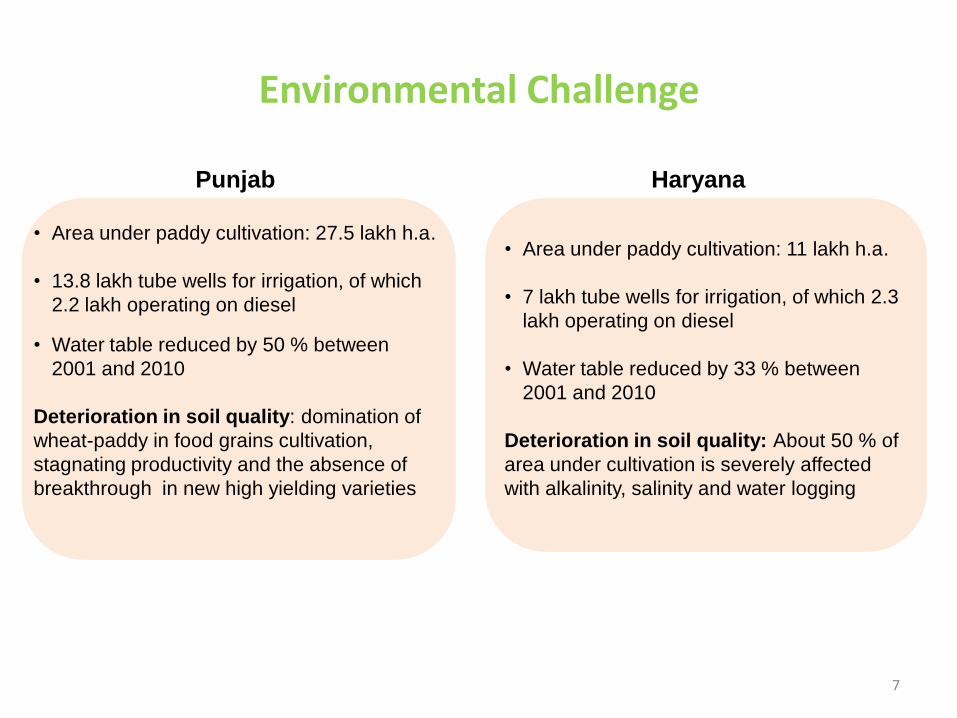
Environmental Challenge
• Area under paddy cultivation: 27.5 lakh h.a.
• 13.8 lakh tube wells for irrigation, of which
2.2 lakh operating on diesel
• Water table reduced by 50 % between
2001 and 2010
Deterioration in soil quality: domination of
wheat-paddy in food grains cultivation,
stagnating productivity and the absence of
breakthrough in new high yielding varieties
Punjab Haryana
• Area under paddy cultivation: 11 lakh h.a.
• 7 lakh tube wells for irrigation, of which 2.3
lakh operating on diesel
• Water table reduced by 33 % between
2001 and 2010
Deterioration in soil quality: About 50 % of
area under cultivation is severely affected
with alkalinity, salinity and water logging
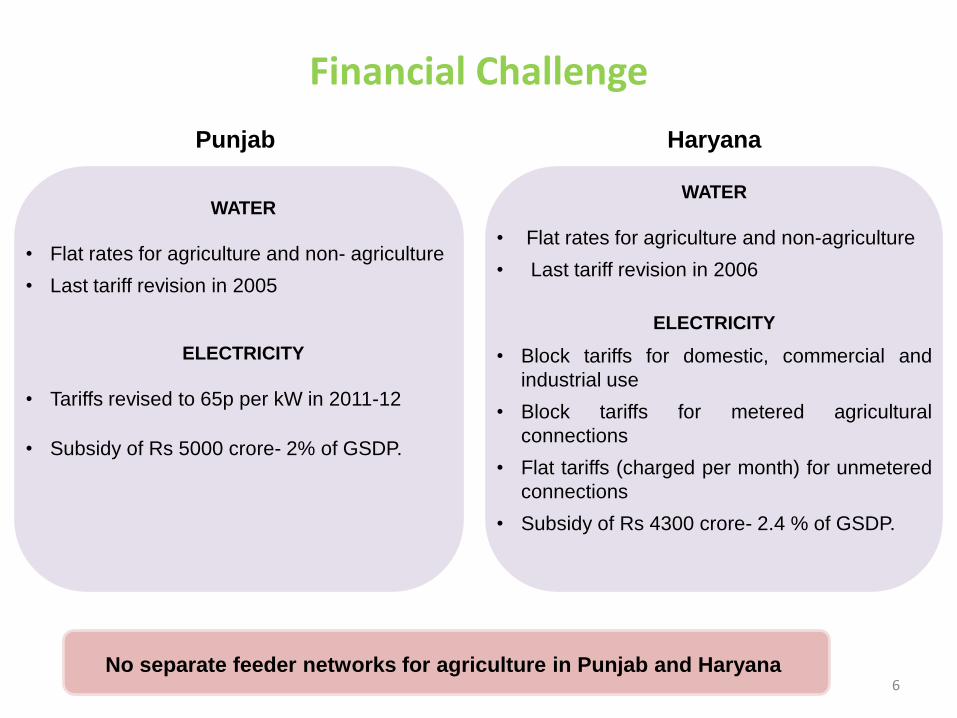
Financial Challenge
6
WATER
• Flat rates for agriculture and non- agriculture
• Last tariff revision in 2005
ELECTRICITY
• Tariffs revised to 65p per kW in 2011-12
• Subsidy of Rs 5000 crore- 2% of GSDP.
Punjab Haryana
WATER
• Flat rates for agriculture and non-agriculture
• Last tariff revision in 2006
ELECTRICITY
• Block tariffs for domestic, commercial and
industrial use
• Block tariffs for metered agricultural
connections
• Flat tariffs (charged per month) for unmetered
connections
• Subsidy of Rs 4300 crore- 2.4 % of GSDP.
No separate feeder networks for agriculture in Punjab and Haryana

Making the most of what you have
1. Maximizing revenues without raising tariffs
2. Reducing Costs
3. Managing networks better
8

Making the most of what you have (contd…)
1. Maximizing revenues without raising tariffs
– Update customer database – both for existing customers and categorisation
– Improve billing and collection systems – bill and collect what you are owed
– Introduce metering – on a priority basis, starting with connections with high volume consumption
– Review tariff block structure – to target subsidies at the poorest
8a

Making the most of what you have (contd…)
2. Reducing costs
– Improve energy efficiency – updating pumps and motors
– Reduce leakage – providing more water for sale, and reducing energy usage per cubic meter of water sold
8b
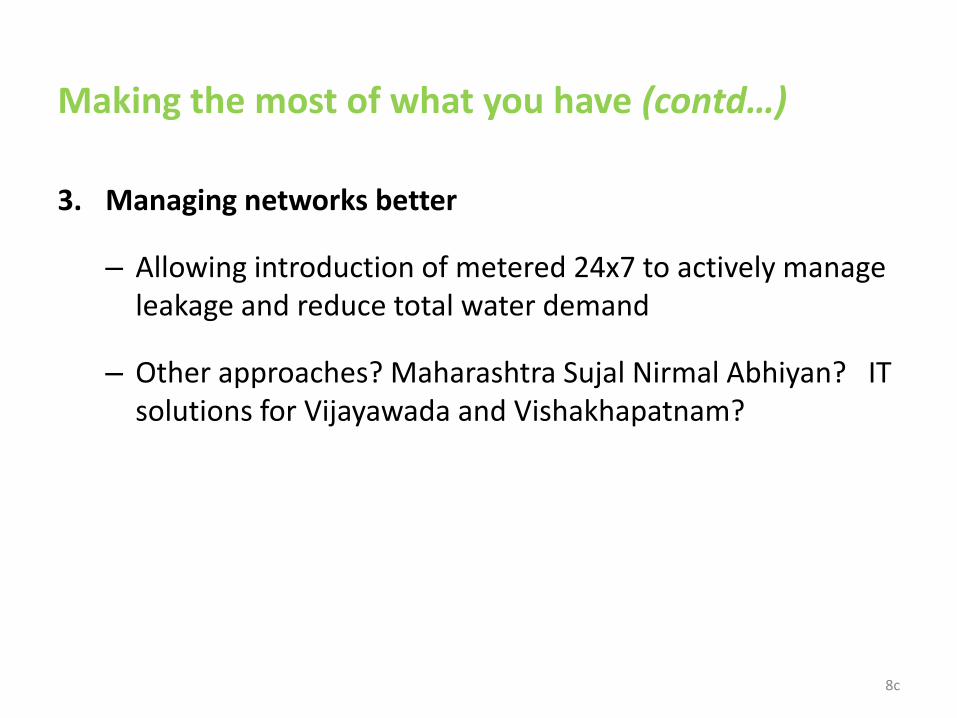
Making the most of what you have (contd…)
3. Managing networks better
– Allowing introduction of metered 24x7 to actively manage leakage and reduce total water demand
– Other approaches? Maharashtra Sujal Nirmal Abhiyan? IT solutions for Vijayawada and Vishakhapatnam?
8c
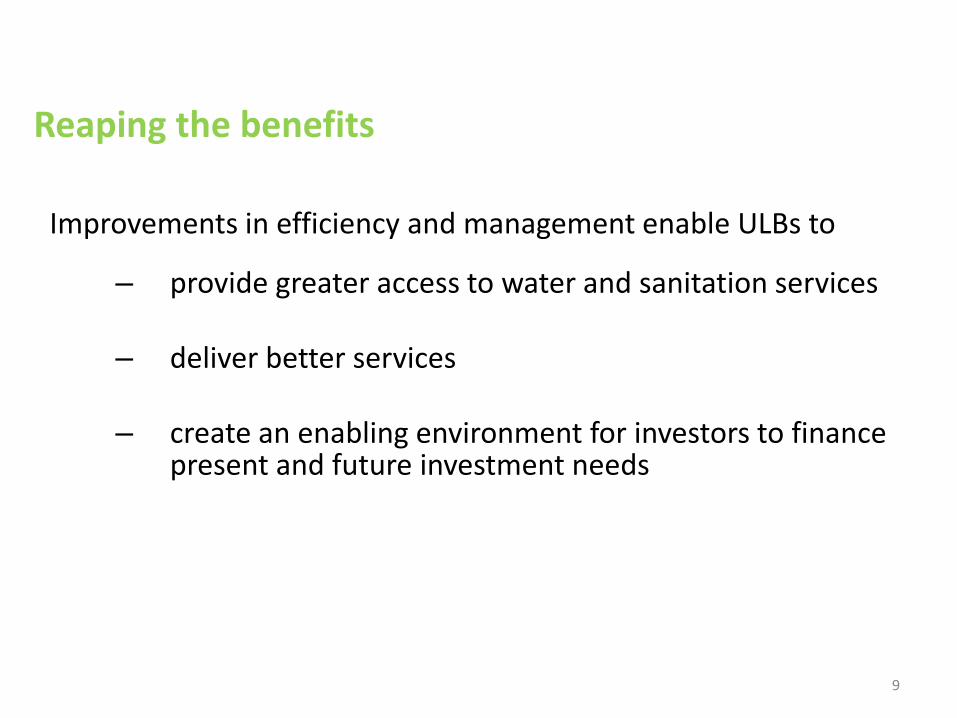
Reaping the benefits
Improvements in efficiency and management enable ULBs to
– provide greater access to water and sanitation services
– deliver better services
– create an enabling environment for investors to finance present and future investment needs
9

Evidence from India
1. Karnataka 3 cities and 4 wards pilot projects (PPP)
Hubli-Dharwad, Gulbarga and Belgaum
2. Maharashtra Nagpur (PPP)
Maharashtra Sujal Nirmal Abhiyan
Amravati, Malkapur and Badlapur
3. Andhra Pradesh IT based models
Vijayawada and Vishakhapatnam
10
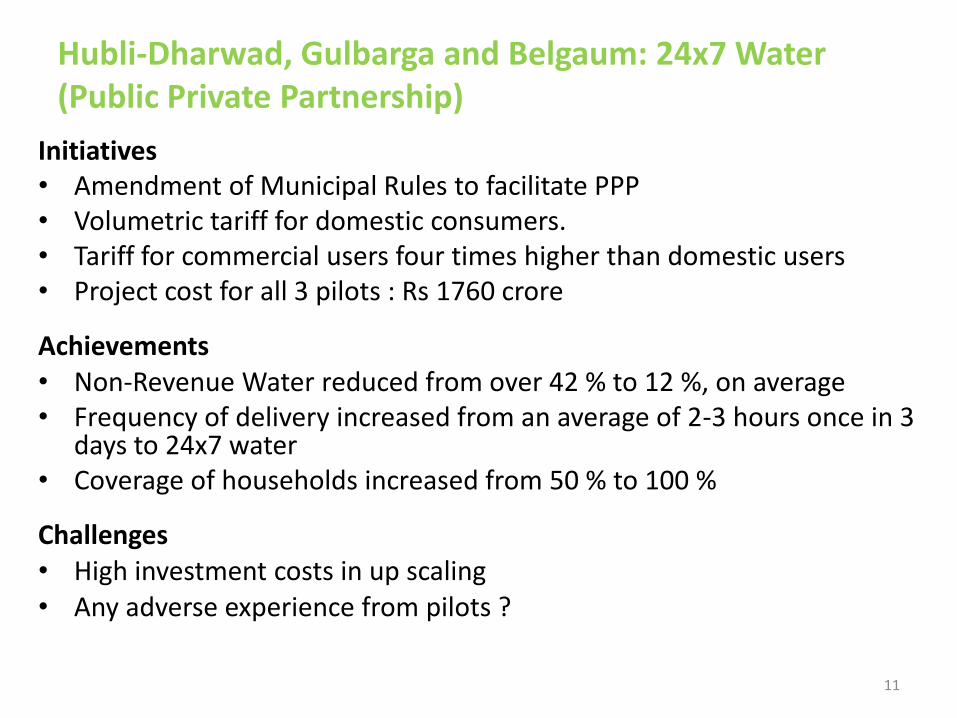
Hubli-Dharwad, Gulbarga and Belgaum: 24x7 Water (Public Private Partnership)
Initiatives • Amendment of Municipal Rules to facilitate PPP • Volumetric tariff for domestic consumers. • Tariff for commercial users four times higher than domestic users • Project cost for all 3 pilots : Rs 1760 crore
Achievements • Non-Revenue Water reduced from over 42 % to 12 %, on average • Frequency of delivery increased from an average of 2-3 hours once in 3
days to 24x7 water • Coverage of households increased from 50 % to 100 %
Challenges • High investment costs in up scaling • Any adverse experience from pilots ?
11
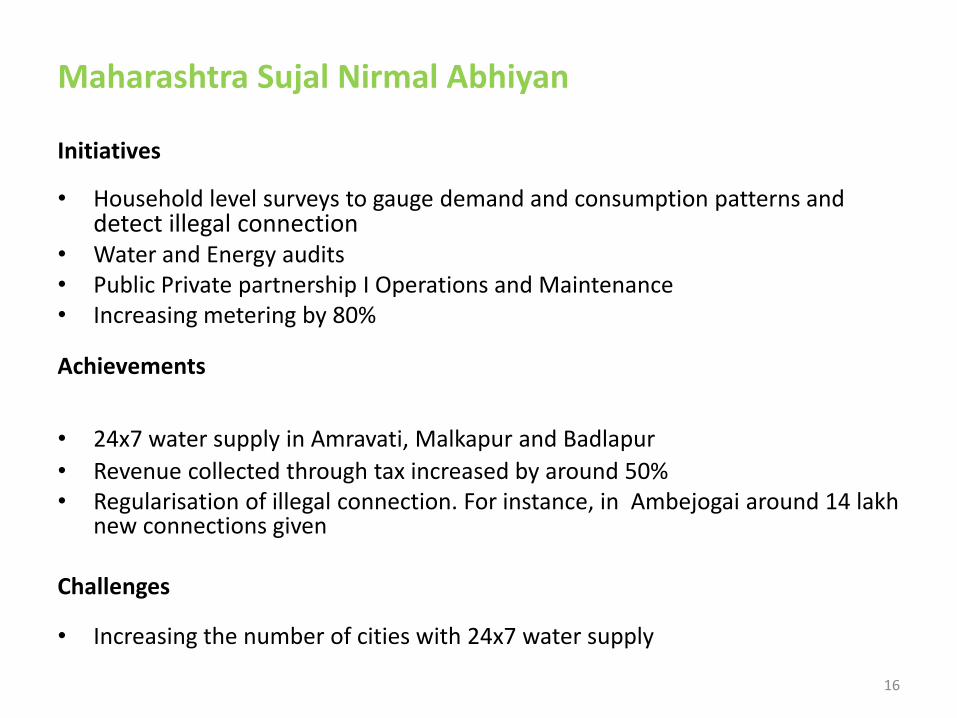
Maharashtra Sujal Nirmal Abhiyan
Initiatives
• Household level surveys to gauge demand and consumption patterns and detect illegal connection
• Water and Energy audits • Public Private partnership I Operations and Maintenance • Increasing metering by 80%
Achievements
• 24x7 water supply in Amravati, Malkapur and Badlapur
• Revenue collected through tax increased by around 50% • Regularisation of illegal connection. For instance, in Ambejogai around 14 lakh
new connections given Challenges
• Increasing the number of cities with 24x7 water supply
16
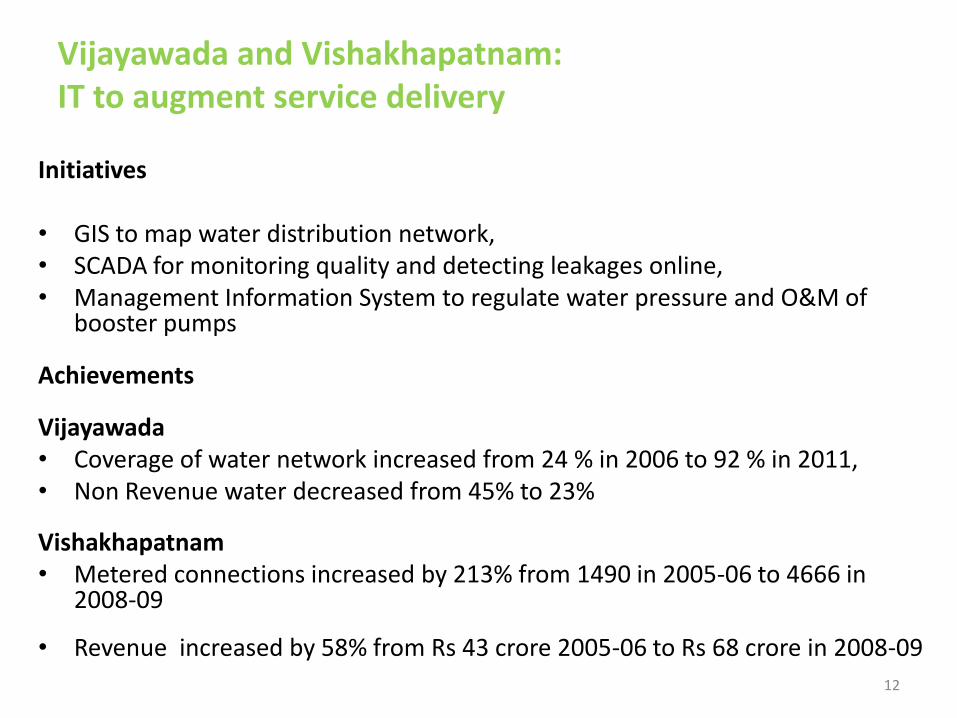
Vijayawada and Vishakhapatnam: IT to augment service delivery
Initiatives • GIS to map water distribution network, • SCADA for monitoring quality and detecting leakages online, • Management Information System to regulate water pressure and O&M of
booster pumps
Achievements
Vijayawada • Coverage of water network increased from 24 % in 2006 to 92 % in 2011, • Non Revenue water decreased from 45% to 23%
Vishakhapatnam • Metered connections increased by 213% from 1490 in 2005-06 to 4666 in
2008-09
• Revenue increased by 58% from Rs 43 crore 2005-06 to Rs 68 crore in 2008-09
12
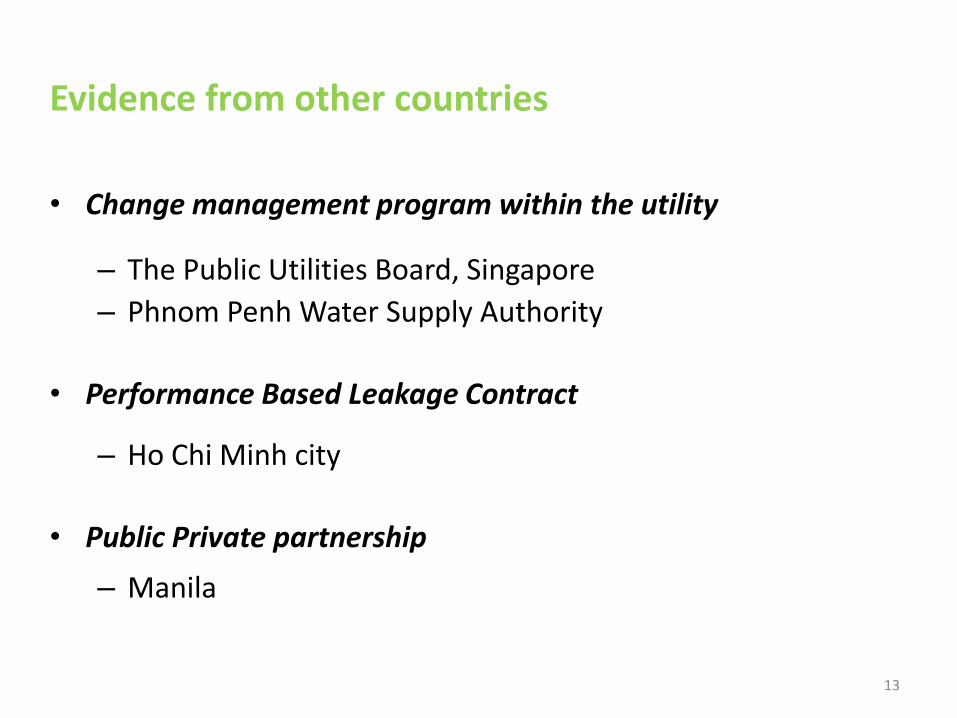
Evidence from other countries
• Change management program within the utility
– The Public Utilities Board, Singapore
– Phnom Penh Water Supply Authority
• Performance Based Leakage Contract
– Ho Chi Minh city
• Public Private partnership
– Manila
13
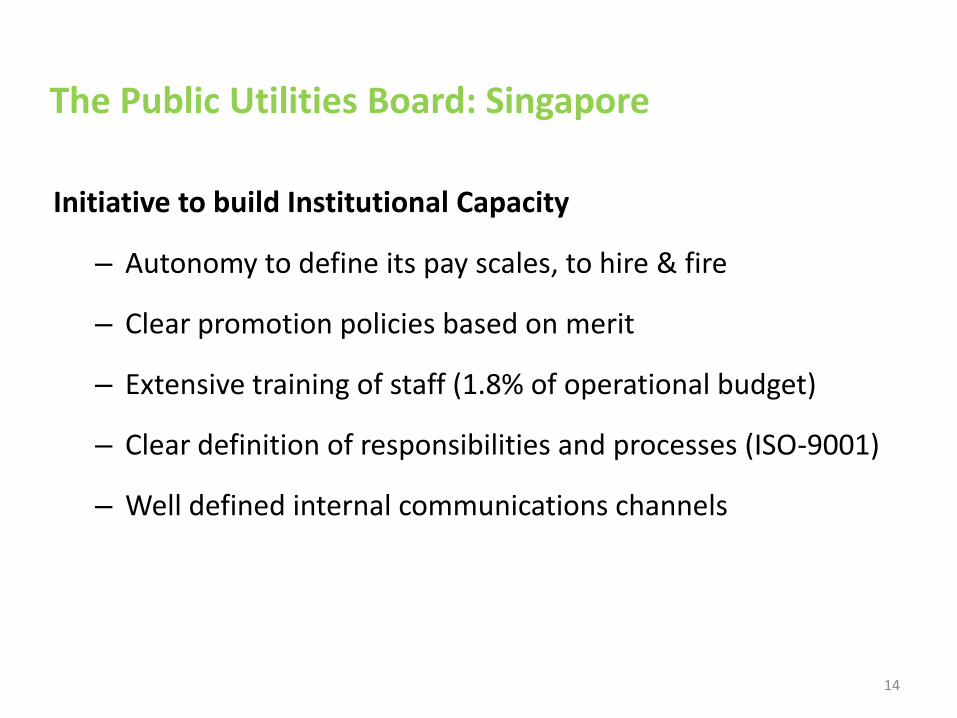
The Public Utilities Board: Singapore
Initiative to build Institutional Capacity
– Autonomy to define its pay scales, to hire & fire
– Clear promotion policies based on merit
– Extensive training of staff (1.8% of operational budget)
– Clear definition of responsibilities and processes (ISO-9001)
– Well defined internal communications channels
14
Phnom Penh: Improvements in service delivery
Initiatives
– Financial Autonomy - independent operations and tariffs based on costs
– Restructuring of management- creating a transparent system of incentives
for performance and penalties
– Maximising collection of bills and reducing non-revenue water
– Supported through external assistance by the World Bank and the Asian
Development bank
Achievements
– Non- Revenue water was reduced from 72% in 1993 to less than 6% in 2010
– Collection efficiency increased from 48% in 1993 to 100% in 2010
– Connections increased from 27,000 in 1993 to 202,000 in 2010
– Water supply increased from 10 hours per day to 24 hours per day
15

Ho Chi Minh city, Vietnam: Benefits of Leakage Reduction
0m
0m
2m
6m
2m
7.0m
7.5m
6.5m
10m
9m
Pressure Before Pressure After
NRW Reduction
6,513 cu.m/day
AFTER (October 2011)
Supply (cu.m/day) 6,432
Consumption (cu.m/day) 3,533
Average Pressure (m) 8
NRW Volume (cu.m/day) 2,899
NRW % 45%
BEFORE (August 2010)
Supply (cu.m/day) 13,049
Consumption (cu.m/day) 3,637
Average Pressure (m) 2
NRW Volume (cu.m/day) 9,412
NRW % 72%
16
Performance based leakage contract was entered into with a private company
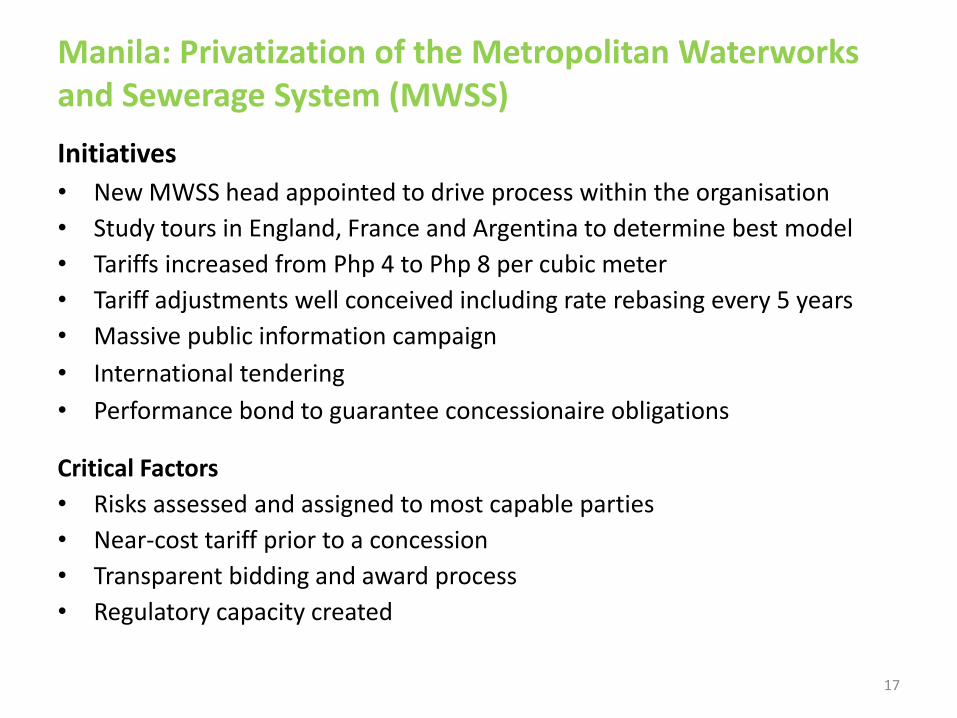
Manila: Privatization of the Metropolitan Waterworks and Sewerage System (MWSS)
Initiatives
• New MWSS head appointed to drive process within the organisation
• Study tours in England, France and Argentina to determine best model
• Tariffs increased from Php 4 to Php 8 per cubic meter
• Tariff adjustments well conceived including rate rebasing every 5 years
• Massive public information campaign
• International tendering
• Performance bond to guarantee concessionaire obligations Critical Factors
• Risks assessed and assigned to most capable parties
• Near-cost tariff prior to a concession
• Transparent bidding and award process
• Regulatory capacity created
17
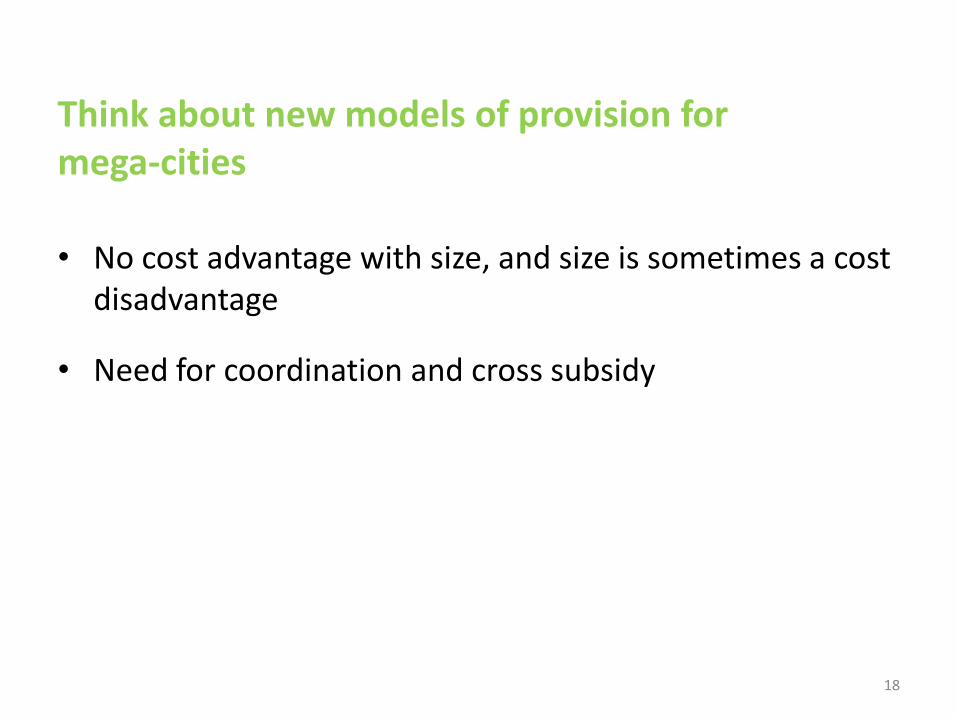
Think about new models of provision for mega-cities
• No cost advantage with size, and size is sometimes a cost disadvantage
• Need for coordination and cross subsidy
18
Summary
• Multiple challenges to urban water delivery
• Improved governance and incentives critical to creation of well run companies that can cater to the rising demand
• Improvement of capacity for planning within the ULB necessary
• Partnering with private sector may augment existing capacity and sometimes financial resources
19


