challenges in the delivery of water and sanitation - … in the delivery of water and ... what you...
TRANSCRIPT

Challenges in the delivery of Water and Sanitation
Urban Team
Indian Council for Research on International Economic Relations
The challenge of delivering water
• Rapid urban growth leads to greater demand for water
• Rising incomes of consumers create higher expectations on the quality of service delivered
1
This calls for
• Investments in source works, networks, maintenance and replacement of aging systems, and
• Efficient delivery mechanisms
• The result will be more water and better delivery
• The challenge is to do this in a financially and environmentally sustainable manner
Stress Points
• Increasing financial stress from rising energy costs and unwillingness to raise user charges
• Increasing environmental stress from inadequate investment in sewage treatment and neglect of solid waste management
2
The challenge of delivering water (contd…)
• Autonomy - being independent to manage professionally without arbitrary interference by others.
• Accountability - being answerable for performance to customers
• Market orientation - making greater use of markets and incentives
How do India’s Urban Service Providers compare against these criteria?
Critical dimensions of a well run utility
3
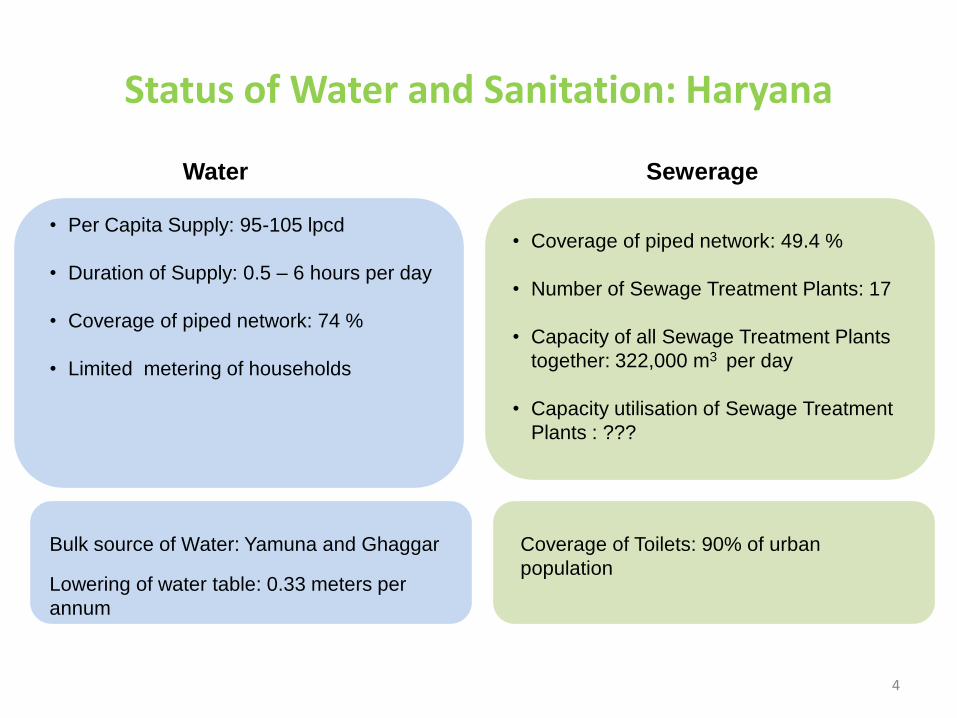
Status of Water and Sanitation: Haryana
4
• Per Capita Supply: 95-105 lpcd
• Duration of Supply: 0.5 – 6 hours per day
• Coverage of piped network: 74 %
• Limited metering of households
Water Sewerage
• Coverage of piped network: 49.4 %
• Number of Sewage Treatment Plants: 17
• Capacity of all Sewage Treatment Plants
together: 322,000 m3 per day
• Capacity utilisation of Sewage Treatment
Plants : ???
Bulk source of Water: Yamuna and Ghaggar
Lowering of water table: 0.33 meters per
annum
Coverage of Toilets: 90% of urban
population

5
Status of Water and Sanitation: Punjab
• Per Capita Supply: 128 lpcd
• Duration of Supply: 0-6 hrs
• Coverage of piped network: 68%
• Limited metering of households
Water Sewerage
• Coverage of piped network: 63.7 %
• Number of Sewage Treatment Plants: 95
• Capacity of all Sewage Treatment Plants
together: ???
• Capacity utilisation of Sewage Treatment
Plants : ???
Bulk Source of Water: Satluj and Beas
Lowering of water table: 0.5 m per annum
Coverage of Toilets: 93% of urban
population
7
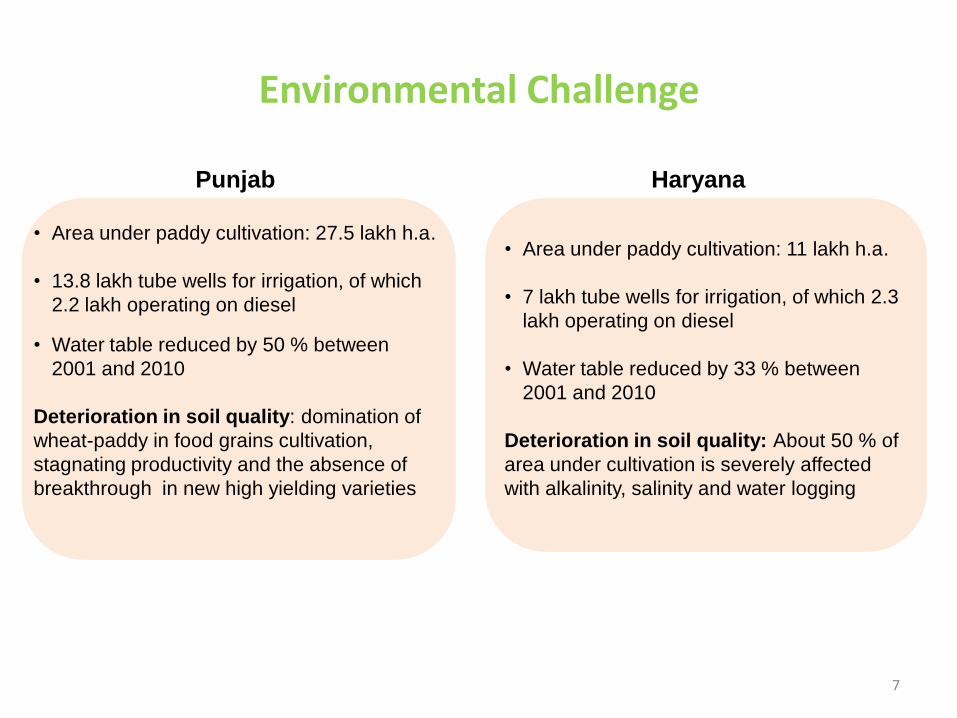
Environmental Challenge
• Area under paddy cultivation: 27.5 lakh h.a.
• 13.8 lakh tube wells for irrigation, of which
2.2 lakh operating on diesel
• Water table reduced by 50 % between
2001 and 2010
Deterioration in soil quality: domination of
wheat-paddy in food grains cultivation,
stagnating productivity and the absence of
breakthrough in new high yielding varieties
Punjab Haryana
• Area under paddy cultivation: 11 lakh h.a.
• 7 lakh tube wells for irrigation, of which 2.3
lakh operating on diesel
• Water table reduced by 33 % between
2001 and 2010
Deterioration in soil quality: About 50 % of
area under cultivation is severely affected
with alkalinity, salinity and water logging
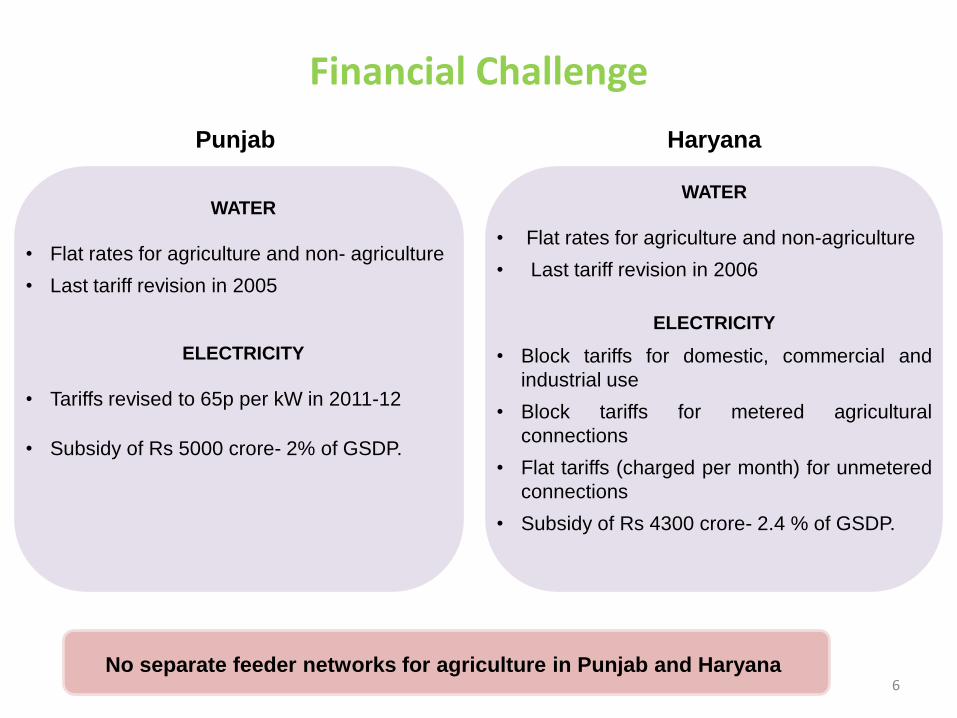
Financial Challenge
6
WATER
• Flat rates for agriculture and non- agriculture
• Last tariff revision in 2005
ELECTRICITY
• Tariffs revised to 65p per kW in 2011-12
• Subsidy of Rs 5000 crore- 2% of GSDP.
Punjab Haryana
WATER
• Flat rates for agriculture and non-agriculture
• Last tariff revision in 2006
ELECTRICITY
• Block tariffs for domestic, commercial and
industrial use
• Block tariffs for metered agricultural
connections
• Flat tariffs (charged per month) for unmetered
connections
• Subsidy of Rs 4300 crore- 2.4 % of GSDP.
No separate feeder networks for agriculture in Punjab and Haryana

Making the most of what you have
1. Maximizing revenues without raising tariffs
2. Reducing Costs
3. Managing networks better
8

Making the most of what you have (contd…)
1. Maximizing revenues without raising tariffs
– Update customer database – both for existing customers and categorisation
– Improve billing and collection systems – bill and collect what you are owed
– Introduce metering – on a priority basis, starting with connections with high volume consumption
– Review tariff block structure – to target subsidies at the poorest
8a

Making the most of what you have (contd…)
2. Reducing costs
– Improve energy efficiency – updating pumps and motors
– Reduce leakage – providing more water for sale, and reducing energy usage per cubic meter of water sold
8b
Making the most of what you have (contd…)
3. Managing networks better
– Allowing introduction of metered 24x7 to actively manage leakage and reduce total water demand
– Other approaches? Maharashtra Sujal Nirmal Abhiyan? IT solutions for Vijayawada and Vishakhapatnam?
8c
Reaping the benefits
Improvements in efficiency and management enable ULBs to
– provide greater access to water and sanitation services
– deliver better services
– create an enabling environment for investors to finance present and future investment needs
9

Evidence from India
1. Karnataka 3 cities and 4 wards pilot projects (PPP)
Hubli-Dharwad, Gulbarga and Belgaum
2. Maharashtra Nagpur (PPP)
Maharashtra Sujal Nirmal Abhiyan
Amravati, Malkapur and Badlapur
3. Andhra Pradesh IT based models
Vijayawada and Vishakhapatnam
10
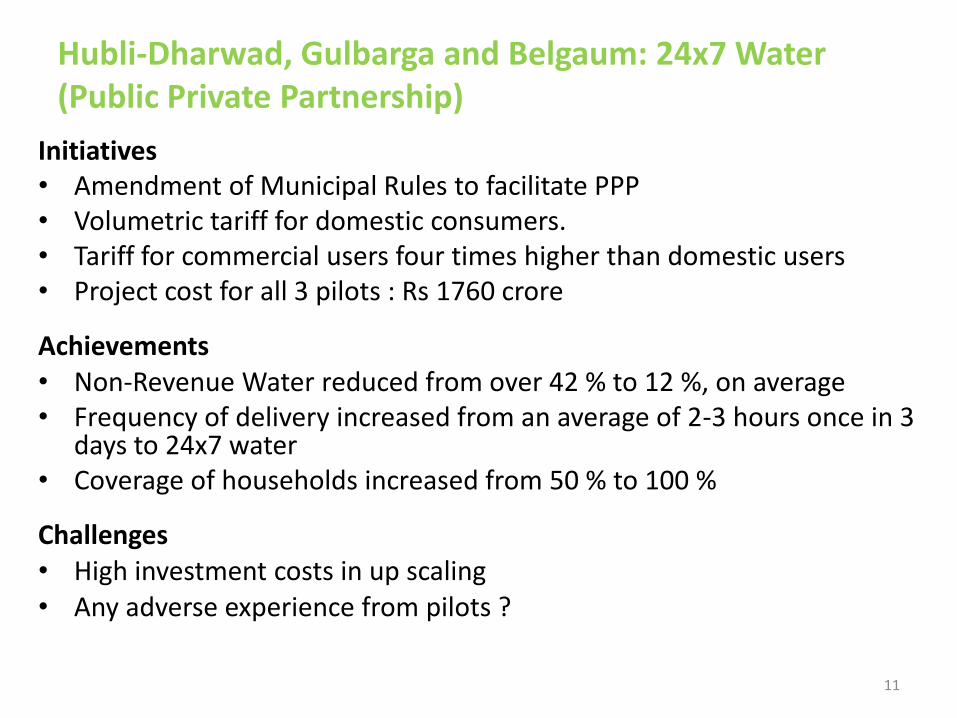
Hubli-Dharwad, Gulbarga and Belgaum: 24x7 Water (Public Private Partnership)
Initiatives • Amendment of Municipal Rules to facilitate PPP • Volumetric tariff for domestic consumers. • Tariff for commercial users four times higher than domestic users • Project cost for all 3 pilots : Rs 1760 crore
Achievements • Non-Revenue Water reduced from over 42 % to 12 %, on average • Frequency of delivery increased from an average of 2-3 hours once in 3
days to 24x7 water • Coverage of households increased from 50 % to 100 %
Challenges • High investment costs in up scaling • Any adverse experience from pilots ?
11
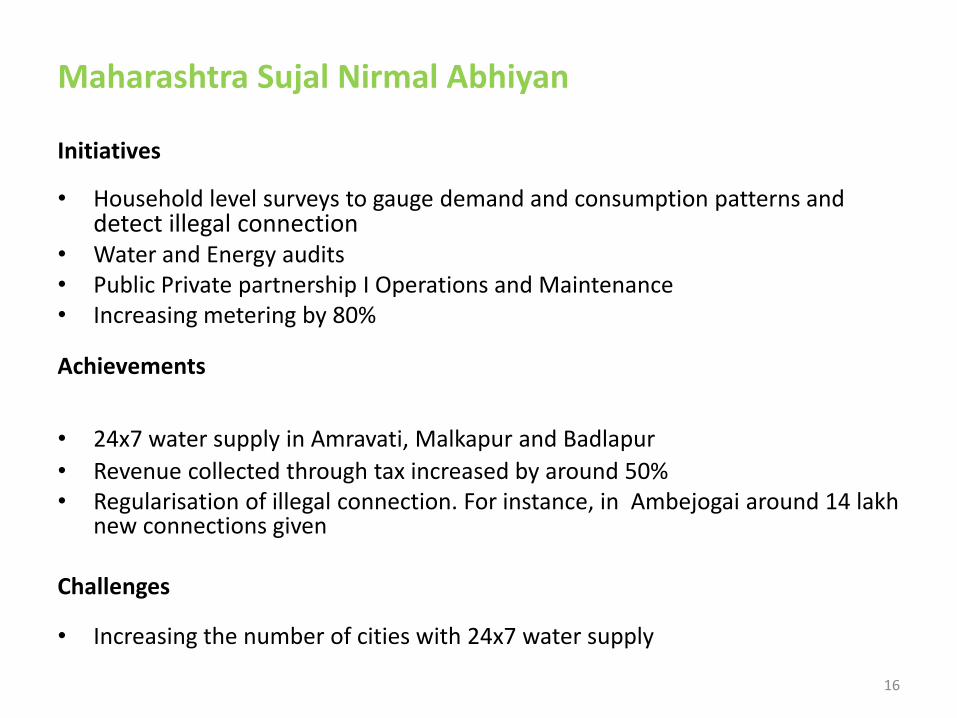
Maharashtra Sujal Nirmal Abhiyan
Initiatives
• Household level surveys to gauge demand and consumption patterns and detect illegal connection
• Water and Energy audits • Public Private partnership I Operations and Maintenance • Increasing metering by 80%
Achievements
• 24x7 water supply in Amravati, Malkapur and Badlapur
• Revenue collected through tax increased by around 50% • Regularisation of illegal connection. For instance, in Ambejogai around 14 lakh
new connections given Challenges
• Increasing the number of cities with 24x7 water supply
16
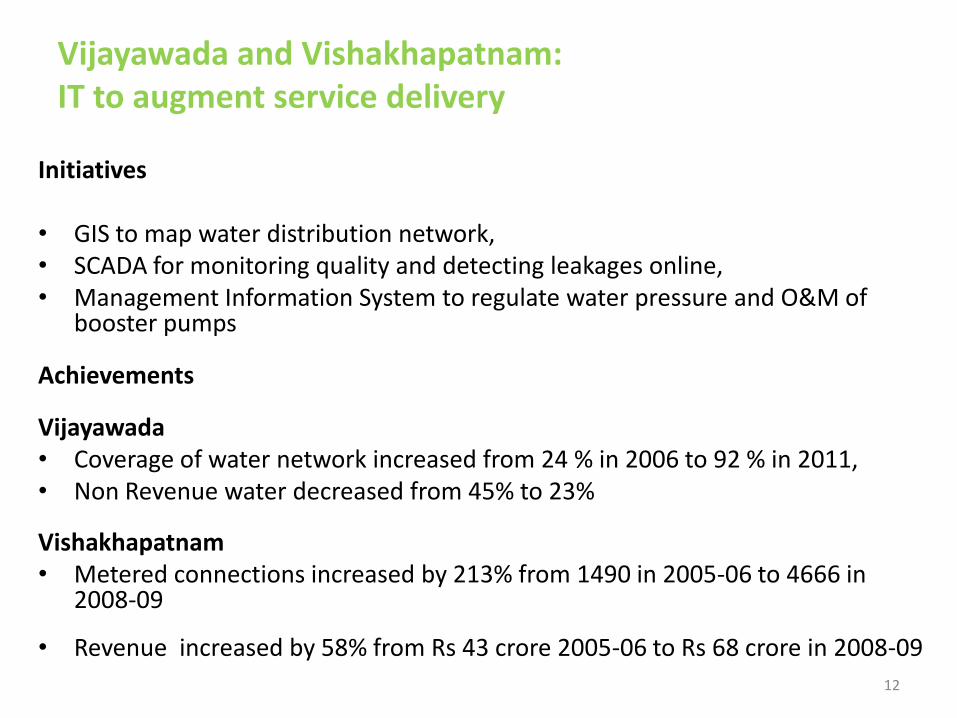
Vijayawada and Vishakhapatnam: IT to augment service delivery
Initiatives • GIS to map water distribution network, • SCADA for monitoring quality and detecting leakages online, • Management Information System to regulate water pressure and O&M of
booster pumps
Achievements
Vijayawada • Coverage of water network increased from 24 % in 2006 to 92 % in 2011, • Non Revenue water decreased from 45% to 23%
Vishakhapatnam • Metered connections increased by 213% from 1490 in 2005-06 to 4666 in
2008-09
• Revenue increased by 58% from Rs 43 crore 2005-06 to Rs 68 crore in 2008-09
12
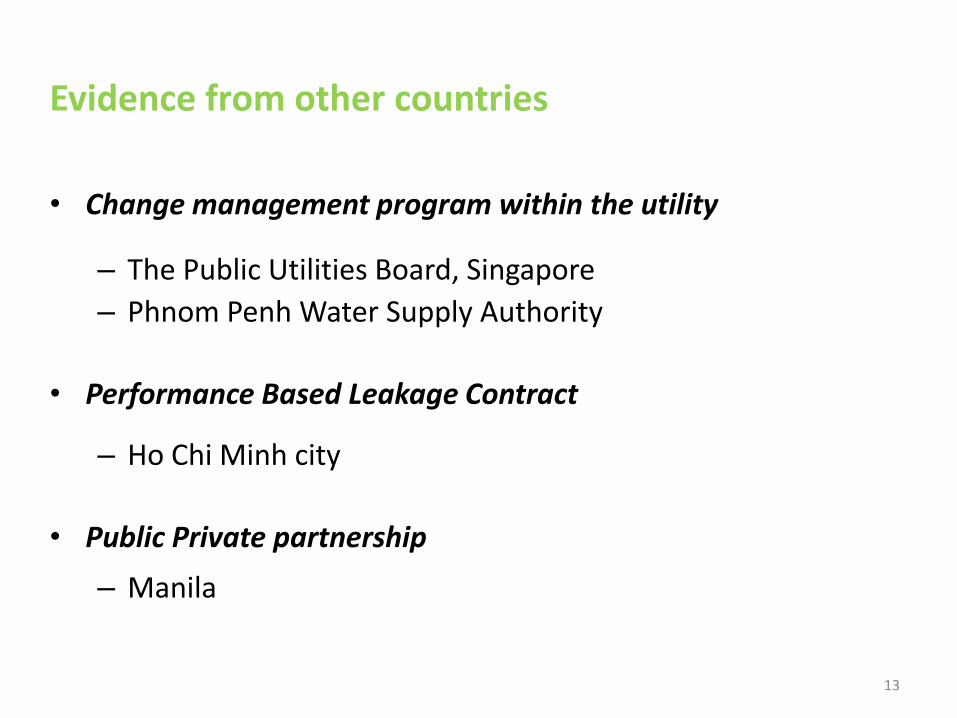
Evidence from other countries
• Change management program within the utility
– The Public Utilities Board, Singapore
– Phnom Penh Water Supply Authority
• Performance Based Leakage Contract
– Ho Chi Minh city
• Public Private partnership
– Manila
13
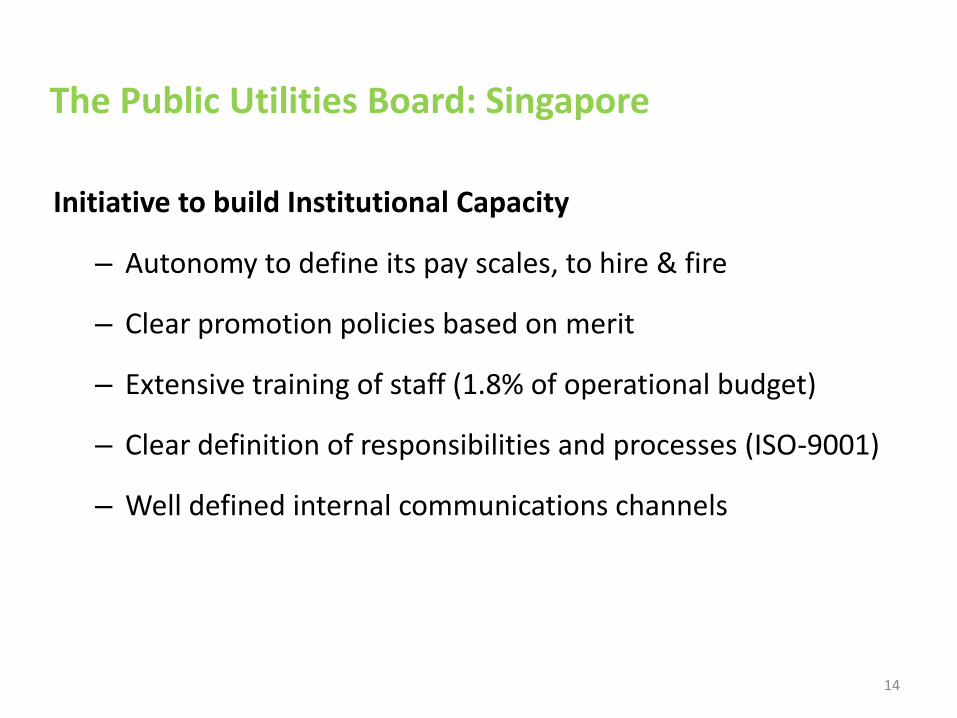
The Public Utilities Board: Singapore
Initiative to build Institutional Capacity
– Autonomy to define its pay scales, to hire & fire
– Clear promotion policies based on merit
– Extensive training of staff (1.8% of operational budget)
– Clear definition of responsibilities and processes (ISO-9001)
– Well defined internal communications channels
14
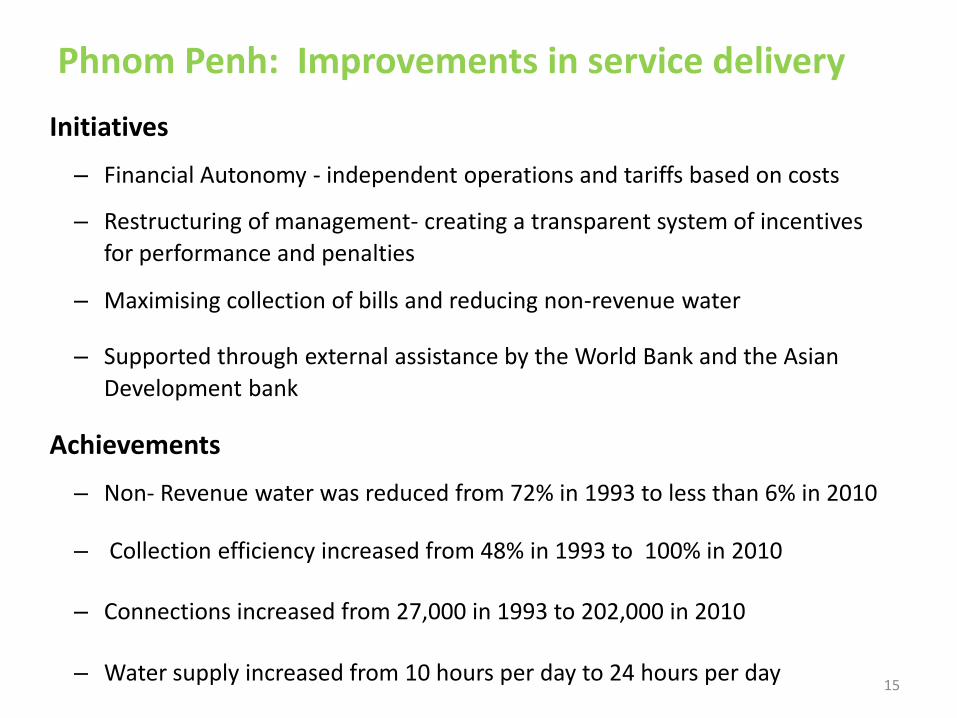
Phnom Penh: Improvements in service delivery
Initiatives
– Financial Autonomy - independent operations and tariffs based on costs
– Restructuring of management- creating a transparent system of incentives
for performance and penalties
– Maximising collection of bills and reducing non-revenue water
– Supported through external assistance by the World Bank and the Asian
Development bank
Achievements
– Non- Revenue water was reduced from 72% in 1993 to less than 6% in 2010
– Collection efficiency increased from 48% in 1993 to 100% in 2010
– Connections increased from 27,000 in 1993 to 202,000 in 2010
– Water supply increased from 10 hours per day to 24 hours per day
15

Ho Chi Minh city, Vietnam: Benefits of Leakage Reduction
0m
0m
2m
6m
2m
7.0m
7.5m
6.5m
10m
9m
Pressure Before Pressure After
NRW Reduction
6,513 cu.m/day
AFTER (October 2011)
Supply (cu.m/day) 6,432
Consumption (cu.m/day) 3,533
Average Pressure (m) 8
NRW Volume (cu.m/day) 2,899
NRW % 45%
BEFORE (August 2010)
Supply (cu.m/day) 13,049
Consumption (cu.m/day) 3,637
Average Pressure (m) 2
NRW Volume (cu.m/day) 9,412
NRW % 72%
16
Performance based leakage contract was entered into with a private company
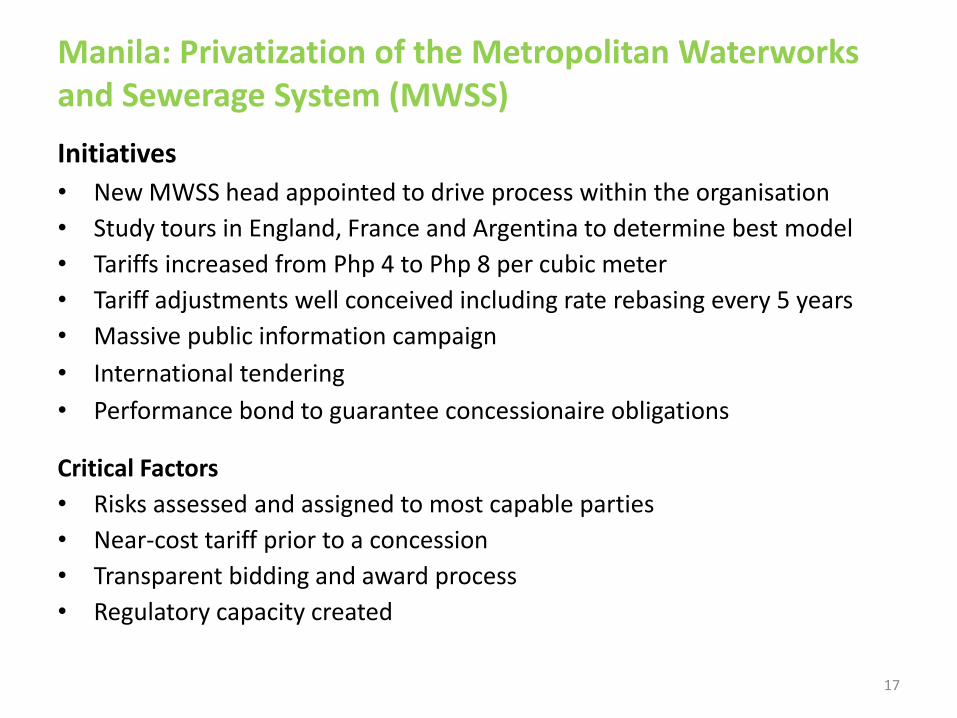
Manila: Privatization of the Metropolitan Waterworks and Sewerage System (MWSS)
Initiatives
• New MWSS head appointed to drive process within the organisation
• Study tours in England, France and Argentina to determine best model
• Tariffs increased from Php 4 to Php 8 per cubic meter
• Tariff adjustments well conceived including rate rebasing every 5 years
• Massive public information campaign
• International tendering
• Performance bond to guarantee concessionaire obligations Critical Factors
• Risks assessed and assigned to most capable parties
• Near-cost tariff prior to a concession
• Transparent bidding and award process
• Regulatory capacity created
17
Think about new models of provision for mega-cities
• No cost advantage with size, and size is sometimes a cost disadvantage
• Need for coordination and cross subsidy
18
Summary
• Multiple challenges to urban water delivery
• Improved governance and incentives critical to creation of well run companies that can cater to the rising demand
• Improvement of capacity for planning within the ULB necessary
• Partnering with private sector may augment existing capacity and sometimes financial resources
19