
Appendix C Traffic and Transport Assessment

Sydney Park JunctionTransport and Traffic Assessment
Final
Transport for NSW
Traf fic an d Tr ansp or t Assessm ent
Trans por t f or NS W

Transport and Traffic Assessment
Sydney Park Junction i
Sydney Park Junction
Project No:
Document Title:
Revision:
Date:
Client Name:
Project Manager:
Author:
File Name:
IA216700
Transport and Traffic Assessment
Final
21 June 2021
Transport for NSW
F Napolitano
C Li / P Truong
Appendix C - Traffic and Transport Assessment
Jacobs Group (Australia) Pty Limited
ABN 37 001 024 095
Level 7, 177 Pacific Highway
North Sydney NSW 2060 Australia
PO Box 632 North Sydney
NSW 2059 Australia
T +61 2 9928 2100
F +61 2 9928 2444
www.jacobs.com
© Copyright 2021 Jacobs Group (Australia) Pty Limited. The concepts and information contained in this document are the property of Jacobs.
Use or copying of this document in whole or in part without the written permission of Jacobs constitutes an infringement of copyright.
Limitation: This document has been prepared on behalf of, and for the exclusive use of Jacobs’ client, and is subject to, and issued in accordance with, the
provisions of the contract between Jacobs and the client. Jacobs accepts no liability or responsibility whatsoever for, or in respect of, any use of, or reliance
upon, this document by any third party.
Document history and status
Revision Date Description Author Checked Reviewed Approved
01 28/08/2020 Issue to TFNSW for review CL / PT PT A Robinson D Wagner
02 02/10/2020 Address TFNSW comments CL MD A Robinson D Wagner
03 16/04/2021 Inclusion of design refinements along
Princess Highway and ancillary compounds
CL MD D Wagner D Wagner
Final 21/06/2021 Final Client Issue Revised opening and design
years to 2023 and 2033
AA MD D Wagner F Napolitano

Transport and Traffic Assessment
Sydney Park Junction ii
Contents
Executive summary............................................................................................................................................................. iv
1. Introduction ............................................................................................................................................................ 8
1.1 Proposal description .............................................................................................................................................................. 8
1.2 Purpose and scope of this report................................................................................................................................... 15
1.3 Structure of this report ...................................................................................................................................................... 15
2. Assessment methodology ................................................................................................................................ 16
2.1 Overall assessment approach ......................................................................................................................................... 16
2.2 Movement and place .......................................................................................................................................................... 17
2.3 Performance indicators ..................................................................................................................................................... 19
2.4 Traffic modelling approach ............................................................................................................................................. 19
3. Existing traffic and transport environment .................................................................................................. 21
3.1 Road safety ............................................................................................................................................................................. 21
3.2 Function and significance of key roads ....................................................................................................................... 24
3.3 Active transport customers (pedestrians and cyclists) ......................................................................................... 27
3.4 Public transport customers .............................................................................................................................................. 31
3.5 General traffic and freight customers .......................................................................................................................... 33
4. Future conditions without the proposal ........................................................................................................ 39
4.1 Road safety ............................................................................................................................................................................. 39
4.2 Future place ........................................................................................................................................................................... 39
4.3 Future movement ................................................................................................................................................................ 42
5. Assessment of potential impacts .................................................................................................................... 55
5.1 Construction........................................................................................................................................................................... 55
5.2 Operation ................................................................................................................................................................................ 59
6. Mitigation and management measures ........................................................................................................ 73
List of tables
Table ES-1-1 Summary of the traffic and transport assessment approach .............................................................................. vi Table ES-1-2 Mitigation and management measures ...................................................................................................................... vii Table 2-1 Summary of the traffic and transport assessment approach ...................................................................................16 Table 2-2 Built environment themes and user outcomes..............................................................................................................17 Table 2-3 Performance indicators ...........................................................................................................................................................19 Table 2-4 Traffic modelling scenarios ...................................................................................................................................................20 Table 2-5 Intersection Level of Service criteria ..................................................................................................................................20 Table 3-1 Crashes by reporting year (2014-2018) ..........................................................................................................................21 Table 3-2 Crashes by contributing factors and conditions (not mutually exclusive) (2014-2018) .............................21 Table 3-3 Crashes by injury severity (2014-2018) ..........................................................................................................................22 Table 3-4 Crash rates (2014-2018) .......................................................................................................................................................22 Table 3-5 Crashes by RUM group (not mutually exclusive) (2014-2018) .............................................................................23 Table 3-6 Top three crash types (2014-2018) ..................................................................................................................................23 Table 3-7 Formal pedestrian crossing opportunities within the proposal area ....................................................................27 Table 3-8 Bus routes near the proposal ................................................................................................................................................31 Table 3-9 Modelled peak hour existing intersection performance (2019) ............................................................................37 Table 4-1 Population and employment forecasts (2016-2036) ................................................................................................41

Transport and Traffic Assessment
Sydney Park Junction iii
Table 4-2 Traffic volume changes without the proposal between 2019, 2023 and 2033...............................................52 Table 4-3 Modelled peak hour intersection performance without proposal (2023 and 2033).....................................53 Table 5-1 Traffic arrangements during construction .......................................................................................................................55 Table 5-2 Cumulative construction impacts .......................................................................................................................................58 Table 5-3 Existing parking and parking with the proposal ............................................................................................................62 Table 5-4 Traffic volume changes with the proposal between 2019, 2023 and 2033 .....................................................65 Table 5-5 Modelled peak hour intersection performance with and without the proposal (2023) ...............................66 Table 5-6 Modelled peak hour intersection performance with and without the proposal (2033) ...............................68 Table 5-7 Movement and place performance of the built environment with the proposal .............................................70 Table 5-8 Cumulative operation impacts .............................................................................................................................................71 Table 6-1 Mitigation and management measures ............................................................................................................................73
List of figures
Figure 1-1 Location of the proposal .......................................................................................................................................................10 Figure 1-2 Overview of the proposal ......................................................................................................................................................11 Figure 2-1 Built environment themes and user outcomes ............................................................................................................18 Figure 3-1 Crashes by road user (2014-2018) ..................................................................................................................................24 Figure 3-2 Pedestrian and cycle networks near the proposal ......................................................................................................29 Figure 3-3 Pedestrian heatmap of Strava users (September 2018 – August 2020) ..........................................................30 Figure 3-4 Cycling heatmap of Strava users (September 2018 – August 2020) .................................................................30 Figure 3-5 Public transport network surrounding the proposal area ........................................................................................32 Figure 3-6 Existing parking conditions ..................................................................................................................................................34 Figure 3-7 Existing peak hour traffic volumes by direction (2019) ...........................................................................................36 Figure 4-1 Centres within the Eastern City District ...........................................................................................................................40 Figure 4-2 Ashmore Precinct structure plan .......................................................................................................................................41 Figure 4-3 Travel zones used in the population and employment forecast analysis..........................................................42 Figure 4-4 M8 Motorway, St Peters interchange, M4-M5 Link and Sydney Gateway .........................................................43 Figure 4-5 Alexandria to Moore Park Connectivity Upgrade – Stage 1 ....................................................................................44 Figure 4-6 Traffic management treatments being progressed as part of the Alexandria local area traffic
management plan ..........................................................................................................................................................................................45 Figure 4-7 Sydney Metro City and Southwest alignment...............................................................................................................46 Figure 4-8 Planned regional, local and recreational cycling routes near the proposal .....................................................48 Figure 4-9 Greater Sydney city-serving transport network vision ..............................................................................................49 Figure 4-10 Peak hour traffic volumes by direction without proposal (2023 and 2033) .................................................51 Figure 5-1 Construction vehicle routes .................................................................................................................................................56 Figure 5-2 Peak hour traffic volumes by direction with and without the proposal (2023) ..............................................63 Figure 5-3 Peak hour traffic volumes by direction with and without the proposal (2033) ..............................................64
Transport and Traffic Assessment
Sydney Park Junction iv
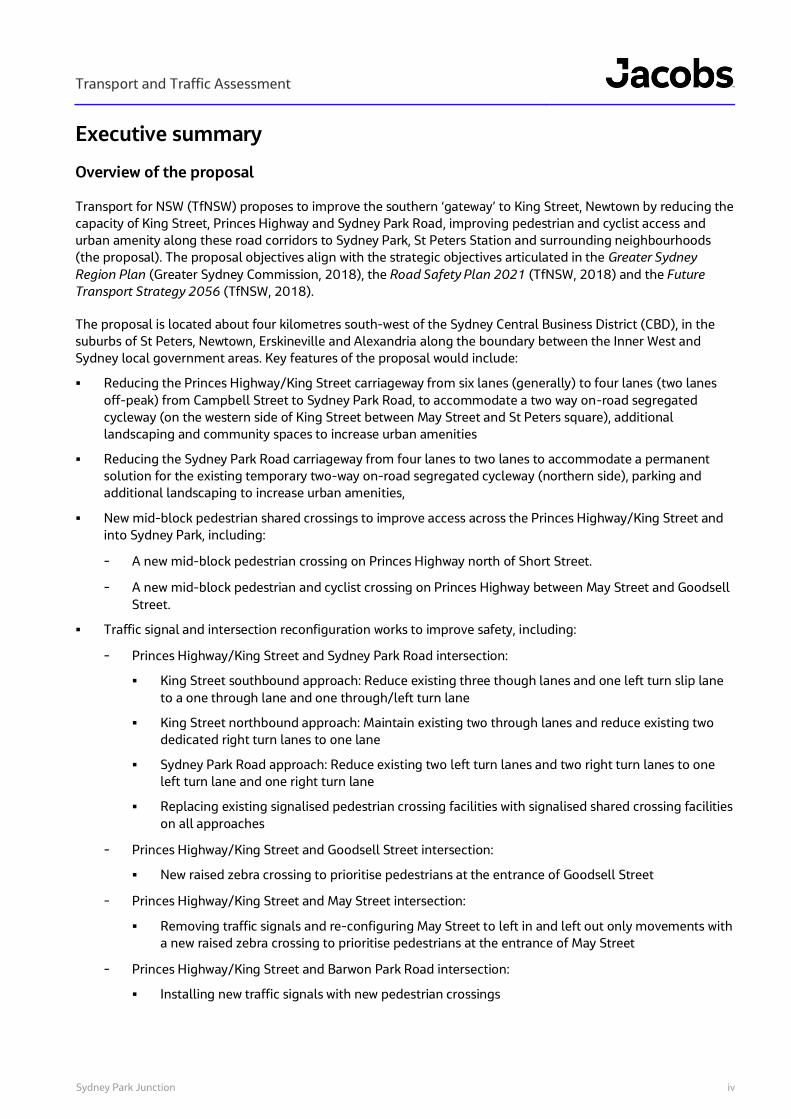
Executive summary
Overview of the proposal
Transport for NSW (TfNSW) proposes to improve the southern ‘gateway’ to King Street, Newtown by reducing the
capacity of King Street, Princes Highway and Sydney Park Road, improving pedestrian and cyclist access and
urban amenity along these road corridors to Sydney Park, St Peters Station and surrounding neighbourhoods
(the proposal). The proposal objectives align with the strategic objectives articulated in the Greater Sydney
Region Plan (Greater Sydney Commission, 2018), the Road Safety Plan 2021 (TfNSW, 2018) and the Future
Transport Strategy 2056 (TfNSW, 2018).
The proposal is located about four kilometres south-west of the Sydney Central Business District (CBD), in the
suburbs of St Peters, Newtown, Erskineville and Alexandria along the boundary between the Inner West and
Sydney local government areas. Key features of the proposal would include:
▪ Reducing the Princes Highway/King Street carriageway from six lanes (generally) to four lanes (two lanes
off-peak) from Campbell Street to Sydney Park Road, to accommodate a two way on-road segregated
cycleway (on the western side of King Street between May Street and St Peters square), additional
landscaping and community spaces to increase urban amenities
▪ Reducing the Sydney Park Road carriageway from four lanes to two lanes to accommodate a permanent
solution for the existing temporary two-way on-road segregated cycleway (northern side), parking and
additional landscaping to increase urban amenities,
▪ New mid-block pedestrian shared crossings to improve access across the Princes Highway/King Street and
into Sydney Park, including:
- A new mid-block pedestrian crossing on Princes Highway north of Short Street.
- A new mid-block pedestrian and cyclist crossing on Princes Highway between May Street and Goodsell
Street.
▪ Traffic signal and intersection reconfiguration works to improve safety, including:
- Princes Highway/King Street and Sydney Park Road intersection:
▪ King Street southbound approach: Reduce existing three though lanes and one left turn slip lane
to a one through lane and one through/left turn lane
▪ King Street northbound approach: Maintain existing two through lanes and reduce existing two
dedicated right turn lanes to one lane
▪ Sydney Park Road approach: Reduce existing two left turn lanes and two right turn lanes to one
left turn lane and one right turn lane
▪ Replacing existing signalised pedestrian crossing facilities with signalised shared crossing facilities
on all approaches
- Princes Highway/King Street and Goodsell Street intersection:
▪ New raised zebra crossing to prioritise pedestrians at the entrance of Goodsell Street
- Princes Highway/King Street and May Street intersection:
▪ Removing traffic signals and re-configuring May Street to left in and left out only movements with
a new raised zebra crossing to prioritise pedestrians at the entrance of May Street
- Princes Highway/King Street and Barwon Park Road intersection:
▪ Installing new traffic signals with new pedestrian crossings

Transport and Traffic Assessment
Sydney Park Junction v
- Sydney Park Road and Mitchell Road intersection:
▪ Eastbound approach: Reduce existing two though lanes and one left turn lane to one through lane
and a through/left turn lane
▪ Westbound approach: Reduce existing one right turn lane, one through lane and one through/left
turn lane to one through/right turn lane and one through/left turn lane
▪ Mitchell Road approach: Change existing one right turn lane and one right/through/left turn lane
to one bus dedicated right turn lane and one through/left turn lane
▪ Reducing the posted speed limit on Princes Highway from 50 kilometres per hour to 40 kilometres from
Campbell Street to Goodsell Street
▪ Sydney Park carpark access on Kings St will be modified so that Barwon Park Road access will be entryonly into the carpark, and King Street will be exit only from the carpark
▪ Adjustments and relocation of parking spaces along the road corridor
▪ Road re-surfacing at signalised intersections and along road corridor where required
▪ Providing dynamic community space for parklets on both sides of Princes Highway
▪ Providing landscaped buildouts on Sydney Park Road and Princes Highway
▪ Relocating the bus stops on Princes Highway near the Short Street intersection, and on Sydney Park Road
near the Mitchell Road intersection
▪ Relocating utilities and adjustments to streetlights where required
▪ Removing the Princes Highway and Sydney Park Road corridors from the approved B-double freight access
network
▪ Adjusting stormwater to accommodate designed works
▪ Relocating existing VMS and CCTV camera
▪ Relocating road signs and line marking works
▪ Temporary construction facilities, including site compounds and an ancillary facility at Burrows Road and
Venice Street, Mascot.
High traffic and freight volumes on Princes Highway, the southern end of King Street and Sydney Park Road,
combined with limited pedestrian crossing opportunities or cycling access, are presently creating an unsafe
environment for all road users. The proposal is required to improve road safety and pedestrian and cyclist access
along the King Street, Princes Highway and Sydney Park Road corridors. The proposal would also link the urban
environment, Sydney Park, transport and pedestrian and cycling movements in a continuously integrated urban
landscape that benefits local communities and visitors.
Approach to transport, traffic and parking assessment
A summary of the methodology used to assess the impact of the proposal on the transport network is provided
in Table ES-1-1.
Transport and Traffic Assessment
Sydney Park Junction vi
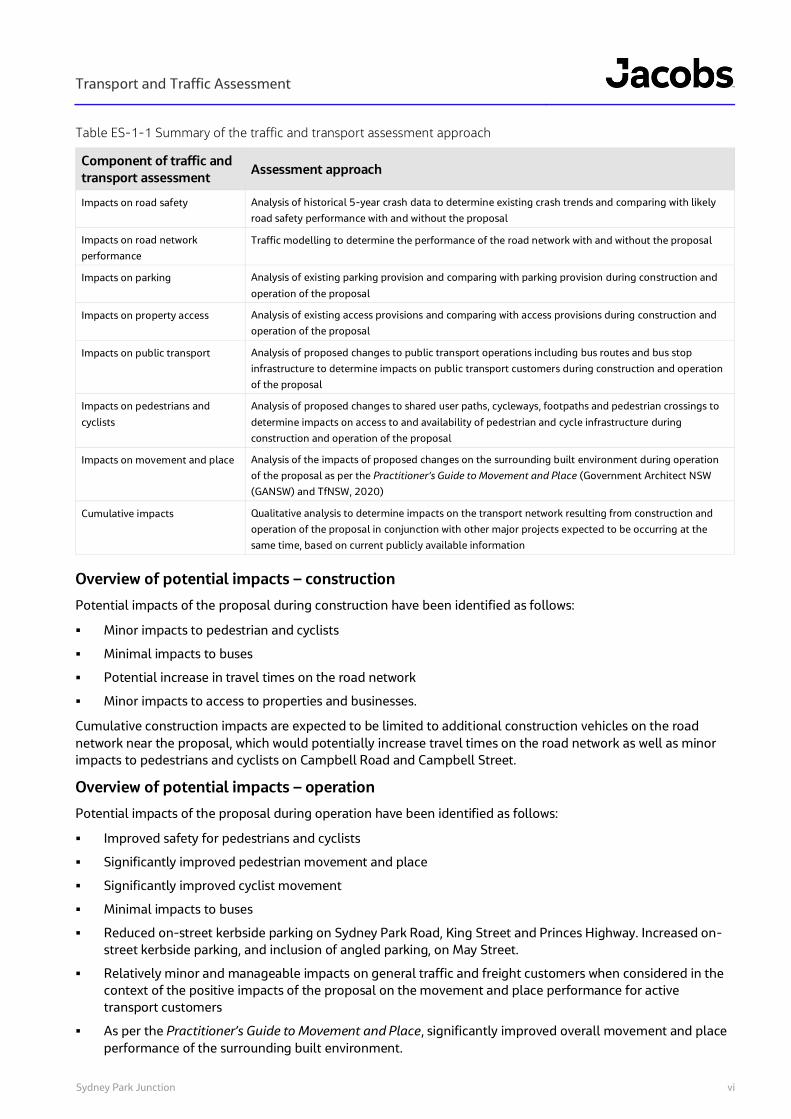
Table ES-1-1 Summary of the traffic and transport assessment approach
Component of traffic and
transport assessment Assessment approach
Impacts on road safety Analysis of historical 5-year crash data to determine existing crash trends and comparing with likely
road safety performance with and without the proposal
Impacts on road network
performance
Traffic modelling to determine the performance of the road network with and without the proposal
Impacts on parking Analysis of existing parking provision and comparing with parking provision during construction and
operation of the proposal
Impacts on property access Analysis of existing access provisions and comparing with access provisions during construction and
operation of the proposal
Impacts on public transport Analysis of proposed changes to public transport operations including bus routes and bus stop
infrastructure to determine impacts on public transport customers during construction and operation
of the proposal
Impacts on pedestrians and
cyclists
Analysis of proposed changes to shared user paths, cycleways, footpaths and pedestrian crossings to
determine impacts on access to and availability of pedestrian and cycle infrastructure during
construction and operation of the proposal
Impacts on movement and place Analysis of the impacts of proposed changes on the surrounding built environment during operation
of the proposal as per the Practitioner’s Guide to Movement and Place (Government Architect NSW
(GANSW) and TfNSW, 2020)
Cumulative impacts Qualitative analysis to determine impacts on the transport network resulting from construction and
operation of the proposal in conjunction with other major projects expected to be occurring at the
same time, based on current publicly available information
Overview of potential impacts – construction
Potential impacts of the proposal during construction have been identified as follows:
▪ Minor impacts to pedestrian and cyclists
▪ Minimal impacts to buses
▪ Potential increase in travel times on the road network
▪ Minor impacts to access to properties and businesses.
Cumulative construction impacts are expected to be limited to additional construction vehicles on the road
network near the proposal, which would potentially increase travel times on the road network as well as minor
impacts to pedestrians and cyclists on Campbell Road and Campbell Street.
Overview of potential impacts – operation
Potential impacts of the proposal during operation have been identified as follows:
▪ Improved safety for pedestrians and cyclists
▪ Significantly improved pedestrian movement and place
▪ Significantly improved cyclist movement
▪ Minimal impacts to buses
▪ Reduced on-street kerbside parking on Sydney Park Road, King Street and Princes Highway. Increased on-
street kerbside parking, and inclusion of angled parking, on May Street.
▪ Relatively minor and manageable impacts on general traffic and freight customers when considered in the
context of the positive impacts of the proposal on the movement and place performance for active
transport customers
▪ As per the Practitioner’s Guide to Movement and Place, significantly improved overall movement and place
performance of the surrounding built environment.

Transport and Traffic Assessment
Sydney Park Junction vii
The cumulative operation impacts of nearby developments or activities include:
▪ Altered traffic patterns in the proposal area, with Euston Road and Campbell Street / Campbell Road
replacing Sydney Park Road, King Street (south of Lord Street) and Princes Highway (north of Campbell
Street) as part of the major east-west route linking St Peters and Moore Park via Alexandria and Waterloo
▪ Improved traffic flow, road safety and trip reliability along the nearby Alexandria to Moore Park corridor
▪ Increased demand for travel across all customer modes in and near the proposal area.
Summary of mitigation measures
A summary of mitigation and management measures is provided in Table ES-1-2.
Table ES-1-2 Mitigation and management measures
Impact Mitigation / management measure Phase Responsible
party
Public transport network
changes during
construction
Bus operators, TfNSW, the City of Sydney and Inner West Council (as
relevant) would be consulted, and the community would be informed
of, any temporary changes to bus stop operation.
Construction Construction
contractor
General traffic and freight
performance during
construction
Ongoing consultation would be undertaken with Transport
Coordination, City of Sydney, Inner West Council, emergency services
and bus operators to minimise transport and traffic impacts during
construction.
Construction Construction
contractor
General traffic and freight
performance during
construction
Implement a variable message sign strategy to encourage through
and regional traffic to use Euston Road and Campbell Street /
Campbell Road instead of Princes Highway and Sydney Park Road.
Construction Construction
contractor
General traffic and freight
performance during
construction
Construction vehicle movements would be minimised during peak
periods. Construction
Construction
contractor
Safety around construction
site accesses
Vehicle access to and from construction sites would be managed to
ensure pedestrian, cyclist and driver safety. This may require manual
supervision, physical barriers and / or temporary traffic control.
Construction Construction
contractor
Construction personnel
parking
All construction personnel parking would be provided on site and not
on local streets. Construction
Construction
contractor
General traffic and freight
performance during
operation
An operational traffic review would be undertaken to confirm the
operational traffic impacts of the proposal on the surrounding road
network. This would be undertaken as part of the ongoing post-
opening operational traffic review that has been committed to as part
of the WestConnex project.
Operation TfNSW
General traffic and freight
performance during
operation
Undertake ongoing network optimisation using the existing traffic
signal control system (SCATS) by minimising intersection and
midblock delays to ensure travel time savings are achieved to the
greatest possible extent.
Operation TfNSW

Transport and Traffic Assessment
Sydney Park Junction 8
1. Introduction
1.1 Proposal description
Transport for NSW (TfNSW) proposes to improve the southern ‘gateway’ to King Street, Newtown by reducing the
capacity of King Street, Princes Highway and Sydney Park Road, improving pedestrian and cyclist access and
urban amenity along these road corridors to Sydney Park, St Peters Station and surrounding neighbourhoods
(the proposal).
The proposal objectives align with the strategic objectives articulated in the Greater Sydney Region Plan (Greater
Sydney Commission, 2018), the Road Safety Plan 2021 (TfNSW, 2018) and the Future Transport Strategy 2056
(TfNSW, 2018).
The proposal is located about four kilometres south-west of the Sydney Central Business District (CBD), in the
suburbs of St Peters, Newtown, Erskineville and Alexandria along the boundary between the Inner West and
Sydney local government areas. The location of the proposal is shown in Figure 1-1 and an overview of the
proposal is provided in Figure 1-2.
Key features of the proposal would include:
▪ Reducing the Princes Highway/King Street carriageway from six lanes (generally) to four lanes (two lanes
off-peak) from Campbell Street to Sydney Park Road, to accommodate a two way on-road segregated
cycleway (on the western side of King Street between May Street and St Peters square), additional
landscaping and community spaces to increase urban amenities
▪ Reducing the Sydney Park Road carriageway from four lanes to two lanes to accommodate a permanent
solution for the existing temporary two-way on-road segregated cycleway (northern side), parking and
additional landscaping to increase urban amenities,
▪ New mid-block pedestrian shared crossings to improve access across the Princes Highway/King Street and
into Sydney Park, including:
- A new mid-block pedestrian crossing on Princes Highway north of Short Street.
- A new mid-block pedestrian and cyclist crossing on Princes Highway between May Street and Goodsell
Street.
▪ Traffic signal and intersection reconfiguration works to improve safety, including:
- Princes Highway/King Street and Sydney Park Road intersection:
▪ King Street southbound approach: Reduce existing three though lanes and one left turn slip lane
to a one through lane and one through/left turn lane
▪ King Street northbound approach: Maintain existing two through lanes and reduce existing two
dedicated right turn lanes to one lane
▪ Sydney Park Road approach: Reduce existing two left turn lanes and two right turn lanes to one
left turn lane and one right turn lane
▪ Replacing existing signalised pedestrian crossing facilities with signalised shared crossing facilities
on all approaches
- Princes Highway/King Street and Goodsell Street intersection:
▪ New raised zebra crossing to prioritise pedestrians at the entrance of Goodsell Street
- Princes Highway/King Street and May Street intersection:
▪ Removing traffic signals and re-configuring May Street to left in and left out only movements with
a new raised zebra crossing to prioritise pedestrians at the entrance of May Street

Transport and Traffic Assessment
Sydney Park Junction 9
- Princes Highway/King Street and Barwon Park Road intersection:
▪ Installing new traffic signals with new pedestrian crossings
- Sydney Park Road and Mitchell Road intersection:
▪ Eastbound approach: Reduce existing two though lanes and one left turn lane to one through lane
and a through/left turn lane
▪ Westbound approach: Reduce existing one right turn lane, one through lane and one through/left
turn lane to one through/right turn lane and one through/left turn lane
▪ Mitchell Road approach: Change existing one right turn lane and one right/through/left turn lane
to one bus dedicated right turn lane and one through/left turn lane
▪ Reducing the posted speed limit on Princes Highway from 50 kilometres per hour to 40 kilometres from
Campbell Street to Goodsell Street
▪ Sydney Park carpark access on Kings St will be modified so that Barwon Park Road access will be entry only
into the carpark, and King Street will be exit only from the carpark
▪ Adjustments and relocation of parking spaces along the road corridor
▪ Road re-surfacing at signalised intersections and along road corridor where required
▪ Providing dynamic community space for parklets on both sides of Princes Highway
▪ Providing landscaped buildouts on Sydney Park Road and Princes Highway
▪ Relocating the bus stops on Princes Highway near the Short Street intersection, and on Sydney Park Road
near the Mitchell Road intersection
▪ Relocating utilities and adjustments to streetlights where required
▪ Removing the Princes Highway and Sydney Park Road corridors from the approved B-double freight access
network
▪ Adjusting stormwater to accommodate designed works
▪ Relocating existing VMS and CCTV camera
▪ Relocating road signs and line marking works
▪ Temporary construction facilities, including site compounds and an ancillary facility at Burrows Road and
Venice Street, Mascot located on Transport for NSW owned land.
Sydney Park Junction is located at the intersection of two major road conduits (King Street and Sydney Park
Road), a significant cultural precinct, public transport infrastructure and one of the city’s major green open
spaces, Sydney Park.
High traffic and freight volumes on Princes Highway, the southern end of King Street and Sydney Park Road,
combined with limited pedestrian crossing opportunities or cycling access, are presently creating an unsafe
environment for all road users. The proposal is required to improve road safety and pedestrian and cyclist
access along the King Street, Princes Highway and Sydney Park Road corridors. The proposal would also link the
urban environment, Sydney Park, transport and pedestrian and cycling movements in a continuously integrated
urban landscape that benefits local communities and visitors.

Transport and Traffic Assessment
10
Figure 1-1 Location of the proposal
Sydney Park Junction

Transport and Traffic Assessment
11
Figure 1-2 Overview of the proposal (page 1 of 4)
Sydney Park Junction

Transport and Traffic Assessment
12
Figure 1-2 Overview of the proposal (page 2 of 4)
Sydney Park Junction

Transport and Traffic Assessment
13
Figure 1-2 Overview of the proposal (page 3 of 4)
Sydney Park Junction

Transport and Traffic Assessment
Sydney Park Junction 14
Figure 1-2 Overview of the proposal (page 4 of 4)

Transport and Traffic Assessment
Sydney Park Junction 15
1.2 Purpose and scope of this report
This technical paper is one of a number of technical papers that form part of the Review of Environmental
Factors (REF). The purpose of this technical paper is to identify and assess the potential impacts of the proposal
during construction and operation in relation to transport and traffic.
This report includes the following:
▪ A review of the existing transport network, including a description of transport infrastructure near the
proposal, public transport service provision, pedestrian and cycle networks, and traffic volumes and patterns
▪ Assessment of the potential transport and traffic impacts of the proposal during construction and
operation, including consideration of cumulative impacts
▪ A suite of measures to mitigate and manage the identified transport and traffic impacts during construction
and operation of the proposal.
1.3 Structure of this report
The remainder of this report is structured as follows:
▪ Chapter 2 documents the assessment methodology including the movement and place and traffic
modelling approaches adopted to assess the potential transport and traffic impacts of the proposal during
construction and operation
▪ Chapter 3 details the existing transport and traffic environment
▪ Chapter 4 provides an assessment of future conditions without the proposal
▪ Chapter 5 provides an assessment of the potential transport and traffic impacts of the proposal during
construction and operation
▪ Chapter 6 identifies mitigation and management measures.

Transport and Traffic Assessment
Sydney Park Junction 16
2. Assessment methodology
2.1 Overall assessment approach
The methodology used to assess the impact of the proposal on the transport network combines the traditional
traffic engineering and traffic modelling approach to road network project development and assessment with
the movement and place approach to road corridor planning and management that recognises the various
functions of the road network.
A summary of the methodology used to assess the impact of the proposal on the transport network is provided
in Table 2-1.
Table 2-1 Summary of the traffic and transport assessment approach
Component of traffic and
transport assessment Assessment approach
Impacts on road safety Analysis of historical 5-year crash data to determine existing crash trends and
comparing with likely road safety performance with and without the proposal
Impacts on road network
performance
Traffic modelling to determine the performance of the road network with and
without the proposal
Impacts on parking Analysis of existing parking provision and comparing with parking provision
during construction and operation of the proposal
Impacts on property access Analysis of existing access provisions and comparing with access provisions
during construction and operation of the proposal
Impacts on public transport
Analysis of proposed changes to public transport operations including bus
routes and bus stop infrastructure to determine impacts on public transport
customers during construction and operation of the proposal
Impacts on pedestrians and
cyclists
Analysis of proposed changes to shared user paths, cycleways, footpaths and
pedestrian crossings to determine impacts on access to and availability of
pedestrian and cycle infrastructure during construction and operation of the
proposal
Impacts on movement and
place
Analysis of the impacts of proposed changes on the movement and place
performance of the surrounding built environment during operation of the
proposal as per the Practitioner’s Guide to Movement and Place (Government
Architect NSW (GANSW) and TfNSW, 2020)
Cumulative impacts
Qualitative analysis to determine impacts on the transport network resulting
from construction and operation of the proposal in conjunction with other
major projects expected to be occurring at the same time, based on current
publicly available information
Transport and Traffic Assessment
Sydney Park Junction 17
2.2 Movement and place
The road network has many functions and people use and experience roads and streets in different ways for
different purposes. Road users can be broadly classified into people using the street for movement and people
using the street as a place. In recognition of these various functions, the Practitioner’s Guide to Movement and
Place outlines the following aims for roads and streets:
▪ Balance movement within, to and from, and through places
▪ Make safer environments
▪ Improve the amenity of places
▪ Support the needs of all users
▪ Use space efficiently
▪ Support the economy by enabling the movement of goods
▪ Support sustainable development.
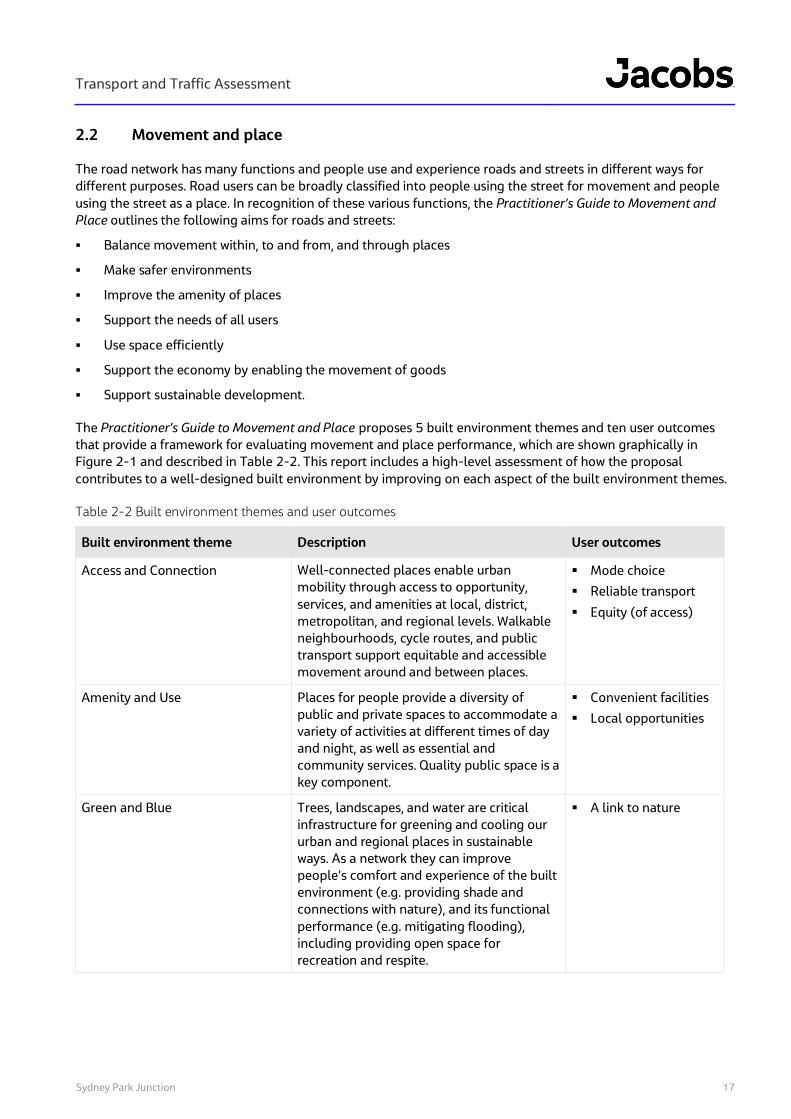
The Practitioner’s Guide to Movement and Place proposes 5 built environment themes and ten user outcomes
that provide a framework for evaluating movement and place performance, which are shown graphically in
Figure 2-1 and described in Table 2-2. This report includes a high-level assessment of how the proposal
contributes to a well-designed built environment by improving on each aspect of the built environment themes.
Table 2-2 Built environment themes and user outcomes
Built environment theme Description User outcomes
Access and Connection Well-connected places enable urban
mobility through access to opportunity,
services, and amenities at local, district,
metropolitan, and regional levels. Walkable
neighbourhoods, cycle routes, and public
transport support equitable and accessible
movement around and between places.
▪ Mode choice
▪ Reliable transport
▪ Equity (of access)
Amenity and Use Places for people provide a diversity of
public and private spaces to accommodate a
variety of activities at different times of day
and night, as well as essential and
community services. Quality public space is a
key component.
▪ Convenient facilities
▪ Local opportunities
Green and Blue Trees, landscapes, and water are critical
infrastructure for greening and cooling our
urban and regional places in sustainable
ways. As a network they can improve
people’s comfort and experience of the built
environment (e.g. providing shade and
connections with nature), and its functional
performance (e.g. mitigating flooding),
including providing open space for
recreation and respite.
▪ A link to nature

Transport and Traffic Assessment
18
Built environment theme Description User outcomes
Comfort and Safety Clear air, sun, shade, peaceful parks, and
active building frontages contribute to the
liveability of places through environmental
comfort including feelings of safety. Road
and street environments can cater for all
users, without risk of death or serious injury.
▪ Comfortable
environment
▪ Low risk
Character and Form The identity of a place is perceived through
its built form, landscape character, and the
contributions of local people over time.
Culture and histories, including Aboriginal
culture and heritage, shape our everyday
environments. The character of each place is
different, and an authentic response to that
character can contribute to the success of
that place.
▪ Human-scaled
▪ Distinct features
Figure 2-1 Built environment themes and user outcomes
Source: Practitioner’s Guide to Movement and Place (GANSW and TfNSW, 2020)
Sydney Park Junction

Transport and Traffic Assessment
Sydney Park Junction 19
2.3 Performance indicators
The performance indicators that are reported for this assessment are both quantitative and qualitative and are
described in Table 2-3. The performance indicators recognise the various functions of the road network and
reflect the needs of each road user customer group.
Table 2-3 Performance indicators
Customer group Performance indicators
General traffic and freight ▪ Intersection performance (determined through traffic modelling)
▪ On-street parking and freight loading provision
Bus ▪ Intersection performance (determined through traffic modelling)
▪ Bus stop facilities
Pedestrians
▪ Walking comfort and accessibility
▪ Pedestrian facilities
▪ Crossing opportunities
▪ Pedestrian environment and security
Cyclists
▪ Cycle connectivity and flow
▪ Cycling facilities
▪ Cycling difficulty
▪ Cycle parking facilities
2.4 Traffic modelling approach
2.4.1 Overview
To assess the impacts of the proposal on road network performance and the movement of general traffic, freight
and buses, traffic modelling has been undertaken of the road network in the modelling study area. The
modelling study area is the area bounded by Princes Highway, King Street, Sydney Park Road, Euston Road and
Campbell Street / Campbell Road.
The approach to traffic modelling undertaken for this assessment aligns with the Traffic Modelling Guidelines
(Roads and Maritime Services, 2013) and includes the following broad steps:
▪ Development of calibrated and validated base models to align with existing operational conditions in base
year 2019
▪ Development of future year base models to align with anticipated operational conditions in the assumed
year of opening (2023) and 10 years after opening (2033)
▪ Application of road network changes associated with the proposal to the future year base models to allow
the identification of potential impacts to road network performance.
Models were developed using the Vissim traffic modelling software package. Vissim is a microsimulation traffic
modelling software package that uses dynamic, stochastic, discrete time modelling techniques to simulate the
movement of individual vehicles based on car-following, lane-changing and gap acceptance algorithms that are
updated several times every second. These vehicle-to-vehicle interactions provide the basis for calculating
delays. Their flexibility allows the modelling of complex traffic operations. The advantage of this type of
modelling is that the build-up and dissipation of queues and their effect on surrounding congestion and travel
times is sensitively modelled. This type of modelling can provide a better representation of queuing, congestion
and delays in at-capacity urban networks compared to static traffic modelling software packages.
Traffic modelling was undertaken for the weekday morning (7 am to 9 am) and evening (4 pm to 6 pm) peak
periods only, which is consistent with the standard approach for this type of assessment. The peak traffic periods
represent a worst-case scenario, as during these periods the road network experiences the maximum

Transport and Traffic Assessment
Sydney Park Junction 20
background traffic demand and the available spare capacity of the road network is at its most limited. A review of
Saturday traffic volumes compared to weekday traffic volumes indicates that weekday peak hour traffic volumes
are higher than Saturday peak hour traffic volumes. Hence, a quantitative assessment on Saturdays has not been
undertaken.
Within the modelled area there are two relatively small car parks (around 100 parking spaces each) which serve
Sydney Park. The northern of these car parks is accessed via a signalised intersection off Sydney Park Rd while
the eastern car park is accessed via non-signalised intersections on Prices Highway and Barwon Park Road. Due
to the size of these car parks, their location and a separate SIDRA assessment of the northern car park; the
decision was made to not include either car park in the VISSIM model as their impact on the network would likely
be negligible.
2.4.2 Traffic modelling scenarios
A summary of traffic modelling scenarios that were adopted to determine the impacts of the proposal on road
network performance is provided in Table 2-4.
Table 2-4 Traffic modelling scenarios
Model
year
Without
proposal
With
proposal
Modelling
scenario Description Impacts assessed
2019 Existing The existing road network N/A
2023
Year of opening
without the proposal
The road network with
background traffic growth
Performance of the road network at
the year of opening without the
proposal
2023
Year of opening with
the proposal
The road network with
background traffic growth and
operation of the proposal
Operational impacts on the road
network as a result of the proposal
2033
Year of opening + 10
years without the
proposal
The road network with
background traffic growth
Performance of the road network at
10 years after opening without the
proposal
2033
Year of opening + 10
years with the proposal
The road network with
background traffic growth and
operation of the proposal
Operational impacts on the road
network as a result of the proposal
2.4.3 Intersection performance indicators
The performance of a road network is largely dependent on the operating performance of intersections, which
form critical capacity control points. The performance indicators that are reported for this assessment include:
▪ Intersection Level of Service – based on criteria outlined in Table 2-5 and defined in the Guide to Traffic
Generating Developments (Roads and Traffic Authority, 2002). The average delay assessed for signalised
intersections is for all movements. The average delay assessed for priority (sign-controlled or roundabout)
intersections is for the worst movement and is expressed in seconds per vehicle.
▪ Maximum queue length on each approach (in metres) over the assessed hour.
Table 2-5 Intersection Level of Service criteria
Level of Service Average delay per vehicle (seconds/vehicle)
A Less than 15
B 15 to 28
C 29 to 42
D 43 to 56
E 57 to 70
F Over 70
Source: Guide to Traffic Generating Developments (Roads and Traffic Authority, 2002)

Transport and Traffic Assessment
21
3. Existing traffic and transport environment
3.1 Road safety
A review of crash data was undertaken to provide an assessment of safety issues and trends within the proposal
area. The crash records used in the assessment comprise the most recent five-year period of finalised crash data,
from 1 January 2014 to 31 December 2018. The crash records include Princes Highway / King Street between
Sydney Park Road and Campbell Street, and Sydney Park Road between Euston Road / Huntley Street and King
Street. The majority of the five-year period of finalised crash data used in the assessment reflects the
configuration of the Euston Road / Huntley Street / Sydney Park Road intersection as a roundabout, with the
conversion to traffic signals occurring in November 2018.
3.1.1 Crash analysis
In the five-year period from 2014 to 2018, a total of 52 crashes were recorded in the proposal area. Crashes by
reporting year are shown in Table 3-1. Key statistics include:
▪ The majority of crashes (37 crashes) occurred on Sydney Park Road
▪ The total number of crashes per year shows a generally decreasing trend in the five-year period from 2014
to 2018.
Table 3-1 Crashes by reporting year (2014-2018)
Road Number of crashes
2014 2015 2016 2017 2018 Total
Princes Highway / King Street between
Sydney Park Road and Campbell Street 3 4 1 5 2 15
Sydney Park Road between Euston Road /
Huntley Street and King Street 11 12 4 8 2 37
Total 14 16 5 13 4 52
Source: TfNSW, Centre for Road Safety (2014-2018)
Crashes by contributing factors and conditions are shown in Table 3-2. Key statistics include:
▪ 65 per cent of crashes (34 crashes) occurred in daylight and 35 per cent of crashes (18 crashes) occurred at
dawn, dusk or in darkness
▪ Four per cent of crashes (two crashes) occurred in adverse weather conditions
▪ Six per cent of crashes (three crashes) involved speeding and none involved fatigue as contributing factors.
Table 3-2 Crashes by contributing factors and conditions (not mutually exclusive) (2014-2018)
Road
Contributing factors Conditions
Speed Fatigue Adverse weather
conditions1
Dark lighting
conditions2
Princes Highway / King Street between
Sydney Park Road and Campbell Street 0 (0%) 0 (0%) 1 (7%) 6 (40%)
Sydney Park Road between Euston
Road / Huntley Street and King Street 3 (8%) 0 (0%) 1 (3%) 12 (32%)
Total 3 (6%) 0 (0%) 2 (4%) 18 (35%)
Source: TfNSW, Centre for Road Safety (2014-2018)
1 Includes crashes that occurred in rain, fog or mist. 2 Includes crashes that occurred at dawn, dusk or in darkness.
Sydney Park Junction

Transport and Traffic Assessment
Sydney Park Junction 22
Crashes by injury severity are shown in Table 3-3. Key statistics include:
▪ No crashes resulted in a fatality
▪ The majority of crashes resulted in an injury (65 per cent of all crashes) with eight resulting in a serious
injury (12 per cent)
▪ Four serious injury crashes were recorded at the Euston Road / Huntley Street / Sydney Park Road
intersection and approaches. Three crashes involved a motorcycle and one crash involved a cyclist
▪ Two serious injury crashes were recorded at the Princes Highway / May Street intersection. One crash
involved a cyclist
▪ Two serious injury crashes were recorded at the Mitchell Road / Sydney Park Road intersection.
Table 3-3 Crashes by injury severity (2014-2018)
Road
Number of crashes
Fatal Serious
injury
Moderate
injury
Minor
injury
Non-
casualty Total
Princes Highway / King Street between
Sydney Park Road and Campbell Street 0 2 2 5 6 15
Sydney Park Road between Euston Road /
Huntley Street and King Street 0 6 5 14 12 37
Total 0 8 7 19 18 52
Source: TfNSW, Centre for Road Safety (2014-2018)
Fatal and serious injury (FSI) and casualty crash rates were benchmarked against similar types of roads in the
Sydney region. The results are shown in Table 3-4. Key statistics include:
▪ FSI crash rates on Princes Highway / King Street and Sydney Park Road are under the Sydney region
average for similar types of road
▪ Casualty crash rates on Princes Highway / King Street and Sydney Park Road are under the Sydney region
average for similar types of road.
Table 3-4 Crash rates (2014-2018)
Road Length
(km)
Average daily
traffic volume
FSI crash
rate
Casualty
crash rate
Casualty crash
rate per 100
million vehicle km
travelled
Princes Highway / King Street between
Sydney Park Road and Campbell Street 0.71 59,500 0.56 2.54 11.68
Sydney Park Road between Euston Road /
Huntley Street and King Street 0.82 45,900 1.46 6.10 36.40
Average Sydney region FSI crash rate for similar types of road 1.65
Average Sydney region casualty crash rate for similar types of road 6.68
Above Sydney region average
Below Sydney region average
Source: TfNSW, Centre for Road Safety (2014-2018)

Transport and Traffic Assessment
Sydney Park Junction 23
3.1.2 Key crash types and movements
Crashes by road user movement (RUM) group are shown in Table 3-5. The top three crash types on each road
are shown in Table 3-6. Key statistics include:
▪ Overall, the three most common crash types were crashes involving cross-traffic movements (23 per cent of
all crashes), rear-end crashes (17 per cent) and right-turn side-swipe crashes (12 per cent). These crash
types represent 52 per cent of crashes within the proposal area
▪ The proportion of crashes involving cross-traffic movements (23 per cent) is higher than the Sydney region
average (14 per cent)
▪ The proportion of right-turn side-swipe crashes (12 per cent) is higher than the Sydney region average (two
per cent)
▪ Nine crashes involving cross-traffic movements were recorded at the Euston Road / Huntley Street / Sydney
Park Road intersection. Three of these crashes involved a cyclist. One of these crashes resulted in a serious
injury
▪ Four right-turn side-swipe crashes were recorded at the Euston Road / Huntley Street / Sydney Park Road
intersection. One of these crashes resulted in a serious injury
▪ Three crashes involving vehicles turning right into opposing through traffic were recorded at the King Street
/ Sydney Park Road intersection. Two of these crashes involved a motorcyclist.
Table 3-5 Crashes by RUM group (not mutually exclusive) (2014-2018)
Road
RUM group
Total
Pe
de
stri
ans
(00
-09
)
Ad
jace
nt
dir
ect
ion
(10
-19
)
Op
po
sin
g
dir
ect
ion
(2
0-2
9)
Sa
me
dir
ect
ion
(30
-39
)
Ma
no
eu
vrin
g
(40
-49
)
Ov
ert
ak
ing
(50
-59
)
On
pa
th (
60
-69
)
Off
pat
h o
n
stra
igh
t (7
0-7
9)
Off
pat
h o
n c
urv
e
(80
-89
)
Mis
cell
an
eo
us
(90
-99
) Princes Highway
/ King Street
between Sydney
Park Road and
Campbell Street
0 2 2 9 1 0 0 1 0 0 15
Sydney Park
Road between
Euston Road /
Huntley Street
and King Street
1 13 3 15 1 0 0 1 3 0 37
Total 1 15 5 24 2 0 0 2 3 0 52
Source: TfNSW, Centre for Road Safety (2014-2018)
Table 3-6 Top three crash types (2014-2018)
Road Top three crash types
Princes Highway / King Street between Sydney Park Road and
Campbell Street
Same direction - 9 crashes (60%)
Adjacent direction - 2 crashes (13%)
Opposing direction - 2 crashes (13%)
Sydney Park Road between Euston Road / Huntley Street and King
Street
Same direction - 15 crashes (41%)
Adjacent direction - 13 crashes (35%)
Opposing direction - 3 crashes (8%)
Source: TfNSW, Centre for Road Safety (2014-2018)

Transport and Traffic Assessment
24
Crashes by road users are shown in Figure 3-1. Key statistics include:
▪ 11 per cent of all crashes involved a motorcycle. This is higher than the Sydney region average (eight per
cent)
▪ Seven per cent of all crashes involved a cyclist. This is higher than the Sydney region average (three per
cent). 60 per cent of crashes involving cyclists occurred at the Euston Road / Huntley Street / Sydney Park
Road intersection.
Figure 3-1 Crashes by road user (2014-2018) 3
Source: TfNSW, Centre for Road Safety (2014-2018)
3.2 Function and significance of key roads
The function and significance of key roads within the proposal area are discussed below.
King Street
King Street is a state road that provides connectivity to City Road, Enmore Road and Princes Highway through
the Newtown activity precinct. King Street is a four-lane single carriageway with a posted speed limit of 50
kilometres per hour. Clearways are operational in the northbound direction in the morning peak period and in
the southbound direction during the evening peak period.
King Street is classified as a tertiary freight route. However, the road does not permit 19-metre B-double heavy
vehicles and is not part of the general mass limit and higher mass limit networks. The freight function of the road
is to facilitate last-mile connectivity for light freight movements travelling to and from the wider freight network.
King Street facilitates city-serving and centre-serving regional bus services that provide public transport access
to Sydney CBD and key centres including Green Square, Mascot, Kogarah, Randwick and Newtown. The road also
facilitates bus routes which provide feeder services between nearby residential and retail areas and the wider
public transport network including Newtown and St Peters train stations.
3 Not mutually exclusive.
Sydney Park Junction

Transport and Traffic Assessment
Sydney Park Junction 25
King Street has high significance for active transport and facilitates pedestrian access and local cycling to retail
and recreational destinations and transport interchanges. King Street has a high place function due to high levels
of street activation within the Newtown activity precinct. The adjoining land uses are primarily retail with some
mixed-use medium-density residential and education land uses. As such, pedestrian occupancy and dwelling is
high along King Street.
Princes Highway
Princes Highway is a state road that connects Ultimo to southern Sydney and the south coast of NSW. Near the
proposal, Princes Highway provides north-south connectivity to major east-west corridors including Sydney Park
Road, Canal Road, Railway Road and the M8 Motorway. The road is a six-lane dual carriageway with a posted
speed limit of 60 kilometres per hour. Clearways are operational in the northbound direction in the morning
peak period and in the southbound direction during the evening peak period.
Near the proposal, Princes Highway is classified as a secondary freight route. The road permits the carriage of
25 / 26-metre B-double heavy vehicles as part of the general mass limit and higher mass limit network. Princes
Highway provides connectivity for freight movements between industrial areas at St Peters, Sydenham and
Tempe, and the wider arterial road and motorway networks.
Princes Highway facilitates city-serving and centre-serving regional bus services that provide public transport
access to Sydney CBD and key centres including Green Square, Mascot, Kogarah, Randwick and Newtown. The
road also facilitates bus routes which provide feeder services between nearby residential and employment areas
and the wider public transport network including St Peters train station.
The function of Princes Highway for active transport is to provide access to key walking and local cycling
destinations including nearby public transport interchanges and recreational areas. Pedestrian and cyclist
activity is concentrated at the northern end of Princes Highway near St Peters train station and the entrances to
Sydney Park. Some pedestrian and cycling activity occurs along the western frontage of Sydney Park, which is a
district destination, but activity generally occurs away from the road within Sydney Park itself. Elsewhere, cycling
and pedestrian activity is limited as industrial and retail land uses are generally accessed by private vehicle.
Princes Highway has limited active frontages along the road, which are primarily local places. Pedestrian
occupancy and dwelling associated with St Peters train station and Sydney Park generally occurs away from the
road. The adjoining land uses include medium-density residential and retail, industrial land uses to the south and
recreational land uses to the north-east. Within the existing mixed-use land use zoning, redevelopment is
currently occurring from industrial to retail and residential land uses along Princes Highway within the proposal
area.
Sydney Park Road
Sydney Park Road is a state road that connects Alexandria to the east to King Street to the west. The road
functions as part of the major east-west route linking St Peters and Moore Park via Alexandria and Waterloo.
Sydney Park Road is a four-lane single carriageway road with a posted speed limit of 60 kilometres per hour.4
Clearways are operational in both directions during the weekday morning and evening peak periods.
Sydney Park Road is classified as a secondary freight route. The road permits 25 / 26 metre B-double heavy
vehicles as part of the general mass limit and higher mass limit network. Sydney Park Road (as part of the east-
west route between St Peters and Moore Park) provides connectivity for freight movements between industrial
areas at St Peters, Alexandria and Beaconsfield, and the wider arterial road network.
As with Princes Highway, Sydney Park Road facilitates city-serving and centre-serving regional bus services that
provide public transport access to Sydney CBD and key centres including Green Square, Mascot, Randwick and
4 As of July 2020, to accommodate the temporary Sydney Park Road pop-up cycleway, Sydney Park Road is a three-lane single carriageway west of
Mitchell Road and a four-lane single carriageway east of Mitchell Road with a posted speed limit of 40 kilometres per hour.

Transport and Traffic Assessment
Sydney Park Junction 26
Newtown. The road also facilitates bus routes which provide feeder services between nearby residential and
employment areas and the wider public transport network including St Peters train station.
The function of Sydney Park Road for active transport is to provide access to key walking and cycling
destinations including nearby public transport interchanges and recreational areas, as well as providing
connectivity to the wider regional cycle network for access to the Sydney CBD, Redfern, Green Square, Sydney
Airport and the Inner West. Pedestrian and cyclist activity is concentrated at the western end near St Peters train
station. Some pedestrian and cycling activity occurs along the northern frontage of Sydney Park but the majority
of activity occurs away from the road within Sydney Park itself. Elsewhere, cycling and pedestrian activity is
moderate due to residential destinations on and near the road.
Sydney Park Road has limited active frontages along the road. The adjoining land uses include medium-density
residential to the north and recreational land uses to the south. Pedestrian occupancy and dwelling at locations
including Sydney Park and St Peters train station generally occurs away from the road.
Mitchell Road
Mitchell Road is a north-south sub-arterial road that connects Henderson Road at Eveleigh at its northern end
and Sydney Park Road at its southern end. The road functions as an alternative parallel route to Euston Road /
McEvoy Street and facilitates through traffic access to Waterloo, Redfern and Sydney CBD as well as local access
to Erskineville. Near the proposal, Mitchell Road is a two-lane single carriageway with a posted speed limit of 50
kilometres per hour. A mix of timed and unrestricted kerbside parking is permitted on both sides of Mitchell
Road. The road is not a designated freight route.
Mitchell Road facilitates city-serving and centre-serving regional bus services that provide public transport
access to Sydney CBD and destinations including Marrickville, Leichhardt and Coogee. The road facilitates bus
routes which provide feeder services between nearby residential areas and the wider public transport network
including St Peters train station.
The land uses adjoining Mitchell Road are low to high-density residential, retail and recreational. The function of
Mitchell Road for active transport is to facilitate access to and from these local destinations as well as cycling
connectivity to the wider regional cycle network. Mitchell Road has limited active frontages and pedestrian
occupancy and dwelling opportunities.
Euston Road
Euston Road is a state road that connects McEvoy Street at its northern end and Campbell Road / M8 Motorway
at its southern end. The road functions as part of the major east-west route linking St Peters and Moore Park via
Alexandria and Waterloo. The road is a six-lane dual carriageway south of Huntley Street / Sydney Park Road and
is a four-lane single carriageway north of Huntley Street / Sydney Park Road. The posted speed limit is 60
kilometres per hour.
Euston Road is classified as a secondary freight route. The road permits short B-double combination vehicles as
part of the higher mass limit network. As with Sydney Park Road, Euston Road (as part of the east-west route
between St Peters and Moore Park) provides connectivity for freight movements between industrial areas at St
Peters, Alexandria and Beaconsfield, and the wider arterial road network. The road does not carry public
transport services.
The function of Euston Road for active transport is to provide local access to adjoining residential, retail,
industrial and recreational land uses. Some local pedestrian and cycling activity occurs along the eastern
frontage of Sydney Park but the majority of activity occurs away from the road within Sydney Park itself. Euston
Road has limited active frontages along the road.

Transport and Traffic Assessment
Sydney Park Junction 27
Campbell Street / Campbell Road
Campbell Street / Campbell Road is a sub-arterial road and provides east-west connectivity between Bourke
Road at Alexandria to the east and Bedwin Road / May Street / Unwins Bridge Road at St Peters to the west. It
also provides connection to the M8 Motorway. East of Princes Highway, Campbell Street / Campbell Road is a
six-lane dual carriageway road with a posted speed limit of 60 kilometres per hour.
Campbell Street / Campbell Road is not a designated freight route. However, it provides connectivity between
the M8 Motorway and industrial areas at St Peters, Alexandria and Mascot. The road does not carry public
transport services. The function of Campbell Street / Campbell Road for active transport is to provide local
access to adjoining residential and industrial land uses as well as the southern edge of Sydney Park. However, the
majority of activity occurs away from the road within Sydney Park itself. Campbell Street / Campbell Road has
limited active frontages along the road.
3.3 Active transport customers (pedestrians and cyclists)
Near the proposal, footpaths are provided on both sides of Princes Highway, Sydney Park Road and King Street.
Footpaths are generally wide, particularly on King Street, with average footpath widths of over 1.8 metres. On
Sydney Park Road an approximately two-metre verge separates the shared path and road and contributes to a
comfortable walking environment. However, on Princes Highway there is no separation between the footpath
and road except for the eastern side between Sydney Park Road and Barwon Park Road. This contributes to an
uncomfortable walking environment due to the 60 kilometres per hour speed limit and high adjacent vehicle
flow. There is also no buffer zone between the footpath and road on King Street. However, parking is permitted
on sections of Princes Highway and King Street during off-peak periods, acting as an informal buffer zone
between pedestrians and passing vehicles. Furthermore, a lower speed limit of 50 kilometres per hour and wide
footpaths contribute to a generally comfortable walking environment on King Street.
Formal pedestrian crossing opportunities within the proposal area are shown in Table 3-7. Sections with long
distances between formal pedestrian crossing opportunities are located on Princes Highway between Campbell
Street and May Street and on Sydney Park Road between King Street and Mitchell Road. Furthermore, pedestrian
crossings are missing on one or multiple legs at several intersections within the proposal area.
Table 3-7 Formal pedestrian crossing opportunities within the proposal area
Intersection Formal pedestrian crossing opportunity
Furthest distance to
adjacent formal crossing
opportunity (metres)
King Street / Concord Street
/ Lord Street
Signalised crossings provided on all legs 80
King Street / Sydney Park
Road
Signalised crossings provided on all legs 520
Princes Highway / May
Street
Signalised crossings on southern and western legs only. Pedestrian ramp
not provided on the western side of the crossing on the southern leg
420
Princes Highway / Barwon
Park Road
No formal pedestrian crossing opportunity provided -
Princes Highway / Short
Street
No formal pedestrian crossing opportunity provided -
Princes Highway / Campbell
Street
Signalised crossings provided on all legs 420
Euston Road / Huntley
Street / Sydney Park Road
Signalised crossing on eastern leg only 280
Mitchell Road / Sydney Park
Road
Signalised crossings on eastern and northern legs only 525

Transport and Traffic Assessment
Sydney Park Junction 28
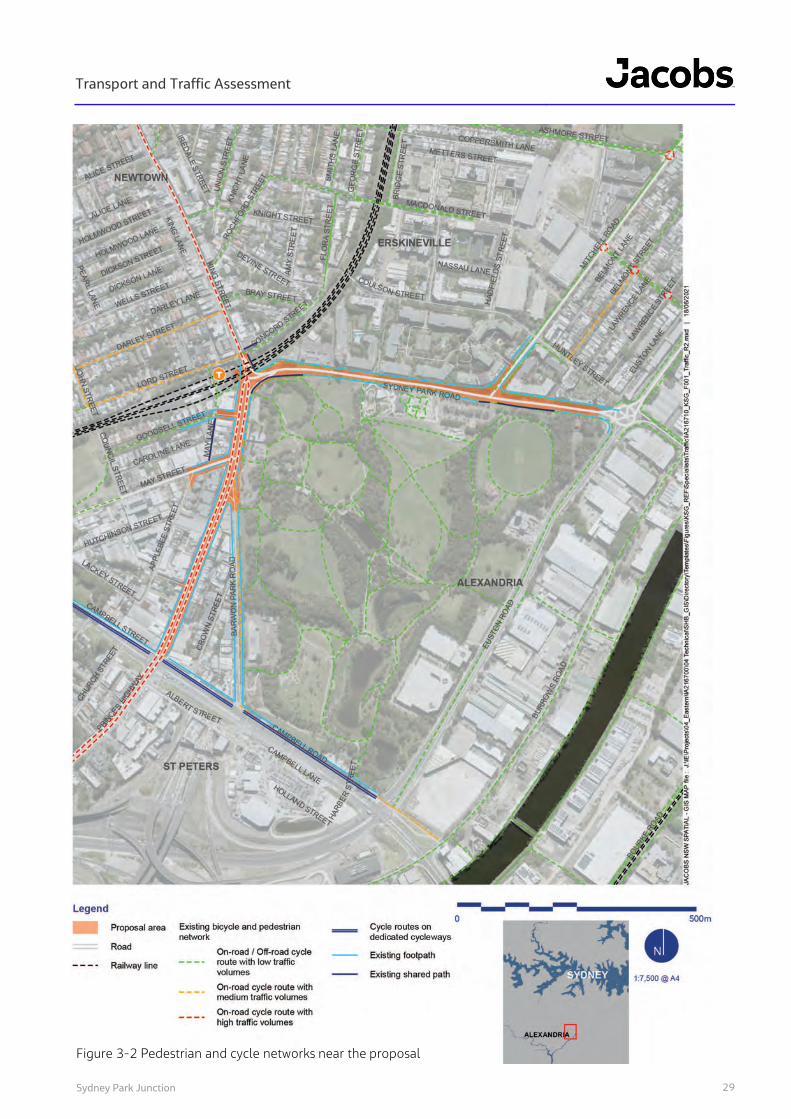
The existing cycle network surrounding the proposal is shown in Figure 3-2 and is well-established with provision
of off-road shared paths on both sides of Sydney Park Road. These shared paths provide connectivity to the
wider regional cycle network for access to the Sydney CBD, Redfern, Green Square, Sydney Airport and the Inner
West. However, these shared paths do not meet current off-road shared path minimum width requirements (2.5
metres). The shared paths on Sydney Park Road are currently supplemented by a temporary separated cycleway
on the northern side of Sydney Park Road between Mitchell Road and King Street. Off-road shared paths are also
provided throughout Sydney Park. In terms of bicycle parking, u-rails are provided at regular intervals on both
sides of King Street between Lord Street and Alice Street and service retail / commercial land uses and active
frontages within the Newtown activity precinct. Secure bicycle parking spaces are not provided on Princes
Highway or Sydney Park Road.
Site observations identified areas of high pedestrian activity at the King Street / Sydney Park Road intersection
and along King Street due to pedestrian demand for travel to St Peters train station and high street activation
within Newtown activity precinct. Areas of high cyclist and pedestrian activity include the entrances to Sydney
Park at the Mitchell Road / Sydney Park Road and Princes Highway / May Street intersections as Sydney Park is a
major recreational destination. Low to moderate levels of pedestrian and cyclist activity occur along King Street
(south of the rail overbridge), Princes Highway and Sydney Park Road. As shown in Figure 3-3 and Figure 3-4,
this is supported by Strava data5 which identifies that pedestrians using Strava are concentrated along King
Street, Mitchell Road and in and around Sydney Park. Furthermore, cyclists using Strava are concentrated along
Sydney Park Road, Princes Highway, King Street and Mitchell Road. No active frontages are present on Sydney
Park Road and active frontages along Princes Highway and King Street (south of the rail overbridge) are limited
to short sections of retail and commercial land uses near Short Street.
5 Strava data is typically used only to inform an understanding of pedestrian and cyclist activity as it only captures the travel patterns of a portion of all
active transport users.
Transport and Traffic Assessment
29
Figure 3-2 Pedestrian and cycle networks near the proposal
Sydney Park Junction

Transport and Traffic Assessment
Sydney Park Junction 30
Figure 3-3 Pedestrian heatmap of Strava users (September 2018 – August 2020)
Figure 3-4 Cycling heatmap of Strava users (September 2018 – August 2020)
Transport and Traffic Assessment
Sydney Park Junction 31
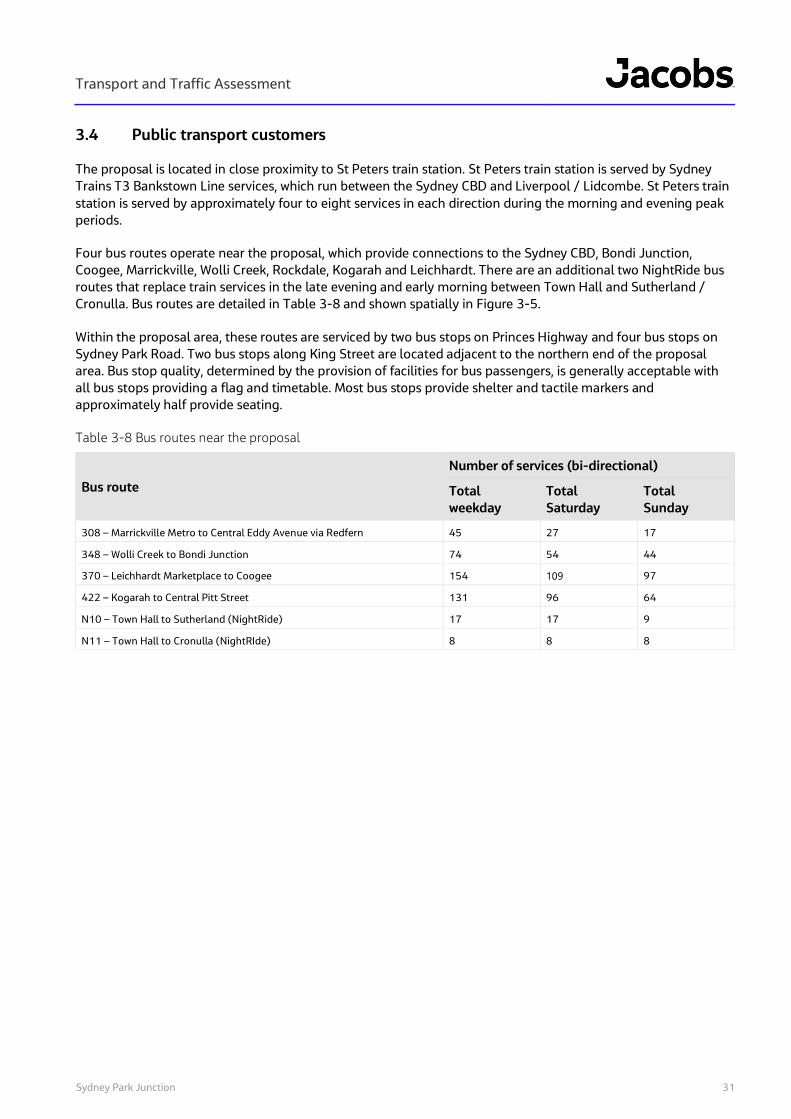
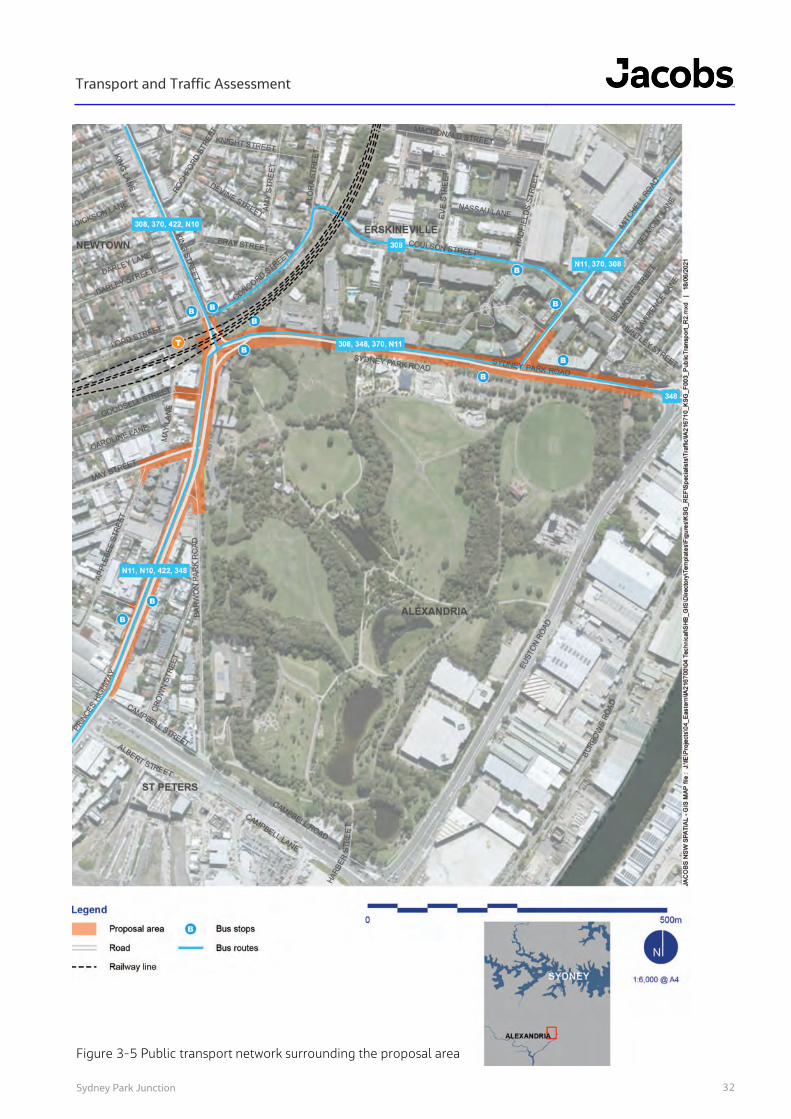
3.4 Public transport customers
The proposal is located in close proximity to St Peters train station. St Peters train station is served by Sydney
Trains T3 Bankstown Line services, which run between the Sydney CBD and Liverpool / Lidcombe. St Peters train
station is served by approximately four to eight services in each direction during the morning and evening peak
periods.
Four bus routes operate near the proposal, which provide connections to the Sydney CBD, Bondi Junction,
Coogee, Marrickville, Wolli Creek, Rockdale, Kogarah and Leichhardt. There are an additional two NightRide bus
routes that replace train services in the late evening and early morning between Town Hall and Sutherland /
Cronulla. Bus routes are detailed in Table 3-8 and shown spatially in Figure 3-5.
Within the proposal area, these routes are serviced by two bus stops on Princes Highway and four bus stops on
Sydney Park Road. Two bus stops along King Street are located adjacent to the northern end of the proposal
area. Bus stop quality, determined by the provision of facilities for bus passengers, is generally acceptable with
all bus stops providing a flag and timetable. Most bus stops provide shelter and tactile markers and
approximately half provide seating.
Table 3-8 Bus routes near the proposal
Bus route
Number of services (bi-directional)
Total
weekday
Total
Saturday
Total
Sunday
308 – Marrickville Metro to Central Eddy Avenue via Redfern 45 27 17
348 – Wolli Creek to Bondi Junction 74 54 44
370 – Leichhardt Marketplace to Coogee 154 109 97
422 – Kogarah to Central Pitt Street 131 96 64
N10 – Town Hall to Sutherland (NightRide) 17 17 9
N11 – Town Hall to Cronulla (NightRIde) 8 8 8
Transport and Traffic Assessment
32
Figure 3-5 Public transport network surrounding the proposal area
Sydney Park Junction

Transport and Traffic Assessment
Sydney Park Junction 33
3.5 General traffic and freight customers
3.5.1 Parking
Near the proposal, public off-street parking is provided at two car parks at Sydney Park. The car parks near
Mitchell Road and May Street provide approximately 100 and 90 car spaces, respectively. Both car parks are
restricted to four-hour parking on Monday to Friday and unrestricted on weekends.
On-street kerbside parking on Princes Highway, King Street and Sydney Park Road is generally limited. Sections
of on-street kerbside parking are permitted at the following locations and times:
▪ Western side of Princes Highway between Campbell Street and May Street (approximately 241 metres
equating to 38 car parking spaces): generally unrestricted kerbside parking outside of weekday morning
peak period clearway restrictions (6 am to 10 am). Short section of 30-minute timed parking south of Short
Street between 10 am to 6 pm on weekdays and unrestricted otherwise
▪ Western side of King Street between May Street and Goodsell Street (approximately 40 metres equating to
6 car parking spaces): unrestricted kerbside parking outside of weekday morning peak period clearway
restrictions (6 am to 10 am) and no parking (3.30 pm to 5.30 pm on weekdays)
▪ Eastern side of Princes Highway between Barwon Park Road and Campbell Street (approximately 210
metres equating to 33 car parking spaces): generally unrestricted kerbside parking outside of weekday
evening peak period clearway restrictions (3 pm to 7 pm)
▪ Northern side of Sydney Park Road between east of King Street and west of Mitchell Street (approximately
252 metres equating to 38 car parking spaces): unrestricted kerbside parking on weekends only
- As of July 2020, this parking has been temporarily removed to accommodate the temporary Sydney
Park Road pop-up cycleway. Existing no parking zones on the southern side of Sydney Park Road
between east of King Street and west of Mitchell Street (approximately 310 metres) have been
temporarily changed to three-hour timed parking between 8 am to 8 pm seven days a week.
▪ King Street north of Lord Street: mix of timed and unrestricted kerbside parking on both sides outside of
weekday morning (6 am to 10 am) and evening (3 pm to 7 pm) peak period clearway restrictions
▪ Barwon Park Road south of Princes Highway: unrestricted kerbside parking
▪ May Street west of Princes Highway: mix of timed and unrestricted kerbside parking on both sides
▪ Goodsell Street west of King Street: mix of timed and unrestricted kerbside parking on both sides.
On and off-street parking and kerbside restrictions within the proposal area are shown in Figure 3-6.

Transport and Traffic Assessment
34
Figure 3-6 Existing parking conditions
Sydney Park Junction

Transport and Traffic Assessment
Sydney Park Junction 35
3.5.2 Traffic volumes and patterns
King Street (south of Lord Street) and Princes Highway (north of Campbell Street) carry high volumes of traffic.
During the weekday morning peak hour, the peak direction on these roads is northbound with volumes of up to
1860 vehicles per hour in each direction near the proposal. During the weekday evening peak hour, the peak
direction is southbound with volumes of up to 2090 vehicles per hour in each direction.
Sydney Park Road carries a high volume of traffic ranging from 580 to 1970 vehicles in each direction during the
weekday morning and evening peak hours. Sydney Park Road exhibits a distinct eastbound morning peak
direction and westbound evening peak direction due to traffic travelling to and from industrial and employment
areas located to the east.
King Street (north of the St Peters railway bridge) carries 700 to 1000 vehicles in each direction during the
weekday morning and evening peak hours. King Street does not exhibit a defined peak direction and vehicle
volumes are approximately equal during both peak hours.
Mitchell Road carries between 240 and 730 vehicles in each direction with a northbound peak direction during
the weekday morning and evening peak hours.
Campbell Street / Campbell Road carries between 340 to 670 vehicles in each direction during the peak hours
and exhibits an eastbound peak direction during the morning peak period and a westbound peak direction
during the evening peak period. Euston Road carries low volumes of traffic (up to 140 vehicles during the peak
hours). It is to be noted that these numbers were derived prior to opening of the M8 Motorway in July 2020. The
opening of the motorway is expected to have increased these numbers significantly.
Approximate peak hour midblock volumes on key roads are shown inFigure 3-7.

Transport and Traffic Assessment
Sydney Park Junction 36
Figure 3-7 Existing peak hour traffic volumes by direction (2019)
3.5.3 Intersection performance
Modelled performance of key intersections in the modelling study area during the weekday morning and evening
peak hours is shown in
Table 3-9.
Modelled intersection performance indicates that the following intersections perform at LOS F:
▪ Princes Highway / May Street during the weekday morning peak hour. This is due to northbound congestion
downstream at the King Street / Sydney Park Road intersection where there are high volumes of through
traffic conflicting with right-turning and cross-street traffic
▪ Euston Road / Huntley Street / Sydney Park Road during the weekday morning peak hour. This is due to
high volumes of conflicting traffic from the southbound and westbound approaches
▪ Mitchell Road / Sydney Park Road during the weekday morning peak hour. This is due to high volumes of
east-west traffic on Sydney Park Road.

Transport and Traffic Assessment
37
Table 3-9 Modelled peak hour existing intersection performance (2019)6
Intersection and
peak hour
Intersection
throughput
(veh / hr)
Average delay
(sec / veh) Level of Service
Maximum queue length by
directional approach (m)
King Street / Sydney Park Road
Morning 3140 44 D
Northbound 185
Eastbound -
Southbound 60
Westbound 125
Evening 4120 38 C
Northbound 95
Eastbound -
Southbound 55
Westbound 400
Princes Highway / May Street
Morning 2710 88 F
Northbound 440
Eastbound 335
Southbound 105
Westbound -
Evening 3560 23 B
Northbound < 5
Eastbound 70
Southbound 115
Westbound -
Princes Highway / Campbell Street
Morning 2590 41 C
Northbound 270
Eastbound 170
Southbound 75
Westbound 75
Evening 3240 15 B
Northbound 115
Eastbound 95
Southbound 120
Westbound 110
Euston Road / Huntley Street / Sydney Park Road
Morning 2010 77 F
Northbound -
Eastbound 170
Southbound 260
Westbound 270
Evening 2410 30 C
Northbound -
Eastbound 90
Southbound 175
Westbound 235
6 Intersection performance results reflect traffic conditions in 2019 prior to the opening of the M8 Motorway.
Sydney Park Junction

Transport and Traffic Assessment
Sydney Park Junction 38
Intersection and
peak hour
Intersection
throughput
(veh / hr)
Average delay
(sec / veh) Level of Service
Maximum queue length by
directional approach (m)
Mitchell Road / Sydney Park Road
Morning 2470 105 F
Northbound < 5
Eastbound 510
Southbound 80
Westbound 290
Evening 3270 31 C
Northbound < 5
Eastbound 165
Southbound 125
Westbound 225
Euston Road / Campbell Road
Morning 620 4 A
Northbound -
Eastbound 10
Southbound 50
Westbound < 5
Evening 590 2 A
Northbound -
Eastbound 10
Southbound 25
Westbound < 5

Transport and Traffic Assessment
Sydney Park Junction 39
4. Future conditions without the proposal
4.1 Road safety
As discussed in Section 3.1, a review of crash data identified the following road safety issues in the proposal area:
▪ The majority of crashes resulted in an injury (65 per cent of all crashes) with eight resulting in a serious
injury (12 per cent)
▪ The three most common crash types were crashes involving cross-traffic movements (23 per cent of all
crashes), rear-end crashes (17 per cent) and right-turn side-swipe crashes (12 per cent). These crash types
represent 52 per cent of crashes within the proposal area
▪ The proportion of crashes involving cross-traffic movements (23 per cent) is higher than the Sydney region
average (14 per cent)
▪ The proportion of right-turn side-swipe crashes (12 per cent) is higher than the Sydney region average (two
per cent)
▪ The proportion of crashes involving motorcycles (11 per cent) is higher than the Sydney region average
(eight per cent)
▪ The proportion of crashes involving cyclists (seven per cent) is higher than the Sydney region average (three
per cent). 60 per cent of crashes involving cyclists occurred at the Euston Road / Huntley Street / Sydney
Park Road intersection.
Without intervention, it is anticipated that these road safety issues would continue in the long-term.
4.2 Future place
4.2.1 Land use changes near the proposal
Proximity to centres
The proposal is located near, and provides access to, key centres that are identified in the Eastern City District
Plan (Greater Sydney Commission, 2018). The nearest centres to the proposal are the Newtown, Marrickville and
Marrickville Metro local centres to the west, and the Green Square – Mascot strategic centre located further away
to the east. Development of these key centres to support population and employment growth is likely to
increase the demand for travel for all customer groups on roads in the proposal area.

Transport and Traffic Assessment
Sydney Park Junction 40
Figure 4-1 Centres within the Eastern City District
Source: Eastern City District Plan (Greater Sydney Commission, 2018)
Ashmore Precinct
The Ashmore Precinct is a 17.4-hectare industrial estate that has been identified for urban renewal including
new housing, commercial and retail land uses, community facilities, public open space and active transport
facilities. The Ashmore Precinct is located in Erskineville to the north of the proposal and is bounded by Ashmore
Street, Mitchell Road, Coulson Street and the railway line. The Ashmore Precinct will provide up to 3500 new
dwellings to service approximately 6300 new residents. As of November 2019, the majority of redeveloped lots
are either under construction, nearing completion or complete.
It is anticipated that the Ashmore Precinct would generate additional demand for travel for all customer groups
on roads in and near the proposal area. The Ashmore Precinct is in close proximity to key destinations including
Sydney Park and St Peters train station and is expected to increase pedestrian and cyclist activity in the area,
particularly along Sydney Park Road. However, the Ashmore Precinct is located away from Sydney Park Road and
is not expected to increase active frontages and pedestrian dwelling opportunities along Sydney Park Road.
The structure plan for the Ashmore Precinct is shown in Figure 4-2.

Transport and Traffic Assessment
Sydney Park Junction 41
Figure 4-2 Ashmore Precinct structure plan
Source: South Sydney Development Control Plan Amendment: Urban Design 1997 - Part G Special Precinct No.7 - Ashmore Precinct (City of Sydney, 2006)
Population and employment forecasts
Population and employment forecasts were analysed to quantify the projected growth in population and
employment. Forecasts for travel zones within the proposal area are shown in Table 4-1. The travel zones used in
the analysis are located within one kilometre of the proposal7 and are shown in Figure 4-3.
The forecasts show population growth of approximately 19,400 (47 per cent) between 2016 and 2036, with the
highest growth projected within the Mascot and Erskineville travel zones. Moderate population growth is also
projected in the St Peters Station South travel zone due to some redevelopment from industrial to residential
land uses along Princes Highway within the proposal area. The forecasts show employment growth of
approximately 13,700 (20 per cent) between 2016 and 2036, with the highest growth projected within the
Mascot and Alexandria travel zones. Population and employment growth is likely to increase the demand for
travel for all customer groups on roads in the proposal area.
Table 4-1 Population and employment forecasts (2016-2036)
Year 2016 2026 2016-2026
growth
2016-2026
growth per
annum 2036
2016-2036
growth
2016-2036
growth per
annum
Population 41,155 53,568 30% 3% 60,540 47% 4%
Employment 68,935 75,981 10% 1% 82,671 20% 2%
Source: Travel Zone Explorer (TfNSW, 2020)
7 Travel zones used in the analysis include: 223, 248-251, 254-267, 283, 303, 305, 325, 328-332, 411

Transport and Traffic Assessment
Sydney Park Junction 42
Figure 4-3 Travel zones used in the population and employment forecast analysis
Source: Travel Zone Explorer (TfNSW, 2020)
4.2.2 Summary of future place without the proposal
The future place function of roads near the proposal is not expected to change significantly. Additional active
frontages are not proposed along Sydney Park Road and active frontages along Princes Highway would continue
to be limited to short sections of retail and commercial land uses near Short Street. Land use developments near
the proposal are limited to the Ashmore Precinct and some redevelopment from industrial to retail and
residential land uses along Princes Highway within the proposal area. As discussed in Section 4.2.1, the Ashmore
Precinct is located away from Sydney Park Road and is not expected to increase active frontages and pedestrian
dwelling opportunities along Sydney Park Road. King Street is expected to retain its existing high levels of street
activation and would continue to have a high place function.
4.3 Future movement
4.3.1 Committed transport projects near the proposal
WestConnex and Sydney Gateway
WestConnex and Sydney Gateway are integrated motorway projects that aim to provide faster, safer and more
reliable journeys across Greater Sydney. Near the proposal, the WestConnex M8 Motorway and St Peters
interchange opened in July 2020, and the WestConnex M4-M5 Link and Sydney Gateway are currently under
construction and are expected to open in 2022 and 2023, respectively. These are shown spatially in Figure 4-4.
The M8 Motorway is a nine-kilometre tunnel that duplicates connects the existing M5 East from Kingsgrove to St
Peters interchange. St Peters interchange provides surface connections to Gardeners Road (via a bridge over
Alexandria Canal), Campbell Road and Euston Road, and will provide underground connections to the M4-M5
Link, M6 Stage 1 and Sydney Gateway. The M4-M5 Link will consist of twin 7.5-kilometre mainline motorway
tunnels between the M4 East at Haberfield and the New M5 at St Peters and sized to accommodate up to four
lanes of traffic in each direction. The tunnels will also include a new interchange at Rozelle that would connect
the M4-M5 Link tunnels with City West Link, Anzac Bridge, Iron Cove Link and the proposed future Western

Transport and Traffic Assessment
43
Harbour Tunnel and Beaches Link. Sydney Gateway will provide direct high-capacity road connections linking the
Sydney motorway network at the St Peters interchange with Sydney Airport and Port Botany. Stage 1 of Sydney
Gateway will comprise a new high-capacity four-lane road in each direction connecting the St Peters interchange
with Sydney Airport’s International Terminal and Qantas Drive. Stage 3 will include a high-capacity connection
between Sydney Airport’s Domestic Terminals and St Peters interchange.
The opening of the M8 Motorway, Sydney Gateway, St Peters interchange, related surface road connections and
related surface road upgrades are expected to alter traffic patterns in the proposal area, with Euston Road and
Campbell Street / Campbell Road replacing Sydney Park Road, King Street (south of Lord Street) and Princes
Highway (north of Campbell Street) as part of the major east-west route linking St Peters and Moore Park via
Alexandria and Waterloo.
Figure 4-4 M8 Motorway, St Peters interchange, M4-M5 Link and Sydney Gateway
Source: Sydney Gateway Road Project Environmental Impact Statement (Roads and Maritime Services / Sydney Airport Corporation Limited, 2019)
Alexandria to Moore Park Connectivity Upgrade
The Alexandria to Moore Park Connectivity Upgrade is located to the north-east of the proposal and involves
intersection, safety and amenity improvements along the Alexandria to Moore Park corridor (Euston Road,
McEvoy Street, Lachlan Street, Dacey Avenue and Alison Road). The project aims to improve traffic flow and
facilities for pedestrians and cyclists to support urban renewal, and interfaces with major projects within the
corridor.
Sydney Park Junction

Transport and Traffic Assessment
44
An upgrade of the full corridor would be delivered in stages. Stage 1 focusses on construction of new right and
left turn lanes on McEvoy Street at Fountain Street, and a new right turn lane on Botany Road at McEvoy Street.
These improvements would be supported with new clearways and additional right turn bans into local streets
along the corridor. Minor improvements are also planned at Elizabeth Street / McEvoy Street and at South
Dowling Street / Lachlan Street / Dacey Avenue. Future stages would be subject to the availability of funding and
broader NSW Government priorities. Stage 1 is shown in Figure 4-5.
The project connects to the upgraded Euston Road, which leads to St Peters interchange, M8 Motorway and
upgraded Campbell Street / Campbell Road. The project reinforces the replacement of Sydney Park Road, King
Street (south of Lord Street) and Princes Highway (north of Campbell Street) with Euston Road and Campbell
Street / Campbell Road as part of the major east-west route linking St Peters and Moore Park via Alexandria and
Waterloo.
Figure 4-5 Alexandria to Moore Park Connectivity Upgrade – Stage 1
Source: Alexandria to Moore Park Stage 1 Project Update November 2019 (Roads and Maritime Services, 2019)
Alexandria local area traffic management plan
The Alexandria local area traffic management plan is a series of traffic management treatments being developed
and implemented by the City of Sydney. The treatments aim to minimise the potential impacts of forecast
additional traffic from St Peters interchange on the local road network in Alexandria and would reinforce the use
of Euston Road and McEvoy Street for regional through traffic.
Following a consultation period in 2020, the following treatments are being progressed:
▪ Closure of Anderson Street at Mitchell Road
▪ Closure of Brennan Street at McEvoy Street
▪ Closure of Loveridge Street at McEvoy Street
▪ Midblock closure of Lawrence Street between Maddox Street and Harley Street
▪ Continuous footpath treatment on Renwick Street at Mitchell Road (completed August 2020).
The locations of these treatments are shown in Figure 4-6.
Sydney Park Junction

Transport and Traffic Assessment
Sydney Park Junction 45
Figure 4-6 Traffic management treatments being progressed as part of the Alexandria local area traffic
management plan
Sydney Metro City and Southwest
Sydney Metro City and Southwest is a new railway line that will connect the existing Sydney Metro network from
Chatswood to Sydenham via new metro stations and a conversion of the existing T3 Bankstown Line for metro
services. The project is currently under construction with target completion in 2024. The proposed Waterloo and
Sydenham metro stations are located within 1.6 kilometres of the proposal and are anticipated to facilitate
significant mode shift from general traffic to rail (and supporting bus services).
The alignment of Sydney Metro City and Southwest in the context of the wider Sydney Metro network is shown in
Figure 4-7.
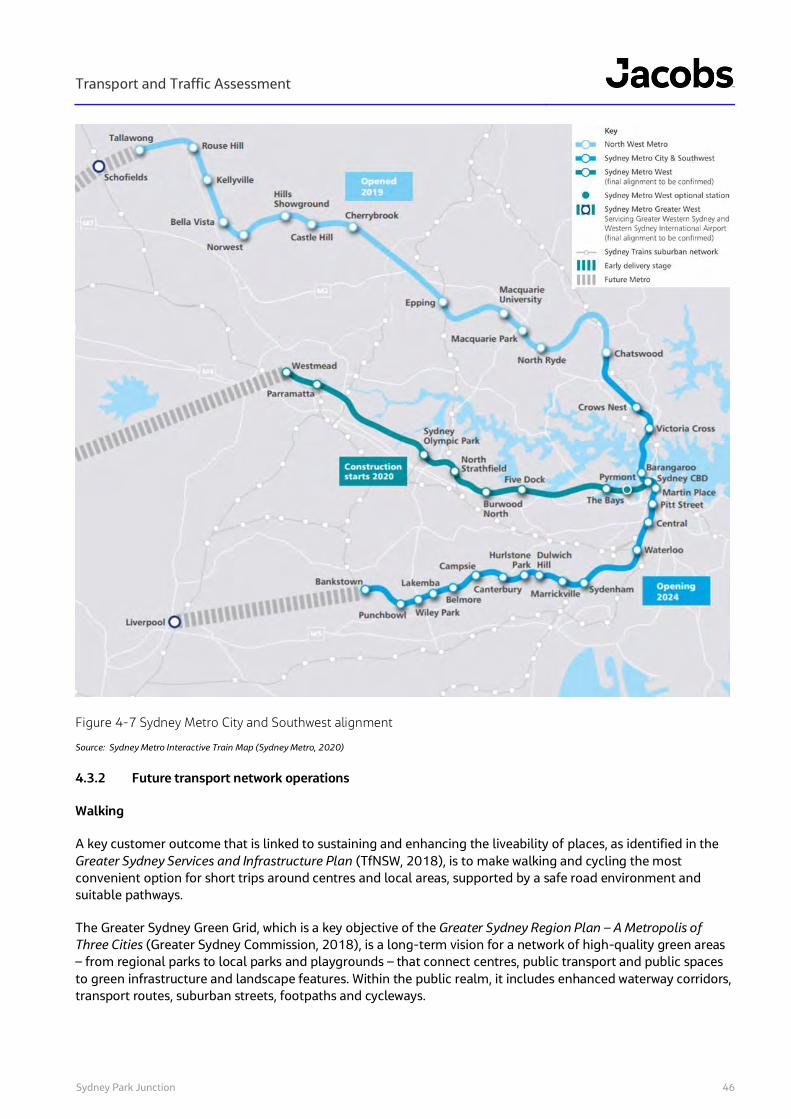
Transport and Traffic Assessment
Sydney Park Junction 46
Figure 4-7 Sydney Metro City and Southwest alignment
Source: Sydney Metro Interactive Train Map (Sydney Metro, 2020)
4.3.2 Future transport network operations
Walking
A key customer outcome that is linked to sustaining and enhancing the liveability of places, as identified in the
Greater Sydney Services and Infrastructure Plan (TfNSW, 2018), is to make walking and cycling the most
convenient option for short trips around centres and local areas, supported by a safe road environment and
suitable pathways.
The Greater Sydney Green Grid, which is a key objective of the Greater Sydney Region Plan – A Metropolis of
Three Cities (Greater Sydney Commission, 2018), is a long-term vision for a network of high-quality green areas
– from regional parks to local parks and playgrounds – that connect centres, public transport and public spaces
to green infrastructure and landscape features. Within the public realm, it includes enhanced waterway corridors,
transport routes, suburban streets, footpaths and cycleways.

Transport and Traffic Assessment
Sydney Park Junction 47
The following routes in or near the proposal area are identified as part of the Greater Sydney Green Grid:
▪ Illawarra Rail Line: Wolli Creek to Redfern
▪ Alexandra Canal
▪ Bourke Street and George Street Active Transport Green Links.
The Walking Strategy and Action Plan (City of Sydney, 2015) outlines walking priorities to align with the
objectives of the Sustainable Sydney 2030 (City of Sydney, 2014) plan. The plan is focussed on four priorities
and 10 targets to provide greater priority, safety and amenity for pedestrians. The plan identifies Sydney Park
Road between Mitchell Road and King Street as part of the primary walking network. In addition, King Street is
identified as a main activity street with the following targets:
▪ Increase footpath capacity by 20 per cent on average on main activity streets through planned upgrades
▪ Improve walking amenity by 10 per cent on main activity streets through planned upgrades.
Cycling
The Greater Sydney Services and Infrastructure Plan describes an aspirational Principal Bicycle Network, which is
a network of major bicycle corridors across Greater Sydney. In addition to supporting longer distance cycling
journeys, individual components have an important role in supporting shorter distance city-serving and centre-
serving journeys. The Principal Bicycle Network will be important in improving cycling access within 10
kilometres of metropolitan centres including the Harbour CBD. This is a key component of achieving Customer
Outcome 3 of the Greater Sydney Services and Infrastructure Plan – walking or cycling is the most convenient
option for short trips around centres and local areas, supported by a safe road environment and suitable
pathways.
The Cycling Strategy and Action Plan 2018-2030 (City of Sydney, 2018) outlines priorities to achieve the City of
Sydney’s Sustainable Sydney 2030 target of 10 per cent cycling mode share. Priority 1 - ‘Connecting the
network’ is described as follows: We are building a safe bike network connecting people and destinations, suitable
for all ages and abilities, within 250 metres of all residents. It will serve workers, students, residents and visitors
travelling in, to or through the city.
As part of priority 1, the plan outlines planned cycling routes within the City of Sydney local government area to
serve regional and local journeys. Planned regional and local cycling routes near the proposal are shown in
Figure 4-8 and include:
▪ Regional route along Sydney Park Road between Mitchell Road and King Street, connecting to planned
regional routes along Mitchell Road and Huntley Street and the existing regional route along Belmont
Street
▪ Local route along Sydney Park Road between Euston Road / Huntley Street and Mitchell Road, connecting
to planned local routes along Euston Road and Huntley Street.

Transport and Traffic Assessment
Sydney Park Junction 48
Figure 4-8 Planned regional, local and recreational cycling routes near the proposal
Source: Cycling Strategy and Action Plan 2018-2030 (City of Sydney, 2018)
Public transport
The Greater Sydney Services and Infrastructure Plan describes aspirational future city-shaping and city-serving
public transport networks in 2056 (shown in Figure 4-9). The city-shaping network includes higher-speed and
volume links between the three cities and other centres. The function of this network is to enable people living in
any of the three cities to access their nearest metropolitan centre within 30 minutes and to be able to travel
efficiently between these metropolitan centres.
Existing 30-minute public transport accessibility near the proposal is mainly facilitated by Sydney Trains services
and bus services that travel within and near the proposal area. Mode shift towards public transport is likely to
occur as 30-minute public transport accessibility improves in line with city-serving and city-shaping corridors
gradually becoming operational over the next 40 years. As discussed in Section 4.3.1, the proposal is also in
proximity to Sydney Metro City and Southwest which includes new metro stations at Waterloo and Sydenham.
The metro is anticipated to facilitate significant mode shift near the proposal from general traffic to rail (and
supporting bus services).
The city-serving network provides on-demand or high-frequency services to customers within 10 kilometres of
metropolitan centres. These typically higher-density areas accommodate residential areas, jobs, services and
social facilities. Providing a dense network of transport services within these areas is important for servicing
these areas and providing access to nearby metropolitan centres. The city-serving network enables greater
density within this area by maintaining convenient and reliable connectivity. The proposal is located near the
following city-shaping and city-serving corridors:
▪ Harbour CBD to Sydney Airport
▪ Harbour CBD to Sutherland
▪ Harbour CBD to Liverpool.

Transport and Traffic Assessment
Sydney Park Junction 49
Figure 4-9 Greater Sydney city-serving transport network vision
Source: Greater Sydney Services and Infrastructure Plan (TfNSW, 2018)

Transport and Traffic Assessment
Sydney Park Junction 50
General traffic and freight
The function of key roads in the proposal area would be impacted significantly by nearby land use changes and
transport projects. As discussed in Section 4.3.1, the opening of the M8 Motorway, St Peters interchange, related
surface road connections and related surface road upgrades are expected to alter traffic patterns in the proposal
area, with Euston Road and Campbell Street / Campbell Road replacing Sydney Park Road, King Street (south of
Lord Street) and Princes Highway (north of Campbell Street) as part of the major east-west route linking St
Peters and Moore Park via Alexandria and Waterloo. In addition, the Alexandria to Moore Park Connectivity
Upgrade is expected to increase traffic capacity along the Alexandria to Moore Park corridor to accommodate
increased traffic volumes travelling to and from the M8 Motorway. Land use developments including the
Ashmore Precinct are expected to increase the demand for travel for all customer groups. However, Sydney
Metro City and Southwest is expected to facilitate significant mode shift away from general traffic to rail (and
supporting bus services).
Euston Road is anticipated to have a significantly increased movement function for general traffic and freight as
the road facilitates north-south connectivity between the St Peters interchange and the Alexandria to Moore
Park corridor. Euston Road also provides connectivity for freight movements between industrial areas at St
Peters, Alexandria and Beaconsfield and the wider motorway network. Campbell Street / Campbell Road are also
expected to have a significantly increased movement function for general traffic and freight by providing access
between the wider motorway and arterial road networks. The extension of Campbell Road over the Alexandra
Canal provides an additional east-west connection between Alexandria and the St Peters interchange.
In contrast, Sydney Park Road, King Street (south of Lord Street) and Princes Highway (north of Campbell Street)
are expected to have a decreased movement function for general traffic and freight. These roads would primarily
facilitate local access to residential areas in Newtown, Erskineville and St Peters, as well as access to the
Newtown activity precinct. These roads would also carry less long-distance freight movements and service last-
mile light freight movements to the Newtown activity precinct.
King Street is anticipated to retain its existing high movement function for general traffic, bus and active
transport customers.
Traffic volumes and patterns
King Street (south of Lord Street) and Princes Highway (north of Campbell Street) is forecast to carry lower
volumes of traffic in 2023 with a further decrease between 2023 and 2033. In 2033, during the weekday
morning peak hour, the peak direction on these roads is expected to be northbound with volumes of up to 1770
vehicles per hour near the proposal. During the weekday evening peak hour, volumes are expected to be
approximately 1000 vehicles per hour in each direction.
Sydney Park Road is also forecast to carry lower volumes of traffic in 2023 with a similar volumes in 2023 and
2033. In 2033, Sydney Park Road is forecast to carry between 380 and 1250 vehicles in each direction during
the weekday morning peak hour with a distinct eastbound peak direction due to traffic travelling to and from
industrial and employment areas located to the east. During the weekday evening peak hour, volumes are
expected to be approximately 800 vehicles per hour in each direction.
King Street (north of the St Peters railway bridge) is forecast to carry approximately the same amount of traffic in
2023 with a decrease between 2023 and 2033. In 2033, King Street is expected to carry 370 to 750 vehicles in
each direction during the weekday morning and evening peak hours. The peak direction is forecast to be
northbound during the weekday morning and evening peak hours.
Mitchell Road is forecast to carry approximately the same amount of traffic in 2023 and 2033. In 2033, Mitchell
Road is expected to carry between 270 and 820 vehicles in each direction with a northbound peak direction
during the weekday morning and evening peak hours.

Transport and Traffic Assessment
Sydney Park Junction 51
Campbell Street / Campbell Road is anticipated to carry a significantly higher amount of traffic in 2023 and
2033 due to motorway connections at St Peters interchange. In 2033, Campbell Street / Campbell Road is
expected to carry between 910 to 1510 vehicles in each direction during the weekday morning and evening
peak hours and exhibits an eastbound peak direction during the weekday morning peak hour.
As with Campbell Street / Campbell Road, Euston Road is anticipated to carry a significantly higher amount of
traffic in 2023 and 2033 due to motorway connections at St Peters interchange. In 2033, Euston Road is
expected to carry between 740 and 1890 vehicles in each direction during the weekday morning and evening
peak hours and exhibits a northbound peak direction during the weekday morning peak hour and a southbound
peak direction during the weekday evening peak hour.
Approximate peak hour midblock volumes on key roads are shown in Figure 4-10. The overall change in traffic
volumes without the proposal between 2019, 2023 and 2033 is summarised in Table 4-2.
Figure 4-10 Peak hour traffic volumes by direction without proposal (2023 and 2033)

Transport and Traffic Assessment
Sydney Park Junction 52
Table 4-2 Traffic volume changes without the proposal between 2019, 2023 and 2033
Road Direction
2019 – 2023 2019 – 2033
AM peak change PM peak change AM peak change PM peak change
Veh/hour % Veh/hour % Veh/hour % Veh/hour %
King Street, north of
Sydney Park Road
Northbound 290 41% -10 -1% 5 1% -245 -25%
Southbound -135 -19% -140 -16% -325 -47% -165 -20%
Princes Highway, between
Sydney Park Road and
May Street
Northbound -90 -5% -320 -24% -405 -22% -280 -22%
Southbound -350 -50% -1085 -52% -440 -63% -1105 -53%
Princes Highway, between
May Street and Campbell
Street
Northbound 190 12% -150 -14% -155 -10% -55 -5%
Southbound -195 -36% -570 -37% -300 -55% -580 -38%
Sydney Park Road,
between Euston Road and
Mitchell Road
Eastbound -175 -15% -210 -36% -360 -31% -325 -55%
Westbound -120 -20% -470 -29% -80 -14% -875 -53%
Sydney Park Road,
between Mitchell Road
and King Street / Princes
Highway
Eastbound -360 -21% -285 -28% -485 -28% -225 -22%
Westbound -200 -35% -925 -47% -195 -33% -1135 -58%
Mitchell Road, north of
Sydney Park Road
Northbound -130 -18% 180 26% -70 -9% 110 15%
Southbound 30 13% 115 19% 35 15% 140 23%
Euston Road, between
Huntley Street / Sydney
Park Road and Campbell
Road
Northbound 1805 - 935 - 1315 - 785 -
Southbound 590 >100% 1635 >100% 600 >100% 1795 >100%
Campbell Street /
Campbell Road, between
Euston Road and Princes
Highway
Eastbound 1340 >100% 1080 >100% 790 >100% 1160 >100%
Westbound 925 >100% 775 >100% 500 >100% 775 >100%
Intersection performance
Modelled performance of key intersections in the modelling study area without the proposal during the weekday
morning and evening peak hours in 2023 and 2033 is shown in Table 4-3.
Modelled intersection performance indicates that the following intersections would perform at LOS F:
▪ King Street / Sydney Park Road in 2033 during the weekday morning peak hour. This is due to high
volumes of conflicting traffic from the northbound and westbound approaches
▪ Princes Highway / May Street in 2033 during the weekday morning peak hour. This is due to northbound
congestion downstream at the King Street / Sydney Park Road intersection where there are high volumes of
through traffic conflicting with right-turning and cross-street traffic
▪ Princes Highway / Campbell Street in 2023 during the weekday morning peak hour and in 2033 during the
weekday morning and evening peak hours. This is due to high volumes of conflicting traffic, particularly
from the northbound, eastbound and westbound approaches
▪ Euston Road / Huntley Street / Sydney Park Road in 2023 and 2033 during the weekday morning and
evening peak hours. This is due to high volumes of conflicting traffic, particularly from the northbound,
eastbound and westbound approaches

Transport and Traffic Assessment
Sydney Park Junction 53
▪ Mitchell Road / Sydney Park Road in 2023 during the weekday morning peak hour and in 2033 during the
weekday morning and evening peak hours. This is due to high volumes of east-west traffic on Sydney Park
Road
▪ Euston Road / Campbell Road in 2033 during the weekday morning and evening peak hours. This is due to
high volumes of conflicting traffic, particularly from the northbound, eastbound and westbound
approaches.
Table 4-3 Modelled peak hour intersection performance without proposal (2023 and 2033)
Intersection
and peak
hour
2023 without proposal 2033 without proposal
Intersection
throughput
(veh / hr)
Average
delay
(sec /
veh)
Level
of
Service
Maximum
queue
length by
directional
approach
(m)
Intersection
throughput
(veh / hr)
Average
delay
(sec /
veh)
Level
of
Service
Maximum
queue
length by
directional
approach
(m)
King Street / Sydney Park Road
Morning 2720 36 C
NB 176
2220 103 F
NB 183
EB - EB -
SB 57 SB 61
WB 274 WB 189
Evening 2730 33 C
NB 98
2535 52 D
NB 182
EB - EB -
SB 57 SB 60
WB 148 WB 112
Princes Highway / May Street
Morning 2285 28 B
NB 363
1845 174 F
NB 467
EB 63 EB 129
SB 44 SB 36
WB - WB -
Evening 2175 21 B
NB 117
2220 34 C
NB 438
EB 44 EB 60
SB 36 SB 37
WB - WB -
Princes Highway / Campbell Street
Morning 5010 119 F
NB 489
3690 245 F
NB 493
EB 359 EB 361
SB 182 SB 116
WB 312 WB 510
Evening 4675 45 D
NB 136
4650 75 F
NB 223
EB 260 EB 363
SB 106 SB 140
WB 131 WB 184

Transport and Traffic Assessment
Sydney Park Junction 54
Intersection
and peak
hour
2023 without proposal 2033 without proposal
Intersection
throughput
(veh / hr)
Average
delay
(sec /
veh)
Level
of
Service
Maximum
queue
length by
directional
approach
(m)
Intersection
throughput
(veh / hr)
Average
delay
(sec /
veh)
Level
of
Service
Maximum
queue
length by
directional
approach
(m)
Euston Road / Huntley Street / Sydney Park Road
Morning 3985 120 F
NB 510
3265 156 F
NB 472
EB 261 EB 234
SB 99 SB 101
WB 265 WB 268
Evening 3955 88 F
NB 418
3600 119 F
NB 423
EB 178 EB 260
SB 161 SB 200
WB 269 WB 269
Mitchell Road / Sydney Park Road
Morning 2035 91 F
NB < 5
1940 193 F
NB < 5
EB 486 EB 511
SB 113 SB 105
WB 259 WB 279
Evening 2600 57 E
NB < 5
2240 138 F
NB < 5
EB 232 EB 508
SB 149 SB 151
WB 271 WB 279
Euston Road / Campbell Road / M8 Motorway ramps
Morning 4490 60 E
NB 231
3695 190 F
NB 510
EB 457 EB 126
SB 70 SB 143
WB 153 WB 383
Evening 4290 42 C
NB 102
4795 169 F
NB 510
EB 93 EB 501
SB 129 SB 169
WB 103 WB 390

Transport and Traffic Assessment
Sydney Park Junction 55
5. Assessment of potential impacts
5.1 Construction
5.1.1 Key assumptions
Construction hours
Construction of the proposal would be undertaken during the following hours:
▪ Daytime activities: 7 am to 6 pm Monday to Friday, and 8 am to 1 pm on Saturday
▪ Nighttime activities: 8 pm to 5 am, subject to the granting of road occupancy licences by TfNSW’s Transport
Management Centre.
Construction zones and staging
Construction of the proposal would be undertaken in two main zones:
▪ Zone A: Princes Highway / King Street – Sydney Park Road to Campbell Street
▪ Zone B: Sydney Park Road – Euston Road to King Street.
Construction of the proposal has been staged to allow the existing road corridor to remain open to traffic, cyclist
and pedestrian movements during construction. Construction of the proposal would be undertaken in three
stages:
▪ Stage 0: Preparation works for future stages including the removal of median slabs, installation of
temporary pavement and drainage adjustments. Major components including installation of drainage would
also be constructed in Stage 0 in some areas
▪ Stages 1 and 2: Permanent works would include installation of drainage, construction of kerbs and
pavements and landscape works.
Traffic arrangements on Princes Highway and Sydney Park Road would be altered to facilitate construction works
and are described in Table 5-1. A 40 kilometres per hour roadwork speed limit would be introduced on the
approaches to and through the construction zones.
Table 5-1 Traffic arrangements during construction
Stage Time of day Zone Traffic arrangements
0 Night Zones A
and B
Traffic conditions in accordance with road occupancy licence requirements. No daytime changes
to traffic are proposed.
1 Day
Zone A
▪ Two northbound lanes and two southbound lanes would be in operation on Princes Highway /
King Street between Sydney Park Road and Barwon Park Road
▪ The northbound approach to the King Street / Sydney Park Road intersection would have one
through lane and one shared through and right turn lane. The northbound departure from the
intersection would have two through lanes. The southbound approach to the intersection
would have one through lane and one shared through and left turn lane. The southbound
departure from the intersection would have two through lanes
▪ Two northbound lanes and one southbound lane would be in operation on Princes Highway
between Barwon Park Road and Campbell Street.
Zone B One eastbound lane and one westbound lane would be in operation on Sydney Park Road
between Euston Road and King Street.

Transport and Traffic Assessment
56
Stage Time of day Zone Traffic arrangements
2 Day
Zone A Two northbound lanes and two southbound lanes would be in operation on Princes Highway /
King Street between Sydney Park Road and Campbell Street.
Zone B One eastbound lane and one westbound lane would be in operation on Sydney Park Road
between Euston Road and King Street.
Construction program
Construction of the proposal is anticipated to commence in mid-2021 for a duration of 24 months.
Construction compound locations and access
Site compounds and ancillary facilities will be located at Burrows Road and Venice Street, Mascot on TfNSW-
owned land. Additional compound and stockpile sites may be required for equipment laydown, stockpiling and
staff parking. The location of these sites would be confirmed prior to construction and the final number of
vehicles accessing the ancillary facility would be determined by the construction contractor.
Construction vehicles would generally access the construction sites via the M8 Motorway, Euston Road and
Campbell Street / Campbell Road as shown in Figure 5-1. It is anticipated that construction traffic movements in
each of the two construction zones would adopt a “left-in, left-out” access arrangement.
Figure 5-1 Construction vehicle routes
Sydney Park Junction
Transport and Traffic Assessment
Sydney Park Junction 57
Construction vehicles and parking
The average daily number of vehicles required to construct the proposal, including personnel and transport of
materials and equipment, would be approximately 30 light vehicles and 10 heavy vehicles, which equates to 60
light vehicle movements and 20 heavy vehicle movements (one vehicle = two movements). The peak number of
vehicles would be approximately 60 light vehicles and 20 heavy vehicles, which equates to 120 light vehicle
movements and 40 heavy vehicle movements. The final number of vehicles would be determined by the
construction contractor.
Construction car parking would be provided at the ancillary facility sites. It is not expected that surplus parking
demand from construction activities would reduce the availability of surrounding public parking.
5.1.2 Impacts on active transport customers
Pedestrians and cyclists may be diverted slightly around construction works in Zone A and Zone B. However,
impacts to pedestrian and cyclists are expected to be minor as access will be maintained and footpaths and
shared user paths on Sydney Park Road would remain operational during construction of the proposal.
5.1.3 Impacts on public transport customers
Princes Highway and Sydney Park Road are currently used by buses and form part of the proposed construction
vehicle routes. Existing bus stops would remain operational during construction of the proposal. Bus operators,
TfNSW, the City of Sydney and Inner West Council (as relevant) would be consulted, and the community would
be informed of, any temporary changes to bus stop operation. Minimal impacts to buses are expected and would
be limited to a potential minor increase in travel time due to additional construction vehicles on the road
network and reduction in the number of lanes available to traffic.
Pedestrian accessibility to St Peters train station would not be impacted during construction of the proposal.
5.1.4 Impacts on general traffic and freight customers
The reduction in the number of lanes available to traffic during construction of the proposal would potentially
increase travel times on the road network. To minimise potential impacts to travel times, construction has been
staged to minimise operational and road alignment changes. Construction of the proposal would be
accompanied by traffic management measures including a variable message sign strategy to encourage through
and regional traffic to use Euston Road and Campbell Street / Campbell Road instead of Princes Highway and
Sydney Park Road.
The impact of construction vehicle movements on the road network would be minor given the number of
construction vehicle movements is relatively low and is within the range of daily variations in traffic volumes on
the road network when compared to background traffic.
5.1.5 Impacts on property and emergency vehicle access
Access to properties and businesses along the proposal would be minor as access would be maintained during
construction. Temporary property access would be provided to residences and businesses where required. The
management of property access would be considered by the construction contractor and detailed as part of the
final staging plan for the proposal.
Access for emergency services would be maintained with the contractor who would be required to carry out the
necessary consultation with the emergency services before any changed traffic conditions are implemented.

Transport and Traffic Assessment
Sydney Park Junction 58
5.1.6 Cumulative construction impacts
Cumulative construction impacts of other nearby developments or activities that are underway or likely to
commence during the proposal’s construction timeframe have been summarised qualitatively in Table 5-2.
Cumulative construction impacts are expected to be limited to additional construction vehicles on the road
network near the proposal, which would potentially increase travel times on the road network as well as minor
impacts to pedestrians and cyclists on Campbell Road and Campbell Street.
Table 5-2 Cumulative construction impacts
Project description Cumulative construction impacts
WestConnex M4-M5 Link
The M4-M5 Link Tunnels are currently being constructed as part of M4-
M5 Link project of WestConnex and will connect the New M4 at
Haberfield with the M8 Motorway at St Peters.
The M4-M5 Link Tunnels team started tunnelling from the Campbell
Road civil and tunnel site in May 2019 and work will continue in the St
Peters area heading towards Newtown during 2020. Construction of the
project is expected to be completed by 2023.
There is potential for the construction works period to overlap
with that of the proposal and as such cumulative construction
impacts would be possible.
Temporary cumulative construction impacts would include
increased construction traffic on Princes Highway and
Campbell Road near the Campbell Road civil and tunnel site.
Sydney Gateway
Transport for NSW and Sydney Airport Corporation Limited propose to
build new direct high capacity road connections linking the Sydney
motorway network at the St Peters interchange with Sydney Airport’s
domestic and international terminals and beyond.
It is anticipated that construction would start in late 2020 and take about
3.5 years to complete.
The proposed development is located approximately 570
metres south of the proposal. The construction period could
potentially overlap with that of the proposal and as such
cumulative construction impacts would be possible.
Temporary cumulative construction impacts would include
increased construction traffic on Princes Highway and near
construction sites to the south of the proposal.
Alexandria to Moore Park
Transport for NSW proposes to upgrade major intersections located along
the Euston Road, McEvoy Street, Lachlan Street and Dacey Avenue
corridor. Stage 1 of the Alexandria to Moore Park project involves the
upgrade of four intersections and the introduction of clearways between
the Euston Road/Maddox Street intersection in Alexandria and the Anzac
Parade/Alison Road/Dacey Avenue intersection in Moore Park.
Construction of Stage 1 is expected to commence in mid-2020 and would
take around 36 months to complete.
The proposed development is located approximately 260
metres north-east of the proposal.
There is potential for the construction works period for Stage
1 to overlap with that of the proposal and as such cumulative
construction impacts would be possible.
Temporary cumulative construction impacts would include
increased construction traffic on the road network near the
proposal, particularly near construction zones to the north-
east of the proposal.
Visy Dry Recyclables Facility
The State Significant Development application for the construction and
operation of a waste transfer and materials recovery facility at 112-120
Euston Road, Alexandria was approved in April 2020.
Stage 1 construction will take about three months to complete and was
scheduled to commence in the first half of 2020. Stage 2 construction is
anticipated to take about four months. A commencement time for the
Stage 2 construction is not yet determined.
The commencement time for Stage 2 construction is not yet
determined. There is potential for the construction works
period for Stage 2 to overlap with that of the proposal and as
such cumulative construction impacts would be possible.
Temporary cumulative construction impacts would include
increased construction traffic on the road network near the
proposal, including on Euston Road.
Ashmore Precinct
The Ashmore Precinct is located in Erskineville and next to Alexandria,
bounded by Ashmore Street, Mitchell Road, Coulson Street and the
Illawarra Railway line and would redevelop an industrial site into a
sustainable neighbourhood consisting of about 3,785 homes, a
commercial/retail centre, a central park (McPherson Park) and bike links.
The development is likely to be completed by 2025.
There is potential for some of the construction works to
overlap with that of the proposal and as such cumulative
construction impacts would be possible.
Temporary cumulative construction impacts would include
increased construction traffic on the road network near the
proposal, particularly near development sites to the north of
the proposal.

Transport and Traffic Assessment
Sydney Park Junction 59
Project description Cumulative construction impacts
St Peters Station Upgrade
Planning is currently underway to upgrade St Peters Station as part of the
Transport for NSW’s Transport Access Program.
The project is expected to be completed in 2023. No further details are
currently available regarding expected construction dates.
The proposed upgrade of St Peters Station would be carried
out immediately adjacent to the proposal. There is potential
for the construction works period to overlap with that of the
proposal and as such cumulative construction impacts would
be possible.
Temporary cumulative construction impacts would include
increased construction traffic on the road network near the
proposal.
5.2 Operation
5.2.1 Road safety
The proposal would include an increased number of formal crossing opportunities, footpath widening,
landscaping and segregated cycleways which would improve safety outcomes for pedestrians and cyclists. As
discussed in Section 1.1, additional formal crossing opportunities are proposed at the following locations:
▪ Signalised pedestrian crossing on Princes Highway at Short Street
▪ Signalised shared crossing on King Street between May Street and Goodsell Street
▪ Signalised pedestrian crossing on Princes Highway at Barwon Park Road
▪ Unsignalised pedestrian crossing on Sydney Park Road at the Sydney Park Cycle Centre.
The above crossings would improve safety by reducing the distance between formal crossing opportunities and
reducing the number of pedestrians and cyclists crossing King Street, Princes Highway and Sydney Park Road at
unsafe locations. Furthermore, additional signalised pedestrian crossings are proposed across the western leg of
the Mitchell Road / Sydney Park Road intersection and on the northern leg of the King Street / Sydney Park
Road intersection (replacing the unsignalised pedestrian crossing across the southbound left-turn slip lane),
which would also improve safety for pedestrians and cyclists.
Footpath widening and landscaping is proposed along the following sections:
▪ Western side of Princes Highway / King Street between Sydney Park Road and Barwon Park Road
▪ Western and eastern side of Princes Highway south of Barwon Park Road
▪ Both sides of Sydney Park Road.
Widened footpaths and landscaping would increase separation between pedestrians and traffic and discourage
pedestrians from crossing at unsafe locations. Similarly, a two-way on-road segregated cycleway is proposed on
the northern side of Sydney Park Road as well as on the western side of King Street between May Street and St
Peters square that would separate cyclists from traffic and discourage cyclists from crossing at unsafe locations.
The proposal would reduce traffic volumes and speed limits on King Street, Princes Highway and Sydney Park
Road (refer to Section 5.2.5). This would lead to a reduction in the likelihood of crashes on these roads. The
proposal would also reduce the volume of heavy vehicles on these roads, which would potentially reduce the
severity of crashes. Reduced likelihood and severity of crashes would lead to a reduction in FSI and casualty
crash rates.

Transport and Traffic Assessment
Sydney Park Junction 60
5.2.2 Impact to function and significance of key roads
The function of some roads would be impacted by the proposal. In combination with the opening of the full
WestConnex scheme, related surface road connections and upgrades, and the Alexandria to Moore Park
Connectivity Upgrade, the proposal would result in Euston Road and Campbell Street / Campbell Road replacing
Sydney Park Road, King Street (south of Lord Street) and Princes Highway (north of Campbell Street) as part of
the major east-west route linking St Peters and Moore Park via Alexandria and Waterloo.
Euston Road would have an increased movement function for general traffic and freight as the road facilitates
north-south connectivity between the St Peters interchange and the Alexandria to Moore Park corridor. Euston
Road also provides connectivity for freight movements between industrial areas at St Peters, Alexandria and
Beaconsfield and the wider motorway network. Campbell Street / Campbell Road would also have an increased
movement function for general traffic and freight by providing access between the wider motorway and arterial
road networks. The extension of Campbell Road over the Alexandra Canal provides an additional east-west
connection between Alexandria and the St Peters interchange.
In contrast, Sydney Park Road, King Street (south of Lord Street) and Princes Highway (north of Campbell Street)
would have a decreased movement function for general traffic and freight customers and increased movement
function for active transport customers. These roads would primarily facilitate local access to residential areas in
Newtown, Erskineville and St Peters, as well as access for pedestrians and cyclists to Sydney Park, St Peters train
station and the Newtown activity precinct. These roads would also carry less long-distance freight movements
and service last-mile light freight movements to the Newtown activity precinct.
King Street (north of Lord Street) would retain its existing high movement function for general traffic, bus and
active transport customers.
5.2.3 Impacts on active transport customers
Pedestrians
The increased number of formal crossing opportunities, footpath widening and landscaping as part of the
proposal would significantly improve pedestrian movement. The additional formal crossing opportunities at the
locations described in Section 1.1 would significantly improve connectivity by reducing the distance between
formal crossing opportunities to a maximum of approximately 200 metres on Princes Highway (between Short
Street and Barwon Park Road) and approximately 280 metres on Sydney Park Road (between Euston Road and
Mitchell Road). Furthermore, these additional formal crossing opportunities would allow direct connectivity and
shorten overall walking distances to destinations such as Sydney Park, St Peters train station, bus stops on
Princes Highway and Sydney Park Road, and retail and commercial land uses on Princes Highway near Short
Street. Pedestrian crossings on Princes Highway at Barwon Park Road and between Goodsell Street and May
Street would counter connectivity impacts resulting from the removal of traffic signals at the Princes Highway /
May Street intersection.
Footpath widening along Princes Highway and Sydney Park Road would improve walking accessibility and
reduce the impacts of pedestrian crowding and dwelling on pedestrian movement. Furthermore, landscaping,
bollards, dynamic community spaces and parklets would improve walking comfort by increasing separation
between pedestrians and traffic. This is particularly significant for Princes Highway as the existing footpath has
limited separation with the road, which carries high adjacent vehicle flows with a 60 kilometres per hour speed
limit.
The reduction in traffic lanes and traffic volumes, footpath widening and landscaping would also improve place
for pedestrians. Pedestrian dwelling opportunities are expected to improve due to a reduction in traffic lanes on
Princes Highway and Sydney Park Road, which would reduce adjacent vehicle flows and improve the pedestrian
environment. This would be further improved by footpath widening and landscaping, which would increase the
amount of dwelling space for pedestrians and improve safety by increasing separation between pedestrians and
traffic.

Transport and Traffic Assessment
61
Cyclists
As with pedestrians, the cyclist movement on Princes Highway and Sydney Park Road would improve
significantly as a result of the increased number of formal crossing opportunities and dedicated cycle paths. The
additional formal crossing opportunities at the locations described in Section 1.1 would improve cycling
connectivity across Princes Highway and Sydney Park Road, including the Sydney Park Cycle Centre on Sydney
Park Road. Furthermore, a permanent two-way on-road segregated cycleway on the northern side of Sydney
Park Road would improve cycling facilities by replacing the existing temporary pop-up cycleway and provide
connectivity to cycling facilities on Huntley Street and the wider regional cycle network. In addition, a new on-
road cycleway on the western side of King Street between May Street and St Peters square would also improve
the cycling environment and safety on Sydney Park Road by removing conflicts with pedestrians and further
delineating cyclists from traffic.
5.2.4 Impacts on public transport customers
Minimal impacts to buses are expected and would be limited to a potential minor increase in travel time due to
the reduction in the number of lanes available to traffic on Sydney Park Road and Princes Highway. It is
considered that any potential increase in bus travel times is relatively minor when considered in the context of
overall door-to-door travel times, where typical journeys are multi-modal (e.g. walking and bus; or walking, bus
and train).
Bus place performance is not expected to change as the proposal does not include changes to bus stop facilities.
However, safety and connectivity for bus customers accessing the relocated northbound and southbound bus
stops at Princes Highway at/opposite Short Street (ID 204436 and 204437) will be improved due to the new
signalised pedestrian crossing on Princes Highway at Short Street.
Accessibility to St Peters train station would be improved with the proposal in operation with improved
pedestrian and cyclist connectivity as described in Section 5.2.3.
5.2.5 Impacts on general traffic and freight customers
Parking
Impacts to parking are summarised in Table 5-3. The proposal would increase on-street parking provision on
King Street between May Street and Goodsell Street. The proposal would also increase on-street parking
provision on Sydney Park Road and would also improve accessibility to the Sydney Park car park with the
allowance of right-turn movements from Sydney Park Road in the eastbound direction.
The proposal would reduce on-street kerbside parking (outside of clearway restrictions) on the western side of
Princes Highway primarily near Barwon Park Road due to the upgrade of the Barwon Park Road / Princes
Highway intersection. The proposal would also reduce on-street kerbside parking (outside of clearway
restrictions) on the eastern side of Princes Highway primarily near Short Street due to the upgrade of the Short
Street / Princes Highway intersection and the relocation of the bus stops in this location.
The proposal would also include the provision of an additional four on-street kerbside parking spaces on May
Street and an additional three off-street parking spaces at the Sydney Park brickworks site. One on-street
kerbside parking space would be removed on Goodsell Street to allow for kerb modifications.
Sydney Park Junction

Transport and Traffic Assessment
Sydney Park Junction 62
Table 5-3 Existing parking and parking with the proposal
Road
No. of car park spaces without the
proposal (total length of parking
provision)
No. of car park spaces with the
proposal (total length of parking
provision)
Sydney Park Road 38 (252m) 30 (189m)
May Street 4 (27m) 13 (82m)
King Street between May Street and
Goodsell Street 6 (40m) 0
Princes Highway between Campbell Street
and May Street (western side) 38 (241m) 31 (197m)
Princes Highway between Campbell Street
and May Street (eastern side) 33 (210m) 30 (192m)
Total 119 (770m) 104 (660m)
Traffic volumes and patterns
King Street (south of Lord Street) and Princes Highway (north of Campbell Street) would carry up to 55 per cent
fewer vehicles in 2023 and up to 66 per cent fewer vehicles in 2033 with the proposal when compared to the
scenario without the proposal. In 2033 with the proposal, during the weekday morning peak hour, the peak
direction on these roads would be northbound with volumes of up to 940 vehicles per hour in each direction.
During the weekday evening peak hour, volumes would be approximately 720 vehicles per hour in each
direction.
Sydney Park Road would carry up to 71 per cent fewer vehicles in 2023 and up to 65 per cent fewer vehicles in
2033 with the proposal when compared to the scenario without the proposal. In 2033 with the proposal, Sydney
Park Road would carry between 250 and 670 vehicles in each direction during the weekday morning and evening
peak hours.
King Street (north of the St Peters railway bridge) would carry up to 47 per cent fewer vehicles in 2023 and up to
46 per cent fewer vehicles in 2033 with the proposal when compared to the scenario without the proposal. In
2033 with the proposal, King Street would carry 200 to 770 vehicles in each direction during the weekday
morning and evening peak hours. The peak direction would be northbound during the weekday morning peak
hour.
Mitchell Road would carry up to 57 per cent fewer vehicles in 2023 and up to 54 per cent fewer vehicles in 2033
with the proposal when compared to the scenario without the proposal. In 2033, Mitchell Road would carry
between 160 and 570 vehicles in each direction with a northbound peak direction during the weekday morning
and evening peak hours.
Campbell Street / Campbell Road would carry up to 11 per cent less vehicles in 2023 and up to 26 per cent
more vehicles in 2033 with the proposal when compared to the scenario without the proposal. In 2033,
Campbell Street / Campbell Road would carry between 1150 and 1680 vehicles in each direction during the
weekday morning and evening peak hours and would exhibit an eastbound peak direction during the weekday
morning peak hour and a westbound peak direction during the weekday evening peak hour.
Euston Road would carry up to 15 per cent more vehicles in 2023 and up to 16 per cent more vehicles in 2033
with the proposal when compared to the scenario without the proposal. In 2033, Euston Road would carry
between 830 and 2040 vehicles in each direction during the weekday morning and evening peak hours and
would exhibit a northbound peak direction during the weekday morning peak hour and a southbound peak
direction during the weekday evening peak hour.

Transport and Traffic Assessment
Sydney Park Junction 63
Overall, traffic volume changes confirm the proposal would reinforce the replacement of Sydney Park Road, King
Street (south of Lord Street) and Princes Highway (north of Campbell Street) with Euston Road and Campbell
Street / Campbell Road as part of the major east-west route linking St Peters and Moore Park via Alexandria and
Waterloo. The reductions in traffic volumes on Sydney Park Road, King Street (south of Lord Street), Princes
Highway (north of Campbell Street) and Mitchell Road also confirm these roads would serve mostly local traffic
with origins or destinations in Newtown, Erskineville or Alexandria. Furthermore, the altered traffic patterns and
volumes do not account for the change in traffic flow which is likely to take place with the opening of the
WestConnex M4-M5 Link in late 2023. Therefore, it is considered that the traffic volumes present a worst-case
scenario.
Approximate peak hour midblock volumes on key roads with and without the proposal are shown in
Figure 5-2 (2023) and Figure 5-3 (2033). The overall change in traffic volumes with the proposal between 2019,
2023 and 2033 is summarised in Table 5-4.
Figure 5-2 Peak hour traffic volumes by direction with and without the proposal (2023)

Transport and Traffic Assessment
Sydney Park Junction 64
Figure 5-3 Peak hour traffic volumes by direction with and without the proposal (2033)

Transport and Traffic Assessment
Sydney Park Junction 65
Table 5-4 Traffic volume changes with the proposal between 2019, 2023 and 2033
Road Direction
2019 – 2023 2019 – 2033
AM peak change PM peak change AM peak change PM peak change
Veh/hour % Veh/hour % Veh/hour % Veh/hour %
King Street, north of
Sydney Park Road
Northbound 150 21% -475 -48% 60 8% -400 -40%
Southbound -185 -26% -210 -25% -500 -71% -265 -31%
Princes Highway, between
Sydney Park Road and
May Street
Northbound -700 -38% -835 -64% -1335 -72% -955 -73%
Southbound -450 -65% -1545 -74% -600 -87% -1625 -78%
Princes Highway, between
May Street and Campbell
Street
Northbound -370 -25% -670 -61% -580 -38% -370 -34%
Southbound -295 -54% -990 -64% -455 -83% -1070 -69%
Sydney Park Road,
between Euston Road and
Mitchell Road
Eastbound -375 -32% -80 -13% -765 -66% 80 13%
Westbound 140 23% -1085 -66% -110 -18% -1100 -67%
Sydney Park Road,
between Mitchell Road
and King Street / Princes
Highway
Eastbound -795 -46% -715 -70% -1070 -62% -435 -42%
Westbound -255 -44% -1660 -85% -325 -56% -1675 -85%
Mitchell Road, north of
Sydney Park Road
Northbound 10 2% -330 -46% -160 -22% -220 -31%
Southbound -30 -13% -230 -37% -80 -33% -265 -43%
Euston Road, between
Huntley Street / Sydney
Park Road and Campbell
Road
Northbound 2020 - 745 - 1525 - 850 -
Southbound 700 >100% 1380 >100% 685 >100% 1945 >100%
Campbell Street /
Campbell Road, between
Euston Road and Princes
Highway
Eastbound 1140 >100% 965 >100% 1135 >100% 1150 >100%
Westbound 825 >100% 750 >100% 735 >100% 975 >100%
Intersection performance
Modelled performance of key intersections in the modelling study area with and without the proposal during the
weekday morning and evening peak hours is shown in Table 5-5 (2023) and Table 5-6 (2033).
Modelled intersection performance indicates that the following intersections would perform at a worse Level of
Service when compared to the scenario without the proposal:
▪ King Street / Sydney Park Road in 2023 during the weekday morning and evening peak hours. This is due to
high volumes of conflicting traffic from the northbound and westbound approaches
▪ Princes Highway / May Street in 2023 during the weekday morning and evening peak hours. This is due to
northbound congestion downstream at the King Street / Sydney Park Road intersection where there are
high volumes of through traffic conflicting with right-turning and cross-street traffic
▪ Princes Highway / Campbell Street in 2023 during the weekday evening peak hour. This is due to high
volumes of conflicting traffic, particularly from the northbound, eastbound and westbound approaches
▪ Mitchell Road / Sydney Park Road in 2023 during the weekday evening peak hour. This is due to high
volumes of east-west traffic on Sydney Park Road
▪ Euston Road / Campbell Road in 2023 during the weekday evening peak hour. This is due to high volumes
of conflicting traffic, particularly from the northbound, southbound and westbound approaches.

Transport and Traffic Assessment
Sydney Park Junction 66
All intersections would perform at the same Level of Service in 2033 when compared to the scenario without the
proposal. The average delay varies between being greater without the proposal and greater with the proposal
though generally it is similar across intersections.
Table 5-5 Modelled peak hour intersection performance with and without the proposal (2023)
Intersection
and peak
hour
2023 without proposal 2023 with proposal
Intersection
throughput
(veh / hr)
Average
delay
(sec /
veh)
Level
of
Service
Maximum
queue
length by
directional
approach
(m)
Intersection
throughput
(veh / hr)
Average
delay
(sec /
veh)
Level
of
Service
Maximum
queue
length by
directional
approach
(m)
King Street / Sydney Park Road
Morning 2720 36 C
NB 176
2045 80 F
NB 166
EB - EB -
SB 57 SB 61
WB 274 WB 499
Evening 2730 33 C
NB 98
1380 97 F
NB 166
EB - EB -
SB 57 SB 59
WB 148 WB 142
Princes Highway / May Street
Morning 2285 28 B
NB 363
1540 149 F
NB 488
EB 63 EB 344
SB 44 SB 34
WB - WB -
Evening 2175 21 B
NB 117
1100 110 F
NB 480
EB 44 EB 303
SB 36 SB 31
WB - WB -
Princes Highway / Campbell Street
Morning 5010 119 F
NB 489
4175 196 F
NB 493
EB 359 EB 361
SB 182 SB 85
WB 312 WB 481
Evening 4675 45 D
NB 136
3550 119 F
NB 480
EB 260 EB 354
SB 106 SB 142
WB 131 WB 306

Transport and Traffic Assessment
Sydney Park Junction 67
Intersection
and peak
hour
2023 without proposal 2023 with proposal
Intersection
throughput
(veh / hr)
Average
delay
(sec /
veh)
Level
of
Service
Maximum
queue
length by
directional
approach
(m)
Intersection
throughput
(veh / hr)
Average
delay
(sec /
veh)
Level
of
Service
Maximum
queue
length by
directional
approach
(m)
Euston Road / Huntley Street / Sydney Park Road
Morning 3985 120 F
NB 510
4000 88 F
NB 444
EB 261 EB 239
SB 99 SB 110
WB 265 WB 97
Evening 3955 88 F
NB 418
2875 146 F
NB 509
EB 178 EB 246
SB 161 SB 222
WB 269 WB 269
Mitchell Road / Sydney Park Road
Morning 2035 91 F
NB < 5
1865 85 F
NB < 5
EB 486 EB 509
SB 113 SB 77
WB 259 WB 271
Evening 2600 57 E
NB < 5
1190 205 F
NB < 5
EB 232 EB 512
SB 149 SB 158
WB 271 WB 251
Euston Road / Campbell Road / M8 Motorway ramps
Morning 4490 60 E
NB 231
4445 57 E
NB 249
EB 457 EB 131
SB 70 SB 71
WB 153 WB 127
Evening 4290 42 C
NB 102
3850 85 F
NB 332
EB 93 EB 79
SB 129 SB 112
WB 103 WB 134

Transport and Traffic Assessment
Sydney Park Junction 68
Table 5-6 Modelled peak hour intersection performance with and without the proposal (2033)
Intersection
and peak
hour
2033 without proposal 2033 with proposal
Intersection
throughput
(veh / hr)
Average
delay
(sec /
veh)
Level
of
Service
Maximum
queue
length by
directional
approach
(m)
Intersection
throughput
(veh / hr)
Average
delay
(sec /
veh)
Level
of
Service
Maximum
queue
length by
directional
approach
(m)
King Street / Sydney Park Road
Morning 2220 103 F
NB 183
1525 96 F
NB 168
EB - EB -
SB 61 SB 58
WB 189 WB 182
Evening 2535 52 D
NB 182
1660 46 D
NB 159
EB - EB -
SB 60 SB 58
WB 112 WB 104
Princes Highway / May Street
Morning 1845 174 F
NB 467
1255 226 F
NB 475
EB 129 EB 343
SB 36 SB 44
WB - WB -
Evening 2220 34 C
NB 438
1380 37 C
NB 394
EB 60 EB 38
SB 37 SB 31
WB - WB -
Princes Highway / Campbell Street
Morning 3690 245 F
NB 493
3670 213 F
NB 493
EB 101 EB 166
SB 116 SB 43
WB 510 WB 338
Evening 4650 75 F
NB 223
4090 168 F
NB 481
EB 363 EB 364
SB 140 SB 138
WB 184 WB 243
Euston Road / Huntley Street / Sydney Park Road
Morning 3265 156 F
NB 472
3165 177 F
NB 510
EB 234 EB 260
SB 101 SB 166
WB 268 WB 122

Transport and Traffic Assessment
Sydney Park Junction 69
Intersection
and peak
hour
2033 without proposal 2033 with proposal
Intersection
throughput
(veh / hr)
Average
delay
(sec /
veh)
Level
of
Service
Maximum
queue
length by
directional
approach
(m)
Intersection
throughput
(veh / hr)
Average
delay
(sec /
veh)
Level
of
Service
Maximum
queue
length by
directional
approach
(m)
Evening 3600 119 F
NB 423
3625 106 F
NB 181
EB 260 EB 184
SB 200 SB 242
WB 269 WB 269
Mitchell Road / Sydney Park Road
Morning 1940 193 F
NB < 5
1295 140 F
NB 0
EB 511 EB 505
SB 105 SB 128
WB 279 WB 292
Evening 2240 138 F
NB < 5
1450 114 F
NB 14
EB 508 EB 418
SB 151 SB 161
WB 279 WB 252
Euston Road / Campbell Road / M8 Motorway ramps
Morning 3695 190 F
NB 510
4050 156 F
NB 510
EB 126 EB 509
SB 143 SB 81
WB 383 WB 153
Evening 4795 169 F
NB 510
4805 142 F
NB 344
EB 501 EB 313
SB 169 SB 273
WB 390 WB 390
The decrease in intersection performance with the proposal in operation, as shown by decreases in Levels of
Service and increases in average delays, is to be expected when lane capacity is removed from an already
congested network. The following are potential impacts of removing lane capacity from traffic networks that are
already operating at or close to capacity (which is effectively the same as additional vehicles being introduced to
the network):
▪ Increased queuing and congestion
▪ Retiming of vehicle trips to either side of the peak to avoid congestion, resulting in ‘peak spreading’
▪ Rerouting of vehicle trips to other roads to avoid congestion
▪ Use of other modes such as active transport or public transport
▪ Other behavioural changes such as changing origin / destination or not undertaking the trip at all.

Transport and Traffic Assessment
Sydney Park Junction 70
In reality, a combination of all of the impacts would occur. Traffic modelling assumes that only increased
queuing and congestion would occur and does not account for the other potential impacts listed above.
Furthermore, the process for calculating demand for 2023 (linear interpolation between 2021 and 2031) does
not account for the step-change in traffic flow which is likely to take place with the opening of nearby transport
infrastructure projects, including WestConnex M4-M5 Link and Sydney Gateway, which are expected to open in
2022 and 2023 respectively. Therefore, it is considered that the traffic modelling presents a worst-case scenario.
It is considered the impacts of the decrease in intersection performance on general traffic and freight customers
are relatively minor and manageable when considered in the context of the positive impacts of the proposal on
the movement and place performance for active transport customers as described in Section 5.2.3.
Notwithstanding this, management measures have been proposed which would address the impacts of the
decrease in intersection performance on general traffic and freight customers. These are described in Section 6.
5.2.6 Impacts on movement and place
As per the Practitioner’s Guide to Movement and Place, the proposal is anticipated to significantly improve the
overall movement and place performance of the surrounding built environment as described in Table 5-7.
Table 5-7 Movement and place performance of the built environment with the proposal
Built
environment
theme
User outcomes Impact of proposal
Access and
Connection
▪ Mode choice
▪ Reliable transport
▪ Equity (of access)
▪ Encourage cycling due to the increased number of formal crossing opportunities
and dedicated cycle paths
▪ Encourage walking due to the increased number of formal crossing opportunities,
footpath widening and landscaping
▪ Encourage the shift to sustainable modes of travel
▪ Minimal impacts to bus travel due to the potential minor increase in travel time
Amenity and Use ▪ Convenient facilities
▪ Local opportunities
▪ Improved end-of-trip facilities on Sydney Park Road, King Street between May
Street and Goodsell Street, May Street and the Sydney Park car park along King
Street/Princes Highway due to increased parking provision
▪ Impacts to end-of-trip facilities on Goodsell Street and Princes Highway (outside
of clearway restrictions) due to reduced on-street kerbside parking
Green and Blue ▪ A link to nature ▪ Improved vegetation and tree canopy cover due to landscaping
Comfort and Safety ▪ Comfortable
environment
▪ Low risk
▪ Improved road user safety due to increased number of formal crossing
opportunities, footpath widening, dedicated cycleways and speed limit reductions
▪ Improved environmental quality due to increased vegetation cover, heavy vehicle
separation and reduced urban heat-island effect and vehicle noise and air
pollution
Character and Form ▪ Human-scaled
▪ Distinct features
▪ Improved access due to increased number of formal crossing opportunities
▪ Improved dwellable street space due to dynamic community spaces, footpath
widening and dedicated cycleways
5.2.7 Summary of impacts of the proposal during operation
The potential impacts of the proposal during operation have been identified as follows:
▪ Improved safety for pedestrians and cyclists due to an increased number of formal crossing opportunities,
separation between pedestrians, cyclists and traffic and reduction in traffic volumes and speed limits
▪ Improved pedestrian movement due to an increased number of formal crossing opportunities, footpath
widening and landscaping

Transport and Traffic Assessment
Sydney Park Junction 71
▪ Improved pedestrian place due to a reduction in traffic lanes and traffic volumes, footpath widening and
landscaping
▪ Improved cyclist movement due to an increased number of formal crossing opportunities and dedicated
cycle paths
▪ Minimal impacts to buses
▪ Reduced on-street kerbside parking on Sydney Park Road, King Street and Princes Highway. Increased on-
street kerbside parking, and inclusion of angled parking, on May Street.
▪ Relatively minor and manageable impacts on general traffic and freight customers when considered in the
context of the positive impacts of the proposal on the movement and place performance for active
transport customers
▪ As per the Practitioner’s Guide to Movement and Place, significantly improved overall movement and place
performance of the surrounding built environment. The proposal would generally improve all of the five
built environment themes and contribute to a well-designed built environment.
5.2.8 Cumulative operation impacts
As discussed in Section 4 and 5.1.6, several developments or activities are committed or currently being
constructed near the proposal. The cumulative operation impacts of these nearby developments or activities
have been summarised qualitatively in Table 5-8 and include:
▪ Altered traffic patterns in the proposal area, with Euston Road and Campbell Street / Campbell Road
replacing Sydney Park Road, King Street (south of Lord Street) and Princes Highway (north of Campbell
Street) as part of the major east-west route linking St Peters and Moore Park via Alexandria and Waterloo
▪ Improved traffic flow, road safety and trip reliability along the nearby Alexandria to Moore Park corridor
▪ Increased demand for travel across all customer modes in and near the proposal area.
Table 5-8 Cumulative operation impacts
Project description Cumulative operation impacts
WestConnex M4-M5 Link
The M4-M5 Link will consist of twin 7.5-kilometre mainline
motorway tunnels between the M4 East at Haberfield and the New
M5 at St Peters and sized to accommodate up to four lanes of
traffic in each direction. The tunnels will also include a new
interchange at Rozelle that would connect the M4-M5 Link tunnels
with City West Link, Anzac Bridge, Iron Cove Link and the proposed
future Western Harbour Tunnel and Beaches Link. Construction of
the project is expected to be completed by 2023.
Cumulative operation impacts are expected to include a decrease in
heavy vehicle traffic on the nearby road network, including on
Princes Highway, as well as reduced travel times across the wider
road network. Additional traffic volumes are expected on Euston
Road and Campbell Road / Campbell Street due to vehicles
travelling to and from the St Peters interchange.
Sydney Gateway
Sydney Gateway will provide direct high-capacity road connections
linking the Sydney motorway network at the St Peters interchange
with Sydney Airport and Port Botany. Stage 1 of Sydney Gateway
will comprise a new high-capacity four-lane road in each direction
connecting the St Peters interchange with Sydney Airport’s
International Terminal and Qantas Drive. Stage 3 will include a
high-capacity connection between Sydney Airport’s Domestic
Terminals and St Peters interchange. Construction is expected to
complete by 2023.
Cumulative operation impacts are expected to include a decrease in
heavy vehicle traffic on the nearby road network, including on
Princes Highway and Sydney Park Road, as well as reduced travel
times across the wider road network. Additional traffic volumes are
expected on Euston Road and Campbell Road / Campbell Street
due to vehicles travelling to and from the St Peters interchange.

Transport and Traffic Assessment
Sydney Park Junction 72
Project description Cumulative operation impacts
Alexandria to Moore Park
The Alexandria to Moore Park Connectivity Upgrade is located to
the north-east of the proposal and involves intersection, safety and
amenity improvements along the Alexandria to Moore Park corridor
(Euston Road, McEvoy Street, Lachlan Street, Dacey Avenue and
Alison Road). Construction of Stage 1 is expected to commence in
mid-2020 and would take around 36 months to complete.
Cumulative operation impacts are expected to include improved
traffic flow, road safety and trip reliability along Euston Road and
the nearby Alexandria to Moore Park road corridor.
Visy Dry Recyclables Facility
The State Significant Development application for the construction
and operation of a waste transfer and materials recovery facility at
112-120 Euston Road, Alexandria was approved in April 2020. The
facility would be fully enclosed within an existing industrial
building, will all unloading, sorting and processing to be undertaken
indoors. A completion date for construction is not yet determined.
Cumulative operation impacts are expected to include a small
increase in operational traffic on Euston Road.
Ashmore Precinct
The Ashmore Precinct is located in Erskineville and next to
Alexandria, bounded by Ashmore Street, Mitchell Road, Coulson
Street and the Illawarra Railway line and would redevelop an
industrial site into a sustainable neighbourhood consisting of about
3,785 homes, a commercial/retail centre, a central park
(McPherson Park) and bike links. The development is likely to be
completed by 2025.
Cumulative operation impacts are expected to include additional
demand for travel for all customer groups on roads in and near the
proposal area, particularly near developments to the north of the
proposal.
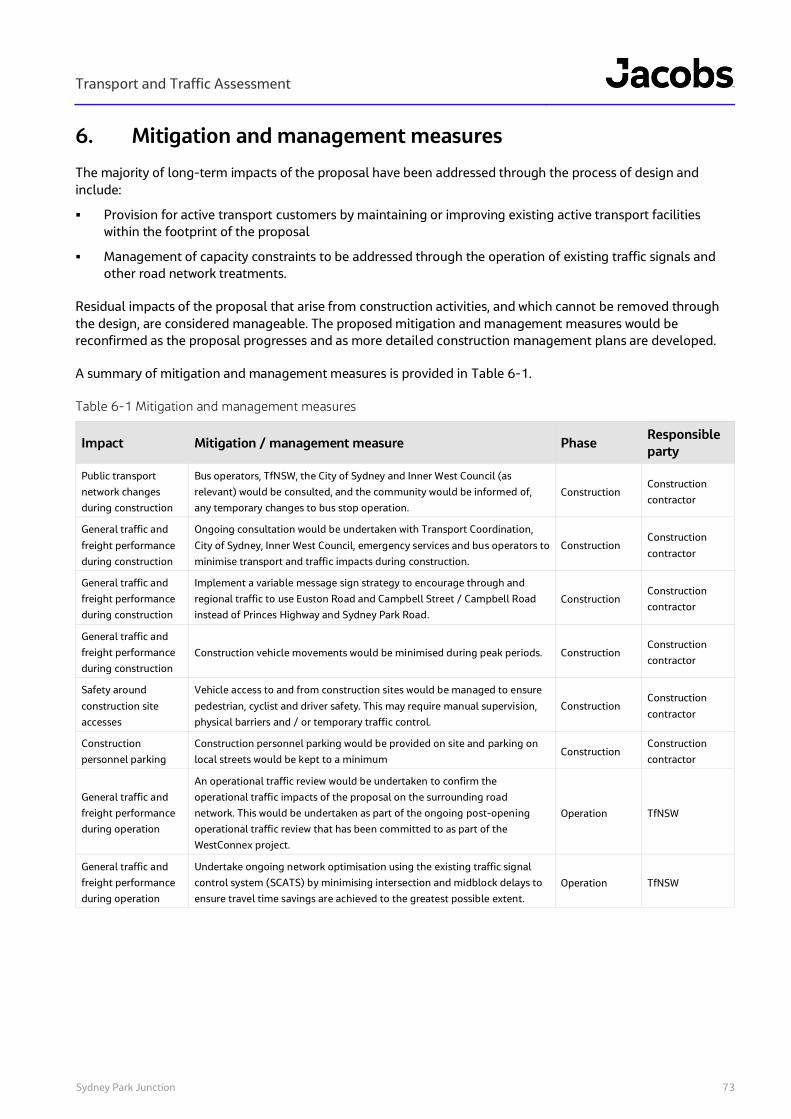
Transport and Traffic Assessment
Sydney Park Junction 73
6. Mitigation and management measures
The majority of long-term impacts of the proposal have been addressed through the process of design and
include:
▪ Provision for active transport customers by maintaining or improving existing active transport facilities
within the footprint of the proposal
▪ Management of capacity constraints to be addressed through the operation of existing traffic signals and
other road network treatments.
Residual impacts of the proposal that arise from construction activities, and which cannot be removed through
the design, are considered manageable. The proposed mitigation and management measures would be
reconfirmed as the proposal progresses and as more detailed construction management plans are developed.
A summary of mitigation and management measures is provided in Table 6-1.
Table 6-1 Mitigation and management measures
Impact Mitigation / management measure Phase Responsible
party
Public transport
network changes
during construction
Bus operators, TfNSW, the City of Sydney and Inner West Council (as
relevant) would be consulted, and the community would be informed of,
any temporary changes to bus stop operation.
Construction Construction
contractor
General traffic and
freight performance
during construction
Ongoing consultation would be undertaken with Transport Coordination,
City of Sydney, Inner West Council, emergency services and bus operators to
minimise transport and traffic impacts during construction.
Construction Construction
contractor
General traffic and
freight performance
during construction
Implement a variable message sign strategy to encourage through and
regional traffic to use Euston Road and Campbell Street / Campbell Road
instead of Princes Highway and Sydney Park Road.
Construction Construction
contractor
General traffic and
freight performance
during construction
Construction vehicle movements would be minimised during peak periods. Construction Construction
contractor
Safety around
construction site
accesses
Vehicle access to and from construction sites would be managed to ensure
pedestrian, cyclist and driver safety. This may require manual supervision,
physical barriers and / or temporary traffic control.
Construction Construction
contractor
Construction
personnel parking
Construction personnel parking would be provided on site and parking on
local streets would be kept to a minimum Construction
Construction
contractor
General traffic and
freight performance
during operation
An operational traffic review would be undertaken to confirm the
operational traffic impacts of the proposal on the surrounding road
network. This would be undertaken as part of the ongoing post-opening
operational traffic review that has been committed to as part of the
WestConnex project.
Operation TfNSW
General traffic and
freight performance
during operation
Undertake ongoing network optimisation using the existing traffic signal
control system (SCATS) by minimising intersection and midblock delays to
ensure travel time savings are achieved to the greatest possible extent.
Operation TfNSW


