appendix b. traffic information
TRANSCRIPT

Tier 1 Final Environmental Impact Statement and Record of Decision North-South Corridor Study
August 2021
Appendix B. Traffic Information

Tier 1 Final Environmental Impact Statement and Record of Decision North-South Corridor Study
August 2021
This page is intentionally left blank.

Traffic Report North-South Corridor Study
Federal-aid Project No. STP-999-A(365)X ADOT Project No. 999 PN 000 H7454 01L Pinal County, Arizona prepared by Arizona Department of Transportation Federal Highway Administration in cooperation with Arizona Game and Fish Department U.S. Army Corps of Engineers U.S. Bureau of Indian Affairs – San Carlos Irrigation Project U.S. Bureau of Land Management U.S. Environmental Protection Agency U.S. Fish and Wildlife Service Western Area Power Administration October 2018
A CCT e ....... U.S. Department al Transportation
~•Federal Highway e,i7 Administration

This page is intentionally left blank.

Traffic Report North-South Corridor Study
October 2018 | iii
Contents
1 Introduction .......................................................................................................................................... 1
1.1 Action Corridor Alternatives....................................................................................................... 1
1.2 Corridor Segments .................................................................................................................... 3
1.3 Project Need and Purpose ........................................................................................................ 5
1.4 Background ............................................................................................................................... 6
1.5 Traffic Report Objectives ......................................................................................................... 11
1.6 Traffic Report Organization ..................................................................................................... 12
2 Existing Conditions and Corridor Characteristics .............................................................................. 13
2.1 Overview of Transportation System ........................................................................................ 13
2.2 Existing Operational Performance on RSR Corridors ............................................................. 17
3 Future Conditions (2040) ................................................................................................................... 21
3.1 2040 Socioeconomic and Land Use Forecast ........................................................................ 21
3.2 Travel Demand Model ............................................................................................................. 22
3.3 Travel Demand Model Calibration, Validation, and Reasonableness ..................................... 25
3.4 Proposed Functional Characteristics of the North-South Corridor .......................................... 26
4 Alternatives Evaluation ...................................................................................................................... 28
4.1 Traffic Safety ........................................................................................................................... 29
4.2 2040 No-Action Alternative...................................................................................................... 34
4.3 EIS Action Alternative 1 with W1a option ................................................................................ 36
4.4 EIS Action Alternative 1 with W1b option ................................................................................ 40
4.5 EIS Action Alternative 2 with W1a and E3a options ............................................................... 44
4.6 EIS Action Alternative 2 with W1a and E3b options ............................................................... 48
4.7 EIS Action Alternative 7 with E1b and E3a options ................................................................ 52
4.8 EIS Action Alternative 7 with E1a and E3a options ................................................................ 56
4.9 EIS Action Alternative 8 with E1b option ................................................................................. 60
5 Performance Summary ..................................................................................................................... 64
Appendix A – Action Alternatives ................................................................................................................ 69

Traffic Report North-South Corridor Study
iv | October 2018
Tables
Table 1. North-South Corridor Segments ..................................................................................................... 4
Table 2. Traffic Volumes and Level of Service Summary for Key Corridors .............................................. 18
Table 3. Existing Study Area Traffic Performance ...................................................................................... 19
Table 4. Population and Employment in Pima, Pinal, and Maricopa Counties, 2015 - 2040 ..................... 21
Table 5. Study Area Population and Employment, 2010 – 2040 ................................................................ 22
Table 6. Modeled Evaluation Alternatives and Corridor Action Alternatives .............................................. 28
Table 7. 2040 No-Action RSR Segments Comparison ............................................................................... 34
Table 8. Study area-wide Performance Measurements ............................................................................. 34
Table 9. EIS Action Alternative 1 with the W1a option, 2040 RSR Segments Comparison ....................... 36
Table 10. EIS Action Alternative 1 with the W1a option, 2040 Study Area-wide and Corridor Performance ................................................................................................................................... 37
Table 11. EIS Action Alternative 1 with the W1b option, 2040 RSR Segments Comparison ..................... 40
Table 12. EIS Action Alternative 1 with the W1b option, 2040 Study Area-wide and Corridor Performance ................................................................................................................................... 41
Table 13. EIS Action Alternative 2 with W1a and E3a options, 2040 RSR Segments Comparison ........... 44
Table 14. EIS Action Alternative 2 with W1a and E3a options, 2040 Study Area-wide and Corridor Performance ................................................................................................................................... 45
Table 15. EIS Action Alternative 2 with W1a and E3b options 2040 Segments Comparison .................... 48
Table 16. EIS Action Alternative 2 with W1a and E3b options, 2040 Study Area-wide and Corridor Performance ................................................................................................................................... 49
Table 17. EIS Action Alternative 7 with E1b and E3a options, 2040 RSR Segments Comparison ............ 52
Table 18. EIS Action Alternative 7 with E1b and E3a options, 2040 Study Area-wide and Corridor Performance ................................................................................................................................... 53
Table 19. EIS Action Alternative 7 with E1a and E3a options 2040 RSR Segments Comparison ............. 56
Table 20. EIS Action Alternative 7 with E1a and E3a options, 2040 Study Area-wide and Corridor Performance ................................................................................................................................... 57
Table 21. EIS Action Alternative 8 with e1b, 2040 RSR Segments Comparison ....................................... 60
Table 22. EIS Action Alternative 8 with e1b, 2040 Study Area-wide and Corridor Performance ............... 61
Table 23. Total Area-wide Traffic Performance Summary .......................................................................... 65
Table 24. Total Area-Wide Miles of Congested Roads ............................................................................... 65
Table 25. Corridor Performance Comparison with Alternatives .................................................................. 66
Table 26. North-South Corridor Travel Time Comparison .......................................................................... 67

Traffic Report North-South Corridor Study
October 2018 | v
Figures
Figure 1. Study Area and Action Corridor Alternatives ................................................................................. 2
Figure 2. Eight full-length action corridor alternatives ................................................................................... 3
Figure 3. Passenger Rail Selected Corridor Alternative ............................................................................... 9
Figure 4. Planned Regionally Significant Routes in Pinal County .............................................................. 10
Figure 5. Existing Land Uses ...................................................................................................................... 13
Figure 6. Existing Lane Characteristics for Key Roadways ........................................................................ 15
Figure 7. 2015 Study Area-wide Performance ............................................................................................ 20
Figure 8. Population in the AZTDM2 Travel Demand Model, 2015 and 2040 ............................................ 23
Figure 9. Employment in the AZTDM2 Travel Demand Model, 2015 and 2040 ......................................... 24
Figure 10. North-South Modeled Alternatives A and D ............................................................................... 30
Figure 11. North-South Modeled Alternatives E and E2 ............................................................................. 31
Figure 12. North-South Modeled Alternatives B and C ............................................................................... 32
Figure 13. North-South Modeled Alternatives F.......................................................................................... 33
Figure 14. 2040 No-Action Study Area-wide Performance ......................................................................... 35
Figure 15. EIS Action Alternative 1 with W1a option, 2040 Daily Traffic Volume ....................................... 38
Figure 16. 2040 EIS Action Alternative 1 with W1a option, Study Area Performance................................ 39
Figure 17. EIS Action Alternative 1 with W1b option .................................................................................. 42
Figure 18. EIS Action Alternative 1 with W1b option, 2040 Study Area Performance ............................... 43
Figure 19. EIS Action Alternative 2 with W1a and E3a options, 2040 Daily Traffic Volumes ..................... 46
Figure 20. EIS Action Alternative 2 with W1a and E3a options , 2040 Study Area Performance .............. 47
Figure 21. EIS Action Alternative 2 with W1a and E3b options, 2040 Daily Traffic Volumes ..................... 50
Figure 22. EIS Action Alternative 2 with W1a and E3b options, Study Area Performance ........................ 51
Figure 23. EIS Action Alternative 7 with E1b and E3a options, 2040 Daily Traffic Volumes ...................... 54
Figure 24. EIS Action Alternative 7 with E1b and E3a options, 2040 Study Area Performance ................ 55
Figure 25. EIS Action Alternative 7 with E1a and E3a options, 2040 Daily Traffic Volumes ...................... 58
Figure 26. EIS Action Alternative 7 with E1a and E3a options, 2040 Study Area Performance ................ 59
Figure 27. EIS Action Alternative 8 with E1b option, 2040 Daily Traffic Volumes ...................................... 62
Figure 28. EIS Action Alternative 8 with E1b option, 2040 Study Area Performance ................................ 63

Traffic Report North-South Corridor Study
vi | October 2018
Acronyms
ADOT Arizona Department of Transportation
ASR Alternatives Selection Report
AZTDM2 Arizona Statewide Travel Demand Model
CAG Central Arizona Governments
CAP Central Arizona Project
Corridor North-South Corridor
DDI Diverging Diamond Interchange
DEIS Draft Environmental Impact Statement
DHV Design Hour Volume
FHWA Federal Highway Administration
HCM Highway Capacity Manual
HCS Highway Capacity Software
IPA Inland Port Arizona
L/DCR Location/Design Concept Report
LOS Level of Service
LPA Locally Preferred Alternative
MAG Maricopa Association of Governments
MUTCD Manual on Uniform Traffic Control Devices
PLH Pinal Land Holdings
PRS Passenger Rail Study
RDG Roadway Design Guidelines
RSRSM Regionally Significant Routes Plan for Safety and Mobility
SCMPO Sun Corridor Metropolitan Planning Organization
SR State Route
TI Traffic Interchange
TIA Traffic Impact Analysis
UPRR Union Pacific Railroad
US United States
VHT Vehicle Hours Traveled
VMT Vehicle Miles Traveled

Traffic Report North-South Corridor Study
October 2018 | 1
1 Introduction The Arizona Department of Transportation (ADOT), in partnership with the Federal Highway Administration (FHWA), is studying the 45-mile-long North-South Corridor (Corridor) in Pinal County, Arizona. The Corridor is bound by United States Highway 60 (US 60) in Apache Junction to the north and by Interstate 10 (I-10) near Eloy to the south. The corridor includes the cities of Apache Junction, Coolidge, and Eloy and the towns of Florence and Queen Creek. The Gila River Indian Community is within the study area and approximately one mile west of the nearest action corridor alternative.
The proposed action would provide a new north-to-south transportation facility that connects the growing communities in central Pinal County with US 60 and I-10 and would extend Arizona State Route (SR) 24, which currently connects with the Santan Freeway (SR 202L) to the west of the Corridor. The action corridor alternatives consist of an Eastern Alternative and a Western Alternative (with two possible transitions points from east-to-west and several options), which are evaluated in the Tier 1 Draft Environmental Impact Statement (DEIS) for the proposed action. Each action corridor alternative is approximately 1,500 feet wide. The action corridor alternatives are divided into four segments that allow shifts from the east to the west, or from the west to the east, with the addition of two transition areas. The study limits, segments, and transition areas are shown in Figure 1.
This Draft Traffic Report is in support of the Tier 1 DEIS, and will help to inform the public, agencies, and other stakeholders about the No-Action alternative and action alternative corridors being considered by ADOT and the potential effects from a traffic perspective on human, built, and environmental resources. The horizon year for when future conditions are evaluated and when a north-south transportation corridor would be operational is 2040.
1.1 Action Corridor Alternatives The Eastern Alternative begins east of Goldfield Road in Apache Junction, following a southerly alignment concurrent with the planned US 60 bypass for approximately 1.5 miles before continuing in a new alignment in mostly undeveloped, unincorporated Pinal County. Two options exist for a connection with the SR 24 extension—one just north of the Germann Road alignment (not currently constructed) and one at the Ocotillo Road alignment (also not currently constructed). South of the SR 24 connection, the Eastern Alternative crosses the Magma Arizona Railroad tracks and the Central Arizona Project (CAP) Canal and continues south and east to Florence. Two alignment options allow the Eastern Alternative to avoid the Poston Butte in western Florence; however, both options cross the Copper Basin Railroad tracks and the Gila River. The options converge just north of SR 287, and the alignment continues south and west to the Picacho Reservoir, where it then follows the Fast Track Road alignment south along a new alignment to I-10.
The Western Alternative starts at the US 60 and Ironwood Drive interchange in Apache Junction and generally follows the Ironwood Drive alignment for approximately three miles, then runs on a new alignment between the developed areas of unincorporated San Tan Valley and the CAP Canal. Near the Germann Road alignment, the SR 24 extension would tie into the Corridor. The alignment for the Western Alternative continues south and east, crossing the Magma Arizona Railroad and Copper Basin Railroad tracks and the Gila River before entering the northern part of the city of Coolidge. The alignment continues south through the eastern part of Coolidge and, just north of the Picacho Reservoir, the Western Alternative heads west across the Union Pacific Railroad tracks. The alignment then runs concurrently with SR 87 south to I-10.
With the availability of the transition areas, a preferred action corridor alternative may include any combination of Eastern and Western Alternative segments.

Traffic Report North-South Corridor Study
2 | October 2018
Figure 1. Study Area and Action Corridor Alternatives
Mesa
• •
w,,
... e W1■
~ Wlb
• Queen Creek
Pima Rd
OcoUlloRd
• c~andltr Heights Rd ..,.__
fllggs Rd
Emphe Blvd
Skylln■ Dr
San Tan Mountains
"" . ~ . ~ .. !!I •• San Tan••
Valley •
!t Judd Rd e ~,1, . ~
W1b
.,.
Gila River Indian Community
r ,.,_ ,., _ ,.
• • ..... ,_ ,,,_ , • • •
E1 ■
: Flonmce Kel._iln Hwy
•
KleckRd ~ Slo,yRd
• • • • • • • • E3c ...
... E3b
(
• • • • • • • • •
SolJTient :ia l=Boo--lldl=-==<12 711===!!=::::=::::::::::=t,ll "'""••• - •" - 1"- •••- •"- "'- '''- "'s;g.;'e'~i?.,
Casa Grande • • Selma/lwy • •
~ - . . 0 ¾ : :
Baltaglla Or
Harmon Rd
~~ . . ~ ~ . .
~ C
" .., 3 J
~~~~ :
~ :,:
s ~
.., z CD . C
? ~
• • • • • • • • • • • • • • • • • • • • • • • • • •• •••
Bar11tt1Rd
Marana
"°
[ffi
Tucson
Action Alternatives
- Eastern Alternative
Eastern Alternative Options
- Western Alternative
Western Alternative Options
SR 24 and US 60 approved al ignment
Segment lines
• • • •• North-South Corridor • • • • study area
DATA SOURCE: ADWR, Pw,al County, Esri WortdEle-vationfferrnln
t-~
I I I I 0 2 4 6
Miles
I 8
A DOT

Traffic Report North-South Corridor Study
October 2018 | 3
1.2 Corridor Segments This traffic report evaluates eight EIS Action Alternatives, as depicted in Figure 2. The alternatives are also included in Appendix A.
The Corridor is divided into four segments that incorporate transition areas to allow an action corridor alternative to shift east to west or west to east and to facilitate the evaluation of impacts resulting from the proposed action. In total, eight full-length action corridor alternatives are evaluated in this DEIS, as shown in Figure 2.
Table 1 identifies the approximate limits of the four segments, the options for transitioning from one action corridor alternative to the other, and other options.
Figure 2. Eight full-length action corridor alternatives
1 2 3 4
5 6 7 8

Traffic Report North-South Corridor Study
4 | October 2018
Table 1. North-South Corridor Segments
Segment
Approximate location Action corridor alternatives and transitions
Northern limit Southern limit
1 US 60 North of Arizona Farms Road
Segment 1 is approximately 18 miles long and includes two eastern alternatives and one western alternative that with a transition option to the east north of the tie-in to SR 24.
E1a Alternative – begins east of Goldfield Road in Apache Junction, following a southerly alignment concurrent with the planned US 60 bypass for approximately 1.5 miles before continuing in a new alignment in mostly undeveloped, unincorporated Pinal County. The SR 24 connection is a southern route, which begins at the Ocotillo Road alignment and crosses the CAP Canal before heading north to join the existing SR 24.
E1b Alternative – is coincident with the E1a Alternative, with the exception that the SR 24 connection is a northern route that follows the Germann Road alignment before it crosses the CAP Canal to join the existing SR 24.
W1a Alternative – follows the Ironwood Drive alignment for approximately 3 miles and then runs on a new alignment between the developed areas of unincorporated San Tan Valley and the CAP Canal.
W1b Alternative – north of the SR 24 connection and Germann Road, crosses the CAP Canal and joins US 60 at Goldfield Road.
2 North of Arizona Farms Road
South of Arizona Farms Road
Segment 2 is approximately 2 miles long to accommodate transitions from west to east or east to west.
E2a Alternative – provides a transition from the E1a and E1b Alternatives to the E3a, E3b, E3c, and E3d Alternatives.
E2b Alternative – provides a transition from the W1a and W1b Alternatives to the E3a, E3b, E3c, and E3d Alternatives.
W2a Alternative – provides a transition from the W1a and W1b Alternatives to the W3 Alternative.
W2b Alternative – provides a transition from the E1a and E1b Alternatives to the W3 Alternative.
3 South of Arizona Farms Road
North of Steele Road
Segment 3 is approximately 12 miles long. The Eastern Alternative includes two options, resulting in four alternatives, plus the Western Alternative.
E3a Alternative – generally follows the CAP Canal before turning south approximately 1 mile east of SR 79 where it crosses the Gila River and then to the west around historic downtown Florence. The route turns south to the east of Valley Farms Road, crossing over SR 287 and then generally paralleling the Florence Canal to north of Steele Road.
E3b Alternative – generally continues south across Copper Basin Railroad and Hunt Highway before crossing the Gila River and merging with the E3a Alternative.
E3c Alternative – coincident with the E3a Alternative until Martin Road, where it continues to the southwest approximately 1 mile east of the E3a Alternative, merging with the E3a and E3b Alternatives north of Steele Road.
E3d Alternative – coincident with E3b and E3c Alternatives.
W3 Alternative – runs on a new alignment through undeveloped and agricultural land east of the Union Pacific Railroad and SR 87.
4 North of Steele Road
Interstate 10
Segment 4 is approximately 12 miles long and includes two eastern alternatives and one western alternative that includes a transition option to the east.
E4 Alternative – from approximately Steele Road the alternative travels south past the Picacho Reservoir where it follows the Fast Track Road alignment south along a new alignment to I-10.
W4 Alternative – from approximately Steele Road the alternative heads southwest from the Picacho Reservoir and across the Union Pacific Railroad tracks, where the alignment then runs concurrently with SR 87 south to I-10.
Notes: CAP = Central Arizona Project, I-10 = Interstate 10, SR = State Route, US 60 = United States Route 60
Traffic Report North-South Corridor Study
October 2018 | 5
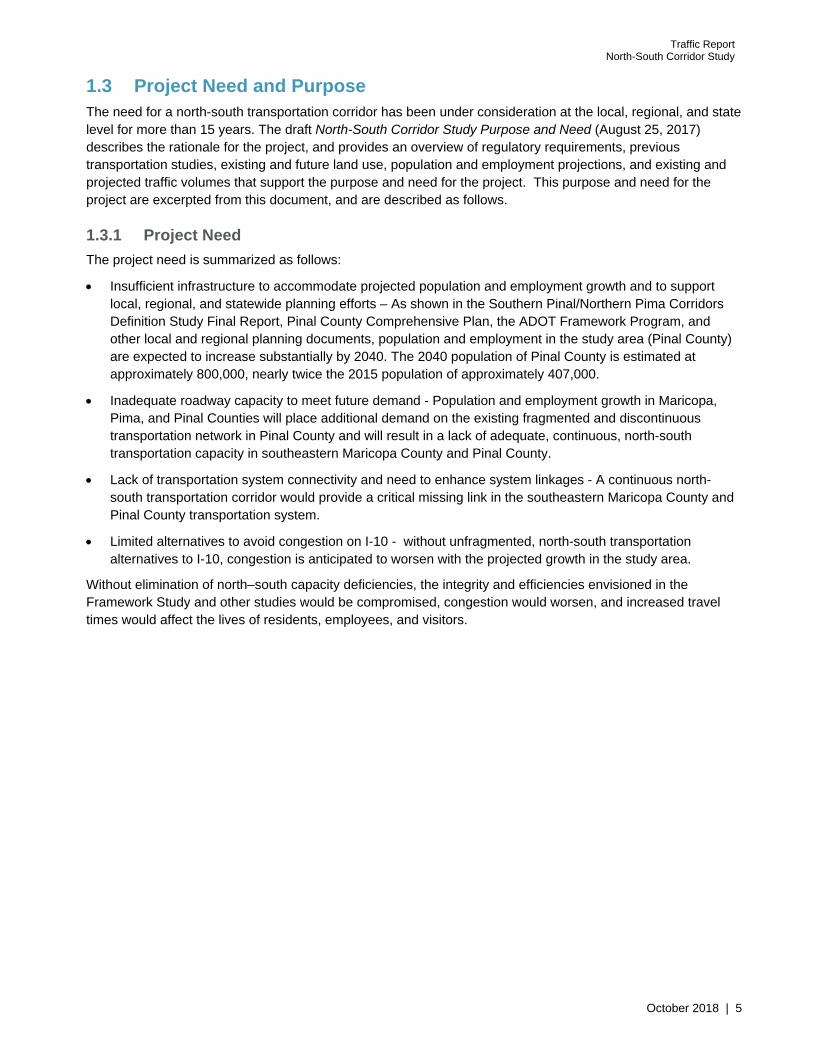
1.3 Project Need and Purpose The need for a north-south transportation corridor has been under consideration at the local, regional, and state level for more than 15 years. The draft North-South Corridor Study Purpose and Need (August 25, 2017) describes the rationale for the project, and provides an overview of regulatory requirements, previous transportation studies, existing and future land use, population and employment projections, and existing and projected traffic volumes that support the purpose and need for the project. This purpose and need for the project are excerpted from this document, and are described as follows.
1.3.1 Project Need
The project need is summarized as follows:
Insufficient infrastructure to accommodate projected population and employment growth and to support local, regional, and statewide planning efforts – As shown in the Southern Pinal/Northern Pima Corridors Definition Study Final Report, Pinal County Comprehensive Plan, the ADOT Framework Program, and other local and regional planning documents, population and employment in the study area (Pinal County) are expected to increase substantially by 2040. The 2040 population of Pinal County is estimated at approximately 800,000, nearly twice the 2015 population of approximately 407,000.
Inadequate roadway capacity to meet future demand - Population and employment growth in Maricopa, Pima, and Pinal Counties will place additional demand on the existing fragmented and discontinuous transportation network in Pinal County and will result in a lack of adequate, continuous, north-south transportation capacity in southeastern Maricopa County and Pinal County.
Lack of transportation system connectivity and need to enhance system linkages - A continuous north-south transportation corridor would provide a critical missing link in the southeastern Maricopa County and Pinal County transportation system.
Limited alternatives to avoid congestion on I-10 - without unfragmented, north-south transportation alternatives to I-10, congestion is anticipated to worsen with the projected growth in the study area.
Without elimination of north–south capacity deficiencies, the integrity and efficiencies envisioned in the Framework Study and other studies would be compromised, congestion would worsen, and increased travel times would affect the lives of residents, employees, and visitors.

Traffic Report North-South Corridor Study
6 | October 2018
1.3.2 Project Purpose
To address transportation needs within the study area, the purpose of the proposed action is to provide the following:
Enhanced transportation to accommodate existing and future populations – A Corridor consistent with state, regional, and municipal planning initiatives to accommodate anticipated growth in the study area and across the larger region.
Improved access to future activity centers – A Corridor to benefit the study area’s new activity and population centers and undeveloped lands identified for conversion that are in various stages of the local and/or regional planning processes.
Improved regional mobility – An operational Corridor providing additional roadway capacity ahead of full build-out development to avoid congestion associated with anticipated growth.
Alternative to avoid congestion on I-10 – An unfragmented north-south transportation alternative to I-10 to reduce traffic delays at full build-out development.
North-south connectivity – a continuous, access controlled Corridor connecting eastern portions of the Phoenix metropolitan area with Pinal County and destinations to the south including Tucson.
Integration of the region’s transportation network – A critical missing link in the transportation network to provide regional connectivity.
1.4 Background This section describes previous studies relating to the Corridor alternatives development, area transportation studies that helped identify transportation improvement needs in the region, and recent and planned transportation improvements in the study area.
1.4.1 Alternatives Selection Report
This traffic report relies on the North-South Corridor Study Alternatives Selection Report (March 2015). The ASR documents the alternatives development and screening process and recommends route alternatives for further detailed analysis in the Tier 1 DEIS. The route alternatives that emerged from the screening process of all reasonable and feasible route alternatives in the study area are represented as the Western Alternatives and the Eastern Alternatives. Western Alternatives 1 and 2 represent the route alternatives located west of the CAP Canal that responded to stakeholder comments representing federal, state, and local agencies. The Western and Eastern Alternatives include transition segments that enable the routes to be combined during the Tier 1 DEIS phase of the study to produce many combinations of reasonable and continuous route alternatives. The alternatives are previously described in Table 1.
1.4.2 Previous Transportation Studies in the Study Area
Transportation studies prepared by ADOT, Maricopa Association of Governments (MAG), Central Arizona Governments (CAG), Sun Corridor Metropolitan Planning Organization (SCMPO), and other local government agencies provide a baseline for evaluating a possible solution for meeting future transportation needs in the study area. Previous studies provide valuable information about current conditions, existing and anticipated system deficiencies, projected growth and development patterns, and municipal and stakeholder objectives. These studies have helped identify short- and long-term transportation improvements to enhance mobility, access, and safety in the study area. The preparation of these materials has helped foster partnerships and coordination efforts between and among the varying agencies that will facilitate the comprehensive planning efforts necessary to improve transportation mobility in the study area. Although this section focuses on studies conducted in the last ten years, needs for the Corridor were included in earlier studies, such as the Southeast

Traffic Report North-South Corridor Study
October 2018 | 7
Maricopa/Northern Pinal County Area Transportation Study Final Report (2003) and Pinal County Corridors Definition Study Final Report (2007), and the 2004 Statewide Long-Range Transportation Plan (MoveAZ).
1.4.2.1 Phoenix to Tucson Passenger Rail Study (2016)
The purpose of implementing passenger rail transportation between Tucson and Phoenix is to help meet future travel demand in Pima, Pinal, and Maricopa counties. State and regional planning initiatives have recommended implementing passenger rail to add travel capacity to what is already offered by highways. Having an additional travel mode for the trip between Tucson and Phoenix could enhance highway safety and reduce air pollutant emissions by removing automobiles from already congested highways. A Final Tier 1 EIS and Record of Decision for this study was completed in December 2016.
The selected alternative (Yellow Corridor Alternative), illustrated in Figure 3, includes routing options in the area between SR 79 and I-10. It follows existing ADOT or Union Pacific Railroad (UPRR) right-of-way (ROW), including the UPRR Phoenix Subdivision’s Southeast Branch. The selected alternative also includes an option that would utilize the Corridor right-of-way; as a result, the Corridor alternatives were developed to accommodate passenger rail from right-of-way and geometric perspectives.
1.4.2.2 Pinal County Regionally Significant Routes (2008, 2017)
The Pinal County Regionally Significant Routes for Safety and Mobility (2008, with updates in 2017) recommended right-of-way preservation and development of a system of regionally significant parkway, arterial, and collector streets.
Regionally significant routes (RSR) serve as a guide for Pinal County and other stakeholders, both public and private, to implement and fund and preserve right-of-way for these routes. The updated RSR are shown in Figure 4, and include the Corridor alignment with a note referencing that the alignment is currently under study by ADOT.
The RSRSM illustrates the Corridor as a “RTA Parkway” north of Kleck Road. South of Kleck Road, the Corridor is illustrated as an arterial following the Wheeler Road alignment.
1.4.2.3 Coolidge-Florence Transportation Study (2008)
The Coolidge-Florence Transportation Study developed a regional multimodal transportation system plan for the Coolidge and Florence region. Travel demand projections were developed for 2025 for this study. The plan recommended continued and coordinated efforts regarding a design concept study for the Corridor.
1.4.2.4 City of Coolidge Comprehensive Transportation Feasibility Study (2012)
Completed in 2012, this study was a cooperative effort of the City of Coolidge and ADOT. The study identified the need for the Corridor, a detailed access / interchange study and a park-and-ride location study.
1.4.2.5 Town of Queen Creek Multimodal Transportation Master Plan (2016)
This 2016 plan sought to identify and address long-term transportation planning issues for Queen Creek. While the study focused on areas within the Queen Creek municipal limits, it identified the Corridor as being in the study vicinity and recognized the need for coordinating future road systems to promote connectivity between and among communities.
1.4.2.6 City of Eloy Small Area Transportation Study (2010)
The City of Eloy Small Area Transportation Study (2010) developed recommendations for 2030 and 2050 time frames. An alternative that was modeled for future conditions included the addition of two potential freeway alignments. One new freeway alignment was the proposed “North-South” freeway that entered the Eloy planning area near the northeast corner and traverses the east side of the planning area to a connection with I-

Traffic Report North-South Corridor Study
8 | October 2018
10 near Picacho. The draft roadway networks recommended for both the 2030 and long-range horizons are one-mile grid systems of arterials.
1.4.2.7 US 60 Alignment Study: Superstition Freeway to Florence Junction Study (2011)
This study advanced the recommendations set forth in ADOT’s US 60 Corridor Definition Study (2006) through the evaluation of improvements to US 60 between mileposts 199 and 211. Residential development has been significant in this area in recent years and is anticipated to increase in the future with the anticipated implementation of the Lost Dutchman Heights (formerly Portalis) and Superstition Vistas developments. In 2011, the US 60 project received environmental clearance with a finding of no significant impact (ADOT 2011).
1.4.2.8 Apache Junction Comprehensive Transportation Study (2012)
A joint effort between the City of Apache Junction and ADOT, this study sought to develop a long-range multimodal transportation plan to address the city’s most critical current and future transportation needs. The study evaluated growing demands placed on the city’s local roads and streets, the Lost Dutchman Heights (formerly Portalis) area, and the larger region and considered public transportation, bicycle, and pedestrian needs, and additional multimodal opportunities. The study identified a series of short-, mid-, and long-range improvements to the transportation network as well as the potential realignment of US 60 and the Corridor.
1.4.2.9 Southern Pinal County Regional Corridors Study (2015)
This study was jointly conducted with ADOT, Eloy, Marana, and Coolidge to address Southern Pinal County’s existing and future multimodal travel demand, identify market opportunities, evaluate priority investment areas, and identify improvements to the regional transportation system. The study references the Corridor as an additional long-term high-capacity transportation corridor needing further detailed study.
1.4.2.10 City of Coolidge General Plan 2025
The City of Coolidge 2025 General Plan (adopted June 23, 2014, Figure 3.3, Transportation Plan Map) identifies potential Corridor interchange locations within the Coolidge planning area. Interchange locations are illustrated at Vah Ki Inn Road, Martin Road, McCartney Road, Kleck Road, Steele Road, Selma Highway, Hanna Road, Arica Road, and Houser Road.
1.4.2.11 Inland Port Arizona & Pinal Logistics Park Traffic Impact Analysis
Pinal Land Holdings (PLH) proposes a new inland port and industrial site one quarter mile east of SR 87 between Hanna and Houser Roads in Eloy, Arizona. Inland ports are specialized locations that offer intermodal transfer facilities and frequently also offer international trade processing and other services.
A traffic impact study for the PLH development was completed in December 2015. The TIA assumed Corridor interchange locations at Hanna Road, Arica Road, and Houser Road. It should be noted that the assumption of an interchange at Arica Road as proposed by PLH and by the Coolidge General Plan is inconsistent with interchange location assumptions made within this Traffic Report. Interchange locations within this Traffic Report (see Section 3.4.5) are made considering spacing criteria and consistency with the Pinal County RSR.
A review of the PLH TIA trip generation and distribution assumptions demonstrates that the traffic generated from PLH in the build-out phase (estimated to be complete in 2030) can be accommodated within the Corridor.

Traffic Report North-South Corridor Study
October 2018 | 9
Figure 3. Passenger Rail Selected Corridor Alternative
Source: Arizona Passenger Rail Corridor Study, Tucson to Phoenix, Record of Decision, December 2017
" ~ ScDtudale
l -, Glendale
$ 1
TohonoO'odham Nation
~ Aipon
Yellow C.aidor AttfmatM
Oplicnal Roi/If
- Interstate
- State ot USHi;hway
- - Railroad
-- Major llrainage
f<deral Land
National r.rest
Tri>al Laod
Slate !rust Lille!
A«:_ s it,ie:s GtyBoundal}'
~EsalOM;:MlllN~tl~!n.3; -tnl- lnimwbS,,....Mll
f

Traffic Report North-South Corridor Study
10 | October 2018
Figure 4. Planned Regionally Significant Routes in Pinal County
Source: Pinal County
T 11h11nn O OJ h /1 Indian Comm u nity
Regionally Significant Routes for Safety & Mobility - 2017 UPDATE
PINAL REGION Legend
(w RTAP..irkAnd Rhfo
O FnA l~kll(lr(flang(I:
e RT.A Local Projec:1 Fun(Jrg
........ EIO'f Cc:uJndl RellOlullon
u. u..-. ~klge (01,.mcl RIJl;l;lh.lUQn
••• ••• RTA tf..SCof'rilfor(ROW)
• .. •• • RTA ~sl Pu--,1 Cmrrlor (RO...VJ
-- RTA P.;ul-.ny
'BIIIWRTACd:I~
-- ParbioWf
-- A~n~
Cesilerims
CAG~a
MAGAAa
Sun COl'l'fOOr "-Iea
S.1 n C ... 11'10" l ndian Community

Traffic Report North-South Corridor Study
October 2018 | 11
1.4.3 Regional Transportation Plans
The Metropolitan Planning Organizations (MPOs) in the region have identified the need for a Corridor through Pinal County. MAG’s 2040 Regional Transportation Plan identifies the extension of SR 24 as a six-lane freeway from Ellsworth Road to Meridian Road as occurring in Group 3 (fiscal years 2027-2040) and right-of-way protection as a priority for the Corridor (including SR 24 between Meridian Road and the Corridor) in the Pinal County area of the MAG Metropolitan Planning Area.
The Pinal Regional Transportation Authority Plan (Proposition 416) was approved by voters in November 2017, along with a half-cent sales tax (Proposition 417), which identifies an estimated $640,000,000 in transportation funding over the 20-year period. The Plan includes the Pinal County contribution for construction of 36 miles of the Corridor as a limited access two-lane principal facility between US 60 in the City of Apache Junction on the north to Kortsen/Kleck Road on the south of Coolidge. It also includes funding towards preservation of right-of-way for the remainder of the Corridor from Kortsen/Kleck Road on the north to I-10 on the south near Eloy.
The CAG Regional Transportation Plan (2015) recognizes the need for a Corridor with a connection to SR 24 to provide an alternative for travel between I-10 and the Phoenix metropolitan area. The CAG Plan also notes that a freeway facility will support economic development and provide support for the growing communities of Eloy, Coolidge, and Florence as well as northern Pinal County.
The SCMPO Regional Transportation Plan (2016) recognizes the need for a continuous north-south route through central Pinal County. This project was listed as a strategic project supported by SCMPO, who will continue to collaborate with ADOT and regional planning partners on this project.
1.4.4 Recent and Planned Transportation Improvements in the Study Area
1.4.4.1 State Route 24 from Ironwood Drive to the North South Corridor
State Route 24 (SR 24), also known as the Williams Gateway Freeway, is a freeway in the southeastern region of the Phoenix metropolitan area. SR 24 is planned as a controlled-access highway to move traffic from the southeastern suburbs of Phoenix to planned suburbs in northwestern Pinal County. The first mile from Loop 202 to Ellsworth Road opened on May 4, 2014. Future plans include extending the highway southeast for 4.6 miles between Ellsworth Road and Ironwood Road. Phase 2 of this project includes construction of an interim roadway with two paved travel lanes in each direction separated by a graded median that would be constructed within the footprint of the future SR 24 freeway between Ellsworth Road and Ironwood Road. The interim roadway pavement surface would be used for the ultimate SR 24 freeway build-out.
In the fall of 2015, the extension of SR 24 to the North-South Corridor was incorporated into the Corridor Study. This addition combines the interrelated and previously distinct Corridor Study and SR 24 extension projects into one integrated project. The Corridor Study incorporates existing SR 24 study material, which began an evaluation of potential SR 24 extensions to the Corridor. Previously completed studies identified an alignment to extend SR 24 to Ironwood Road; the Corridor Study will continue the study from Ironwood Road to the east.
1.5 Traffic Report Objectives The objectives of this traffic report are to provide traffic engineering perspectives to the evaluation of Corridor alternatives in the Tier 1 DEIS, including:
Evaluate Corridor study area travel demand patterns and performance indicators Evaluate Corridor study area transportation capacity deficiencies and major points of congestion Macro-level traffic evaluation of Corridor improvement concepts

Traffic Report North-South Corridor Study
12 | October 2018
1.6 Traffic Report Organization This Traffic Report relies on the draft Corridor Study Purpose and Need dated August 25, 2017, which documents the need for a continuous, non-fragmented transportation corridor connecting US 60 and I-10 and to reduce study area congestion created by projected growth and development in Pinal County.
The Traffic Report defines, develops, and evaluates alternatives for a continuous, fully access-controlled transportation facility on 400-foot-wide right-of-way connecting US 60 near Apache Junction and I-10 near Eloy. The facility is planned for build-out conditions and consists of three lanes in each direction with service interchanges generally located to support the arterial network as recommended in the 2008 Pinal County Regionally Significant Routes Plan for Safety and Mobility (RSRSM) study with 2017 updates.
The Arizona Statewide Travel Demand Model (AZTDM2) was used to evaluate each of the Corridor route alternatives. The performance of each route alternative was compared to the 2040 No-Action condition to inform the selection of a preferred route alternative in the Tier 1 DEIS. Subsequently, for each route alternative segment, the maximum volume was selected to form a single composite corridor to facilitate an evaluation of the corridor in the 2040 design year (2040).
The traffic report is organized into the following chapters: 1) Introduction; 2) Existing Conditions and Corridor Characteristics; 3) Future Conditions (2040); and 4) Conclusions.

Traffic Report North-South Corridor Study
October 2018 | 13
2 Existing Conditions and Corridor Characteristics
2.1 Overview of Transportation System The transportation system in the Corridor area has developed over time in response to land uses. Pinal County has historically had primarily agricultural and undeveloped land uses. Figure 5 illustrates the relative percentage of land use types within the Corridor study area.
The road system in the study area has developed over time as a grid system in the Coolidge area, which extends to Eloy. Through Florence and areas north, the grid system is interrupted due to the Gila River, the Union Pacific, Copper Basin, and Magma Arizona railroads, the CAP canal, and other geographic constraints. This has hindered the development of a robust network.
A continuous north-south transportation corridor would provide a critical missing link in the southeastern Maricopa County and Pinal County transportation system. Currently, travelers heading north from the Tucson area on westbound I-10 who wish to reach areas east of central Phoenix while continuing to travel on a high-capacity roadway must go through central Phoenix to access the SR 202L or US 60 to the east. SR 79 provides access along the eastern edge of the study area north of the Town of Florence; south of the Town of Florence SR 79 travels southeast towards Oracle Junction, where it ends at its junction with SR 77, approximately 25 miles north of Tucson. SR 79 is not a high-capacity route, and operates as a local route through Florence with numerous access points and businesses along the route.
An overview of the transportation system in the study area and operational performance is described in the following sections.
2.1.1 Transportation System
2.1.1.1 Interstate and U.S. Highways
Primary freeways within or near the study area include I-10, Interstate 8 (I-8), and US 60 (see Figure 6). These freeways are located on the outer edges of the study area and provide connections to secondary roadways, including SR 87, SR 79, SR 287, and Hunt Highway.
I-10 serves as the primary vehicular corridor between Tucson and Phoenix. Congestion on I-10 in Tucson and Phoenix and between the two cities continues to increase, particularly during peak travel times. The recently completed widening of I-10 between Picacho and Marana and planned widening of I-10 between -8 and Picacho (anticipated to start construction in 2018) have been designed to alleviate some of the pressure on the existing system.
US 60 is an east-west roadway in the northern part of the study area. In the west, it connects with I-10. In the northwestern part of the study area, US 60 connects with SR 202L and continues east through Apache Junction, where it turns southeast through Gold Canyon and connects with SR 79, which runs along the eastern edge of the study area.
Figure 5. Existing Land Uses
EXISTING L t-
CJ "iii u
"' ·e "' a. QI ,, E -~
C QI u E :, a. ·;;;
0 "O 0 0 u E

Traffic Report North-South Corridor Study
14 | October 2018
2.1.1.2 State Highways
State highways carry most of the regional traffic in Pinal County and southeastern Maricopa County. Within the study area, these facilities include SR 24, SR 202L, SR 87, SR 287, and SR 79. SR 24, which extends from SR 202L to Ellsworth Road in far eastern Maricopa County, is developed as an urban freeway with two lanes in each direction. Plans are in place to extend SR 24 approximately 4.6 miles east from Ellsworth Road to Ironwood Road. SR 202L is an urban freeway with three general purpose lanes in each direction. Generally, SR 87, SR 287, and SR 79 have one lane in each direction in rural areas, with some wider cross-sections in more urbanized areas such as Coolidge and Florence.
In the study area, SR 87 runs east-west just north of downtown Coolidge. It connects with SR 287 in Coolidge and SR 79 in Florence. SR 287 continues south to Eloy while SR 79 runs north through Florence and connects with US 60 before it turns northwest toward Gold Canyon and Apache Junction.
2.1.1.3 Arterial Streets and Regionally Significant Routes
The study area is characterized by a limited network of continuous arterial streets. Roads that generally connect to the freeways and highways and serve more populated areas of the study area such as Coolidge, Florence, and San Tan Valley include the following:
Hunt Highway
Ellsworth Road
Ironwood Road/Gantzel Road
Bella Vista Road
Arizona Farms Road
Attaway Road
Cactus Forest Road
Figure 6 illustrates the number of lanes for the various facilities inside the study limits. In addition, the planned Pinal County RSR network is shown in Chapter 1. The RSRs serve as a guide for Pinal County and other stakeholders, both public and private, to implement and fund RSRs Routes and preserve right-of-way for these routes.

Traffic Report North-South Corridor Study
October 2018 | 15
Figure 6. Existing Lane Characteristics for Key Roadways
Gila River Indian Community
jl?1 "O -
i I I ~ p- -=----+--+---"'
Legend
-+--+ Railroads
--- CAP Canal
Local Roadway
Q North-South Corridor Study Area
Number of Lanes
- 2 Lanes
- 4 Lanes
- 6+ Lanes
0 2.5 5 10 Miles I
N
A
_ j

Traffic Report North-South Corridor Study
16 | October 2018
2.1.1 4 Transit
Public transit service in Pinal County is limited. Current public transit options include the Central Arizona Regional Transit (CART) bus line that connects Florence, Coolidge, Central Arizona College, and Casa Grande and the Cotton Express bus system, which provides deviated fixed route bus service and on-demand service throughout the City of Coolidge Monday through Friday. Both of these services are operated by the City of Coolidge Transit Department.
The Coolidge Transit Study (2016) recommended further study for potentially expanding transit service to Eloy, Arizona City, San Tan Valley, and the Sacaton / Blackwater area.
The Southeast Valley Transit Study (July 2015), conducted by MAG, identified a series of short-, mid-, and long- term recommendations to promote a transit system that connects the communities of the Southeast Valley and provides linkages to the existing and planned regional transit network. Participating communities in the study area included Apache Junction, Florence, Queen Creek, and the surrounding unincorporated parts of Pinal County.
The Corridor does not include a transit component, and any potential improved public transportation in the study area would be addressed separately.
2.1.1.5 Railroads
Union Pacific Railroad
UPRR has rail lines carrying freight in the study area. The UPRR east-west Sunset Route crosses the entire state of Arizona, passing through Cochise, Benson, Tucson, Picacho, Eloy, Casa Grande, Maricopa, Gila Bend, Wellton, and Yuma. Traffic on the Sunset Route varies from 44 to 49 trains per day, on average. This is the UPRR main line, connecting southern California with Texas and the south-central United States. Within the study area, the Sunset Route runs parallel to I-10.
UPRR has recently completed double-tracking the transcontinental Sunset Route within the study area. Additionally, UPRR has developed plans for constructing a new railyard in the Red Rock area at the southern end of the study area.
UPRR has a second line in the study area, the Phoenix Subdivision, which runs north from the Sunset Route along SR 87 into Coolidge, where it turns to the northwest and serves the Phoenix metropolitan area. The UPRR Phoenix Subdivision connects the Sunset Route with Phoenix and points west and east of Phoenix. The Phoenix Subdivision averages about six through trains per day. UPRR currently interchanges with three railroads on its Phoenix Subdivision: Copper Basin Railway at Magma Junction, the dormant Magma Arizona Railroad at Magma Junction, and BNSF Railway at Phoenix.
Amtrak provides passenger service on the Sunset Route. The Sunset Limited service route begins in Orlando, Florida, and ends in Los Angeles, California, but it does not currently have any stops within the study area (the closest stops are in Tucson and Maricopa).
Stakeholder interviews with rail representatives identified that design for the Corridor should ultimately allow for up to four main line tracks on the UPRR Sunset Line. Any new additional tracks will be located adjacent to the existing tracks on UPRR right-of-way. It is UPRR policy that clear span structures are required over UPRR right-of-way and that the number of tracks to be accommodated in the roadway design will be determined by UPRR on a case-by-case review.

Traffic Report North-South Corridor Study
October 2018 | 17
Copper Basin Railway
The Copper Basin Railway extends 54.6 miles from its interchange with UPRR at Magma to Winkelman. The line is owned by ASARCO, LLC, a copper mining, smelting, and refining company. Major commodities carried include copper ore, concentrates, anodes, cathodes, coal, coke, smelting biproduct corrosive, lumber products (building material), military vehicles, petroleum naphtha, plastic resins, and sulfuric acid.
Magma Arizona Railroad
This 28-mile line is currently out of service. It is owned by BHP-Billiton and connects UPRR and Copper Basin Railway at Magma with the BHP Superior Mine. This copper mine closed in 1995. The Magma Railroad is expected to be reactivated when the Superior Mine reopens.
2.1.1.6 Active Transportation
Bicycling and walking represent important modes of transportation. In the study area, Coolidge has approximately 11 miles of arterial and collector streets with sidewalks on either one or both sides of the road. Some roadways have striped shoulders that are suitable for bicycling. Eloy has sidewalks on a number of residential streets as well as on segments of Main Street. Paved shoulders that are four feet wide or greater exist on Frontier Street and on Sunshine Boulevard from I-10 to Frontier Street. Sections of Shedd Road and Giles Street have a striped bicycle lane.
In Florence, there is currently no continuous system of pedestrian or bicycle facilities. Sidewalks are proposed within new developments.
Pinal County residents and visitors have access to a wide variety of park, trail, and outdoor recreation opportunities. Pinal County is home to five State Parks, four Wilderness Areas, three National Monuments, two National Forests, and a National Scenic Trail. Pinal County also provides several neighborhood/community parks and manages approximately 60 miles of regional non-motorized multi-use trails. Bicycles are permitted on all state roads in Pinal County except I-10 and the segment of I-8 between Trekell Road and I-10.
2.2 Existing Operational Performance on RSR Corridors Pinal County key RSR segments within the study area that will be significantly impacted by the Corridor are identified for further analysis to measure the traffic operational impacts of the Corridor.
A transportation network is designed to accommodate the expected transportation demand, that is, a certain volume of travel, at an acceptable level of service (LOS). Once that volume is exceeded, the network begins to operate inefficiently. When capacity deficiency occurs, or is projected to occur, improvements that would be necessary to address these deficiencies are typically identified in the jurisdiction’s long-range transportation plan.
Traffic operational characteristics are typically described in terms of LOS. LOS is measured on a scale ranging from A to F, with A representing the best performance and F indicating the worst. As described in the Transportation Research Board’s Highway Capacity Manual (2010), LOS A corresponds to minimal delay at signalized intersections and free-flow conditions on highways. LOS F means long delays at signalized intersections and congested stop-and-go conditions on highways.
Pinal County Traffic Impact Assessment Guidelines & Procedures, January 2007, defines LOS as the desired performance target:
If the resulting Level of Service and/or roadway capacity are below “C” then the author shall include within the report a recommendation of what minimum improvements are necessary to elevate any substandard conditions to that of LOS = C. Such will be considered as the background conditions for any horizon years, excluding the opening year.

Traffic Report North-South Corridor Study
18 | October 2018
2.2.1 Existing Traffic Volumes and Level of Service
Daily 2015 average daily traffic (ADT) volumes and volume-to-capacity (V/C) ratios and LOS for key RSR segments contained in the 2015 No-Action travel demand model are summarized in Table 2. The performance is illustrated in Figure 7.
Table 2. Traffic Volumes and Level of Service Summary for Key Corridors
Corridor Location
Existing (2015)
ADT Volume/ Capacity (V/C) Level of Service1
North-South RSRs
Hunt Highway Arizona Farms Road to Franklin Road 10,162 1.01 LOS F
SR 79 Hunt Highway to Diversion Dam Road 8,302 0.46 LOS A-C
Ironwood - Gantzel Road Baseline Road to SR 24 17,377 0.87 LOS E
Schnepf Road Combs Road to Skyline Drive 6,213 0.62 LOS A-C
Attaway Road Hunt Highway to SR 287 4,135 0.41 LOS A-C
SR 87 (Arizona Boulevard) Vah Ki Inn Road to Martin Road 7,532 0.21 LOS A-C
Hunt Highway Belle Vista Road to Copper Mine Road 29,085 2.39 LOS F
East-West RSRs
Riggs - Combs Road Signal Butte Road to Schnept Road 10,111 1.01 LOS F
Skyline Drive Schnept Road to Quail Run Lane 4,454 0.44 LOS A-C
Bella Vista Road Gantzel Road to Quail Run Lane 5,907 0.59 LOS A-C
Arizona Farms Road Hunt Highway to Copper Basin RR 2,000 0.26 LOS A-C
Coolidge Avenue SR 87 to Attaway Road 966 0.10 LOS A-C
SR 287 Christenson Road to Attaway Road 6,580 0.37 LOS A-C
Selma highway Eleven Mile Corner Road to SR 87 126 0.01 LOS A-C
US 60 Perlalta Road to SR 79 9,590 0.27 LOS A-C
Ocotillo Road Rittenhouse Road to Ironwood Drive 19,760 1.00 LOS F
SR 287 Attaway Road to Valley Farms Road 5,606 0.31 LOS A-C
I-10 Sunshine Boulevard to SR 87 56,500 0.70 LOS A-C
1. Relationship of V/C Ratio and LOS: LOS A-C: V/C ≤ 0.72 LOS D: V/C > 0.72 & ≤ 0.84 LOS E: V/C > 0.84 & ≤ 1.00 LOS F: V/C > 1.00
The 2015 ADOT travel demand model traffic assignment results were evaluated to provide an indication of baseline traffic performance within the study area. The study area system performance results for all existing roadways the North-South corridor study area, in terms of vehicle-miles-traveled (VMT) and vehicle-hours-traveled (VHT) are summarized in Table 3. The results indicate that approximately 8% of roads within the study area (47 out of 613 miles) are congested.

Traffic Report North-South Corridor Study
October 2018 | 19
Table 3. Existing Study Area Traffic Performance
Alternatives Total VMT
(daily) Total VHT
(daily)
Miles of Congested
Roads
2015 Existing 5,002,600 108,900 47

Traffic Report North-South Corridor Study
20 | October 2018
Figure 7. 2015 Study Area-wide Performance
---f
Legend
-f--+- Railroads
--- CAP Canal
Interstate Highway
U.S. / State Highways and Freeways
Local Roadway
,--qJ,~, --- US 60 -Approved Alignment
C) North-South Corridor Study Area
Level-of-Service (LOS)
0 2.5 5 10 Miles
2015 No-Build LOS
I_ \
r
,( - ../~-
J \
-...___
\ '--..
N
A
·, -,
~- ~~ r' ..__
-~~ /
~.,t> --~---<t:"-e~'li-
~
\ l
>-

Traffic Report North-South Corridor Study
October 2018 | 21
3 Future Conditions (2040)
3.1 2040 Socioeconomic and Land Use Forecast
3.1.1 Land Use
The study area is a mix of incorporated municipal and unincorporated county and Arizona State Land Department (ASLD) lands. Each incorporated municipality has an identified municipal planning area (MPA), which represents the respective municipality’s area of planning concern and is based on the anticipated future incorporated boundaries of that municipality. The incorporation of these lands, and subsequent development, depends on annexation from the county or ASLD.
According to municipal and county land use plans, nearly 500,000 acres classified as agricultural or undeveloped today would be converted to residential and commercial development at full build-out development (there is no estimated timeframe for when full build-out will occur as it is dependent on the timing and intensity of development). According to these plans, future land use would be 50 percent residential and mixed use. Neighborhood land uses, which are a combination of residential and commercial with varying densities, would represent 13 percent of total study area lands.
Commercial land use is anticipated to increase to 14 percent, from less than 1 percent in existing conditions. Much of this commercial development would be concentrated in the northern part of the study area just south of Apache Junction, in and around the Phoenix-Mesa Gateway Airport, and in Coolidge where a new regional shopping area is planned. Open space areas would increase from under 1 percent to 13 percent. Most of the open space lands would be concentrated in the eastern and southern parts of the study area. Agricultural lands would decrease from approximately 20 percent under existing conditions to less than 1 percent.
3.1.2 Population and Employment Growth
Population and employment in the study area are expected to grow substantially by 2040. Existing and projected population and employment in Pinal, Pima, and Maricopa Counties (including those areas outside the study area) are presented in Table 4. There is significant population and employment growth forecast, particularly in Pinal County in terms of the percentage of growth.
Table 4. Population and Employment in Pima, Pinal, and Maricopa Counties, 2015 - 2040
Geographic areaa 2015 2040 Percentage
change
Source: 2015 Population Estimates, Office of Employment & Population Statistics, Arizona Department of Administration, 2015.
2040 Population Projections, 2015-2050 State and County Population Projections, Office of Employment & Population Statistics, Arizona Department of Administration.
Employment Projections: ADOT Modeling & Forecasting Section (2017).
a includes all of Pima, Pinal, and Maricopa Counties
Population
Pima County 1,009,371 1,276,700 26.5
Pinal County 406,468 800,700 97.0
Maricopa County 4,076,438 6,031,000 47.9
Employment
Pima County 465,594 495,569 6.4
Pinal County 68,364 189,682 177.5
Maricopa County 1,923,012 2,863,967 48.9
Within the study area, population and employment growth is summarized in Table 5. For the study area, existing population and employment numbers are available only from the current MPO projection series that reports figures in 10-year increments beginning in 2010. Population in the study area is projected to more than

Traffic Report North-South Corridor Study
22 | October 2018
double by 2040. Much of this growth will occur outside existing incorporated municipal limits but within identified MPAs. In their general plans, study area municipalities have identified how and to what extent land would be converted to support new residential development. In addition, these municipalities anticipate that a north-south transportation corridor would support and facilitate this growth.
Table 5. Study Area Population and Employment, 2010 – 2040
Demographic 2015 2040 Percentage
change
Population 275,657 601,053 118.0
Employment 36,416 162,685 346.7
3.2 Travel Demand Model Travel demand modeling was performed to forecast 2040 future travel demand conditions. The tasks included the development of a base highway network that is coded and input into the AZTDM2 travel demand model. The AZTDM2, maintained by ADOT, uses population and employment projections from the State Office of Employment and Population Statistics, metropolitan planning organizations, councils of governments, and other local agencies.
Development of the transportation network was based on input from stakeholders in the study area including MAG, SCMPO, and CAG. The base network represents their respective future transportation networks and long-range transportation plans.
Population and employment data assumed in the AZTDM2 travel demand model is shown graphically in Figures 8 and 9.
The future network was evaluated to determine what changes have occurred on RSRs in the study area. Improvements to principal corridors that are reflected in the 2040 network include:
SR 287 is upgraded to a 4-lane cross-section west of Attaway Road
Attaway Road is upgraded to a 4-lane cross-section
Hunt Highway is upgraded to a 6-lane cross-section
I-10 is upgraded to a 6-lane cross-section
US 60 is upgraded to an 8-lane cross-section west of Ironwood Drive
US 60 and SR 24 approved alignments

Traffic Report North-South Corridor Study
October 2018 | 23
Figure 8. Population in the AZTDM2 Travel Demand Model, 2015 and 2040
0
Gila River Indian Community
N
A 2.5 5
Picacho ~ Reservoir g· -
~ gi
~ [
2015 Population
10 Miles I
Gila River Indian Community
Picacho :J Reservoir g ;?
~ i>l'-
i lro
2040 Population
Legend
-+--+ Railroads
Interstate Highway
U.S./ State Highways and Freeways
Local Roadway
0 North-South Corridor Study Area
SR 24 and US 60 approved alignment
Population per Sq. Mile 0
1 - 999 - 1,000 - 4,999 -5,000 - 9,999 - > 9,999

Traffic Report North-South Corridor Study
24 | October 2018
Figure 9. Employment in the AZTDM2 Travel Demand Model, 2015 and 2040
N
A 0 2 .5 5 I I
2015 Employment
10 Miles I
2040 Employment
Legend
-+------+ Railroads Employment per Sq. Mile
Interstate Highway 0
U.S. / State Highways and Freeways - 1 - 999
Local Roadway 1,000 - 2,999
Q North-South Corridor Study Area - 3,000 - 5,999
- SR 24 and US 60 Approved Alignment - > 5,999

Traffic Report North-South Corridor Study
October 2018 | 25
3.3 Travel Demand Model Calibration, Validation, and Reasonableness This section describes ways that the AZTDM2 travel demand model is checked for accuracy. This information is excepted from Development of the Arizona Statewide Travel Demand Model: Phase 2 (AZTDM2) (2011).
Travel demand model calibration is a method of adjusting model parameters so that, when the models are applied to input data for a recent “base year”, the number of people making each particular travel decision matches a “target”.
After the model calibration, the model validation verifies the ability of the models to reproduce specific observations of travel patterns seen on the actual network, independent of the data used in the initial model development and estimation. Validation of AZTDM2 travel demand model was performed by comparing the results of the highway assignments to highway counts. After observing initial results from the highway validations, additional adjustments were made to key model components where the initial targets were at odds with the results from the validations to achieve a compromise that agreed with all sources to the greatest extent possible.
Each component (short distance person travel, long distance person travel, short distance truck travel, and long distance truck travel) of the AZTDM2 travel demand model contributes to the total travel in the state. The general strategy used to calibrate the model is to first calibrate the long-distance model components, because those can be compared to intercity volumes on major through‐routes where long distance travel can be reasonably expected to dominate.
The long-distance traffic is then held as background traffic while the short distance models are calibrated. In the end, all are considered holistically.
3.3.1 Mode Share Assumptions
Mode choice is the process where the means of traveling is determined. A procedure in the travel demand model is used to convert to person-trips for the following modes:
Drive alone
Shared ride with 2 persons
Shared ride with 3 or more persons
Transit
The percent of trips assumed by transit varies according to the area type (central business district (CBD), urban, suburban, rural/small town CBD) and the trip purpose. After transit trips are factored out, a model is applied to choose the auto occupancy, which takes into account auto operating costs per mile, distance, value of time, and travel time specific to the mode. Person trips are later converted to vehicle trips.
3.3.2 Description of Forecast Uncertainties
3.3.2.1 ADOT Phoenix to Tucson Passenger Rail Study
Forecast uncertainties include the effect of passenger rail service on travel on the North-South corridor. There is currently no construction schedule and no funding identified for passenger rail system service between Tucson and Phoenix. Moving forward, the public and policymakers will decide how to generate the funding to pay for the project. Mode share for rail service is not included in the current AZTDM2 travel demand model.

Traffic Report North-South Corridor Study
26 | October 2018
3.3.2.2 Pinal Land Holdings
Pinal Land Holdings (PLH) proposes to construct a new inland port (Inland Port Arizona) and industrial site (Pinal Logistics Park) one quarter-mile east of SR 87 between Hanna Road and Houser Road, on land recently annexed into the City of Coolidge.
The proposed inland port and Pinal Logistics Park includes 1,493 acres and is to be constructed in three phases. According to the traffic impact analysis (Traffic Impact Analysis, Inland Port Arizona & Pinal Logistics Park, State Route 87/Houser Road, December 2015), Phase I of the development (opening year) is assumed to be constructed in 2020. Phase II is assumed to be constructed in 2025 and Phase III in 2030.
Trip generation and assumptions developed in the 2015 TIA for the full build-out scenario were reviewed to consider potential impacts to the North-South Corridor. For Phase 1 of the PLH development, 20,000 vehicles per day was forecasted. Phase 2 forecasted 40,144 vehicles per day, and Phase 3 forecasted 67,700 vehicles per day.
Applying the assumptions and trip distributions from the 2015 TIA, approximately 27% of forecasted trips, an additional 18,279 trips per day of Phase 3 (buildout) are anticipated to travel on the North-South Corridor from from/to the north to SR 24 or US 60. Approximately 35% of forecasted trips, an additional 23,695 trips per day of Phase 3, are assumed to travel from/to the south to I-10.
The results of the traffic analysis show that the North-South Corridor will be able to accommodate (under its definition as a six-lane, fully-access controlled freeway facility) the proposed PLH Inland Port development.
3.4 Proposed Functional Characteristics of the North-South Corridor Attributes and characteristics of the Corridor were defined to facilitate an evaluation of route alternatives (recommended in the Alternatives Selection Report for further evaluation in the EIS phase of the Corridor Study) and an analysis of design year traffic operations. The project purpose and need are reviewed to functionally define the following key transportation features of the corridor. The corridor definition is subject to refinement as a result of further transportation studies in the study area.
3.4.1 Functional Classification
To accomplish its purpose and need, the Corridor will be a continuous transportation facility connecting US 60 in the vicinity of Apache Junction to I-10 in the vicinity of Eloy. Build-out population in the study area is expected to be approximately two million people, and studies of build-out conditions have recommended a fully access-controlled freeway facility. The corridor definition therefore includes a fully access-controlled freeway facility on the preferred route alternative selected in this phase of the Corridor Study.
3.4.2 Right-of-Way
The Tier 1 DEIS will identify a 1,500-foot wide alternative corridor; the Tier 2 study will define a 400-foot alignment within this corridor for the proposed facility.
A 400-foot right-of-way width is designed to accommodate both a fully accessed-controlled freeway and a passenger rail. The Corridor is included in the Locally Preferred Alternative (LPA) options for the Phoenix-to-Tucson passenger rail corridor.
This 400-foot right-of-way width was developed in consultation with the ADOT Passenger Rail Study.
The 400-foot right-of-way width also allows sufficient flexibility during corridor final design.
3.4.3 Design Year and Criteria
The design year for the Corridor is 2040. The northern portion of the study area (north of SR 287) is projected to experience higher development and urbanization than the southern portion of the study area. As such, the

Traffic Report North-South Corridor Study
October 2018 | 27
northern reaches of the corridor may be designed and constructed as an urban freeway and the southern reaches as a rural freeway or other interim facility.
Preliminary design criteria for developing routes alternatives was prepared during the Tier 1 phase. Design criteria will be refined during the Tier 2 phase.
Both ADOT Roadway Design Guidelines (RDG) for urban and rural freeway facilities and design criteria for the passenger rail should be considered in establishing design criteria for the corridor. Generally, horizontal and vertical design criteria for the passenger rail will accommodate RDG design criteria for urban and rural freeways.
3.4.4 Number of Basic Lanes
Three basic freeway lanes in each direction are included in the corridor definition. A six-lane freeway facility provides sufficient corridor capacity to accommodate 2040 future growth and development, diversion of traffic during closures of I-10, during incidents/events on the Corridor which reduce capacity, and regional evacuation events.
3.4.5 Traffic Service Interchanges / System Interchanges
The corridor definition includes 14 “service” interchanges at the junction of access-controlled freeway and arterials and three “system” interchanges at the junction of three access-controlled freeways. Service interchanges are located at junctions with Pinal County Regionally Significant Routes, with consideration of desirable interchange spacing (2 to 3 miles). Service and system interchanges in the corridor definition are listed below from north to south (note: service interchange locations and some system interchanges are subject to change pending future transportation planning studies by MAG and ADOT). These interchange locations are:
US 60 (system interchange)
Elliot Road (service interchange)
US 60 Bypass (service interchange, eastern alternative only)
SR 24 (system interchange)
Ocotillo Road (service interchange)
Riggs Road (service interchange)
Skyline Road (service interchange)
Bella Vista Road (service interchange)
Arizona Farms Road (service interchange)
Hunt Highway (service interchange)
SR 287 (service interchange)
Martin Road (service interchange)
Bartlett Road (service interchange)
Kleck Road (service interchange)
Steele Road (service interchange)
Selma Highway (service interchange)
Hanna Road (service interchange)
Houser Road (service interchange)
I-10 (system interchange)

Traffic Report North-South Corridor Study
28 | October 2018
4 Alternatives Evaluation Modeled evaluation alternatives were prepared and modeled in the Arizona Statewide Travel Demand Model (AZTDM) to facilitate the evaluation of the eight alternatives (and options which allow for a total of forty different combinations of alternative route segments that could be incorporated into the recommended alternative).
Seven modeled evaluation alternatives were run to evaluate the eight EIS Action Alternatives and options. The EIS Action Alternatives, included in Appendix A, represent routes that are located in the western portion of the study area, eastern portion of the study area, and those that cross from east to west. EIS Action Alternatives also represent a northerly connection of SR 24 to the North-South Corridor, and a southerly connection of SR 24 to the North-South Corridor.
The seven modeled alternatives are depicted in Figure 10 through Figure 13. Table 6 lists the EIS Action Alternatives, the corresponding modeled alternative(s) used to develop the performance evaluation, and the corridor options within each alternative that comprise the selected model alternatives. Using the results of these model runs, the performance evaluation for each of the eight EIS Action Alternatives was derived. In some instances, the results are reported as a range to capture the differences resulting from the various options in Segments 1 (W1a and W1b for the western alternatives and E1a and E1b for the eastern alternative) and Segment 3 (the eastern alternative includes four options, E3a, E3b, E3c, and E3d). In Segment 3, the difference between the options E3a and E3c, and E3b and E3d, are insignificant from a traffic perspective; therefore, E3a and E3b results are representative of E3c and E3d, respectively.
Table 6. Modeled Evaluation Alternatives and Corridor Action Alternatives
Alternative Description Model Modeled Corridor Action Alternatives
Segment 1 Segment 2 Segment 3 Segment 4
1 West connection to US 601 and west corridor in Segments 3, and 4
A W1a W2a W3 W4 D W1b W2a W3 W4
2 West connection to US 601 with east corridor near Florence2 and west connection to I-10
Composite with E
W1a, W1b E2b E3a W4
Composite with E2
W1a, W1b E2b E3b W4
3 West connection to US 601 and east corridor near Florence2 and east connection to I-10
Composite model result
W1a, W1b E2b E3a, E3b E4
4 West connection to US 601 and west corridor near Coolidge and east connection to I-10
Composite model result
W1a, W1b W2a W3 E4
5 East connection to US 603 and west corridor in Segments 3, and 4
Composite model result
E1a, E1b W2b W3 W4
6 East connection to US 60 and east corridor near Florence2 and west connection to I-10
Composite model result
E1a, E1b E2a E3a, E3b W4
7 East connection to US 603 and east corridor near Florence2 and east connection to I-10
C E1a E2a E3a E4
B E1b E2a E3a E4
8 East connection to US 603 and west corridor near Coolidge and east connection to I-10
F E1b W2b W3 E4
* Segment 2 is transition segment, allowing crossover from east to west and west to east. Notes: Alternative E3a and E3b differ from Alternatives E3c and E3d, respectively, by less than one-tenth of a mile in length, and share interchanges and travel
times; therefore, Alternative E3a and E3b are representative of Alternatives E3c and E3d, respectively
1. West connection to US 60 refers to the W1a and W1b Alternatives.
2. East connection near Florence refers to E3a (or E3c) and E3b (or E3d).
3. East connection to US 60 refers to the E1a and E1b Alternatives.
This chapter documents the performance evaluation of each of the action corridor alternatives, along with that of the 2040 No-Action Alternative in terms of their impact to:
Reduce congestion on the RSR network (reduce 2040 v/c ratio on a defined RSR segment): RSR segments for which performance is evaluated were selected considering the RSR’s connectivity to the North-South corridor and if the RSR segment serves as an alternative route to the North-South.

Traffic Report North-South Corridor Study
October 2018 | 29
Reduce the number of miles of congested roadways within the study area
Reduce VMT (Vehicle-Miles Traveled) within the study area
Reduce VHT (Vehicle-Hours Traveled) within the study area
In addition, the evaluation summary includes a qualitative description of the following:
1. Performance differences in Segment 1 between the eastern (E1a and E1b) and western (W1a and W1b) alternatives (e.g. does the choice of eastern or western options in Segment 1 impact corridor performance to the south)?
2. Performance differences to the north and south of Segment 3 for the eastern (E3a and E3b) alternatives and western (W1a) alternative.
3. Performance differences to the north of Segment 4 for the E4 and W4 Alternatives.
4.1 Traffic Safety A detailed traffic safety analysis was not completed for the study area. Most the study area in which the Corridor will be constructed consists of undeveloped land void of improved roadways. Other portions of the Corridor will incorporate existing rural roadways. Rural roadways have higher crash rates than other types of roadways. Safety issues associated with rural roadways often include nighttime visibility, speeding, animal crossings, and fixed objects next to the roadway.
The Corridor is anticipated to decrease the number of crashes that occur on Pinal County RSR segments and other local streets as all Corridor alternatives will:
Include a median-divided roadway
Implement corridor access management (access provided at interchanges only)
Separate higher-speed through traffic from local streets
Incorporate other safety features such as delineation for horizontal curves, and longitudinal rumble strips and stripes
Provide alternative route during incidents on I-10; Corridor alternatives will provide an alternative route with sufficient capacity to accommodate traffic volumes that would be diverted from I-10 between Eloy and Phoenix. Currently, no such alternative route exists. This will improve incident management during I-10 incidents, and reduce secondary crashes due to I-10 congestion during incidents.
Consideration of traffic safety will be an important element of future engineering and planning analysis. Safety should be considered as design criteria is established, and other design-level decisions such selection of interchange configurations.

Traffic Report North-South Corridor Study
30 | October 2018
Figure 10. North-South Modeled Alternatives A and D
El S Action Alternative 1 with W1a
(Modeled Alternative A)
El S Action Alternative 1 with W1b
(Modeled Alternative D)
N
A .... North-Soulh Corridor Alig~n t
#,### Forec:a:st-:d CailyTraficVoJun-.es
-- Prowx<t US&::> Align~ nt

Traffic Report North-South Corridor Study
October 2018 | 31
Figure 11. North-South Modeled Alternatives E and E2
El S Action Alternative 2 with E3a
(Modeled Alternative E)
El S Action Al t.ernative 2 with E3b
(Modeled Altemative E2)
N
A - Norrt-Sootn o,rr1::1orAl~men1
#;### rorecae.:..o DUPJ Tra~ICVok.rll ee.
-- Propoeeo u s 60 Alignment
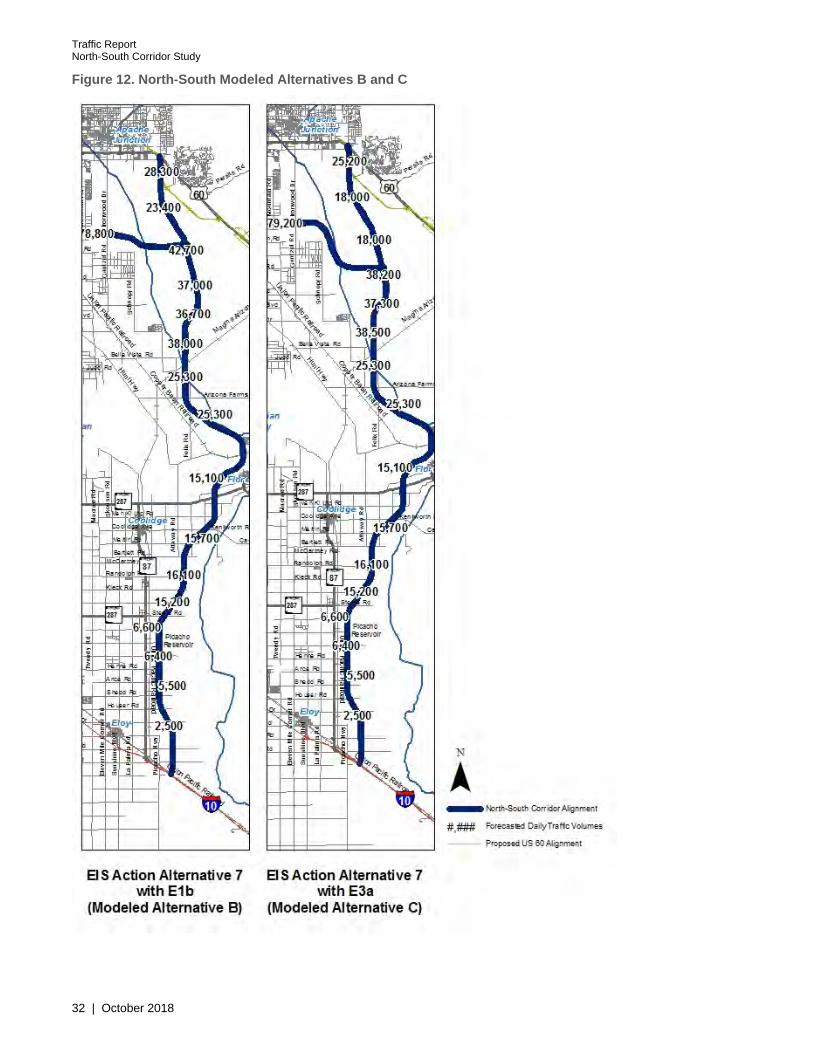
Traffic Report North-South Corridor Study
32 | October 2018
Figure 12. North-South Modeled Alternatives B and C
El S Action Al ternative 7 with E1b
(Modeled Al ternative 8)
El S Action Al ternative 7 with E3a
(Modeled Al ternative C)
N
A - Nortt.-Souttl Corridor Alignment
#,### Foteca:s'='<f DailyTraficVotumes
-- Pro~xdUS ~ Alig:nme.nt

Traffic Report North-South Corridor Study
October 2018 | 33
Figure 13. North-South Modeled Alternatives F
El S Action Alternative 8 with E1b
(Modeled Alternative F)
N
A ..... Norlh-Souttt C.orridor Alignment
#,### Fotemst-:d DailyTra:-icVoJun-.es
-- Prowxd US &::>A lignment

Traffic Report North-South Corridor Study
34 | October 2018
4.2 2040 No-Action Alternative The 2040 No-Action Alternative represents projected future traffic conditions without the Corridor.
The forecasted 2040 volumes for select RSR segments are summarized in Table 7. The 2040 results illustrate that the select RSRs are forecasted to have significant traffic growth compared to the 2015 traffic volumes. As shown, the model assignment indicates that many of the RSR segments are forecasted to experience poor LOS in terms of a volume-to-capacity relationship. A v/c ratio greater than 0.84 (LOS E) would indicate congestion.
Table 7. 2040 No-Action RSR Segments Comparison
RSR Segment Location
Existing (2015)
2040 No-Build
ADT ADT v/c LOS
North-South RSRs
Hunt Highway Arizona Farms Road to Franklin Road 10,162 37,308 > 1.0 LOS F
SR 79 Hunt Highway to Diversion Dam Road 8,302 26,289 0.73 LOS D
Ironwood - Gantzel Road Baseline Road to SR 24 17,377 26,752 > 1.0 LOS F
Schnepf Road Combs Road to Skyline Drive 6,213 14,160 > 1.0 LOS F
Attaway Road Hunt Highway to SR 287 4,135 25,593 > 1.0 LOS F
SR 87 (Arizona Boulevard) Vah Ki Inn Road to Martin Road 7,532 36,556 > 1.0 LOS F
Hunt Highway Belle Vista Road to Copper Mine Road 29,085 85,642 > 1.0 LOS F
East-West RSRs
Riggs - Combs Road Signal Butte Road to Schnepf Road 10,065 32,466 > 1.0 LOS F
Skyline Drive Schnepf Road to Quail Run Lane 2,353 13,685 > 1.0 LOS F
Bella Vista Road Gantzel Road to Quail Run Lane 6,196 10,648 > 1.0 LOS F
Arizona Farms Road Hunt Highway to Copper Basin RR 2,611 6,502 0.65 LOS A-C
Coolidge Avenue SR 87 to Attaway Road 2,323 6,276 0.62 LOS A-C
SR 287 Christenson Road to Attaway Road 10,952 41,435 > 1.0 LOS F
Selma highway Eleven Mile Corner Road to SR 87 420 483 0.05 LOS A
US 60 Peralta Road to SR 79 13,929 24,799 0.68 LOS A-C
Ocotillo Road Rittenhouse Road to Ironwood Drive 21,802 31,152 > 1.0 LOS F
SR 287 Attaway Road to Valley Farms Road 8,111 24,182 > 1.0 LOS F
I-10 Sunshine Boulevard to SR 87 56,500 96,000 0.79 LOS D
The results of a performance evaluation of the No-Action Alternative at a study area-wide level are summarized in Table 8. The total VMT (average weekday) within the defined study limits is forecasted to reach 12,626,500 miles. The VHT forecast is 372,800 hours. Congestion was determined using the v/c ratio equal to or greater than 0.84. According to the results, 185 miles of the 2040 network within the study area are forecasted to experience congestion as illustrated in Figure 14.
Table 8. Study area-wide Performance Measurements
Alternative Total VMT
(daily) Total VHT
(daily)
Miles of Congested
Roads
2040 No-Action 12,626,500 372,800 185

Traffic Report North-South Corridor Study
October 2018 | 35
Figure 14. 2040 No-Action Study Area-wide Performance
T
Gila River Indian Community
" a: . c _-' "O
~ lips j~ i MiUiganRdRd
6 + Rd
L
Legend
-+--+ Railroads
--- CAP Canal
Interstate Highway
U.S. / State Highways and Freeways
Local Roadway
Q North-South Corridor Study Area
Level-of-Service (LOS)
0 2.5 5 10 Miles N
A

Traffic Report North-South Corridor Study
36 | October 2018
4.3 EIS Action Alternative 1 with W1a option EIS Action Alternative 1 with the W1a option was modeled by Evaluation Alternative A. The north terminal is located at US 60 / Ironwood Drive and continues south along Ironwood Drive. The south terminal is located at I-10 / SR 87 and continues north along SR 87. The SR 24 extension connects to the Corridor from the west, just north of Pecos Road. Action Alternative 1 with the W1a option is illustrated in Figure 15.
Forecast 2040 volumes, v/c ratio, and LOS for RSR segments for EIS Action Alternative 1 with the W1a option are summarized in Table 9.
Table 9. EIS Action Alternative 1 with the W1a option, 2040 RSR Segments Comparison
RSR Segment Location
2040 No-
Action 2040 Alternative A
ADT ADT v/c LOS
North-South RSRs
Hunt Highway Arizona Farms Road to Franklin Road 37,308 33,879 > 1.0 LOS F
SR 79 Hunt Highway to Diversion Dam Road 26,289 24,264 0.67 LOS A-C
Ironwood - Gantzel Road Baseline Road to SR 24 26,752 10,019 0.5 LOS A-C
Schnepf Road Combs Road to Skyline Drive 14,160 9,313 0.93 LOS E
Attaway Road Hunt Highway to SR 287 25,593 4,611 0.23 LOS A-C
SR 87 (Arizona Boulevard) Vah Ki Inn Road to Martin Road 36,556 29,923 0.83 LOS D
Hunt Highway Belle Vista Road to Copper Mine Road 85,642 72,748 > 1.0 LOS F
East-West RSRs
Riggs - Combs Road Signal Butte Road to Schnept Road 32,466 11,600 > 1.0 LOS F
Skyline Drive Schnept Road to Quail Run Lane 13,685 4,200 0.42 LOS A-C
Bella Vista Road Gantzel Road to Quail Run Lane 10,648 30,000 0.83 LOS D
Arizona Farms Road Hunt Highway to Copper Basin RR 6,502 7,00 0.70 LOS A-C
Coolidge Avenue SR 87 to Attaway Road 6,276 23,500 0.65 LOS A-C
SR 287 Christenson Road to Attaway Road 41,435 29,300 > 1.0 LOS F
Selma highway Eleven Mile Corner Road to SR 87 483 1,297 0.13 LOS A-C
US 60 Peralta Road to SR 79 24,799 23,496 0.65 LOS A-C
Ocotillo Road Rittenhouse Road to Ironwood Drive 31,152 29,294 > 1.0 LOS F
SR 287 Attaway Road to Valley Farms Road 24,182 24,193 > 1.0 LOS F
I-10 Sunshine Boulevard to SR 87 96,000 94,400 0.78 LOS D
The results of a performance evaluation at a study area-wide level are summarized in Table 10. The total VMT within the defined study limits is forecasted to increase to 13,645,800 miles. The VHT forecast is 339,800 hours. According to the results, 153 miles of the 2040 network within the study limits are forecasted to experience congestion (LOS E or LOS F) as illustrated in Figure 16.
----

Traffic Report North-South Corridor Study
October 2018 | 37
Table 10. EIS Action Alternative 1 with the W1a option, 2040 Study Area-wide and Corridor Performance
Total VMT
(daily) Total VHT
(daily)
Miles of Congested
Roads
Study Area-wide Performance
EIS Action Alternative 1 with W1a Option
13,645,800 339,800 153
2040 No-Action 12,626,500 372,800 185
Corridor Performance
EIS Action Alternative 1 with W1a Option
1,659,477 27,146 -

Traffic Report North-South Corridor Study
38 | October 2018
Figure 15. EIS Action Alternative 1 with W1a option, 2040 Daily Traffic Volume
Gila River Indian --1 Community
Woodruff Rd~ ---+-1 ~
l ~ i
00 _ Rd
P1cacho c Reservo1
12,090 a Rd -u
Rd ! d r1i1 ,t~O rRd g_
""
Legend -+---+ Railroads
--- CAP Canal
Interstate Highway
U.S. / State Highways and Freeways
Local Roadway
Q North-South Corridor Study Area
SR 24 and US 60 Approved Alignment
# ,###- Forecasted Daily Traffic Volumes
0 2.5 5 10 Miles I
N
A

Traffic Report North-South Corridor Study
October 2018 | 39
Figure 16. 2040 EIS Action Alternative 1 with W1a option, Study Area Performance
-rl
Gila River Indian Community
L
Legend
--+--+ Railroads
--- CAP Canal
Interstate Highway
U.S. / State Highways and Freeways
Local Roadway
Q North-South Corridor Study Area
Level-of-Service (LOS)
0 2.5 5 10 Miles I
N

Traffic Report North-South Corridor Study
40 | October 2018
4.4 EIS Action Alternative 1 with W1b option EIS Action Alternative 1 with W1b option was modeled by Evaluation Alternative D. The north terminal is located at US 60, east of Goldfield Road. The south terminal is located at I-10 / SR 87 and continues north along SR 87. The SR 24 extension connects to the Corridor from the west just north of Pecos Road.
EIS Action Alternative 1 with the W1b option is illustrated in Figure 17. The forecast 2040 volumes, v/c ratio, and LOS for selected RSR segments are summarized in Table 11.
Table 11. EIS Action Alternative 1 with the W1b option, 2040 RSR Segments Comparison
Corridor Location
2040 No-Action
2040 Alternative D
ADT ADT v/c LOS
North-South RSRs
Hunt Highway Arizona Farms Road to Franklin Road 37,308 33,851 > 1.0 LOS F
SR 79 Hunt Highway to Diversion Dam Road 26,289 24,213 0.67 LOS A-C
Ironwood - Gantzel Road Baseline Road to SR 24 26,752 15,063 0.75 LOS D
Schnepf Road Combs Road to Skyline Drive 14,160 9,289 0.93 LOS E
Attaway Road Hunt Highway to SR 287 25,593 4,641 0.23 LOS A-C
SR 87 (Arizona Boulevard) Vah Ki Inn Road to Martin Road 36,556 29,907 0.83 LOS D
Hunt Highway Belle Vista Road to Copper Mine Road 85,642 72,721 > 1.0 LOS F
East-West RSRs
Riggs - Combs Road Signal Butte Road to Schnept Road 32,466 31,154 > 1.0 LOS F
Skyline Drive Schnept Road to Quail Run Lane 13,685 11,336 > 1.0 LOS F
Bella Vista Road Gantzel Road to Quail Run Lane 10,648 17,169 > 1.0 LOS F
Arizona Farms Road Hunt Highway to Copper Basin RR 6,502 11,899 > 1.0 LOS F
Coolidge Avenue SR 87 to Attaway Road 6,276 4,233 0.42 LOS A-C
SR 287 Christenson Road to Attaway Road 41,435 30,028 0.83 LOS D
Selma highway Eleven Mile Corner Road to SR 87 483 1,288 0.13 LOS A-C
US 60 Perlalta Road to SR 79 24,799 23,825 0.66 LOS A-C
Ocotillo Road Rittenhouse Road to Ironwood Drive 31,152 29,479 > 1.0 LOS F
SR 287 Attaway Road to Valley Farms Road 24,182 24,205 >1.0 LOS F
I-10 Sunshine Boulevard to SR 87 96,000 94,500 0.79 LOS D
The results of a performance evaluation at a study area-wide level are summarized in Table 12. The total VMT within the study area is forecasted to increase to 13,693,500 miles. The VHT forecast is 341,300 hours. The results show that 154 miles of the 2040 network are forecasted to experience congestion as illustrated in Figure 18.
----

Traffic Report North-South Corridor Study
October 2018 | 41
Table 12. EIS Action Alternative 1 with the W1b option, 2040 Study Area-wide and Corridor Performance
Total VMT
(daily) Total VHT
(daily)
Miles of Congested
Roads
Study Area-wide Performance
EIS Action Alternative 1 with W1b Option
13,693,500 341,300 154
2040 No-Action 12,626,500 372,800 185
Corridor Performance
EIS Action Alternative 1 with W1b Option
1,601,983 26,0389 -

Traffic Report North-South Corridor Study
42 | October 2018
Figure 17. EIS Action Alternative 1 with W1b option
Gila River Indian Community
Ma
Bar 7.lci·
,_~_..,._ Rand
K
:Alsd
, 00 Rd
00 P1cacho
c Reservo1
100 1l d _ -i ~.39~ d [
L -
Legend --+--+ Railroads
--- CAP Canal
Interstate Highway
U.S. / State Highways and Freeways
Local Roadway
Q North-South Corridor Study Area
SR 24 and US 60 Approved Alignment
- Alternative D
# ,###- Forecasted Daily Traffic Volumes
0 2.5 5 10 Miles I
N
A

Traffic Report North-South Corridor Study
October 2018 | 43
Figure 18. EIS Action Alternative 1 with W1b option, 2040 Study Area Performance
- illO_'<jj~ ~ l- •1-.... •■ ~--1~~iLJ-_k.. Q~~~ , 1~
' . -, .o;\~jf¾ r.f. reek ::_9
. , ~ L-----1,,,: 'fi:.-·i - Einpire
-· ~Sk}'y,e Dr
- - ,~~::::i,, ~~~.ll!..11-~ ~ ------l ;.-;-r ~ 'I
-r
Legend
--+---+ Railroads
CAP Canal
Interstate Highway
U.S. I State Highways and Freeways
Local Roadway
Q North-South Corridor Study Area
Level-of-Service (LOS)
0 2.5 5 10 Miles N
A

Traffic Report North-South Corridor Study
44 | October 2018
4.5 EIS Action Alternative 2 with W1a and E3a options EIS Action Alternative 2 with W1a and E3a options was modeled by Evaluation Alternative E. The north terminal is located at US 60 / Ironwood Drive and continues south along Ironwood Drive. The south terminal is located at I-10 / SR 87 and continues north along SR 87. The SR 24 extension connects to the Corridor from the west, just north of Pecos Road.
EIS Action Alternative 2 with W1a and E3a options is illustrated in Figure 19.
The forecast 2040 volumes, v/c ratio, and LOS for selected RSR segments are summarized in Table 13.
Table 13. EIS Action Alternative 2 with W1a and E3a options, 2040 RSR Segments Comparison
Corridor Location
2040 No-Action
2040 Alternative D
ADT ADT v/c LOS
North-South RSRs
Hunt Highway Arizona Farms Road to Franklin Road 37,308 29,731 0.99 LOS F
SR 79 Hunt Highway to Diversion Dam Road 26,289 26,184 0.83 LOS D
Ironwood - Gantzel Road Baseline Road to SR 24 26,752 9,435 0.47 LOS A-C
Schnepf Road Combs Road to Skyline Drive 14,160 9,156 0.92 LOS E
Attaway Road Hunt Highway to SR 287 25,593 18,951 0.95 LOS E
SR 87 (Arizona Boulevard) Vah Ki Inn Road to Martin Road 36,556 29,922 0.83 LOS D
Hunt Highway Belle Vista Road to Copper Mine Road 85,642 77,509 > 1.0 LOS F
East-West RSRs
Riggs - Combs Road Signal Butte Road to Schnept Road 32,466 30,479 > 1.0 LOS F
Skyline Drive Schnept Road to Quail Run Lane 13,685 10,984 > 1.0 LOS F
Bella Vista Road Gantzel Road to Quail Run Lane 10,648 20,323 > 1.0 LOS F
Arizona Farms Road Hunt Highway to Copper Basin RR 6,502 9,641 0.96 LOS E
Coolidge Avenue SR 87 to Attaway Road 6,276 5,026 0.5 LOS A-C
SR 287 Christenson Road to Attaway Road 41,435 31,986 0.89 LOS D
Selma highway Eleven Mile Corner Road to SR 87 483 1,544 0.15 LOS A-C
US 60 Perlalta Road to SR 79 24,799 23,033 0.64 LOS A-C
Ocotillo Road Rittenhouse Road to Ironwood Drive 31,152 29,183 > 1.0 LOS F
SR 287 Attaway Road to Valley Farms Road 24,182 19,656 > 1.0 LOS F
I-10 Sunshine Boulevard to SR 87 96,000 94,700 0.79 LOS D
The results of a performance evaluation at a study area-wide level are summarized in Table 14. Total VMT within the study limits is forecasted to increase to 13,417,084 miles. The VHT forecast is 339,568 hours. The results show 161 miles of the 2040 network are forecasted to experience congestion as illustrated in Figure 20.
----

Traffic Report North-South Corridor Study
October 2018 | 45
Table 14. EIS Action Alternative 2 with W1a and E3a options, 2040 Study Area-wide and Corridor Performance
Total VMT
(daily) Total VHT
(daily)
Miles of Congested
Roads
Study Area-wide Performance
EIS Action Alternative 1 with W1a and E3a Options
13,417,100 339,600 161
2040 No-Action 12,626,500 372,800 185
Corridor Performance
EIS Action Alternative 1 with W1a and E3a Options
1,477,826 23,925 -

Traffic Report North-South Corridor Study
46 | October 2018
Figure 19. EIS Action Alternative 2 with W1a and E3a options, 2040 Daily Traffic Volumes
o
] 4&,8~0
000 ~\ '-~ 64,200
! I 14)800 - ) 4j 400
' - ' - _r
Gila River Indian I Community
7tt
Legend
-+----+ Railroads
--- CAP Canal
Interstate Highway
U.S. I State Highways and Freeways
Local Roadway
Q North-South Corridor Study Area
SR 24 and US 60 Approved Alignment
#;###- Forecasted Daily Traffic Volumes
0 2.5 5 10 Miles I
N

Traffic Report North-South Corridor Study
October 2018 | 47
Figure 20. EIS Action Alternative 2 with W1a and E3a options , 2040 Study Area Performance
--,
Gila River Indian Community
Legend --+----+ Railroads
--- CAP Canal
Interstate Highway
U.S. I State Highways and Freeways
Local Roadway
Q North-South Corridor Study Area
Level-of-Service (LOS)
0 5 10 Miles I
N
A
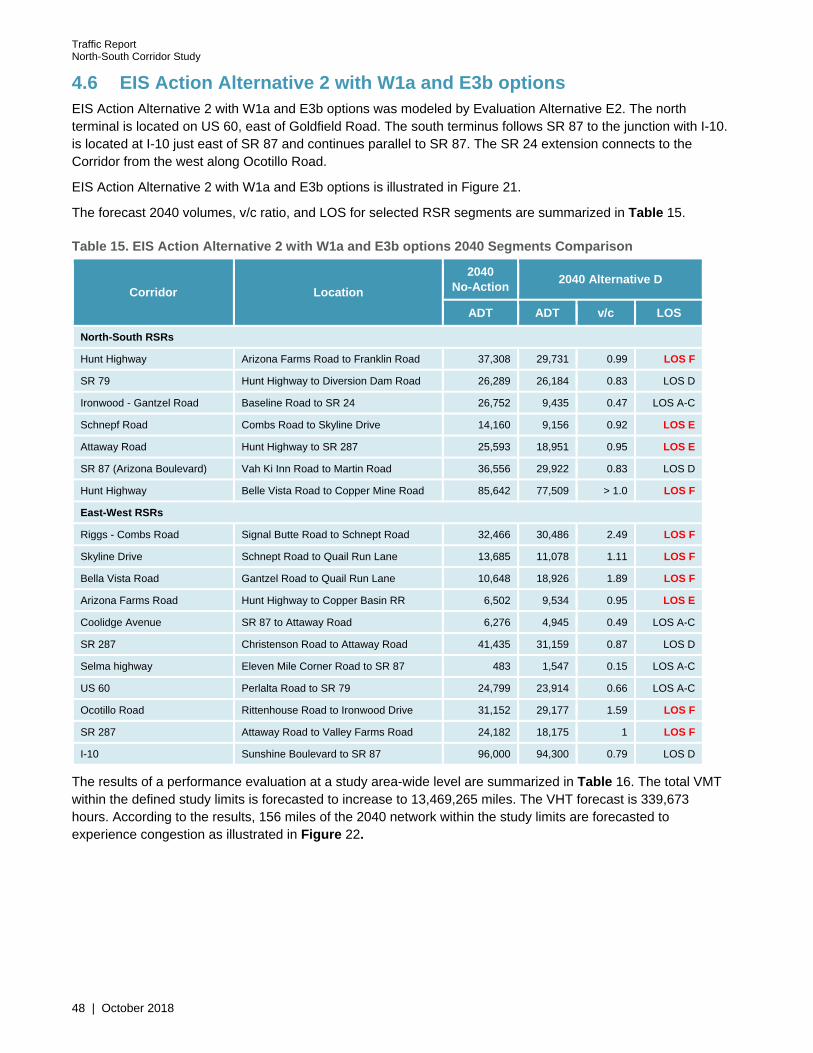
Traffic Report North-South Corridor Study
48 | October 2018
4.6 EIS Action Alternative 2 with W1a and E3b options EIS Action Alternative 2 with W1a and E3b options was modeled by Evaluation Alternative E2. The north terminal is located on US 60, east of Goldfield Road. The south terminus follows SR 87 to the junction with I-10. is located at I-10 just east of SR 87 and continues parallel to SR 87. The SR 24 extension connects to the Corridor from the west along Ocotillo Road.
EIS Action Alternative 2 with W1a and E3b options is illustrated in Figure 21.
The forecast 2040 volumes, v/c ratio, and LOS for selected RSR segments are summarized in Table 15.
Table 15. EIS Action Alternative 2 with W1a and E3b options 2040 Segments Comparison
Corridor Location
2040 No-Action
2040 Alternative D
ADT ADT v/c LOS
North-South RSRs
Hunt Highway Arizona Farms Road to Franklin Road 37,308 29,731 0.99 LOS F
SR 79 Hunt Highway to Diversion Dam Road 26,289 26,184 0.83 LOS D
Ironwood - Gantzel Road Baseline Road to SR 24 26,752 9,435 0.47 LOS A-C
Schnepf Road Combs Road to Skyline Drive 14,160 9,156 0.92 LOS E
Attaway Road Hunt Highway to SR 287 25,593 18,951 0.95 LOS E
SR 87 (Arizona Boulevard) Vah Ki Inn Road to Martin Road 36,556 29,922 0.83 LOS D
Hunt Highway Belle Vista Road to Copper Mine Road 85,642 77,509 > 1.0 LOS F
East-West RSRs
Riggs - Combs Road Signal Butte Road to Schnept Road 32,466 30,486 2.49 LOS F
Skyline Drive Schnept Road to Quail Run Lane 13,685 11,078 1.11 LOS F
Bella Vista Road Gantzel Road to Quail Run Lane 10,648 18,926 1.89 LOS F
Arizona Farms Road Hunt Highway to Copper Basin RR 6,502 9,534 0.95 LOS E
Coolidge Avenue SR 87 to Attaway Road 6,276 4,945 0.49 LOS A-C
SR 287 Christenson Road to Attaway Road 41,435 31,159 0.87 LOS D
Selma highway Eleven Mile Corner Road to SR 87 483 1,547 0.15 LOS A-C
US 60 Perlalta Road to SR 79 24,799 23,914 0.66 LOS A-C
Ocotillo Road Rittenhouse Road to Ironwood Drive 31,152 29,177 1.59 LOS F
SR 287 Attaway Road to Valley Farms Road 24,182 18,175 1 LOS F
I-10 Sunshine Boulevard to SR 87 96,000 94,300 0.79 LOS D
The results of a performance evaluation at a study area-wide level are summarized in Table 16. The total VMT within the defined study limits is forecasted to increase to 13,469,265 miles. The VHT forecast is 339,673 hours. According to the results, 156 miles of the 2040 network within the study limits are forecasted to experience congestion as illustrated in Figure 22.
----

Traffic Report North-South Corridor Study
October 2018 | 49
Table 16. EIS Action Alternative 2 with W1a and E3b options, 2040 Study Area-wide and Corridor Performance
Total VMT
(daily) Total VHT
(daily)
Miles of Congested
Roads
Study Area-wide Performance
EIS Action Alternative 1 with W1a and E3b Options
13,469,265 339,700 156
2040 No-Action 12,626,500 372,800 185
Corridor Performance
EIS Action Alternative 1 with W1a and E3b Options
1,483,234 23,860 -

Traffic Report North-South Corridor Study
50 | October 2018
Figure 21. EIS Action Alternative 2 with W1a and E3b options, 2040 Daily Traffic Volumes
o ] 47t,7~0
00 ~\
l,! .. --s--"' 50, 00
- ' - _r
Gila River Indian I Community
7tt
Legend
--+-+ Railroads
--- CAP Canal
Interstate Highway
U.S. I State Highways and Freeways
Local Roadway
Q North-South Corridor Study Area
SR 24 and US 60 Approved Alignment
#;###- Forecasted Daily Traffic Volumes
0 2.5 5 10 Miles I
N

Traffic Report North-South Corridor Study
October 2018 | 51
Figure 22. EIS Action Alternative 2 with W1a and E3b options, Study Area Performance
i
Gila River Indian I Community
Legend
--+-+ Railroads
--- CAP Canal
Interstate Highway
U.S./ State Highways and Freeways
Local Roadway
Q North-South Corridor Study Area
Level-of-Service (LOS)
0 2.5 5 10 Miles I
N
A

Traffic Report North-South Corridor Study
52 | October 2018
4.7 EIS Action Alternative 7 with E1b and E3a options EIS Action Alternative 7 with E1b and E3a options was modeled by Evaluation Alternative B. The north terminal is located at the far east of US 60, east of Goldfield Road. The south terminal is located at I-10 just east of SR 87 and continues parallel to SR 87. The SR 24 extension connects to the Corridor from the west just north of Pecos Road. EIS Action Alternative 7 with the E1b and E3a options is illustrated in Figure 23.The forecast 2040 volumes, v/c ratio, and LOS for selected RSR segments for EIS Action Alternative 7 are summarized in Table 17.
Table 17. EIS Action Alternative 7 with E1b and E3a options, 2040 RSR Segments Comparison
Corridor Location
2040 No-Action
2040 Alternative D
ADT ADT v/c LOS
North-South RSRs
Hunt Highway Arizona Farms Road to Franklin Road 37,308 31,057 > 1.0 LOS F
SR 79 Hunt Highway to Diversion Dam Road 26,289 27,737 0.77 LOS D
Ironwood - Gantzel Road Baseline Road to SR 24 26,752 16,845 0.84 LOS E
Schnepf Road Combs Road to Skyline Drive 14,160 10,948 > 1.0 LOS F
Attaway Road Hunt Highway to SR 287 25,593 19,423 0.97 LOS E
SR 87 (Arizona Boulevard) Vah Ki Inn Road to Martin Road 36,556 30,983 0.86 LOS E
Hunt Highway Belle Vista Road to Copper Mine Road 85,642 77,955 > 1.0 LOS F
East-West RSRs
Riggs - Combs Road Signal Butte Road to Schnept Road 32,466 30,782 > 1.0 LOS F
Skyline Drive Schnept Road to Quail Run Lane 13,685 12,356 > 1.0 LOS F
Bella Vista Road Gantzel Road to Quail Run Lane 10,648 16,092 > 1.0 LOS F
Arizona Farms Road Hunt Highway to Copper Basin RR 6,502 10,669 > 1.0 LOS F
Coolidge Avenue SR 87 to Attaway Road 6,276 4,653 0.47 LOS A-C
SR 287 Christenson Road to Attaway Road 41,435 32,792 0.91 LOS E
Selma highway Eleven Mile Corner Road to SR 87 483 1,242 0.12 LOS A-C
US 60 Perlalta Road to SR 79 24,799 23,236 0.64 LOS A-C
Ocotillo Road Rittenhouse Road to Ironwood Drive 31,152 29,641 > 1.0 LOS F
SR 287 Attaway Road to Valley Farms Road 24,182 20,298 > 1.0 LOS F
I-10 Sunshine Boulevard to SR 87 96,000 94,600 0.79 LOS D
The results of a performance evaluation at a study area-wide level are summarized in Table 18. Total VMT within the study limits will increase to 13,415,300 miles. The VHT forecast is 347,400 hours. The results show 174 miles of the 2040 network are forecasted to experience congestion as illustrated in Figure 24.
----

Traffic Report North-South Corridor Study
October 2018 | 53
Table 18. EIS Action Alternative 7 with E1b and E3a options, 2040 Study Area-wide and Corridor Performance
Total VMT
(daily) Total VHT
(daily)
Miles of Congested
Roads
Study Area-wide Performance
EIS Action Alternative 7 with E1b and E3a options
13,415,300 347,400 174
2040 No-Action 12,626,500 372,800 185
Corridor Performance
EIS Action Alternative 7 with E1b and E3a options
1,028,322 16,114 -

Traffic Report North-South Corridor Study
54 | October 2018
Figure 23. EIS Action Alternative 7 with E1b and E3a options, 2040 Daily Traffic Volumes
1 ,100
:'700 "'"' ' ,/•
- _r
Gila River Indian I Community
7tt
Legend
--+-+ Railroads
--- CAP Canal
Interstate Highway
U.S. I State Highways and Freeways
Local Roadway
Q North-South Corridor Study Area
SR 24 and US 60 Approved Alignment
#,###- Forecasted Daily Traffic Volumes
0 2.5 5 10 Miles I
N

Traffic Report North-South Corridor Study
October 2018 | 55
Figure 24. EIS Action Alternative 7 with E1b and E3a options, 2040 Study Area Performance
--,
Gila River Indian Community
Legend --+----+ Railroads
--- CAP Canal
Interstate Highway
U.S. I State Highways and Freeways
Local Roadway
Q North-South Corridor Study Area
Level-of-Service (LOS)
0 5 10 Miles I
N
A

Traffic Report North-South Corridor Study
56 | October 2018
4.8 EIS Action Alternative 7 with E1a and E3a options EIS Action Alternative 7 with E1a and E3a options was modeled by Evaluation Alternative C. The south terminal is located at I-10 just east of SR 87 and continues parallel to SR 87. The north terminal is located on US 60, east of Goldfield Rd. The SR 24 extension connects to the Corridor from the west along Ocotillo Rd. EIS Action Alternative 7 with E1a and E3a options is illustrated in Figure 25. The forecast 2040 volumes, v/c ratio, and LOS for selected RSR segments are summarized in Table 19.
Table 19. EIS Action Alternative 7 with E1a and E3a options 2040 RSR Segments Comparison
Corridor Location
2040 No-Action
2040 Alternative D
ADT ADT v/c LOS
North-South RSRs
Hunt Highway Arizona Farms Road to Franklin Road 37,308 30,998 > 1.0 LOS F
SR 79 Hunt Highway to Diversion Dam Road 26,289 27,703 0.77 LOS D
Ironwood - Gantzel Road Baseline Road to SR 24 26,752 19,027 0.95 LOS E
Schnepf Road Combs Road to Skyline Drive 14,160 11,045 > 1.0 LOS F
Attaway Road Hunt Highway to SR 287 25,593 19,360 0.96 LOS E
SR 87 (Arizona Boulevard) Vah Ki Inn Road to Martin Road 36,556 30,984 0.86 LOS E
Hunt Highway Belle Vista Road to Copper Mine Road 85,642 77,988 > 1.0 LOS F
East-West RSRs
Riggs - Combs Road Signal Butte Road to Schnept Road 32,466 30,805 > 1.0 LOS F
Skyline Drive Schnept Road to Quail Run Lane 13,685 12,354 > 1.0 LOS F
Bella Vista Road Gantzel Road to Quail Run Lane 10,648 15,842 > 1.0 LOS F
Arizona Farms Road Hunt Highway to Copper Basin RR 6,502 10,722 > 1.0 LOS F
Coolidge Avenue SR 87 to Attaway Road 6,276 4,646 0.46 LOS A-C
SR 287 Christenson Road to Attaway Road 41,435 32,752 0.91 LOS E
Selma highway Eleven Mile Corner Road to SR 87 483 1,228 0.12 LOS A-C
US 60 Perlalta Road to SR 79 24,799 23,236 0.65 LOS A-C
Ocotillo Road Rittenhouse Road to Ironwood Drive 31,152 29,351 > 1.0 LOS F
SR 287 Attaway Road to Valley Farms Road 24,182 20,308 > 1.0 LOS F
I-10 Sunshine Boulevard to SR 87 96,000 94,600 0.79 LOS D
The results of a performance evaluation at a study area-wide level are summarized in Table 20. Total VMT within the study limits will increase to 13,397,700 miles. The VHT forecast is 345,500 hours. The results show 174 miles of the 2040 network within the study limits will experience congestion as illustrated in Figure 26.
----

Traffic Report North-South Corridor Study
October 2018 | 57
Table 20. EIS Action Alternative 7 with E1a and E3a options, 2040 Study Area-wide and Corridor Performance
Total VMT
(daily) Total VHT
(daily)
Miles of Congested
Roads
Study Area-wide Performance
EIS Action Alternative 7 with E1a and E3a Options
13,397,700 345,500 174
2040 No-Action 12,626,500 372,800 185
Corridor Performance
EIS Action Alternative 7 with E1a and E3a Options
936,828 14,556 -

Traffic Report North-South Corridor Study
58 | October 2018
Figure 25. EIS Action Alternative 7 with E1a and E3a options, 2040 Daily Traffic Volumes
Gila River Indian II I Community
Legend
-+--+ Railroads
--- CAP Canal
Interstate Highway
U.S. I State Highways and Freeways
Local Roadway
Q North-South Corridor Study Area
SR 24 and US 60 Approved Alignment
# ,### Forecasted Daily Traffic Volumes
0 I
2.5 5 I
10 Miles I
N
A

Traffic Report North-South Corridor Study
October 2018 | 59
Figure 26. EIS Action Alternative 7 with E1a and E3a options, 2040 Study Area Performance
I Gila River Indian Community
1
- i -- <f)
Storey ~d
FlorencJ Blvd
Legend
-+--+ Railroads
--- CAP Canal
Interstate Highway
U.S./ State Highways and Freeways
Local Roadway
Q North-South Corridor Study Area
Level-of-Service (LOS)
0 2.5 5 10 Miles I
N
A

Traffic Report North-South Corridor Study
60 | October 2018
4.9 EIS Action Alternative 8 with E1b option EIS Action Alternative 8 with e1b was modeled by evaluation alternative F. The south terminal is located at I-10 just east of SR 87 and continues parallel to SR 87. The north terminal is located on US 60, east of Goldfield Road. The SR 24 extension connects to the Corridor from the west along Ocotillo Road.
EIS Action Alternative 8 with e1b is illustrated in Figure 27.
The forecast 2040 volumes, v/c ratio, and LOS for selected RSR segments are summarized in Table 21.
Table 21. EIS Action Alternative 8 with e1b, 2040 RSR Segments Comparison
Corridor Location
2040 No-Action
2040 Alternative D
ADT ADT v/c LOS
North-South RSRs
Hunt Highway Arizona Farms Road to Franklin Road 37,308 37,212 > 1.0 LOS F
SR 79 Hunt Highway to Diversion Dam Road 26,289 17,818 0.88 LOS D
Ironwood - Gantzel Road Baseline Road to SR 24 26,752 16,697 0.83 LOS D
Schnepf Road Combs Road to Skyline Drive 14,160 10,941 > 1.0 LOS F
Attaway Road Hunt Highway to SR 287 25,593 6,484 0.32 LOS A-C
SR 87 (Arizona Boulevard) Vah Ki Inn Road to Martin Road 36,556 29,737 0.83 LOS D
Hunt Highway Belle Vista Road to Copper Mine Road 85,642 76,281 > 1.0 LOS F
East-West RSRs
Riggs - Combs Road Signal Butte Road to Schnept Road 32,466 30,594 > 1.0 LOS F
Skyline Drive Schnept Road to Quail Run Lane 13,685 12,230 > 1.0 LOS F
Bella Vista Road Gantzel Road to Quail Run Lane 10,648 14,263 > 1.0 LOS F
Arizona Farms Road Hunt Highway to Copper Basin RR 6,502 7,495 0.75 LOS D
Coolidge Avenue SR 87 to Attaway Road 6,276 5,804 0.58 LOS A-C
SR 287 Christenson Road to Attaway Road 41,435 28,014 0.78 LOS D
Selma highway Eleven Mile Corner Road to SR 87 483 1,245 0.12 LOS A-C
US 60 Perlalta Road to SR 79 24,799 23,338 0.65 LOS A-C
Ocotillo Road Rittenhouse Road to Ironwood Drive 31,152 29,589 > 1.0 LOS F
SR 287 Attaway Road to Valley Farms Road 24,182 22,717 > 1.0 LOS F
I-10 Sunshine Boulevard to SR 87 96,000 94,100 0.78 LOS D
The results of a performance evaluation at a study area-wide level are summarized in Table 22. Total VMT within the study limits is forecasted to increase to 13,557,445 miles. The VHT forecast is 346,982 hours. The results show 165 miles of the 2040 network are forecasted to experience congestion as illustrated in Figure 28.
----

Traffic Report North-South Corridor Study
October 2018 | 61
Table 22. EIS Action Alternative 8 with e1b, 2040 Study Area-wide and Corridor Performance
Total VMT
(daily) Total VHT
(daily)
Miles of Congested
Roads
Study Area-wide Performance
EIS Action Alternative 8 with e1b
13,557,445 347,000 165
2040 No-Action 12,626,500 372,800 185
Corridor Performance
EIS Action Alternative 8 with e1b
1,209,042 19,173 -

Traffic Report North-South Corridor Study
62 | October 2018
Figure 27. EIS Action Alternative 8 with E1b option, 2040 Daily Traffic Volumes
Gila River Indian I Community
71;t
Legend
-+-+- Railroads
--- CAP Canal
Interstate Highway
U.S. / State Highways and Freeways
Local Roadway
Q North-South Corridor Study Area
SR 24 and US 60 Approved Alignment
# ,###- Forecasted Daily Traffic Volumes
0 I
2.5 5 I
10 Miles I
N
A

Traffic Report North-South Corridor Study
October 2018 | 63
Figure 28. EIS Action Alternative 8 with E1b option, 2040 Study Area Performance
I Gila River Indian Community
Legend
-+--+ Railroads
--- CAP Canal
Interstate Highway
U.S./ State Highways and Freeways
Local Roadway
Q North-South Corridor Study Area
Level-of-Service (LOS)
0 2.5 5 10 Miles I
N
A

Traffic Report North-South Corridor Study
64 | October 2018
5 Performance Summary The Study area-wide performance results for each of the action alternatives are summarized in Table 23 and Table 24. The study area was divided based on the segmentation shown in Figure 1. From there, each action alternative’s performance was interpolated based on the action alternative segments from the modeled results. The corridor would remove non-localized traffic from key roadways within the study area, resulting in lower congestion and decreased travel time as the Corridor provides a more direct route from I-10 to US 60 in Apache Junction.
The results show an increase in study area-wide VMT for each build alternative, compared to the 2040 No-Action scenario. The increase of the total VMT within the study area roadway network indicates an increase in attraction to the North-South Corridor.
In addition, a decrease of total VHT is anticipated with the construction of both the Corridor and the SR 24 extension. This decrease in VHT with the corridor indicates that travelers are more efficiently able to reach their desired destinations. The results also show that the Action Alternatives reduce the number of hours for which the study area is congested (LOS F).
Table 24 shows that EIS Action Alternative 3 has the fewest miles of study area congested roads.
Table 25 summarizes 2040 daily traffic volumes for each EIS Action Alternative, organized by screenlines.

Traffic Report North-South Corridor Study
October 2018 | 65
Table 23. Total Area-wide Traffic Performance Summary
Segment Area 1 Segment Area 2 Segment Area 3 Segment Area 4 Total
VMT
% Congested VMT
VHT % Congested
VHT VMT
% Congested VMT
VHT % Congested
VHT VMT
% Congested VMT
VHT % Congested
VHT VMT
% Congested VMT
VHT % Congested
VHT VMT
% Congested VMT
VHT % Congested
VHT
2040 No-Action 8,740,400 55% 291,300 73% 219,500 61% 7,200 61% 1,442,000 55% 40,900 61% 2,235,200 1% 33,800 1% 12,637,100
46% 373,200 65%
EIS Action Alt 11 9,436,000
- 9,477,400
42% - 44% 259,600
- 261,200
59% - 60% 287,400
– 290,000
46% - 47% 8,200
– 8,300
64% - 66% 1,575,800
– 1,578,100
27% 36,200
– 36,300
33% 2,345,000
– 2,345,100
1% 35,800 2% 13,644,200
– 13,690,600
33% - 35% 339,800
– 341,600
50% - 50%
EIS Action Alt. 22 9,281,800
- 9,295,000
43% 260,000
- 261,400
60% - 61% 198,600
– 198,900
61% - 65% 5,700 70% - 75% 1,626,200
– 1,645,200
30% - 32% 37,500
– 38,600
37% - 38% 2,320,100
– 2,338,600
1% 35,300
– 35,700
1% - 2% 13,426,700
– 13,477,700
34% - 35% 338,500
– 341,400
52%
EIS Action Alt. 33 9,281,800
- 9,295,000
43% 260,000
- 261,400
60% - 61% 198,600
– 198,900
61% - 65% 5,700 70% - 75% 1,585,500
– 1,645,200
30% - 36% 36,900
– 38,600
37% - 43% 2,303,700
– 2,303,900
1% 35,100 2% 13,369,600
– 13,443,000
35% 337,700
– 340,800
52% - 53%
EIS Action Alt. 44 9,436,000
- 9,477,400
42% - 44% 259,600
- 261,200
59% - 60% 287,400
– 290,000
46% - 47% 8,200
– 8,300
64% - 66% 1,575,800
– 1,578,100
27% 36,200
– 36,300
33% 2,334,200 1% 35,700 2% 13,633,400
– 13,679,700
34% - 35% 339,700
– 341,500
50% - 51%
EIS Action Alt. 55 9,344,000
- 9,473,800
48% 267,500
- 269,500
63% - 64% 297,100 37% 8,500 49% 1,457,200 27% 35,500 37% 2,345,000
– 2,345,100
1% 35,800 2% 13,443,300
– 13,573,200
38% 347,300
– 349,300
54% - 55%
EIS Action Alt. 66 9,344,000
- 9,473,800
48% 267,500
- 269,500
63% - 64% 174,700
– 174,900
74% 6,200 79% 1,585,500
– 1,645,200
30% - 36% 36,900
– 38,600
37% - 43% 2,320,100
– 2,338,600
1% 35,300
– 35,700
1% - 2% 13,424,300
– 13,632,500
39% 345,900
– 350,000
55%
EIS Action Alt. 77 9,344,000
- 9,360,800
48% - 49% 267,600
- 269,500
64% 174,700
– 174,900
74% 6,200 79% 1,585,500
– 1,586,300
36% 36,900 43% 2,303,700
– 2,303,900
1% 35,100 2% 13,407,900
– 13,425,900
39% 345,800
– 347,700
56%
EIS Action Alt. 88 9,477,400 48% 261,400 63% 174,900
– 297,100
37% - 74% 6,200
– 8,500
49% - 79% 1,457,200
– 1,585,500
27% - 36% 35,500
– 36,900
37% - 43% 2,303,900
– 2,334,200
1% 35,100
– 35,700
2% 13,413,400
– 13,694,200
38% 338,200
– 342,500
54% - 55%
Table 24. Total Area-Wide Miles of Congested Roads
2040 No-Action EIS Action Alt.11 EIS Action Alt. 22 EIS Action Alt. 33 EIS Action Alt. 44 EIS Action Alt. 55 EIS Action Alt. 66 EIS Action Alt. 77 EIS Action Alt. 88
Segment Area 1 142.0 123.8 - 124.8 123.8 - 125 123.8 - 125 123.8 - 125 136.4 - 141.1 136.4 - 141.1 136.4 - 138.3 136.4 - 141.1
Segment Area 2 - - - - - - - - -
Segment Area 3 36.2 20.4 24.0 – 26.3 24.0 – 27.6 20.4 18.8 24.0 – 27.6 27.6 18.8 – 27.6
Segment Area 4 1.6 2.4 1.8 2.4 2.4 2.4 1.8 2.4 2.4
Total 184.8 152.5 – 153.5 155.5 – 159.8 156.1 – 161.7 152.5 – 153.7 160.5 – 165.2 168.1 – 176.4 172.3 – 174.2 160.5 – 177.0
Notes: #. Cells with a single value indicates no distinguishable range of performance criteria 1. Min-max of modeled Alternative A and D 2. Min-max of modeled Alternative E and E2

Traffic Report North-South Corridor Study
66 | October 2018
Notes, continued: 3. Segment Area 1: Derived from the min-max of the modeled Alternative E, E2; Segment Area 2: Derived from the min-max of modeled Alternative E, E2; Segment Area 3: Derived from the min-max of modeled Alternative E, E2, C, B; Segment Area 4: Derived from the min-max of modeled Alternative B, C 4. Segment Area 1: Derived from the min-max of modeled Alternative A, D; Segment Area 2: Derived from the min-max of modeled Alternative A, D; Segment Area 3: Derived from the min-max of modeled Alternative A, D; Segment Area 4: Derived from the min-max of modeled Alternative F 5. Segment Area 1: Derived from the min-max of modeled Alternative C, B, F; Segment Area 2: Derived from the min-max of modeled Alternative F; Segment Area 3: Derived from the min-max of modeled Alternative F; Segment Area 4: Derived from the min-max of modeled Alternative A, D 6. Segment Area 1: Derived from the min-max of modeled Alternative C, B, F; Segment Area 2: Derived from the min-max of modeled Alternative C, B; Segment Area 3: Derived from the min-max of modeled Alternative E, E2, C, B; Segment Area 4: Derived from the min-max of modeled Alternative E, E2 7. Min-max of modeled Alternative C and B 8. Min-max of modeled Alternative C and F
Table 25. Corridor Performance Comparison with Alternatives
Vehicles Per Day (VPD)
EIS Action Alt.11 EIS Action Alt. 22 EIS Action Alt. 33 EIS Action Alt. 44 EIS Action Alt. 55 EIS Action Alt. 66 EIS Action Alt. 77 EIS Action Alt. 88
Seg
me
nt 1
US-60 to Elliot Road 42,800 - 45,000 44,000 - 44,400 44,000 - 44,400 42,800 - 45,000 25,200 - 30,000 25,200 - 30,000 25,200 - 28,300 25,200 - 30,000
Elliot Road to SR-24 39,000 - 49,400 46,800 - 47,700 46,800 - 47,700 39,000 - 49,400 18,000 - 25,400 18,000 - 25,400 18,000 - 23,400 18,000 - 25,400
SR-24 to Ocotillo Road 69,200 - 70,900 64,200 - 65,900 64,200 - 65,900 69,200 - 70,900 18,000 - 47,200 18,000 - 47,200 18,000 - 42,700 18,000 - 47,200
Ocotillo Road to Riggs/Combs 54,1001 46,800 - 48,500 48,500 - 46,800 54,1001 38,200 - 41,900 37,000 - 41,900 37,000 - 38,200 37,000 - 41,900
Riggs/Combs to Skyline Drive 58,300 - 59,100 48,400 - 50,200 48,400 - 50,200 58,300 - 59,100 37,300 - 42,100 36,700 - 42,100 36,700 - 37,300 36,700 - 42,100
Skyline Drive to Bella Vista Road 60,800 - 61,100 49,800 - 51,800 49,800 - 51,800 60,800 - 61,100 38,500 - 44,400 38,000 - 44,400 38,000 - 38,500 38,000 - 44,400
Bella Vista Road to Arizona Farms Road 50,400 - 50,700 29,600 - 31,300 29,600 - 31,300 50,400 - 50,700 25,300 - 31,800 25,300 - 31,800 25,300# 25,300 - 31,800
Seg
me
nt 2
Arizona Farms Road to Hunt Highway 39,800 - 40,000 29,600 - 31,300 29,600 - 31,300 39,800 - 40,000 31,8002 25,300# 25,300# 31,8005
Seg
me
nt 3
Hunt Highway to SR-287 39,600 - 39,900 18,600 - 19,900 15,100 - 19,900 39,600 - 39,900 38,8002 15,100 - 19,900 15,100# 38,8005
SR-287 to Bartlett Road (Martin Road) 21,900# 17,800 - 21,400 15,700 - 21,400 21,900# 19,2002 15,700 - 21,400 15,700# 19,200
Seg
me
nt 4
Bartlett Road (Martin Road) to Kleck Road 20,000# 18,600 - 21,800 16,100 - 21,800 20,000# 18,5002 16,100 - 21,800 16,100# 18,500
Kleck Road to Steele Road 19,200# 17,700 - 19,800 15,200# 17,600# 19,2001 17,700 - 19,800 15,200# 17,600
Steele Road to Selma Highway 9,900# 9,100 - 9,900 6,600# 8,100# 9,9001 9,100 - 9,800 6,600# 8,100
Selma Highway to Hanna Road 12,000 - 12,100 11,900 - 12,600 6,400# 7,500# 12,000 - 12,100 11,900 - 12,600 6,400# 7,500
Hanna Road to Houser Road 5,300# 10,500 - 11,300 5,500# 6,700# 5,300 - 11,100 10,500 - 11,300 5,500# 6,700
Houser Road to I-10 4,900 - 5,000 3,900 - 4,600 2,500# 3,900# 4,900 - 5,000 3,900 - 4,600 2,500# 3,900
Notes: #. No distinguishable range of values. 1. Min-max of modeled Alternative A and D 2. Min-max of modeled Alternative E and E2 3. Segment Area 1: Derived from the min-max of the modeled Alternative E, E2; Segment Area 2: Derived from the min-max of modeled Alternative E, E2; Segment Area 3: Derived from the min-max of modeled Alternative E, E2, C, B; Segment Area 4: Derived from the min-max of modeled Alternative B, C 4. Segment Area 1: Derived from the min-max of modeled Alternative A, D; Segment Area 2: Derived from the min-max of modeled Alternative A, D; Segment Area 3: Derived from the min-max of modeled Alternative A, D; Segment Area 4: Derived from the min-max of modeled Alternative F 5. Segment Area 1: Derived from the min-max of modeled Alternative C, B, F; Segment Area 2: Derived from the min-max of modeled Alternative F; Segment Area 3: Derived from the min-max of modeled Alternative F; Segment Area 4: Derived from the min-max of modeled Alternative A, D 6. Segment Area 1: Derived from the min-max of modeled Alternative C, B, F; Segment Area 2: Derived from the min-max of modeled Alternative C, B; Segment Area 3: Derived from the min-max of modeled Alternative E, E2, C, B; Segment Area 4: Derived from the min-max of modeled Alternative E, E2 7. Min-max of modeled Alternative C and B 8. Min-max of modeled Alternative C and F

Traffic Report North-South Corridor Study
October 2018 | 67
Travel from I-10 near Eloy to the East Valley of the Phoenix metropolitan area requires use of a fragmented set of roads and highways. Typically, the common route (in the northbound direction) would include:
SR 287
SR 79
SR 87
Hunt Highway
Bella Vista Road
Gantzel Road
Ironwood Road
The Corridor would provide a more direct route that facilitates travel during 2040 conditions. As summarized in Table 26, the travel time during existing conditions is just over 1 hour (65 minutes). The travel time is forecasted to increase to 100 minutes in the 2040 No-Action conditions. Each of the EIS Action Alternatives reduces 2040 travel time, as the route is more direct and no longer fragmented.
The results show that EIS Action 1 (with w1a and w1b) provide the largest travel time savings. EIS Action Alternative 2 and 7 provide the longest travel times, largely due to out of direction travel in the Florence area.
Table 26. North-South Corridor Travel Time Comparison
EIS Action Alternative
Model Evaluation Alternative Current (2018)
Average Travel (minutes),
Eloy to Apache Junction
2040 Average Travel Time (minutes)
Eloy to Apache Junction
2040 Travel Time Savings Eloy to Apache
Junction
Existing* - 65 - -
2040 No-Action - - 100 -
EIS Action Alt. 1 with W1a option
A - 56 44
EIS Action Alt. 1 with W1b option
D - 54 46
EIS Action Alt. 2 with W1a and E3a options
E - 59 40
EIS Action Alt. 2 with W1a and E3b options
E2 - 57 42
EIS Action Alt. 3 Similar to Alt 2, Model Alt. E, E2
- 57-59 40-42
EIS Action Alt. 4 Similar to Alt 1, Model Alt. A, D - 54-56 44-46
EIS Action Alt. 5 Similar to Alt 8, Model Alt. F - 56 43
EIS Action Alt. 6 Similar to Alt 7, Model Alt. B - 59 40-41
EIS Action Alt. 7 with E1b and E3a
B - 59 40
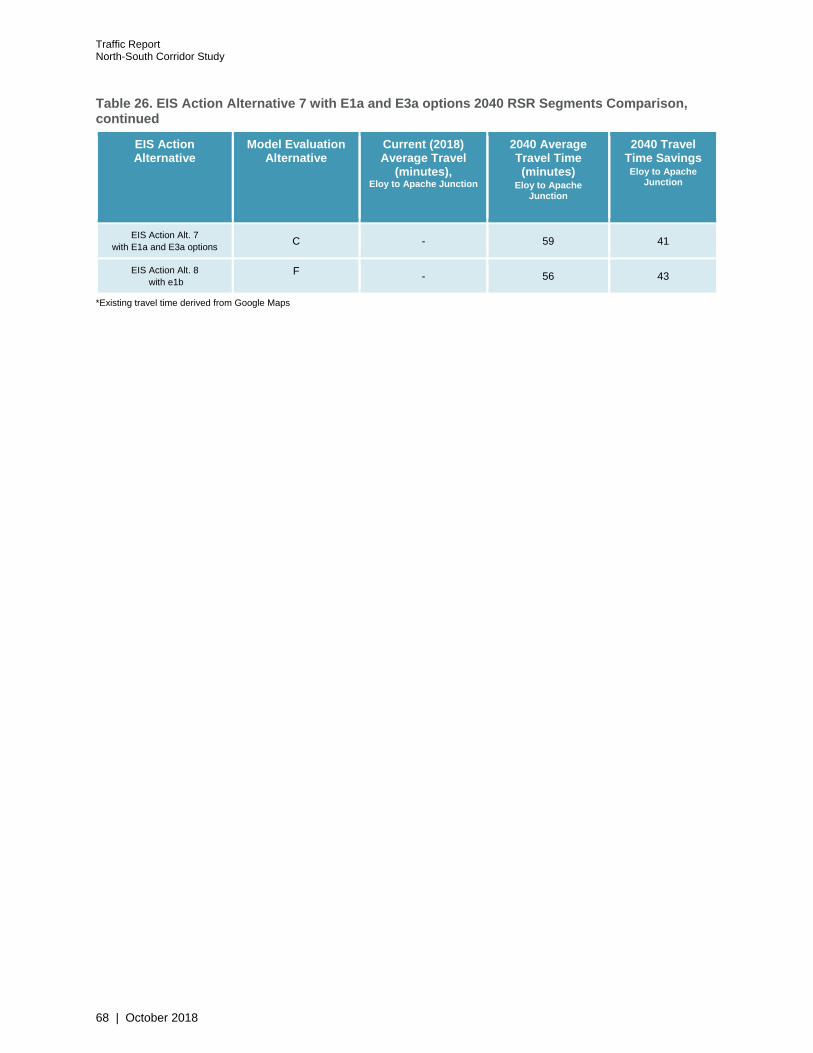
Traffic Report North-South Corridor Study
68 | October 2018
Table 26. EIS Action Alternative 7 with E1a and E3a options 2040 RSR Segments Comparison, continued
EIS Action Alternative
Model Evaluation Alternative
Current (2018) Average Travel
(minutes), Eloy to Apache Junction
2040 Average Travel Time (minutes)
Eloy to Apache Junction
2040 Travel Time Savings Eloy to Apache
Junction
EIS Action Alt. 7 with E1a and E3a options
C - 59 41
EIS Action Alt. 8 with e1b
F - 56 43
*Existing travel time derived from Google Maps

Traffic Report North-South Corridor Study
Appendix A – Action Alternatives

Traffic Report North-South Corridor Study
This page is intentionally left blank.

Traffic Report North-South Corridor Study
Figure A-1. Alternative 1
Mesa Untve~kyAve Broadway Rd
.s r '§ AP.ache
Junction
W1o
G■rmann Rd • w,. ~ W1b
• Queen Creek Pima Rd
OcoUllo Rd
• Ch,ndlar Holgrits Rd ~ a:
Riggs Rd t Empire Blvd 3
ffi ~ Skyllnt Dr San Tan•• -<>
Valley San Tan
Mountains Judd Rd
Gila River Indian Community
... a:
C
"' "'
• • • • • • • • •
•
W1•
(
• • • • • • •
• • • : Florence KeMn Hwy
• • • • BartlottRd
• S05JT1ant JI l::ma..-n11 .. .---m l---'•E;;,;;;,;;;;~11r·""'•••-"' - ,,_,,,_,.,_..,_,,._,,.seg;:;'e~i~
Casa Grande Solnat_hry
11an.guaor
Harmon Rd
• <If,. ~.,..~.,,.
Arizona City
" a: .5
~ " ... :,: C ~ l 1 ~
• • • • • • •
• • ~ . iii •
ll •• ~ . j •• • • • • • •• • •
•• ••• ••
ill
• • • • • • • • • • • • • • • • • • • • • • • • • • • • • • • Red Rock • •
••• •••
Marana
fill
. ............. .
: @l .isa ~ 1t10.
~ ·• ... ....
Action Alternative 1
- Eastern Alternative
Im
Tu e-son
Eastern Alternative Options
Western Alternative
Western Alternative Options
SR 24 and US 60 approved alignment
Segment lines
• • • • • North-South Corridor • • • • study area
DATA SOURCE : AOWR, p.,,i Counly, E!irf WOr1dE1ievauon/Tertairt
I 0
I I I 2 4 6
Miles
I 8
A DOT

Traffic Report North-South Corridor Study
Figure A-2. Alternative 2
Mesa Untve~kyAve Broadway Rd
Q ,,,., '§ AP.ache
Junction
W1o
G■rmann Rd • WII
~ W1b
• Queen Creek P1m1 Rd
OcoUllo Rd
• Ch,ndlar Holgllts Rd ~
Rigg$ Rd
EmpboBlvd
Skyline Dr
San Tan Mountains
a:
i ~ San Tan•• ""
Valley
Judd Rd
Gila River Indian Community
• ... • "' • i • • = • "' "' • • •
•
W1•
• 1::i:e. .... ...,.1,,--m --lllE•~~=III"
Casa Grande •
BalUgllolOr
Arizona City
" a:
5 ~ ... :,: = Harmon Rd ~ i 1 ~
• • • • • •
• • ? • iii • l! •• ~ . j ••
E3c
""'
• • •
... .,.
• • •• • • •• •••
••
• • • • • • •
• • • : Florence KeMn Hwy
• • • •
ill
• • • • • • • • • • • • • • • • • • • • • • • • • • • • • • •
BartloURd
Red Rock • • ••• •••
Marana
fill
. ............. .
: @l .isa ~ 1t10.
~ ·• ... ....
Action Alternative 2
- Eastern Alternative
Im
Tu e-son
Eastern Alternative Options
Western Alternative
Western Alternative Options
SR 24 and US 60 approved alignment
Segment lines
• • • • • North-South Corridor • • • • study area
DATA SOURCE: ADWR, p.,., Counly, E!irf WOr1dE1ievauon/Tertairt
I 0
I I I 2 4 6
Miles
I 8
A DOT

Traffic Report North-South Corridor Study
Figure A-3. Alternative 3
Mesa Unlver5ky Ave Bro.1dwaiRd
Q r. ! AP.ache
""nction
G11mann Rd • •
W1o
e W1■
•
~ W1b
• Queen Creek Pima Rd
OcoUllo Rd
• Ch,1ndlor Holghls Rd ~ "' . Rig91 Rd 1i! • I ••• EmplreBl•d iii •
Skylln• Dr San Tan••
San Tan Mountains
Valley
Judd Rd
Gila River Indian Community
~
1 ~ ~
Battogll,1 Dr
... "' C
ci ,. 3 .,. ,:
Harmon Rd .:. ; j ~
• • • • • • • •
... ~ m . ~
l
• • • ••
W1a
Wlb
• • • • • • • • •• • • • ·• ..
••
• • • • • • •
• • • • • • • : Florence K!llvln Hwy
• • • •
• • • • • • • • • • • • • • • • • • • • • • • • • • • • • • •
Barlloll Rd
Red Rock ~
••• ••• • • ••••
Marana
Pecsl;a
•······ .. 10
. . . sa ~ Mdll fill
"
Action Alternative 3
Eastern Alternative
rm
Tucson
Eastern Alternative Options
Western Alternative
Western Alternative Options
SR 24 and US 60 approved alignment
Segment lines
• • • • • North-South Corridor • • • • study area
DATA SOURCE: AfJWR, Pinal County, E,ri WorldElevabonfTerrain
I 0
I I I 2 4 6
Miles
I 8
/.\DOT
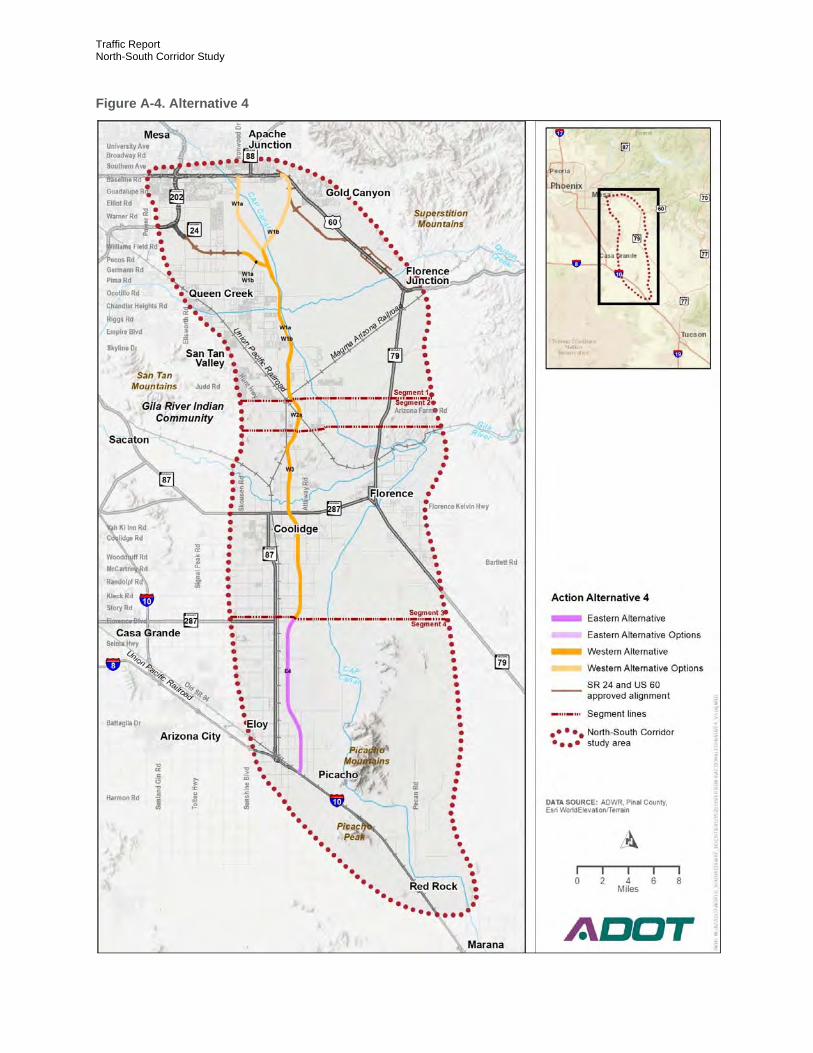
Traffic Report North-South Corridor Study
Figure A-4. Alternative 4
Mesa Untve~kyAve Broadway Rd
.s r '8 AP.ache ; "'nction
W1o
G■rmann Rd • w,. Pima Rd
OcoUllo Rd
~ W1b
• Queen Creek • Ch,ndlar Holgrits Rd ~ a: •
Riggs Rd i! • Empire Blvd ~ ..
ffi •• ":.~ San Tan•• -<>
Skyllnt Dr
San Tan Mountains
Valley
Judd Rd
Gila River Indian Community
... a:
C
"' "'
• • • • • • • • •
•
W l b
W1•
Wlb
(
• • • • • • •
• • • : Florence KeMn Hwy
• • • • BartlottRd
• S05JT1ant JI l::ms..-n11 .. .---m 1---'•E ===llf '"""'•••-"'- ,,_,,,_,,,_..,_,,._"'seg;:;'e~i~
Casa Grande Solnat_hry
Ba!UgltaDr
Harmon Rd
• <If,. ~.,..~.,,.
Arizona City
" a: .5
~ " ... :,: C ~ l 1 ~
• • • • • • •
• • ~ . iii •
ll •• ~ . j •• • • • • • •• • •
•• ••• ••
ill
• • • • • • • • • • • • • • • • • • • • • • • • • • • • • • • Red Rock • •
••• •••
Marana
fill
. .. ........... .
: @l .isa ~ 1t10.
~ ·• ... .. ..
Action Alternative 4
- Eastern Alternative
Im
Tu e-son
Eastern Alternative Options
Western Alternative
Western Alternative Options
SR 24 and US 60 approved alignment
Segment lines
• • • • • North-South Corridor • • • • study area
DATA SOURCE : AOWR, p.,., Counly, E!irf WOr1dE1ievauon/Tertairt
I 0
I I I 2 4 6
Miles
I 8
A DOT

Traffic Report North-South Corridor Study
Figure A-5. Alternative 5
Mesa Untve~kyAve Broadway Rd
Pima Rd
~ Queen Creek OcoUllo Rd
• Ch,ndlar Holgrits Rd ~ a:
Riggs Rd t Empire Blvd 3
ffi ~ Skyllnt Dr San Tan•• -<>
Valley San Tan
Mountains Judd Rd
Gila River Indian Community
... a:
C
"' "'
• • • • • • • • • (
• • • • • • •
• • • : Florence KeMn Hwy
• • • • BartlottRd
• S05JT1ant JI l::ma..-n11 .. .---m l---'•E;;,;;;,;;;;~11r·""'•••-"' - ,,_,,,_,.,_..,_,,._,,.seg;:;'e~i~
Casa Grande Solnat_hry
Ba!Ugll•Dr
Harmon Rd
• <If,. ~.,..~.,,.
Arizona City
" a: .5
~ " ... :,: C ~ l 1 ~
• • • • • • •
• • ~ . iii •
ll •• ~ . j •• • • • • • •• • •
•• ••• ••
ill
• • • • • • • • • • • • • • • • • • • • • • • • • • • • • • • Red Rock • •
••• •••
Marana
fill
... ............
: @l .isa ~ 1t10.
~ ·• ... ....
Action Alternative 5
- Eastern Alternative
Im
Tue-son
Eastern Alternative Options
Western Alternative
Western Alternative Options
SR 24 and US 60 approved alignment
Segment lines
• • • • • North-South Corridor • • • • study area
DATA SOURCE : AOWR, p.,,i Counly, E!irf WOr1dE1ievauon/Tertairt
I 0
I I I 2 4 6
Miles
I 8
A DOT

Traffic Report North-South Corridor Study
Figure A-6. Alternative 6
Mesa Untve~kyAve Broadway Rd
Ela
Elb
P1m1 Rd
~ Queen Creek OcoUllo Rd
• Ch,ndlar Holgllts Rd ~ a:
i ~ Rigg$ Rd
EmpboBlvd
Skyline Dr San Tan•• ""
Valley San Tan
Mountains Judd Rd
Gila River Indian Community
... "' i = "' "'
• • • • • • • • • • 1::i:e. .... ...,.1,,--m --lllE•~~=III"
Casa Grande •
BalUgllolDr
Arizona City
" a:
5 ~ ... :,: = Harmon Rd
~ i 1 ~
• • • • • •
• • ? • iii • l! •• ~ . j ••
Ela
E3c
""'
• • •
... .,.
• • •• • • •• •••
••
• • • • • • •
• • • : Florence KeMn Hwy
• • • •
ill
• • • • • • • • • • • • • • • • • • • • • • • • • • • • • • •
BartloURd
Red Rock • • ••• •••
Marana
fill
...............
: @l .isa ~ 1t10.
~ ·• ... ....
Action Alternative 6
- Eastern Alternative
Im
Tu e-son
Eastern Alternative Options
Western Alternative
Western Alternative Options
SR 24 and US 60 approved alignment
Segment lines
• • • • • North-South Corridor • • • • study area
DATA SOURCE : AOWR, p.,., Counly, E!irf WOr1dE1ievauon/Tertairt
I 0
I I I 2 4 6
Miles
I 8
A DOT

Traffic Report North-South Corridor Study
Figure A-7. Alternative 7
Mesa Untve~kyAve Broadway Rd
Pima Rd
~ Queen Creek OcoUllo Rd
• Ch,ndlar Holgrits Rd ~ a:
Riggs Rd t Empire Blvd 3
Skyllnt Dr
San Tan Mountains
ffi ~ San Tan•• -<>
Valley
Judd Rd
Gila River Indian Community
• • • • • • •
• • • : Florence KeMn Hwy
... a:
C
"' "'
• • • • • • • • • E3c
""'
... E3b
• • • •
• S05JT1ant JI b,.-...ei .... --~ l- _..~;;,;;;,;~11"'"" ••• - "' - ,,_ ,,,_ ,,,_ ..,_ ,,._ ... _ ,,,_ ,,, ,..
~ • segment4 • Casa Grande • •
Solnat_hry : :
Ba!Ugll•Dr
Harmon Rd
• • • • 0.f,. • ~.,..~.,,.
Arizona City
" a: .5
~ " ... :,: C ~ l 1 ~
• • ~ . iii •
ll •• ~ . j •• • • • • • •• • •
ill
• • • • • • • • • • • • • • • • • • • • • • • • • • •• •••
• • ••
Red Rock
••• •••
• •
BartlottRd
Marana
fill
... ............
: @l .isa ~ 1t10.
~ ·• ... ....
Action Alternative 7
- Eastern Alternative
Im
Tue-son
Eastern Alternative Options
Western Alternative
Western Alternative Options
SR 24 and US 60 approved alignment
Segment lines
• • • • • North-South Corridor • • • • study area
DATA SOURCE : AOWR, p.,,i Counly, E!irf WOr1dE1ievauon/Tertairt
I 0
I I I 2 4 6
Miles
I 8
A DOT

Traffic Report North-South Corridor Study
Figure A-8. Alternative 8
Mesa Untve~kyAve Broadway Rd
• Pima Rd
OcoUllo Rd ~ Queen Creek Ch,ndlar Holgrits Rd
Riggs Rd
Empire Blvd
Skyllnt Dr
San Tan Mountains
• a: i! ~ . ,!! •
m • San Tan•
Valley
Judd Rd
Gila River Indian Community
C
"' "'
• • • • • • • • • (
• • • • • • •
• • • : Florence KeMn Hwy
• • • • BartlottRd
• S05JT1ant JI l::ms..-n11 .. .---m 1---'•E ===llf '"""'•••-"'- ,,_,,,_,,,_..,_,,._"'seg;:;'e~i~
Casa Grande Solnat_hry
Ba!Ugll•Dr
Harmon Rd
• <If,. ~.,..~.,,.
Arizona City
" a: .5
~ " ... :,: C ~ l 1 ~
• • • • • • •
• • ~ . iii •
ll •• ~ . j •• • • • • • •• • •
•• ••• ••
ill
• • • • • • • • • • • • • • • • • • • • • • • • • • • • • • • Red Rock • •
••• •••
Marana
fill
... ............
: @l .isa ~ 1t10.
~ ·• ... .. ..
Action Alternative 8
- Eastern Alternative
Im
Tu e-son
Eastern Alternative Options
Western Alternative
Western Alternative Options
SR 24 and US 60 approved alignment
Segment lines
• • • • • North-South Corridor • • • • study area
DATA SOURCE : AOWR, p.,,i Counly, E!irf WOr1dE1ievauon/Tertairt
I 0
I I I 2 4 6
Miles
I 8
A DOT