Download - All inone financial mgt

WELCOME TO THE COURSE ON FINANCIAL MANAGEMENT
BY T.VENKATARAMANAN.FICWA.FCS.
1

Your syllabus
Financial statements –nature,limitations,analysis and tools&techiniques
Ratio analysis Cash and fund flow statements. Theory and plg. Of working capital-working
capital financing
2
Syllabus –continued.
Cash management Inventory management Receivables management Time value of money. Capital BUDGETING Cost of capital.
3

Rules of the game
There is no gain with out pain. Use it or lose it Many heads are better than one.Relie on group
discussions. The lecturer is only facilitator of the groups and
not a teacher, only a guide and a coordinator ,aid and not an assistant ,rendering a service and not selling a product.
4

INTRODUCTION
THE TERM FINANCIAL STATEMENTS STANDS FOR THE BALANCE SHEET THE INCOME STATEMENT / THE PROFIT AND LOSS A/C AND THE CASH FLOW STATEMENTS
5

THE BALANCE SHEET
WHAT IT IS? BRIEFLY STATED IT IS A STATEMENT OF
ASSETS AND LIABILITIES OF A BUSINESS ORGANISATION ON A GIVEN
POINT OF TIME IT IS A SNAP SHOT OF THE FINANCIAL
POSITION OF AN ORGANISATION
6
ASSETS WHAT ARE THEY ? THEY ARE THE RIGHTS AND PROPERTIES
OWNED BY THE BUSINESS. IT REFERS TO THE RESOURCES ACQUIRED
BY THE BUSINESS THROUGH THE FUNDS PROVIDED BY THE SHARE HOLDERS AND THE CREDITORS
IT APPEARS ON THE RIGHT HAND SIDE OF THE BALANCESHEET.
7

LIABILITIES
LIABILITIES REFER TO THE CLAIMS AGAINST THE COMPANY INCLUDING THAT OF THE SHARE HOLDERS AND OUTSIDERS.
IT IS WHAT THE COMPANY OWES TO SHARE HOLDERS AND CREDITORS.
IT APPEARS ON THE LEFTHAND SIDE OF THE BALANCE SHEET.
8

Classification of assets Assets are classified into Fixed assets-like land, building ,plant &machinery
etc.These are not meant for resale and intended for long term use.
Current assets are those which are acquired for resale – finished goods
Or for conversion and resale-raw materials And others like sundry debtors,bills,cash and bank
balances In short current asset means cash and other resources
easily convertible into cash consumed in the normal operating cycle of business.
9

Classification of liabilities
Long term liabilities-Also known as fixed liabilities; which do not become due for payment in one year and which do not involve current assets for their payment, includes share capital and long term debts.
Current liabilities are what the company owes to outsiders and which may become payable with in one year out of the sale of current assets, example: accounts payable, sundry creditors, etc.
10

Income statement or profit&loss account Depending upon the type of the organisation ,
inorder to ascertain the financial out come,periodically or as and when required , a statement of income and expenditure , or receipt and payment a/c or manufacturing, trading , and profit and loss a/c is prepared.
11

Funds & Fund flow statement
The international accounting std. no.7 recognises the absence of a single, generally accepted definition of fund. According to the standard , the term fund generally refers to cash cash equivalents or working capital.
There are two concepts of working capital –the gross concept and the net concept. The term funds are generally used in the latter sense.
12

Fund flow stt.continued
Fund flow statements can be prepared from balance sheet as total resource basis and may be prepared on amplified basis.
Fund flow statement on working capital basis presents1)sources of working capital 2)uses of working capital and 3) the net changes in working capital or “as a statement showing the changes in working capital”
13

Cash flow statement
Cash flow statement which is also known as “wgwgs”-where got where gone statement depicts the flow of cash in an organisation from different activities and used for various purposes.
In India the cash flow statement of listed companies will have to be prepared as per the indirect method prescribed in AS-3.
14
FINANCIAL MANAGEMENTMODULE-IIRatio analysis
15

MEANING OF FINANCIAL ANALYSIS FINANCIAL ANALYSIS LITERALLY MEANS
BREAKING THE VARIOUS STATEMENTS INTO SMALLER MANAGEABLE INDEPENDENT PARTS FOR THE PURPOSE OF EXAMINING THE DATA WITH A VIEW TO ASSESS THE PROFITABILITY, SOLVENCY, LIQUIDITY,VIABILITY AND STABILITY OF A BUSINESS ENTITY.
16

Ratios :Definition
What is a ratio? Ratio is an indicated quotient of two
mathematical expressions. It is a number which expresses the relationship
between two or more things. A financial ratio is a number which expresses
the relationship between two financial figures It can be a % or a decimal or a fraction also.
17
Who uses?
Share holders. Creditors. Investors. Financial institutions. Bankers. Investigators and researchers.
18

What are the five major categories of ratios?What questions do they answer?
Liquidity: Are we in a position to make required payments in time in the current period?
Asset management: Right amount of assets vs sales. Debt management: Right mix of debt and equity. Profitability:do sales price exceed cost of sales and
sales high enough as reflected in PM, ROE, and ROA ? MARKET VALUES: Do investors like what they see as
reflected in P/E, and M/B ratios ?
19

Classification of ratios
1)Traditional classification : A) Profit & Loss a/c Ratios
B ) Balance Sheet Ratios
C) Composite ratios
20

Groups of ratios.Functional point of view Liquidity ratios Solvency ratios Profitability ratios Turn over ratios Capital structure or stability ratios Coverage ratios
21

Liquidity Ratios/profitability ratios Current ratio = current assets / current
liabilities Acid test ratio = Liquid assets / current
liabilities Gross profit to sales Net profit to sales Return on assets = net profit after tax/ total
assets Return on capital employed= NPAIT/ Total
capital employed
22

Solvency & turn over ratios
solvency ratio = debt equity ratios = long term debt/ shareholders equity Capital gearing ratio = fixed interest bearing
capital/ shareholders funds Turn over ratios Inventory turn over ratio= cost of goods sold
/average inventory Debtors turn over ratio = net credit sales /
average debtors
23

Coverage ratios
Interest cover = E BI&T/ INTEREST DIVIDEND COVER = E AT/dividend on
preference shares. Total coverage = EBI& T/TOTAL FIXED
CHARGES
24

Yard sticks: Ratios express only positions , to assess
whether it is good, bad , or in between require some yardsticks or benchmarks.
Some bench marks which are commonly used are i) absolute standards –common to all entities ii) historical standards-past-best applicable to that unit iii) horizontal standards- best of comparable entities. iv) budgetary standards based on ideal working conditions,based on budgets
25

ILLUSTRATION -I
FOLLOWING IS THE BALANCE SHEET AND PROFIT AND LOSS ACCOUNT OF ABC.LTD.COMPUTE ABOVE RATIOS .
26

BALANCE SHEET AS AT 31/03/2007OF ABC.LTD
LIABILITIES.RS LAKHS SHARE CAP
1350 RESERVES& SURPLUS 1000 SEC-LOAN
500 S.CRS. 300 PRO.DIVIDEND 150 Total 3300
ASSETS LAND 100 BUILDINGS 650 PLANT&M/C 1100 OTHERS 200 CURRENT ASSETS INVENTORY 510 S.DRS. 540 CASH 200 TOTAL 3300
27

TRADING ACCOUNT
TO,OP.STOCK360
TO, PUR 1750 TO,GROSS P/L
900 TOTAL 3010
BY,SALES 2700
CLOSING STK 310
TOTAL 3010
28

PROFIT AND LOSS ACCOUNT
TO,ESTT.EXP 90 TO,ADMN EXP 270 TO,SELLING EXP 100 TO,INT –DEB 70 TO,INCOME TAX 90 TO,NET PROFIT 280 TOTAL 900
BY,GP 900
TOTAL 900
29

Profit &LOSS APPROPRIATION ACCOUNT
PRO.DVD 150 BALANCEC/D 350 TOTAL 500
BY,N.P.B/D 280 PROFIT.P.Y 220 TOTAL 500
30

Illustration -ii From the following data pertaining to xyz ltd.,
draw up the companies balance sheet: 1)current ratio: 2.5 2)liquid ratio 1.5 3) net working capital Rs 3,00,000 4)cost of sales /closing stock=6 5) G.P.ratio= 20 % 6)FA/TO=2 based on cost of sales. 7)average debt collection period 2 months
8)FA/SHAREHOLDERS FUNDS=0.80 9)Reserves and Surpluses/eq=0.50 10)B.R & B.P. Rs 100,000. EACH
31
THE TOOLS AND TECHNIQUES THE TOOLS AND TECHNIQUES OF
ANALYSIS FALL UNDER THE FOLLOWING CATEGORIES:
A)VERTICAL ANALYSIS B)HORIZONTAL ANALYSIS C)BALANCE SHEET ANALYSIS D)P&L ANALYSIS E)COMPOSITE DATA ANALYSIS
32

TOOLS CONTINUED
F)COMPARATIVE BALANCE SHEETS G)COMMON SIZE BALANCE SHEETS H)RATIOS
33

THE PROCEDURE NORMALLY STARTS WITH A STUDY OF
RELATIONSHIP AMONG VARIOUS FINANCIAL FACTORS IN A SINGLE SET OF STATEMENTS AND A STUDY OF THE TREND OF THESE FACTORSAS SHOWN IN A SERIES OF STATEMENTS.
IT INVOLVES A PROCESS OF SELECTION OF FIGURES ,STUDY OF THEIR RELATIONSHIP AND EVALUATION
34

COMPARATIVE BALANCE SHEET
BHEL 2006 SHARE CAP
24476 RES&SUR
705662 SEC LOAN 50000 UNSEC-L
5824 TOTAL 785962
BHEL 2005 SHARE CAP
24476 RESER 578213 SEC LOAN
50000 UNSEC-L
3698 TOTAL
656387
35
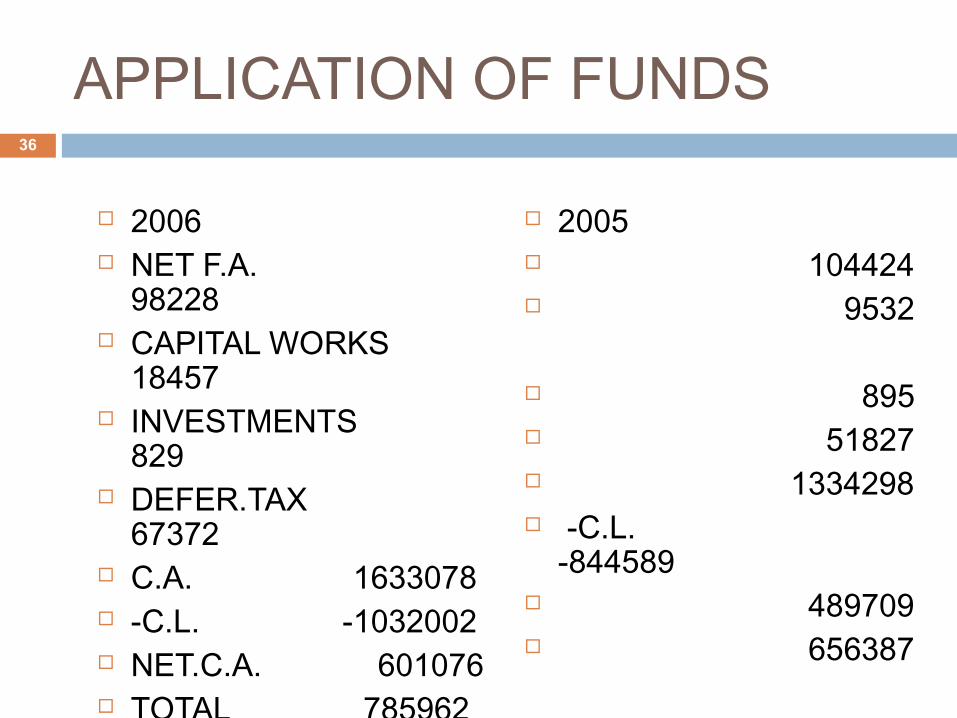
APPLICATION OF FUNDS
2006 NET F.A.
98228 CAPITAL WORKS
18457 INVESTMENTS
829 DEFER.TAX
67372 C.A. 1633078 -C.L. -1032002 NET.C.A. 601076 TOTAL 785962
2005 104424 9532
895 51827 1334298 -C.L.
-844589 489709 656387
36

COMMONSIZE BALANCE SHEETS INSTEAD OF ABSOLUTE
FIGURES,REDUCE THE CONSTITUENTS INTO %S TAKING THE TOTAL AS 100
THE PREVIOUS SLIDE FIGURES WILL APPEAR AS UNDER:
YEAR 2005 2006 SHARE+RES 88.5% 93% LOANFUNDS 11.5% 7%
37

CONCLUSION
WE HAVE TAKEN A SIMPLIFIED VERSION INBOTH CASES .
THE COMPARISON FACILITATES UNDERSTANDING THE GROWTH OF THE CURRENT YEAR OVER THE PREVIOUS YEAR
THE COMMON SIZE BALANCE SHEETS QUANTIFY THE RATE OF GROWTH
OTHER TOOLS –NEXT MODULE. BYE.
38

MODULE 3:COMPARITIVE P & LQUESTIONS
39

PROFIT & LOSS A/C
2001 RS SALES 15,25,000 INT&DIV 7,500 PROFIT ON SALE–LAND 6000 TOTAL 15,38,500
COST OF GOODS 9,00,000
2002 RS 17,00,000 6,200
8,000 TOTAL17,14,200
9,50,000
40

P & L CONTINUED
2001 RS ADMN EXP 93250 S&DN EXP 190000 INT 8000 LOSS ON SALE-M/C 2500 TAX 85000
N.P 259750 TOTAL 1538500
2002 RS 95980 209000 7000
800 168000 283420 1714200
41

COMPARE & COMMENTON THE P & L ACCOUNTS
42

MODULE 5FUND FLOW STATEMENTS problems
43

Summarized balance sheet of Atlas cycles for 31/12/02
liabilities 31/12/20031/12/20011
31/12/20031/12/20022
assetsassets 31/12/200131/12/2001 31/12/200231/12/2002
S.CS.C 500000500000 500000500000 F.A.F.A. 450000450000 370000370000
RES&SRES&S 300000300000 310000310000 INVESINVES 5000050000 6000060000
P&LP&L 5600056000 6800068000 STOCSTOCKK
240000240000 210000210000
CRS.CRS. 168000168000 164000164000 DRS.DRS. 210000210000 455000455000
SEC.LOSEC.LO ------------------ 270000270000 CASH CASH 149000149000 197000197000
PRO-PRO-TAXTAX
7500075000 1000010000
TOTALTOTAL 10990001099000 12920001292000 10990001099000 12920001292000
44

ADDITIONAL INFORMATION
1)INVESTMENTS COSTING RS 8000/=SOLD DURING THE YEAR 2002 FOR RS8500
2)PROVISION FOR TAX IN 2002 RS 9000/= 3)FIXED ASSETS SOLD RS 12000/=BOOK
VALUE RS10000/=PROFIT CREDITED TO P&L 4)DIVIDEND PAID RS 40,000/= 5)FROM THE ABOVE PREPARE A
STATEMENT OF SOURCES AND APPLICATION OF FUNDS.
45
FINANCIAL MANAGEMENTMODULE-VIFund Flow statements
46

Fund Meaning of fund: What is it? Cash and cash equivalent? Investments of and/ or claims? Of a business entity Defining funds as “cash and cash equivalent “is
somewhat limiting Broadening the definition to include investments
and claims against those investments-is a better definition.
47
Fund Flow statement Is it sources and application of funds? Does balance sheet satisfy the definition? No.balance sheet shows the financial position
as on a given date .It is a snapshot, static statement.
Flow is a dynamic concept, it traces the path ,the source and its flow , where it gets invested.It is a wgwgs –where got where gone statement
Balance sheet is stock of funds.changes in balance sheets –two-is the net flow.
48

Fund flow –from balance sheets
Source of funds
Any decrease in asset item
Any increase in claims(liability)
Uses of funds
Any increase in asset item.
Any decrease in claims
49

Tips- tips -tips
AssetAsset liabilityliability
sourcesource __ ++
usesuses ++ __
50

Some questions?
Is increase in cash a source or an application?
Bonus issue of shares ?
Retained earnings?
51

Classification of ratios
Structural point of view : Balance sheet ratios: debt equity ratio, current
ratio, quick ratio Profit and Loss ratios: G.P. Ratio, N.P.
Ratio ,turn over ratios Composite ratios :ROE, RONW, ROCE,
ROTA, TOTA, TOFA, TOWC, TODR, TOSTOCK,
52


