
Accelerated Vesting of Employee Stock Options in Anticipation of FAS 123-R
Preeti Choudhary Assistant Professor
Georgetown University McDonough School of Business
413 Old North Washington, DC 20057
Tel: 202 687 5794; Fax: 202 687 1366 email: pc299georgetown.edu
Shivaram Rajgopal Herbert O. Whitten Endowed Professor
University of Washington Business School Box 353200, Seattle, WA 98195
Tel. 206 543 7913; Fax 206 685 9392 email: [email protected]
Mohan Venkatachalam*
Associate Professor Fuqua School of Business, Duke University
P.O. Box 90120, Durham, NC 27708 Tel: 919 660 7859; Fax: 919 660 7971
email: [email protected]
September 2008
Abstract: In December 2004, the Financial Accounting Standards Board (FASB) mandated the use of a fair value based measurement attribute to value employee stock options (ESOs) via FAS 123-R. In anticipation of FAS 123-R, between March 2004 and November 2005, several firms accelerated the vesting of ESOs to avoid recognizing existing unvested ESO grants at fair value in future financial statements. We find that the likelihood of accelerated vesting is higher if (i) acceleration has a greater effect on future ESO compensation expense, especially related to underwater options; and (ii) firms suffer greater agency problems, proxied by fewer block-holders, lower pension fund ownership and top five officers holding a greater share of ESOs. We also find a negative stock price reaction around the announcement of the acceleration decision, especially for firms with greater agency problems. Furthermore, stock returns are significantly negative before the new vesting dates and positive afterward, suggesting that vesting dates could have been backdated. *Corresponding author. We thank an anonymous referee, Raj Aggarwal, Merle Erickson (editor), Jennifer Francis, Jon Glover, Rebecca Hann, Ross Jennings, Chandra Kanodia, Bill Kinney, Bill Mayew, Ed Maydew, Partha Mohanram, Kevin Murphy, Karen Nelson, Doron Nissim, Terry Shevlin, Scott Taub, Ross Watts, Greg Waymire, Joe Weber and workshop participants at the 2006 FARS Conference, Columbia University, Massachusetts Institute of Technology, University of California, Berkeley, University of Minnesota, University of Southern California, University of Texas at Austin, UNC/DUKE Fall Camp and the American Accounting Association meetings in 2006 and 2007 for many helpful suggestions on the paper. We are grateful to Katherine Schipper for many helpful discussions. We thank Carl Schmitt of Buck Consultants, Jack Cieselski of the Analyst’s Accounting Observer for sharing their data with us and Xin Wang for research assistance. We acknowledge financial support from the University of Washington Business School, Fuqua School of Business and Global Capital Markets Center, Duke University.

1
Accelerated Vesting of Stock Options in Anticipation of FAS 123-R
1. Introduction
The Financial Accounting Standards Board (FASB) issued FAS 123-R on December 12, 2004,
requiring fair value measurement for employee stock options (ESOs). Public firms were required to apply
the new valuation method to (i) all ESO awards granted after June 15, 2005; and (ii) unvested ESO
awards granted after 1994. Fair value measurement imposes financial reporting costs because it entails
recording compensation expense relating to both new option grants and existing unvested options. In
order to reduce or avoid financial reporting costs associated with FAS 123-R, firms could consider two
(not mutually exclusive) alternatives. With regard to compensation expense arising from (i) above, firms
could avoid issuing new option grants after the effective date, i.e., June 15, 2005; with respect to (ii)
above, firms could consider vesting all unvested options (i.e., accelerate the vesting) prior to the effective
date. We focus on accelerated vesting because it represents a short term, one time response to an
accounting standard where the timing of the acceleration is indicative of intent to achieve a financial
reporting objective.
Our enquiry into firms’ accelerated vesting decision is motivated by extant research that indicates
managers take “real” actions in response to accounting standards to avoid or achieve a financial reporting
outcome. Real managerial actions can transfer wealth either to or away from shareholders. For example,
Mittelstaedt, Nichols and Regier (1995) report that 35% of their sample firms cut health care benefits
subsequent to FAS 106 which required financial statement recognition of future health care costs. Health
care benefit reductions represent wealth transfers from employees to shareholders. Carter and Lynch
(2003) focus on a Financial Accounting Standard Board (FASB) proposal requiring firms that reprice
stock options after December 15, 1998 to record a compensation expense equal to the difference between
the new exercise price and the market price of the stock in each subsequent period the option is
unexercised. The timing and concentration of option repricings they identify suggests that managers took
advantage of accounting rule changes to transfer wealth from shareholders to employees (and
themselves).
2
Our study complements Carter and Lynch (2003) by examining accelerated option vesting, a real
action in response to an accounting standard that benefits the employees at shareholders’ expense, but
differs from theirs in three ways. First, in the repricing setting, there was no financial reporting
consequence for firms’ past actions (i.e., prior option grants) or for firms that did not find it optimal to
reprice; rather, firms faced financial reporting costs as a consequence of the new accounting rule only for
subsequent option repricings. In our setting, firms that do not accelerate the vesting of options (i.e., do
nothing) face a financial reporting cost. Second, unlike the repricing setting where the financial effects are
not estimable due to unknown future prices, we are able to quantify the financial reporting costs for both
accelerators and non-accelerators. Consequently, we can assess the extent to which accelerated vesting
decisions are influenced by the level of financial reporting costs. Lastly, we identify potential wealth
transfers from shareholders to employees through negative stock price affects and through possible
backdating of the acceleration date.
We examine two questions. First, we investigate what motivates firms to alter their compensation
contracts in response to an accounting standard. We document the characteristics of firms that accelerate
the vesting of options to evaluate the cost benefit tradeoff associated with the acceleration decision. While
the timing of the accelerated vesting decision suggests that it is driven by financial reporting benefits,
there are other reasons to accelerate option vesting, such as (i) retaining employees and improving
employee morale, and (ii) transferring wealth from shareholders to managers by taking advantage of poor
governance and greater agency problems. Second, we investigate whether the acceleration decision
represents benign changes in employees’ compensation contracts by examining the stock market reactions
surrounding both the acceleration date as well as the filing date. Acceleration is costly because it
decreases the amount of service required of employees before enjoying the benefit from exercising the
options, removing the long-term incentive effects of option contracts.1
1 Following the analysis of Chi and Johnson (2008), we would have liked to measure these costs in the form of
the number of months the vesting period was reduced. However, lack of detailed disclosures regarding the accelerated options prohibit such analysis.

3
Our analysis is based on a sample of 354 firms that announced the accelerated vesting of options
between March 2004 and November 2005 and a broad control sample of 665 firms.2 We observe a rapid
increase in the number of accelerated vesting announcements subsequent to the FASB passing FAS 123-
R, suggestive of a motivation to avoid recording a stock option expense. Our results suggest that, for the
median (mean) accelerating firm, accelerated vesting increases earnings as a percentage of net income by
about 4% (23%). Our regression results indicate that the likelihood that a firm accelerates vesting
increases with the extent of underwater options and the level of financial reporting benefits received from
acceleration. We, however, do not find support for the hypothesis that firms whose stocks have under-
performed relative to their industry are more likely to accelerate vesting in order to retain employees or to
boost their morale.
We also find evidence that acceleration is associated with agency motivations. Managerial
ownership and greater option holdings by the top five executives are positively associated with
accelerated vesting. Consistent with recent claims (e.g., Jensen, Murphy and Wruck 2004), equity
incentives induce managers to increase stock prices in the short run through income increasing financial
reporting choices. We also find that firms with better external governance are less likely to accelerate
vesting. Consistent with anecdotal reports that (i) corporate consultants such as the Corporate Library
(who advise institutions on how to vote on proxy proposals) criticize accelerated vesting of options (The
Washington Post, 2005); and (ii) the reluctance of active institutional investors to allow firms to reset the
terms of employee stock options (e.g., The Wall Street Journal, 1999), we find that firms with greater
blockholder ownership and pension fund ownership (proxies for better governance structures) have lower
likelihood of acceleration.3
Regardless of the motivation to accelerate option vesting, it is unclear ex ante whether the
decision is value-increasing or value-destroying, on average. Boards of several firms state that avoiding a
2 As a sensitivity check we also conduct analysis using a matched control sample of 354 firms matched on size,
industry, operating and stock return performance. Results were qualitatively similar. 3 Boards are not required to allow shareholder votes when resetting the terms of options unless their charters
specify this. In our sample of accelerators we are not aware of any firms that allowed shareholders to vote on acceleration decisions.

4
future accounting charge via accelerated vesting is value-increasing because of the income statement
effects:
“The Board believes it was in the best interest of the shareholders to accelerate these options, as it will have a positive impact on the earnings of the Company over the previously remaining vested period of approximately 3 years.” (Source: Central Valley Community Bancorp, 8-K filed on February 23, 2005).
However, investors may perceive accelerated vesting as merely paying employees more for a reduced
amount of service, i.e., a wealth transfer to employees. To investigate the shareholder value implications
of acceleration, we examine (i) the stock market response surrounding the acceleration announcement;
and (ii) the patterns of stock prices surrounding the accelerated vesting date to investigate whether the
vesting date was opportunistically timed ex post. We find that the average market reaction to the
acceleration decision is -1% over the five-day period surrounding the announcement. The negative
reaction is systematically worse for firms with higher agency costs, proxied by lower CEO stock
ownership and lower blockholder ownership. The magnitude of the negative abnormal return is
economically comparable to the average market reaction for news events such as extreme negative
earnings announcements which ranges on average between -1% and -1.5% (Jegadeesh and Livnat, 2006;
Bernard and Thomas 1990). The results indicate that acceleration announcements are interpreted
unfavorably by the stock market, especially when the market is likely to perceive the wealth transfers to
executives to be greater.
More intriguing, there is some evidence that the accelerated vesting date could have been
backdated. Similar to the return patterns documented by Lie (2005), we find systematic negative stock
returns of –1.7% 20 days before the acceleration date (not the announcement date) and positive returns of
1.4% 20 days after the acceleration date. We also find that a large majority of acceleration decisions (233
of the 365) reported the activity to the SEC six days or more after acceleration decision, supportive of
backdated vesting dates. Selecting the accelerated vesting date is discretionary; there is no requirement to
file a Form 4 or any other kind of notice when a firm accelerates the vesting of options. Thus, firms can
choose an acceleration date ex post when the stock price is low. We view backdating as a form of

5
unrecognized wealth transfer from shareholders to employees because backdating the vesting date to
coincide with a lower point in the path of the stock price is likely to reduce or even eliminate the financial
reporting expense. In turn, this could motivate firms to accelerate even more unvested options.
Our paper makes three contributions to the extant literature. First, we provide archival evidence
consistent with Graham, Harvey and Rajgopal (2005) and Nelson, Elliott and Tarpley (2002) who find
that managers are willing to alter transactions (the terms of compensation contracts in this paper) to
achieve a desired financial reporting outcome. We add to a small but growing stream of archival research
that offers evidence of such behavior. Imhoff and Thomas (1988) document substitution from capital
leases to operating leases and non-lease sources of financing following adoption of FAS 13. Dechow and
Sloan (1991) and Bushee (1998) provide evidence that managers reduce R&D spending to meet earnings
goals. Lys and Vincent (1995) show that AT&T spent between $50 million and $500 million to gain
pooling of-interest accounting in its acquisition of NCR. Engel, Erickson, and Maydew (1999) find that
firms engaged in recapitalizations to make their balance sheets look better. Marquardt and Wiedman
(2005) show that the likelihood of firms issuing contingent convertible bonds, which are often excluded
from diluted EPS calculations under FAS 128, is associated with the reduction that would occur in diluted
EPS if the bonds were traditionally structured.
Second, we contribute to the literature that examines the real effects of accounting standards,
where one effect of transaction structuring is the wealth transfer from shareholders to employees. Unlike
prior research (e.g., Carter and Lynch (2003)), we find that agency factors contribute as much as financial
reporting reasons to the accelerated vesting decision. We document wealth transfers by the association
between the negative stock market reaction around the announcement date and several agency proxies.
Third, the pattern of stock returns surrounding the new vesting date is consistent with the hypothesis that
the new vesting date could have been retroactively picked by management, implying that the practice of
backdating may extend beyond stock option grants.
The remainder of the paper is organized as follows. Section 2 discusses the background and
hypotheses. Section 3 describes the data and empirical results related to factors associated with the

6
likelihood that a firm will accelerate the vesting of options. Section 4 presents evidence related to stock
price reactions at the acceleration announcement and around the new vesting date. Section 5 summarizes
and concludes.
2. Background and Hypotheses 2.1 Background
Prior to 1995, the accounting for options issued to employees (ESOs), was governed by
Accounting Principles Board (APB) Opinion 25. APB 25 specifies that the cost of fixed-plan stock
options are based on the intrinsic value of the option (excess of the market price over the exercise price)
on the option grant date. Most firms incur no option compensation expense by issuing at-the-money, fixed
term options. In October 1995, the FASB issued FAS 123 requiring firms to disclose (not recognize) a
fair-value-based estimate of ESOs. In the aftermath of the accounting scandals and the passage of the
Sarbanes-Oxley Act, the FASB issued FAS 123-R in December 2004, requiring recognition of the cost of
share based payments using fair value measurement (as opposed to the intrinsic value under APB 25) on
the grant date. The cost of the award is allocated over the vesting period. FAS 123-R was originally
scheduled to be effective for public companies after June 15, 2005.4 Under FAS 123-R, only stock
options awarded to employees that vest (become exercisable) after the effective date must be recognized
using a fair value method. Options already vested (even if unexercised) prior to the effective date are not
affected as the required services for those options have already been rendered. For example, if a calendar
year public company granted an option to an employee on December 31, 2003 that vests (i.e., is
exercisable) ratably over three years, a third of the award will vest in fiscal 2006, after the effective date
of FAS 123-R. In order to avoid recognizing the fair value of the unvested option as a compensation
4 The SEC postponed the implementation date of FAS 123-R on April 14, 2005 stating that SEC registrants will
have to comply with FAS 123-R beginning with the first interim or annual reporting period of the first fiscal year beginning on or after June 15, 2005 - i.e., the first quarter of 2006 for most public companies. While calendar-year companies receive a six-month reprieve, several technology companies (e.g., Cisco, JDS Uniphase, Sun Microsystems) and other companies with fiscal year-ends in June 30th and July did not benefit from this delayed implementation.

7
expense in fiscal 2006, the company can accelerate the vesting of the final third of the award to a date on
or before December 31, 2005.5
2.2 Motivations for accelerated vesting
We hypothesize that three factors: (i) accounting; (ii) economic; and (iii) agency factors will
influence the decision to accelerate the vesting period of ESOs prior to FAS 123-R’s effective date.
Proxies for these factors are used in the following logit model (firm subscripts suppressed):
Pr(Accelerated vesting) = β0 + β1 UNDER% + β2 IMPACT + β3 ADOPTERS + β4 EQ_ISSUE + β5 MEET_BEAT + β6 LOSS + β7 D/E + β8 STCLAIM + β9 D_CAPITAL + β10 BHAR_INDADJ + β11 BONUS + β12 CEO_OWN + β13 TOP5_OPT% + β14 BLOCK + β15 PP + β16 B_SIZE + β17 %B_INSIDERS + β18 B_MEETINGS + β19 B_INSIDECHAIR + β20 B_STAG + β21 SIZE + β22 M/B + ε (1)
Accounting factors
2.2.1 Extent of underwater options
While a firm’s acceleration decision reduces financial reporting costs by avoiding future option
expense, it requires recording a current option expense if the option is in-the-money at the time of
acceleration. Under APB 25, shortening the vesting period triggers revaluation; an expense is recognized
based on the intrinsic value at the acceleration date. Accelerating the vesting period of at or out of the
money stock options requires no option expense recognition at the acceleration date. Hence, we
hypothesize that the probability that a firm accelerates vesting is greater if the firm has more unvested
under-water options.
Our empirical proxy for the extent of unvested underwater options is computed from the
Execucomp database, which contains detailed data on option grants to the top five officers. We hand
5 There are a few tax effects of the acceleration as well. A company that accelerates the vesting date of incentive stock options, or ISOs, needs to seek consent from holders of ISOs, as per Section 422 of the Internal Revenue Code of 1986 if the acceleration would have the effect of changing the status of the option for federal income tax purposes from an incentive stock option to a non-qualified stock option. Should any of the holders of incentive stock options refuse or fail to consent to the acceleration of option vesting, then there would be future expense associated with those options as per FAS 123-R. If the company were to accelerate the vesting of an “in-the-money” option, the firm would book a compensation expense per FAS 123 and a deferred tax asset.
8
collect option grant data from the annual proxy statements for firms not included in Execucomp. We
estimate the extent of unvested underwater options as follows. First, we divide the total number of options
granted to the top five executives by the proportion of options granted to these executives relative to that
granted to all employees. This gives us an estimate of the total number of options granted each year.
Following Hall and Knox (2004), we compute unvested options that are underwater as of December 2004.
Assuming that all options are granted at the end of each fiscal year and vest over four-years, we calculate
the number of unvested options for each of the four previous years. For example, a ratable portion of all
the options granted in 2001 through 2004 is considered unvested for a firm with a fiscal year ending
December 31, 2004. To determine whether the unvested options are underwater, we compare the strike
price of the option to the stock price of the firm as of December 31, 2004 (for acceleration firms we use
the stock price at the end of the day before acceleration). UNDER % is the total number of unvested
underwater options scaled by shares outstanding. We expect the probability of accelerating the vesting
period to increase with UNDER%.6
2.2.2 Future expense saved
Over 75% of the accelerating firms cite the magnitude of the future expense avoided as one of the
key benefits of accelerating the vesting of options. Hence, we predict firms will accelerate when these
future expenses are larger. There are at least three reasons why managers might undertake actions to
affect income that have no cash flow effects. First, Graham et al. (2005) find that several CFOs they
interviewed believe that stock markets are efficient, on average, but they would rather not take the chance
that the market inefficiently prices reported income of their firms. Second, recent findings in Sloan (1996)
and Xie (2001) question market efficiency with respect to the pricing of earnings components. Hirshleifer
and Teoh (2003) model an equilibrium in which partially attentive investors focus more on recognized
rather than disclosed charges to income. The existence of such investors creates incentives for firms to
avoid recognizing costs in the financial statements. Finally, even if the stock market is efficient at
6 Because Execucomp contains data from company proxy statements (which follow fiscal years), the entries
show the number of options at the end of the company’s fiscal year, not calendar year.

9
unraveling the effects of transaction structuring on reported income, managers have incentives to manage
reported income to signal their competence to the managerial labor market as suggested by Graham et al.
(2005) or to manage the perceptions of other stakeholders such as suppliers, employees or creditors (see
Bowen, Ducharme and Shores 1995).
In our sample, 228 of the 354 accelerating firms report the amount of future stock option cost
saved as a result of the acceleration. For these firms, we use the reported after tax cost saved as our
empirical measure of future expense saved; for firms that report the before tax impact, we multiply the
before tax impact by 0.65 (assuming a 35% tax rate). For the 126 accelerators that did not disclose the
amount of stock option cost saved and for the control firms, we estimate the financial statement effect as
the tax adjusted Black Scholes value (Black and Scholes 1983) of the unvested underwater options using
the following procedure.7 First, we sum the total number of options unvested as at the end of fiscal 2004
for each of the top five executives.8 We scale this by the percentage of options granted to the top five
executives in each year to estimate the unvested options held by all employees. Next, we determine the
Black Scholes value of these unvested options by using the input assumptions reported in the 10-K filings
(obtained from Equilar). If the firm is missing from the Equilar database, we assume the following input
parameters: a seven year holding term, monthly stock return volatility estimated from CRSP for the past
seven years, a zero dividend rate, and a risk-free rate equal to the ten year Treasury bill rate as of
December of the corresponding year. Since we are interested in the unamortized portion of the total cost,
we multiply the estimated Black Scholes value of unvested options by one-fourth for options granted in
2001, by one-half for options granted in 2002, by three-fourths for options granted in 2003, and by one
7 One might argue that the acceleration phenomenon is a more significant issue for underwater options. Also,
acceleration of in-the-money options imposes an immediate financial reporting cost in that it would require recording an option expense equal to the intrinsic value at the time of acceleration. Therefore, as a sensitivity check, we include in-the-money options when estimating the financial statement impact for all control firms and for treatment firms that did not report the financial statement impact. Using this alternative measure of financial statement impact does not alter the tenor of our conclusions.
8 We assume that firms accelerate all unvested options. This assumption relies on the premise that firms want to minimize the extent of stock option expense reported under FAS 123-R. Under FAS 123-R, firms can avoid recognizing any stock option expense for accelerated out-of-the-money options. Hence, we are not sure why a firm would choose to accelerate only a part of the underwater, unvested options. Unfortunately, firms’ disclosures are too patchy to reveal whether some firms accelerated the vesting of only a portion of their out-of-the-money options.

10
for options granted in 2004. To compute the after tax costs we multiply the sum of these unamortized
expenses by 0.65. The resultant measure is scaled by absolute value of net income and constitutes the
expected future saving in expense attributable to underwater and unvested options (IMPACT).9 We set
IMPACT to zero for 1% of the treatment sample and 19% of control sample firms that voluntarily
adopted the fair value provisions of FAS 123.
Our estimate of the financial statement effect (cost savings) rests on several assumptions: the
grant date is the last day of the granting fiscal year, the holding period of the option (i.e., time till
exercise) for all employees is the same (i.e., seven years or as disclosed in the 10K filing), and a four-year
vesting period. Given these assumptions, our measure of IMPACT likely contains measurement error. To
validate the measure, we compute an as-if IMPACT for firms that disclosed their expected savings in
their announcements. We find that the Spearman rank (Pearson) correlation is 0.72 (0.68) (both p < 0.01)
giving us assurance about the reliability of our measure, despite the assumptions made above.10
2.2.3 Voluntary adopters of fair value provisions of FAS 123
Several firms voluntarily adopted the fair value provisions of FAS 123 beginning in 2002 (see
Aboody, Barth and Kasznik 2004). These firms will not incur savings from accelerated vesting, and may
entail a short-term increase in current cost under FAS 123.11 We hypothesize that voluntary adopters are
9 As a sensitivity check, we use the estimated IMPACT measure for all firms and find that using this alternative
variable does not affect the tenor of our conclusions. Although income seems like a natural scalar in our context, scaling by the absolute value of net income could create a potential small denominator problem. In untabulated analyses, we also consider other scalars such as total assets and sales with no qualitative change in our findings.
10 We also conduct a calibration analysis where we regressed actual IMPACT on an intercept and as-if IMPACT and then applied the parameters from this regression to compute the predicted value for actual IMPACT for firms where we only have the as-if IMPACT number. The estimated intercept (t-stat) is 0.30 (7.65) and coefficient on as-if IMPACT is 1.80 (8.95). Substituting the calibrated number in our empirical analyses does not alter any of our reported inferences.
11 According to FAS 123, once a firm elects to use the fair value method of valuing stock options, they may not change the valuation method back to the intrinsic value method at any point in the future. Therefore, a voluntary adopter that accelerates vesting would be forced to expense an amount equal to the unrecognized portion of the fair value of the accelerated options.

11
less likely to accelerate vesting of options. We code ADOPTERS, as one if the firm voluntarily adopts the
fair value provisions of FAS 123 (per the Bear Stearns report dated 12/16/ 2004) and zero otherwise.12
2.2.4 Reported income and capital markets
In this section, we argue that firms with a preference for reporting higher accounting income on
the margin are more likely to engage in accelerated vesting of options. We employ several empirical
proxies to capture the importance of accounting income. As with prior research, we predict firms that
engage in seasoned equity offerings (EQ_ISSUE), consistently meet or beat analyst earnings targets
(MEET/BEAT), incur losses (LOSS), and have significant leverage (D/E) are more likely to be sensitive
to reported earnings. We measure these variables as follows: EQ_ISSUE is a dummy variable that is set to
one if the firm issued equity in the last three fiscal years and zero otherwise; MEET/BEAT is the
proportion of times a firm meets or exceeds the seasonal quarterly earnings benchmark over the last three
years. Because analyst forecasts are unavailable for a significant proportion (27%) of our sample, we use
prior year earnings instead of analyst forecasts to measure MEET/BEAT; LOSS is the percentage of times
the firm reported negative net income adjusted for the stock option expense amounts (disclosed in the
footnotes) during the four fiscal years prior to the acceleration decision; D/E is the debt-equity ratio
measured as the book value of debt scaled by the market value of equity.
2.2.5 Reported income and stakeholders
Bowen et al. (1995) document that firms with more implicit claims with stakeholders such as
employees, suppliers or customers choose relatively aggressive accounting methods to influence
stakeholders’ assessments of the firm’s reputation. Graham et al. (2005) present survey evidence that
CFOs view stakeholder concerns as an important determinant of financial reporting practices. Even if the
stock market is fully efficient in processing earnings information, managers may accelerate the vesting of
options and reduce future reported costs to extract better terms of trade with their stakeholders. Following
Bowen et al. (1995) and Matsumoto (2002), we conduct a factor analysis to identify a single factor
12 It is likely that subsequent to the Bear Stearns Report, some of the accelerating and the control firms
announced decisions to voluntarily expense stock options, leading to misclassification of the ADOPTERS variable. However, such misclassification would only bias against finding results in support of our hypothesis.

12
(STCLAIM) for the following three variables to capture stakeholder claims: (i) DDUR if a firm belongs to a
durable goods industry; (ii) R&D/Sales and (iii) LABOR intensity [1-(property, plant and equipment/
adjusted total assets)]. STCLAIM represents the factor score capturing the combined elements of these
three variables. The factor retains over 75% of the variation in the input variables. Higher factor scores
correspond with greater stakeholder claims; hence we expect a positive association between the
probability of accelerated vesting and STCLAIM.
Economic factors
2.2.6 Cash flow constraints
Prior research (e.g., Core and Guay 2001) finds that firms with greater financial constraints tend
to use stock options. Accelerated vesting of options could hasten the inflow of cash through the option
exercise if the option is in-the-money and the employee decides to exercise the option early. Even if the
options are out of the money, the incentive effects of accelerated vesting may motivate employees to
work harder to bring the options into the money that in turn motivates early exercise. We hypothesize that
firms with higher cash flow constraints will have greater incentives to accelerate the vesting of options.
Although it is cheaper to raise capital from diversified financial institutions than from employees, the cash
flow constraints hypothesis implicitly assumes that it is sensible for the employees to finance the
company using stock option exercises. Recent research suggests that issuing broad based options to
employees is sensible when firms exploit boundedly rational employees who are likely to be excessively
optimistic about the company stock and when employees are likely to have a strict preference for options
over stock (Bergman and Jenter 2006, Hodge, Rajgopal, and Shevlin 2006). We use free cash flow (FCF)
which is the difference between cash flow from operations for year t-1 and the past-three year average (t-
1, t-2, t-3) of the firm’s capital expenditures, scaled by current assets at t-1. We set a dummy variable
(D_CAPITAL) to one if the free cash flow measure (FCF) is less than - 0.50 and zero otherwise. This
variable also captures the firm’s ex-ante demand for external capital, which in turn, provides managerial
incentives to engage in actions that influence reported income. We expect a positive association between
the acceleration decision and D_CAPITAL.

13
2.2.7 Improving employee morale and retention
Several firms explicitly state that they accelerate the vesting of options to improve employee
morale and retain employees. Hodge et al. (2006) present survey evidence that employees attach
significant value to earlier vesting of stock options. Firms view the acceleration of underwater options as
a symbolic action that communicates concern to employees about their options being out of the money.
Moreover, acceleration of underwater options can be viewed as a signal that managers expect the stock
price to increase. Hence, we argue that firms may choose to boost employee morale and increase the
chance of retaining employees, on the margin, by accelerated vesting.13 While it is debatable whether the
accelerated vesting of underwater options promotes employee retention and incentive alignment, we
appeal to recent work by Jin and Meulbroek (2002) that indicates underwater options have sufficient
incentive alignment properties.14 In addition, options are more valuable to employees when the vesting
period is shorter and employees will have stronger incentives to work harder to boost the stock price to
bring their options into the money.
Following Carter and Lynch (2001) and Oyer (2004), we argue that firms that under-perform
relative to their industry will find it harder to retain employees as such employees have attractive outside
employment opportunities within the industry. Under the retention story, we expect the likelihood of
acceleration to be negatively associated with BHAR_INDADJ, which represents the firm’s prior year
industry adjusted buy and hold return comprised of firms in the three-digit NAICS code, excluding the
treatment firm. BHAR_INDADJ for firms that accelerated vesting in 2004 (2005) is computed over the
year ending June 2004 (December 2004). For control firms, we compute BHAR_INDADJ over the
calendar year 2004.
13 In fact, 51 of the 354 accelerating firms in our sample that accelerate the vesting of underwater options barred
some employees from selling the stock until the original exercise date. 14 Moreover, several of our sample firms (65 firms) accelerate the vesting of some in-the-money options.

14
Agency factors
2.2.8 Managers’ private incentives
We consider several factors related to the private incentives of senior managers to influence
financial reporting choices. Murphy (2000) documents widespread use of earnings based annual bonus
plans in compensation contracts; prior research (e.g., Matsunaga and Park 2001) shows that earnings
based bonus plans influence financial reporting choices. If management bonuses are based on reported
earnings unadjusted for accounting changes, we predict firms that compensate managers with bonus plans
are more likely to accelerate the vesting of options.15 We use the ratio of CEO bonus to total cash
compensation (BONUS) as our proxy for earnings-sensitive bonus plans.16
We also include two additional proxies to capture managers’ private incentives for income
increasing financial reporting decisions – CEO ownership calculated as the equity shares held by the CEO
(CEO_OWN) and the number of options granted to top executives (TOP5_OPT%). Both are scaled by
shares outstanding. Agency theory suggests that greater CEO ownership improves alignment between
managerial and shareholder interests, mitigating agency problems. Thus, firms with greater managerial
ownership are less likely to indulge in earnings management (Warfield, Wild and Wild 1995). Based on
this argument, we predict that the propensity to accelerate will decrease with CEO_OWN. However,
recent evidence (Bartov and Mohanram 2004, Bergstresser and Phillipon 2005, Burns and Kedia 2005,
and Cheng and Warfield 2005) suggests that managers with significant equity incentives (i.e., managers
with significant managerial ownership and stock options) are more likely to manage earnings because
managers have considerable wealth invested in the firm’s stock increasing the propensity to sell shares in
15 A positive relation between the acceleration decision and BONUS could arise for a more innocuous reason.
Because the acceleration decision is more likely to occur when past performance is weak and options are more likely to be underwater, BONUS could simply be an additional proxy for the likelihood that the options are underwater.
16 Ideally, we would like to proxy for bonus incentives via the actual bonus formula in proxy statements or by estimating a regression of bonus compensation on accounting performance for each firm and using the parameter estimates to determine how much a typical manager would actually make in terms of additional bonus if accelerated vesting occurs. However, firms do not consistently disclose bonus formulas in their proxy statements and in addition, requiring a time-series data on bonus compensation will lead to significant data attrition.

15
the near term. Consequently, we entertain the possibility that the relation between the acceleration
decision and CEO_OWN is positive.
TOP5_OPT% is a proxy for managers’ personal incentives. Dechow, Hutton and Sloan (1996)
find that firms with more options granted to the top five executives are more likely to lobby the FASB
against fair value measurement and recognition. They argue that executive stock option grants represent
excess compensation. Managers with significant option portfolios will attempt to reduce the political
costs associated with reporting a high stock option compensation expense. Since accelerating the vesting
of options is a mechanism to avoid expense recognition, we expect a positive association between the
acceleration decision and TOP5_OPT%.17
2.2.9 External governance
We expect outside monitoring to counteract the private incentives of senior managers to
accelerate the vesting of options and avoid expense recognition. We use two proxies to capture external
monitoring: (i) equity ownership by the largest blockholder (BLOCK) compiled by Dlugosz,
Fahlenbrach, Gompers and Metrick (2006); and (ii) equity ownership by public pension funds (PP)
identified by Cremers and Nair (2005).18 Pension funds and blockholders usually oppose resetting the
terms of employee stock options (The Wall Street Journal 1999; Pollock, Fisher and Wade 2001). Several
consultants such as the Corporate Library, who counsel institutional investors on investment decisions
and proxy voting, have been critical of accelerated vesting. For example, Paul Hodgson of the Corporate
Library states: “It's lying. It may be legitimate lying, but it is nevertheless lying to shareholders about the
17 A direct analysis of these agency issues would separate accelerators that exclude senior managers, including
the CEO. Unfortunately, disclosures on restricting accelerations to rank and file workers are patchy and unreliable. 18 A natural candidate for internal monitoring would be the compensation committee. However, we did not find
significant cross-sectional variation either in the presence of a compensation committee or in the composition of the compensation committee, both within our treatment and matched samples and between these two samples. This is not surprising considering that (i) section 303.01(B)(2)(a) and (3) and 303A.02 of the NYSE's listing standards require NYSE listed firms to establish compensation committees composed entirely of independent directors; and (ii) for most NASDAQ companies, the compensation payable to the company's chief executive officer and other executive officers must be approved either by a majority of the independent directors on the board or a compensation committee comprised solely of independent directors. We included the presence of a compensation committee, the number of compensation committee members and the proportion of inside directors on the compensation committees as additional variables but these variables did not load significantly in the multivariate regressions.

16
cost of options." (Washington Post, December 19, 2005). Nell Minow, founder of the Corporate Library,
calls accelerated vesting “appalling." She adds “institutional investors are already saying that the issue
could encourage them to withhold votes from corporate directors. It shows bad faith and bad judgment on
the part of [corporate] boards." (The Street.com, April 12, 2005). We expect the probability of
accelerating the vesting of options to decrease with BLOCK and PP.
2.2.10 Internal governance - Board of Directors
Managers cannot unilaterally accelerate option vesting because the compensation committee and
ultimately the board of directors must authorize such acceleration. Hence, we expect the probability of
acceleration to decrease with the presence of a strong board. We consider five proxies related to board
structure:
(i) The number of directors on the board (B_SIZE). Jensen (1993) and Lipton and Lorsch (1992)
argue that large boards can be less effective than small boards. The intuition is that director free
riding increases with board size and that larger boards may be more symbolic and less involved
in the management process. Yermack (1996) tests this view and finds empirical support for it.
(ii) The proportion of insiders on the board (%B_INSIDERS). Several studies show that boards
composed mainly of outside (or independent) directors are more effective than boards made up
of insiders (e.g., Brickley and James 1987; Weisbach 1988; Rosenstein and Wyatt 1990).
(iii) The number of board meetings (B_MEETINGS). A greater frequency of board meetings may
indicate active governance on the part of the board. Alternatively, it may signal the difficulty
involved in monitoring the firm’s operations and hence, a greater number of board meetings
may suggest a mere reactionary response on the part of the board to poor performance or bad
outcomes.
(iv) The presence of an insider (i.e., an employee, interim CEO, or an individual who owns more than
50% of voting shares) as the chairman of the Board (B_INSIDECHAIR). Boards are known to be
ineffectual monitors especially when the CEO or an insider is also Chairman of the Board
(Jensen 1993).
(v) The presence of a staggered board (B_STAG). Staggered board refers to a board where only
some members are elected/re-elected each year. Staggered boards are a powerful defense
against removal in either a proxy fight or proxy contests. There is evidence that staggered
boards are a key determinant for whether a target receiving a hostile bid will remain
independent (Bebchuk, Coates, and Subramanian 2002). There is also evidence that staggered

17
boards are negatively correlated with Tobin’s Q (Bebchuk and Cohen (2004) and are associated
with negative future returns (Bebchuk, Cohen and Ferrell 2006).
We obtain board data for fiscal year 2004 for several of our sample firms from the Equilar database. We
hand-collected all the variables from proxy statements for 82 accelerating and control firms’ that were not
available in the Equilar board database. Given that a higher value for all the above variables (with the
exception of B_MEETINGS) captures poor internal governance, we predict each of the variables to be
positively (negatively) related to the likelihood of accelerated vesting.
2.2.10 Other variables
Smith and Watts (1992) argue that a firm’s size and investment opportunity set are important
determinants of compensation contracts. Visible actions such as accelerated vesting are likely to invite
public scrutiny. Firm size is commonly used as a proxy to capture political vulnerability (see Watts and
Zimmerman 1990); we measure SIZE as the logarithm of market value of equity. Finally, we include a
proxy for investment opportunity set (M/B) calculated as the ratio of market value of equity to book value
of equity.
3. Data and Results 3.1 The sample
We identify firms that accelerate the vesting period of options via a Lexis-Nexis search beginning
March 2004 using the following keywords “accelerat! w/10 vest!.” We began our search in March 2004
because the FASB issued an exposure draft for share based payment on April 13, 2004. This exposure
draft states that “the intrinsic value method would be repealed (except in limited circumstances) and
replaced with a requirement that generally all equity awards be accounted for at the fair value.”
According to our data search, the first acceleration decision in response to the exposure draft occurred in
July 2004. Note that we eliminate routine accelerations that occur as a result of mergers and acquisitions,
change of control in the firm, separation of employees or performance vesting. We supplemented our
search using lists provided by three stock market analysts (Buck Consultants dated July 7, 2005; Bear

18
Stearns dated Nov 21, 2005, and Analyst’s Accounting Observer dated Oct 12, 2005). The time-series
distribution of acceleration announcements is provided in Figure 1. All but four acceleration
announcements occurred after the FASB decision on October 6, 2004 to consider the acceleration of
vesting period prior to the adoption of the standard as “non-substantive (see
http://www.fasb.org/board_meeting_minutes/10-06-04_ebc.pdf). Had the FASB not voted 4-3 against this
proposal, unvested options that were accelerated would continue to be recognized at fair value over the
original vesting period, eliminating the financial reporting benefit of acceleration. Firms are subject to
FAS 123-R as early as June 2005 or as late as May 2006, depending on their fiscal year end dates. We
terminated our search as of November 18, 2005.
The control firms consist of 665 firms that (i) had not accelerated vesting of options as of
November 18, 2005; and (ii) have all data available to perform our analysis from Execucomp as of
December 2004. Execucomp provides compensation data reported in proxy statements for the top five
officers of firms in the S&P 500 large capitalization, S&P 400 mid capitalization, and S&P 600 small-
capitalization indices. A complete description of data computations and sources is provided in Table 1.
Our final usable sample that passes the required data filters consists of 354 accelerating firms and 665
control firms (see Table 2, Panel A).
Table 2, panel B reports the industry classification (NAICS codes) for the accelerating firms. The
table indicates that technology firms (defined per Francis and Schipper 1999) constitute 39.8% of the
accelerating firms compared to 16.2% for the control firms.19 Manufacturing, finance, and insurance
firms are under-represented in the accelerator sample relative to the control group.
Table 3, Panel A presents descriptive statistics and provides tests of differences in means and
medians between the accelerated vesting and the control samples. Consistent with the predictions we find
that accelerated vesting firms have higher underwater options (UNDER%) and financial statement
IMPACT than their control counterparts. In Panel B of Table 3 we report Pearson correlations between
19 Francis and Schipper (1999) define firms in the 14 three-digit SIC codes (283, 357, 360-368, 481, 737 and
873) as technology-intensive industries. We use a similar industry classification except that we use NAICS codes instead of SIC codes and treat firms in the corresponding NAICS codes (32, 33, 51, and 54) as technology-intensive.

19
various factors that affect firms’ acceleration decision. The strong 0.74 correlation between UNDER%
and IMPACT suggests that most of the “savings” in future stock option costs due to accelerated vesting is
attributable to underwater options.
3.2 Results related to likelihood of accelerating vesting
Panel A of Table 4 presents results from estimating equation (1). Because UNDER % and
IMPACT are significantly correlated (ρ = 0.74, p<0.01), we do not consider these variables jointly when
estimating equation (1) to avoid multi-collinearity problems. In addition, we combine the two variables
using factor analysis and use the factor scores in the logit estimation as an alternative measure of financial
statement reporting benefit.
The results are generally consistent with our predictions. We find that proxies for several
accounting motivations are positively associated with the acceleration decision. Consistent with
incentives to minimize fair value expense, firms with more underwater options (column 1) are more likely
to accelerate vesting (p-value <0.01), and firms with greater expense impact (column 3) are more likely to
accelerate the vesting of options (p-value < 0.01). The combined factor score using UNDER% and
IMPACT (column 5) is also positive and significant (p-value <0.01). Since the results with IMPACT,
UNDER%, and the combined factor score are similar, we restrict our discussion of results to those
presented in columns 5 – 7. To interpret the effect of the various incentives on the likelihood of the
acceleration decision, we present the marginal effects in column 7 of Table 4 related to the regression
specification reported in column 5. The marginal effects for UNDER%, IMPACT and the factor score are
based on the logit models reported in columns 1, 3 and 5 respectively, with each of the effects evaluated
at the sample median of the respective distributions. The results suggest that a 100 basis point increase (or
1 percentage point increase) from the sample median in the proportion of underwater options increases
the probability of acceleration by 0.68%. Further, a 100 basis point increase (or 1 percentage point
increase) from the sample median in the expense impact as a percentage of net income increases the
probability of acceleration by 14.5%. Thus, financial reporting benefits are economically important in the
acceleration decision.

20
Consistent with Aboody et al.’s (2004) finding that voluntary adopters try to separate themselves
from other firms by demonstrating their willingness and ability to take a charge to earnings, firms that
voluntarily recognized options at fair value are less likely to accelerate, indicated by the negative
coefficient on ADOPTERS (p-value < 0.01). Proxies for financial reporting incentives (MEET BEAT and
LOSS) do not affect the acceleration decision, possibly because IMPACT and UNDER% already capture
such incentives. Inconsistent with expectations, we find firms with lower debt equity ratios (D/E) are
more likely to accelerate the vesting period. As expected, firms with greater stakeholder claims
(STCLAIM coefficient = 0.20; p-value < 0.05) are more likely to be accelerators because they may be
more concerned about managing reporting perceptions.
With respect to the other variables, we find that firm size plays a major role in the acceleration
decision in that smaller firms are more likely to accelerate. To help appreciate the importance of the
accounting motivation we report the incremental explanatory power. We estimate the incremental
explanatory power (Pseudo R2) by comparing the R2of the full model and the R2 of the model excluding
the accounting factors. The incremental explanatory power (Pseudo R2) for the accounting variables
ranges from 2.36% to 17.57% depending on whether we include UNDER%, IMPACT or the factor score
that captures both variables.
Turning to the economic motivations, we find a positive coefficient on D_CAPITAL (p-value <
0.10) only when the specification includes the IMPACT or the factor variable, providing weak evidence
that cash constrained firms are more likely to accelerate vesting. The coefficient on BHAR_INDADJ is
weakly significant in the column 3 specification. The incremental pseudo R2 for the economic variables
ranges from 1.07% to 2.23%. Thus, we conclude that economic factors have relatively lesser influence on
the acceleration decision.
Turning to the agency explanations, we find that BONUS is negatively related to the accelerated
vesting decision, inconsistent with our predictions. A plausible explanation for this finding is that a lower
level of BONUS implies less reliance on bonus contracts, which in turn, suggests that incentive
compensation for executives relies more on equity compensation such as options and restricted stock.

21
Such an equity-bias in the compensation might provide incentives for managers to manage earnings as
proposed in Bartov and Mohanram (2004), Bergstresser and Phillipon (2005), Burns and Kedia (2005),
and Cheng and Warfield (2005). Consistent with findings in Cheng and Warfield (2005), we find a strong
positive relation between CEO_OWN and accelerated vesting (coefficient = 6.42; p < 0.01) suggesting
that firms with greater managerial ownership have more incentives to manage financial reporting
outcomes. Consistent with managerial incentives to avoid expense recognition, we find that managers
with significant option compensation are more likely to accelerate, i.e., the coefficient on TOP5_OPT% is
positive and significant (coefficient =12.61; p-value < 0.01). This variable is also economically
significant; the marginal effect suggests that if the option compensation of top five managers increases by
100 basis points (i.e., 1 percentage point increase) the probability of acceleration increases by about 1%.
With respect to external governance variables, we find negative and statistically significant
coefficients on BLOCK and PP at the 1% level, consistent with expectations that block holders and
pension funds are generally averse to resetting terms of employee stock options. A 1% (100 basis points)
decrease in BLOCK and PP (from the median of their respective distributions) increases the probability of
acceleration by about 1% and 3% respectively. Contrary to expectations, we find weak evidence that
larger boards are less likely to be associated with acceleration (coefficient = -0.08, p-value < 0.10). The
incremental explanatory power of the agency variables ranges from 5.31% to 11.15%, suggesting that
agency motivations have significant explanatory power for the likelihood of acceleration.
We conclude that a firm is more likely to accelerate the vesting of options when the firm (i) can
avoid reporting a future accounting expense for options; (ii) has a shareholder base less likely to be
dominated by block-holders and pension funds; (iii) has higher levels of option compensation for its top
five managers and (v) is smaller. Thus, a combination of accounting and agency factors is associated with
accelerated vesting of ESOs in anticipation of FAS 123-R.
3.3 Matched Sample
One limitation of the broad control sample that we use is that a vast majority of accelerators have
underwater options; these options are presumably underwater because of poor stock price performance.
22
Accelerating firms are typically small and concentrated in the technology industries, whereas the control
sample is comprised of a broad cross section of firms. Regardless of how many variables we include in
the regression, it is difficult to fully control for the inherent differences between these samples. To
minimize the likelihood that the control sample differences contribute to the results, we test the robustness
of our results using a matched sample, matching treatment and control firms using industry membership
(3 digit NAICS code), size, operating and lagged annual buy and hold returns. We identify potential
matches from a sample of 1,300 firms with board data supplied by Equilar, excluding accelerating firms.
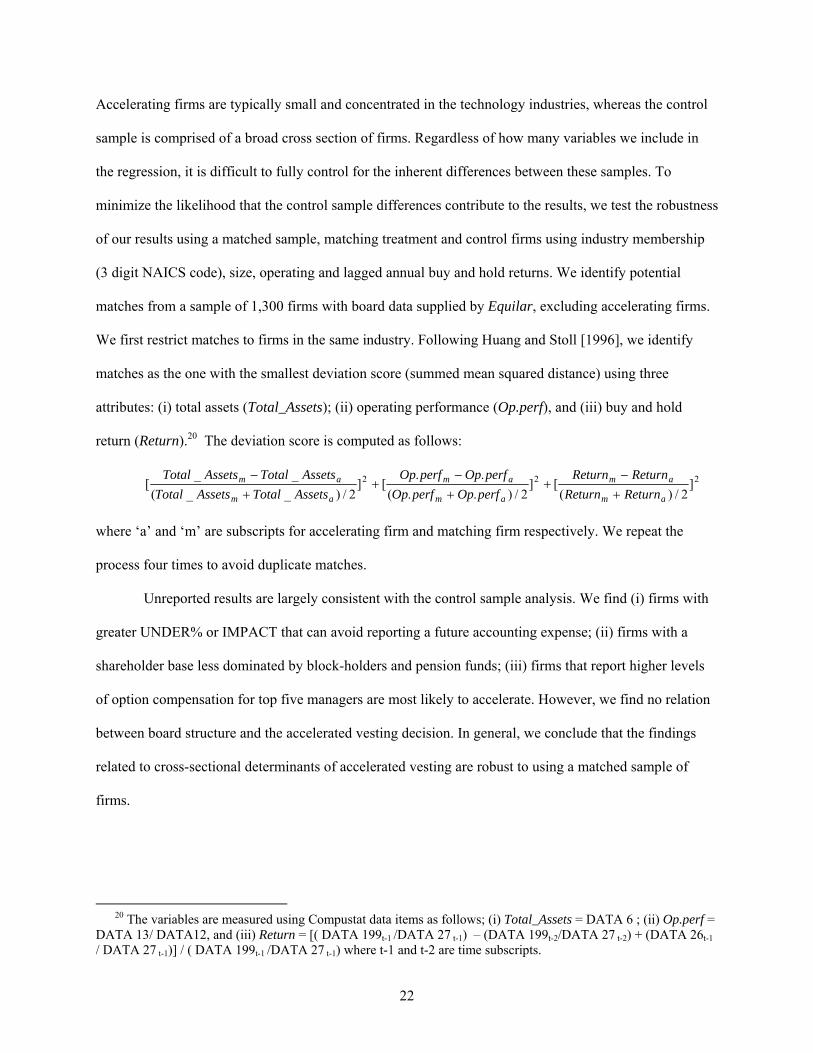
We first restrict matches to firms in the same industry. Following Huang and Stoll [1996], we identify
matches as the one with the smallest deviation score (summed mean squared distance) using three
attributes: (i) total assets (Total_Assets); (ii) operating performance (Op.perf), and (iii) buy and hold
return (Return).20 The deviation score is computed as follows:
222 ]2/)(
[]2/)..(
..[]
2/)__(__
[am
am
am
am
am
am
turnReturnReturnReturnRe
perfOpperfOpperfOpperfOp
AssetsTotalAssetsTotalAssetsTotalAssetsTotal
+−
++
−+
+−
where ‘a’ and ‘m’ are subscripts for accelerating firm and matching firm respectively. We repeat the
process four times to avoid duplicate matches.
Unreported results are largely consistent with the control sample analysis. We find (i) firms with
greater UNDER% or IMPACT that can avoid reporting a future accounting expense; (ii) firms with a
shareholder base less dominated by block-holders and pension funds; (iii) firms that report higher levels
of option compensation for top five managers are most likely to accelerate. However, we find no relation
between board structure and the accelerated vesting decision. In general, we conclude that the findings
related to cross-sectional determinants of accelerated vesting are robust to using a matched sample of
firms.
20 The variables are measured using Compustat data items as follows; (i) Total_Assets = DATA 6 ; (ii) Op.perf =
DATA 13/ DATA12, and (iii) Return = [( DATA 199t-1 /DATA 27 t-1) – (DATA 199t-2/DATA 27 t-2) + (DATA 26t-1 / DATA 27 t-1)] / ( DATA 199t-1 /DATA 27 t-1) where t-1 and t-2 are time subscripts.
23
4. Market reaction to accelerated vesting 4.1 Market reaction to accelerated vesting announcements
We examine the stock market reaction surrounding accelerated vesting announcements to
understand investor perceptions. If investors perceive accelerated vesting as a wealth transfer to
employees, then we expect to find a negative reaction. Alternatively, if the market perceives that
accelerated vesting is merely an accounting choice with no attendant costs, we expect no reaction on
average. Our ability to use stock returns surrounding the announcement to measure wealth transfer is
limited by the extent to which market participants anticipate the announcement. Therefore, we caution
readers that the purpose of the analysis is to highlight rather than quantify the wealth transfer.
To conduct this test, we obtain returns data from www.yahoo.com. We estimate cumulative five-
day risk-adjusted stock returns (CAR), measured around the announcement date (day 0) from Yahoo.com.
For the returns analysis reported in the remainder of the paper, returns are obtained from the CRSP
database. We use a five-day window to allow sufficient time for market participants to process the
information as several of the acceleration announcements are made in an SEC filing (10K/10Q/8K). We
use traditional market model betas to adjust for risk using Russell 2000 index as the market return,
estimated over a 250-day period from day -20 to day -270 (note that the results are insensitive to using
market returns based on either the Dow Jones Index or the S&P 500 index). The event date is assumed to
be the trading day on which the firm first issues a press release or files 10K/10Q/8K that contains a
disclosure of the accelerated vesting.21
Table 5, Panel A presents summary statistics relating to the stock market reactions to 365
accelerated vesting announcements made by 354 distinct firms; 11 firms accelerated twice. The mean
announcement return is –0.99% and is statistically negative (t-statistic = -2.92). Most of the negative
21 In an untabulated robustness check, we compute a time-series based version of CAR and find that we obtain
qualitative similar results to those reported in the text. In particular, we estimate the following equation over the period January 2004 through November 2005 separately for each firm: RETjt = β0 + β1 MRETt + β1 EVENTjt + εjt where RETjt is the firm j’s daily stock return; MRET is the daily market return; and EVENTj is an indicator variable equal to 1 for each of the five days surrounding firm j’s accelerated vesting announcement date, and 0 otherwise and t denotes the trading day.

24
reaction occurs on the day before (-1) and the two days (+2) after the announcement. 22 Untabulated
results indicate 56% of the observations report a negative reaction; a ranked sign test rejects the null of no
reaction (p-value = 0.02). Eliminating multiple announcements by the same firm does not alter any of our
inferences. The negative announcement return is consistent with market participants viewing acceleration
as an economically significant wealth transfer to employees and a value decreasing proposition on
average. This result follows Chi and Johnson (2008) who find a stronger association between firm value
and unvested options than vested ones, suggesting that the incentive power of options is greater for
unvested options. To gauge the economic significance, we compare this reaction to negative earnings
announcements. Prior research (e.g., Jegadeesh and Livnat, 2006; Bernard and Thomas 1990) document
an announcement period return of about -1% to -1.5% for a three day window surrounding the
announcement of bad earnings news. We explore potential cross-sectional determinants of this CAR in
the following sections.
4.1.1 Confounding events
The results presented in Table 5, Panel A do not control for concurrent announcements or
differentiate among the alternative disclosure forms. In Panel B we separate announcement forms across
8-Ks, press releases, and 10-Ks/10-Qs. Results indicate that all three announcement forms have negative
abnormal returns; 8-K announcers are the most frequent, the least contaminated, and have a negative
reaction of –0.67% (t-statistic = -1.75).
We also conduct a Lexis Nexis search to examine press releases surrounding the announcement
dates to eliminate firms with concurrent announcements of mergers, acquisitions, substantial contracts,
earnings releases, management earnings forecasts, dividend announcements or share repurchases.
Because 10-Ks and 10-Qs always contain a significant amount of financial and non-financial information,
22 We considered the possibility of a drift or a reversal in returns around the acceleration announcement. In
particular, we correlated the abnormal return for days (-2, +2) around the acceleration announcement on abnormal returns for days (+3, +7), the trading week after the announcement return window that we analyze. Note the mean abnormal return for days (+3, +7) is –0.02% and is not statistically different from zero (t-statistic = -0.07). Further, the correlation between abnormal returns on windows (-2, +2) and (+3, +7) is 0.02 (p-value = 0.80). Hence, we find no evidence of a drift or a reversal.
25
we restrict our analysis of confounding events to firms that disclose the acceleration decision in an 8-K or
press release. Unreported results indicate that the abnormal returns surrounding the uncontaminated
acceleration announcements is -0.72% and is statistically significant at the 10% level two-tailed (t-statistic
= -1.76). Thus, we conclude that confounding announcements do not appear to be a first-order concern.
4.1.2 Announcement information
SEC Professional Fellow, Chad Kokenge, stated on December 6, 2004 that firms choosing to
accelerate vesting of stock options must not only disclose their decision, but also must provide the reason
for accelerating the vesting. We read press releases and SEC filings to identify motivations disclosed by
accelerators to justify the acceleration decision. Of the 365 accelerated vesting announcements, 83% of
announcements contained one or more of the following six disclosures: 23 (i) the accelerating firm wants
to eliminate stock option expense; (ii) employees are to refrain from selling vested shares on option
exercise until the original date of vesting; (iii) the firm is accelerating vesting to improve employee
retention and morale; (iv) stock options are not achieving their original objectives at the firm; (v) the
acceleration is in the best interest of the firm’s shareholders; and (vi) options have limited economic
value. Table 6, panel A reports the frequency distribution for each disclosure. The most common reason is
the desire to eliminate stock option expense (285 instances).
To examine whether the returns to acceleration announcements vary cross-sectionally by the
disclosed justifications, we first assess whether disclosure of any reason is correlated with the cross-
sectional distribution of CARs. We create a dummy variable, DISCLOSER, which is one if a firm reports
any justification, zero otherwise. Table 6, Panel A reports the coefficient on DISCLOSER is positive and
weakly significant suggesting that the market penalizes firms that do not report any reason for accelerated
vesting of stock options. Results support investor disapproval of insufficient disclosures.
An analysis of the association between CARs and the stated reasons reveals that the stock market
appears to favorably value two reasons for accelerated vesting: (i) elimination of the stock option
23 In our sample, 15 firms accelerated the vesting of options prior to Chad Kokenge’s speech. Ten firms
announced the acceleration prior to his speech. Deleting these observations does not affect our inferences.

26
expense; and (ii) employees may not sell the vested shares until the original option exercise date. We
conjecture that reason (ii) reflects a desire to curtail abuse of the early vesting and reduces the economic
cost of accelerated vesting to the firm. It is difficult to interpret the positive coefficient on reason (i)
because there is a significant overlap between firms that voluntarily disclose a reason for acceleration and
those that claim that the reason for acceleration was elimination of the stock option expense.
4.1.3 Cross sectional analysis of CAR
In this section, we analyze whether the cross-sectional variation in CARs is associated with
accounting, economic and agency factors. We expect the stock market to react positively or less
negatively to the acceleration announcement if such acceleration is driven by economic considerations.
We expect firms with poor performance relative to industry are expected to accelerate with an intention to
retain employees. Firms with greater agency costs are likely to accelerate the vesting of options more to
benefit senior executives and less for genuine economic reasons. Hence, we expect firms with greater
agency costs to report larger negative abnormal returns.
Unreported results suggest that accounting factors, with the exception of the factor score that
combines UNDER% and IMPACT, are unrelated to the cross-sectional distribution of CAR. Surprisingly
we observe a positive association between CAR and BHAR_INDADJ. That is, the better a firm’s prior
industry adjusted performance, the less negative the stock price reaction at the announcement of the
accelerated vesting.
Finally, we do not find any systematic relation between external governance variables and
abnormal returns. However, the positive coefficient on BLOCK indicates that firms that are better
governed are associated with a smaller negative reaction on the vesting announcement. Thus, agency
proxies explain some of the cross-sectional variation in the announcement returns and this evidence can
be interpreted as consistent with accelerated vesting resulting in a wealth transfer from shareholders to
managers. Investors perceive the net costs of acceleration to be lower when there are fewer agency
problems. Given the mixed results, we are unable to document strong reasons for the negative abnormal
returns around the acceleration announcement.
27
4.2 Market reaction surrounding accelerated vesting dates – Potential backdating
We posit that another potential channel of wealth transfer associated with accelerated vesting of
options could arise through backdating the acceleration date. The backdating hypothesis as originally
proposed by Lie (2005) is that dates on which executives are granted stock options is determined ex post
(i.e., backdated) based on when the stock price of the company was relatively lower than the actual grant
date.24 Research by Dhaliwal, Erickson and Heitzman [2007] suggests that backdating may extend to
other contexts, such as option exercises, in order to minimize tax effects.
Backdating the acceleration date (the new vesting date) when the stock price is relatively lower
has two effects. First, backdating minimizes the financial reporting costs. Accelerating the vesting date
when the stock price is low (i.e., when the options are at- or out-of-the money) could reduce the intrinsic
value to zero on the acceleration date, eliminating recognition of stock option expenses. Recall that a firm
recognizes stock option expense at the acceleration date based on the measurement attribute it is currently
using (intrinsic value per APB 25). The scenario described above primarily affects options that are in-the-
money at the time of “actual” acceleration and out-of-the money (or close to out-of-the money) at the
backdated acceleration date.
Second, backdating could result in an unrecognized and unreported wealth transfer from
stockholders to employees. To illustrate this argument, consider a scenario with two firms A and B with
similar option exercise price ($12) and vesting terms (4 years). Assume that the stock price of both firms
reaches a low point of $10 on September 1 and the stock price increases to $15 by December 31. On
December 31, both firms decide to accelerate the vesting date. Firm A chooses to backdate to September
1 when the stock price was $10. Firm B does not backdate. Firm B will record an option expense equal at
least to $3 per option (the intrinsic value of the option at the time of acceleration). Firm A, however, will
not recognize any option expense because the acceleration date on record would be September 1, when
the options were out of the money. Although both firms transfer wealth to employees (as they have vested
24 We first became aware of potential backdating following a report by Jack Ciecelski (Analyst’s Accounting
Observer dated August 17, 2006) and through subsequent discussions with him.

28
in the money options), Firm A’s wealth transfer is not transparent because it recognizes no expense
related to accelerated vesting. In other words, backdating enables “stealth” compensation to employees.
Investors think the acceleration is for out-of the-money options, when it is not. One can push this
reasoning further and argue that given the disincentive associated with reporting compensation expense in
the books, Firm B is less likely to even accelerate the vesting of options relative to Firm A. Backdating
the accelerated vesting date results in a similar wealth transfer consequence as backdating option grants.
Estimating the dollar magnitude of the under-reported compensation expense and the wealth transfer via
backdating is difficult because information about i) the exact number of accelerated options that were
backdated; and ii) the "actual” date of acceleration, as opposed to the reported accelerated date, is not
readily available.
It is important to note that backdating to the lowest stock price does not provide any greater
benefit than backdating to a date where the price is just below the strike price. Continuing with the
previous example, the manager need not backdate to the lowest price of $10 on September 1. Instead, he
may choose a date when the stock price is equal to or less than $12 (the exercise price) in order to achieve
the same reporting benefits. Consequently, unlike options grant backdating, it may be difficult to
demonstrate opportunistic evidence of backdating of accelerated vesting dates.
Examining the reporting lags between the acceleration dates and the dates on which the
acceleration were reported to the SEC provides some tentative evidence of potential backdating.25 Table
7, Panel A presents the distribution of the reporting lag. We find that the modal reporting lag is 6 days.
This may be surprising because our sample period falls after the Sarbanes Oxley Act that tightened the
reporting regulations for stock option grants. Selecting the accelerated vesting date is discretionary;
25 The reader might wonder about how the acceleration sample period relates to the timeline of the backdating
scandal. Lie [2005] finds evidence of backdating occurring between 1992 and August, 28, 2002 prior to when the SEC shortened the lag time between option grants and filing a Form 4. Subsequent to August 29, 2002, Heron and Lie [2007] find a significant reduction in backdating activity, evidenced by lower abnormal returns around option grant dates. Since firms were not required to file a Form 4 when accelerating vesting periods, it is possible for firms to backdate the acceleration date to a time when the stock price is low (and discussed more fully in section 4.2). According to Bernile and Jarrell [2007], the backdating scandal began to capture public attention subsequent to the 3/18/2006 article in the Wall Street Journal. The timing of accelerated vesting activity falls between the early occurrence of option backdating and the unveiling and investigation of firms who were accused of backdating.

29
hence, managers can opportunistically time the acceleration such that the options are at or out of the
money. Conversations with an analyst, an SEC official, and a securities lawyer suggest that there is no
requirement to file a Form 4 or any other kind of notice when a firm accelerates the vesting of options.26
The only disclosure requirement pertains to revealing the justification for the acceleration (discussed in
section 4.1.2; see also Table 6). However, because the constraint on reporting these accelerations does not
stem from insider filing regulations, we caution the readers that our backdating evidence based on
reporting lags is suggestive but not definitive.
We next examine return patterns surrounding the acceleration date for a deeper analysis of the
backdating hypothesis. Figure 2A depicts the cumulative raw returns from 20 trading days before through
20 trading days after the accelerated vesting dates. We focus on cumulative raw returns as opposed to
abnormal returns because the benefits of acceleration to the firm (in the form of lower financial reporting
cost at the time of acceleration) and to the employee (via early possible exercise due to immediate
vesting) are based on the firm’s own stock price performance, not abnormal stock price performance.
Similar to the findings in Heron and Lie (2007) we find that the average return for the accelerating firms
starts to decline 20 days prior to the acceleration date and increases immediately afterward. The average
cumulative return during the 20 trading days prior to the acceleration date is −1.7% and is statistically
significant at the 1% level (t-statistic = -2.63). After the acceleration date, there is a return reversal;
during the 20 days subsequent to acceleration the average return is 1.4% (t-statistic = 2.31). However, this
reversal pattern in returns is not observed for the matched sample (see Figure 2A).27
Narayanan, Schipani and Seyhun (2007) argue that the gain from backdating is smaller for the
group with the shorter reporting lag. Heron and Lie (2007) find that after the implementation of the two-
day, Form 4 reporting requirement, the abnormal positive return pattern is consistent with backdating for
26 The Sarbanes Oxley Act modified the reporting requirements under Section 16(a) of the Securities Exchange
Act of 1934 and mandated that any stock option grants have to be filed with the SEC via Form 4 within two business days. However, this reporting requirement does not apply to changes in vesting period of existing option grants.
27 In untabulated analyses, we delete the 51 firms (shown in Table 6) where the vesting was accelerated but firms restricted managers from exercising the options until the original vesting date. Our inferences are similar to those found in the full sample. Interestingly, for those 51 firms the cumulative returns do not display any reversal patterns surrounding the acceleration date.

30
option grants with at least four-day reporting lags, but non-existent for one-day reporting lags. We
explore whether the return patterns during accelerated vesting are associated with the reporting lag. Table
7, Panel B presents return patterns for 20 days before and after the accelerated vesting date across various
filing lags between the reported vesting date and the SEC filing date (or the press release date). Figure 2B
depicts the same relation graphically. The decline in returns before the acceleration date is the greatest (–
2.6%) for firms with the longest reporting lag (greater than 7 days). The stock price increase subsequent
to the acceleration date is 1% but not statistically significant. The dip in stock price prior to the
acceleration and the subsequent increase in price are consistent with the presence of acceleration
backdating and the potential wealth transfer to employees. Quantifying the wealth transfer is challenging
because it is difficult, if not impossible, to identify future option exercises that correspond to accelerated
options. We acknowledge that there is an alternate interpretation of the results. There is an incentive to
opportunistically time the acceleration to a date stock price is low in order to accelerate more options and
incur lower financial reporting costs. Opportunistic timing can be accomplished without backdating if
managers have private information about firm performance via voluntary disclosure strategies.
5. Conclusions
We investigate the factors associated with firms’ decisions during March 2004-November 2005 to
accelerate the vesting period of stock options in anticipation of June 15, 2005, the date on which FAS
123-R became effective. We also investigate the stock market reaction associated with the accelerated
vesting announcements.
We find that firms accelerate the vesting of options to realize the accounting benefit associated
with recognizing option compensation cost under the APB 25 “intrinsic” value regime as opposed to the
upcoming FAS 123-R “fair value” regime. Firms with stronger institutional monitors such as block
holders and public pension funds are less likely to accelerate vesting. The stock market reaction to the
announcement of the vesting decision is, on average, negative and is more negative for firms that are
subject to larger agency problems. Accelerating the vesting period of options increases reported earnings
by 23% on average, but that action reduces market capitalization by about 1%. Moreover, the return
31
patterns around the acceleration date are consistent with managers choosing a past date on which the
stock price was particularly low to be the new vesting date. This significantly enhances their ability to
exercise in-the-money options much earlier than scheduled by the original grant. We interpret this
evidence as consistent with managers exploiting poor governance and greater agency problems to take
financial reporting actions that the stock market views as value-decreasing and transferring wealth to
employees.
The evidence presented in this study adds to our understanding of the “real” effects of accounting
standards; in particular, how firms endogenously change compensation arrangements in response to new
standards that affect their financial reporting outcomes. We have admittedly focused on only one, albeit
interesting, contracting choice made by firms to avoid financial reporting costs associated with the
passage of FAS 123-R.28 As proxy disclosures become available, future research could examine whether
firms attempt other changes to their compensation arrangements, due to FAS 123-R (e.g., cuts in rank and
file option programs and employee stock purchase plans).
28 Firms may also engage in other earnings management devices to increase future reported earnings. For
example, firms could use income-decreasing accruals that reverse in the future. However, we do not find (results not reported) any evidence consistent with this hypothesis.

32
References
Aboody, D., M. Barth and R. Kasznik. 2004. Firms’ Voluntary Recognition of Stock-Based Compensation Expense. Journal of Accounting Research 42(2): 123-150.
Accounting Principles Board (APB). Accounting for Stock Issued to Employees, APB Opinion No. 25.
New York: APB, 1972. Bartov, E. and P. Mohanram. 2004. Private Information, Earnings Manipulations, and Executive Stock-
Option Exercises. Accounting Review 79, no. 4: 889-920. Bebchuk, L., J.C. Coates IV and G. Subramanian. 2002. The Powerful Antitakeover Force of Staggered
Boards: Theory, Evidence & Policy. Stanford Law Review, 55, 887-951. Bebchuk, L., and A. Cohen. 2004. The Costs of Entrenched Boards. Journal of Financial Economics, 78:
409-433. Bebchuk, L., A. Cohen and A. Ferrell. 2006. What matters in Corporate Governance? Harvard Law
School John M. Olin Discussion Paper No. 491. Bernard, V. and J. Thomas. 1990. Evidence that Stock Prices do not fully Reflect the Implications of
Current Earnings on Future Earnings. Journal of Accounting and Economics 13: 305-340. Bernile, G., and G.A. Jarrell. 2007. The Impact of Options Backdating Scandal on Shareholders Wealth.
Working Paper, University of Miami. Bergman, N. and D. Jenter. 2006. Employee Sentiment and Stock Option Compensation. Journal of
Financial Economics, 79(1): 35-67. Bergstresser, and D., Philippon, T., 2005. CEO Incentives and Earnings Management: Evidence
from the 1990s. Journal of Financial Economics, 80(3):511-529. Black, F., and M. Scholes. 1973. The Pricing of Options and Corporate Liabilities. Journal of Political
Economy 81: 637-54. Bowen, R., L. Ducharme, and D. Shores. 1995. Stakeholders Implicit Claims and Accounting Method
Choice. Journal of Accounting and Economics 20: 255–295. Burns, N. and S. Kedia, 2005. The Impact of Performance-based Compensation on Misreporting.
Journal of Financial Economics 79: 35-76. Bushee, B.J. 1998. The Influence of Institutional Investors on Myopic R&D Investment Behavior. The
Accounting Review 73: 305-333. Brickley, J. and C. James. 1987. The Takeover Market, Corporate Board Composition, and Ownership
Structure: The Case of Banking. Journal of Law and Economics 30: 161-181. Carter, M.E. and L.J. Lynch. 2001. An Examination of Executive Stock Option Repricing. Journal of
Financial Economics 61: 207–225. Carter, M.E. and L.J. Lynch. 2003. The Consequences of the FASB’s 1998 Proposal
33
on Accounting for Stock Option Repricing. Journal of Accounting and Economics 35: 51–72.
Cheng, Q. and T. Warfield, 2005. Equity Incentives and Earnings Management. The Accounting
Review 80, 441-476. Chi, J. and S. Johnson. 2008. The Value of Vesting Restrictions on Managerial Stock and Option
Holdings, working paper, Arizona State University- West and Texas A&M University. Ciesielski, Jack. “3rd Quarter Update: Accelerated Vesting Continues Accelerating” The Analyst’s
Accounting Observer, Vol. 14, October 12, 2005. Ciesielski, Jack. “Options Closed: The End of Accelerated Vesting.” The Analyst’s Accounting Observer,
Vol. 14, August, 15, 2006. Core, J. and W. Guay. 2001. Stock Option Plans for Non-Executive Employees. Journal of Financial
Economics 61: 253-287. Cremers K.J.M, and V.B. Nair. 2005. Governance Mechanisms and Equity Prices. Journal of Finance,
60(6):2859-2894. Dechow, P., A. Hutton, and R. Sloan. 1996. Economic Consequences of Accounting for Stock Based
Compensation. Journal of Accounting Research 34:1-21. Dechow, P., and R. Sloan. 1991. Executive incentives and the horizon problem: An empirical
investigation. Journal of Accounting and Economics 14:51-89. Dhaliwal, D, M. Erickson, and S. Heitzman. 2007. Taxes and the Backdating of Stock Option Exercise
Dates, working paper University of Arizona, University of Chicago, University of Rochester. Dlugosz, J., R. Fahlenbrach, P. Gompers and A. Metrick. 2006. Large Blocks of Stock: Prevalence, Size,
and Measurement, Journal of Finance 12(3):594-618. Engel, E, M. Erickson, and E. Maydew. 1999. Debt-Equity Hybrid Securities, Journal of Accounting
Research 37(2): 249-274. FINANCIAL ACCOUNTING STANDARDS BOARD (FASB). Accounting for Stock-Based
Compensation. FASB Statement No 123. Norwalk, CT: FASB, 1995. FINANCIAL ACCOUNTING STANDARDS BOARD (FASB). Accounting for Stock-Based
Compensation (Revised). FASB Statement No 123-R. Norwalk, CT: FASB, 1996. Francis, J and K. Schipper. 1999. Have Financial Statements Lost their Relevance? Journal of
Accounting Research 37: 319-353. Graham, J., C. Harvey and S. Rajgopal. 2005. The Economic Implications of Financial Reporting.
Journal of Accounting and Economics, 40(1-3):3-73. Hall, B. and T. A. Knox. 2004. Underwater Options and the Dynamics of Pay-to-Performance
Sensitivities. Journal of Accounting Research 42: 365.

34
Heron, R. and E. Lie. 2007. Does Backdating Explain the Stock Price Pattern around Executive Stock Option Grants? Journal of Financial Economics 83: 271-295.
Hirshleifer, D. and S. H. Teoh. 2003. Limited Attention, Information Disclosure and Financial Reporting.
Journal of Accounting and Economics 36: 337-386. Hodge, F., S. Rajgopal and T. Shevlin. 2006. How do Managers Value Stock Options and Restricted
Stock? Working paper, University of Washington. Huang, R. D., and H. Stoll. 1996. Dealer vs. Auction Markets: A Paired Comparison of Execution Costs
on NASDAQ and the NYSE. Journal of Financial Economics 41: 313–357. Imhoff, E. and J. Thomas. 1988. Economic Consequences of Accounting Standards: The Lease Disclosure Rule Change. Journal of Accounting and Economics 10: 277-310. Jegadeesh, N. and J. Livnat. 2006. Post-Earnings Announcement Drift: The Role of Revenue Surprises.
Financial Analyst Journal 62: 22-34. Jensen, M.C. 1993. The Modern Industrial Revolution, Exit, and the Failure of Internal Control Systems.
Journal of Finance: 48, 831-880. Jensen, M.C., K. Murphy and E. Wruck. 2004. Remuneration: Where We've Been, How We Got to Here,
What are the Problems, and How to Fix Them. Working paper, Harvard Business School. Jin, L, and L. K. Meulbroek. 2002. “Do Underwater Executive Stock Options Still Align Incentives? The
Effect of Stock Price Movements on Managerial Incentive-Alignment.” Working Paper, Harvard Business School.
Kokenge, Chad (Professional Accounting Fellow, Office of Chief Accountant of the U.S. Securities
Exchange Commission). Speech given at the AICPA National Conference on Dec 6, 2004, www.sec.gov/news/speech/spch120604cak.htm.
Lie, E. 2005. On the Timing of Stock Option Awards. Management Science 51: 802-812. Lipton M. and J. W. Lorsch. 1992. A Modest Proposal for Improved Corporate Governance. The
Business Lawyer 48:1. Lys, T., and L.Vincent. 1995. Analysis of Value Destruction in AT&T’s Acquisition of NCR. Journal of Financial Economics 39: 353–78. Marquardt, C; and C. Wiedman. 2005. “Earnings Management through Transaction Structuring:
Contingent Convertible Debt and Diluted EPS.” Journal of Accounting Research 43: 205-243. Matsumoto, D. 2002. Management’s Incentives to Avoid Negative Earnings Surprises. Accounting
Review 77: 483-515. Matsunaga, S.R. and C.W. Park. 2001. The Effect of Missing a Quarterly Earnings Benchmark on the
CEO’s Annual Bonus. Accounting Review 76: 313-332. McConnell, P. D. Mott, J. Pegg, and C. Senyak. Employee Stock Options: Over 400 Companies
Accelerate Stock Options’ Vesting. Bear Stearns, Nov 21, 2005.

35
McConnell, P. D. Mott, J. Pegg, and C. Senyak. FASB Does It: FAS 123(R) Requires Stock Option
Expensing. Bear Stearns, Dec 16, 2004. Mittelstaedt, F, W. Nichols and P. Regier. 1995. SFAS No. 106 and Benefit Reductions in Employer-
Sponsored Retiree Health Care Plans. The Accounting Review 70, 535-556.
Murphy, K. 2000. Performance Standards In Incentive Contracts. Journal of Accounting and Economics 30: 245-278.
Narayanan, M.P., C.A. Schipani, and H.N. Seyhun. 2007. The Economic Impact of Backdating of Executive Stock Options. Michigan Law Review, 105:1597-1641.
Nelson, M., J. Elliott, and R. Tarpley. 2002. Evidence from Auditors about Managers’ and Auditors’ Earnings Management Decisions. The Accounting Review 77: 175-202. Oyer, Paul. 2004. Why do Firms Use Incentives that have No Incentive Effects? Journal of Finance 59, 1619-1649. Pollock, T.G., H. Fisher and J. Wade. 2001. The Role of Politics In Repricing Executive Options.
Academy of Management Journal. Rosenstein S., and J. G. Wyatt. 1990. Outside Directors, Board Independence, and Shareholder Wealth.
Journal of Financial Economics, 26: 175-191. Sloan, Richard. 1996. Do Stock Prices Fully Reflect Information in Accruals and Cash Flows about
Future Earnings? Accounting Review 71: 289-316. Smith, C., and R. Watts. 1992. The Investment Opportunity Set and Corporate Financing, Dividend, and
Compensation Policies. Journal of Financial Economics 7: 117-61. The Street. com. 2005. Midnight At the Options Oasis. April 12. Wall Street Journal, The. 1999. Breathing underwater: Amid Shareholder Complaints, Companies Look
for Alternatives to Repricing Options, April 8, p. R6. Washington Post, The. 2005. Pushing fast-forward on options. Speeded-up vesting is a way around new
accounting rule, but some cry foul. December 19, 2005; D01. Warfield, T.D., J. J. Wild, and K.L. Wild. 1995. Managerial Ownership, Accounting Choices, and
Informativeness of Earnings. Journal of Accounting and Economics 20(1): 61-91. Watts, R. L., and J. L. Zimmerman. 1990. Positive Accounting Theory, A Ten Year Perspective. The
Accounting Review 65: 131-156. Weisbach, M. 1988. Outside Directors and CEO Turnover. Journal of Financial Economics 37(1): 159-
188. Whaley, R. E. 2006. Derivatives: Markets, Valuation, and Risk Management, John Wiley & Sons, Inc.:
Hoboken, NJ.

36
Yermack, D. 1996. Higher Market Valuations of Companies with Smaller Board of Directors. Journal of Financial Economics 40: 185-212.
Xie, Hong. 2001. The Mispricing of Abnormal Accruals. The Accounting Review 76: 357-374.

37
Figure 1
Time series trends in accelerated vesting announcements
1 1 2 4
1216
21
54
29
50
36
20 21 21
34
44
0
10
20
30
40
50
60
Mar 04
May 04
Jul 0
4
Sept 0
4
Nov 04
Jan 0
5
Mar 05
May 05
Jul 0
5
Sept 0
5
Nov 05
Acceleration Month
Freq
uenc
y
On 3/31/04 the FASB issued an exposure draft for FAS 123R
On 12/16/04 the FASB passed FAS 123R making it effective for the f irst f iscal qtr after 6/15/05
On 4/14/05 the Sec revised the effective date of FAS 123 to be fiscal years beginning after 6/15/05

38
Figure 2A Cumulative stock returns around acceleration vesting dates for accelerating firms and matched
sample
The figure shows the cumulative raw stock returns from 20 days before through 20 days after the acceleration date. The thick lines pertain to cumulative stock returns for the accelerating firms. The thin lines pertain to cumulative stock returns for the matched control firms surrounding the acceleration date for the corresponding treatment firm.
-0.02
-0.01
0
0.01
0.02
0.03
0.04
-20 0 20Cum
ulat
ive
stoc
k re
turn
s
Day relative to acceleration date

39
Figure 2B: Cumulative stock returns for accelerating firms around acceleration vesting dates based on the
filing lag
The figure shows the cumulative raw stock returns from 20 days before through 20 days after the acceleration date for various filing lags. Filing lag is the distance between the acceleration date and the filing date.
-0.04
-0.03
-0.02
-0.01
0
0.01
0.02
-20 0 20
Cum
ulat
ive
stoc
k re
turn
s
Day relative to acceleration date
Filing Lag < 3 daysFiling lag 3 to 5 daysFiling lag 6 to 7 daysFiling lag > 7 days
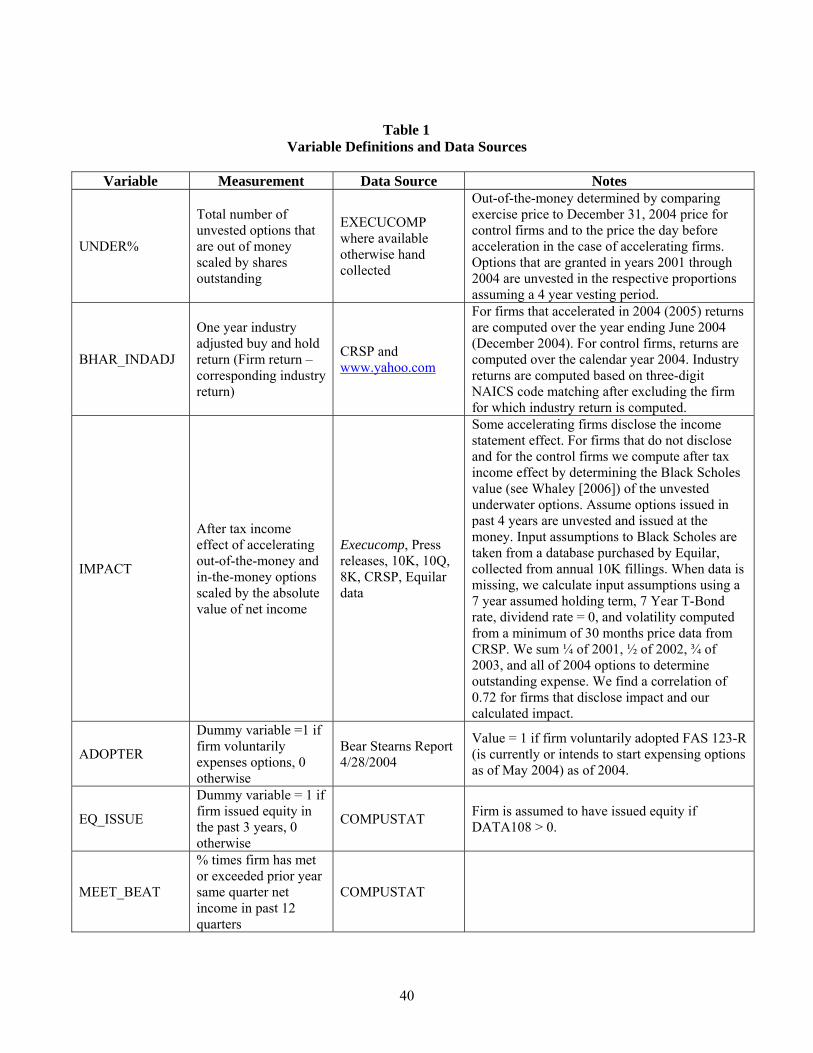
40
Table 1 Variable Definitions and Data Sources
Variable Measurement Data Source Notes
UNDER%
Total number of unvested options that are out of money scaled by shares outstanding
EXECUCOMP where available otherwise hand collected
Out-of-the-money determined by comparing exercise price to December 31, 2004 price for control firms and to the price the day before acceleration in the case of accelerating firms. Options that are granted in years 2001 through 2004 are unvested in the respective proportions assuming a 4 year vesting period.
BHAR_INDADJ
One year industry adjusted buy and hold return (Firm return – corresponding industry return)
CRSP and www.yahoo.com
For firms that accelerated in 2004 (2005) returns are computed over the year ending June 2004 (December 2004). For control firms, returns are computed over the calendar year 2004. Industry returns are computed based on three-digit NAICS code matching after excluding the firm for which industry return is computed.
IMPACT
After tax income effect of accelerating out-of-the-money and in-the-money options scaled by the absolute value of net income
Execucomp, Press releases, 10K, 10Q, 8K, CRSP, Equilar data
Some accelerating firms disclose the income statement effect. For firms that do not disclose and for the control firms we compute after tax income effect by determining the Black Scholes value (see Whaley [2006]) of the unvested underwater options. Assume options issued in past 4 years are unvested and issued at the money. Input assumptions to Black Scholes are taken from a database purchased by Equilar, collected from annual 10K fillings. When data is missing, we calculate input assumptions using a 7 year assumed holding term, 7 Year T-Bond rate, dividend rate = 0, and volatility computed from a minimum of 30 months price data from CRSP. We sum ¼ of 2001, ½ of 2002, ¾ of 2003, and all of 2004 options to determine outstanding expense. We find a correlation of 0.72 for firms that disclose impact and our calculated impact.
ADOPTER
Dummy variable =1 if firm voluntarily expenses options, 0 otherwise
Bear Stearns Report 4/28/2004
Value = 1 if firm voluntarily adopted FAS 123-R (is currently or intends to start expensing options as of May 2004) as of 2004.
EQ_ISSUE
Dummy variable = 1 if firm issued equity in the past 3 years, 0 otherwise
COMPUSTAT Firm is assumed to have issued equity if DATA108 > 0.
MEET_BEAT
% times firm has met or exceeded prior year same quarter net income in past 12 quarters
COMPUSTAT

41
Table 1 (continued)
Variable Measurement Data Source Notes
LOSS
Proportion of times in the last 4 years the firm had a loss after deducting the option expense amount disclosed in the 10K
COMPUSTAT Firm has a loss if DATA18-DATA399 < 0; Loss = (number of times Loss=1)/4
D/E Total debt / Market value of equity COMPUSTAT
Total debt = (DATA34+DATA9) Market Value of Equity = DATA25 * DATA199
STCLAIM
A single factor determined from three variables: 1) dummy indicator for durable goods industry 2) R&D/Sales 3) labor intensity (1-PPE/ adjusted total assets);
COMPUSTAT
Durable good industry (SIC codes 150-179, 245,283,301,250-259,324-399), R&D (data 46), sales (data 12), PP&E (data 7), adjusted total assets (data 6 + data 196 + data 240).
D_CAPITAL If FCF <-0.5 then D_CAPITAL =1, 0 otherwise
COMPUSTAT
FCF is the difference between cash flow from operations (#308) for year t-1 and the past-three year average (t-1, t-2, t-3) of the firm’s capital expenditure (#128) scaled by current assets (#4) at t-1.
BONUS Bonus / Total cash compensation
Execucomp where available otherwise hand collected
BONUS/TCC.
CEO_OWN Shares owned by CEO scaled by shares outstanding
Execucomp where available otherwise hand collected
SHROWN / SHROUT.
TOP5_OPT%
Total stock options granted to top 5 executives scaled by shares outstanding
Execucomp where available otherwise hand collected
Σ(SOPTGRNT to top 5 executives in 2001 through 2004)/SHRSOUT
BLOCK Equity ownership by the largest block holder
Dlugosz et al. (2006)
PP Equity ownership by public pension funds
Cremers and Nair (2005)
%B_INSIDERS Percentage of non-independent directors on the board
Equilar where available, rest hand collected from proxy statements
A director is not considered independent if the individual is an employee, interim CEO, owns more than 50% of voting shares, part-time employee, employed by the company in the last 5 yrs, founder, provides any consulting services to the company, has an immediate family member who is an employee, or is not deemed independent by the company
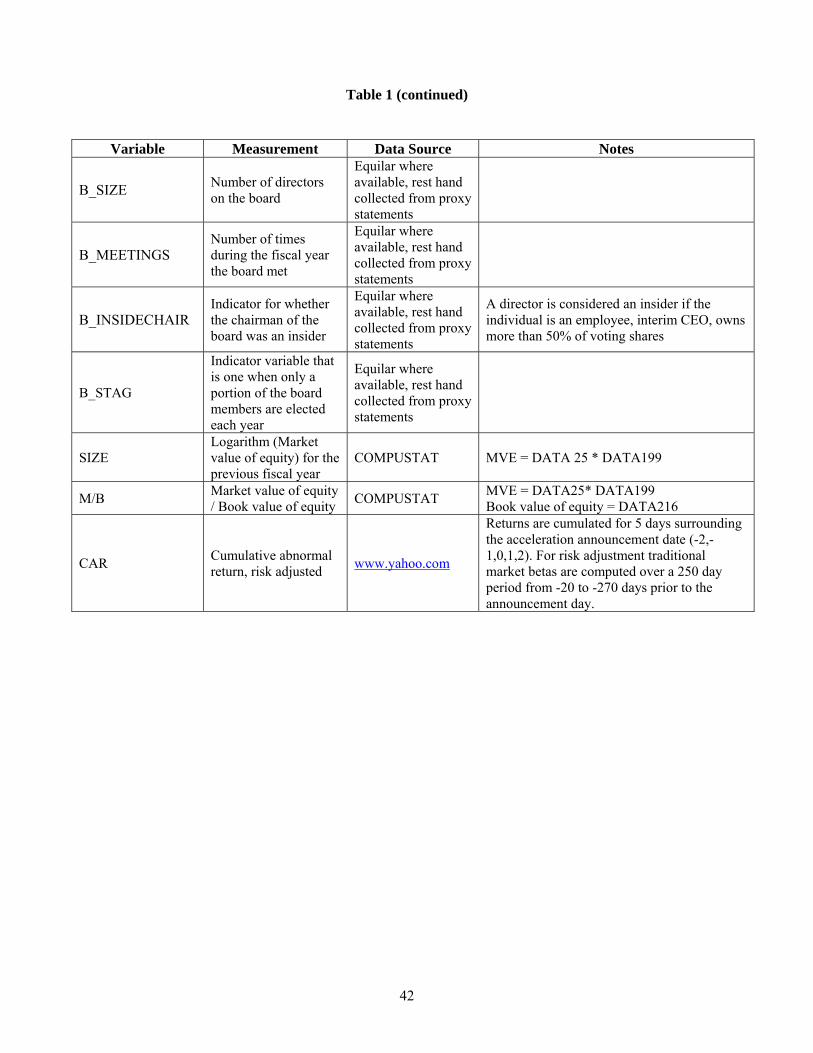
42
Table 1 (continued)
Variable Measurement Data Source Notes
B_SIZE Number of directors on the board
Equilar where available, rest hand collected from proxy statements
B_MEETINGS Number of times during the fiscal year the board met
Equilar where available, rest hand collected from proxy statements
B_INSIDECHAIR Indicator for whether the chairman of the board was an insider
Equilar where available, rest hand collected from proxy statements
A director is considered an insider if the individual is an employee, interim CEO, owns more than 50% of voting shares
B_STAG
Indicator variable that is one when only a portion of the board members are elected each year
Equilar where available, rest hand collected from proxy statements
SIZE Logarithm (Market value of equity) for the previous fiscal year
COMPUSTAT MVE = DATA 25 * DATA199
M/B Market value of equity / Book value of equity COMPUSTAT MVE = DATA25* DATA199
Book value of equity = DATA216
CAR Cumulative abnormal return, risk adjusted www.yahoo.com
Returns are cumulated for 5 days surrounding the acceleration announcement date (-2,-1,0,1,2). For risk adjustment traditional market betas are computed over a 250 day period from -20 to -270 days prior to the announcement day.
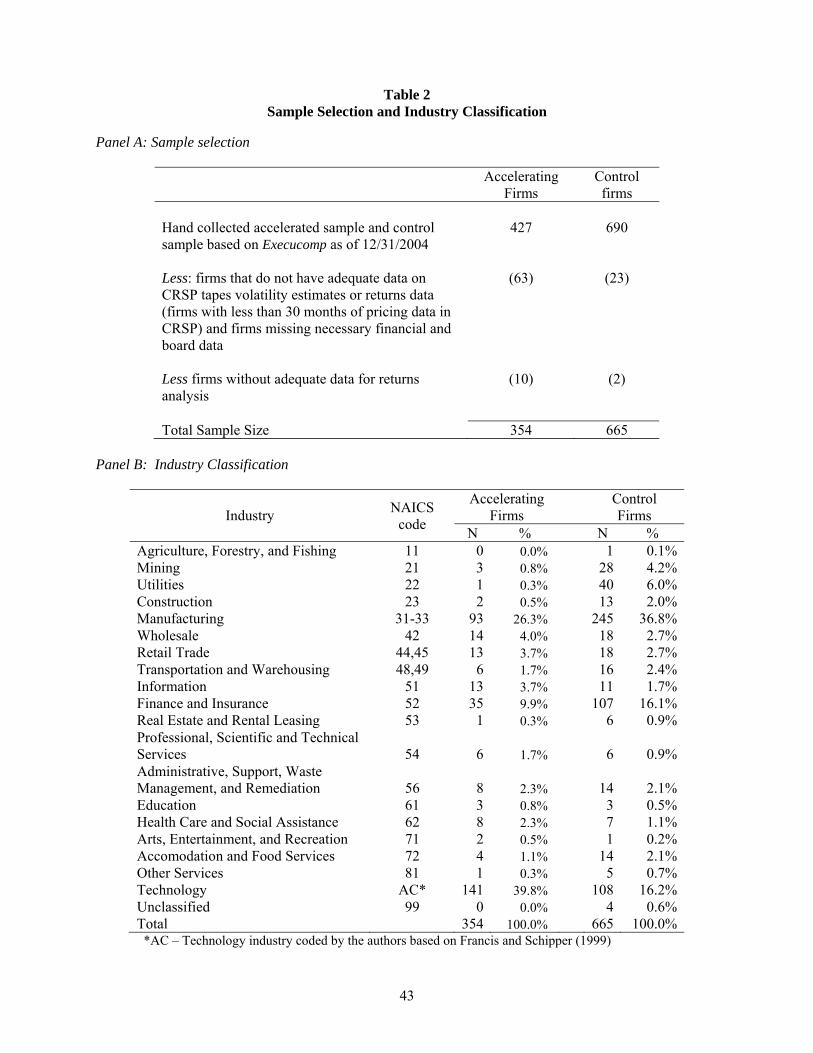
43
Table 2 Sample Selection and Industry Classification
Panel A: Sample selection
Accelerating
Firms Control firms
Hand collected accelerated sample and control sample based on Execucomp as of 12/31/2004
427 690
Less: firms that do not have adequate data on CRSP tapes volatility estimates or returns data (firms with less than 30 months of pricing data in CRSP) and firms missing necessary financial and board data
(63) (23)
Less firms without adequate data for returns analysis
(10) (2)
Total Sample Size 354 665
Panel B: Industry Classification
Industry NAICS code
Accelerating Firms
Control Firms
N % N % Agriculture, Forestry, and Fishing 11 0 0.0% 1 0.1%Mining 21 3 0.8% 28 4.2%Utilities 22 1 0.3% 40 6.0%Construction 23 2 0.5% 13 2.0%Manufacturing 31-33 93 26.3% 245 36.8%Wholesale 42 14 4.0% 18 2.7%Retail Trade 44,45 13 3.7% 18 2.7%Transportation and Warehousing 48,49 6 1.7% 16 2.4%Information 51 13 3.7% 11 1.7%Finance and Insurance 52 35 9.9% 107 16.1%Real Estate and Rental Leasing 53 1 0.3% 6 0.9%Professional, Scientific and Technical Services 54 6 1.7% 6 0.9%Administrative, Support, Waste Management, and Remediation 56 8 2.3% 14 2.1%Education 61 3 0.8% 3 0.5%Health Care and Social Assistance 62 8 2.3% 7 1.1%Arts, Entertainment, and Recreation 71 2 0.5% 1 0.2%Accomodation and Food Services 72 4 1.1% 14 2.1%Other Services 81 1 0.3% 5 0.7%Technology AC* 141 39.8% 108 16.2%Unclassified 99 0 0.0% 4 0.6%Total 354 100.0% 665 100.0%
*AC – Technology industry coded by the authors based on Francis and Schipper (1999)

44
Table 3 Descriptive Statistics and Correlation Matrix
Panel A: Descriptive Statistics
Accelerating Firms (N = 354)
Control Firms (N = 665)
Mean Median Std Dev Mean Median Std Dev MVE (Mil) 1689.050 411.740 4927.820 12883.964** 3011.870** 31597.872 Total Assets (Mil) 1869.263 415.635 6764.130 24246.729** 3256.540** 98458.638 Net Income (Mil) 29.798 10.332 224.995 671.879* 146.086** 1704.049 UNDER% 0.090 0.057 0.103 0.027** 0.005** 0.066 BHAR_INDADJ -0.159 -0.202 0.392 -0.100* -0.134** 0.371 IMPACT 0.231 0.042 0.572 0.000** 0.000** 0.003 ADOPTER 0.011 0.000 0.106 0.190** 0.000** 0.392 EQ_ISSUE 0.559 1.000 0.497 0.335** 0.000** 0.473 MEET_LYE 0.611 0.583 0.202 0.691** 0.667** 0.203 LOSS 0.410 0.250 0.393 0.141** 0.000** 0.264 D/E 0.310 0.087 0.632 0.490** 0.205** 1.114 STCLAIM 0.352 0.272 1.249 -0.187** -0.187** 0.777 D_CAPITAL 0.127 0.000 0.334 0.194** 0.000** 0.396 BONUS 0.275 0.262 0.246 0.494** 0.550** 0.240 CEO_OWN 0.056 0.017 0.105 0.016** 0.003** 0.044 TOP5_OPT% 0.039 0.029 0.037 0.020** 0.014** 0.026 BLOCK 0.020 0.000 0.044 0.058** 0.064** 0.066 PP 0.011 0.000 0.016 0.025** 0.029** 0.014 %B_INSIDERS 0.318 0.317 0.130 0.290** 0.272** 0.149 B_SIZE 7.956 7.000 2.237 9.943** 10.000** 2.494 B_MEETINGS 7.706 7.000 3.867 7.618 7.000 3.455 B_INSIDECHAIR 0.712 1.000 0.454 0.818** 1.000** 0.386 B_STAG 0.562 1.000 0.497 0.615 1.000^ 0.487 SIZE 6.125 6.061 1.583 7.969** 7.829** 1.646 M/B 3.569 2.481 3.677 3.526 2.327 3.851

45
Table 3 (continued) Panel B: Spearman Correlation Matrix
ACCELERATE UNDER% IMPACT ADOPTER EQ_ISSUE MEET_BEAT LOSS D/E STCLAIM D_CAPITAL
UNDER% 0.52 IMPACT 0.74 0.74 ADOPTER -0.25 -0.50 -0.37 EQ_ISSUE 0.22 0.25 0.27 -0.12 MEET_BEAT -0.18 -0.24 -0.21 0.03 -0.03 LOSS 0.37 0.45 0.47 -0.15 0.21 -0.26 D/E -0.21 0.22 -0.26 0.22 -0.34 -0.09 -0.15 STCLAIM 0.23 0.27 0.32 -0.13 0.18 -0.01 0.28 -0.32 D_CAPITAL -0.08 -0.17 -0.16 0.26 -0.20 0.10 -0.17 0.33 0.04 BHAR_INDADJ -0.11 -0.21 -0.17 0.05 -0.08 0.14 -0.07 0.07 -0.05 0.10 BONUS -0.40 -0.37 -0.36 0.21 -0.08 0.31 -0.26 0.07 -0.04 0.04 CEO_OWN 0.38 0.17 0.23 -0.15 -0.03 0.02 0.05 -0.08 0.02 -0.01 TOP5_OPT% 0.39 0.55 0.39 -0.27 0.21 -0.10 0.37 -0.19 0.19 -0.16 BLOCK -0.34 -0.21 -0.29 0.07 -0.14 0.06 -0.14 0.08 -0.12 -0.06 PP -0.40 -0.23 -0.28 0.14 -0.14 0.12 -0.21 0.12 -0.04 -0.02 SIZE -0.48 -0.39 -0.35 0.31 -0.10 0.25 -0.35 0.12 -0.09 0.12 M/B -0.02 0.00 0.09 -0.07 0.23 0.28 -0.07 -0.35 0.21 -0.13 %B_INSIDERS 0.11 0.01 0.10 -0.08 0.03 0.04 0.02 -0.12 -0.05 0.02 B_SIZE -0.41 -0.29 -0.37 0.27 -0.26 0.14 -0.32 0.36 -0.23 0.26 B_MEETINGS -0.13 0.06 0.03 0.03 0.00 -0.06 0.08 0.22 -0.03 0.09 B_INSIDECHAIR -0.12 -0.08 -0.11 0.10 -0.06 0.09 -0.13 0.06 -0.06 -0.01 B_STAG -0.05 -0.05 -0.06 -0.00 -0.04 0.06 -0.06 0.03 -0.00 0.08

46
Table 3 (continued) Panel B: Spearman Correlation Matrix (continued)
BHAR_ INDADJ BONUS CEO
OWNTOP5 OPT% BLOCK PP SIZE M/B %B_INSIDERS B_SIZE B_MEETINGS B_INSIDE
CHAIR BONUS 0.22 CEO_OWN 0.00 -0.25 TOP5_OPT% -0.04 -0.25 0.28 BLOCK 0.05 0.19 -0.17 -0.17 PP 0.00 0.31 -0.30 -0.26 0.50 SIZE 0.00 0.48 -0.46 -0.58 0.25 0.47 M/B -0.08 0.16 -0.09 -0.07 0.04 0.05 0.31 %B_INSIDERS -0.00 -0.09 0.20 0.01 -0.09 -0.20 -0.11 0.01 B_SIZE 0.04 0.30 -0.35 -0.47 0.20 0.28 0.56 -0.01 -0.13 B_MEETINGS -0.04 -0.01 -0.16 -0.03 -0.05 0.06 0.09 -0.05 -0.13 0.12 B_INSIDECHAIR -0.00 0.14 0.12 -0.11 0.03 0.11 0.16 0.02 -0.00 0.08 -0.05 B_STAG 0.05 -0.00 0.00 -0.00 0.04 0.03 -0.06 -0.04 -0.04 0.11 0.05 0.02
Notes: In Panel A, **,*,^ represents statistical significance of the t-statistic (z-statistic) for the difference in mean (median) between the accelerating firms and the control firms at the 1%/5%,10% level two-tailed. The correlation tables depict pair-wise correlation between variables for the combined sample of acceleration and Execucomp control firms. All correlations significant at p < 0.05, two-tailed level are presented in bold. See Table 1 for variable definitions.

47
Table 4 Likelihood of Accelerated Vesting of Stock Options
Pred.
Sign
Coeff. Estimate
(1)
Z-Statistic
(2)
Coeff. Estimate
(3)
Z-Statistic
(4)
Coeff. Estimate
(5)
Z-Statistic
(6)
Marginal Effect
(7) Intercept ? 4.01 5.84** 3.20 3.73** 4.99 6.75** Accounting Factors: UNDER% + 5.19 3.91** 0.676 IMPACT + 166.60 6.40** 14.478 FACTOR(UNDER, IMPACT) 1.28 7.16** 0.163 ADOPTER - -1.81 -2.95** -2.13 -2.25* -1.94 -2.65** -0.266 EQ_ISSUE + 0.41 2.06* 0.35 1.39 0.30 1.44^ 0.051 MEET_BEAT + 0.03 0.00 0.05 0.10 0.08 0.17 0.047 LOSS + 0.60 1.88* 0.17 0.45 0.10 0.28 0.111 D/E + -0.24 -1.87 -0.27 -1.47 -0.34 -2.31 -0.046 STCLAIM + 0.29 2.46** 0.30 2.06* 0.20 1.69* 0.029 Economic Factors: D_CAPITAL + 0.34 1.13 0.61 1.67* 0.44 1.41^ 0.080 BHAR_INDADJ - -0.30 1.35 -0.40 -1.50^ -0.25 -1.10 -0.277 Agency Factors: BONUS + -1.39 -3.51 -1.74 -3.38 -1.26 -3.05 -0.113 CEO_OWN +/- 6.63 4.19** 5.73 3.46** 6.42 4.06** 1.069 TOP5_OPT% + 7.88 2.30* 3.18 0.86 12.61 3.51** 1.050 BLOCK - -6.58 -3.40** -6.23 -2.48** -5.39 -2.71** -1.098 PP - -19.20 -2.85** -19.15 -2.08* -20.56 -2.84** -2.996 %B_INSIDERS + -0.34 -0.53 -0.21 -0.26 -0.51 -0.74 -0.088 B_SIZE + -0.08 -1.79 -0.05 -0.92 -0.08 -1.66 -0.010 B_MEETINGS ? 0.01 0.56 -0.01 -0.35 0.01 0.51 0.002 B_INSIDECHAIR + -0.29 -1.37 0.06 0.20 -0.29 -1.32 -0.047 B_STAG + -0.17 -0.93 -0.11 -0.46 -0.20 -1.03 -0.031 Other variables: SIZE ? -0.43 -5.24** -0.47 -4.34** -0.50 5.68** -0.075 M/B ? 0.02 0.94 0.02 0.70 0.03 1.18 0.003 Pseudo-R2 (Total) 40.06% 55.27% 43.24% Incr.Pseudo-R2 (Acctg) 2.36% 17.57% 5.54% Incr.Pseudo-R2 (Economic) 1.92% 1.07% 2.23% Incr.Pseudo-R2 (Agency) 11.15% 5.31% 10.86%

48
Table 4 (continued)
Note: The estimation equation is : Pr(Accelerated vesting) = β0 + β1 UNDER% + β2 IMPACT + β3 ADOPTERS + β4 EQ_ISSUE
+ β5 MEET_BEAT + β6 LOSS + β7 D/E + β8 STCLAIM + β9 D_CAPITAL + β10 BHAR_INDADJ + β11 BONUS + β12 CEO_OWN + β13 TOP5_OPT% + β14 BLOCK + β15 PP + β16 B_SIZE + β17 %B_INSIDERS + β18 B_MEETINGS + β19 B_INSIDECHAIR + β20 B_STAG + β21 SIZE + β22 M/B + ε (1) Sample consists of 354 accelerating firms with 665 Execucomp control firms. For variable definitions see Table 1. **,*,^ represents statistical significant at the 1%/5%,10% level one-tailed (two-tailed) if the coefficient sign is predicted (not predicted). We do not report significance levels that assume a sign opposite to the one predicted. The marginal effects reported in column (7) are evaluated at the median of the distribution of the independent variables. The Incr. Pseudo R2 represents the incremental Pseudo R2 obtained when including the Accounting, Economic and Agency variables in the model relative to the Pseudo-R2 obtained when including all variables other than Accounting, Economic and Agency variables in the model.

49
Table 5 Abnormal Returns surrounding Accelerated Vesting Announcement
Panel A: Summary statistics from firm-specific estimation of abnormal returns
Event date Accelerated Sample CAR t-statistic -2 -0.03% -0.31 -1 -0.29% -2.20* 0 -0.10% -0.64 1 -0.02% -0.07 2 -0.56% -3.53** (-2,2) -0.99% -2.92**
Panel B: Summary statistics of abnormal returns by disclosure type
Note: Sample consists of 365 acceleration announcements comprising 354 unique firms. CAR represents cumulative abnormal returns. See Table 1 for variable definitions. **,*,^ represents statistical significance at the 1%/5%,10% level two-tailed.
All 10K/Q 8K Press release
Abnormal return -0.99% -1.57% -0.67% -2.18% t-statistic -2.92** -2.15* -1.75^ -1.38 N 365 96 252 17
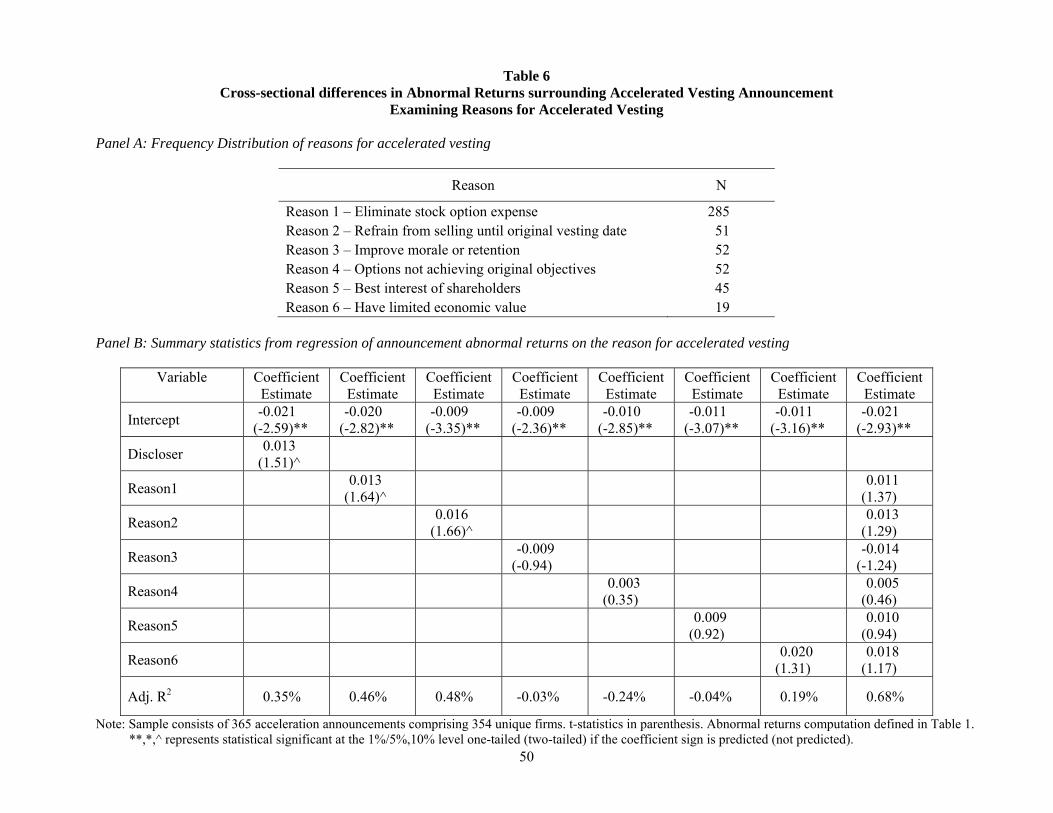
50
Table 6 Cross-sectional differences in Abnormal Returns surrounding Accelerated Vesting Announcement
Examining Reasons for Accelerated Vesting Panel A: Frequency Distribution of reasons for accelerated vesting
Reason N
Reason 1 – Eliminate stock option expense 285 Reason 2 – Refrain from selling until original vesting date 51 Reason 3 – Improve morale or retention 52 Reason 4 – Options not achieving original objectives 52 Reason 5 – Best interest of shareholders 45 Reason 6 – Have limited economic value 19
Panel B: Summary statistics from regression of announcement abnormal returns on the reason for accelerated vesting
Variable Coefficient Estimate
Coefficient Estimate
Coefficient Estimate
Coefficient Estimate
Coefficient Estimate
Coefficient Estimate
Coefficient Estimate
Coefficient Estimate
Intercept -0.021 (-2.59)**
-0.020 (-2.82)**
-0.009 (-3.35)**
-0.009 (-2.36)**
-0.010 (-2.85)**
-0.011 (-3.07)**
-0.011 (-3.16)**
-0.021 (-2.93)**
Discloser 0.013 (1.51)^
Reason1 0.013 (1.64)^
0.011 (1.37)
Reason2 0.016 (1.66)^
0.013 (1.29)
Reason3 -0.009 (-0.94)
-0.014 (-1.24)
Reason4 0.003 (0.35)
0.005 (0.46)
Reason5 0.009 (0.92)
0.010 (0.94)
Reason6 0.020 (1.31)
0.018 (1.17)
Adj. R2 0.35% 0.46% 0.48% -0.03% -0.24% -0.04% 0.19% 0.68%
Note: Sample consists of 365 acceleration announcements comprising 354 unique firms. t-statistics in parenthesis. Abnormal returns computation defined in Table 1. **,*,^ represents statistical significant at the 1%/5%,10% level one-tailed (two-tailed) if the coefficient sign is predicted (not predicted).

51
Table 7 Distribution of Acceleration dates relative to the filing date and stock returns surrounding the
acceleration date Panel A: Distribution of the lag between acceleration date and the filing date
Lag between
acceleration date and filing date
No. of observations
0 16 1 27 2 32 3 19 4 38 5 27 6 85 7 19
>=8 102 Total 365
Panel B: Abnormal stock returns around acceleration dates
Day(s) relative to acceleration date
-20 to 0 1 to 20
Mean p-value Mean p-value
All firms -0.017 -2.63 0.014 2.31 Control firms 0.011 1.71 0.021 2.64
Filing Lag < 2 days -0.014 -0.99 0.027 2.14
Filing Lag 3 to 5 days -0.017 -1.25 0.008 0.48 Filing Lag 6 to 7 days -0.012 -0.99 0.014 1.52 Filing Lag > 7 days -0.026 -1.91 0.010 0.87
Note: Panel A presents the distribution of the number of days between the acceleration date and the announcement date or filing date with the SEC. Panel B presents the stock returns surrounding the acceleration dates for i) the accelerating firms and ii) subsamples based on the lag between the acceleration date and the filing date.


