vesting of long term incentives and ceo careers: holding ...homepages.ed.ac.uk/mainbg/files/vesting...
TRANSCRIPT
1
Vesting of Long Term Incentives and CEO Careers: Holding their feet to the fire
Brian G M Main (University of Edinburgh Business School)
Rolf Thiess (University of Edinburgh Business School)
and
Vicky Wright
(Towers Watson) August 2010
2
Vesting of Long Term Incentives and CEO Careers
Brian G M Main*, Rolf Thiess* and Vicky Wright#
*University of Edinburgh Business School, Edinburgh, UK EH8 9JY [email protected]; [email protected]
#Towers Watson, London, UK SW1H 9LL
Manuscript Type: Conceptual/Empirical
Research Question/Issue: The recent financial crisis has sparked a serious re-examination of the structure of incentive pay. This paper evaluates the key concept embedded in recent policy statements (FSA, 2009; G-20/FSB, 2009; Walker Report, 2009), namely that there should be a shift away from short term incentive schemes in favour of longer term vesting – possibly over the whole CEO career and certainly extending beyond retirement date (Bebchuk & Fried, 2009; Bhagat & Romano, 2009). Research Findings/Insights Using those FTSE350 CEOs whose careers terminated between 1992 and 2007, the impact of such a career-vesting arrangement is shown to improve the pay-performance relationship in terms of settling-up over the career by incorporating an automatic claw-back effect for subsequent poor performance.
Theoretical/Academic Implications: Analysis from an agency perspective reveals that while offering an improvement over conventional restricted shares, career vesting results in a weaker pay-performance connection than performance shares based on relative performance metrics. But the career shares approach offers advantages in terms of clawback, succession planning and transparency.
Practitioner/Policy Implications: For successful CEOs, the cumulative effect of the arrangement may influence investment and succession decisions towards career end. Remuneration committees would be wise to take care in communicating such rewards to shareholders, and might be required to adjust the overall remuneration package in the light of tax and risk bearing consequences. KEYWORDS: Corporate Governance; Long Term Incentives; Vesting; CEO Career.
3
INTRODUCTION
The role of incentive pay has emerged as among the chief suspects in most analyses
of the causes of the recent financial crisis. Criticism has focused less on the size of
the rewards at stake and more on the short time horizon between recorded
performance and payout. In response to this perception, the G-20 encouraged the
cross national adoption of remuneration standards in the financial sector as laid out by
the Financial Services Authority (FSA, 2009) and the Financial Stability Board (FSB,
2009). These added to the momentum already given in some countries to the reform
of remuneration in this area (e.g., by the Walker Review, 2009, in the UK). In all of
this, the essential thrust is towards deferring the majority of bonus payments, using
significant vesting periods for incentive pay, and ensuring greater provision for claw-
back in the event of disappointing completed performance. Although aimed
specifically at the financial sector, it is widely expected that these influences will
affect executive remuneration practice more widely.
In the USA, in addition to signing up to the G20-backed reforms, efforts were
made to contain the level of incentive payments in those companies covered by the
Troubled Asset Relief Program (TARP) by limiting incentives to one-third of the
annual remuneration received by executives (US Treasury, 2009). This limit could be
exceeded if the incentive was in the form of restricted shares not vesting until after all
outstanding TARP obligations had been met. So the overall thrust of reform is, again,
towards deferred payments with vesting periods of significant length.
Reflecting these policy initiatives, two academic contributors to the debate
have offered a new perspective on incentive pay by suggesting that incentive
alignment could be improved by moving from a typical three-year vesting period
towards a significantly longer arrangement. Bhagat & Romano (2009) recommend
4
that long term incentive awards should not vest until two to four years after the last
day in office (retirement or other exit from the firm). Bebchuk & Fried (2009)
suggest that it would be sufficient to have a pre-agreed extension period after vesting
before the executive is permitted to cash-out the majority of the award (whether
options or restricted shares) – the authors allude to a period of 10 years after vesting.
Both papers point to a range of companies that have used similar practices in the past
(Boeing, Citigroup, Exxon Mobil, Goldman Sachs, Merrill Lynch).
Such delayed vesting or delayed cash-out arrangements not only ensure that
executives build and ever increasing stake in their company as their time in post
lengthens, but also guarantee an automatic ‘claw back’ effect, as subsequent poor
performance reduces the value of earlier incentive awards before they can be cashed
out, or realised. The automatic or programmed nature of this approach also makes it
difficult for the executive to manipulate the timing of the exercise of options and/or
the release of corporate news so as to advantage themselves (Bebchuk et al., 2009;
Lie, 2005; Lomax, 2008).
To investigate the empirical scope of such an approach, this paper applies
several variants of the proposals in the context of the actual completed career histories
recorded by CEOs in the UK FTSE3501 during the period 1993-2007. These actual
career histories (start-dates and end-dates) are utilised in conjunction with each
company’s performance as recorded in the London Stock Price Database (LSPD).
The following section discusses the theoretical underpinnings of the approach. There
is then a section that introduces the data and explains the calculations made in arriving
at the results presented. The results themselves are available in a separate section, and
the paper ends with a review of the policy ramifications of these results and a brief
conclusion.
5
INCENTIVE PAY AND PERFORMANCE
The use of pay-for-performance for executives was originally seen as a remedy for the
principal-agent problem (Jensen & Meckling, 1976) that arises when the professional
management of a company lacks both an adequate ownership stake in the company
and effective direct supervision (i.e., in most widely held public companies).
Delivering part of executive pay in the form of equity instruments (shares or options),
which do not vest to the executive (pass into ownership) until a time some years in the
future, creates a beneficial alignment of interest between the executives and the
owners.
Initial analysis of the arrangements in place for CEOs in the USA (Jensen &
Murphy, 1990) produced estimates of the pay-performance connection that were seen
as empirically too modest to support this as a realistic view of executive pay – leading
the authors to suggest that CEOs were paid more like bureaucrats (according to the
size of their company) than anything else. But the shareholder-value movement of the
1980s and various tax considerations (Murphy, 2002) caused companies to adopt a
more aggressive use of executive share options and performance/restricted shares,
allowing later studies to demonstrate that the predicted pay-performance effect was
empirically significant (Hall & Liebman, 1998; Hall & Murphy, 2000).
Bebchuk & Grinstein (2005) report that the performance related component of
executive pay in the USA grew from 37% in 1993 to 57% by 2003. Conyon et al.
(2009) report that much of the USA-UK difference in the level of CEO pay can be
explained by the higher amounts of equity pay used in the USA. But even in the UK
the use of incentive pay in the board room has increased markedly. Following what
6
was interpreted as critical comment in the Greenbury Report (1995) concerning the
use of executive share option schemes, companies moved to adopt performance share
plans. Booker & Wright (2006) report their adoption in 52% of FTSE100 companies
by 1999, rising to 84% by 2005. Some of these companies replaced their option
schemes with performance share plans, others utilised both. Gregory-Smith (2009)
reports that in 2005 incentive pay accounted for over 50% of median executive
remuneration in his sample of FSTE350 boards.
Statistical studies of the effectiveness of boards in linking the pay of their
executives to company performance continue to record mixed results. Meta studies
based on the large numbers of papers in the area (Tosi et al., 2000; Rost & Osterloh,
2009) fail to find a significant connection. Given the aggressive expansion of the use
of equity-linked CEO pay, these results appear surprising and have recently been
challenged by Clementi & Cooley (2009), Core & Guay (2010), and Nyberg et al.
(2010) who emphasise the importance of including all of the CEO’s equity in the firm
(prior unvested grants as well as current grants) and of getting the timing right
between the realisation of the share and option gains on the one hand, and
performance over the period covered by such grants on the other.
While there may remain a number of critics who doubt the efficacy with
which share-based rewards are administered in the boardroom, seeing the process as
being hostage to managerial power (Bebchuk & Fried, 2004), the overwhelming
importance of this component of pay suggests that the career vesting proposals
discussed here have a key role to play in the design of executive pay. The extension
of vesting, or more precisely cashing-in restrictions on incentive shares clearly
suggests the following hypothesis:
7
Hypothesis 1: Career vesting of incentive share awards will enhance the
reward of more successful CEOs and reduce the reward of less successful
CEOs.
To keep the focus on the question of career-length vesting, only grants of
shares will be considered in the following calculations. The relative role of shares
versus options in the recent financial crisis is still being debated, but early evidence
seems to suggest that share related rewards played little or no role in engendering
excessive risk taking (De Young, 2009; Fahlenbrach & Stultz, 2009; Suntheim, 2010).
In the career-vesting approach, no additional performance condition will be imposed
other than remaining in employment, and nor will other forms of pay be included. As
a comparison, however, career vesting will be contrasted with the type of relative-
TSR (total shareholder return) arrangement that has become common for performance
shares in the UK:
Hypothesis 2: Career vesting of incentive share awards produces a pay-
performance relationship that is at least as strong as performance shares
under a relative-performance scheme based on total shareholder return.
Details on data and estimation are given in the following section.
DATA COLLECTION AND COMPUTATION
To identify the sample of CEO careers included in the study, all companies present in
the FTSE350 at December in each year between 1992 and 2006 are identified. Even if
the company subsequently drops out of the index, it is still followed through to the
end of 2007. All subsequent CEO departures from these companies are recorded, and
the original start-date of that CEO is identified. Interim CEOs are ignored, as are any
8
careers lasting less than 6 months. In the resulting 1,292 CEO careers, the typical
length is remarkably brief, with an overall median of 4.3 years and mean of 5.7 years.
At all times, however, there are long serving CEOs observed in this sample – the
longest completed career observed is 34 years long, but in no year does the maximum
fall below 16 years.
The London Share Price Database (LSPD) is used to identify the performance
of the company over the duration of each CEO career (and potentially for up to 4
years following the exit of the CEO, if the company maintains a listing for that length
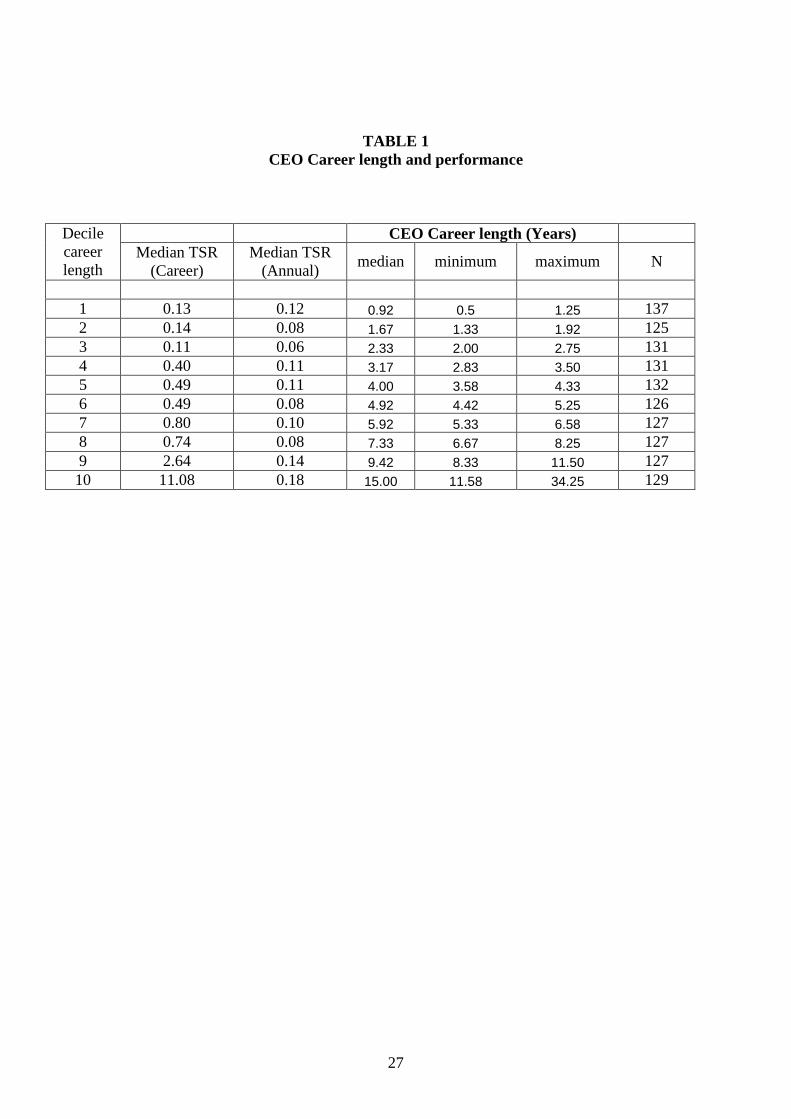
of time). Table 1 summarises by decile of CEO completed career the shareholder
return during each CEO’s tenure. Although it is clear that longer serving CEOs can
claim a superior performance (the top decile recording a median annual TSR of 18%),
the relationship between tenure and performance is not monotonic. Even in the case of
the career cumulative TSR measure the relationship between tenure and performance
is not straightforward. This may, in part, be due to better performing CEOs being
lured away early in their careers to other companies, in addition to poorer performing
CEOs having their careers terminated earlier. The vagaries of the business cycle will
also impact on company performance. But the connection between performance and
length of career is sufficiently weak to suggest that there is scope for pay-related
forms of incentive.
-------------------------------
Insert Table 1 about here
-------------------------------
To investigate the scope for pay incentives (and long term incentives, in
particular), the rewards resulting from each CEO’s career performance are computed.
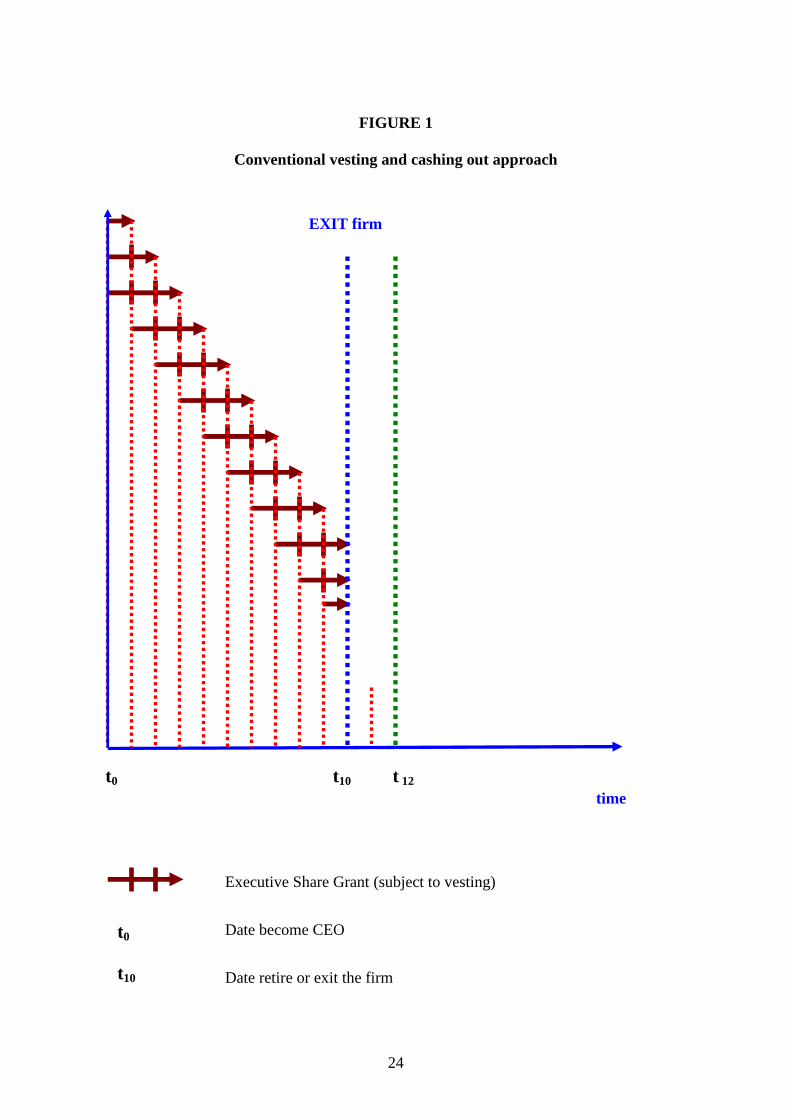
To facilitate comparability, the incentive scheme in question is assumed to take the
9
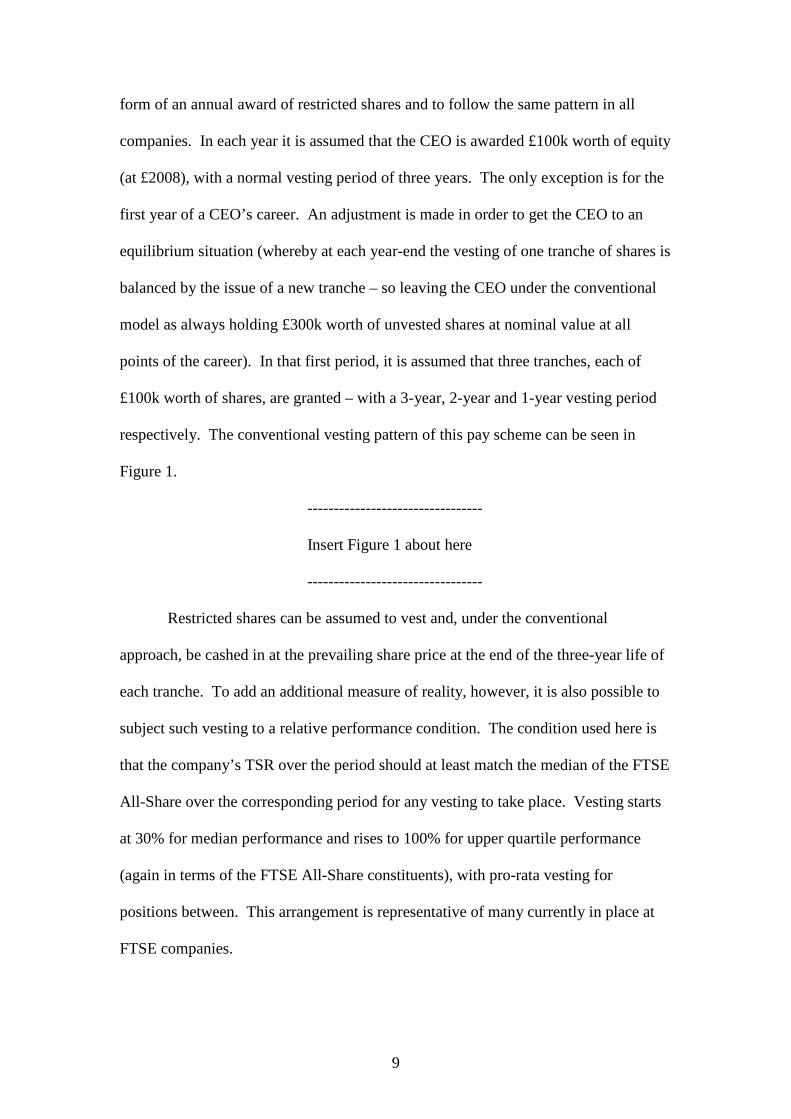
form of an annual award of restricted shares and to follow the same pattern in all
companies. In each year it is assumed that the CEO is awarded £100k worth of equity
(at £2008), with a normal vesting period of three years. The only exception is for the
first year of a CEO’s career. An adjustment is made in order to get the CEO to an
equilibrium situation (whereby at each year-end the vesting of one tranche of shares is
balanced by the issue of a new tranche – so leaving the CEO under the conventional
model as always holding £300k worth of unvested shares at nominal value at all
points of the career). In that first period, it is assumed that three tranches, each of
£100k worth of shares, are granted – with a 3-year, 2-year and 1-year vesting period
respectively. The conventional vesting pattern of this pay scheme can be seen in
Figure 1.
---------------------------------
Insert Figure 1 about here
---------------------------------
Restricted shares can be assumed to vest and, under the conventional
approach, be cashed in at the prevailing share price at the end of the three-year life of
each tranche. To add an additional measure of reality, however, it is also possible to
subject such vesting to a relative performance condition. The condition used here is
that the company’s TSR over the period should at least match the median of the FTSE
All-Share over the corresponding period for any vesting to take place. Vesting starts
at 30% for median performance and rises to 100% for upper quartile performance
(again in terms of the FTSE All-Share constituents), with pro-rata vesting for
positions between. This arrangement is representative of many currently in place at
FTSE companies.
10
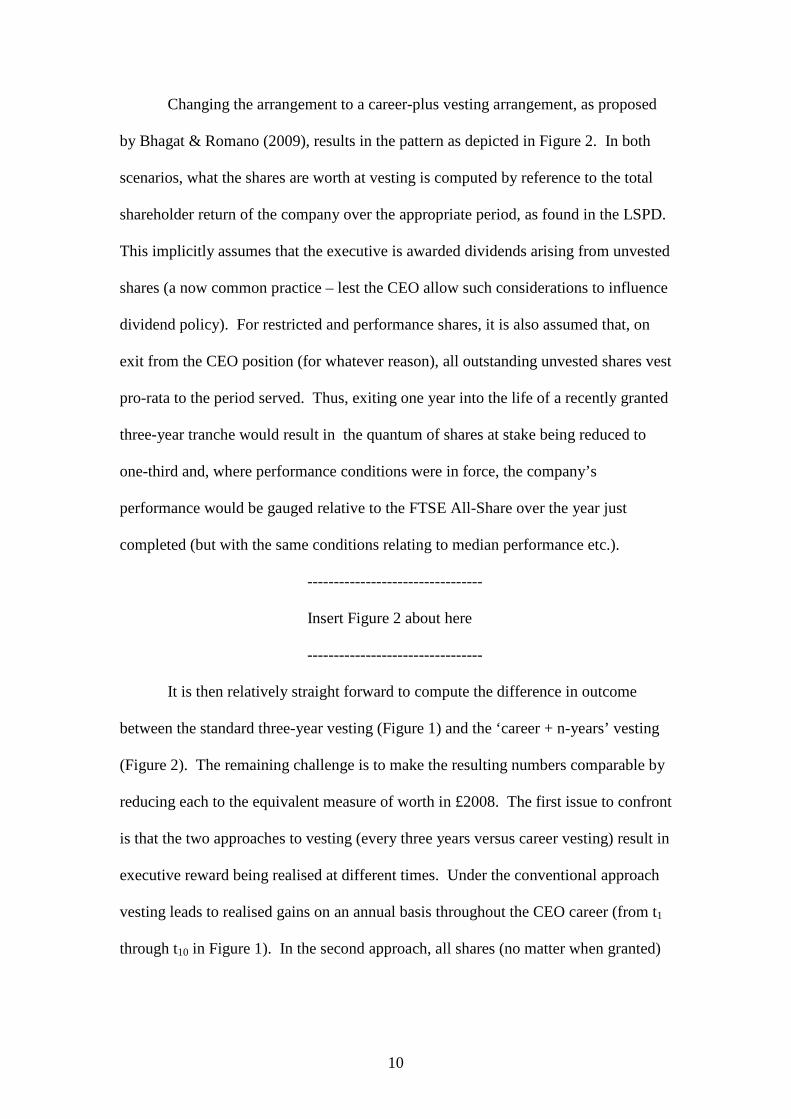
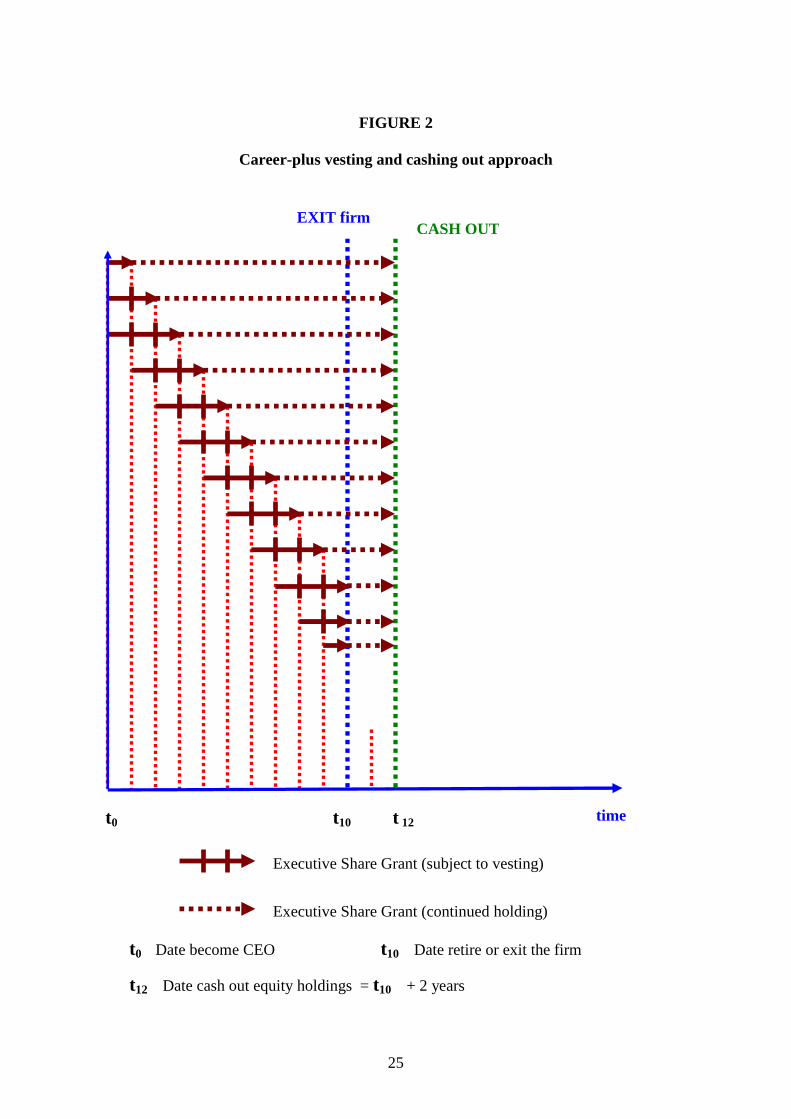
Changing the arrangement to a career-plus vesting arrangement, as proposed
by Bhagat & Romano (2009), results in the pattern as depicted in Figure 2. In both
scenarios, what the shares are worth at vesting is computed by reference to the total
shareholder return of the company over the appropriate period, as found in the LSPD.
This implicitly assumes that the executive is awarded dividends arising from unvested
shares (a now common practice – lest the CEO allow such considerations to influence
dividend policy). For restricted and performance shares, it is also assumed that, on
exit from the CEO position (for whatever reason), all outstanding unvested shares vest
pro-rata to the period served. Thus, exiting one year into the life of a recently granted
three-year tranche would result in the quantum of shares at stake being reduced to
one-third and, where performance conditions were in force, the company’s
performance would be gauged relative to the FTSE All-Share over the year just
completed (but with the same conditions relating to median performance etc.).
---------------------------------
Insert Figure 2 about here
---------------------------------
It is then relatively straight forward to compute the difference in outcome
between the standard three-year vesting (Figure 1) and the ‘career + n-years’ vesting
(Figure 2). The remaining challenge is to make the resulting numbers comparable by
reducing each to the equivalent measure of worth in £2008. The first issue to confront
is that the two approaches to vesting (every three years versus career vesting) result in
executive reward being realised at different times. Under the conventional approach
vesting leads to realised gains on an annual basis throughout the CEO career (from t1
through t10 in Figure 1). In the second approach, all shares (no matter when granted)
11
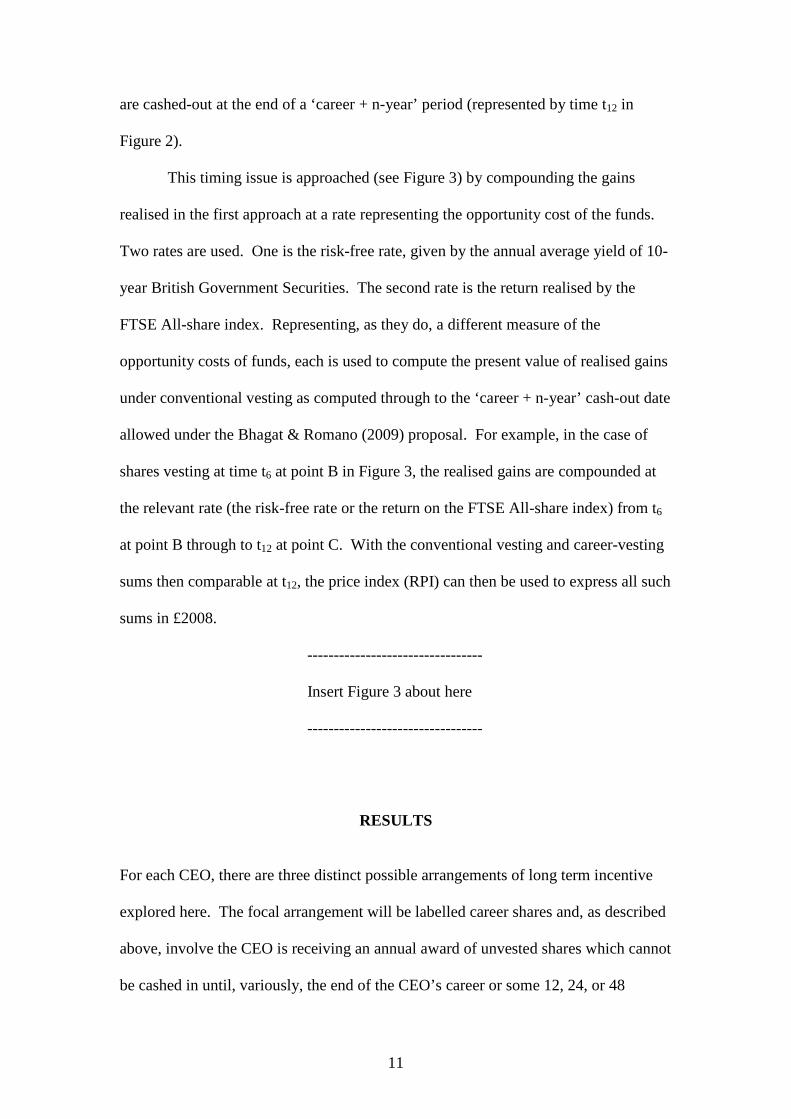
are cashed-out at the end of a ‘career + n-year’ period (represented by time t12 in
Figure 2).
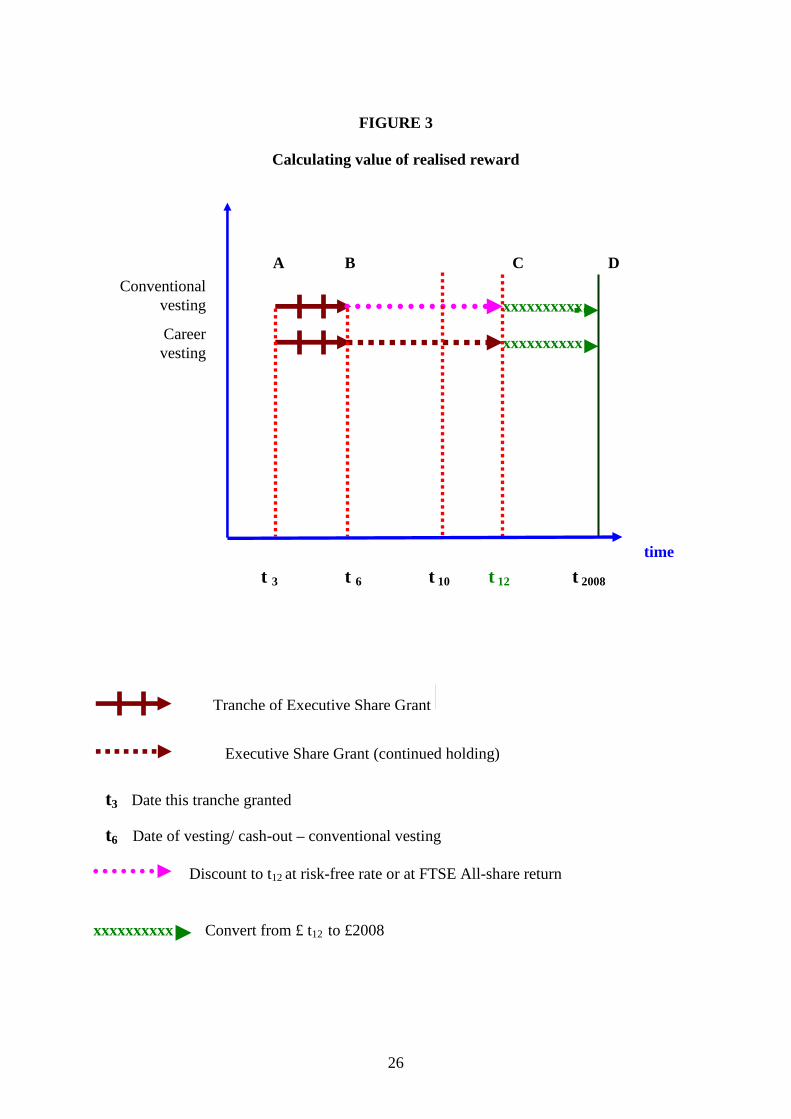
This timing issue is approached (see Figure 3) by compounding the gains
realised in the first approach at a rate representing the opportunity cost of the funds.
Two rates are used. One is the risk-free rate, given by the annual average yield of 10-
year British Government Securities. The second rate is the return realised by the
FTSE All-share index. Representing, as they do, a different measure of the
opportunity costs of funds, each is used to compute the present value of realised gains
under conventional vesting as computed through to the ‘career + n-year’ cash-out date
allowed under the Bhagat & Romano (2009) proposal. For example, in the case of
shares vesting at time t6 at point B in Figure 3, the realised gains are compounded at
the relevant rate (the risk-free rate or the return on the FTSE All-share index) from t6
at point B through to t12 at point C. With the conventional vesting and career-vesting
sums then comparable at t12, the price index (RPI) can then be used to express all such
sums in £2008.
---------------------------------
Insert Figure 3 about here
---------------------------------
RESULTS
For each CEO, there are three distinct possible arrangements of long term incentive
explored here. The focal arrangement will be labelled career shares and, as described
above, involve the CEO is receiving an annual award of unvested shares which cannot
be cashed in until, variously, the end of the CEO’s career or some 12, 24, or 48
12
months after that termination. This is contrasted with a similar annual award of
restricted shares (with a three-year vesting period) and an award of performance
shares (again with a three-year vesting period). As both restricted shares and
performance shares are assumed to be cashed in on vesting, in each case
comparability with the career shares is effected by calculating the present values of
such realised gains using the rate of return on equities (FTSE All Share index) over
the comparable period. This results in three outcome measures for each of the four
lengths of career restriction considered. A fourth measure can be introduced by
calculating a version of career vesting wherein the number of each tranche of share
awards that is held through to the end of the period is dependent on the relative
performance conditions – so producing a hybrid of career shares and performance
shares (labelled “career shares_plus” here).
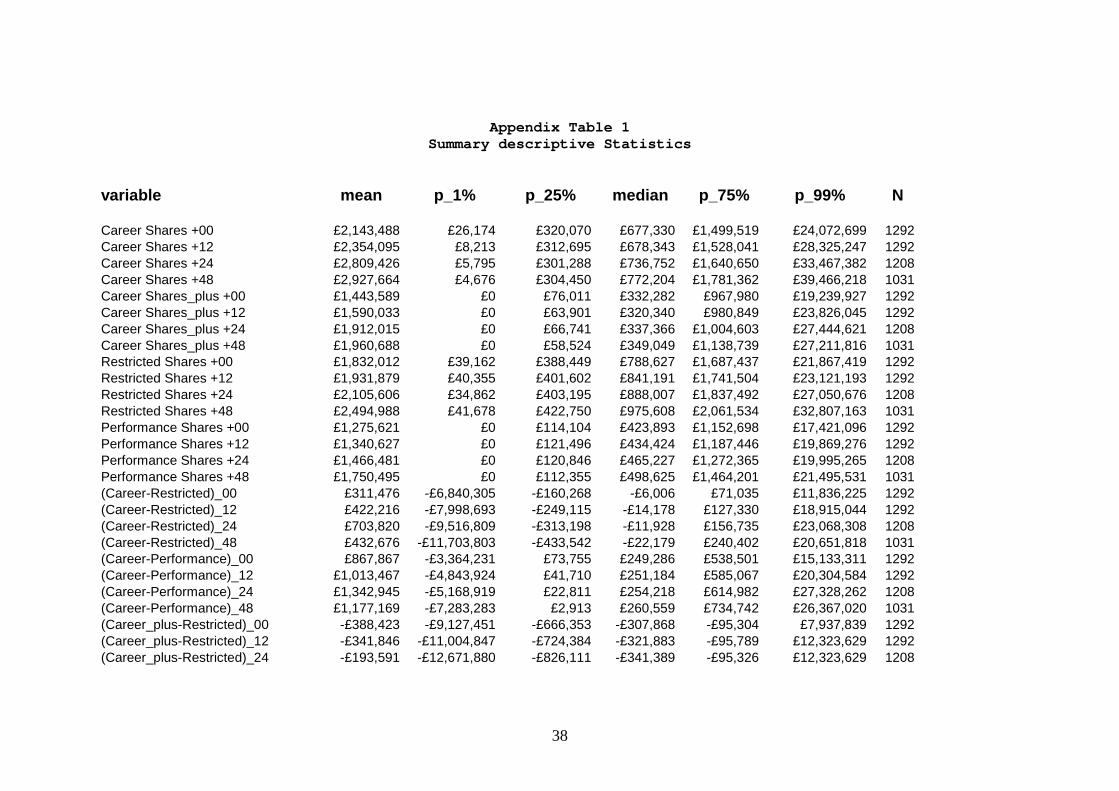
Appendix Table 1 provides basic descriptive variables on these outcome
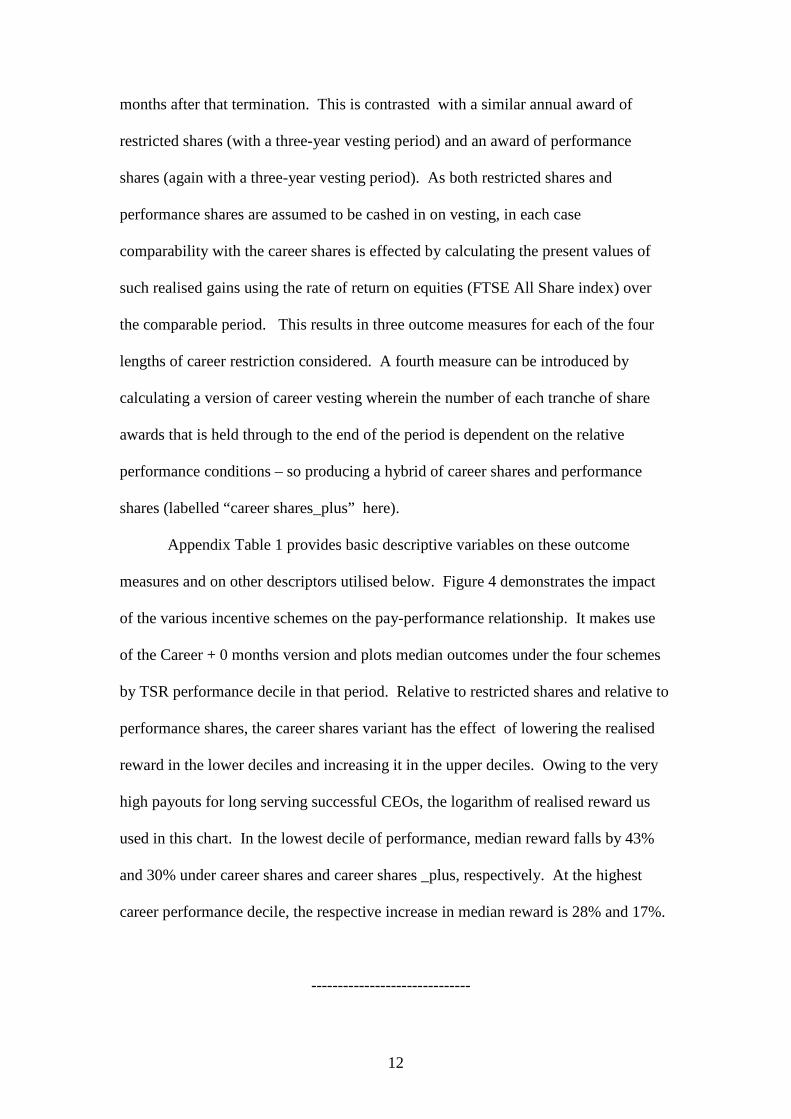
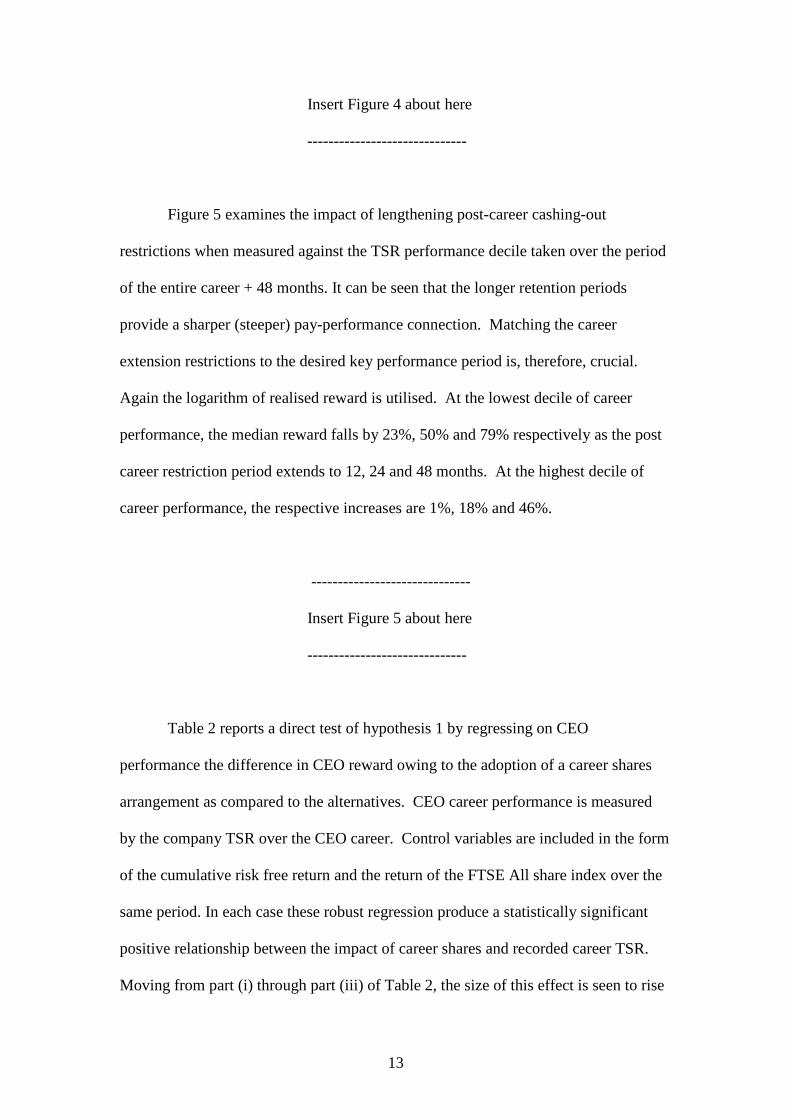
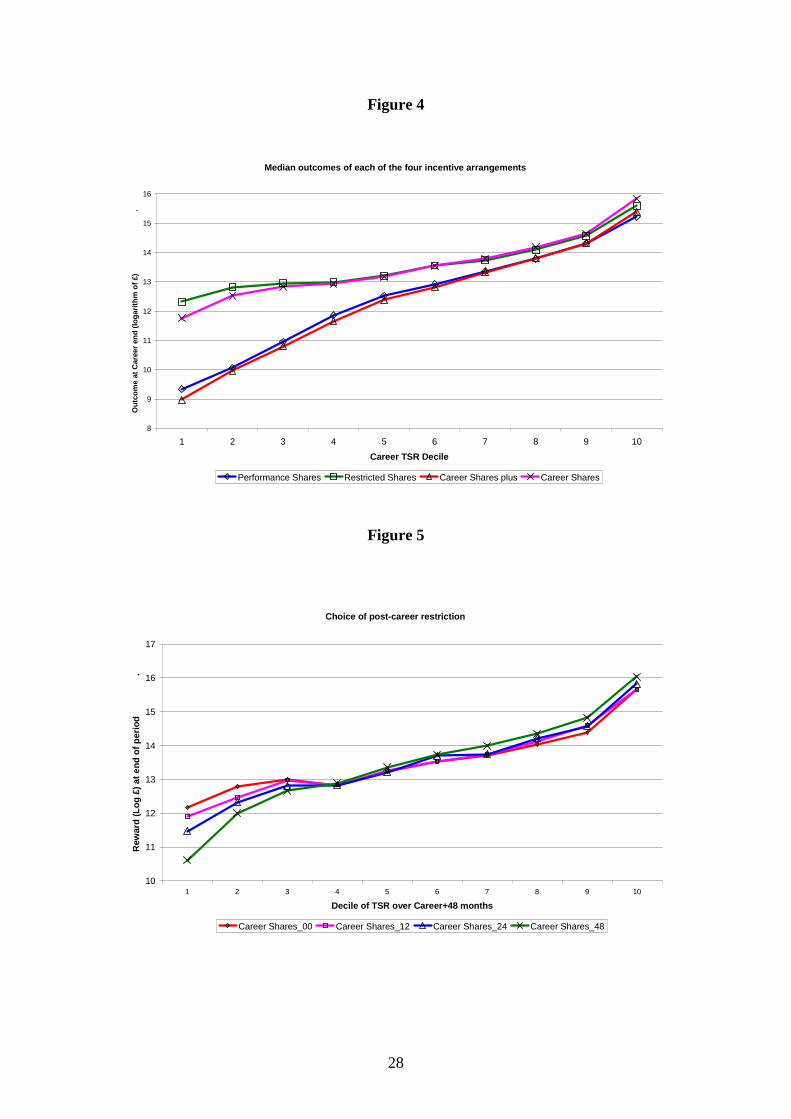
measures and on other descriptors utilised below. Figure 4 demonstrates the impact
of the various incentive schemes on the pay-performance relationship. It makes use
of the Career + 0 months version and plots median outcomes under the four schemes
by TSR performance decile in that period. Relative to restricted shares and relative to
performance shares, the career shares variant has the effect of lowering the realised
reward in the lower deciles and increasing it in the upper deciles. Owing to the very
high payouts for long serving successful CEOs, the logarithm of realised reward us
used in this chart. In the lowest decile of performance, median reward falls by 43%
and 30% under career shares and career shares _plus, respectively. At the highest
career performance decile, the respective increase in median reward is 28% and 17%.
------------------------------
13
Insert Figure 4 about here
------------------------------
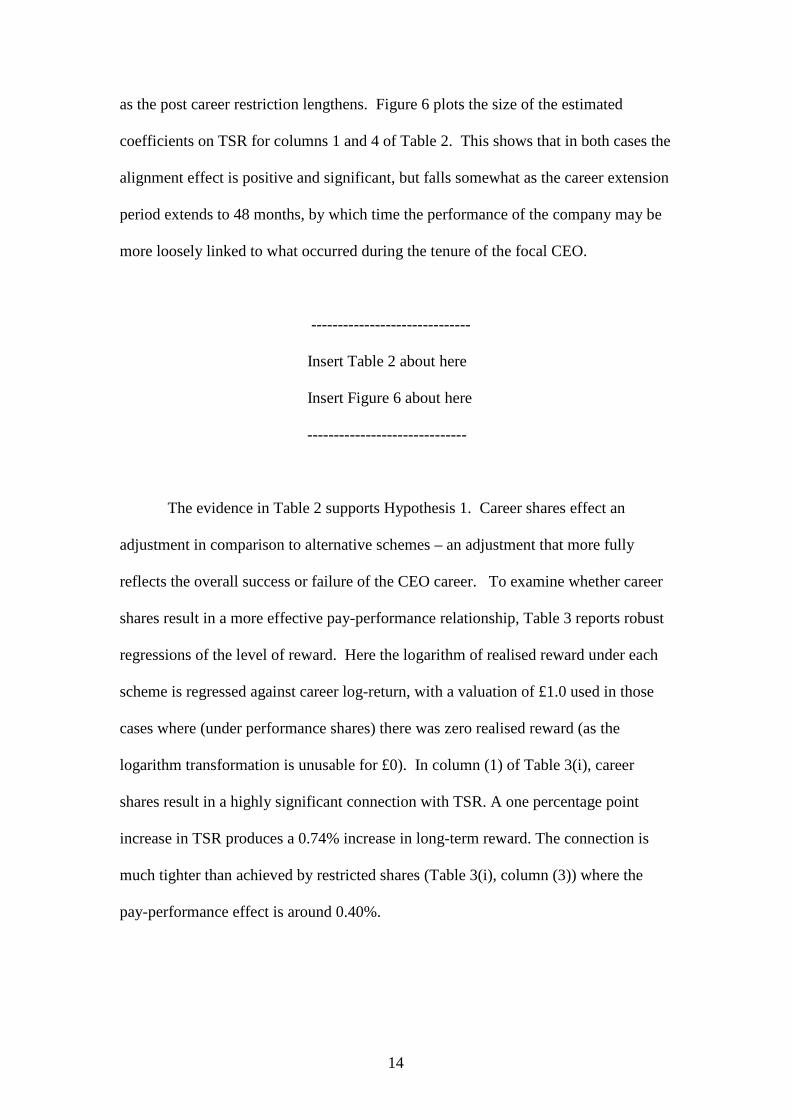
Figure 5 examines the impact of lengthening post-career cashing-out
restrictions when measured against the TSR performance decile taken over the period
of the entire career + 48 months. It can be seen that the longer retention periods
provide a sharper (steeper) pay-performance connection. Matching the career
extension restrictions to the desired key performance period is, therefore, crucial.
Again the logarithm of realised reward is utilised. At the lowest decile of career
performance, the median reward falls by 23%, 50% and 79% respectively as the post
career restriction period extends to 12, 24 and 48 months. At the highest decile of
career performance, the respective increases are 1%, 18% and 46%.
------------------------------
Insert Figure 5 about here
------------------------------
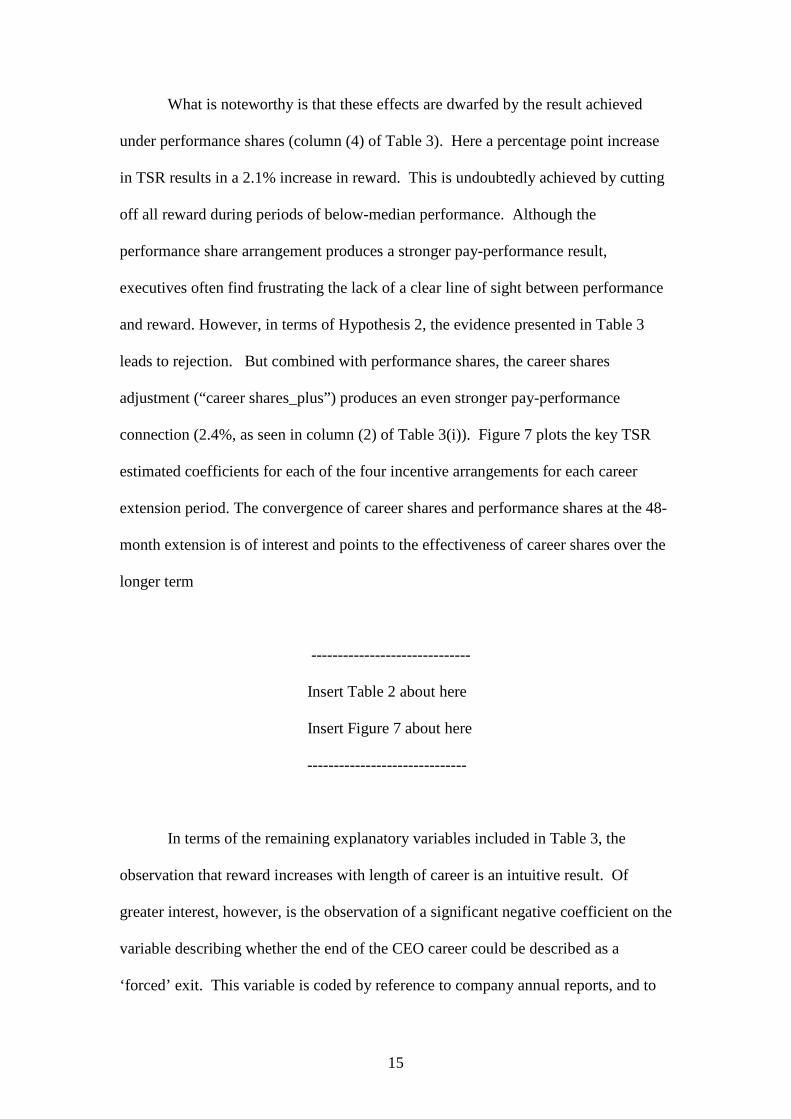
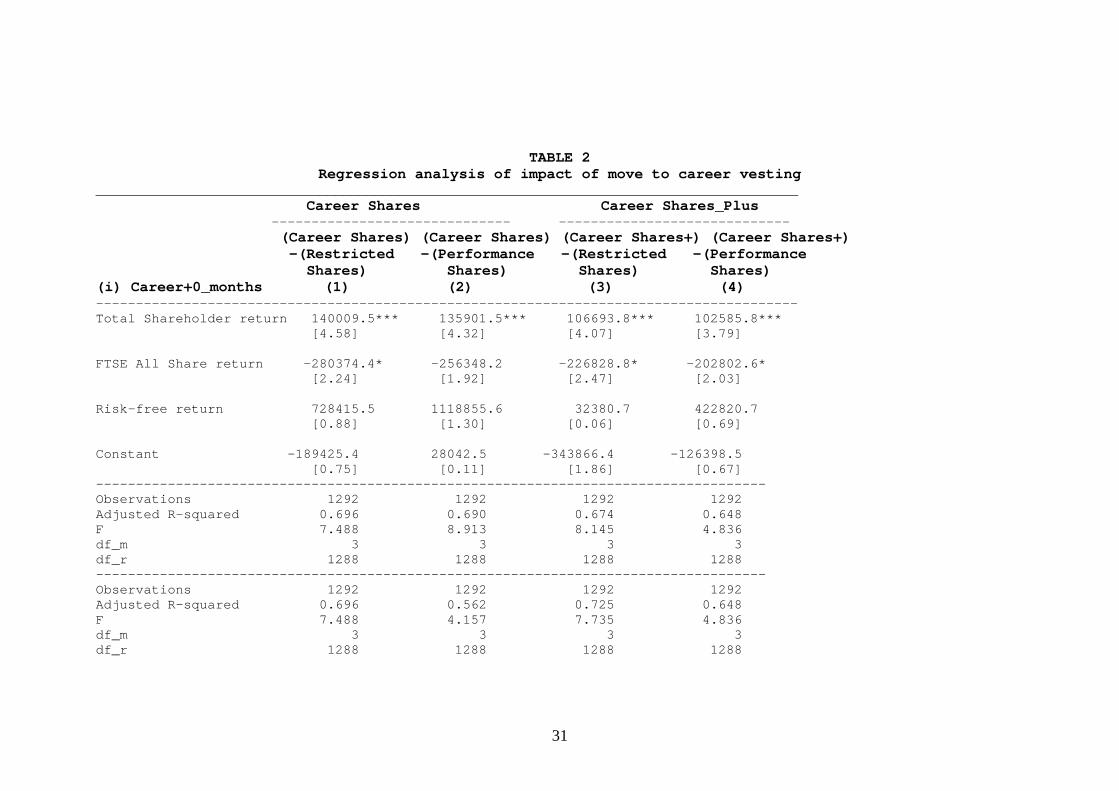
Table 2 reports a direct test of hypothesis 1 by regressing on CEO
performance the difference in CEO reward owing to the adoption of a career shares
arrangement as compared to the alternatives. CEO career performance is measured
by the company TSR over the CEO career. Control variables are included in the form
of the cumulative risk free return and the return of the FTSE All share index over the
same period. In each case these robust regression produce a statistically significant
positive relationship between the impact of career shares and recorded career TSR.
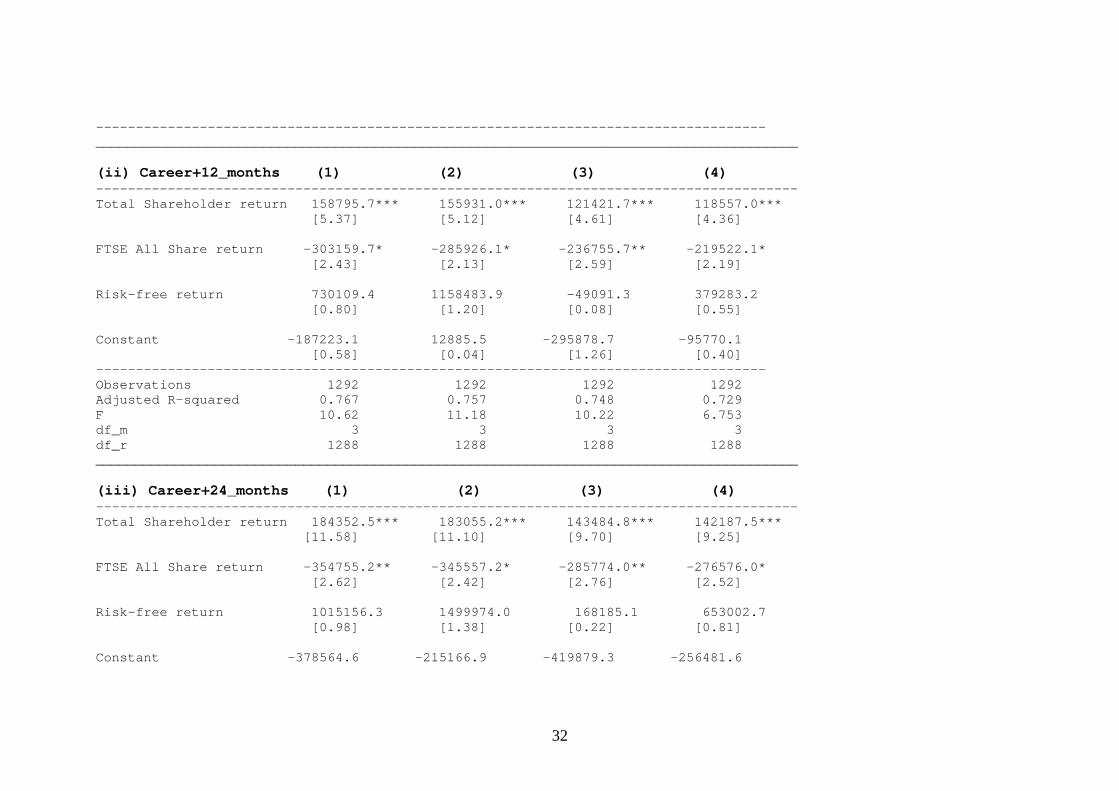
Moving from part (i) through part (iii) of Table 2, the size of this effect is seen to rise
14
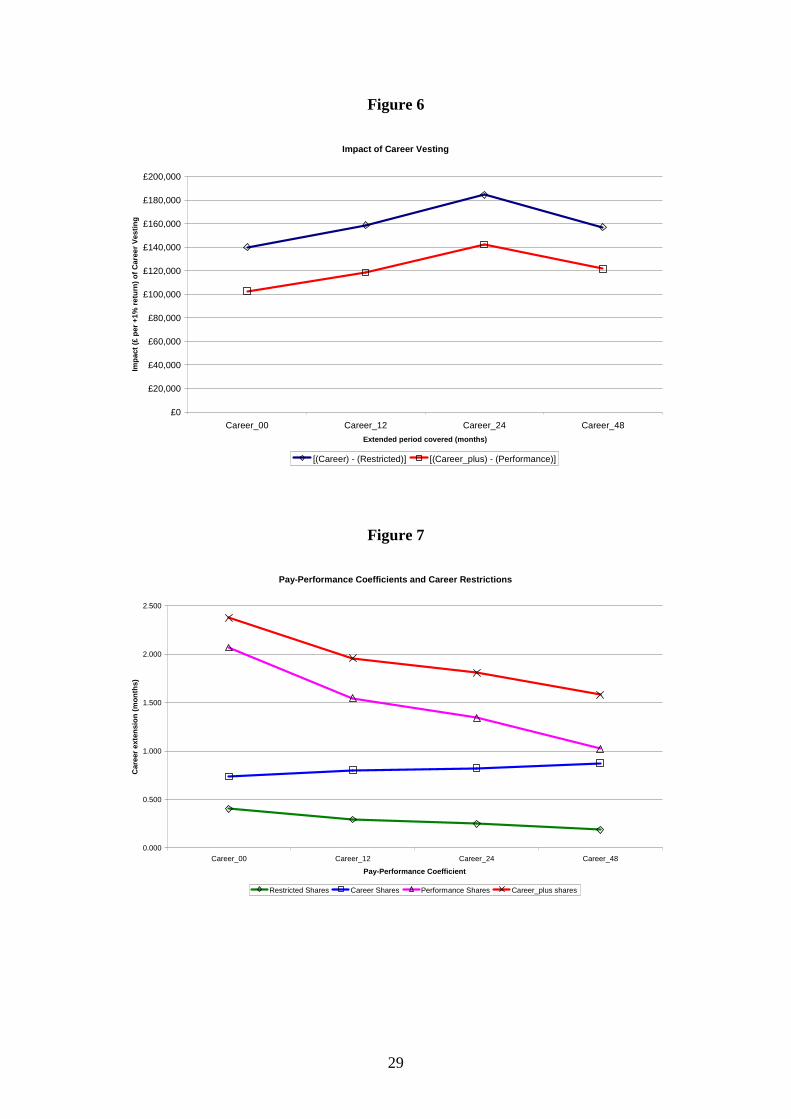
as the post career restriction lengthens. Figure 6 plots the size of the estimated
coefficients on TSR for columns 1 and 4 of Table 2. This shows that in both cases the
alignment effect is positive and significant, but falls somewhat as the career extension
period extends to 48 months, by which time the performance of the company may be
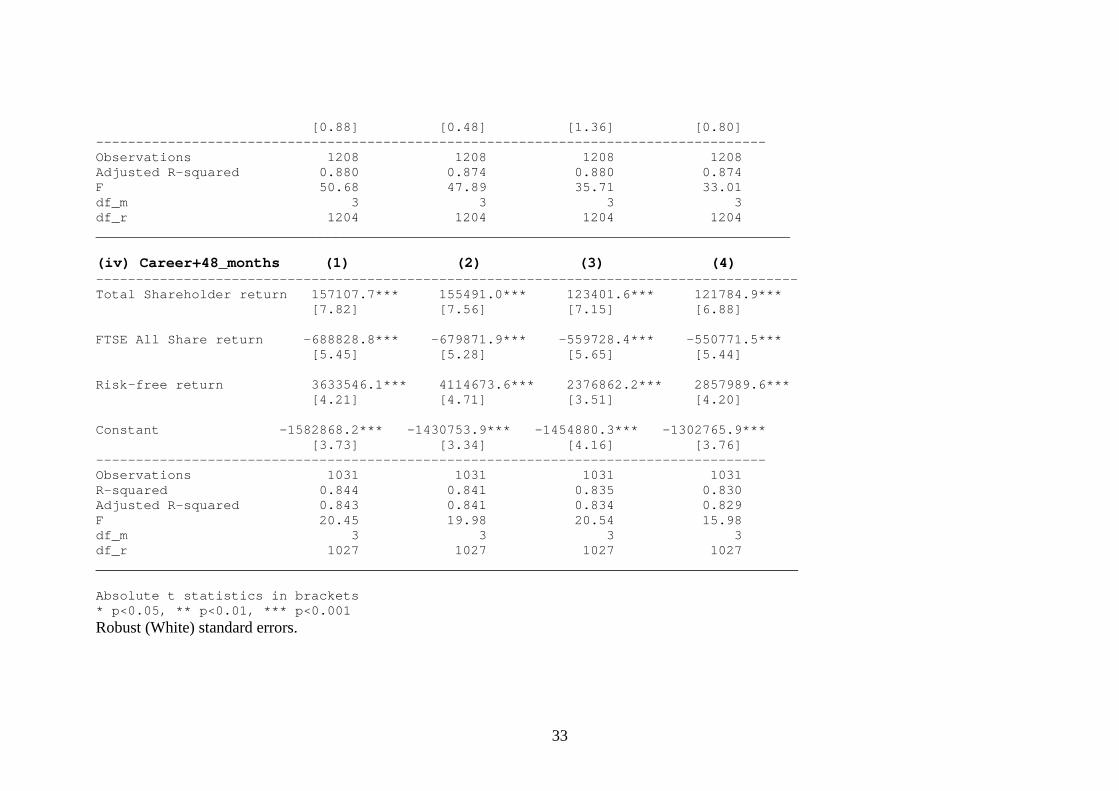
more loosely linked to what occurred during the tenure of the focal CEO.
------------------------------
Insert Table 2 about here
Insert Figure 6 about here
------------------------------
The evidence in Table 2 supports Hypothesis 1. Career shares effect an
adjustment in comparison to alternative schemes – an adjustment that more fully
reflects the overall success or failure of the CEO career. To examine whether career
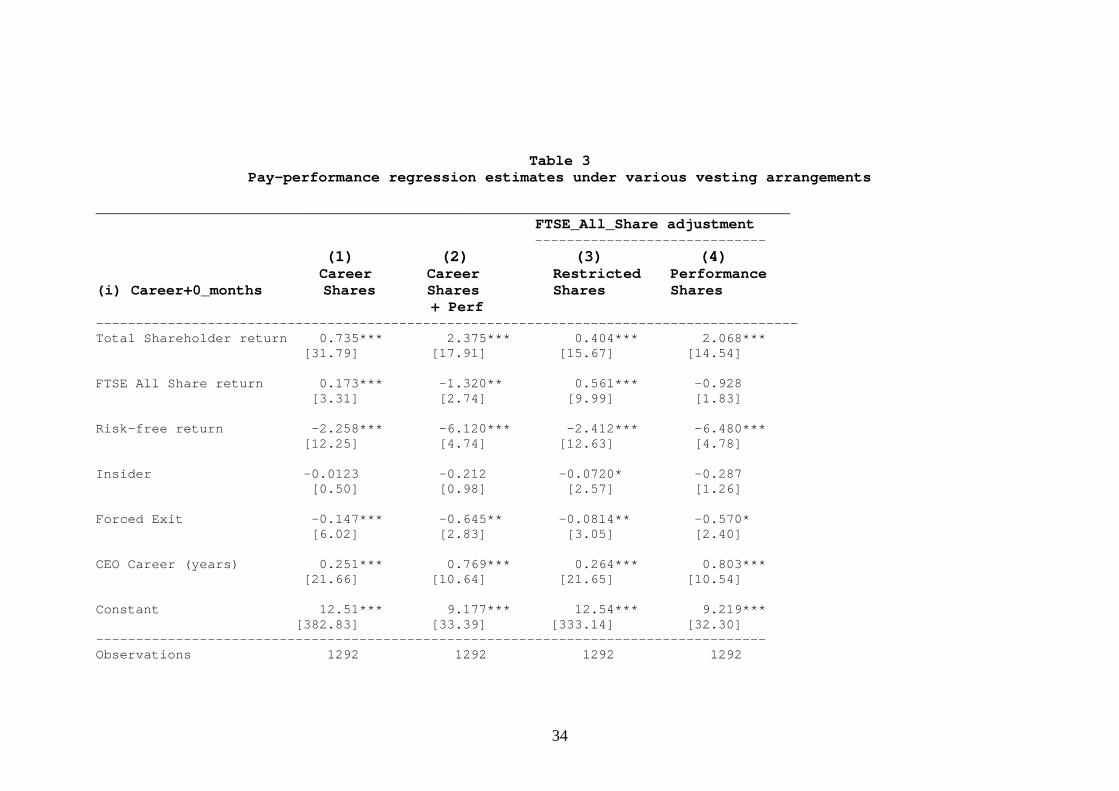
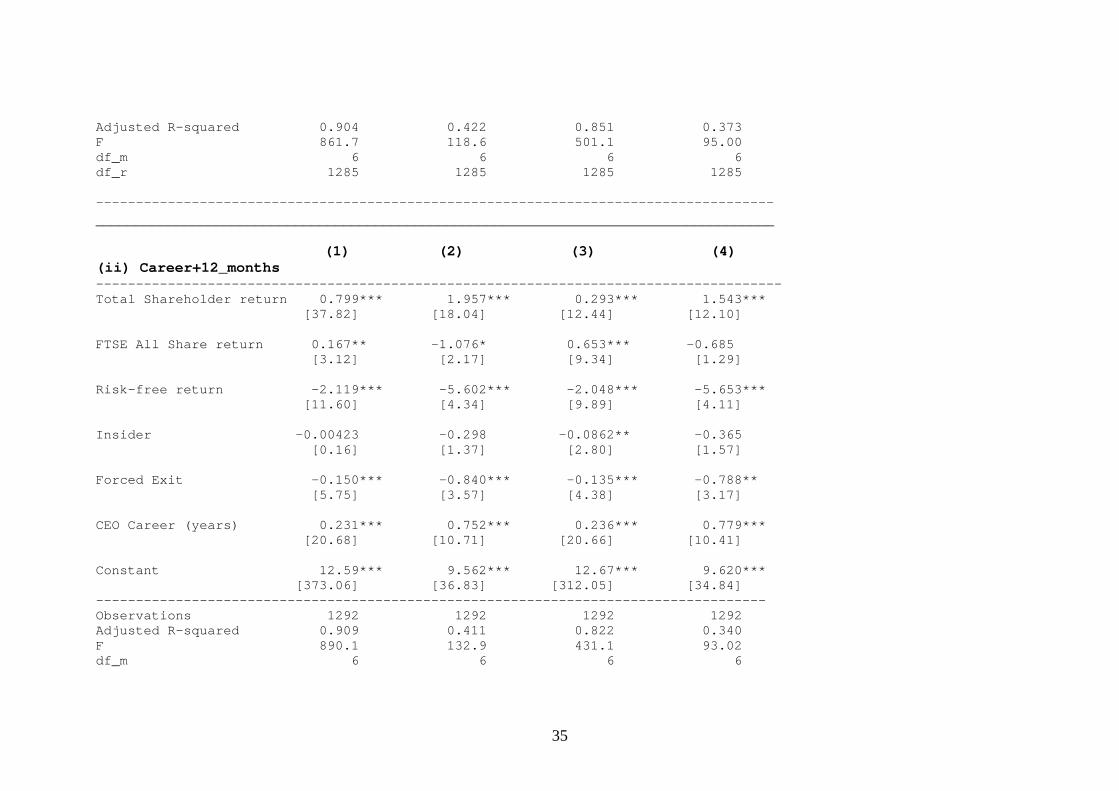
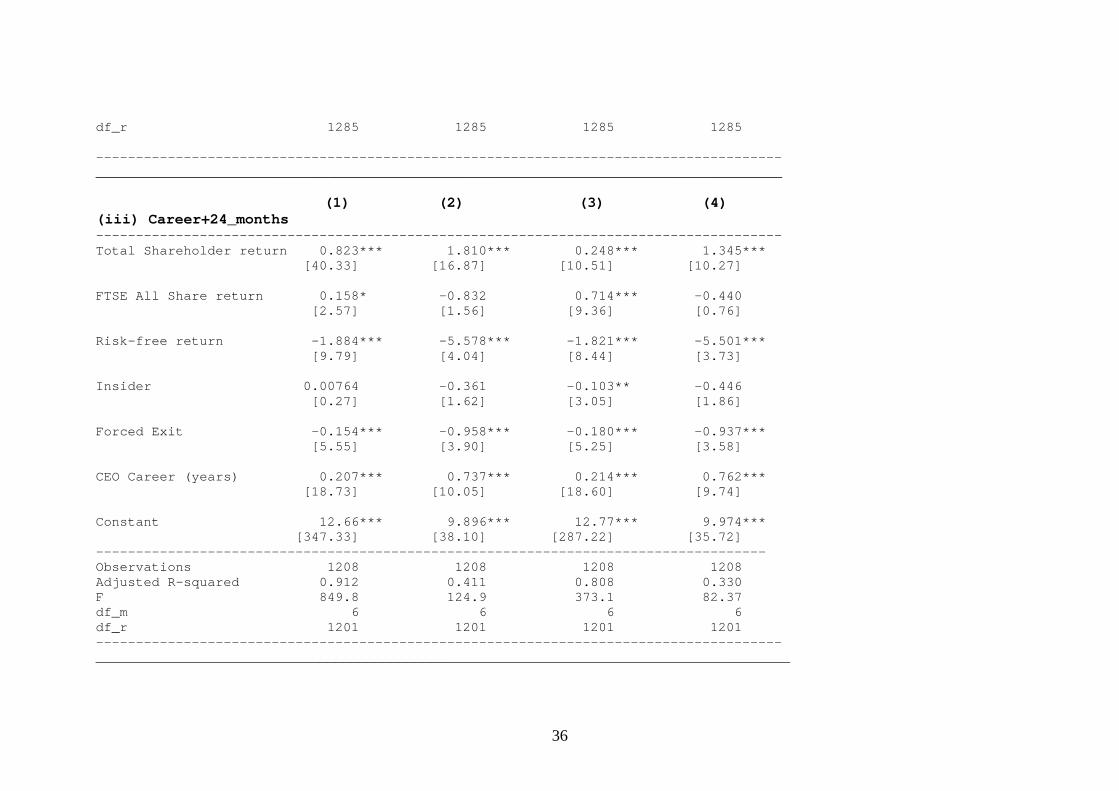
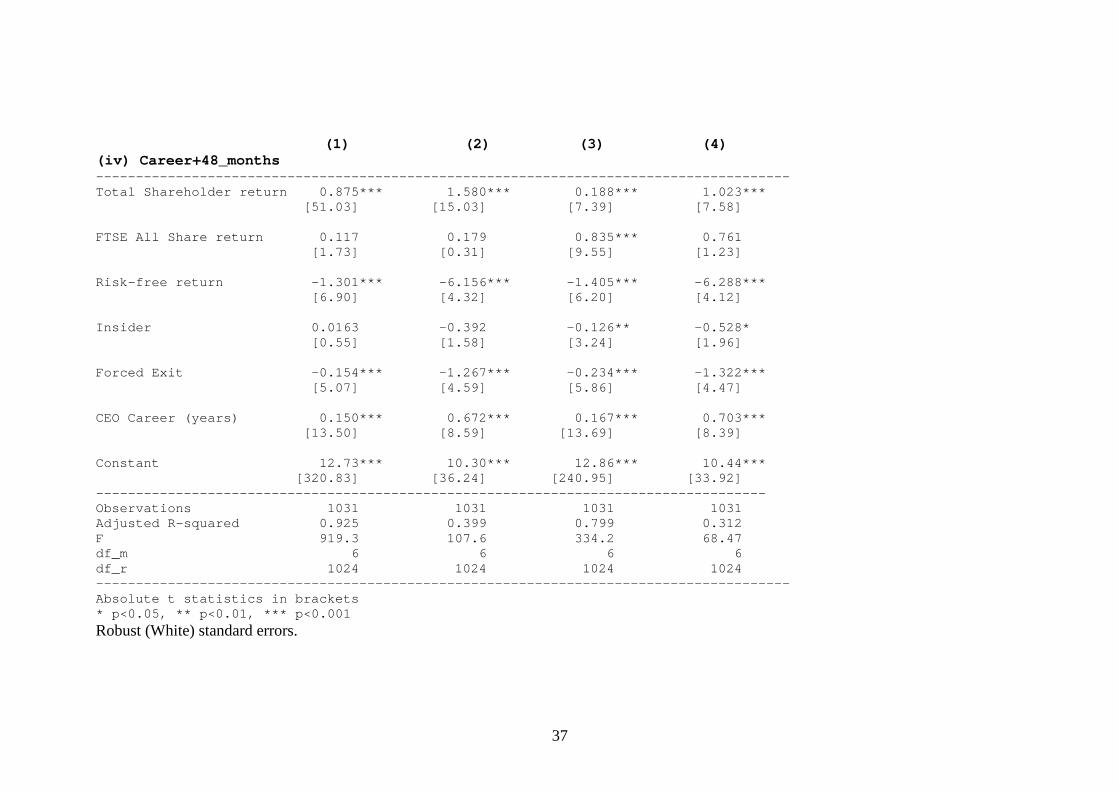
shares result in a more effective pay-performance relationship, Table 3 reports robust
regressions of the level of reward. Here the logarithm of realised reward under each
scheme is regressed against career log-return, with a valuation of £1.0 used in those
cases where (under performance shares) there was zero realised reward (as the
logarithm transformation is unusable for £0). In column (1) of Table 3(i), career
shares result in a highly significant connection with TSR. A one percentage point
increase in TSR produces a 0.74% increase in long-term reward. The connection is
much tighter than achieved by restricted shares (Table 3(i), column (3)) where the
pay-performance effect is around 0.40%.
15
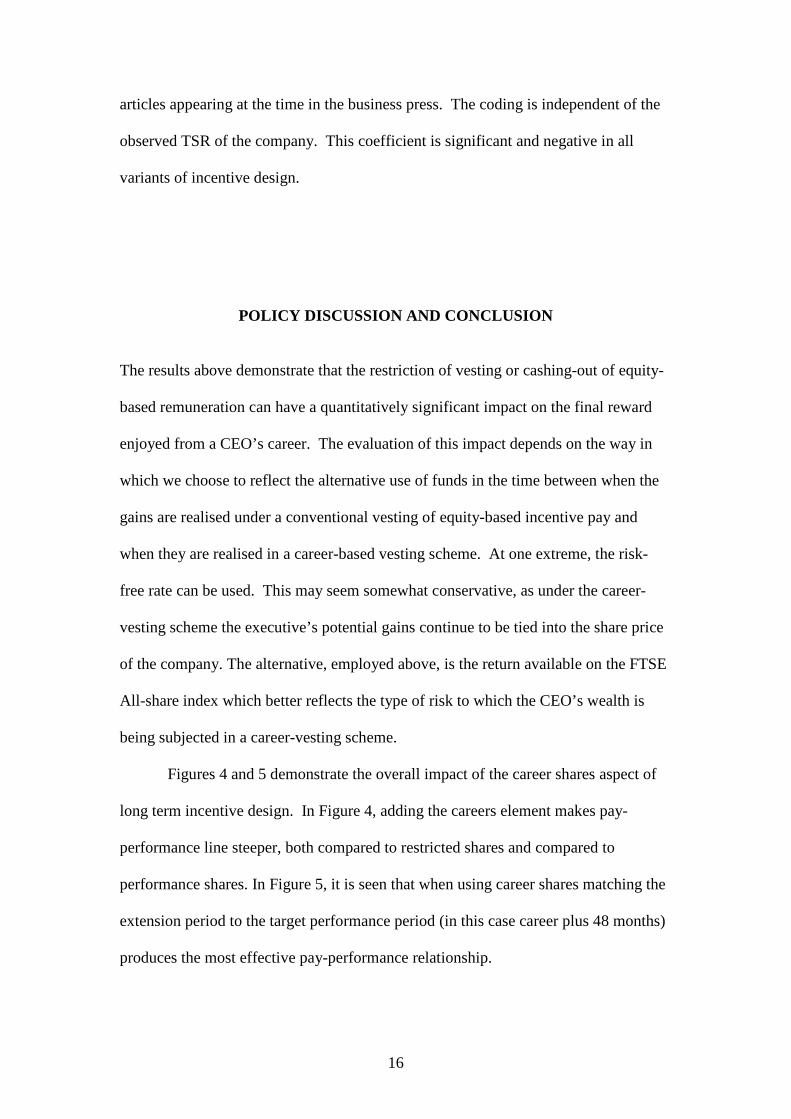
What is noteworthy is that these effects are dwarfed by the result achieved
under performance shares (column (4) of Table 3). Here a percentage point increase
in TSR results in a 2.1% increase in reward. This is undoubtedly achieved by cutting
off all reward during periods of below-median performance. Although the
performance share arrangement produces a stronger pay-performance result,
executives often find frustrating the lack of a clear line of sight between performance
and reward. However, in terms of Hypothesis 2, the evidence presented in Table 3
leads to rejection. But combined with performance shares, the career shares
adjustment (“career shares_plus”) produces an even stronger pay-performance
connection (2.4%, as seen in column (2) of Table 3(i)). Figure 7 plots the key TSR
estimated coefficients for each of the four incentive arrangements for each career
extension period. The convergence of career shares and performance shares at the 48-
month extension is of interest and points to the effectiveness of career shares over the
longer term
------------------------------
Insert Table 2 about here
Insert Figure 7 about here
------------------------------
In terms of the remaining explanatory variables included in Table 3, the
observation that reward increases with length of career is an intuitive result. Of
greater interest, however, is the observation of a significant negative coefficient on the
variable describing whether the end of the CEO career could be described as a
‘forced’ exit. This variable is coded by reference to company annual reports, and to
16
articles appearing at the time in the business press. The coding is independent of the
observed TSR of the company. This coefficient is significant and negative in all
variants of incentive design.
POLICY DISCUSSION AND CONCLUSION
The results above demonstrate that the restriction of vesting or cashing-out of equity-
based remuneration can have a quantitatively significant impact on the final reward
enjoyed from a CEO’s career. The evaluation of this impact depends on the way in
which we choose to reflect the alternative use of funds in the time between when the
gains are realised under a conventional vesting of equity-based incentive pay and
when they are realised in a career-based vesting scheme. At one extreme, the risk-
free rate can be used. This may seem somewhat conservative, as under the career-
vesting scheme the executive’s potential gains continue to be tied into the share price
of the company. The alternative, employed above, is the return available on the FTSE
All-share index which better reflects the type of risk to which the CEO’s wealth is
being subjected in a career-vesting scheme.
Figures 4 and 5 demonstrate the overall impact of the career shares aspect of
long term incentive design. In Figure 4, adding the careers element makes pay-
performance line steeper, both compared to restricted shares and compared to
performance shares. In Figure 5, it is seen that when using career shares matching the
extension period to the target performance period (in this case career plus 48 months)
produces the most effective pay-performance relationship.
17
In terms of our specific hypotheses, the results in Table 2 confirm that
adjustments to reward resulting from the implementation of a career vesting approach
are such as to reward higher performance. Viewed as a free standing incentive
scheme, the career vesting approach is shown in the regressions of Table 3 to result in
a stronger pay-performance connection than results under a restricted shares scheme.
Equally, however, these same results make is patently clear that a performance shares
approach, based on a relative performance metric, results in a far stronger pay-
performance connection – albeit one that is often said to remain obscure to the
executives it aims to incentivise. Adding a career shares aspect to the performance
shares design (in what has been labelled here as “career shares_plus”) produces a
further enhancement of the pay-performance relationship.
One claim that is made for the career-vesting approach is that it removes the
endogeneity of timing of the release of company news and/or the granting of equity
related incentives. Yermack (1997) & Lie (2005) both drew attention to suspicious
activity around option grant days. Subsequent SEC investigation proved this to be the
case and reporting requirements were tightened up (Herron & Lie, 2007; Lomax,
2008). But this may be an overstated claim, as examination of Figures 1 and 2
demonstrates that well organised and publicised award and vesting schemes of either
type should be immune from this criticism – it is a matter of governance.
The approach adopted above ignores an important effect illustrated by Booker
& Wright (2006) and Main et al. (2008) who demonstrate the significant difference to
eventual vesting that a few days can make in the choice of the defining dates for a
performance period. This observation reflects the general finding of Acker & Duck
(2007) and Dimitrov & Govindaraj (2007), referred to as the ‘reference day’ effect.
The results reported above might have been very different for particular companies
18
had our timing of share performance measurement commenced on a different day of
the month. It is less likely, however that the overall results would have been much
different taken over a sample of the size used here.
The career shares arrangement does satisfy the Core & Guay (2009) critique
that the timing of the pay event and the period of performance measurement are
frequently mismatched. Save for the extension beyond the end of the CEO career,
pay and performance are exactly matched. This is, of course, the advantage of taking
the whole-career perspective offered by career shares.
Several issues regarding the robustness of the career-vesting approach remain
and these merit highlighting. First, the reward achieved by a disappointing CEO may
be resurrected if a successor CEO quickly turns the company around. The same
criticism can, of course, be made regarding any takeover premium enjoyed by a
failing company that is subject to acquisition.
To the extent that the CEO has some influence in choosing a successor –
customary, at least for internal succession – the arrangement provides an effective
incentive to choose wisely. On the other hand, career vesting will raise the stakes as
to the timing of voluntary exit from the CEO position (say, into retirement) and this
may provoke precipitously early exits or overly delayed departures. There was no
scope to investigate such effects above, as all CEO careers were as recorded under the
conventional vesting arrangements that have prevailed over the past 20 years or so.
The career-vesting approach works by exposing the CEO to substantially more
risk as to the company’s performance and this can be expected to require
compensation in the form of higher base pay or salary. There may also be tax
consequences when restricted shares vest and yet must be carried through to the
designated period some years after demitting the CEO position. Again the company
19
may well be required to compensate the executive for this liability (albeit with the
possibility of claiming this back at the end of the process), or at least allow a partial
cashing out of the CEO’s incentive shares to meet tax liabilities.
One thing emerges clearly from Table 1 it is that long serving CEOs also tend
to be among the better performing CEOs. This is, to some extent, axiomatic as a
longer career affords more time to accumulate a better company performance. But
there is also an undoubted endogeneity between long service and good performance.
Under-performing CEOs tend to get fired (Gregory-Smith et al., 2009). Long service
CEOs will therefore tend to benefit disproportionately from career vesting. This is,
possibly, no more than it should be, but remuneration committees will be required to
explain significantly larger cashing-out events than are currently observed.
Career vesting introduces increasing amounts of risk into the CEO’s wealth
prospects. Whether caught by a cyclical downturn or by long term sectoral decline,
the CEO is exposed to an unwelcome increase in uncertainty. Companies may be
required to compensate for this in the form of higher base salary. For longer serving
CEOs, boards may need to be aware that decision making in later career may be
influenced by such large amounts of accumulated wealth at risk in the company’s
shares. Thus, while the final payout to underperforming CEOs may be reduced in
such arrangements, those more successful and longer serving CEOs will see their final
payout increase considerably. While much of this will be compensation not only for
performance but also for the extra risk born, shareholders may look askance at such
enlarged payouts. In comparison with performance share schemes with their
dependence on choice of comparator peer groups, career shares have a transparency
that many shareholders and executives may find refreshing. Although four years may

20
be empirically too long a period to fairly add to the CEO’s career-vesting
arrangements.
While the career-vesting approach has much to commend it, there remain a
considerable number of complications that await early adopters. As with so many
innovations in the world of executive pay, one would be wise to look out for
unintended consequences.
21
References: Acker, D. & Duck, N. W. 2006. Reference-day risk and the use of monthly returns data: a warning note. Journal of Accounting, Auditing and Finance, 22: 527-557. Association of British Insurers. 1994. Long term remuneration for senior executives. London: ABI (May). Bebchuk, L. A. & Fried, J. M. 2004. Pay without performance. The unfilled promise of executive compensation. Cambridge, Mass.: Harvard University Press. Bebchuk, L. A. & Fried, J. M. 2009. Paying for long-term performance. Harvard: John M Ohlin Center for Law, Economics and Business, Discussion Paper No. 658 (December). Bebchuk, L. A., Grinstein, Y. & Peyer, U. M. 2009. Lucky CEOs and lucky directors. Harvard law School and National Bureau of Economic Research Working Paper (May). Bebchuk, L. A. & Grinstein, Y. 2005. The growth of executive pay. Oxford Review of Economic Policy, 21: 208-303. Bhagat, S. & Romano, R. 2009. Reforming executive compensation: Simplicity, transparency and committing to the long-term. Yale: John Ohlin Center for Studies in Law, Economics, and Public Policy, Research Paper No. 393. Booker, R. C. & Wright, V. 2006. Relative shareholder return – the best measure of executive performance? What if? Perspective. London: Watson Wyatt (June). Clementi, G. L. & Cooley, T. F. 2009. Executive compensation: Facts. National Bureau of Economic Research, working paper 15426. Conyon, M. J., Core, J. E. & Guay, W. R. 2009. Are US CEOs paid more than UK CEOs? Inferences from risk-adjusted pay. University of Pennsylvania, Wharton Working Paper (November). Conyon, M.J & Florou, A. 2004. The pattern of investment surrounding CEO retirements: UK evidence. The British Accounting Review, 38: 299-319. Core, J. E, Guay, Wayne R. 2010. Is pay too high and are incentives too low? A wealth-based contracting framework. The Wharton School, University of Pennsylvania Working Paper (January 28, 2010) De Young, , R., Peng, E. Y. & Yan, M. 2010. Executive compensation and business policy choices at U.S. commercial banks. Kansas City: Federal Reserve Bank of Kansas City Research Working Papers. Dimitrov, V. & Govindaraj, S. 2007. Reference-day risk: observations and extension. Journal of Accounting, Auditing and Finance, 22: 559-572.
22
Edmans, A. & Gabaix, X. 2009. Is CEO pay really inefficient? A survey of new optimal contracting theories. European Financial Management, 15: 486-496. Fahlenbrach, R. & Stulz, R. M. 2009. Bank CEO incentives and the Credit Crisis. Fisher College of Business Studies Working Paper Series, Dice Center WP 2009-13 (July). Financial Reporting Council 2009. 2009 Review of the combined code: Final report. London: Financial Reporting Council. Financial Reporting Council 1998. The combined code on corporate governance. London: Financial Reporting Council . Financial Services Authority, FSA. 2009. Reforming remuneration practices in financial services. Feedback on CP09/10 and final rules. FSA: CP09/15. Financial Stability Board, FSB. 2009. Financial stability forum - FSF principles for sound compensation practices. Bank for International Settlements in Basel, Switzerland, (September). Greenbury, R. 1995. Directors’ remuneration. Report of a study group chaired by Sir Richard Greenbury. London: Gee Publishing Ltd. Gregory-Smith, I. 2009. Chief executive pay and non-executive director pay in the UK: Optimal contracting vs. rent extraction. Nottingham University NUBS Research Paper Series No. 2009-02. Gregory-Smith, I., Thompson, S. & Wright P. W. 2009. Fired or retired? A Competing Risks Analysis of Chief Executive Turnover. Economic Journal, 119: 463-481. Hall, B. J. & Liebman, J. B. 1998. Are CEOs really paid like bureaucrats? Quarterly Journal of Economics, 113: 653-691. Hall, B. J. & Murphy, K. J. 2000. Optimal exercise prices for executive stock options. American Economic Review, 90: 209-214. Heron, R. A. & Lie, E. 2007. Does backdating explain the stock price pattern around executive stock option grants? Journal of Financial Economics, 83: 271–295. Jensen, M. C, & Meckling, W. H. 1976. Theory of the firm: managerial behavior, agency costs and ownership structure. Journal of Financial Economics, 3: 305-360. Jensen, M. C. & Murphy K. J. 1990. Performance pay and top-management incentives. Journal of Political Economy, 98: 225-264. Lie, E. 2005. On the timing of CEO stock option awards. Management Science, 51: 802-812.
23
Lomax, S. 2008. Backdating stock options: the latest corporate storm. Business & Economic Review, (January/March), pp. 15-18. Main, B. G M, Berry, G., Neate, J. & Wright, V. 2008. The potential for backdating executive share options in the UK. The length of a footprint – does it matter? University of Edinburgh Business School, Centre for Financial Markets Research Working Paper 08.01. Murphy, K. J. 2009. Compensation structure and systematic risk. Evidence presented to United States House of Representatives Committee on Financial Services, June 11, 2009. University of Southern California Marshall School of Business, Working Paper FBE 34-09. Murphy, K. 2002. Explaining executive compensation: Managerial power vs. perceived cost of stock options. University of Chicago Law Review, 69: 847-869. Nyberg, A., Fulmer, I., Smithey, G. B., & Carpenter, M. A. 2010. Agency theory revisited: CEO returns and shareholder interest alignment. Academy of Management Review, forthcoming. Rost, K. & Osterloh, M. 2009. Management fashion pay-for-performance for CEOs. Schmalenbach Business Review, 61: 119-149. Securities & Exchange Commission. 2006. Executive compensation and related person disclosure. Washington, D.C.: Securities & Exchange Commission. Securities & Exchange Commission. 1993. Securities Act release no. 6962 and no. 7009. Washington, D.C.: Securities & Exchange Commission. Suntheim, F. 2010. Managerial compensation in the financial service industry. Milan, Italy: University of Bucconi Department of Finance Working Paper. Tosi, H. L., Werner, S., Katz, J. P. & Gomez-Mejia, L. R. 2000. How much does performance matter? A meta-analysis of CEO pay studies. Journal of Management, 26: 301-339. U.S. Treasury Department. 2009. Interim final rule for TARP standards for compensation and corporate governance. Part 30. Washington, D.C.: U.S. Treasury Department Walker Review. 2009. A review of corporate governance in UK banks and other financial industry entities. London: Financial Services Authority. Yermack, D. 1997. Good timing: CEO stock option awards and company news announcements. Journal of Finance, 52: 449-476.
24
FIGURE 1
Conventional vesting and cashing out approach
Executive Share Grant (subject to vesting)
t0
t10
Date become CEO
Date retire or exit the firm
time t0 t10 t 12
EXIT firm
25
FIGURE 2
Career-plus vesting and cashing out approach
Executive Share Grant (subject to vesting)
t0 Date become CEO t12 Date cash out equity holdings = t10 + 2 years
t10 Date retire or exit the firm
Executive Share Grant (continued holding)
time t0 t10 t 12
EXIT firm CASH OUT
26
FIGURE 3
Calculating value of realised reward
xxxxxxxxxx xxxxxxxxxx
A C B D
time
t 3 t 12 t 2008 t 6 t 10
Conventional vesting
Career vesting
Tranche of Executive Share Grant
t3 Date this tranche granted
Discount to t12 at risk-free rate or at FTSE All-share return
t6 Date of vesting/ cash-out – conventional vesting
Executive Share Grant (continued holding)
xxxxxxxxxx Convert from £ t12 to £2008
27
TABLE 1 CEO Career length and performance
CEO Career length (Years) Decile
career length
Median TSR (Career)
Median TSR (Annual)
median minimum maximum N
1 0.13 0.12 0.92 0.5 1.25 137 2 0.14 0.08 1.67 1.33 1.92 125 3 0.11 0.06 2.33 2.00 2.75 131 4 0.40 0.11 3.17 2.83 3.50 131 5 0.49 0.11 4.00 3.58 4.33 132 6 0.49 0.08 4.92 4.42 5.25 126 7 0.80 0.10 5.92 5.33 6.58 127 8 0.74 0.08 7.33 6.67 8.25 127 9 2.64 0.14 9.42 8.33 11.50 127 10 11.08 0.18 15.00 11.58 34.25 129
28
Figure 4
Median outcomes of each of the four incentive arrangements
8
9
10
11
12
13
14
15
16
1 2 3 4 5 6 7 8 9 10
Career TSR Decile
Ou
tco
me
at C
aree
r en
d (
log
arit
hm
of
£)
.
Performance Shares Restricted Shares Career Shares plus Career Shares
Figure 5
Choice of post-career restriction
10
11
12
13
14
15
16
17
1 2 3 4 5 6 7 8 9 10
Decile of TSR over Career+48 months
Rew
ard
(L
og
£)
at e
nd
of
per
iod
.
Career Shares_00 Career Shares_12 Career Shares_24 Career Shares_48
29
Figure 6
Impact of Career Vesting
£0
£20,000
£40,000
£60,000
£80,000
£100,000
£120,000
£140,000
£160,000
£180,000
£200,000
Career_00 Career_12 Career_24 Career_48
Extended period covered (months)
Imp
act
(£ p
er +
1% r
etu
rn)
of
Car
eer
Ves
tin
g
[(Career) - (Restricted)] [(Career_plus) - (Performance)]
Figure 7
Pay-Performance Coefficients and Career Restrictions
0.000
0.500
1.000
1.500
2.000
2.500
Career_00 Career_12 Career_24 Career_48
Pay-Performance Coefficient
Car
eer
exte
nsi
on
(m
on
ths)
Restricted Shares Career Shares Performance Shares Career_plus shares

1 FTSE350 is the Financial Times Stock Exchange list of the top 350 companies by market capitalisation traded on the London Market at any time. It is the sum of the largest companies (FTSE100) and the next 250 companies (FTSE250).
31
TABLE 2 Regression analysis of impact of move to career vesting
________________________________________________________________________________________ Career Shares Career Shares_Plus ------------------------------ ----------------------------- (Career Shares) (Career Shares) (Career Shares+) (Career Shares+) -(Restricted -(Performance -(Restricted -(Performance Shares) Shares) Shares) Shares) (i) Career+0_months (1) (2) (3) (4) ---------------------------------------------------------------------------------------- Total Shareholder return 140009.5*** 135901.5*** 106693.8*** 102585.8*** [4.58] [4.32] [4.07] [3.79] FTSE All Share return -280374.4* -256348.2 -226828.8* -202802.6* [2.24] [1.92] [2.47] [2.03] Risk-free return 728415.5 1118855.6 32380.7 422820.7 [0.88] [1.30] [0.06] [0.69] Constant -189425.4 28042.5 -343866.4 -126398.5 [0.75] [0.11] [1.86] [0.67] ------------------------------------------------------------------------------------ Observations 1292 1292 1292 1292 Adjusted R-squared 0.696 0.690 0.674 0.648 F 7.488 8.913 8.145 4.836 df_m 3 3 3 3 df_r 1288 1288 1288 1288 ------------------------------------------------------------------------------------ Observations 1292 1292 1292 1292 Adjusted R-squared 0.696 0.562 0.725 0.648 F 7.488 4.157 7.735 4.836 df_m 3 3 3 3 df_r 1288 1288 1288 1288
32
------------------------------------------------------------------------------------ ________________________________________________________________________________________ (ii) Career+12_months (1) (2) (3) (4) ---------------------------------------------------------------------------------------- Total Shareholder return 158795.7*** 155931.0*** 121421.7*** 118557.0*** [5.37] [5.12] [4.61] [4.36] FTSE All Share return -303159.7* -285926.1* -236755.7** -219522.1* [2.43] [2.13] [2.59] [2.19] Risk-free return 730109.4 1158483.9 -49091.3 379283.2 [0.80] [1.20] [0.08] [0.55] Constant -187223.1 12885.5 -295878.7 -95770.1 [0.58] [0.04] [1.26] [0.40] ------------------------------------------------------------------------------------ Observations 1292 1292 1292 1292 Adjusted R-squared 0.767 0.757 0.748 0.729 F 10.62 11.18 10.22 6.753 df_m 3 3 3 3 df_r 1288 1288 1288 1288 ________________________________________________________________________________________ (iii) Career+24_months (1) (2) (3) (4) ---------------------------------------------------------------------------------------- Total Shareholder return 184352.5*** 183055.2*** 143484.8*** 142187.5*** [11.58] [11.10] [9.70] [9.25] FTSE All Share return -354755.2** -345557.2* -285774.0** -276576.0* [2.62] [2.42] [2.76] [2.52] Risk-free return 1015156.3 1499974.0 168185.1 653002.7 [0.98] [1.38] [0.22] [0.81] Constant -378564.6 -215166.9 -419879.3 -256481.6
33
[0.88] [0.48] [1.36] [0.80] ------------------------------------------------------------------------------------ Observations 1208 1208 1208 1208 Adjusted R-squared 0.880 0.874 0.880 0.874 F 50.68 47.89 35.71 33.01 df_m 3 3 3 3 df_r 1204 1204 1204 1204 _______________________________________________________________________________________ (iv) Career+48_months (1) (2) (3) (4) ---------------------------------------------------------------------------------------- Total Shareholder return 157107.7*** 155491.0*** 123401.6*** 121784.9*** [7.82] [7.56] [7.15] [6.88] FTSE All Share return -688828.8*** -679871.9*** -559728.4*** -550771.5*** [5.45] [5.28] [5.65] [5.44] Risk-free return 3633546.1*** 4114673.6*** 2376862.2*** 2857989.6*** [4.21] [4.71] [3.51] [4.20] Constant -1582868.2*** -1430753.9*** -1454880.3*** -1302765.9*** [3.73] [3.34] [4.16] [3.76] ------------------------------------------------------------------------------------ Observations 1031 1031 1031 1031 R-squared 0.844 0.841 0.835 0.830 Adjusted R-squared 0.843 0.841 0.834 0.829 F 20.45 19.98 20.54 15.98 df_m 3 3 3 3 df_r 1027 1027 1027 1027 ________________________________________________________________________________________ Absolute t statistics in brackets * p<0.05, ** p<0.01, *** p<0.001
Robust (White) standard errors.
34
Table 3 Pay-performance regression estimates under various vesting arrangements
_______________________________________________________________________________________
FTSE_All_Share adjustment ----------------------------- (1) (2) (3) (4)
Career Career Restricted Performance (i) Career+0_months Shares Shares Shares Shares + Perf ---------------------------------------------------------------------------------------- Total Shareholder return 0.735*** 2.375*** 0.404*** 2.068*** [31.79] [17.91] [15.67] [14.54] FTSE All Share return 0.173*** -1.320** 0.561*** -0.928 [3.31] [2.74] [9.99] [1.83] Risk-free return -2.258*** -6.120*** -2.412*** -6.480*** [12.25] [4.74] [12.63] [4.78] Insider -0.0123 -0.212 -0.0720* -0.287 [0.50] [0.98] [2.57] [1.26] Forced Exit -0.147*** -0.645** -0.0814** -0.570* [6.02] [2.83] [3.05] [2.40] CEO Career (years) 0.251*** 0.769*** 0.264*** 0.803*** [21.66] [10.64] [21.65] [10.54] Constant 12.51*** 9.177*** 12.54*** 9.219*** [382.83] [33.39] [333.14] [32.30] ------------------------------------------------------------------------------------ Observations 1292 1292 1292 1292
35
Adjusted R-squared 0.904 0.422 0.851 0.373 F 861.7 118.6 501.1 95.00 df_m 6 6 6 6 df_r 1285 1285 1285 1285 -------------------------------------------------------------------------------------
_____________________________________________________________________________________ (1) (2) (3) (4) (ii) Career+12_months -------------------------------------------------------------------------------------- Total Shareholder return 0.799*** 1.957*** 0.293*** 1.543*** [37.82] [18.04] [12.44] [12.10] FTSE All Share return 0.167** -1.076* 0.653*** -0.685 [3.12] [2.17] [9.34] [1.29] Risk-free return -2.119*** -5.602*** -2.048*** -5.653*** [11.60] [4.34] [9.89] [4.11] Insider -0.00423 -0.298 -0.0862** -0.365 [0.16] [1.37] [2.80] [1.57] Forced Exit -0.150*** -0.840*** -0.135*** -0.788** [5.75] [3.57] [4.38] [3.17] CEO Career (years) 0.231*** 0.752*** 0.236*** 0.779*** [20.68] [10.71] [20.66] [10.41] Constant 12.59*** 9.562*** 12.67*** 9.620*** [373.06] [36.83] [312.05] [34.84] ------------------------------------------------------------------------------------ Observations 1292 1292 1292 1292 Adjusted R-squared 0.909 0.411 0.822 0.340 F 890.1 132.9 431.1 93.02 df_m 6 6 6 6
36
df_r 1285 1285 1285 1285 -------------------------------------------------------------------------------------- ______________________________________________________________________________________ (1) (2) (3) (4) (iii) Career+24_months -------------------------------------------------------------------------------------- Total Shareholder return 0.823*** 1.810*** 0.248*** 1.345*** [40.33] [16.87] [10.51] [10.27] FTSE All Share return 0.158* -0.832 0.714*** -0.440 [2.57] [1.56] [9.36] [0.76] Risk-free return -1.884*** -5.578*** -1.821*** -5.501*** [9.79] [4.04] [8.44] [3.73] Insider 0.00764 -0.361 -0.103** -0.446 [0.27] [1.62] [3.05] [1.86] Forced Exit -0.154*** -0.958*** -0.180*** -0.937*** [5.55] [3.90] [5.25] [3.58] CEO Career (years) 0.207*** 0.737*** 0.214*** 0.762*** [18.73] [10.05] [18.60] [9.74] Constant 12.66*** 9.896*** 12.77*** 9.974*** [347.33] [38.10] [287.22] [35.72] ------------------------------------------------------------------------------------ Observations 1208 1208 1208 1208 Adjusted R-squared 0.912 0.411 0.808 0.330 F 849.8 124.9 373.1 82.37 df_m 6 6 6 6 df_r 1201 1201 1201 1201 -------------------------------------------------------------------------------------- _______________________________________________________________________________________
37
(1) (2) (3) (4) (iv) Career+48_months --------------------------------------------------------------------------------------- Total Shareholder return 0.875*** 1.580*** 0.188*** 1.023*** [51.03] [15.03] [7.39] [7.58] FTSE All Share return 0.117 0.179 0.835*** 0.761 [1.73] [0.31] [9.55] [1.23] Risk-free return -1.301*** -6.156*** -1.405*** -6.288*** [6.90] [4.32] [6.20] [4.12] Insider 0.0163 -0.392 -0.126** -0.528* [0.55] [1.58] [3.24] [1.96] Forced Exit -0.154*** -1.267*** -0.234*** -1.322*** [5.07] [4.59] [5.86] [4.47] CEO Career (years) 0.150*** 0.672*** 0.167*** 0.703*** [13.50] [8.59] [13.69] [8.39] Constant 12.73*** 10.30*** 12.86*** 10.44*** [320.83] [36.24] [240.95] [33.92] ------------------------------------------------------------------------------------ Observations 1031 1031 1031 1031 Adjusted R-squared 0.925 0.399 0.799 0.312 F 919.3 107.6 334.2 68.47 df_m 6 6 6 6 df_r 1024 1024 1024 1024 --------------------------------------------------------------------------------------- Absolute t statistics in brackets * p<0.05, ** p<0.01, *** p<0.001
Robust (White) standard errors.
38
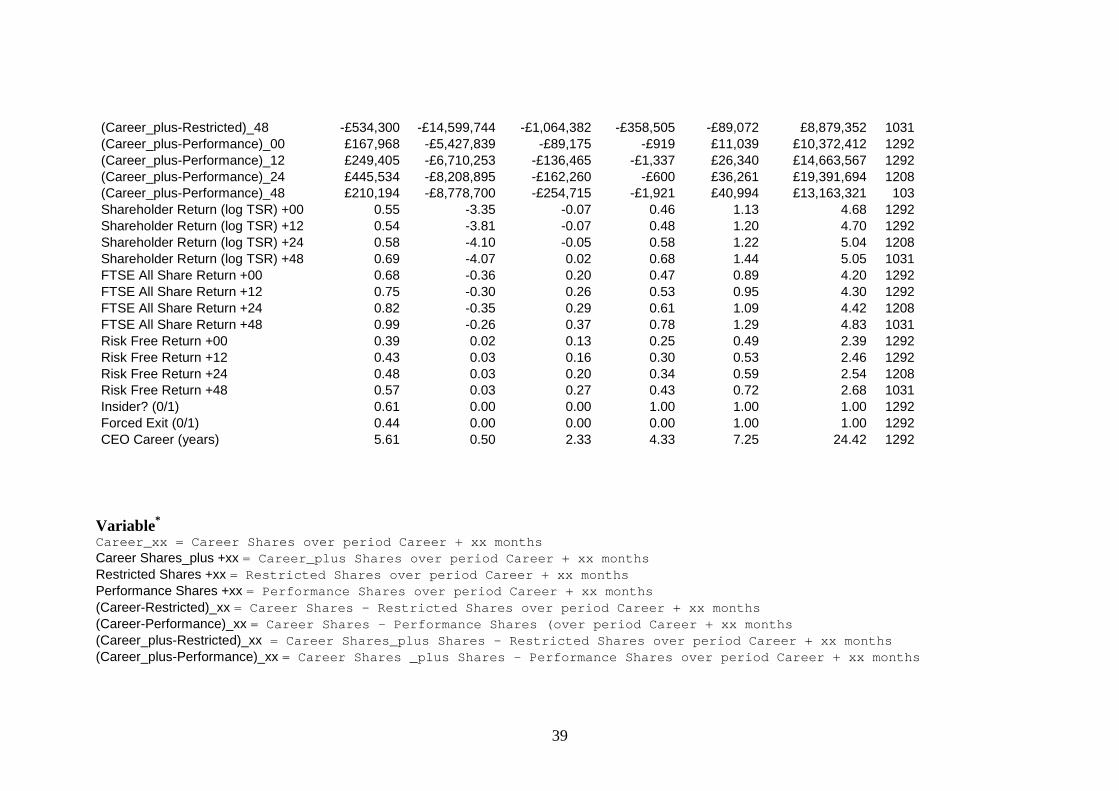
Appendix Table 1 Summary descriptive Statistics
variable mean p_1% p_25% median p_75% p_99% N
Career Shares +00 £2,143,488 £26,174 £320,070 £677,330 £1,499,519 £24,072,699 1292 Career Shares +12 £2,354,095 £8,213 £312,695 £678,343 £1,528,041 £28,325,247 1292 Career Shares +24 £2,809,426 £5,795 £301,288 £736,752 £1,640,650 £33,467,382 1208 Career Shares +48 £2,927,664 £4,676 £304,450 £772,204 £1,781,362 £39,466,218 1031 Career Shares_plus +00 £1,443,589 £0 £76,011 £332,282 £967,980 £19,239,927 1292 Career Shares_plus +12 £1,590,033 £0 £63,901 £320,340 £980,849 £23,826,045 1292 Career Shares_plus +24 £1,912,015 £0 £66,741 £337,366 £1,004,603 £27,444,621 1208 Career Shares_plus +48 £1,960,688 £0 £58,524 £349,049 £1,138,739 £27,211,816 1031 Restricted Shares +00 £1,832,012 £39,162 £388,449 £788,627 £1,687,437 £21,867,419 1292 Restricted Shares +12 £1,931,879 £40,355 £401,602 £841,191 £1,741,504 £23,121,193 1292 Restricted Shares +24 £2,105,606 £34,862 £403,195 £888,007 £1,837,492 £27,050,676 1208 Restricted Shares +48 £2,494,988 £41,678 £422,750 £975,608 £2,061,534 £32,807,163 1031 Performance Shares +00 £1,275,621 £0 £114,104 £423,893 £1,152,698 £17,421,096 1292 Performance Shares +12 £1,340,627 £0 £121,496 £434,424 £1,187,446 £19,869,276 1292 Performance Shares +24 £1,466,481 £0 £120,846 £465,227 £1,272,365 £19,995,265 1208 Performance Shares +48 £1,750,495 £0 £112,355 £498,625 £1,464,201 £21,495,531 1031 (Career-Restricted)_00 £311,476 -£6,840,305 -£160,268 -£6,006 £71,035 £11,836,225 1292 (Career-Restricted)_12 £422,216 -£7,998,693 -£249,115 -£14,178 £127,330 £18,915,044 1292 (Career-Restricted)_24 £703,820 -£9,516,809 -£313,198 -£11,928 £156,735 £23,068,308 1208 (Career-Restricted)_48 £432,676 -£11,703,803 -£433,542 -£22,179 £240,402 £20,651,818 1031 (Career-Performance)_00 £867,867 -£3,364,231 £73,755 £249,286 £538,501 £15,133,311 1292 (Career-Performance)_12 £1,013,467 -£4,843,924 £41,710 £251,184 £585,067 £20,304,584 1292 (Career-Performance)_24 £1,342,945 -£5,168,919 £22,811 £254,218 £614,982 £27,328,262 1208 (Career-Performance)_48 £1,177,169 -£7,283,283 £2,913 £260,559 £734,742 £26,367,020 1031 (Career_plus-Restricted)_00 -£388,423 -£9,127,451 -£666,353 -£307,868 -£95,304 £7,937,839 1292 (Career_plus-Restricted)_12 -£341,846 -£11,004,847 -£724,384 -£321,883 -£95,789 £12,323,629 1292 (Career_plus-Restricted)_24 -£193,591 -£12,671,880 -£826,111 -£341,389 -£95,326 £12,323,629 1208
39
(Career_plus-Restricted)_48 -£534,300 -£14,599,744 -£1,064,382 -£358,505 -£89,072 £8,879,352 1031 (Career_plus-Performance)_00 £167,968 -£5,427,839 -£89,175 -£919 £11,039 £10,372,412 1292 (Career_plus-Performance)_12 £249,405 -£6,710,253 -£136,465 -£1,337 £26,340 £14,663,567 1292 (Career_plus-Performance)_24 £445,534 -£8,208,895 -£162,260 -£600 £36,261 £19,391,694 1208 (Career_plus-Performance)_48 £210,194 -£8,778,700 -£254,715 -£1,921 £40,994 £13,163,321 103 Shareholder Return (log TSR) +00 0.55 -3.35 -0.07 0.46 1.13 4.68 1292 Shareholder Return (log TSR) +12 0.54 -3.81 -0.07 0.48 1.20 4.70 1292 Shareholder Return (log TSR) +24 0.58 -4.10 -0.05 0.58 1.22 5.04 1208 Shareholder Return (log TSR) +48 0.69 -4.07 0.02 0.68 1.44 5.05 1031 FTSE All Share Return +00 0.68 -0.36 0.20 0.47 0.89 4.20 1292 FTSE All Share Return +12 0.75 -0.30 0.26 0.53 0.95 4.30 1292 FTSE All Share Return +24 0.82 -0.35 0.29 0.61 1.09 4.42 1208 FTSE All Share Return +48 0.99 -0.26 0.37 0.78 1.29 4.83 1031 Risk Free Return +00 0.39 0.02 0.13 0.25 0.49 2.39 1292 Risk Free Return +12 0.43 0.03 0.16 0.30 0.53 2.46 1292 Risk Free Return +24 0.48 0.03 0.20 0.34 0.59 2.54 1208 Risk Free Return +48 0.57 0.03 0.27 0.43 0.72 2.68 1031 Insider? (0/1) 0.61 0.00 0.00 1.00 1.00 1.00 1292 Forced Exit (0/1) 0.44 0.00 0.00 0.00 1.00 1.00 1292 CEO Career (years) 5.61 0.50 2.33 4.33 7.25 24.42 1292
Variable* Career_xx = Career Shares over period Career + xx months Career Shares_plus +xx = Career_plus Shares over period Career + xx months Restricted Shares +xx = Restricted Shares over period Career + xx months Performance Shares +xx = Performance Shares over period Career + xx months (Career-Restricted)_xx = Career Shares - Restricted Shares over period Career + xx months (Career-Performance)_xx = Career Shares - Performance Shares (over period Career + xx months (Career_plus-Restricted)_xx = Career Shares_plus Shares - Restricted Shares over period Career + xx months (Career_plus-Performance)_xx = Career Shares _plus Shares - Performance Shares over period Career + xx months