Download - A Leading Senior Gold Producer

A Leading Senior Gold Producer …COSTS, FINANCIAL PERFORMANCE & STRENGTH, SHAREHOLDER RETURNS …WITH EXPLORATION UPSIDE
GOLD FORUM AMERICASSeptember 21, 2020

FORWARD-LOOKING INFORMATION Cautionary Note Regarding Forward-Looking Information
The information in this presentation has been prepared as at September 20, 2020. This presentation contains “forward looking statements” and "forward-looking information" within the meaning of applicable securities laws, including statements regarding the plans, intentions, beliefs and current expectations of Kirkland Lake Gold with respect to future business activities and operating performance. Forward-looking information is often identified by the words "may", "would", "could", "should", "will", "intend", "plan", "anticipate", "believe", "estimate", "expect" or similar expressions and include information regarding: (i) changes in Mineral Resource estimates, potential growth in Mineral Resources, conversion of Mineral Resources to proven and probable Mineral Reserves, and other information that is based on forecasts of future operational or financial results, estimates of amounts not yet determinable and assumptions of management; (ii) the amount of future production over any period; (iii) assumptions relating to revenues, operating cash flow and other revenue metrics set out in the Company's disclosure materials; and (iv) future exploration plans.
Investors are cautioned that forward-looking information is not based on historical facts but instead reflect Kirkland Lake Gold's management's expectations, estimates or projections concerning future results or events based on the opinions, assumptions and estimates of management considered reasonable at the date the statements are made. Although Kirkland Lake Gold believes that the expectations reflected in such forward-looking information are reasonable, such information involves risks and uncertainties, and undue reliance should not be placed on such information, as unknown or unpredictable factors could have material adverse effects on future results, performance or achievements of the combined company. Among the key factors that could cause actual results to differ materially from those projected in the forward-looking information are the following: the future development and growth potential of the Canadian and Australian operations; the future exploration activities planned at the Canadian and Australian operations and anticipated effects thereof; changes in general economic, business and political conditions, including changes in the financial markets; changes in applicable laws; and compliance with extensive government regulation. Exploration results that include geophysics, sampling, and drill results on wide spacings may not be indicative of the occurrence of a mineral deposit. Such results do not provide assurance that further work will establish sufficient grade, continuity, metallurgical characteristics and economic potential to be classed as a category of mineral resource. A mineral resource that is classified as "inferred" or "indicated" has a great amount of uncertainty as to its existence and economic and legal feasibility. It cannot be assumed that any or part of an "indicated mineral resource" or "inferred mineral resource" will ever be upgraded to a higher category of resource. Investors are cautioned not to assume that all or any part of mineral deposits in these categories will ever be converted into proven and probable reserves. This forward-looking information may be affected by risks and uncertainties in the business of Kirkland Lake Gold and market conditions. This information is qualified in its entirety by cautionary statements and risk factor disclosure contained in filings made by Kirkland Lake Gold, including its annual information form for the year ended December 31, 2019, and the financial statements and related MD&A for the financial year ended December 31, 2019 an for the interim period ended June 30, 2020, which are filed with the securities regulatory authorities in certain provinces of Canada and available at www.sedar.com.
Should one or more of these risks or uncertainties materialize, or should assumptions underlying the forward-looking information prove incorrect, actual results may vary materially from those described herein as intended, planned, anticipated, believed, estimated or expected. Although Kirkland Lake Gold has attempted to identify important risks, uncertainties and factors which could cause actual results to differ materially, there may be others that cause results not to be as anticipated, estimated or intended. Kirkland Lake Gold does not intend, and do not assume any obligation, to update this forward-looking information except as otherwise required by applicable law.
All dollar amounts in this presentation are expressed in U.S. dollars except as otherwise noted.
Use of Non-IFRS Measures
This Presentation refers to average realized price, operating costs, operating costs per ounce sold, all-in sustaining cost (“AISC”) per ounce of gold sold, free cash flow, sustaining capital expenditures and growth capital expenditure because certain readers may use this information to assess the Company’s performance and also to determine the Company’s ability to generate cash flow and meet its expenditure requirements. This data is furnished to provide additional information and are non-IFRS measures and do not have any standardized meaning prescribed by International Financial Reporting Standards (“IFRS”). These measures should not be considered in isolation as a substitute for measures of performance prepared in accordance with IFRS and are not necessarily indicative of operating costs presented under IFRS. Refer to each Company’s most recent MD&A for a reconciliation of these measures. The most comparable IFRS Measure for operating cash costs, operating cash costs per ounce sold and AISC per ounce sold is production costs as presented in the Consolidated Statements of Operations and Comprehensive Income, while total additions and construction in progress are the most comparable measures for sustaining and growth capital expenditures.
2

3
DIVERSIFIED PORTFOLIO OF HIGH-QUALITY ASSETS
Strong Production Growth, Low Unit Costs Highly profitable, cash flow generating assets with substantial growth potential
Producing Assets
Australia
Production base in leading mining jurisdictions, underpinned by three flagship assets
Detour Lake
Macassa
Canada
Fosterville3
Reserves: 2.1 Mozs @ 21.8 g/tRobbin’s Hill: 218 kozs @ 5.5 g/t619.4 kozs in 2019315.0 kozs for YTD 2020Target: Growing mine life with high-grade ounces
Macassa3
Reserves: 2.4 Mozs @ 22.1 g/t241.3 kozs in 201992.7 kozs for YTD 20204
Target: Production >400 kozs by 2023
Detour3
Reserves: 14.8 Mozs @ 0.97 g/t602 kozs in 2019223.5 kozs for YTD 20204
Target: Double reserves
1) Refers to compound annual growth rate.2) Refers to All-In Sustaining Costs per ounce sold (See Non-IFRS Measures section in forward-looking statements slide).3) See information on Mineral Reserve and Mineral Resource estimates at end of full presentation.4) Transitioned to reduced operations due to COVID-19 near end of March 2020, workers recalled beginning in May 2020.
Fosterville

Governance
Ethical conduct; Understanding our impacts; Managing our Supply Chain
Social
Health and Safety; Human and Labour Rights; Diversity & Equality; Supporting our Communities
Environment
Environmental Stewardship; Biodiversity, Land Use, Mine Closure; Water, Energy, Climate Change
4
RESPONSIBLE GOLD MINING AT KIRKLAND LAKE GOLD
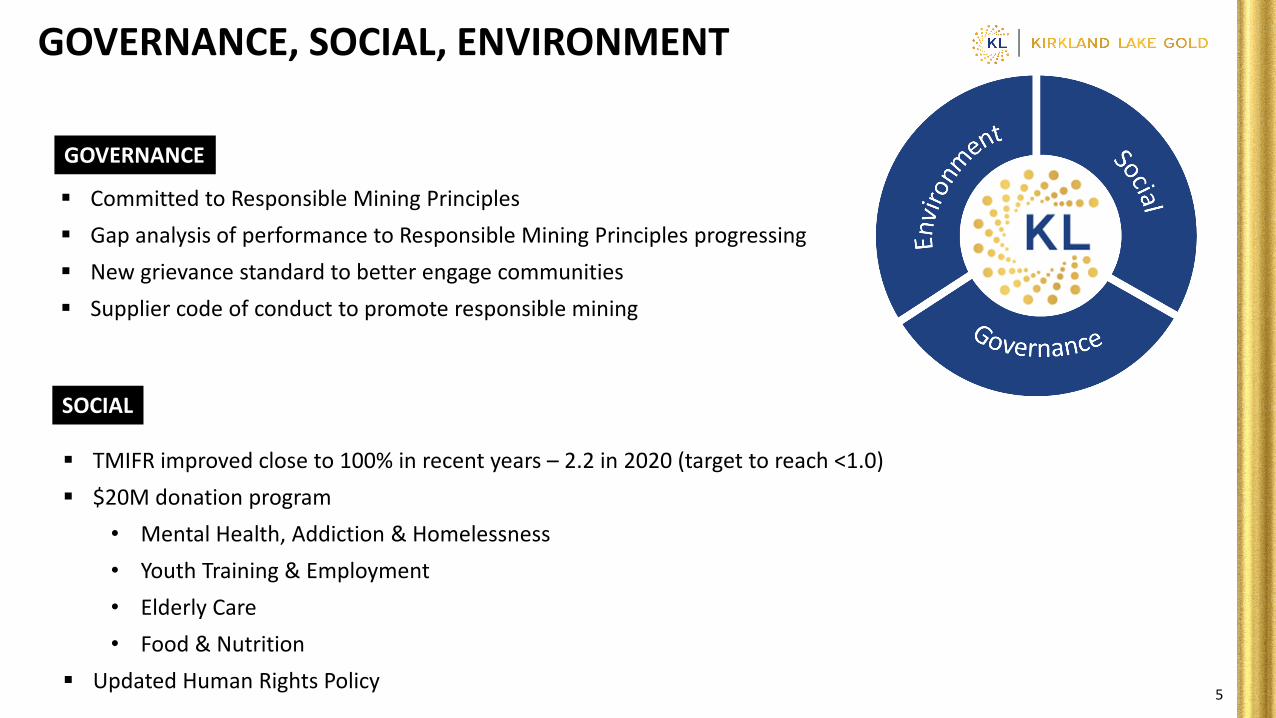
GOVERNANCE
Committed to Responsible Mining Principles Gap analysis of performance to Responsible Mining Principles progressing New grievance standard to better engage communities Supplier code of conduct to promote responsible mining
SOCIAL
TMIFR improved close to 100% in recent years – 2.2 in 2020 (target to reach <1.0) $20M donation program
• Mental Health, Addiction & Homelessness• Youth Training & Employment• Elderly Care• Food & Nutrition
Updated Human Rights Policy5
GOVERNANCE, SOCIAL, ENVIRONMENT

ENVIRONMENT
Water Fosterville zero discharge, Detour 97% recycled water, Macassa 90% recycled water Recent initiatives: Reverse osmosis plant at Fosterville operations; pilot testing
MBBR plant to reduce ammonia in water at Macassa
Climate Change Macassa industry leader in use of battery-powered equipment, >80% of fleet
battery powered Three mines with greenhouse gas emissions well below industry average
Rehabilitation Constructed a 10-hectare Test Cover Area at Detour mine rock stockpile to evaluate a range of
cover system and revegetation options for closure Embarking on a comprehensive rehabilitation program for the Northern Territory property
Tailings Major investment in enhancing stability of Macassa Tailings Facility; Deployment of thickened tails to reduce the
water from tailings – further enhances stability and minimizes land-use for tailings storage6
GOVERNANCE, SOCIAL, ENVIRONMENT

$42.1$0.35/share
$132.4$0.64/share
$273.9$1.30/share
$10 $30 $50 $70 $90$110$130$150$170$190$210$230$250$270$290$310$330$350$370$390$410$430$450$470$490$510$530$550$570$590
2016
2017
2018
2019
STRONG GROWTH IN EARNINGS AND CASH FLOW
104% increase in 2019
1) See Non-IFRS Measures section in forward-looking statements slide.7
$560.1$2.67/share
NET EARNINGS ($ MILLIONS)
$113.9
$178.0
$255.2
$10 $30 $50 $70 $90 $110 $130 $150 $170 $190 $210 $230 $250 $270 $290 $310 $330 $350 $370 $390 $410 $430 $450 $470 $490
2016
2017
2018
2019 $463.0
FREE CASH FLOW1 ($ MILLIONS) 82% growth in 2019

$148.9YTD 2019
YTD 2020
$214.3$1.02/share
$0 $20 $40 $60 $80 $100 $120 $140 $160 $180 $200 $220 $240 $260 $280 $300 $320 $340 $360
YTD 2019
YTD 2020
YTD NET EARNINGS ($ MILLIONS)
YTD FREE CASH FLOW1,2 ($ MILLIONS)
$353.1$1.32/share
$285.4
92% growth from Q2 2019
65% increase from YTD 2019
1) See Non-IFRS Measures section in forward-looking statements slide 2) Excludes $60.5 million of non-recurring transaction and restructuring costs mainly related to the Detour Gold acquisition.
YTD 2020: CONTINUED STRONG PERFORMANCE
8
YTD 2020 FCF totalled $418.1Mexcluding $132.6M non-recurringincome tax payment in Australiarelated to 2019 income.
YTD 2020 adjusted net earningsof $398.5M or $1.49/share (ex.transaction costs mainly relatedto Detour Gold acquisition andCOVID-related costs).

Cash at June 30, 2020: $537.4 million with no debt
Used $438 million for share purchases in YTD 2020
Impact of Detour Gold acquisition:o Added $173.9 million of cash
o Repaid Detour Gold’s $98.6 million of debt
o Used $30.3 million to close our hedge positions
o $54.4 million in transact and restructuring costs
INDUSTRY-LEADING FINANCIAL STRENGTH
9

Repurchased 12.2 Million Shares for YTD 2020 for $438 Million
Doubled Quarterly Dividend to US$0.125 per share in Q1 2020o Six dividend increases since mid-2017o Returning $140M to shareholders through annual dividend payments
RETURNING CAPITAL TO SHAREHOLDERS
10
~$520M invested in share repurchases and dividend payments1 to date in 2020, represents $1.89 per share, $377 per ounce based mid-point of 2020 production guidance2
1) Includes Q3 2020 dividend payment of $0.125 per share to be paid on October 14, 2020 to shareholders of record at close of business on September 30, 2020.2) Based on mid-range of 2020 production guidance of 1,350,000 – 1,400,000 ounces.
C$0.01 C$0.01 C$0.02 C$0.02C$0.03 C$0.03
C$0.04 C$0.04
US$0.04 US$0.04
US$0.06
US$0.125 US$0.125 US$0.125
Q 2 2 0 1 7 Q 3 2 0 1 7 Q 4 2 0 1 7 Q 1 2 0 1 8 Q 2 2 0 1 8 Q 3 2 0 1 8 Q 4 2 0 1 8 Q 1 2 0 1 9 Q 2 2 0 1 9 Q 3 2 0 1 9 Q 4 2 0 1 9 Q 1 2 0 2 0 Q 2 2 0 2 0 Q 3 2 0 2 0
Doubled Dividend in Q1 2020

YTD 2020 STRONG PERFORMANCE AGAINST RE-ISSUED GUIDANCE
1. See Non-IFRS Measures section in forward-looking statements slide2. Includes general and administrative costs and severance payments. Excludes non-cash share-based payment expense
$ million unless otherwise states
2020 Guidance
YTD 2020 Actuals
AISC ($/oz)1 $790 – $810 $763
Operating cash costs1 $560 – $580 $279.2
Royalty expense $80 – $85 $40.5
Sustaining capital1 $390 – $400 $170.2
Growth capital1 $95 – $105 $31.3
Exploration $130 – $150 $59.6
Corporate G&A2 $50 – $55 $27.5
Macassa Detour Lake Holt Complex Fosterville 2020 Guidance
YTD 2020 Actuals
Production – 2020 guidance (kozs) 210 – 220 520 – 540 29 590 – 610 1,350 – 1,400
Production – YTD 2020 (ozs) 92,726 223,547 29,391 314,970 660,634
Op. cash costs ($/oz)1 $490 – $510 610 – 630 $955 $130 – $150 $410 – $430
Op. cash costs – YTD 2020 ($/oz) 1 541 628 1,000 $127 $407
YTD 2020 Performance Tracking well to production guidance Unit costs beating guidance after first half of 2020 Capital expenditures and exploration spending to
increase in second half of year
11

12(1) As at December 31, 2018. Refer to Reserve and Resource Statements in Appendix of this presentation(2) Refers to all-in sustaining costs(3) Example of Non-IFRS measures, see Slide 2 for more information about Non-IFRS measures
Refer to Slide 2 “Cautionary Language” regarding forward-looking information
Macassa is a high-grade underground mine located in Ontario, Canada High-grade Mineral Reserve base (Reserves & Resource estimates as at Dec. 31 2019)(1)
o Mineral Reserves of 2.4M ozs @ 22.1 g/t, Near Surface: 0.1M ozs @ 10.7 g/to M&I Mineral Resources of 0.7M ozs @ 13.8 g/t, Near Surface: N/Mo Inferred Mineral Resources of 0.6M ozs @ 16.7 g/t, Near Surface: 0.1M ozs @ 11.5 g/t
One of the lowest GHG emitters in the world• World leader in the use of battery-powered equipment
Sinking new #4 Shaft – Target completion late 2020• Expected to grow gold production to over 400 koz per year at lower unit costs by 2023
Significant exploration success being achieved • Extending South Mine Complex to east and west, identifying high-grade mineralization along the
Amalgamated Break, identified new, high-grade corridor along Main Break near new shaft location
YTD 2020 production of 92.7 kozs @ op. cash costs of $541/oz, AISC of $846/oz • Transitioned to reduced operations at end of March 2020 due to COVID-19, returned to normal workforce
level by end of Q2 2020
Gold Production (koz) AISC ($/oz)(2)(3)
MACASSA – GROWING TO OVER 400,000 OZ/YEAR
Detour Lake Holt Complex
Macassa
Ontario

13(1) As at December 31, 2018. Refer to Reserve and Resource Statements in Appendix of this presentation(2) Refers to all-in sustaining costs(3) Example of Non-IFRS measures, see Slide 2 for more information about Non-IFRS measures
Refer to Slide 2 “Cautionary Language” regarding forward-looking information
One of world’s largest open-pit gold deposits with growth potential, located in Ontario, Canada Large base of Mineral Reserve base (Reserves & Resource estimates as at Dec. 31 2019)(1)
o Mineral Reserves of 14.8M ozs @ 0.97 g/to M&I Mineral Resources of 3.9M ozs @ 1.08 g/t, Underground: 0.5M ozs @ 5.80 g/to Inferred Mineral Resources of 1.1M ozs @ 0.82 g/t, Underground: 0.1M ozs @ 4.35g/t
Annual production of ~600 kozs, with current Mineral Reserve life of well over 20 years Targeting significant growth in Mineral Reserves through extensive drilling
o Growth in reserves to support strong production growth, improved unit costs
Substantial in-mine and regional exploration upsideo In-mine targets: Main and West Pito 58 North (located 8.4 kms from Main Pit)o Regional exploration targets (over 1,000 km2 land position along Abitibi-Greenstone Belt
Gold Production (koz) AISC ($/oz)(2)(3)
DETOUR LAKE – LARGE-SCALE, OPEN-PIT MINE
Detour Lake Holt Complex
Macassa
Ontario
One of World’s Largest Open-Pit Gold Deposits with Growth Potential

Q2 2020
131,992 ozs produced in Q2 2020
Op. cash costs/oz1: $573 (vs $696 in Q1 2020)
AISC/oz1: $1,090 (vs $1,108 in Q1 2020)
Free cash flow1: $89.0M
YTD 2020 (January 31 – June 30)
223,547 ozs produced (Guidance: 520 – 540 ozs)
Op. cash costs/oz1: $628 (Guidance: $610 – $630)
AISC/oz1: $1,098
Free cash flow1: $167.0M (40% of total FCF)2
DETOUR GOLD: THE RIGHT ACQUISITION AT THE RIGHT TIME
1. See Non-IFRS Measures section in forward-looking statements slide2. Based on total free cash flow of $418.1 million, which excludes $60.5 million of non-recurring transaction and restructuring fees and a $132.6 million tax instalment payment in Q2 2020 related to 2019 income. 14
DETOUR – CREATING SIGNIFICANT VALUE

SADDLE ZONE – HIGH POTENTIAL TARGET
1) Mineral Resources are inclusive of Mineral Reserves15
Potential for Significant Growth in Mineral Reserves and Mineral Resources

1) Mineral Resources are inclusive of Mineral Reserves16
SADDLE ZONE – HIGH POTENTIAL TARGET
Potential for Significant Growth in Mineral Reserves and Mineral Resources

FOSTERVILLE MINE – LOW-COST GOLD PRODUCTION
17
Fosterville
Northern Territory
Australia
High-grade, low cost mine with extensive in-mine and district scale exploration potential
(1) As at December 31, 2018. Refer to Reserve and Resource Statements in Appendix of this presentation(2) Refers to all-in sustaining costs(3) Example of Non-IFRS measures, see Slide 2 for more information about Non-IFRS measures
Fosterville is a high-grade, low cost underground mine located in Victoria State, Australia
High-grade Mineral Reserve base (Reserves & Resource estimates as at Dec. 31 2019)(1)
o Mineral Reserves of 2.1M ounces at 21.8 g/t, Robbin’s Hill: 0.2M ozs @ 5.5 g/to M&I Mineral Resources of 2.1M ozs @ 5.3 g/t, Robbin’s Hill: 0.4M ozs @ 3.5 g/to Inferred Mineral Resources of 1.7M ozs @ 6.4 g/t, Robbin’s Hill: 0.4M ozs @ 4.5 g/t
Swan Zone: Mineral Reserves of 1.6M ozs @ 38.6 g/t accounts for majority of production
YTD 2020 production of 315.0 kozs at op. cash costs(3) of $127/oz and AISC(2)(3) of $293/oz
Significant in-mine and district scale exploration potential through Lower Phoenix (including Swan Zone), Cygnet, Harrier and Robbin’s Hill
Gold Production (koz)
Refer to Slide 2 “Cautionary Language” regarding forward-looking information
AISC ($/oz)(2)(3)
Macassa, Detour Lake, Fosterville – highly profitable, cash flow generating assets with growth
Strong earnings and cash flow performance
Industry-leading financial strength – substantial liquidity, no debt
Projects advancing well in support of long-term performance of key assets
Achieving substantial exploration success
Committed to returning capital to shareholders
KL: DELIVERING PERFORMANCE WITH VALUE CREATION UPSIDE
KL: QUALITY ASSETS – SUPERIOR PERFORMANCE
18

19
APPENDIX
FOSTERVILLE MACASSA DETOUR LAKE
FOSTERVILLE Q2 2019 MINE PLAN
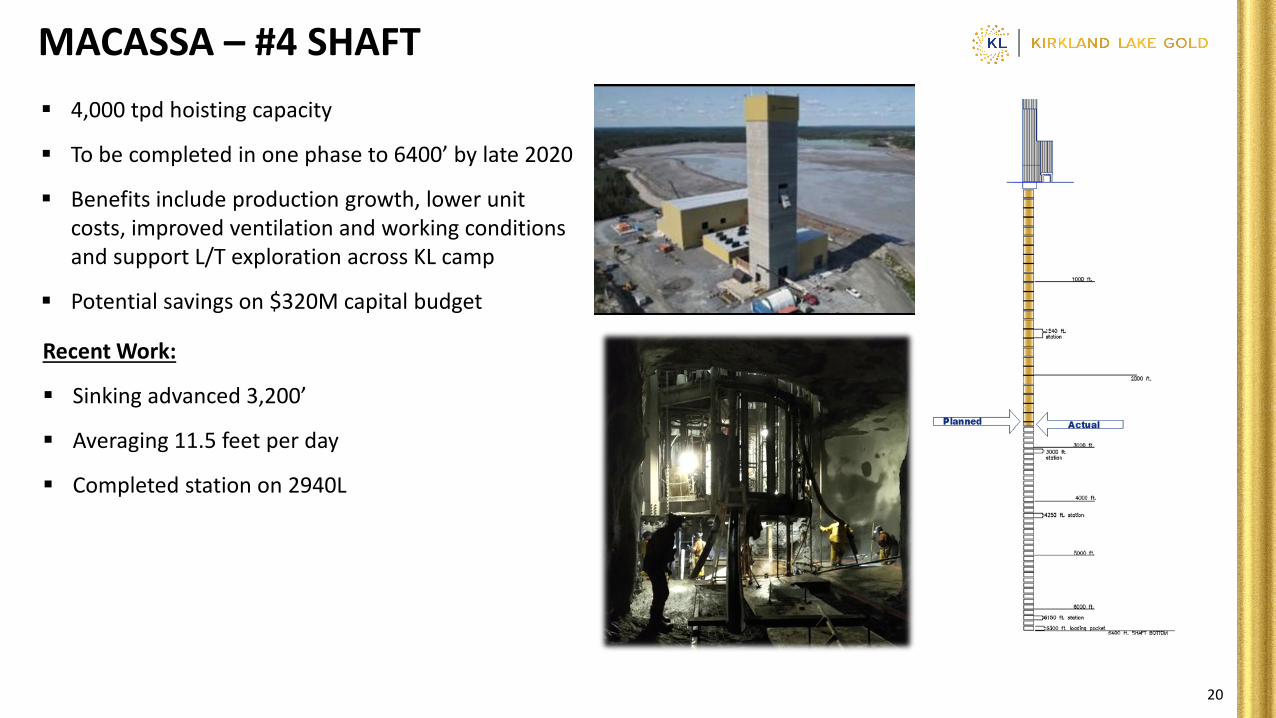
Recent Work:
Sinking advanced 3,200’
Averaging 11.5 feet per day
Completed station on 2940L
4,000 tpd hoisting capacity
To be completed in one phase to 6400’ by late 2020
Benefits include production growth, lower unit costs, improved ventilation and working conditions and support L/T exploration across KL camp
Potential savings on $320M capital budget
MACASSA – #4 SHAFT
20

21
MACASSA: KEY EXPLORATION TARGETS

22
New high-grade corridor identified along Main Break, below historic mining
Areas of high-grade mineralization identified along Amalgamated Break
Significant potential at depth as Main/’04 and Amalgamated Breaks plunge together
MACASSA – SIGNIFICANT EXPLORATION POTENTIAL
23
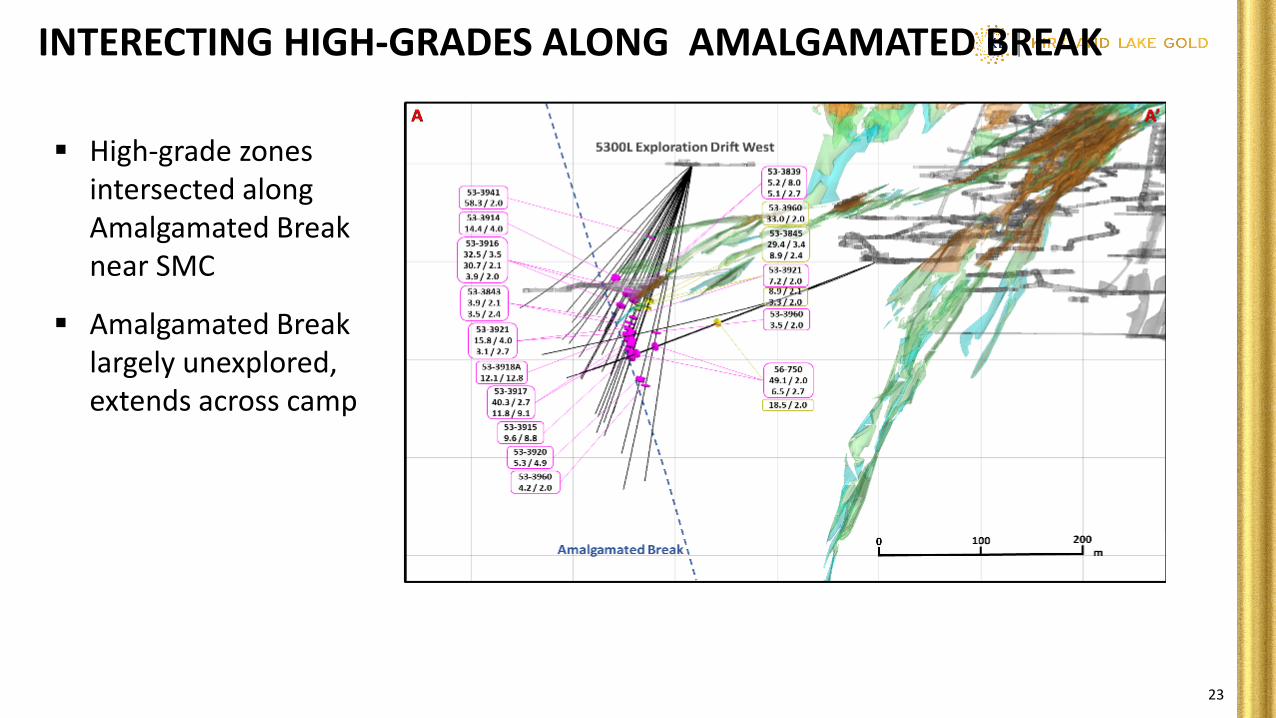
INTERECTING HIGH-GRADES ALONG AMALGAMATED BREAK
High-grade zones intersected along Amalgamated Break near SMC
Amalgamated Break largely unexplored, extends across camp

24
Potential for Significant Growth in Mineral Reserves and Mineral Resources
DETOUR – 58 NORTH ZONE – POTENTIAL NEW DEPOSIT
646 km2

25
Potential for Significant Growth in Mineral Reserves and Mineral Resources
DETOUR – 58 NORTH ZONE – POTENTIAL NEW DEPOSIT
58 NORTH ZONE

FOSTERVILLE – ENCOURAGING DRILL RESULTS
26

FOSTERVILLE: SWAN AND CYGNET
Infill Drilling at SwanKey intercepts:976 g/t Au over 7.4 m (ETW 7.0 m);933 g/t Au over 6.4 m (ETW 5.8 m);416 g/t Au over 6.8 m (ETW 5.6 m); and222 g/t Au over 8.1 m (ETW 7.3 m)
Extension drilling at CygnetKey intercepts:13.6 g/t Au over 6.6 m (ETW 5.9 m);12.7g/t Au over 2.1 m (ETW 2.1 m); and5.4 g/t Au over 9.7 m (ETW 8.0 m)
950 M extension of
Phoenix structure
Infill drilling in Swan Zone
returns higher than expected
grades
27
Significant potentialat Cygnet

FOSTERVILLE: ROBBIN’S HILL
Demonstrated substantial scale of mineralized system
Intersected high-grades with VG 950 m down-plunge of Mineral Resources
Cygnet zone 650 m strike
length, 300 m vertical depth
28

NOTES TO KIRKLAND LAKE GOLD MINERAL RESERVES & MINERAL RESOURCES
29
Detailed footnotes related to Mineral Reserve Estimates (dated December 31, 2019) - with the exception of Detour:
(1) CIM definitions (2019) were followed in the estimation of Mineral Reserves.(2) Mineral Reserves were estimated using a long-term gold price of US$1,300/oz (C$1,700/oz; A$1,765/oz).(3) Cut-off grades for Canadian Assets were calculated for each stope and included the costs of: mining, milling, General and Administration, royalties and capital expenditures and other modifying factors
(e.g. dilution, mining extraction, mill recovery).(4) Cut-off grades for Australian Assets were calculated for each mining block and included the costs of: mining, milling, General and Administration, royalties and capital expenditures and other modifying
factors (e.g. dilution, mining extraction, mill recovery).(5) Dilution estimates vary by mining methods and ranges from 5% to 50%.(6) Extraction estimates vary by mining methods and range from 50% to 100%.(7) Mineral Reserves estimates for Canadian Operations were prepared under the supervision of N.Vaz, P. En(8) Mineral Reserves estimates for Australian Operations were prepared under the supervision of I.Holland, FAusIM(9) Mineral Reserves are stated at a mill feed reference point.(10) Totals may not add up due to rounding.
Detailed footnotes related to Detour’s Mineral Reserve and Resource Estimates (dated December 31, 2019):
(1) The Company’s mineral reserve and mineral resource statement is classified in accordance with the Canadian Institute of Mining, Metallurgy and Petroleum (“CIM”) “CIM Definition Standards - ForMineral Resources and Mineral Reserves" adopted by the CIM Council (as amended, the “CIM Definition Standards”) in accordance with the requirements of National Instrument 43-101 “Standards ofDisclosure for Mineral Projects" (“NI 43-101”). Mineral reserve and mineral resource estimates reflect the Company's reasonable expectation that all necessary permits and approvals will be obtainedand maintained.
(2) Mineral reserves were estimated using a gold price of US$1,000/oz and mineral resources were estimated using a gold price of US$1,200/oz at a $US/$CDN exchange rate of 1.10.(3) Mineral reserves and resources were based on a cut-off grade of 0.50 g/t Au.(4) LG fines (sourced from material grading 0.40 – 0.50 g/t Au) classified as Measured or Indicated were reported as Probable mineral reserves and included in the mine plan. Reported tonnage is defined
as material scheduled to be fed from 2021 to the end of the mine as per 2018 life of mine plan.(5) Further information, including key assumptions, parameters, and methods used to estimate mineral resources and mineral reserves are described in the Technical Report on the Detour Lake operation,
dated Nov 26th, 2018.(6) Mineral underground resources for 58N are reported at a cut-off grade of 2.2 g/t Au, using a gold price of US$1,300 per ounce and a $US/$CDN exchange rate of 1.25 with an assumed mining dilution
of 12%.(7) Mineral resources are reported exclusive of mineral reserves. Mineral resources that are not mineral reserves do not have demonstrated economic viability. Mineral resources are constrained within an
economic pit shell.(8) Mineral Reserves and Mineral Resource estimates for the Detour Operation was prepared under the supervision of A. Leite, PEng , AUSIMM CP (MIN), MEng, P. Eng.(9) Totals may not add due to rounding.

NOTES TO KIRKLAND LAKE GOLD MINERAL RESERVES & MINERAL RESOURCES
30
Detailed footnotes related to Mineral Resource Estimates for Canadian Assets (dated December 31, 2019) – with the exception of Detour
(1) CIM definitions (2019) were followed in the calculation of Mineral Resource.(2) Mineral Resources are reported Exclusive of Mineral Reserves. Mineral Resources were calculated according to KL Gold’s Mineral Resource Estimation guidelines.(3) Mineral Resource estimates were prepared under the supervision of Eric Kallio, P. Geo. Senior Vice President, Exploration.(4) Mineral Resources are estimated using a long-term gold price of US $1,300/oz (C$1,700/oz).(5) Mineral Resources were estimated using a range of 3.4g/t to 8.6 g/t cut-off grades for Macassa Mine, a 2.8 g/t cut-off grade for Holt Mine and Holloway Mine, a 2.5 g/t cut-off grade for Holt Near Surface, a
2.6 g/t cut-off grade for Taylor, a 2.5 g/t cut-off grade for Canamax, a 2.2 g/t cut-off grade for Hislop and a 0 g/t cut-off grade for Aquarius.(6) Totals may not add up due to rounding.
Detailed footnotes related to Mineral Resource Estimates for Australian Assets (dated December 31, 2019)
(1) CIM definitions (2019) were followed in the estimation of Mineral Resource.(2) Mineral Resources are estimated using a long-term gold price of US$1,300/oz (A$1,765/oz)(3) Mineral Resources for the Australian assets are reported exclusive of Mineral Reserves.(4) Mineral Resources at Fosterville were estimated using cut-off grades 0.7 g/t Au for oxide and 1.0 g/t Au for sulfide mineralization to potentially open-pitable depths of approximately
100m, below which a cut-off grade of 3.0 g/t Au was used.(5) Mineral Resources in the Northern Territory were estimated using a cut-off grade of 0.5 – 0.7 g/t Au for potentially open pit mineralization and cut-offs of 1.5 to 2.0 g/t Au for
underground mineralization.(6) Mineral Resource estimates for the Fosterville property were prepared under the supervision of Troy Fuller, MAIG.(7) Mineral Resource estimates for the Northern Territory properties were prepared under the supervision of Owen Greenberger, MAIG.(8) Totals may not add up due to rounding.
Qualified Persons
Natasha Vaz, P.Eng., Vice President, Technical Services is a "qualified person" as defined in NI 43-101 and has reviewed and approved disclosure of the Mineral Reserves technicalinformation and data for the Canadian Assets (excluding Detour) included in this presentation.
Eric Kallio, P. Geo., Senior Vice President, Exploration is a “qualified person” as defined in NI 43-101 and has reviewed and approved disclosure of the Mineral Resource technical informationand data for the Canadian Assets (excluding Detour) included in this presentation.
Andre Leite, P.Eng , AUSIMM CP (MIN), MEng, Mine Technical Services Manager is a "qualified person" as defined in NI 43-101 and has reviewed and approved disclosure of the MineralReserves and Mineral Resources technical information and data for Detour included in this presentation.


