
Waste to Energy
A Technical Review of Municipal Solid Waste Thermal Treatment Practices
Final Report
Section 8: Emission Monitoring Systems
March 2011
Project No. 1231-10166
8-1
8 EMISSION MONITORING SYSTEMS
In order to determine compliance with facility emission permit limits, operators must undertake
emission monitoring and report the results to regulatory authorities. Point source emissions
monitoring is conducted either on continuous basis or periodic (non-continuous) basis.
Continuous monitoring measures parameters of concern using stationary monitoring equipment
permanently installed at various locations within combustion, APC or discharge flue of the
facility. Continuous monitors are typically used for operational control and occasionally for
compliance measurements. The results from the continuous monitor are representative of the
location on the system where they are installed, and therefore may not always represent the
concentration in the discharge.
Periodic emission monitoring, also called stack sampling, is usually performed on a prescribed
frequency, with the period specified (usually quarterly, annually or semi-annually) by the facility
SWMP or permit in the case of WTE, and is therefore non-continuous. Periodic stack sampling is
performed by a sampling crew of at least two people that extract a discrete sample from the stack for
the facility. This method of determining discharge quality consists of obtaining samples of the
emission stream according to approved protocols. The duration of the stack test is determined by the
size of the stack, the number of prescribed sample points within the stack, the degree of difficulty in
maintaining standard operating conditions during the test, and the number of replicate tests required
by the test procedure.
Continuous emissions and periodic stack testing monitoring methods are discussed in additional
detail below.
8.1 Continuous Emissions Monitoring Systems (CEMS)
Modern WTE monitoring systems ensure that air emissions resulting from plant operation fall within
specified limits. Projects initiated within Canada are required to use Environment Canada or US
Environmental Protection Agency (EPA) protocols and performance specifications listed in Appendix
7.1 of the BC Stationary Air Emissions Testing manual.[179]
New stationary continuous source testing
methods can be approved if they meet the requirements of US EPA Method Validation Protocol
Method 301.[180]
In conventional combustion facilities, Continuous Emissions Monitors Systems
(CEMS) are installed to monitor the internal operations of the facility components to ensure the
emissions leaving the facility are at appropriate levels.
The types of parameters that CEMS usually monitor and record include:
The baghouse outlet for opacity, moisture, CO, TOC, O2, NOx, SO2, HCl and HF. Opacity
measurements would be used as the filter bag leak detection system
179 British Columbia Field Sampling Manual Part B: Air and Air Emissions Testing. Stationary Air Emissions Testing. 2003. 180 US EPA. CFR Promulgated Test Methods. Method 301 – Method Validation Protocol. Field Validation of Pollutant Measurement
Methods from Various Waste Media.
Waste to Energy
A Technical Review of Municipal Solid Waste Thermal Treatment Practices
Final Report
Section 8: Emission Monitoring Systems
March 2011
Project No. 1231-10166 8-2
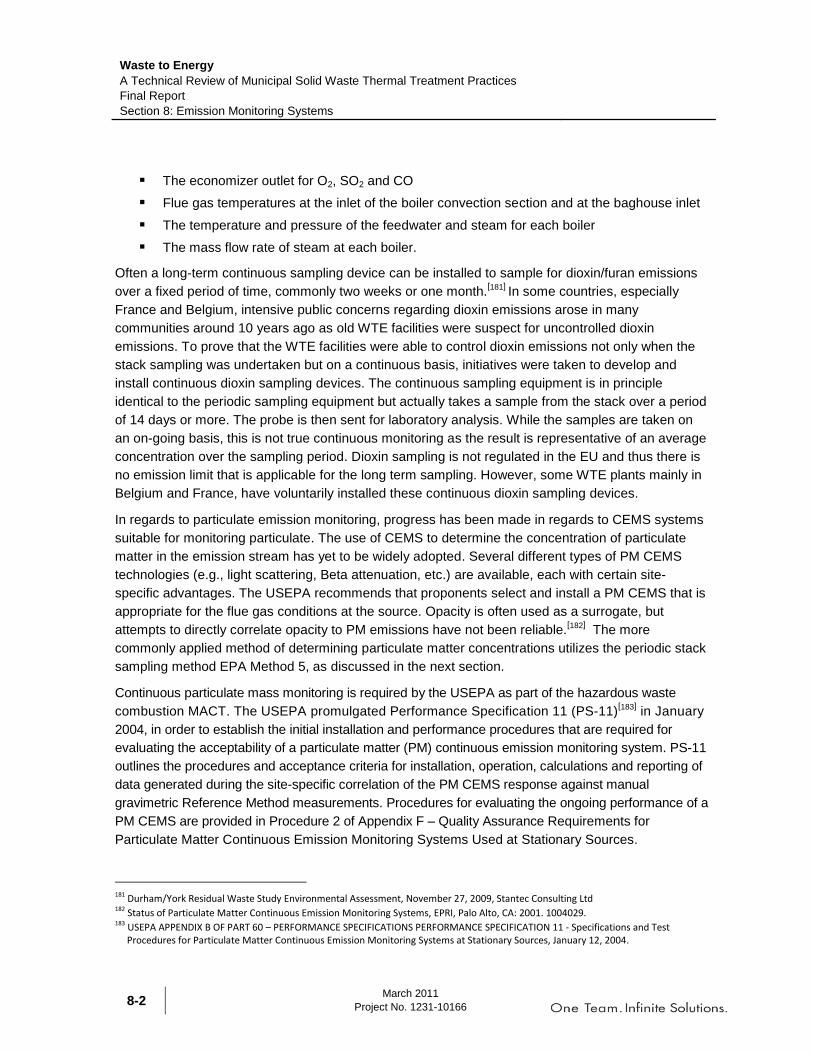
The economizer outlet for O2, SO2 and CO
Flue gas temperatures at the inlet of the boiler convection section and at the baghouse inlet
The temperature and pressure of the feedwater and steam for each boiler
The mass flow rate of steam at each boiler.
Often a long-term continuous sampling device can be installed to sample for dioxin/furan emissions
over a fixed period of time, commonly two weeks or one month.[181]
In some countries, especially
France and Belgium, intensive public concerns regarding dioxin emissions arose in many
communities around 10 years ago as old WTE facilities were suspect for uncontrolled dioxin
emissions. To prove that the WTE facilities were able to control dioxin emissions not only when the
stack sampling was undertaken but on a continuous basis, initiatives were taken to develop and
install continuous dioxin sampling devices. The continuous sampling equipment is in principle
identical to the periodic sampling equipment but actually takes a sample from the stack over a period
of 14 days or more. The probe is then sent for laboratory analysis. While the samples are taken on
an on-going basis, this is not true continuous monitoring as the result is representative of an average
concentration over the sampling period. Dioxin sampling is not regulated in the EU and thus there is
no emission limit that is applicable for the long term sampling. However, some WTE plants mainly in
Belgium and France, have voluntarily installed these continuous dioxin sampling devices.
In regards to particulate emission monitoring, progress has been made in regards to CEMS systems
suitable for monitoring particulate. The use of CEMS to determine the concentration of particulate
matter in the emission stream has yet to be widely adopted. Several different types of PM CEMS
technologies (e.g., light scattering, Beta attenuation, etc.) are available, each with certain site-
specific advantages. The USEPA recommends that proponents select and install a PM CEMS that is
appropriate for the flue gas conditions at the source. Opacity is often used as a surrogate, but
attempts to directly correlate opacity to PM emissions have not been reliable.[182]
The more
commonly applied method of determining particulate matter concentrations utilizes the periodic stack
sampling method EPA Method 5, as discussed in the next section.
Continuous particulate mass monitoring is required by the USEPA as part of the hazardous waste
combustion MACT. The USEPA promulgated Performance Specification 11 (PS-11)[183]
in January
2004, in order to establish the initial installation and performance procedures that are required for
evaluating the acceptability of a particulate matter (PM) continuous emission monitoring system. PS-11
outlines the procedures and acceptance criteria for installation, operation, calculations and reporting of
data generated during the site-specific correlation of the PM CEMS response against manual
gravimetric Reference Method measurements. Procedures for evaluating the ongoing performance of a
PM CEMS are provided in Procedure 2 of Appendix F – Quality Assurance Requirements for
Particulate Matter Continuous Emission Monitoring Systems Used at Stationary Sources.
181 Durham/York Residual Waste Study Environmental Assessment, November 27, 2009, Stantec Consulting Ltd 182 Status of Particulate Matter Continuous Emission Monitoring Systems, EPRI, Palo Alto, CA: 2001. 1004029. 183 USEPA APPENDIX B OF PART 60 – PERFORMANCE SPECIFICATIONS PERFORMANCE SPECIFICATION 11 - Specifications and Test
Procedures for Particulate Matter Continuous Emission Monitoring Systems at Stationary Sources, January 12, 2004.

Waste to Energy
A Technical Review of Municipal Solid Waste Thermal Treatment Practices
Final Report
Section 8: Emission Monitoring Systems
March 2011
Project No. 1231-10166
8-3
Up until recently, although guidance was provided regarding PM CEMS by the USEPA it has not yet
been widely used in the USA as a suitable monitoring approach for the purpose of demonstrating
regulatory compliance because of measurement accuracy and repeatability issues. However, this
has recently changed. The US EPA recently issued for public comment, 40 CFR Part 60 (new
standards for incineration units), which includes requirements for example for new waste energy
recovery units which would require units that have a design capacity greater than 250 MMBtu/hr, to
include monitoring of PM emissions using a PM CEMS.[184]
For other incineration facilities, the use of
PM CEMS would be optional as an alternative to periodic sampling.
The proposed new requirements for incineration units discuss the methods used to develop
proposed new emissions limits, and discuss the use of averaging periods as they relate to CEMS or
stack tests. For example, the proposed PM emission limits are based on data from infrequent
(normally annual) stack tests and compliance would generally be demonstrated by stack tests. The
use of PM CEMS for measurement and enforcement of the same emission limits must be carefully
considered in relation to an appropriate averaging period for data reduction. Because historical PM
CEMS data are unavailable for the solid waste incineration sector, EPA concluded that the use of a
24-hour block average was appropriate to address potential changes in PM emissions that cannot be
accounted for with short term stack test data. The 24-hour block average would be calculated
following procedures in EPA Method 19 of Appendix A-7 of 40 CFR part 60.[185]
CEMS requirements vary between jurisdictions, with some common parameters being measured
via CEMS but not all; and few jurisdictions have reviewed and assessed the potential requirement
for mandatory CEMS for particulate. The following table presents an overview of the continuous
emissions requirements as outlined in the current BC MSWI guidelines, Ontario Guideline A-7
(revised October 2010) and the EU Waste Incineration Directive.[186]
Table 8-1: Continuous Emissions Monitoring in BC, Ontario and EU
Pollutant BC 1991 MSWI
Emission Criteria
Ontario Guideline A-7 (Parameters Considered for
Continuous Monitoring)
EU Waste Incineration Directive
Temperature X X X
Organic matter X
Carbon monoxide X X X
Residual oxygen X X
Carbon dioxide X
Volumetric flow rate of the flue gas X
Hydrogen chloride X X X
Sulphur dioxide X X
184 ENVIRONMENTAL PROTECTION AGENCY, 40 CFR Part 60 EPA-HQ-OAR-2003-0119; FRL- RIN 2060-AO12 Standards of Performance for New
Stationary Sources and Emission Guidelines for Existing Sources: Commercial and Industrial Solid Waste Incineration Units, April 2010. 185 Ibid. 186 Ontario Ministry of the Environment. Guideline A-7: Air Pollution Control, Design and Operation Guidelines for Municipal Waste Thermal
Treatment Facilities, October 2010.

Waste to Energy
A Technical Review of Municipal Solid Waste Thermal Treatment Practices
Final Report
Section 8: Emission Monitoring Systems
March 2011
Project No. 1231-10166 8-4
Pollutant BC 1991 MSWI
Emission Criteria
Ontario Guideline A-7 (Parameters Considered for
Continuous Monitoring)
EU Waste Incineration Directive
Hydrogen fluoride X X
Nitrogen oxides X X
Opacity X X
TOC X
Total Dust/Particulate Matter X X
The Waste Incineration Directive also requires that O2 concentration, pressure, temperature, and
water vapour content of exhaust gas be continuously monitored. Periodic, instead of continuous,
monitoring of HCl, HF, and SO2 may be authorized if the operator can prove that the emissions of
these pollutants can under no circumstance be higher than the prescribed emission limit values. The
WID also requires at least two measurements per year of heavy metals, dioxins and furans (one
measurement at least every three months for the first 12 months of operation). Further, if the
operator can demonstrate that the emissions of heavy metals and dioxins/furans are always below
50% of the emission limit values, the operator only needs to test for heavy metals once every two
years (instead of twice a year) and for dioxins/furans once a year (instead of twice a year).Some EU
member nations impose additional requirements. For example, Germany requires that Hg be
monitored continuously.
8.2 Periodic Emission Monitoring
Currently in BC, to determine if a discharge is in compliance with permit requirements, periodic non-
continuous sampling may be required on a quarterly, semi-annually or annual basis. Field monitoring
conducted for each survey must be conducted by certified stack test technicians as required by the
BC Stationary Air Emissions Testing manual.[187]
This method of testing is also commonly called
„manual stack testing‟ and involves obtaining a representative sample of the emission from the flue
over a period of time at a prescribed number of sample locations. Stack testing is conducted
according to strict, approved protocols published in the BC Field Sampling Manual, the BC Air
Analytical Manual, the US Environmental Protection Agency methods, or by other approved
sampling and analytical methods.[188] [189. The USEPA methods generally represent the approved period
sampling methodologies for stationary sources, in many cases for specific industry sectors or specific
emission sources.
The duration of a periodic stack test is linked with the diameter of the stack and therefore the number
of sample locations on each traverse, the variability of the emission rate relative to standard
187 British Columbia. Field Sampling Manual for Continuous Monitoring and the Collection of Air, Air-Emission, Water, Wastewater, Soil,
Sediment, and Biological Samples. 2003 188 US Environmental Protection Agency 40 CFR Parts 60, 61 and 63 189 British Columbia Environmental Laboratory Manual for the Analysis of Water, Wastewater, Sediment, Biological Materials and
Discrete Ambient Air Samples. 2007
Waste to Energy
A Technical Review of Municipal Solid Waste Thermal Treatment Practices
Final Report
Section 8: Emission Monitoring Systems
March 2011
Project No. 1231-10166
8-5
operating conditions during the test, and the number of replicate tests that are required to meet
permit requirements. Typically, the test methodology will extract a sample from the discharge stream
and collect the parameters of interest on a filter paper (for particulates) or in a reagent or resin (such
as XAD-2 resin for organic constituents) for subsequent chemical analysis. Results are initially
produced on a mass basis and are then converted to concentration values on the basis of the
volumetric discharge rate. Therefore, the test results are representative of an average concentration
for the duration of the sampling period. In BC a valid manual stack survey consists of three individual
sample runs, and the result is then reported as the average of the triplicate tests. The discharge of
particulate, speciated particulate, trace metals, speciated organics and other specific parameters are
typically monitored using manual stack testing techniques.
It is important to note that the results produced by this testing method are representative of the
operational performance and actual emissions during the duration of the test run.
Emission criteria must consider the methods available to determine compliance and base the limit on
the period over which the sample is obtained.
8.3 Commonly Accepted Emission Monitoring Methods
Periodic stack testing requires the application of approved testing methods. Sampling methods have
been developed for most all contaminants that may be encountered. The approved methods specify
the locations and conditions under which testing can be considered representative of the emissions.
The approved methods also define the reagents to be used in the sampling equipment and define
how to handle the samples. The US EPA is one of the primary approving bodies for testing methods
and their approved methods are adopted in Canada and in some EU countries. The province has in
general, adopted the US EPA methods for application in BC. Continuous monitoring by CEMS also
has prescribed methods for locating the monitors and for completing correlation tests to validate the
CEMS data against periodic stack testing methods. The methods approved for use in BC are listed in
Table 8.2 below.
Similar application of approved methods occurs in the EU. There, the European Committee for
Standardization (CEN) is the body responsible for approving methods. The EU-directive 2000/76/EC
Annex III states that, If CEN standards are not available, then International Standards Association
(ISO) standard methods would apply. Similar to the EPA methods, CEN stipulates that continuous
measurement techniques must pass the CAL2 test, as described in EN14181, where the correlation
between the actual concentration and continuous monitor result is verified by annual reference test.
Waste to Energy
A Technical Review of Municipal Solid Waste Thermal Treatment Practices
Final Report
Section 8: Emission Monitoring Systems
March 2011
Project No. 1231-10166 8-6
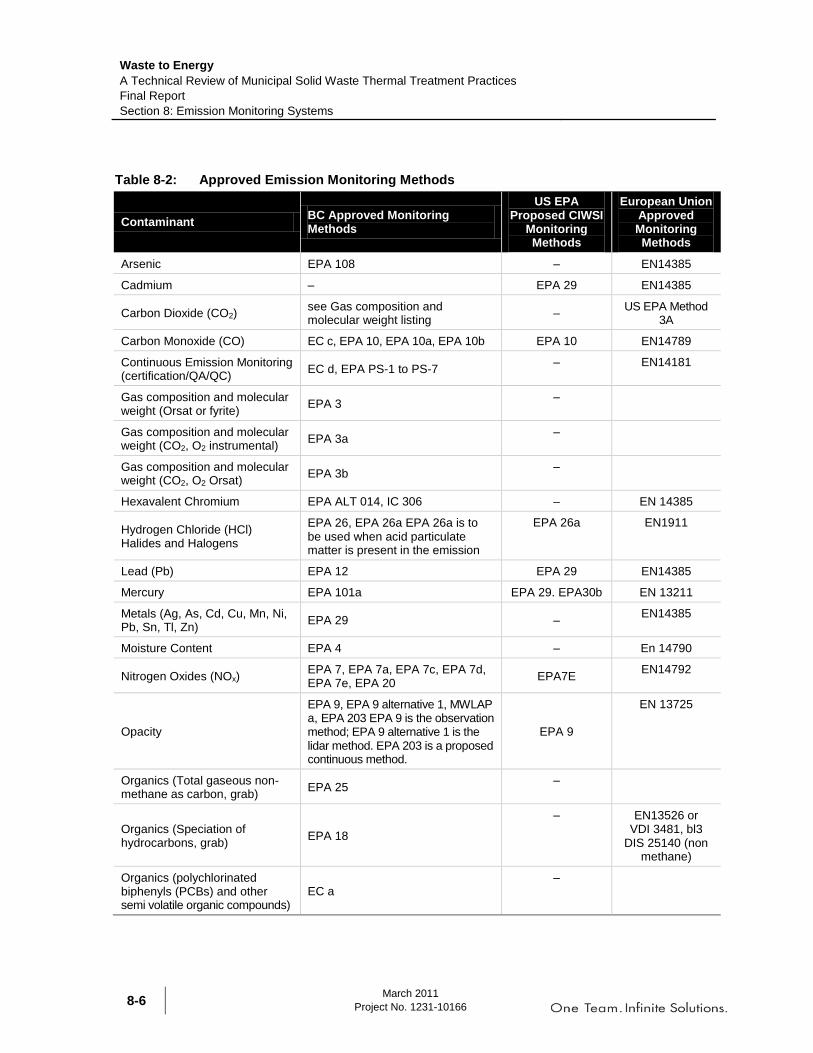
Table 8-2: Approved Emission Monitoring Methods
Contaminant BC Approved Monitoring Methods
US EPA Proposed CIWSI
Monitoring Methods
European Union Approved Monitoring Methods
Arsenic EPA 108 – EN14385
Cadmium – EPA 29 EN14385
Carbon Dioxide (CO2) see Gas composition and molecular weight listing
– US EPA Method
3A
Carbon Monoxide (CO) EC c, EPA 10, EPA 10a, EPA 10b EPA 10 EN14789
Continuous Emission Monitoring (certification/QA/QC)
EC d, EPA PS-1 to PS-7 – EN14181
Gas composition and molecular weight (Orsat or fyrite)
EPA 3 –
Gas composition and molecular weight (CO2, O2 instrumental)
EPA 3a –
Gas composition and molecular weight (CO2, O2 Orsat)
EPA 3b –
Hexavalent Chromium EPA ALT 014, IC 306 – EN 14385
Hydrogen Chloride (HCl) Halides and Halogens
EPA 26, EPA 26a EPA 26a is to be used when acid particulate matter is present in the emission
EPA 26a EN1911
Lead (Pb) EPA 12 EPA 29 EN14385
Mercury EPA 101a EPA 29. EPA30b EN 13211
Metals (Ag, As, Cd, Cu, Mn, Ni, Pb, Sn, Tl, Zn)
EPA 29 – EN14385
Moisture Content EPA 4 – En 14790
Nitrogen Oxides (NOx) EPA 7, EPA 7a, EPA 7c, EPA 7d, EPA 7e, EPA 20
EPA7E EN14792
Opacity
EPA 9, EPA 9 alternative 1, MWLAP a, EPA 203 EPA 9 is the observation method; EPA 9 alternative 1 is the lidar method. EPA 203 is a proposed continuous method.
EPA 9
EN 13725
Organics (Total gaseous non-methane as carbon, grab)
EPA 25 –
Organics (Speciation of hydrocarbons, grab)
EPA 18
– EN13526 or VDI 3481, bl3
DIS 25140 (non methane)
Organics (polychlorinated biphenyls (PCBs) and other semi volatile organic compounds)
EC a –
Waste to Energy
A Technical Review of Municipal Solid Waste Thermal Treatment Practices
Final Report
Section 8: Emission Monitoring Systems
March 2011
Project No. 1231-10166
8-7
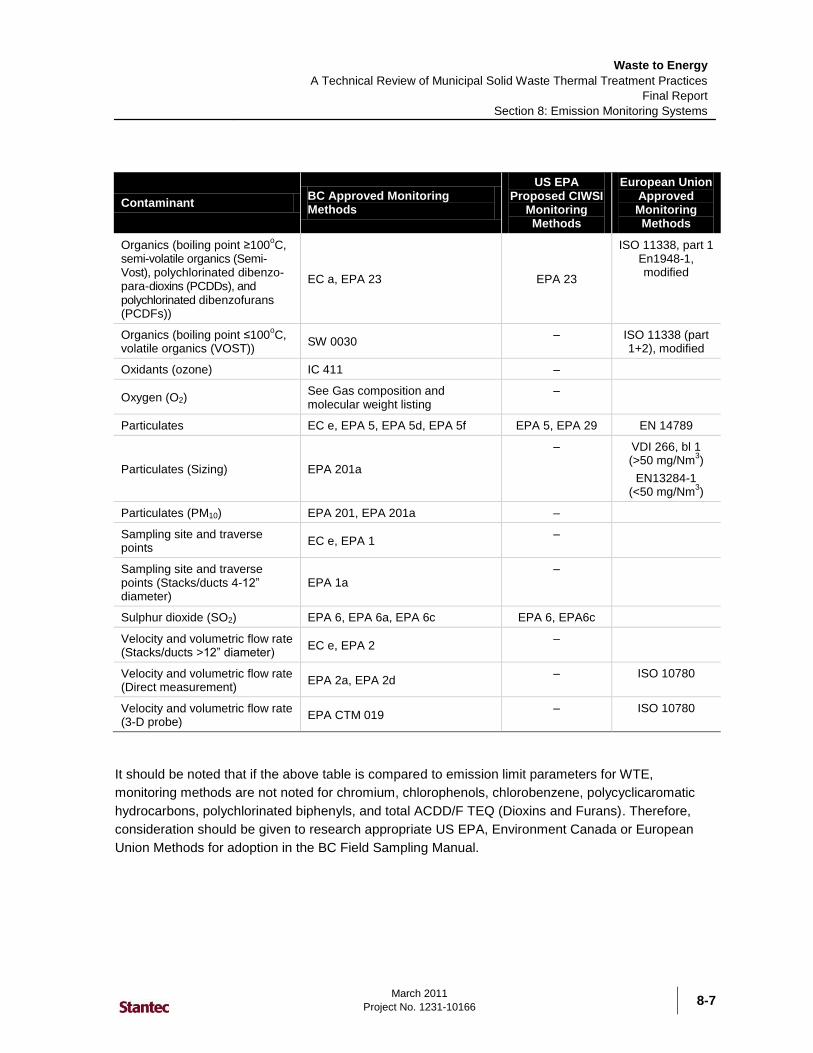
Contaminant BC Approved Monitoring Methods
US EPA Proposed CIWSI
Monitoring Methods
European Union Approved Monitoring Methods
Organics (boiling point ≥100oC,
semi-volatile organics (Semi-Vost), polychlorinated dibenzo-para-dioxins (PCDDs), and polychlorinated dibenzofurans (PCDFs))
EC a, EPA 23 EPA 23
ISO 11338, part 1 En1948-1, modified
Organics (boiling point ≤100oC,
volatile organics (VOST)) SW 0030
– ISO 11338 (part 1+2), modified
Oxidants (ozone) IC 411 –
Oxygen (O2) See Gas composition and molecular weight listing
–
Particulates EC e, EPA 5, EPA 5d, EPA 5f EPA 5, EPA 29 EN 14789
Particulates (Sizing) EPA 201a
– VDI 266, bl 1 (>50 mg/Nm
3)
EN13284-1 (<50 mg/Nm
3)
Particulates (PM10) EPA 201, EPA 201a –
Sampling site and traverse points
EC e, EPA 1 –
Sampling site and traverse points (Stacks/ducts 4-12” diameter)
EPA 1a –
Sulphur dioxide (SO2) EPA 6, EPA 6a, EPA 6c EPA 6, EPA6c
Velocity and volumetric flow rate (Stacks/ducts >12” diameter)
EC e, EPA 2 –
Velocity and volumetric flow rate (Direct measurement)
EPA 2a, EPA 2d – ISO 10780
Velocity and volumetric flow rate (3-D probe)
EPA CTM 019 – ISO 10780
It should be noted that if the above table is compared to emission limit parameters for WTE,
monitoring methods are not noted for chromium, chlorophenols, chlorobenzene, polycyclicaromatic
hydrocarbons, polychlorinated biphenyls, and total ACDD/F TEQ (Dioxins and Furans). Therefore,
consideration should be given to research appropriate US EPA, Environment Canada or European
Union Methods for adoption in the BC Field Sampling Manual.
Waste to Energy
A Technical Review of Municipal Solid Waste Thermal Treatment Practices
Final Report
Section 8: Emission Monitoring Systems
March 2011
Project No. 1231-10166 8-8
8.4 Relationship between Monitoring Methods and Emission Limits
The setting of emission criteria must consider the monitoring method used to determine compliance
and the period of time over which the sample is obtained. Emission limits based on periodic
monitoring are typically lower than the emission limits based on CEMS. The reasons for this
difference are described below.
In simple terms, periodic stack sampling generally involves sample runs for a minimum of 60 minutes
for partulates or for dioxins, furans and other select air toxics a minimum of 240 minutes. A minimum
of three sample runs constitutes a valid stack survey. Therefore, it can take between three and
twelve hours to complete a single stack survey (not including time to set up and take down the
equipment). During the test, the constituents of concern are collected continuously over the test
period and the mass of the constituents collected is measured. The data is then reduced to generate
a concentration value in a unit emission rate which is representative of the average concentration of
the constituent over the sampling period.
Instantaneous fluctuations in the concentration of the constituents of concern in the emissions from
incineration facilities occur as a result of a variety of factors, such as waste composition, moisture
content, variations in feed rates, and the duration of the fluctuation is typically minutes or at most a
few hours. Fluctuations in concentration during periodic monitoring test periods are averaged out and
the average reported. Compliance is often determined by averaging the results of duplicate or
triplicate tests, further normalizing the concentration in the emission.
Emission limits that are based on periodic sampling methods have a lower numerical value because
the instantaneous fluctuations in the emission concentration are not identified individually but are
averaged across the sampling period. The emission limits therefore correspond to the concentration
that would be expected and achievable over the averaging period under normal facility operating
conditions, including the fluctuations.
CEMS are by design continuous, with a high sampling frequency measured in seconds or minutes.
CEMS will detect the instantaneous fluctuations in concentration and produces data over a short
sampling interval, without averaging the results. CEMS provides a detailed glimpse of the emission
quality and its variability over time. As a result, emission limits based on CEMS must take into
account the expected fluctuations in emission quality and typically apply a much shorter averaging
period (e.g., ½ hour) to accommodate the fluctuations. CEMS-based emission limits are set at a
higher numerical value than periodic monitoring limits to accommodate the expected emissions
fluctuations. Notwithstanding the higher numerical values, CEMS-based limits are equivalent to, or
more protective than, the periodic sampling-based limit as they are generally applied over shorter
averaging periods and as compliance with these limits can be more regularly demonstrated.
The US EPA establishes the CEMS-based limits by considering historical monitoring data from both
periodic monitoring and CEMS and in the past has selected averaging periods between four hours
and 24 hours based on statistical analysis of long-term CEMS data for a particular facility. Their
default for setting CEMS-based limits is a 24-hour block average, calculated in accordance with EPA
Method 19 of Appendix A-7 of 40 CFR Part 60.

Waste to Energy
A Technical Review of Municipal Solid Waste Thermal Treatment Practices
Final Report
Section 8: Emission Monitoring Systems
March 2011
Project No. 1231-10166
8-9
8.5 Ambient Air Quality Monitoring
Ambient air quality monitoring stations are used to quantify concentrations of air contaminants in
ambient air. The focus of ambient air monitoring is determining concentrations relative to ambient air
quality objectives that have been established as being protective of human health and the environment.
Ambient air quality monitoring does not measure emissions from any one source; rather it measures
the combination of constituents in the atmosphere that may be present from any number of sources or
locations. Point sources, fugitive emissions and even out-of-region emissions will be detected by
ambient air quality monitoring. Ambient stations use a combination of continuous analyzers, typically
for basic parameters and gas concentrations, and monitors that obtain a sample over an extended
duration, for example total particulate and PM10 and PM 2.5. Trends observed in air quality data are
used to evaluate the effectiveness of reduction strategies for point source and non-point sources.
The Lower Fraser Valley Air Quality Monitoring Network is an excellent example of a regional
ambient air quality monitoring. This network includes 27 long-term air quality monitoring stations
operated by Metro Vancouver.[190]
Most of the stations collect air quality and weather data
continuously. The six CACs reported continuously are: O3, CO, SO2, NO2, PM10, PM2.5. Other
pollutants that are less widely monitored include ammonia, VOCs, and Total Reduced Sulphur
(TRS). Some stations collect non-continuous data for VOCs, particulate speciation and dichotomous
particulates.[191]
In addition, Metro Vancouver deploys portable air quality stations and instruments to
conduct special monitoring stations that focus on suspected problem areas in local communities.
Real-time ambient air quality monitoring data is also collected in the following BC communities:[192]
Western Communities
Victoria/Saanich
Nanaimo/Parksville
Campbell River
Whistler
Williams Lake
Quesnel
Prince George
Burns Lake
Terrace
Smithers
Fort St. John
Fort Nelson
Golden
Kamloops
North, Central, and South Okanagan
190 Metro Vancouver Air Quality website: http://www.metrovancouver.org/services/air/management/Pages/default.aspx 191 Metro Vancouver. Technical Appendix Air Quality Data 2006. Accessible at: http://www.bcairquality.com/readings/ 192 BC Air Quality Readings. Accessible at: http://www.bcairquality.com/readings/

Waste to Energy
A Technical Review of Municipal Solid Waste Thermal Treatment Practices
Final Report
Section 8: Emission Monitoring Systems
March 2011
Project No. 1231-10166 8-10
THIS PAGE INTENTIONALLY LEFT BLANK.
Waste to Energy
A Technical Review of Municipal Solid Waste Thermal Treatment Practices
Final Report
Section 9: Emission Limits and Their Application
March 2011
Project No. 1231-10166
9-1
9 EMISSION LIMITS AND THEIR APPLICATION
9.1 Typical Regulatory Practices
This subsection contains an assessment of MSW-related emission limits from other jurisdictions. It
indicates limits of all regulated substances plus determines which limits are dated, recent but derived
from dated material, and recent. All limits have been classified as to whether they are representative
of best achievable technology. Indications are made as to which technology is associated with the
various limits. Most importantly, this section is intended to convey an understanding of not only the
limits and appropriate control technologies that can meet these limits, but the rationale used to
support setting these limits in other jurisdictions.
The key to examining the limits used in other jurisdictions for regulated substances is to understand
not only the limits and appropriate control technologies that can meet these limits, but the rationale
used to support setting these limits in other jurisdictions. In some cases, the limits can be risk-based
with appropriate provisions for emissions to fall well within those that can cause an effect. In others,
the limits are set based on MACT (i.e., BAT) to drive the use of best-practice control technologies, or
are set at in-stack detection limits representing the limit of our capability to determine if a parameter
is being emitted at all. Understanding the premise behind the regulatory practices, limits or standards
set in other jurisdictions, will assist in the development of the supporting rationale for the updated
provincial air emission criteria in BC.
Section 9 presents the regulatory approach applied in various jurisdictions which represent a range
of jurisdictions in which WTE is applied. In preparation of this report, it was not intended to provide a
summary of the regulatory approach applied in all jurisdictions in which WTE is applied, but instead
to present information for a sampling of jurisdictions that generally fit the following requirements:
1. Jurisdictions located adjacent to BC (e.g., Alberta, Washington State, etc.) where the
regulatory approach to emissions represents those that could affect connected airsheds.
2. Jurisdictions within Canada within which the Canada Wide Standards developed by the
Canadian Council of the Ministers of the Environment (CCME) forms a foundation for the
regulatory environment, where there have been appropriate modifications to reflect
provincial specific issues, and where there has been more recent review of WTE approaches
(e.g., Alberta, Ontario).
3. Other nations (e.g., USA, and various EU nations) where WTE is widely applied, where
regulatory approaches have been relatively frequently updated over the past 20 years, and
from which facility performance information and reasonable translations of the regulations
and supporting documents are readily available.
There are a number of Asiatic nations (Japan, South Korea, China and others) where WTE has also
been widely applied, and where some information is available regarding current approaches and
technologies, however, sourcing facility performance data and/or reasonable translations of
regulations and supporting documents that discuss the regulatory approach is very difficult. While
Waste to Energy
A Technical Review of Municipal Solid Waste Thermal Treatment Practices
Final Report
Section 9: Emission Limits and Their Application
March 2011
Project No. 1231-10166 9-2
some research was undertaken, reliable consistent information from many other nations was not
available to support this project.
9.1.1 Regulatory Environment in Canada
The Canadian Council of the Ministers of the Environment (CCME) has developed guidelines and
Canada Wide Standards (CWS) that deal with the release of air emission from WTE facilities. It has
also developed ambient air quality CWS for particulate matter and ozone. The following subsections
discuss each.
9.1.1.1 CCME Guidelines
The Canadian Council of Ministers of the Environment (CCME) has developed federal guidelines
which give a basis for acceptable levels of emissions for a number of substances of concern (total
particulate matter, hydrogen chloride, carbon monoxide, sulfur dioxide, nitrogen oxides, cadmium
and lead) that are released from WTE facilities. The 1989 CCME guidelines were developed
because the CCME recognized the potential for significant growth in the area of MSW incineration in
Canada and wanted to ensure that health and environmental concerns were addressed. Specific
guidelines for each parameter are listed in Table 8-1.[193]
Although the CCME has developed these guidelines, it has no authority to impose its guidelines on
any jurisdiction in Canada. The guidelines, therefore, act more as a measure to which the provinces
and territories can compare their own individual limits. Each province or territory decides on the
degree to which it will incorporate the CCME suggested pollution guidelines in their own laws. Due to
the CCME guidelines lack of authority, there is a large degree of variation of environmental
standards across the county in terms of emissions from incineration facilities.
9.1.1.2 CCME Canada Wide Standards (CWS)
Canada-wide Standards (CWSs) are intergovernmental agreements developed under the Canadian
Council of Ministers of the Environment (CCME) Canada-wide Environmental Standards Sub-
Agreement, which operates under the broader CCME Canada-wide Accord on Environmental
Harmonization. National ambient air quality objectives can be promulgated by Health Canada and/or
by Environment Canada under the Canadian Environmental Protection Act (CEPA). CWSs address
key environmental protection and health risk issues that require concerted action across Canada.
CWSs represent co-operation toward a common goal and involve no delegation of authority by any
federal, provincial or territorial Minister of Environment.
CWSs can include quantitative standards for protecting the environment and reducing risks to human
health. The focus of the Canada-wide Environmental Standards Sub-Agreement is on standards that
recommend concentrations of substances in the environment. The standards generally provide
protection for human health and the environment, and are technologically and economically achievable.
193 Canadian Council of Ministers of the Environment. Operating and Emissions Guidelines for MSW Incinerators Report CCME-TS/WM-
TRE003, June 1989.

Waste to Energy
A Technical Review of Municipal Solid Waste Thermal Treatment Practices
Final Report
Section 9: Emission Limits and Their Application
March 2011
Project No. 1231-10166
9-3
In addition to the 1989 CCME Guidelines, the CCME has developed Canada Wide Standards in
regards to emissions of mercury and dioxins/furans from municipal waste incineration.[194]
In 2000,
the CCME also developed ambient air quality CWS for particulate matter and ozone.[195]
Mercury (Hg)
The standards for mercury emissions were endorsed in 2000 and address both existing and new
facilities that incinerate waste. In their report, the CCME identified waste incineration as one of the
three main sectors contributing to mercury emissions in Canada but stressed that these emissions
are mainly associated with the incineration of sewage sludge and hazardous waste. The CCME set
mercury emissions limits at 20 µg/Rm3.
Dioxins/Furans (PCDD/F)
The standards for dioxin and furan concentrations were endorsed in 2001. In their report, the CCME
identified the incineration of municipal waste, sewage sludge, medical waste, and hazardous waste
as major contributors to the emissions of dioxins and furans in Canada. The CCME set dioxin/furan
emissions limits at 80 pg I-TEQ/Rm3.[196]
The CCME also provides a number of recommendations regarding reduction of emissions of dioxins
and furans from the incineration of municipal waste. Their recommendations included increasing the
diversion of waste from disposal, removing materials from the waste stream that have a great
potential to lead to increased emissions of dioxins and furans, combustion control strategies to
optimize performance, and use of alternative disposal or management technologies.[197]
In 2007, the CCME reviewed their CWS for dioxins/furans and determined that there is no need to
update the emission limit. They reasoned that the current limit for dioxins/furans is still below limits
put in place by other jurisdictions around the world such as the European Union (92 pg I-TEQ/Rm3).
[198]
Ambient Particulate Matter and Ozone
In addition to the guidelines for emission of total particulate matter from municipal solid waste
incinerators set out in 1989[199]
, the CCME also developed ambient air quality CWS for particulate
matter (PM) and ozone in 2000.[200]
The CWS set an overall ambient target for PM2.5 for 2010 at 30
µg/Rm3 (24-hour averaging time based on the 98
th percentile ambient measurement annually averaged
over three consecutive years). The CWS does not set stack or industry sector specific targets.
194 Canadian Council of Ministers of the Environment. Canada-Wide Standards for Mercury Emissions. June 2000 195 Canadian Council of Ministers of the Environment Canada-Wide Standards for Particulate Matter (PM) and Ozone. 2000 196 Canadian Council of Ministers of the Environment Canada-Wide Standards for Dioxins and Furans. 2001 197 Canadian Council of Ministers of the Environment Canada-Wide Standards for Dioxins and Furans. 2001. 198 Canadian Council of Ministers of the Environment (CCME). (2007). Review of Dioxins and Furans from Incineration In Support of a
Canada-wide Standard Review 199 Canadian Council of Ministers of the Environment. Operating & Emissions Guidelines for MSW Incinerators Report CCME-TS/WM-
TRE003, June 1989. 200 Canadian Council of Ministers of the Environment Canada-Wide Standards for Particulate Matter (PM) and Ozone. 2000.

Waste to Energy
A Technical Review of Municipal Solid Waste Thermal Treatment Practices
Final Report
Section 9: Emission Limits and Their Application
March 2011
Project No. 1231-10166 9-4
The CWS did not provide an overall ambient target for PM10 as the CCME considered the reduction
in PM10 to come along with a reduction in PM2.5. Therefore the report does not discuss total
particulate matter, or PM2.5.
The CCME reviewed its CWS for particulate matter (PM) and ozone in 2005 and recommended
keeping the 2000 targets.[201]
9.1.1.3 CEAA
The federal requirements for an environmental assessment arise from the Canadian Environmental
Assessment Act (CEAA) and its supporting regulations. CEAA requires the Government of Canada
to consider the environmental effects of proposed projects before making a decision or exercising
any regulatory power in relation to a project. Per section 5(1) of CEAA, the federal environmental
assessment process is generally triggered if the Government of Canada:
Is the proponent
Provides funding, loan or other financial assistance that enables a project
Sells or leases land to enable a project
Issues a permit, licence, approval, or authorization that is identified in the Law List
Regulations pursuant to CEAA.
If future WTE projects fall under the above triggers, a CEAA-compliant environmental impact
assessment will be required.
9.1.1.4 Summary
Overall, the national guidelines set by the CCME are quite conservative in comparison to the laws
and guidelines set by other countries on similar pollutants. However, because the CCME does not
have the authority to enforce their standards and guidelines, it limits their ability to ensure that
targets are being met. Responsibility for ensuring the environmental performance of WTE facilities
rests with provincial and territorial governments.
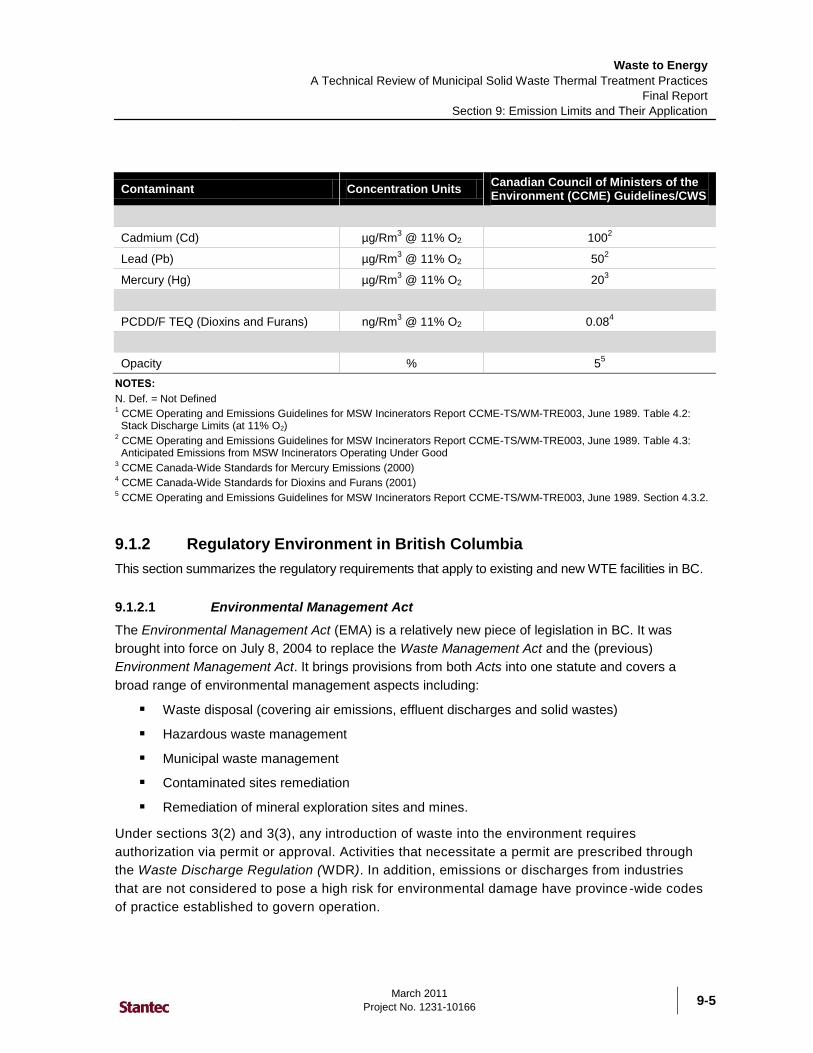
Table 9-1 presents an overview of the CCME emissions guidelines and CWS applicable to municipal
solid waste incinerators.
Table 9-1: CCME WTE Emissions Guidelines for Municipal Solid Waste Incinerators (1989)
Contaminant Concentration Units Canadian Council of Ministers of the Environment (CCME) Guidelines/CWS
Total Particulate Matter (TPM) mg/Rm3 @ 11% O2 20
1
Sulphur Dioxide (SO2) mg/Rm3 @ 11% O2 260
2
Hydrogen Chloride (HCl) mg/Rm3 @ 11% O2 75 or 90% removal
1
Nitrogen Oxides (NOx) (as NO2) mg/Rm3 @ 11% O2 400
2
Carbon Monoxide (CO) mg/Rm3 @ 11% O2 57 (114 for RDF Systems)
1
201 Joint Action Implementation Coordinating Committee (JAICC). (2005). An Update in Support of the Canada-wide Standards for
Particulate Matter and Ozone
Waste to Energy
A Technical Review of Municipal Solid Waste Thermal Treatment Practices
Final Report
Section 9: Emission Limits and Their Application
March 2011
Project No. 1231-10166
9-5
Contaminant Concentration Units Canadian Council of Ministers of the Environment (CCME) Guidelines/CWS
Cadmium (Cd) µg/Rm3 @ 11% O2 100
2
Lead (Pb) µg/Rm3 @ 11% O2 50
2
Mercury (Hg) µg/Rm3 @ 11% O2 20
3
PCDD/F TEQ (Dioxins and Furans) ng/Rm3 @ 11% O2 0.08
4
Opacity % 55
NOTES:
N. Def. = Not Defined 1 CCME Operating and Emissions Guidelines for MSW Incinerators Report CCME-TS/WM-TRE003, June 1989. Table 4.2: Stack Discharge Limits (at 11% O2)
2 CCME Operating and Emissions Guidelines for MSW Incinerators Report CCME-TS/WM-TRE003, June 1989. Table 4.3: Anticipated Emissions from MSW Incinerators Operating Under Good
3 CCME Canada-Wide Standards for Mercury Emissions (2000)
4 CCME Canada-Wide Standards for Dioxins and Furans (2001)
5 CCME Operating and Emissions Guidelines for MSW Incinerators Report CCME-TS/WM-TRE003, June 1989. Section 4.3.2.
9.1.2 Regulatory Environment in British Columbia
This section summarizes the regulatory requirements that apply to existing and new WTE facilities in BC.
9.1.2.1 Environmental Management Act
The Environmental Management Act (EMA) is a relatively new piece of legislation in BC. It was
brought into force on July 8, 2004 to replace the Waste Management Act and the (previous)
Environment Management Act. It brings provisions from both Acts into one statute and covers a
broad range of environmental management aspects including:
Waste disposal (covering air emissions, effluent discharges and solid wastes)
Hazardous waste management
Municipal waste management
Contaminated sites remediation
Remediation of mineral exploration sites and mines.
Under sections 3(2) and 3(3), any introduction of waste into the environment requires
authorization via permit or approval. Activities that necessitate a permit are prescribed through
the Waste Discharge Regulation (WDR). In addition, emissions or discharges from industries
that are not considered to pose a high risk for environmental damage have province -wide codes
of practice established to govern operation.
Waste to Energy
A Technical Review of Municipal Solid Waste Thermal Treatment Practices
Final Report
Section 9: Emission Limits and Their Application
March 2011
Project No. 1231-10166 9-6
The WDR defines “prescribed” industries, trades, businesses, activities and operations for the
purposes of regulation under EMA section 6(2) and 6(3). It also provides a process for registering
under a Minister‟s code of practice and a process for substituting requirements to a code of practice
in order to protect the public or the environment if an applicant can prove that the intent of the code
will be met.
The EMA and the WDR established a three-tiered approach for discharges to the environment
by prescribed industries. Tier 1 industries, which would include the WTE sector, are considered
to pose an elevated risk to the environment and public health and therefore require a permit to
discharge to the environment or for the case of WTE facilities under a Solid Waste Management Plan
(under Part 3 of EMA). Tier 2 industries pose a lower risk and discharges can be addressed by a Code
of Practice or by a permit. Tier 3 industries are low risk and do not require a permit.
Following submission of the EMA permit application, Ministry staff review the technical assessment
reports and application form information in order to draft recommendations for the Director of Waste
Management. The applicant reviews the draft recommendations, at which point the Director makes a
decision to either grant or deny a permit.
Should a permit be granted, the permit holder must pay an annual fee on the anniversary date of its
issuance, or 30 days after the date an invoice has been issued for the amount owing. The annual permit
fee is a combination of a base fee and a variable fee based on contaminants from authorized discharges
identified in the permit.
Under the EMA, Part 3 (Municipal Waste Management), municipal Solid Waste Management
Plans (SWMPs) are submitted for approval to the minister[202]
. Once the plan is approved by the
minister, an operational certificate may be issued by the Director to the municipality or specific
facility covered by the SWMP. A power or authority similar to a permit may be exercised by a
director in reference to an operational certificate. SWMPs address the management of solid
waste in landfills as well as WTE facilities. Once a SWMP containing specifics emission limits for
a WTE facility is approved by the Director, the facility would not require a permit from BCMOE.
9.1.2.2 Emission Criteria for Municipal Solid Waste Incineration
BC Ministry of Environment introduced Emission Criteria for Municipal Solid Waste Incinerators[203]
in
1991. A copy of the 1991 emissions criteria document can be found in Appendix B of this report.
The respective incinerator stack emissions limits are summarized in Table 9-2 and apply to new
and modified MSW incinerators with a capacity of greater than 400 kg/h (essentially equivalent to
9.6 tonnes per day) of waste. If the incinerator processing capacity is equal or less than 400 kg/h
of waste, different emission limits and ambient air quality objectives apply (Table 8-3).
The criteria require continuous monitoring of combustion temperature, oxygen, CO, opacity, HCl, and
emission control device inlet and outlet temperatures. Monthly source testing and annual
performance reporting are also required.
202 BC Environmental Management Act. Chapter 53. Part 3 – Municipal Waste Management. 2010. 203 BC Ministry of Environment. Emission Criteria for Municipal Solid Waste Incinerators. 1991.

Waste to Energy
A Technical Review of Municipal Solid Waste Thermal Treatment Practices
Final Report
Section 9: Emission Limits and Their Application
March 2011
Project No. 1231-10166
9-7
The BC Emission Criteria for Municipal Solid Waste Incinerators also identify design and operation
requirements for MSW and emission control systems to minimize emissions from an incinerator.
Table 9-2 lists incinerator design and operation parameters applicable to all sizes of incinerators.
Information pertaining to the permitting of the Burnaby WTE Incinerator in comparison to BC
Emission Criteria for Municipal Solid Waste Incinerators is provided in Section 9.1.3.2.
Table 9-2: BCMOE Emissions Criteria for MSW with a Processing Capacity Greater than 400 kg/h of Waste (1991)
Contaminant Concentration
Units Emissions
Criteria Averaging
Period Monitoring Method
Total Particulate Matter (TPM) mg/Rm3 @ 11% O2 20
1 2
Carbon Monoxide (CO) mg/Rm3 @ 11% O2 55
3
4-hour rolling average
Continuous monitoring
Sulphur Dioxide (SO2) mg/Rm3 @ 11% O2 250
1
2
Nitrogen Oxides (NOx as NO2) mg/Rm3 @ 11% O2 350
1
2
Hydrogen Chloride (HCl) mg/Rm3 @ 11% O2 70
8-hour rolling average
Continuous monitoring
Hydrogen Fluoride (HF) mg/Rm3 @ 11% O2 3
1
2
Total Hydrocarbons (as CH4) mg/Rm3 @ 11% O2 40
1
2
Arsenic (As)4 µg/Rm
3 @ 11% O2 4
1
2
Cadmium (Cd)4 µg/Rm
3 @ 11% O2 100
1
2
Chromium (Cr)4 µg/Rm
3 @ 11% O2 10
1
2
Lead (Pb)4 µg/Rm
3 @ 11% O2 50
1
2
Mercury (Hg) µg/Rm3 @ 11% O2 200
1
2
Chlorophenols µg/Rm3 @ 11% O2 1
1
2
Chlorobenzenes µg/Rm3 @ 11% O2 1
1
2
Polycyclicaromatic Hydrocarbons
µg/Rm3 @ 11% O2 5
1
2
Polychlorinated Biphenyls µg/Rm3 @ 11% O2 1
1
2
Total PCDD/F TEQ (Dioxins and Furans)
5
ng/Rm3 @ 11% O2 0.5
1
2
Opacity % 5 1hr avg, data every 10 sec
Continuous monitoring
NOTES:
BC Limits are based on 20 C. 1 To be averaged over the approved sampling and monitoring method
2 All sampling and monitoring methods, including continuous monitors, are to be approved by the Regional Manager.
3 For RDF systems the limit shall be 110 mg/m
3
4 The concentration is total metal emitted as solid and vapour
5 Expressed as Toxicity Equivalents. The value shall be estimated from isomer specific test data and toxicity equivalency factors by following a procedure approved by the Minister
Waste to Energy
A Technical Review of Municipal Solid Waste Thermal Treatment Practices
Final Report
Section 9: Emission Limits and Their Application
March 2011
Project No. 1231-10166 9-8
BC has remote camps serving the resource industry. In many of these locations, domestic solid
waste is incinerated in commercially available units with capacities less than 400 kg/h. Typically
these are small units that operate intermittently and which have small diameter discharge stacks that
may be difficult to conduct periodic or continuous source testing. For these facilities, the emission
limits for particulate is less stringent than for larger facilities (180 mg/m3 for smaller facilities versus
20 mg/m3 for larger facilities) reflecting the absence of APC equipment to control particulate. The
carbon monoxide limit is the same as 55 mg/m3 for large and small facilities where the fuel is MSW,
but increases to 110 mg/m3 for small facilities burning RDF. This is intended to reflect less efficient
combustion of RDF, which may include fuel with higher moisture content.
Under the BC Waste Discharge Regulation[204]
, the emissions and ash from a commercially available
auxiliary fuel fired refuse incinerator serving remote industrial, recreational, exploration or construction
camp designed to accommodate fewer than 100 persons are exempt from the application of
Environmental Management Act for waste disposal (Section 6(2) and 6(3)).[205]
In such instances,
the emissions criteria defined in Table 8-3 are not applied.
The capacity limit of 400 kg/h (9.6 tonnes per day) has been a reasonable cut-off for the
commercially available incinerators used in remote camps in BC. We noted that the US
Environmental Protection Agency defines small as 250 tons per day or less and large facilities as
greater than that. In Ontario, a simpler approval process applies to facilities that process less than
100 tonnes per day, however, the same air emissions criteria apply regardless of size for permanent
facilities. There is some flexibility associated with temporary or research facilities. The BC
Environmental Assessment Act trigger to conduct an Environmental Assessment is 250 tonnes per
day. The concept of a low threshold in terms of facility size, as applied in BC and Ontario, is a
reasonable one, affording a higher level of protection to the environment for all facilities that fall
outside the scale for research or on-site materials management. Determining the appropriate cut-off
capacity should be based on the regional context. In BC, small incinerators will in most all cases be
associated with remote camps serving the resource sector, and not operating as commercial
incineration facilities. It should be recognized that facilities below the capacity cut-off generally are
too small for point source emission monitoring, so the limit needs to be set appropriately. While there
is no direct connection between the facility size cut-off in the 1991 Criteria and the WDR exemption,
the current 400 kg/h cutoff should be maintained in the BC context in the revised MSWI Criteria.
204 BC Environmental Management Act. Waste Discharge Regulation. 2008. Website:
http://www.bclaws.ca/EPLibraries/bclaws_new/document/ID/freeside/50_320_2004#section6 205 BC Environmental Management Act. May 5, 2010. Website:
http://www.bclaws.ca/EPLibraries/bclaws_new/document/ID/freeside/03053_02

Waste to Energy
A Technical Review of Municipal Solid Waste Thermal Treatment Practices
Final Report
Section 9: Emission Limits and Their Application
March 2011
Project No. 1231-10166
9-9
Table 9-3: BCMOE Emissions Criteria for MSW with a Processing Capacity Equal to or Less than 400 kg/h of Waste (1991)
Contaminant Concentration
Units Emissions
Criteria
Averaging Period
Monitoring Method
Total Particulate Matter (TPM) mg/Rm3 @ 11% O2 180
1 2
Carbon Monoxide (CO) mg/Rm3 @ 11% O2 553 4-hour rolling avg Continuous
Carbon Monoxide (if burning RDF) mg/Rm3 @ 11% O2 110 4-hour rolling avg Continuous
Sulphur Dioxide (SO2) µg/Rm3 @ 11% O2 450
1
2
Nitrogen Oxides (NOx as NO2) µg/Rm3 @ 11% O2 400
1
2
Hydrogen Chloride (HCl) µg/Rm3 @ 11% O2 100 8-hour rolling avg Continuous
Hydrogen Fluoride (HF) mg/Rm3 @ 11% O2 3
1
2
Opacity % 10
NOTES:
BC Limits are based on 20 C. 1 To be averaged over the approved sampling and monitoring method
2 All samples and monitoring methods, including continuous monitors, are to be approved by the Regional Manager
3 For RDF systems the limit shall be 110 mg/m
3
Table 9-4: BCMOE Design and Operation Requirements for MSW and Emission Control Systems
Parameter Incinerator Type Modular (Excess Air and Starved Air)
Incinerator Type
Mass Burn RDF
Incinerator
Minimum Incineration Temperature
1,000 C at fully mixed height 1,000 C determined by an overall design review
1,000 C
Minimum Residence Time
One second after final secondary air injection ports
1 second calculated from the point where most of the combustion has been completed and the incineration temperature fully developed
1 second calculated from point where most of the combustion has been completed and the incineration temperature fully developed
Primary Air (Underfire)
Utilize multi-port injection to minimize waste distribution difficulties
Use multiple plenums with individual air flow control
Use air distribution matched to waste distribution
Secondary Air (Overfire)
Up to 80% of total air required1 At least 40% of total air
required At least 40% of total air required
Overfire Air Injector Design
That required for penetration and coverage of furnace cross-section
That required for penetration and coverage of furnace cross-section
That required for penetration and coverage of furnace cross-section

Waste to Energy
A Technical Review of Municipal Solid Waste Thermal Treatment Practices
Final Report
Section 9: Emission Limits and Their Application
March 2011
Project No. 1231-10166 9-10
Parameter Incinerator Type Modular (Excess Air and Starved Air)
Incinerator Type
Mass Burn RDF
Auxiliary Burner Capacity
Secondary burner 60% of total rated heat capacity, and that required to meet start-up and part-load temperatures
60% of total output, and that required to meet start-up and part-load temperatures
60% of total output, and that required to meet start-up and part-load temperatures
Oxygen Level at the Incinerator Outlet
6 to 12% 6 to 12% 3 to 9%
Turndown Restrictions
80 to 110% of designed capacity
80 to 110% of designed capacity
80 to 110% of designed capacity
Maximum CO Level 55 mg/m3 @ 11% O2
(4-h rolling average) 55 mg/m
3 @ 11% O2
(4-h rolling average) 110 mg/m
3 @ 11% O2
(4-h rolling average)
Emission Control Systems2
Flue Gas Temperature at Inlet or Outlet of Emission Control Device
3
Not to exceed 140 C Not to exceed 140 C Not to exceed 140 C
Opacity4 Less than 5% Less than 5% Less than 5%
NOTES: 1 For excess Air type – as required by design.
2 Applicable to incinerators equipped with such systems
3 The flue gas temperature at the inlet or outlet will depend on the type of emission control device in use
4 For incinerators with capacity or processing 400 kg/h or less of waste the opacity shall be less than 10%
9.1.2.3 BC Ambient Air Quality Objectives
The BC Ambient Air Quality Objectives (BC AAQO) have been derived from a variety of agencies on
a provincial and national basis. It is the intention that the BC AAQO are at least consistent with, and
potentially more stringent than, air quality objectives adopted on a national basis. As described
above, national air quality objectives can be promulgated by either Health Canada or Environment
Canada. It should be noted that the AAQO are non-statutory limits that are intended to be used as
benchmarks to assess air quality and to guide decision making with respect to the management of
air quality within an airshed.
The BC Ministry of Environment (2006), the federal government and Metro Vancouver established
ambient air quality criteria for a number of air contaminants. The BC AAQO for particulate matter
PM2.5 were adopted by the Ministry of Healthy Living and Sport (BC MHLS, 2009).[206]
These
objectives are summarized in Table 8-5.
206 BC Ministry of Healthy Living and Sport. Air Quality Objectives for British Columbia and Canada. April, 2009
http://www.env.gov.bc.ca/epd/bcairquality/regulatory/pm25-objective.html
Waste to Energy
A Technical Review of Municipal Solid Waste Thermal Treatment Practices
Final Report
Section 9: Emission Limits and Their Application
March 2011
Project No. 1231-10166
9-11
Historically, national air quality objectives[207]
have been defined as follows:
The Maximum Desirable Level is the long-term goal for air quality and provides a basis for
anti-degradation policy for unpolluted parts of the country, and for the continuing
development of control technology.
The Maximum Acceptable Level provides adequate protection against effects on soil,
water, vegetation, materials, animals, visibility, personal comfort and well-being.
The Maximum Tolerable Level denotes time based concentrations of air contaminants
beyond which, due to a diminishing margin of safety, appropriate action is required to protect
the health of the general population.
The BC AAQO are denoted as Levels A, B, and C and generally defined as follows:
Level A is set as the objective for new and proposed discharges and, within the limits of best
practicable technology, to existing discharges by planned staged improvements for these
operations.
Level B is set as the intermediate objective for all existing discharges to meet within a period
of time specified by the Director, and as an immediate objective for existing discharges
which may be increasing in quantity or altered in quality as a result of process expansion or
modification.
Level C is set as the immediate objective for all existing chemical and petroleum industries
to reach within a minimum technically feasible period of time.
Metro Vancouver adopted its own Ambient Air Quality Objectives as part of the Air Quality
Management Plan (AQMP) in October, 2005. AAQO were set for carbon monoxide, nitrogen dioxide,
sulphur dioxide, ozone, inhalable particulate matter (PM10), and fine particulate matter (PM2.5).[208]
In
2008, Metro Vancouver‟s objectives were equivalent or more stringent than both the CWS and BC
objectives for these CACs.[209]
A provincial 24-hour AAQO for PM2.5 was established in 2009 and is
numerically the same as Metro Vancouver‟s objective. However, whereas exceedance is prohibited
under the Metro Vancouver objective, some exceedances are permissible under the BC objective
each year. Metro Vancouver‟s annual objective is less stringent than the provincial annual target of
8 µg/m3 and an annual planned goal of 6 µg/m
3.
207 Health Canada. National Ambient Air Quality Objectives. http://www.hc-sc.gc.ca/ewh-semt/pubs/air/naaqo-onqaa/index-eng.php 208 Greater Vancouver Regional District (GVRD). Air Quality Management Plan. September 2005
http://www.metrovancouver.org/about/publications/Publications/AQMPSeptember2005.pdf 209 Metro Vancouver. 2008 Lower Fraser Valley Air Quality Report. June, 2009
http://www.metrovancouver.org/about/publications/Publications/LowerFraserValleyAmbientAirQuality-2008.pdf

Waste to Energy
A Technical Review of Municipal Solid Waste Thermal Treatment Practices
Final Report
Section 9: Emission Limits and Their Application
March 2011
Project No. 1231-10166 9-12
Table 9-5: British Columbia, National and Metro Vancouver Ambient Air Quality Objectives
Contaminant Averaging Period
BC Objectives (µg/m
3)
Canada Objectives (µg/m
3)
Metro Vancouver Objectives (µg/m
3)
Level A Level B Level C Maximum Desirable
Maximum Acceptable
Maximum Tolerable
Objective Level
Sulphur Dioxide (SO2)
1-hour 450 900 900 – 1,300 450 900 NA 450
3-hour 375 665 NA NA NA
24-hour 160 260 360 150 300 800 125
Annual 25 50 80 30 60 NA 30
Total Reduced Sulphur (TRS)
1-hour 7 28 NA NA 74
24-hour 3 6 NA NA NA
Hydrogen Sulphide (H2S)
1-hour 7.5 – 14 28 – 45 42 – 45 1 15 NA NA
24-hour 4 6 – 7.5 7.5 – 8 NA 5 NA NA
Nitrogen Dioxide (NO2)
1-hour NA NA NA NA 400 1,000 200
24-hour NA NA NA NA 200 300 NA
Annual NA NA NA 60 100 NA 40
Carbon Monoxide (CO)
1-hour 14,300 28,000 35,000 15,000 35,000 NA 30,000
8-hour 5,500 11,000 14,300 6,000 15,000 20,000 10,000
Ozone (O3)
1-hour NA 100 160 300 NA
8-hour NA 65 ppb3 126
24-hour NA 30 50 NA NA
Annual NA NA 30 NA NA
PM2.5 24-hour 25
1 30
2 25
Annual 8 NA 12
PM10 24-hour 50 NA 50
Annual NA NA 20

Waste to Energy
A Technical Review of Municipal Solid Waste Thermal Treatment Practices
Final Report
Section 9: Emission Limits and Their Application
March 2011
Project No. 1231-10166
9-13
Contaminant Averaging Period
BC Objectives (µg/m
3)
Canada Objectives (µg/m
3)
Metro Vancouver Objectives (µg/m
3)
Level A Level B Level C Maximum Desirable
Maximum Acceptable
Maximum Tolerable
Objective Level
Total Suspended Particulates (TSP)
24-hour 150 200 260 NA 120 400 NA
Annual 60 70 75 60 70 NA NA
Lead (Pb)
24-hour 4 4 6 NA NA
Annual 2 2 3 NA NA
Formaldehyde (CH2O)
1-hour Action Level = 60 NA NA
24-hour Action Level = 370 NA NA
NOTES:
Sources: BC MHLS (2009, Internet Site), Health Canada (2007), Metro Vancouver (2008 Lower Fraser Valley Ambient Air Quality, 2006 Technical Appendix Air Quality Data, 2005 Air Quality Management Plan for Greater Vancouver).
NA = Not applicable 1 Based on 98
th percentile value for one year.
2 The Canada-wide Standard is referenced to the 98
th percentile value averaged over three consecutive years.
3 8-hour daily maximum is based on fourth highest annual value, average over three consecutive years.
4 Metro Vancouver TRS desirable, acceptable and tolerable levels are 7, 14 and 1414 µg/m
3, respectively.

Waste to Energy
A Technical Review of Municipal Solid Waste Thermal Treatment Practices
Final Report
Section 9: Emission Limits and Their Application
March 2011
Project No. 1231-10166 9-14
9.1.2.4 BCMOE Best Achievable Technology Policy
In May 2008, the BC Ministry of Environment adopted an interim policy for “Determining Best Achievable
Technology Standards”.[210]
The policy is intended to provide guidance to MOE staff when setting waste
discharge standards, provincial targets, regulations and codes of practice, by using the best achievable
technologies (BAT) appropriate for the sector. BAT is also to be used by staff in the setting of facility-
specific permit or approval limits. The interim BAT policy is meant to encourage the scoping of all
technology shown to be economically feasible through successful commercial application in a similar
facility in the same industry. New and innovative technologies must also be examined. Generally, BAT
will be applied to new facilities, facilities undergoing major modifications that will result in amendments to
their permits and/or facilities located in sensitive environments.
The interim policy identifies seven steps to the determination of BAT to be used in the setting of
standards and criteria for the province and for facilities. These steps include:
1. Identification of all potential technologies or options
2. Eliminating technically infeasible options
3. Consideration of the reliability of each option
4. Ranking of technically feasible options by control effectiveness
5. Evaluating the cost effectiveness of each option
6. Selection of the appropriate BAT for the specific application
7. Determine the appropriate waste discharge criteria or standard.
The interim BAT policy does not specify the appropriate technology for any given application, rather
the approach is to determine what discharge quality is technically and economically possible and allow
proponents to select equipment and processes that meet those criteria.
9.1.2.5 British Columbia Environmental Assessment Act
The British Columbia Environmental Assessment Act (BCEAA) governs the preliminary environmental
approval process for large capital projects in BC and includes consideration of new projects,
modifications to existing facilities, and dismantling and abandonment of facilities. BCEAA is administered
by the British Columbia Environmental Assessment Office (BCEAO) and is intended to ensure that
projects subject to the legislation meet the Province of British Columbia‟s goals of environmental,
economic, and social sustainability. BCEAA also provides a process to address issues and concerns
raised by the public, First Nations, interested stakeholders and government agencies.
Future WTE facilities may require approval under the BCEAA if they meet the criteria set out in the
Reviewable Projects Regulation[211]
under Part 4 (Energy Projects) and Part 6 (Waste Disposal
Projects) of the regulation. BCEAA Reviewable Projects Regulations applicable to WTE projects are
210 BCMOE Interim Policy: Determining Best Achievable Technology Standards, Maiy 2008 211 British Columbia Environmental Assessment Act: Reviewable Projects Regulation. BC. Reg. 370/2002. Amended January 14, 2010
Waste to Energy
A Technical Review of Municipal Solid Waste Thermal Treatment Practices
Final Report
Section 9: Emission Limits and Their Application
March 2011
Project No. 1231-10166
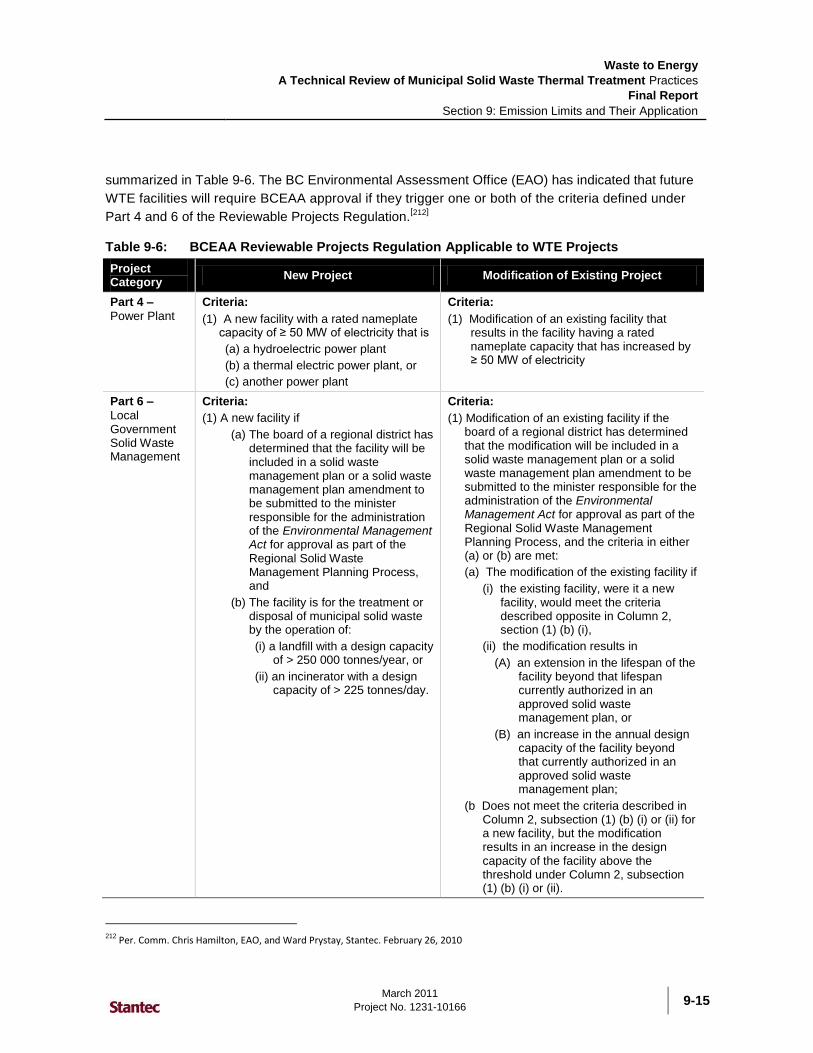
9-15
summarized in Table 9-6. The BC Environmental Assessment Office (EAO) has indicated that future
WTE facilities will require BCEAA approval if they trigger one or both of the criteria defined under
Part 4 and 6 of the Reviewable Projects Regulation.[212]
Table 9-6: BCEAA Reviewable Projects Regulation Applicable to WTE Projects
Project Category
New Project Modification of Existing Project
Part 4 –
Power Plant
Criteria:
(1) A new facility with a rated nameplate capacity of ≥ 50 MW of electricity that is
(a) a hydroelectric power plant
(b) a thermal electric power plant, or
(c) another power plant
Criteria:
(1) Modification of an existing facility that results in the facility having a rated nameplate capacity that has increased by ≥ 50 MW of electricity
Part 6 –
Local Government Solid Waste Management
Criteria:
(1) A new facility if
(a) The board of a regional district has determined that the facility will be included in a solid waste management plan or a solid waste management plan amendment to be submitted to the minister responsible for the administration of the Environmental Management Act for approval as part of the Regional Solid Waste Management Planning Process, and
(b) The facility is for the treatment or disposal of municipal solid waste by the operation of:
(i) a landfill with a design capacity of > 250 000 tonnes/year, or
(ii) an incinerator with a design capacity of > 225 tonnes/day.
Criteria:
(1) Modification of an existing facility if the board of a regional district has determined that the modification will be included in a solid waste management plan or a solid waste management plan amendment to be submitted to the minister responsible for the administration of the Environmental Management Act for approval as part of the Regional Solid Waste Management Planning Process, and the criteria in either (a) or (b) are met:
(a) The modification of the existing facility if
(i) the existing facility, were it a new facility, would meet the criteria described opposite in Column 2, section (1) (b) (i),
(ii) the modification results in
(A) an extension in the lifespan of the facility beyond that lifespan currently authorized in an approved solid waste management plan, or
(B) an increase in the annual design capacity of the facility beyond that currently authorized in an approved solid waste management plan;
(b Does not meet the criteria described in Column 2, subsection (1) (b) (i) or (ii) for a new facility, but the modification results in an increase in the design capacity of the facility above the threshold under Column 2, subsection (1) (b) (i) or (ii).
212 Per. Comm. Chris Hamilton, EAO, and Ward Prystay, Stantec. February 26, 2010

Waste to Energy
A Technical Review of Municipal Solid Waste Thermal Treatment Practices
Final Report
Section 9: Emission Limits and Their Application
March 2011
Project No. 1231-10166 9-16
9.1.3 Regulatory Environment in Metro Vancouver
9.1.3.1 Greater Vancouver Regional District Air Quality Management Bylaw No. 1082, 2008
The Greater Vancouver Regional District (GVRD, recently renamed to Metro Vancouver) has been
authorized by the Environmental Management Act to regulate, control and prevent discharge of air
contaminants. The Greater Vancouver Regional District Air Quality Management Bylaw No. 1082[213]
regulates the discharge of air contaminants within Metro Vancouver. The bylaw dictates air emissions
from industries, trades, businesses, activities, operations or residences are required to obtain approval
from the District Director whether or not they are permitted under the Environmental Management Act.
Waste management facilities must fulfill the requirements defined by the District Director in order to
obtain authorization to discharge air contaminants from the Provincial Government.
The Burnaby Incinerator operates under the Metro Vancouver Solid Waste Management Plan, and as
such the above MV bylaw does not apply to the Burnaby Incinerator.
9.1.3.2 Metro Vancouver Solid Waste Management Plan
Specific objectives on reducing per capital garbage disposal in the Greater Regional Vancouver
District (now Metro Vancouver) were set by the province of BC in 1995. The objectives were published
in the 1995 Greater Waste Regional Solid Waste Management Plan[214]
report, stating per capita
garbage disposal will be reduced by at least 30% in 1995 and 50% in 2000, while responsibly
managing any residues. As part of the objectives, Appendix D of the report summarized long-term
monitoring requirements and discharge limits for the Burnaby Incinerator disposal facility.
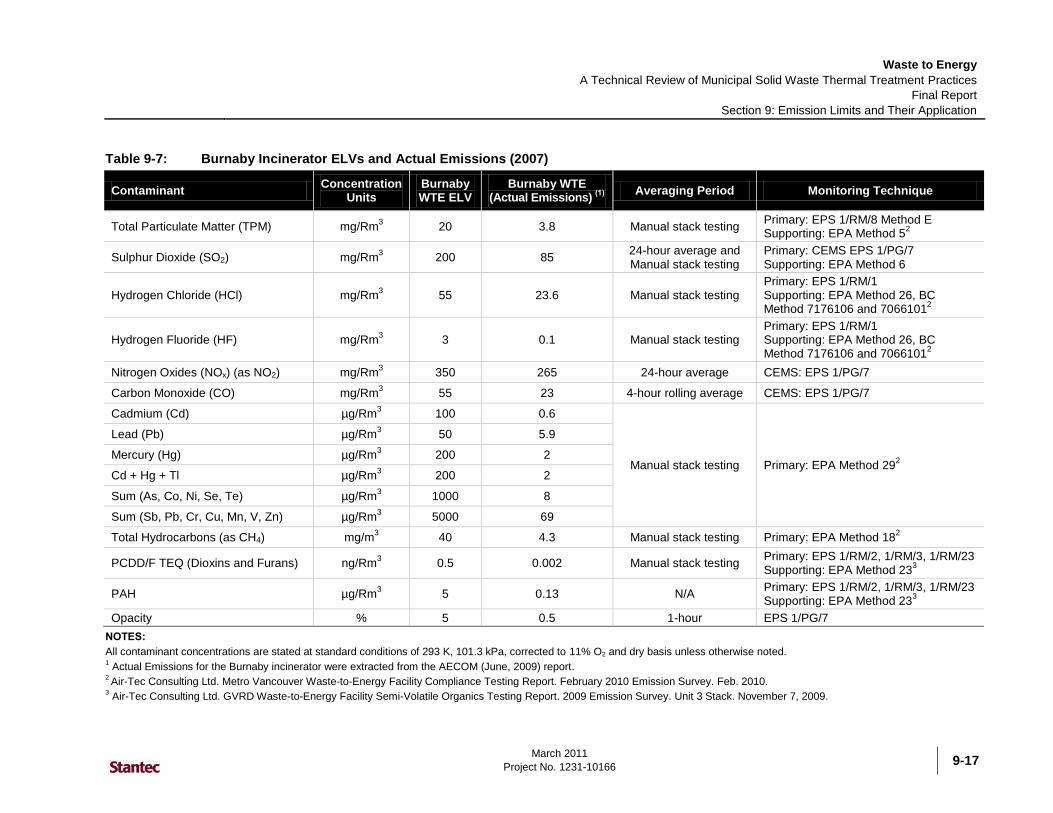
The Metro Vancouver Burnaby incinerator burns approximately 280,000 tonnes of garbage to produce
900,000 tonnes of steam which is used to generate electricity. The plant has three processing lines, each
processing approximately 11.5 tonnes of garbage each hour. Generated heat and gases are passed into
the boiler area, where they heat tubes filled with water. Gases subsequently pass into the flue gas cleaning
system which consists of the lime and carbon injection reactor and fabric bags. The lime and carbon
injection reactor captures acid gases and any traces of mercury. Fabric bags are used to remove acids and
particulate matter before the cleaned gas is discharged through the 60 m high stack.
Table 9-7 compares the air discharge limits against actual Burnaby incinerator air emissions.[215]
The
table also summarizes the long-term monitoring requirements as well as the monitoring techniques
used at the facility.[216, 217]
213 Greater Vancouver Regional District Air Quality Management Bylaw No. 1082, 2008.
http://www.metrovancouver.org/boards/bylaws/Bylaws/RD_Bylaw_1082.pdf 214 Greater Vancouver Regional Solid Waste Management Plan. July, 1995. 215 AECOM. Management of Municipal Solid Waste in Metro Vancouver – A comparative Analysis of Options for Management of Waste
After Recycling. June, 2009. 216 Air-Tec Consulting Ltd. Metro Vancouver Waste-to-Energy Facility Compliance Testing Report. February 2010 Emission Survey. Feb. 2010. 217 Air-Tec Consulting Ltd. GVRD Waste-to-Energy Facility Semi-Volatile Organics Testing Report. 2009 Emission Survey. Unit 3 Stack.
November 7, 2009.
Waste to Energy
A Technical Review of Municipal Solid Waste Thermal Treatment Practices
Final Report
Section 9: Emission Limits and Their Application
March 2011
Project No. 1231-10166
9-17
Table 9-7: Burnaby Incinerator ELVs and Actual Emissions (2007)
Contaminant Concentration
Units Burnaby WTE ELV
Burnaby WTE (Actual Emissions)
(1)
Averaging Period Monitoring Technique
Total Particulate Matter (TPM) mg/Rm3 20 3.8 Manual stack testing
Primary: EPS 1/RM/8 Method E Supporting: EPA Method 5
2
Sulphur Dioxide (SO2) mg/Rm3 200 85
24-hour average and Manual stack testing
Primary: CEMS EPS 1/PG/7 Supporting: EPA Method 6
Hydrogen Chloride (HCl) mg/Rm3 55 23.6 Manual stack testing
Primary: EPS 1/RM/1 Supporting: EPA Method 26, BC Method 7176106 and 7066101
2
Hydrogen Fluoride (HF) mg/Rm3 3 0.1 Manual stack testing
Primary: EPS 1/RM/1 Supporting: EPA Method 26, BC Method 7176106 and 7066101
2
Nitrogen Oxides (NOx) (as NO2) mg/Rm3 350 265 24-hour average CEMS: EPS 1/PG/7
Carbon Monoxide (CO) mg/Rm3 55 23 4-hour rolling average CEMS: EPS 1/PG/7
Cadmium (Cd) µg/Rm3 100 0.6
Manual stack testing Primary: EPA Method 292
Lead (Pb) µg/Rm3 50 5.9
Mercury (Hg) µg/Rm3 200 2
Cd + Hg + Tl µg/Rm3 200 2
Sum (As, Co, Ni, Se, Te) µg/Rm3 1000 8
Sum (Sb, Pb, Cr, Cu, Mn, V, Zn) µg/Rm3 5000 69
Total Hydrocarbons (as CH4) mg/m3 40 4.3 Manual stack testing Primary: EPA Method 18
2
PCDD/F TEQ (Dioxins and Furans) ng/Rm3 0.5 0.002 Manual stack testing
Primary: EPS 1/RM/2, 1/RM/3, 1/RM/23 Supporting: EPA Method 23
3
PAH µg/Rm3 5 0.13 N/A
Primary: EPS 1/RM/2, 1/RM/3, 1/RM/23 Supporting: EPA Method 23
3
Opacity % 5 0.5 1-hour EPS 1/PG/7
NOTES:
All contaminant concentrations are stated at standard conditions of 293 K, 101.3 kPa, corrected to 11% O2 and dry basis unless otherwise noted. 1 Actual Emissions for the Burnaby incinerator were extracted from the AECOM (June, 2009) report.
2 Air-Tec Consulting Ltd. Metro Vancouver Waste-to-Energy Facility Compliance Testing Report. February 2010 Emission Survey. Feb. 2010.
3 Air-Tec Consulting Ltd. GVRD Waste-to-Energy Facility Semi-Volatile Organics Testing Report. 2009 Emission Survey. Unit 3 Stack. November 7, 2009.

Waste to Energy
A Technical Review of Municipal Solid Waste Thermal Treatment Practices
Final Report
Section 9: Emission Limits and Their Application
March 2011
Project No. 1231-10166 9-18
In general, the Burnaby incinerator permit requirements are in agreement with the provincial 1991
emissions criteria for MSW combustion (Table 8-2). The exceptions include permit limits SO2 and
HCl contaminants which are more stringent than the provincial criteria. Also, under the Burnaby
permit the long-term monitoring requirements for HF call for manual stack testing, whereas provincial
criteria require continuous monitoring and 8-hr rolling averaging.
Since the 1995 objectives have been met, Metro Vancouver has been working on revising the 1995
provincially mandated plan. The draft Integrated Solid Waste and Resource Management (ISWRM)
report[218]
was released in November, 2009. The new target of the ISWRMP increases the regional
diversion rate from an average of 55% to 70% by 2015. The plan also identifies aggressive waste
reduction strategies to recover materials and energy from remaining waste through four goals:
Goal 1: Minimize waste generated
Goal 2: Maximize reuse, recycling and material recovery
Goal 3: Recover energy from the waste stream after material recycling
Goal 4: Dispose of all remaining waste in landfill, after material recycling and energy recovery.
The strategies identified to achieve the ISWRMP target under Goal 3 include:
Use of WTE to provide electricity and district heating
Recover energy from other solid waste management facilities
Utilize non-recyclable material as fuel.
This includes the ongoing use of the Burnaby Incinerator as one of the approved disposal facilities,
expansion of WTE utilization in the region (up to 500,000 tonnes per year of new WTE capacity), and
development of new WTE capacity through new projects designed to maximize the environmental,
financial, and social benefits.
9.1.3.3 Proposed Gold River Power (formerly Green Island) WTE Facility
The Gold River Power facility proposed by Covanta, will be capable of converting approximately
750,000 tonnes of post-recycled municipal solid waste per year to clean energy. This thermal power
plant is proposed to be located at the former pulp mill site in Gold River, BC.
The proposed facility has an existing permit PA-17426, issued May 13, 2004 (last amended
November 25, 2005), which authorizes the discharge of air emissions from a wood-fueled power
boiler (Phase I Boiler) and a refuse derived fueled (RDF) modified recovery boiler (Phase II Boiler).
Table 9-8 presents the ELVs identified in the existing permit for this facility.
218 Integrated Solid Waste and Resource Management: A Draft Solid Waste Management Plan for the Greater Vancouver Regional District
and Member Municipalities. November, 2009.

Waste to Energy
A Technical Review of Municipal Solid Waste Thermal Treatment Practices
Final Report
Section 9: Emission Limits and Their Application
March 2011
Project No. 1231-10166
9-19
However, design of the facility (as well as ownership) has shifted to a design involving two new
state-of-the-art boilers (No.1 and No. 2), each with independent Air Pollution Control (APC)
equipment, and an application has been recently submitted to amend the existing air permit accordingly.
Combustion controls are proposed to maintain low levels of carbon monoxide and minimize products
of incomplete combustion. Covanta‟s proprietary Very Low NOx VLN™ system (patent pending) and
a Selective Non-Catalytic Reduction (SNCR) system are proposed to achieve NOx emissions levels
that meet Provincial NOx control criteria. The proposed APC approach would also include a
scrubber, baghouse, carbon injection system and a continuous emission monitoring system. Lime
injection and temperature control at the scrubber will control acid gases and carbon injection before
the scrubber is intended to provide mercury and dioxin control.
The following table compares the authorized emissions from Phase I and Phase II Boilers under the
existing permit with the proposed authorized emissions from the new high-efficiency boilers.
Table 9-8: Proposed Green Island Energy Emission Limit Values
Parameter EXISTING
Phase I Boiler (wood fueled)
EXISTING Phase II Boiler (RDF fueled)
PROPOSED Boilers
Nos. 1 and 2
Max. Authorized Rate of Discharge 147 m3/s 220 m
3/s 220 m
3/s
Authorized Discharge Period Continuous Continuous Continuous
Total Particulate Matter (1) 15 mg/m3 15 mg/m
3 9.0 mg/m
3
Particulate matter less than 10 μm in diameter (PM10) (2)
No limit stipulated No limit stipulated 23.0 mg/m3
Particulate Matter less than 2.5 μm in diameter (PM2.5) (2)
No limit stipulated No limit stipulated 22.0 mg/m3
Opacity 5% 5% 5%
Flue gas temperature (3) No limit stipulated 190C 190C
Carbon Monoxide (CO) No limit stipulated 110.0 mg/m3 (4)
83.0 mg/m3
Hydrogen Chloride (HCl) No limit stipulated 70.0 mg/m3 27.5 mg/m
3 (1hr)
23.8 mg/m3 (24hr)
Hydrogen Flouride (HF) No limit stipulated 3.0 mg/m3 1.8 mg/m
3(1hr)
0.9 mg/m3 (24hr)
Sulphur Dioxide (SO2) No limit stipulated 200.0 mg/m3 (5)
50.0 mg/m3
Nitrogen Oxides (NOx) No limit stipulated No limit stipulated 150.0 mg/m3 (1hr)
123.0 mg/m3 (24hr)
Total Hydrocarbons as CH4 No limit stipulated 40.0 mg/m3 4.8 mg/m
3
Dioxins and Furans (I-TEQ) No limit stipulated 8.0E-08 mg/m3 8.14E-08 mg/m
3 (6
)
Total Mercury (Hg) No limit stipulated 0.02 mg/m3 0.02 mg/m
3
Class I metals (Total of Cd, Hg, Tl) No limit stipulated 0.2 mg/m3 Note 7
Class II metals (Total of As, Co, Ni, Se, Te) No limit stipulated 1.0 mg/m3 Note 7
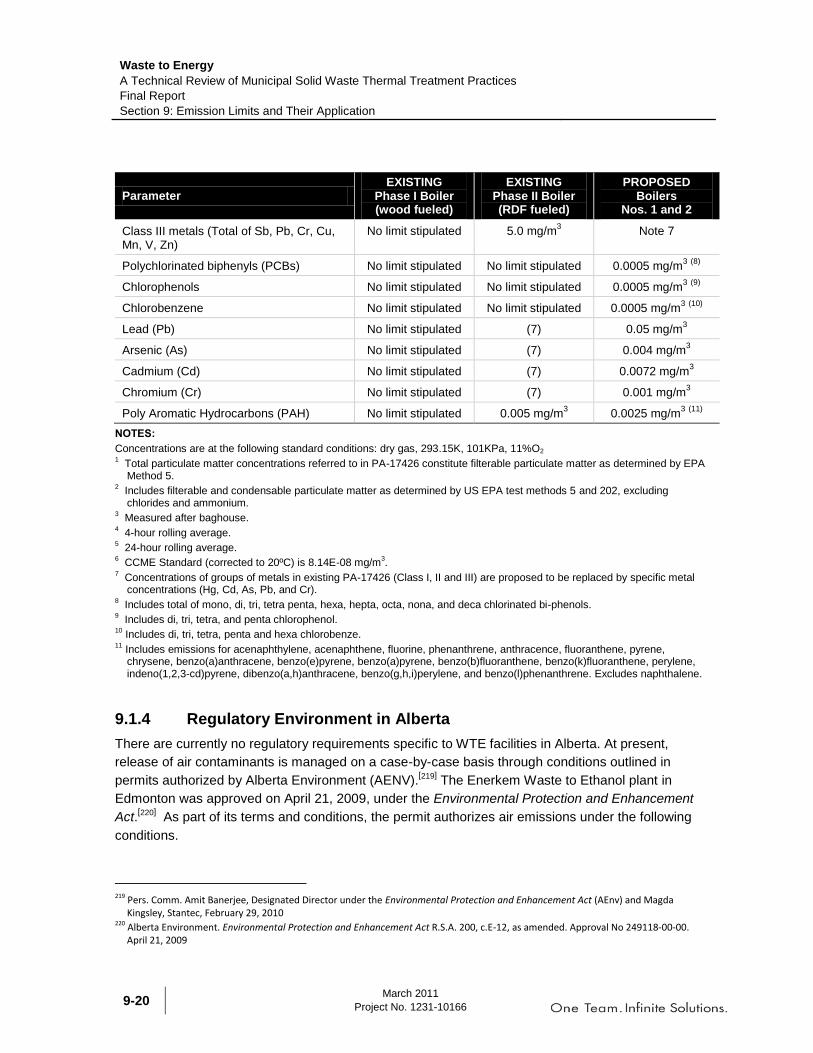
Waste to Energy
A Technical Review of Municipal Solid Waste Thermal Treatment Practices
Final Report
Section 9: Emission Limits and Their Application
March 2011
Project No. 1231-10166 9-20
Parameter EXISTING
Phase I Boiler (wood fueled)
EXISTING Phase II Boiler (RDF fueled)
PROPOSED Boilers
Nos. 1 and 2
Class III metals (Total of Sb, Pb, Cr, Cu, Mn, V, Zn)
No limit stipulated 5.0 mg/m3 Note 7
Polychlorinated biphenyls (PCBs) No limit stipulated No limit stipulated 0.0005 mg/m3 (8)
Chlorophenols No limit stipulated No limit stipulated 0.0005 mg/m3 (9)
Chlorobenzene No limit stipulated No limit stipulated 0.0005 mg/m3 (10)
Lead (Pb) No limit stipulated (7) 0.05 mg/m3
Arsenic (As) No limit stipulated (7) 0.004 mg/m3
Cadmium (Cd) No limit stipulated (7) 0.0072 mg/m3
Chromium (Cr) No limit stipulated (7) 0.001 mg/m3
Poly Aromatic Hydrocarbons (PAH) No limit stipulated 0.005 mg/m3 0.0025 mg/m
3 (11)
NOTES:
Concentrations are at the following standard conditions: dry gas, 293.15K, 101KPa, 11%O2 1 Total particulate matter concentrations referred to in PA-17426 constitute filterable particulate matter as determined by EPA
Method 5. 2 Includes filterable and condensable particulate matter as determined by US EPA test methods 5 and 202, excluding
chlorides and ammonium. 3 Measured after baghouse.
4 4-hour rolling average.
5 24-hour rolling average.
6 CCME Standard (corrected to 20ºC) is 8.14E-08 mg/m
3.
7 Concentrations of groups of metals in existing PA-17426 (Class I, II and III) are proposed to be replaced by specific metal
concentrations (Hg, Cd, As, Pb, and Cr). 8 Includes total of mono, di, tri, tetra penta, hexa, hepta, octa, nona, and deca chlorinated bi-phenols.
9 Includes di, tri, tetra, and penta chlorophenol.
10 Includes di, tri, tetra, penta and hexa chlorobenze.
11 Includes emissions for acenaphthylene, acenaphthene, fluorine, phenanthrene, anthracence, fluoranthene, pyrene, chrysene, benzo(a)anthracene, benzo(e)pyrene, benzo(a)pyrene, benzo(b)fluoranthene, benzo(k)fluoranthene, perylene, indeno(1,2,3-cd)pyrene, dibenzo(a,h)anthracene, benzo(g,h,i)perylene, and benzo(l)phenanthrene. Excludes naphthalene.
9.1.4 Regulatory Environment in Alberta
There are currently no regulatory requirements specific to WTE facilities in Alberta. At present,
release of air contaminants is managed on a case-by-case basis through conditions outlined in
permits authorized by Alberta Environment (AENV).[219]
The Enerkem Waste to Ethanol plant in
Edmonton was approved on April 21, 2009, under the Environmental Protection and Enhancement
Act.[220]
As part of its terms and conditions, the permit authorizes air emissions under the following
conditions.
219 Pers. Comm. Amit Banerjee, Designated Director under the Environmental Protection and Enhancement Act (AEnv) and Magda
Kingsley, Stantec, February 29, 2010 220 Alberta Environment. Environmental Protection and Enhancement Act R.S.A. 200, c.E-12, as amended. Approval No 249118-00-00.
April 21, 2009

Waste to Energy
A Technical Review of Municipal Solid Waste Thermal Treatment Practices
Final Report
Section 9: Emission Limits and Their Application
March 2011
Project No. 1231-10166
9-21
Air monitoring must comply with applicable AENV requirements outlined under:
The Alberta Stack Sampling Code, Alberta Environment, 1995, as amended
The Methods Manual for Chemical Analysis of Atmospheric Pollutants, Alberta
Environment,1 993, as amended
The Air Monitoring Directive, Alberta Environment, 1989, as amended.
Air emissions requirements must comply with the CCME National Emission Guideline for
Commercial/Industrial Boilers and Heaters[221]
during the construction phase
Air emissions during the operation phase shall not exceed the limits listed in Table 8-9. It is
noteworthy that the emission limits in the permit are in units of kg/hr but with no linkage to
emission volume, so a concentration limit is not established directly or indirectly.
Ongoing monitoring and reporting is required as outlined in the Approval.
Table 9-9: Air Emissions Limits for the Enerkem Facility
Emission Source Substance Emissions Limit
Waste Heat Recovery Unit Stack NOx (expressed in NO2) 10 kg/hr
SO2 1.3 kg/hr
Boiler Stack NOx (expressed in NO2) 0.9 kg/hr
All baghouse and dust collection systems PM 0.20 g/kg
In practice, the kg/hr limits are the flow rate of the operation multiplied by the concentration of the
contaminants. It is not possible to convert kg/hr emission limits into concentration numbers for
comparison elsewhere in this report since the flow rate is not specified in the information Stantec
was able to obtain.
9.1.5 Regulatory Environment in Ontario
Currently, the Ontario Ministry of the Environment applies two separate regulatory requirements to
address air emissions from thermal treatment facilities: Ontario MOE Guideline A-7 Air Pollution
Control, Design and Operation Guidelines for Municipal Waste Thermal Treatment Facilities and
Ontario Regulation 419/05 with Point of Impingement (POI) guidelines and Ambient Air Quality
Criteria (AAQC).
Ontario Guideline A-7 specifies a maximum allowable concentration of the critical contaminants in the
exhaust flue gases from municipal waste thermal treatment facilities and is based on the “Maximum
Achievable Control Technology (MACT)” principle, which is similar to the approach taken by a number
221 Canadian Council of Ministers of the Environment. National Emission Guideline for Commercial/Industrial Boilers and Heaters.
Initiative N306. N 1286. March, 1998
Waste to Energy
A Technical Review of Municipal Solid Waste Thermal Treatment Practices
Final Report
Section 9: Emission Limits and Their Application
March 2011
Project No. 1231-10166 9-22
of other jurisdictions. The MACT standards are based on emission levels already achieved by best-
performing similar facilities.[222]
Ontario Regulation 419/05 POI limits and AAQC are used to assess the potential for causing an
adverse effect and general air quality at the WTE facility property line and beyond. These air
standards were developed as a result of the well defined scientific evaluation of the likelihood of
adverse health effects due to exposure of a human or ecosystem to a physical or a chemical agent.
The POI standards are used by the MOE regularly to determine regulatory compliance of a facility
and its emission sources for Certificate of Approval (Air) purposes.[223]
The following subsections describe both Guideline A-7 and Regulation 419/05 in more depth.
9.1.5.1 Ontario Guideline A-7
Ontario MOE Guideline A-7 sets out minimum recommendations for pollution control systems and
maximum allowable “in-stack” contaminant emission levels from municipal waste thermal treatment
facilities in Ontario. In addition, the Guideline also sets out recommendations for acceptable design
and operating parameters. The Guideline applies to all thermal treatment facilities processing
municipal waste including manufacturing facilities, if they use MSW as an alternative fuel.
Guideline A-7 is applied through conditions on Certificates of Approval in accordance with the
requirements of the Environmental Protection Act, Part V, Section 27, and Part II, Section 9. The
EPA requires that a proponent of a municipal waste incinerator apply to the Ministry of Environment
for approval to install and operate an incinerator. If the application is approved, the Ministry will issue
a certificate of approval for the incinerator which will incorporate emission limits, and monitoring and
operating requirements, based on the limits and criteria set out in Guideline A-7. The certificate may
also incorporate other requirements specific to the location and the nature of the application for approval.
Emissions criteria specified in Guideline A-7 are relatively stringent. The emission limits for mercury
and dioxin/furans are identical to the limits set by the Canadian Council of Ministers of the
Environment (CCME) – Canada-Wide Standards for Mercury Emissions and Canada-wide Standard
for Dioxins and Furans Emissions for MSW incinerators. The emissions limits are generally
comparable (some lower and some higher, but within the same order of magnitude) with the current
regulations governing such facilities in both the United States and Europe. Emission limits specified
in Guideline A-7 are reviewed and updated by the Ministry to reflect technology improvements and
new health and environmental information.
Guideline A-7 was most recently updated in October 2010 (after last being updated in 2004). The
updates made to the Guideline include a reduction in the emission limits for particulate matter,
cadmium, lead, nitrogen oxides, organic matter and also new emission limits for carbon monoxide
and opacity from 2004 levels. The reduced emission limits were introduced to reflect requirements in
222 Ontario Ministry of the Environment. Guideline A-7: AIr Pollution Control, Design and Operation Guidelines for Municipal Waste
Thermal Treatment Facilities. October 2010. 223 Ontario Ministry of the Environment. SUMMARY of O. REG. 419/05 Standards and Point of Impingement Guidelines and Ambient Air
Quality Criteria (AAQCs). Standards Development Branch. Ontario Ministry of the Environment. December 2005

Waste to Energy
A Technical Review of Municipal Solid Waste Thermal Treatment Practices
Final Report
Section 9: Emission Limits and Their Application
March 2011
Project No. 1231-10166
9-23
other jurisdictions as well as the capacity of current technologies. When draft revisions to the 2004
version of Guideline A-7 were first released in 2009, the Ministry proposed to also reduce the
emission limit for dioxins and furans from 80 pg/Rm3 to 32 pg/Rm
3. However, after considerable
consultation the Ministry decided to keep the 2004 ELV for the following reasons:
It is already the most stringent in the world;
It is the same as the Canada Wide Standard Value;
The CCME reviewed this limit in 2007 and found no reason to revise it; and finally,
Releases to the environment at the level below 80 pg/Rm3 cannot be accurately measured.
In addition to new emission limits, the new 2010 Guideline also includes special considerations for
experimental units, small units in remote locations in northern Ontario, and provides additional
guidance on continuous or long-term monitoring requirements as well as handling of data obtained
from these systems.

Waste to Energy
A Technical Review of Municipal Solid Waste Thermal Treatment Practices
Final Report
Section 9: Emission Limits and Their Application
March 2011
Project No. 1231-10166 9-24
Table 9-10: Emissions Requirements, Ontario Guideline A-7 (2004 and 2010)
Contaminant Concentration
Units
Ontario MOE A-7 OLD
(February 2004)
Ontario MOE A-7 CURRENT
(October 2010) Comments
Particulate Matter (PM)
mg/Rm3
@ 11% O2 17 14
Calculated as the arithmetic average of three stack tests conducted in accordance with standard methods, or as the arithmetic average of 24 hours of data from a continuous emissions monitoring system (2004).
Results from compliance source testing or calculated as the rolling arithmetic average of four (4) hours of data before dilution with any other gaseous stream, measured by a continuous emission monitoring system that provides data at least once every fifteen minutes (2010).
Sulphur Dioxide (SO2) mg/Rm
3
@ 11% O2 56 56
Calculated as the arithmetic average of three stack tests conducted in accordance with standard methods, or as the arithmetic average of 24 hours of data from a continuous emissions monitoring system. (2004).
Results from compliance source testing or calculated as the rolling arithmetic average of 24 hours of data measured by a continuous emission monitoring system that provides data at least once every 15 minutes (2010).
Hydrogen Chloride (HCl)
mg/Rm3
@ 11% O2 27 27
Calculated as the arithmetic average of three stack tests conducted in accordance with standard methods, or as the arithmetic average of 24 hours of data from a continuous emissions monitoring system (2004).
Results from compliance source testing or calculated as the rolling arithmetic average of 24 hours of data measured by a continuous emission monitoring system that provides data at least once every 15 minutes (2010).
Nitrogen Oxides (NOx) (as NO2)
mg/Rm3
@ 11% O2 207 198
Calculated as the arithmetic average of three stack tests conducted in accordance with standard methods, or as the arithmetic average of 24 hours of data from a continuous emissions monitoring system (2004).
Results from compliance source testing or calculated as the rolling arithmetic average of 24 hours of data measured by a continuous emission monitoring system that provides data at least once every 15 minutes (2010).
Carbon Monoxide (CO)
mg/Rm3
@ 11% O2 N.Def. 40
Calculated as the rolling arithmetic average of four (4) hours of data at the outlet of the piece of equipment where combustion of the gas stream resulting from thermal treatment of waste is completed but before dilution with any other gaseous stream, measured by a continuous emission monitoring system that provides data at least once every fifteen minutes (2010).
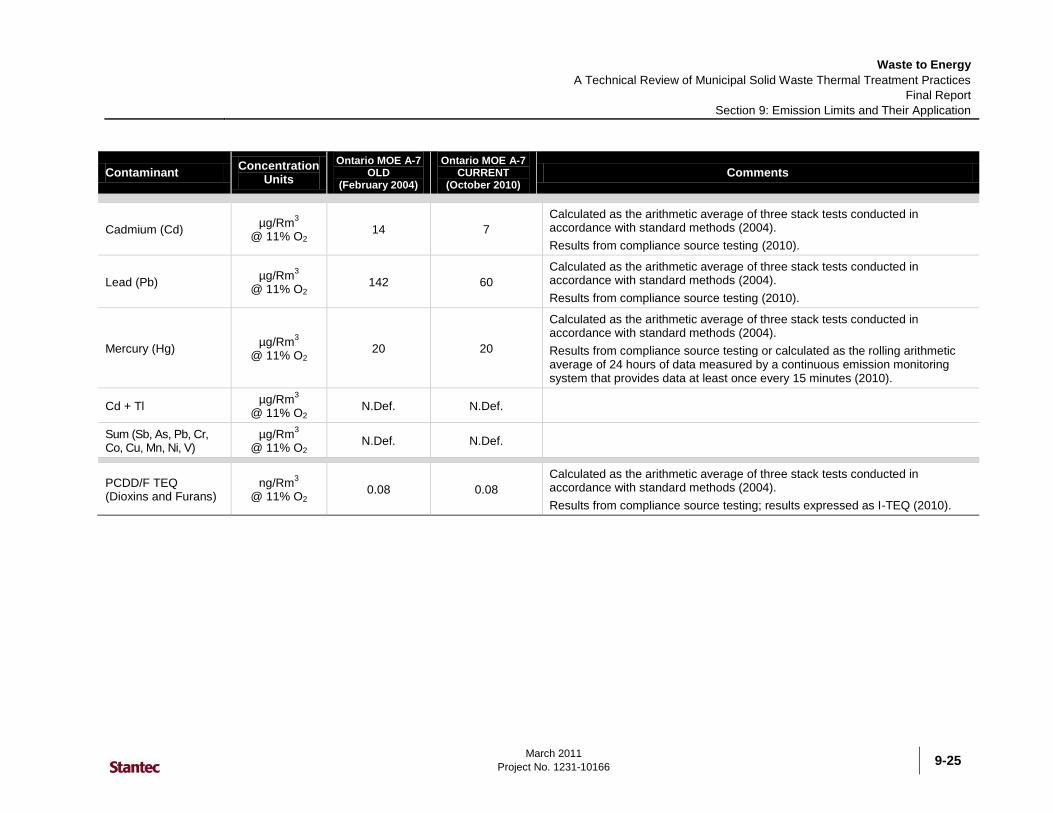
Waste to Energy
A Technical Review of Municipal Solid Waste Thermal Treatment Practices
Final Report
Section 9: Emission Limits and Their Application
March 2011
Project No. 1231-10166
9-25
Contaminant Concentration
Units
Ontario MOE A-7 OLD
(February 2004)
Ontario MOE A-7 CURRENT
(October 2010) Comments
Cadmium (Cd) µg/Rm
3
@ 11% O2 14 7
Calculated as the arithmetic average of three stack tests conducted in accordance with standard methods (2004).
Results from compliance source testing (2010).
Lead (Pb) µg/Rm
3
@ 11% O2 142 60
Calculated as the arithmetic average of three stack tests conducted in accordance with standard methods (2004).
Results from compliance source testing (2010).
Mercury (Hg) µg/Rm
3
@ 11% O2 20 20
Calculated as the arithmetic average of three stack tests conducted in accordance with standard methods (2004).
Results from compliance source testing or calculated as the rolling arithmetic average of 24 hours of data measured by a continuous emission monitoring system that provides data at least once every 15 minutes (2010).
Cd + Tl µg/Rm
3
@ 11% O2 N.Def. N.Def.
Sum (Sb, As, Pb, Cr, Co, Cu, Mn, Ni, V)
µg/Rm3
@ 11% O2 N.Def. N.Def.
PCDD/F TEQ (Dioxins and Furans)
ng/Rm3
@ 11% O2 0.08 0.08
Calculated as the arithmetic average of three stack tests conducted in accordance with standard methods (2004).
Results from compliance source testing; results expressed as I-TEQ (2010).
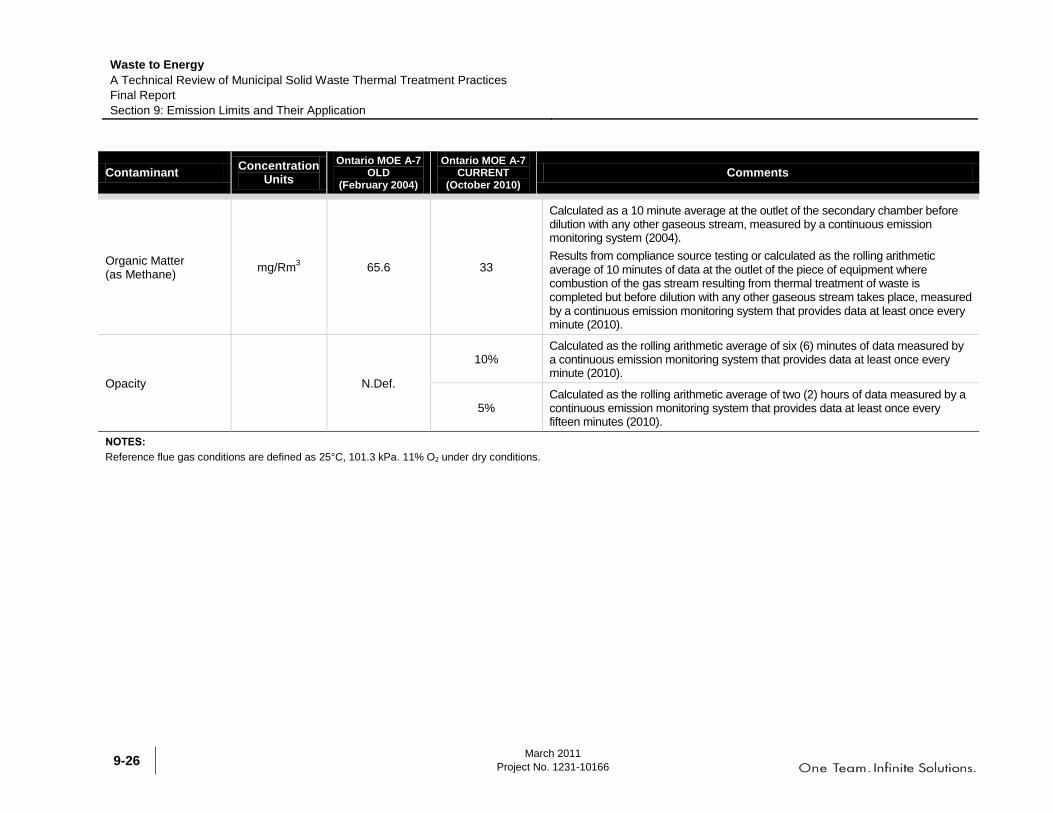
Waste to Energy
A Technical Review of Municipal Solid Waste Thermal Treatment Practices
Final Report
Section 9: Emission Limits and Their Application
March 2011
Project No. 1231-10166 9-26
Contaminant Concentration
Units
Ontario MOE A-7 OLD
(February 2004)
Ontario MOE A-7 CURRENT
(October 2010) Comments
Organic Matter (as Methane)
mg/Rm3 65.6 33
Calculated as a 10 minute average at the outlet of the secondary chamber before dilution with any other gaseous stream, measured by a continuous emission monitoring system (2004).
Results from compliance source testing or calculated as the rolling arithmetic average of 10 minutes of data at the outlet of the piece of equipment where combustion of the gas stream resulting from thermal treatment of waste is completed but before dilution with any other gaseous stream takes place, measured by a continuous emission monitoring system that provides data at least once every minute (2010).
Opacity N.Def.
10% Calculated as the rolling arithmetic average of six (6) minutes of data measured by a continuous emission monitoring system that provides data at least once every minute (2010).
5% Calculated as the rolling arithmetic average of two (2) hours of data measured by a continuous emission monitoring system that provides data at least once every fifteen minutes (2010).
NOTES:
Reference flue gas conditions are defined as 25°C, 101.3 kPa. 11% O2 under dry conditions.

Waste to Energy
A Technical Review of Municipal Solid Waste Thermal Treatment Practices
Final Report
Section 9: Emission Limits and Their Application
March 2011
Project No. 1231-10166
9-27
Guideline A-7 requires that within six months of an incineration facility starting up, stack emissions
test results be submitted to the MOE to ensure the facility is in compliance with the emissions limits.
Source testing must be performed under maximum operating feed and must be completed using the
methods and procedures documented in the Ontario Source Testing Code (Procedure A-1-1). After
the initial test, additional tests must be completed on an annual basis to ensure compliance. The
guidelines also states that a report documenting the results of the test be submitted to the MOE
within 90 days of the tests completion and also be made available to the public for review.
Guideline A-7 also outlines the proper design and operations of an incineration facility to ensure that
good combustion conditions are met. Specifically the Guideline outlines nine different operational
parameters that should be met by an incinerator. Table 8-11 outlines the parameters and what
Guideline A-7 requires.
Table 9-11: Guideline A-7: Design and Operation Considerations for Municipal Waste Incinerators
Consideration Description
Combustion Temperature
The Ministry acknowledges that temperatures in the combustion chamber or
zone of municipal waste incinerators and other combustion equipment will vary
with the design.
A minimum temperature of 1,000°C is considered adequate to ensure high-
efficiency combustion and destruction of products from thermal treatment of
municipal waste. The equipment that is used, at least in part, to destroy
organic compounds, including products of incomplete combustion, and to meet
the organic matter and the carbon monoxide limits, shall be capable of
sustaining, on a continuous basis, a temperature that is 100°C degrees greater
than the minimum required operating temperature. This capability to operate at
a temperature of up to 1,100°C is expected to provide an adequate safety
margin as the actual operating temperature should always be more than
1,000°C unless an alternative temperature is approved.
An auxiliary burner is expected to be incorporated into the design to ensure
that the minimum operating temperature is maintained:
At start-up before the commencement of the thermal treatment cycle, i.e.,
Before any waste is fed into the equipment
During shutdown until all thermal treatment of waste has ceased
At all times when waste is being thermally treated.
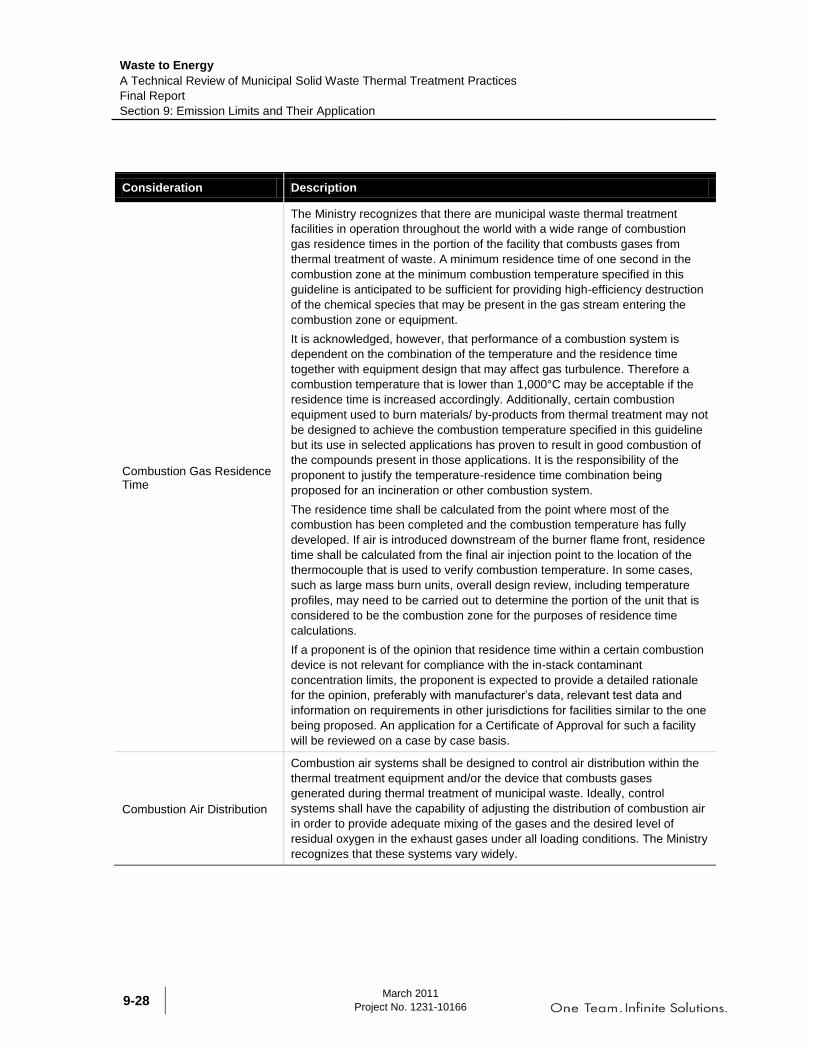
Waste to Energy
A Technical Review of Municipal Solid Waste Thermal Treatment Practices
Final Report
Section 9: Emission Limits and Their Application
March 2011
Project No. 1231-10166 9-28
Consideration Description
Combustion Gas Residence Time
The Ministry recognizes that there are municipal waste thermal treatment
facilities in operation throughout the world with a wide range of combustion
gas residence times in the portion of the facility that combusts gases from
thermal treatment of waste. A minimum residence time of one second in the
combustion zone at the minimum combustion temperature specified in this
guideline is anticipated to be sufficient for providing high-efficiency destruction
of the chemical species that may be present in the gas stream entering the
combustion zone or equipment.
It is acknowledged, however, that performance of a combustion system is
dependent on the combination of the temperature and the residence time
together with equipment design that may affect gas turbulence. Therefore a
combustion temperature that is lower than 1,000°C may be acceptable if the
residence time is increased accordingly. Additionally, certain combustion
equipment used to burn materials/ by-products from thermal treatment may not
be designed to achieve the combustion temperature specified in this guideline
but its use in selected applications has proven to result in good combustion of
the compounds present in those applications. It is the responsibility of the
proponent to justify the temperature-residence time combination being
proposed for an incineration or other combustion system.
The residence time shall be calculated from the point where most of the
combustion has been completed and the combustion temperature has fully
developed. If air is introduced downstream of the burner flame front, residence
time shall be calculated from the final air injection point to the location of the
thermocouple that is used to verify combustion temperature. In some cases,
such as large mass burn units, overall design review, including temperature
profiles, may need to be carried out to determine the portion of the unit that is
considered to be the combustion zone for the purposes of residence time
calculations.
If a proponent is of the opinion that residence time within a certain combustion
device is not relevant for compliance with the in-stack contaminant
concentration limits, the proponent is expected to provide a detailed rationale
for the opinion, preferably with manufacturer‟s data, relevant test data and
information on requirements in other jurisdictions for facilities similar to the one
being proposed. An application for a Certificate of Approval for such a facility
will be reviewed on a case by case basis.
Combustion Air Distribution
Combustion air systems shall be designed to control air distribution within the
thermal treatment equipment and/or the device that combusts gases
generated during thermal treatment of municipal waste. Ideally, control
systems shall have the capability of adjusting the distribution of combustion air
in order to provide adequate mixing of the gases and the desired level of
residual oxygen in the exhaust gases under all loading conditions. The Ministry
recognizes that these systems vary widely.

Waste to Energy
A Technical Review of Municipal Solid Waste Thermal Treatment Practices
Final Report
Section 9: Emission Limits and Their Application
March 2011
Project No. 1231-10166
9-29
Consideration Description
Oxygen Availability
Lack of sufficient oxygen during combustion of any combustible material,
including gases generated during thermal treatment of municipal waste, is a
contributing factor to the discharge of products of incomplete combustion.
Components of thermal treatment facilities shall be designed and operated to
ensure that there is sufficient residual oxygen in the flue gases from the
component used for combustion of gases from thermal treatment of waste.
Availability of oxygen and ability to control the amount of oxygen are intended
to minimize the discharge of products of incomplete combustion at all times
when waste is being thermally treated. A sufficient level of residual oxygen in
the exhaust gases is critical with respect to meeting the organic matter and
carbon monoxide limits set out.
Thermal treatment facilities are typically expected to be designed and
operated to provide an oxygen rich atmosphere in the combustion zone or
dedicated piece of combustion equipment with residual oxygen level of at least
6% by volume on dry basis in the undiluted gases leaving the combustion
zone. The Ministry acknowledges that the recommendation of 6% residual
oxygen may be too conservative for some designs, such as those where the
gases from the solid waste are a product of a carefully controlled gasification
process, followed by elaborate cleaning and refining of the gases to the point
of the gases becoming a gaseous fuel with consistent quality rather than being
a complex mixture of products of incomplete combustion. In order to establish
an appropriate oxygen level, there will be a need to balance between energy
recovery, emissions of oxides of nitrogen and the system‟s ability to deal with
variations in waste feed quality. The composition of waste can vary
significantly depending on factors such as the extent and type of industrial
activity, seasonal activities and level of recycling, and so will the gases from
the thermal treatment of that waste. It is also noted that a proposal may
involve use of “engineered fuel”, solid or gaseous, made from municipal waste
that meets certain specifications and is therefore expected to be of more
consistent quality. In this case, the combustion process may not be subject to
great challenges and an oxygen level below 6% may be acceptable.
Gas-Phase Turbulence and Mixing
The design and operation of a thermal treatment facility shall provide a high
degree of gas-phase turbulence and mixing in the combustion zone. This can
usually be achieved through appropriately located/directed air jets, changes
of flue gas flow direction, baffling, and constriction of cross-sectional flue gas
flow area.
Range of Operation
Municipal waste thermal treatment facilities shall be designed and operated to
achieve the required temperature, residence time, oxygen availability and
turbulence over the expected range of operation, taking into account feed rate
variations, as well as ultimate analysis, heating value, ash and moisture
content of the waste together with combustion air requirements and heat losses.
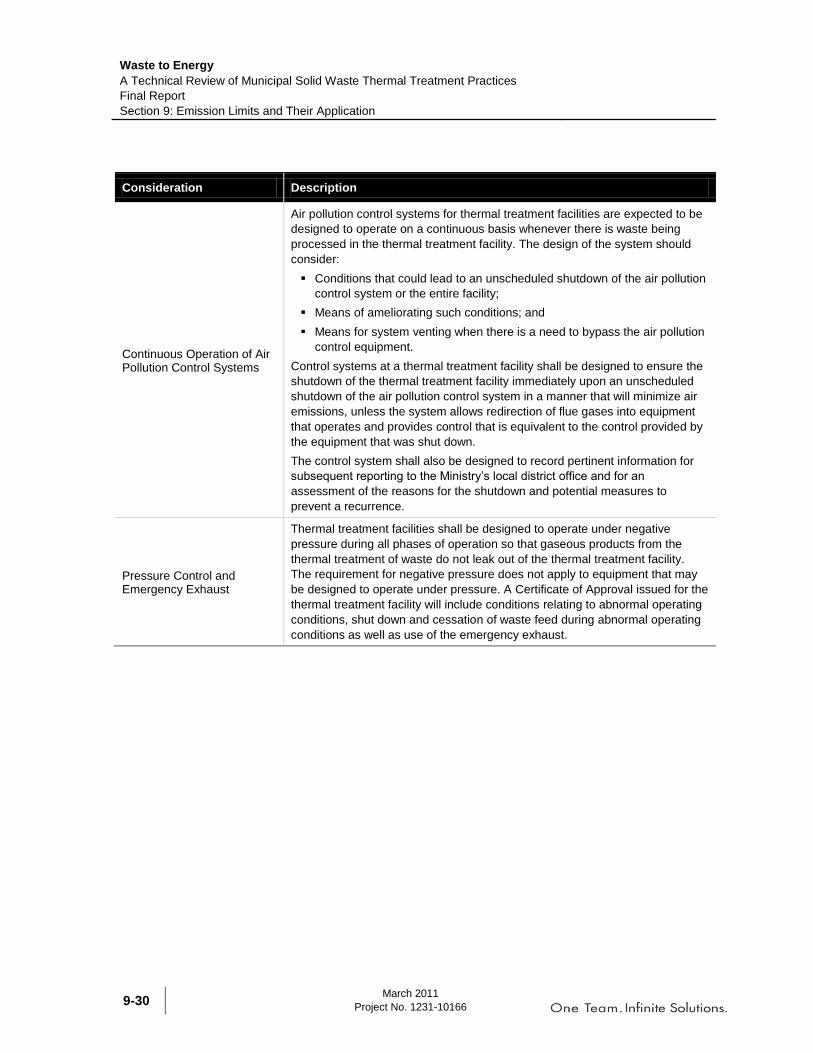
Waste to Energy
A Technical Review of Municipal Solid Waste Thermal Treatment Practices
Final Report
Section 9: Emission Limits and Their Application
March 2011
Project No. 1231-10166 9-30
Consideration Description
Continuous Operation of Air Pollution Control Systems
Air pollution control systems for thermal treatment facilities are expected to be
designed to operate on a continuous basis whenever there is waste being
processed in the thermal treatment facility. The design of the system should
consider:
Conditions that could lead to an unscheduled shutdown of the air pollution
control system or the entire facility;
Means of ameliorating such conditions; and
Means for system venting when there is a need to bypass the air pollution
control equipment.
Control systems at a thermal treatment facility shall be designed to ensure the
shutdown of the thermal treatment facility immediately upon an unscheduled
shutdown of the air pollution control system in a manner that will minimize air
emissions, unless the system allows redirection of flue gases into equipment
that operates and provides control that is equivalent to the control provided by
the equipment that was shut down.
The control system shall also be designed to record pertinent information for
subsequent reporting to the Ministry‟s local district office and for an
assessment of the reasons for the shutdown and potential measures to
prevent a recurrence.
Pressure Control and Emergency Exhaust
Thermal treatment facilities shall be designed to operate under negative
pressure during all phases of operation so that gaseous products from the
thermal treatment of waste do not leak out of the thermal treatment facility.
The requirement for negative pressure does not apply to equipment that may
be designed to operate under pressure. A Certificate of Approval issued for the
thermal treatment facility will include conditions relating to abnormal operating
conditions, shut down and cessation of waste feed during abnormal operating
conditions as well as use of the emergency exhaust.

Waste to Energy
A Technical Review of Municipal Solid Waste Thermal Treatment Practices
Final Report
Section 9: Emission Limits and Their Application
March 2011
Project No. 1231-10166
9-31
Consideration Description
Ash Management and Organic Content of Ash
Municipal waste thermal treatment facilities typically generate residues that are
collected from various parts within the facility. One such residue, often referred
to as bottom ash, is typically removed from the chamber, vessel or other
equipment into which the municipal waste is introduced. Some designs offer a
capability to vitrify (solidify into a glass-like substance) this residue. Residue
can also be collected from equipment used for energy recovery from gases
from thermal treatment and from air pollution control equipment (fly ash).
Owners and operators of thermal treatment facilities are encouraged to
consider beneficial use of any residues where possible.
Under Regulation 347, fly ash from an incinerator's energy recovery and
pollution control system must be handled separately from the bottom ash
generated in the zone where municipal waste is incinerated. Similarly, for other
types of thermal treatment facilities, the fly ash should be kept separate from
the bottom ash or any other residue.
Thermal treatment facility operators are expected to test the ash and other
residues in accordance with the conditions included in a Certificate of Approval
issued under Part V of the EPA (waste approval) before the ashes and/ or
residues are transferred from the site of the thermal treatment facility.
Testing of bottom ash involves determination of organic content in all cases to
confirm that it meets the definition of incinerator ash set out in Regulation 347.
The organic content in ash should be determined using Loss on Ignition testing
on dry ash samples with ferrous metals absent or as otherwise required by
conditions included in a Certificate of Approval. Owners and operators of
municipal waste thermal treatment facilities are expected to develop a detailed
protocol for sampling and analysis of residues that are to be tested. The
protocol is expected to be periodically reviewed and amended as experience
with the facility is gained and test results are available. The operation of a
thermal treatment facility is expected to be controlled such that the organic
content of the bottom ash is minimized to the greatest degree possible.
In accordance with Regulation 347 incinerator ash (bottom ash), as defined,
resulting from the incineration of waste that is neither hazardous waste nor
liquid industrial waste is not a hazardous waste and may be disposed of at a
site that is approved to receive solid non-hazardous waste. Owners and
operators of thermal treatment facilities processing municipal waste are not
required to carry out Toxicity Characteristic
Leachate Procedure (TCLP) on the bottom ash that meets the definition of
incinerator ash (i.e., has an organic content of less than 10%). Testing using
TCLP, however, is required if the organic content exceeds 10% unless the
bottom ash is to be disposed of at a waste disposal site approved to accept
hazardous waste. In the absence of testing, the owners and operators must
assume that the bottom ash is hazardous waste and handle it accordingly.
Fly ash from thermal treatment of municipal waste, on the other hand, is
assumed to be hazardous waste unless otherwise proven. Therefore, if an
operator of a thermal treatment facility wishes to classify the fly ash, or any
other residue aside from bottom ash, as non-hazardous, the ash or other
residue must be tested to determine if it is leachate toxic. The Ministry's testing
protocol, TCLP, is referenced in Regulation 347 while the sampling procedure
and results evaluation procedure is in the Ministry's publication "Protocol for
Sampling and Evaluating Fly Ash from Non-Hazardous Solid Waste
Incineration Facilities" October 1990 as may be amended.
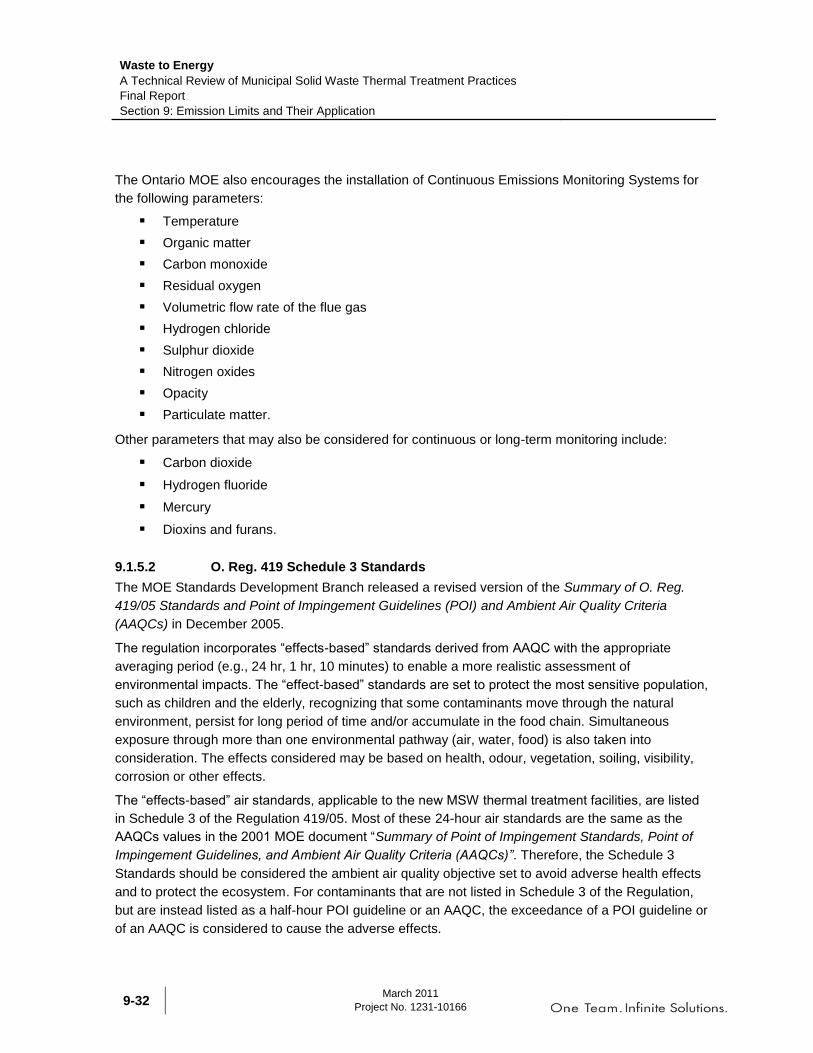
Waste to Energy
A Technical Review of Municipal Solid Waste Thermal Treatment Practices
Final Report
Section 9: Emission Limits and Their Application
March 2011
Project No. 1231-10166 9-32
The Ontario MOE also encourages the installation of Continuous Emissions Monitoring Systems for
the following parameters:
Temperature
Organic matter
Carbon monoxide
Residual oxygen
Volumetric flow rate of the flue gas
Hydrogen chloride
Sulphur dioxide
Nitrogen oxides
Opacity
Particulate matter.
Other parameters that may also be considered for continuous or long-term monitoring include:
Carbon dioxide
Hydrogen fluoride
Mercury
Dioxins and furans.
9.1.5.2 O. Reg. 419 Schedule 3 Standards
The MOE Standards Development Branch released a revised version of the Summary of O. Reg.
419/05 Standards and Point of Impingement Guidelines (POI) and Ambient Air Quality Criteria
(AAQCs) in December 2005.
The regulation incorporates “effects-based” standards derived from AAQC with the appropriate
averaging period (e.g., 24 hr, 1 hr, 10 minutes) to enable a more realistic assessment of
environmental impacts. The “effect-based” standards are set to protect the most sensitive population,
such as children and the elderly, recognizing that some contaminants move through the natural
environment, persist for long period of time and/or accumulate in the food chain. Simultaneous
exposure through more than one environmental pathway (air, water, food) is also taken into
consideration. The effects considered may be based on health, odour, vegetation, soiling, visibility,
corrosion or other effects.
The “effects-based” air standards, applicable to the new MSW thermal treatment facilities, are listed
in Schedule 3 of the Regulation 419/05. Most of these 24-hour air standards are the same as the
AAQCs values in the 2001 MOE document “Summary of Point of Impingement Standards, Point of
Impingement Guidelines, and Ambient Air Quality Criteria (AAQCs)”. Therefore, the Schedule 3
Standards should be considered the ambient air quality objective set to avoid adverse health effects
and to protect the ecosystem. For contaminants that are not listed in Schedule 3 of the Regulation,
but are instead listed as a half-hour POI guideline or an AAQC, the exceedance of a POI guideline or
of an AAQC is considered to cause the adverse effects.
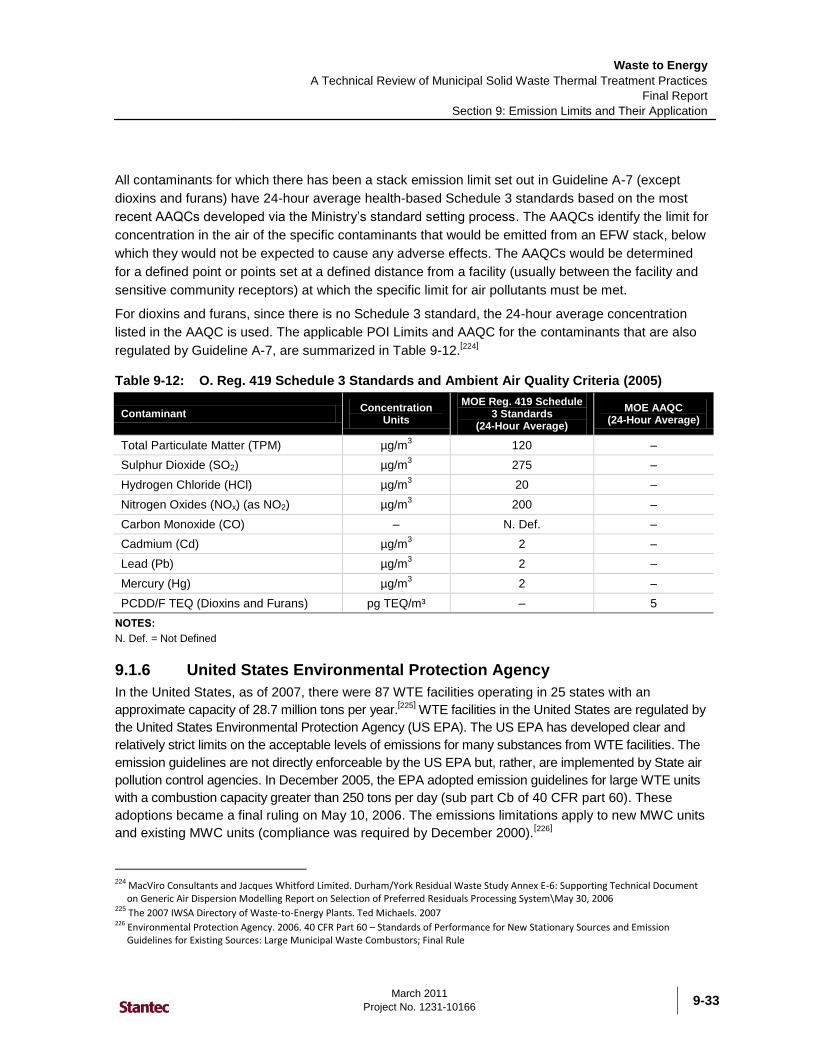
Waste to Energy
A Technical Review of Municipal Solid Waste Thermal Treatment Practices
Final Report
Section 9: Emission Limits and Their Application
March 2011
Project No. 1231-10166
9-33
All contaminants for which there has been a stack emission limit set out in Guideline A-7 (except
dioxins and furans) have 24-hour average health-based Schedule 3 standards based on the most
recent AAQCs developed via the Ministry‟s standard setting process. The AAQCs identify the limit for
concentration in the air of the specific contaminants that would be emitted from an EFW stack, below
which they would not be expected to cause any adverse effects. The AAQCs would be determined
for a defined point or points set at a defined distance from a facility (usually between the facility and
sensitive community receptors) at which the specific limit for air pollutants must be met.
For dioxins and furans, since there is no Schedule 3 standard, the 24-hour average concentration
listed in the AAQC is used. The applicable POI Limits and AAQC for the contaminants that are also
regulated by Guideline A-7, are summarized in Table 9-12.[224]
Table 9-12: O. Reg. 419 Schedule 3 Standards and Ambient Air Quality Criteria (2005)
Contaminant Concentration
Units
MOE Reg. 419 Schedule 3 Standards
(24-Hour Average)
MOE AAQC (24-Hour Average)
Total Particulate Matter (TPM) µg/m3 120 –
Sulphur Dioxide (SO2) µg/m3 275 –
Hydrogen Chloride (HCl) µg/m3 20 –
Nitrogen Oxides (NOx) (as NO2) µg/m3 200 –
Carbon Monoxide (CO) – N. Def. –
Cadmium (Cd) µg/m3 2 –
Lead (Pb) µg/m3 2 –
Mercury (Hg) µg/m3 2 –
PCDD/F TEQ (Dioxins and Furans) pg TEQ/m³ – 5
NOTES:
N. Def. = Not Defined
9.1.6 United States Environmental Protection Agency
In the United States, as of 2007, there were 87 WTE facilities operating in 25 states with an
approximate capacity of 28.7 million tons per year.[225]
WTE facilities in the United States are regulated by
the United States Environmental Protection Agency (US EPA). The US EPA has developed clear and
relatively strict limits on the acceptable levels of emissions for many substances from WTE facilities. The
emission guidelines are not directly enforceable by the US EPA but, rather, are implemented by State air
pollution control agencies. In December 2005, the EPA adopted emission guidelines for large WTE units
with a combustion capacity greater than 250 tons per day (sub part Cb of 40 CFR part 60). These
adoptions became a final ruling on May 10, 2006. The emissions limitations apply to new MWC units
and existing MWC units (compliance was required by December 2000).[226]
224 MacViro Consultants and Jacques Whitford Limited. Durham/York Residual Waste Study Annex E-6: Supporting Technical Document
on Generic Air Dispersion Modelling Report on Selection of Preferred Residuals Processing System\May 30, 2006 225 The 2007 IWSA Directory of Waste-to-Energy Plants. Ted Michaels. 2007 226 Environmental Protection Agency. 2006. 40 CFR Part 60 – Standards of Performance for New Stationary Sources and Emission
Guidelines for Existing Sources: Large Municipal Waste Combustors; Final Rule
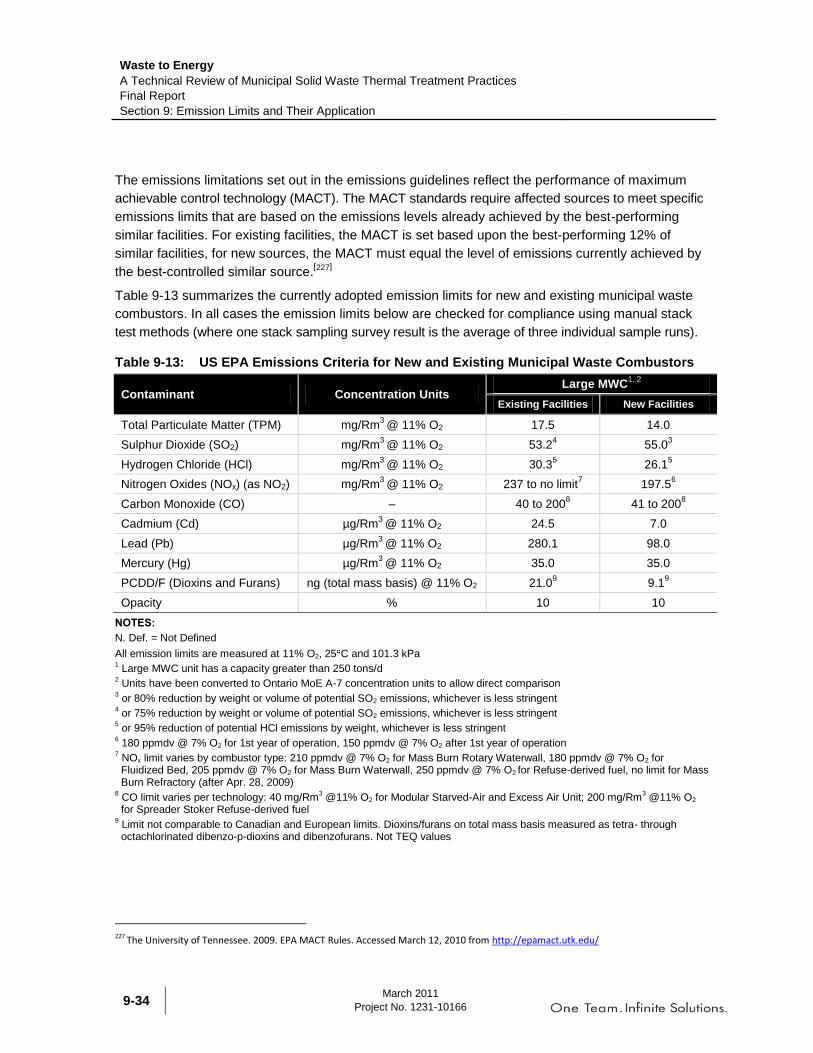
Waste to Energy
A Technical Review of Municipal Solid Waste Thermal Treatment Practices
Final Report
Section 9: Emission Limits and Their Application
March 2011
Project No. 1231-10166 9-34
The emissions limitations set out in the emissions guidelines reflect the performance of maximum
achievable control technology (MACT). The MACT standards require affected sources to meet specific
emissions limits that are based on the emissions levels already achieved by the best-performing
similar facilities. For existing facilities, the MACT is set based upon the best-performing 12% of
similar facilities, for new sources, the MACT must equal the level of emissions currently achieved by
the best-controlled similar source.[227]
Table 9-13 summarizes the currently adopted emission limits for new and existing municipal waste
combustors. In all cases the emission limits below are checked for compliance using manual stack
test methods (where one stack sampling survey result is the average of three individual sample runs).
Table 9-13: US EPA Emissions Criteria for New and Existing Municipal Waste Combustors
Contaminant Concentration Units Large MWC
1, 2
Existing Facilities New Facilities
Total Particulate Matter (TPM) mg/Rm3
@ 11% O2 17.5 14.0
Sulphur Dioxide (SO2) mg/Rm3
@ 11% O2 53.24 55.0
3
Hydrogen Chloride (HCl) mg/Rm3
@ 11% O2 30.35 26.1
5
Nitrogen Oxides (NOx) (as NO2) mg/Rm3
@ 11% O2 237 to no limit7 197.5
6
Carbon Monoxide (CO) – 40 to 2008 41 to 200
8
Cadmium (Cd) µg/Rm3
@ 11% O2 24.5 7.0
Lead (Pb) µg/Rm3
@ 11% O2 280.1 98.0
Mercury (Hg) µg/Rm3
@ 11% O2 35.0 35.0
PCDD/F (Dioxins and Furans) ng (total mass basis) @ 11% O2 21.09 9.1
9
Opacity % 10 10
NOTES:
N. Def. = Not Defined
All emission limits are measured at 11% O2, 25 C and 101.3 kPa 1 Large MWC unit has a capacity greater than 250 tons/d
2 Units have been converted to Ontario MoE A-7 concentration units to allow direct comparison
3 or 80% reduction by weight or volume of potential SO2 emissions, whichever is less stringent
4 or 75% reduction by weight or volume of potential SO2 emissions, whichever is less stringent
5 or 95% reduction of potential HCl emissions by weight, whichever is less stringent
6 180 ppmdv @ 7% O2 for 1st year of operation, 150 ppmdv @ 7% O2 after 1st year of operation
7 NOx limit varies by combustor type: 210 ppmdv @ 7% O2 for Mass Burn Rotary Waterwall, 180 ppmdv @ 7% O2 for Fluidized Bed, 205 ppmdv @ 7% O2 for Mass Burn Waterwall, 250 ppmdv @ 7% O2 for Refuse-derived fuel, no limit for Mass Burn Refractory (after Apr. 28, 2009)
8 CO limit varies per technology: 40 mg/Rm
3 @11% O2 for Modular Starved-Air and Excess Air Unit; 200 mg/Rm
3 @11% O2
for Spreader Stoker Refuse-derived fuel 9 Limit not comparable to Canadian and European limits. Dioxins/furans on total mass basis measured as tetra- through octachlorinated dibenzo-p-dioxins and dibenzofurans. Not TEQ values
227 The University of Tennessee. 2009. EPA MACT Rules. Accessed March 12, 2010 from http://epamact.utk.edu/

Waste to Energy
A Technical Review of Municipal Solid Waste Thermal Treatment Practices
Final Report
Section 9: Emission Limits and Their Application
March 2011
Project No. 1231-10166
9-35
It should be noted the EPA has released draft standards for emissions from commercial and
industrial solid waste incineration units in April 2010 [228]
. These standards are currently in the public
domain for comment; it is too early to determine if they will be adopted as presented. Key features of
the standards include the provision for continuous monitoring of total particulate, a reduction in the
allowable concentration of particulate in the discharge and variability in the allowable concentration
depending of the type of incineration facility. Detailed examination of the proposed standards was
not possible under our schedule of this WTE Emissions assignment for BC MOE.
9.1.7 Regulatory Environment in the State of Oregon
Oregon Department of Environmental Quality established emission standards, design requirements
and performance standards for all solid waste incinerators in order to minimize air contaminant
emissions and provide adequate protection of public health as filed through April 15, 2010.
Incinerator Regulations are summarized under the Oregon Administrative Rule (OAR) 340-230.[229]
Air emissions from municipal waste combustors with a combustion capacity greater than 250 tons/day
must meet the criteria outlined in Table 9-14 (OAR 340-230-300 through 340-230-0395). In addition,
no owner or operator of the municipal waste combustor may cause or allow visible emissions of
combustion ash from an ash conveying system in excess of 5% of the observed period.
Table 9-14: Oregon Administrative Rule 340-230-310 Incinerator Regulations – Emissions Limits (April 15, 2010)
Contaminant Units Before
April 28, 2009 On or After
April 28, 2009
Particulate Matter (PM) mg/Rm3 @ 11% O2 19 18
Sulphur Dioxide (SO2) mg/Rm3 @ 11% O2 53
1
Hydrogen Chloride (HCl) mg/Rm3 @ 11% O2 30
2
Nitrogen Oxides (NOx) (as NO2) mg/Rm3 @ 11% O2 270
Carbon Monoxide (CO) – N. Def.
Cadmium (Cd) µg/m3 @ 11% O2 28 14
Lead (Pb) µg/m3 @ 11% O2 308 140
228 Environmental Protection Agency 40 CFR Part 60 [EPA-HQ-OAR-2003-0119; FRL-RIN 2060-A012], Standards of Performance for New
Stationary Sources and Emission Guidelines for Existing Sources: Commercial and Industrial Solid Waste Incineration Units. 229 Oregon Administrative Rules. Department of Environmental Quality. OAR 340-230. Incinerator Regulations. Filed through April 15,
2010. http://arcweb.sos.state.or.us/rules/OARs_300/OAR_340/340_230.html

Waste to Energy
A Technical Review of Municipal Solid Waste Thermal Treatment Practices
Final Report
Section 9: Emission Limits and Their Application
March 2011
Project No. 1231-10166 9-36
Contaminant Units Before
April 28, 2009 On or After
April 28, 2009
Mercury (Hg) µg/m3 @ 11% O2 56
3 35
3
PCDD/F (Dioxins and Furans) ng/m³ @ 11% O2 424 25
5
Opacity % 106
NOTES:
N. Def. = Not Defined
All emission limits are converted to 11% O2, 25 C and 101.3 kPa 1 Or 25% of the potential SO2 emission concentration (75% reduction by weight or volume), whichever is less stringent.
2 Or 5% of the potential HCl emission concentration (95% reduction by weight or volume), whichever is less stringent.
3 Or 15% of the potential mercury emission concentration (85% reduction by weight), whichever is less stringent.
4 Total mass. Applies to municipal waste combustor units that employ electrostatic precipitator-based emission control system. If electrostatic precipitator-based emission controls are not employed, 30 ng per dry m
3 (total mass) @ 7% O2.
5 Total mass. Applies to municipal waste combustor units that employ electrostatic precipitator-based emission control system. If electrostatic precipitator-based emission controls are not employed, 15 ng per dry m
3 (total mass) @ 7% O2.
6 Opacity considered over a 6-minute average.
9.1.8 Regulatory Environment in the State of Washington
Within Washington State, standards for Energy Recovery and Incineration Facilities are defined
under Washington Administrative Code (WAC) 173-350-240 effective 2003.[230]
These standards
apply to incineration facilities designed to burn more than 12 tons/day of solid waste or RDF.
Although there are no specific design standards, the facilities must meet the general performance
requirements under WAC 173-350-040.[231]
The standards require facilities meet emission standards
or ambient air quality standards at the property boundary in compliance with chapter 70.94 RCW
(Revised Code of Washington), Washington Clean Air Act.[232]
Emission standards, design requirements, and performance standards for solid waste incinerator
facilities with a capacity of 12 tons/day or more are defined under WAC 173-434[233]
as promulgated
under chapter 70.94 RCW. Table 9-15 summarizes the emission standards applicable to solid waste
incinerator facilities. Design and operational requirements are summarized in Table 9-16.
Special emission standard provisions exist for combustor and incinerator units constructed prior to
1999 under WAC 173-400-050.[234]
These emissions standards are less stringent than the criteria
summarized in Table 9-15.
230 Washington Administrative Code. Energy Recovery and Incineration Facilities, WAC 173-350-240.
http://apps.leg.wa.gov/wac/default.aspx?cite=173-350-240 231Washington Administrative Code. Performance Standards, WAC 173-350-040
http://apps.leg.wa.gov/wac/default.aspx?cite=173-350-040 232 Revised Code of Washington. Washington Clean Air Act. Chapter 70.94 RCW. 233 Washington Administrative Code. Solid Waste Incinerator Facilities. WAC 173-434. http://apps.leg.wa.gov/wac/default.aspx?cite=173-434 234 Washington Administrative Code. Emission Standards for Combustion and Incineration Units, WAC 173-400-050
http://apps.leg.wa.gov/WAC/default.aspx?cite=173-400-050
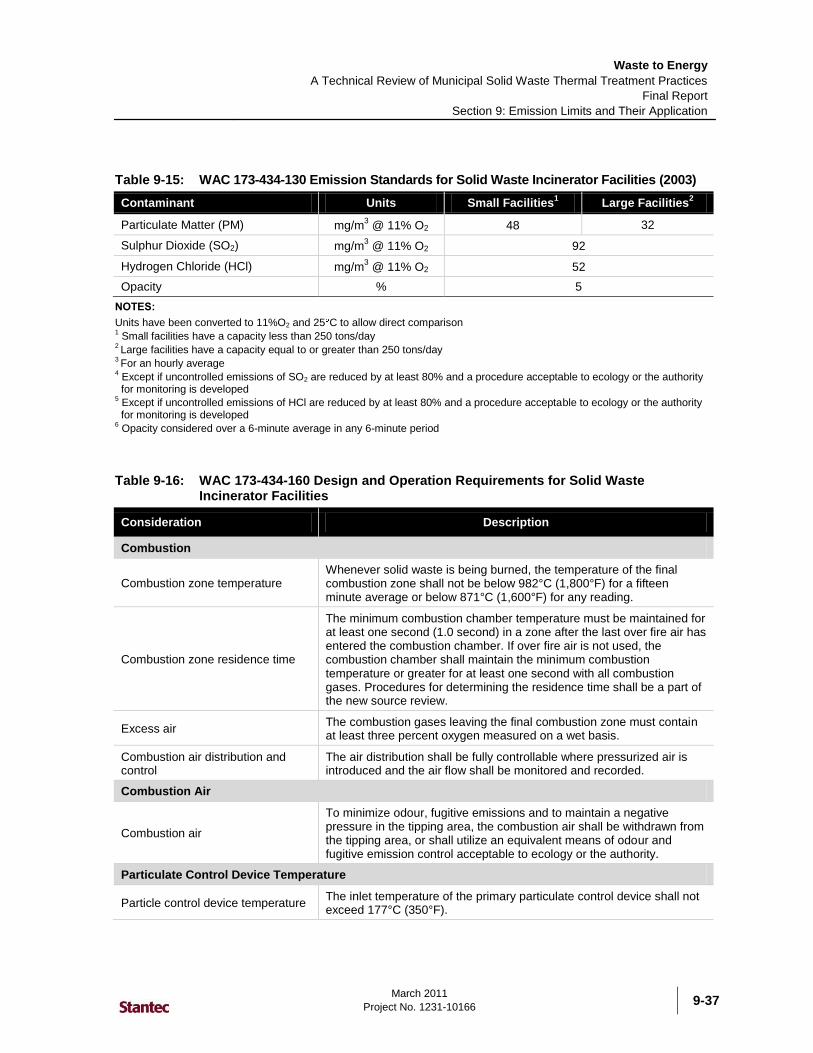
Waste to Energy
A Technical Review of Municipal Solid Waste Thermal Treatment Practices
Final Report
Section 9: Emission Limits and Their Application
March 2011
Project No. 1231-10166
9-37
Table 9-15: WAC 173-434-130 Emission Standards for Solid Waste Incinerator Facilities (2003)
Contaminant Units Small Facilities1 Large Facilities
2
Particulate Matter (PM) mg/m3 @ 11% O2 48 32
Sulphur Dioxide (SO2) mg/m3 @ 11% O2 92
Hydrogen Chloride (HCl) mg/m3 @ 11% O2 52
Opacity % 5
NOTES:
Units have been converted to 11%O2 and 25 C to allow direct comparison 1 Small facilities have a capacity less than 250 tons/day
2 Large facilities have a capacity equal to or greater than 250 tons/day
3 For an hourly average
4 Except if uncontrolled emissions of SO2 are reduced by at least 80% and a procedure acceptable to ecology or the authority for monitoring is developed
5 Except if uncontrolled emissions of HCl are reduced by at least 80% and a procedure acceptable to ecology or the authority for monitoring is developed
6 Opacity considered over a 6-minute average in any 6-minute period
Table 9-16: WAC 173-434-160 Design and Operation Requirements for Solid Waste Incinerator Facilities
Consideration Description
Combustion
Combustion zone temperature Whenever solid waste is being burned, the temperature of the final combustion zone shall not be below 982°C (1,800°F) for a fifteen minute average or below 871°C (1,600°F) for any reading.
Combustion zone residence time
The minimum combustion chamber temperature must be maintained for at least one second (1.0 second) in a zone after the last over fire air has entered the combustion chamber. If over fire air is not used, the combustion chamber shall maintain the minimum combustion temperature or greater for at least one second with all combustion gases. Procedures for determining the residence time shall be a part of the new source review.
Excess air The combustion gases leaving the final combustion zone must contain at least three percent oxygen measured on a wet basis.
Combustion air distribution and control
The air distribution shall be fully controllable where pressurized air is introduced and the air flow shall be monitored and recorded.
Combustion Air
Combustion air
To minimize odour, fugitive emissions and to maintain a negative pressure in the tipping area, the combustion air shall be withdrawn from the tipping area, or shall utilize an equivalent means of odour and fugitive emission control acceptable to ecology or the authority.
Particulate Control Device Temperature
Particle control device temperature The inlet temperature of the primary particulate control device shall not exceed 177°C (350°F).
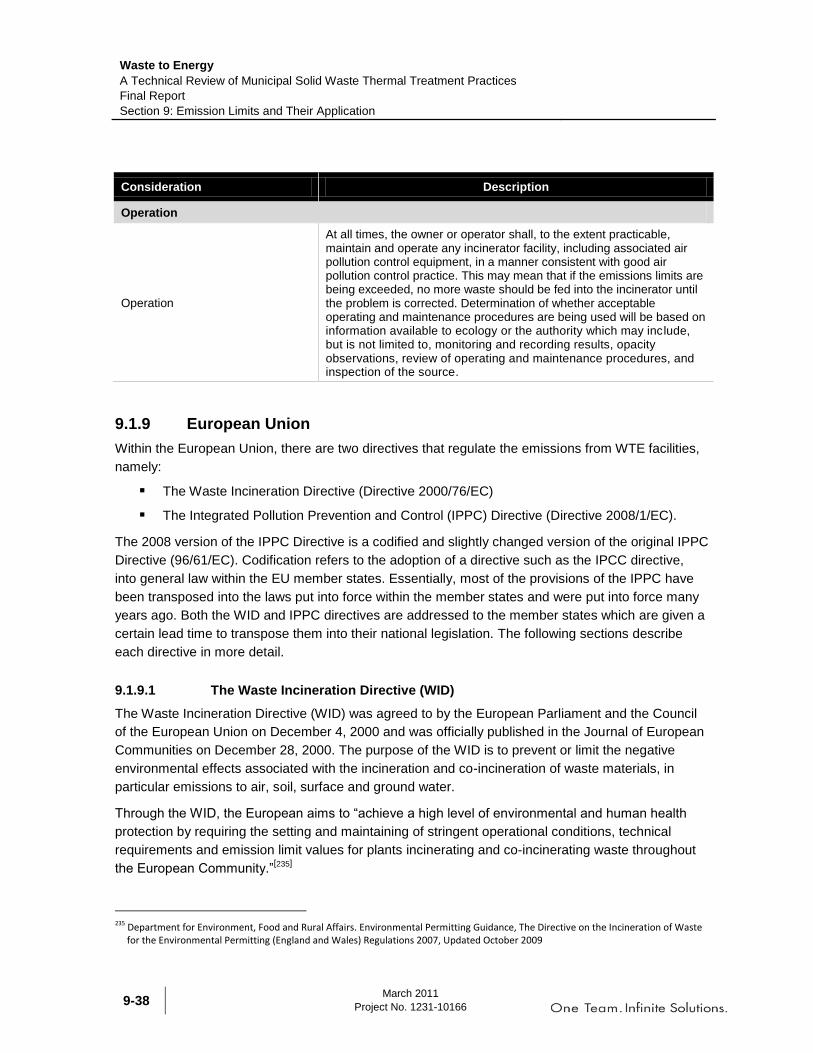
Waste to Energy
A Technical Review of Municipal Solid Waste Thermal Treatment Practices
Final Report
Section 9: Emission Limits and Their Application
March 2011
Project No. 1231-10166 9-38
Consideration Description
Operation
Operation
At all times, the owner or operator shall, to the extent practicable, maintain and operate any incinerator facility, including associated air pollution control equipment, in a manner consistent with good air pollution control practice. This may mean that if the emissions limits are being exceeded, no more waste should be fed into the incinerator until the problem is corrected. Determination of whether acceptable operating and maintenance procedures are being used will be based on information available to ecology or the authority which may include, but is not limited to, monitoring and recording results, opacity observations, review of operating and maintenance procedures, and inspection of the source.
9.1.9 European Union
Within the European Union, there are two directives that regulate the emissions from WTE facilities,
namely:
The Waste Incineration Directive (Directive 2000/76/EC)
The Integrated Pollution Prevention and Control (IPPC) Directive (Directive 2008/1/EC).
The 2008 version of the IPPC Directive is a codified and slightly changed version of the original IPPC
Directive (96/61/EC). Codification refers to the adoption of a directive such as the IPCC directive,
into general law within the EU member states. Essentially, most of the provisions of the IPPC have
been transposed into the laws put into force within the member states and were put into force many
years ago. Both the WID and IPPC directives are addressed to the member states which are given a
certain lead time to transpose them into their national legislation. The following sections describe
each directive in more detail.
9.1.9.1 The Waste Incineration Directive (WID)
The Waste Incineration Directive (WID) was agreed to by the European Parliament and the Council
of the European Union on December 4, 2000 and was officially published in the Journal of European
Communities on December 28, 2000. The purpose of the WID is to prevent or limit the negative
environmental effects associated with the incineration and co-incineration of waste materials, in
particular emissions to air, soil, surface and ground water.
Through the WID, the European aims to “achieve a high level of environmental and human health
protection by requiring the setting and maintaining of stringent operational conditions, technical
requirements and emission limit values for plants incinerating and co-incinerating waste throughout
the European Community.”[235]
235 Department for Environment, Food and Rural Affairs. Environmental Permitting Guidance, The Directive on the Incineration of Waste
for the Environmental Permitting (England and Wales) Regulations 2007, Updated October 2009
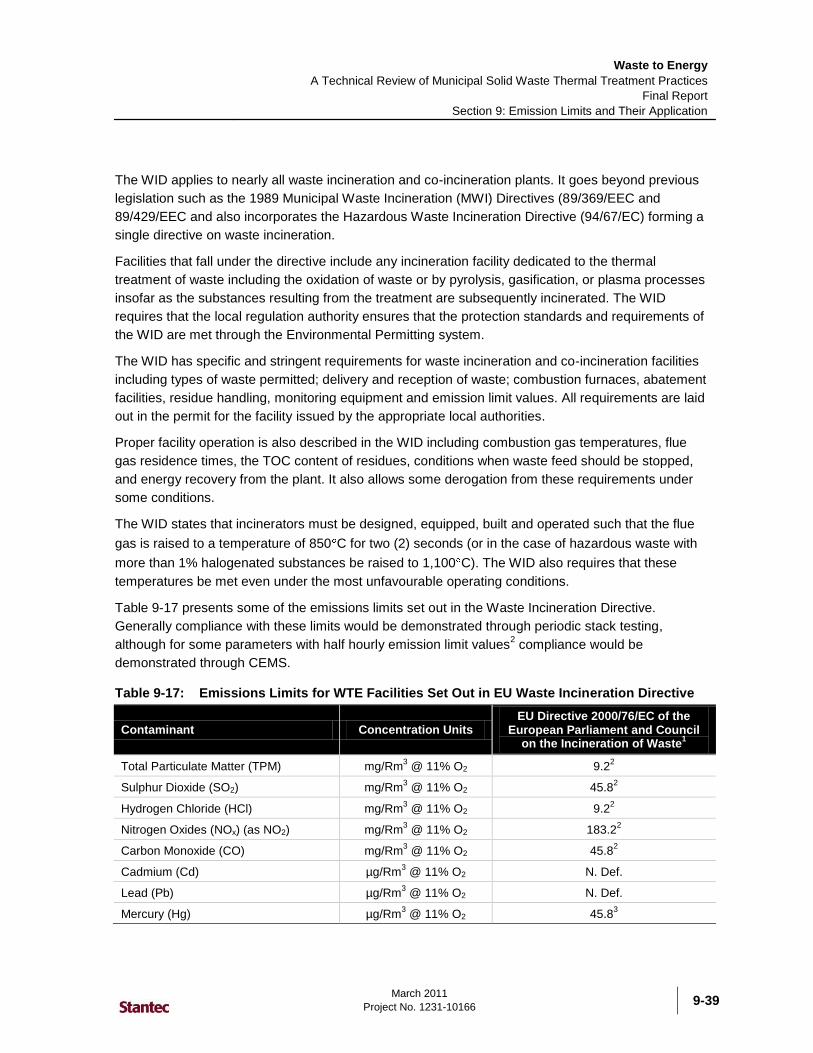
Waste to Energy
A Technical Review of Municipal Solid Waste Thermal Treatment Practices
Final Report
Section 9: Emission Limits and Their Application
March 2011
Project No. 1231-10166
9-39
The WID applies to nearly all waste incineration and co-incineration plants. It goes beyond previous
legislation such as the 1989 Municipal Waste Incineration (MWI) Directives (89/369/EEC and
89/429/EEC and also incorporates the Hazardous Waste Incineration Directive (94/67/EC) forming a
single directive on waste incineration.
Facilities that fall under the directive include any incineration facility dedicated to the thermal
treatment of waste including the oxidation of waste or by pyrolysis, gasification, or plasma processes
insofar as the substances resulting from the treatment are subsequently incinerated. The WID
requires that the local regulation authority ensures that the protection standards and requirements of
the WID are met through the Environmental Permitting system.
The WID has specific and stringent requirements for waste incineration and co-incineration facilities
including types of waste permitted; delivery and reception of waste; combustion furnaces, abatement
facilities, residue handling, monitoring equipment and emission limit values. All requirements are laid
out in the permit for the facility issued by the appropriate local authorities.
Proper facility operation is also described in the WID including combustion gas temperatures, flue
gas residence times, the TOC content of residues, conditions when waste feed should be stopped,
and energy recovery from the plant. It also allows some derogation from these requirements under
some conditions.
The WID states that incinerators must be designed, equipped, built and operated such that the flue
gas is raised to a temperature of 850 C for two (2) seconds (or in the case of hazardous waste with
more than 1% halogenated substances be raised to 1,100 C). The WID also requires that these
temperatures be met even under the most unfavourable operating conditions.
Table 9-17 presents some of the emissions limits set out in the Waste Incineration Directive.
Generally compliance with these limits would be demonstrated through periodic stack testing,
although for some parameters with half hourly emission limit values2 compliance would be
demonstrated through CEMS.
Table 9-17: Emissions Limits for WTE Facilities Set Out in EU Waste Incineration Directive
Contaminant Concentration Units EU Directive 2000/76/EC of the
European Parliament and Council on the Incineration of Waste
1
Total Particulate Matter (TPM) mg/Rm3 @ 11% O2 9.2
2
Sulphur Dioxide (SO2) mg/Rm3 @ 11% O2 45.8
2
Hydrogen Chloride (HCl) mg/Rm3 @ 11% O2 9.2
2
Nitrogen Oxides (NOx) (as NO2) mg/Rm3 @ 11% O2 183.2
2
Carbon Monoxide (CO) mg/Rm3 @ 11% O2 45.8
2
Cadmium (Cd) µg/Rm3 @ 11% O2 N. Def.
Lead (Pb) µg/Rm3 @ 11% O2 N. Def.
Mercury (Hg) µg/Rm3 @ 11% O2 45.8
3
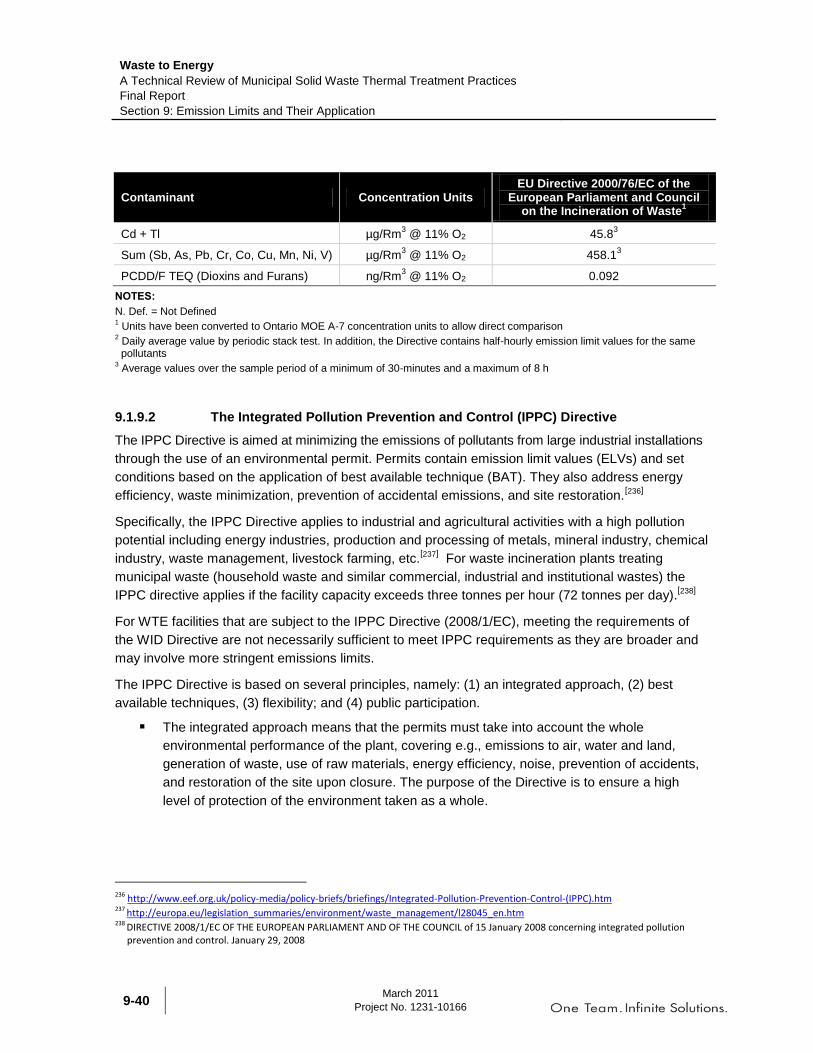
Waste to Energy
A Technical Review of Municipal Solid Waste Thermal Treatment Practices
Final Report
Section 9: Emission Limits and Their Application
March 2011
Project No. 1231-10166 9-40
Contaminant Concentration Units EU Directive 2000/76/EC of the
European Parliament and Council on the Incineration of Waste
1
Cd + Tl µg/Rm3 @ 11% O2 45.8
3
Sum (Sb, As, Pb, Cr, Co, Cu, Mn, Ni, V) µg/Rm3 @ 11% O2 458.1
3
PCDD/F TEQ (Dioxins and Furans) ng/Rm3 @ 11% O2 0.092
NOTES:
N. Def. = Not Defined 1 Units have been converted to Ontario MOE A-7 concentration units to allow direct comparison
2 Daily average value by periodic stack test. In addition, the Directive contains half-hourly emission limit values for the same pollutants
3 Average values over the sample period of a minimum of 30-minutes and a maximum of 8 h
9.1.9.2 The Integrated Pollution Prevention and Control (IPPC) Directive
The IPPC Directive is aimed at minimizing the emissions of pollutants from large industrial installations
through the use of an environmental permit. Permits contain emission limit values (ELVs) and set
conditions based on the application of best available technique (BAT). They also address energy
efficiency, waste minimization, prevention of accidental emissions, and site restoration.[236]
Specifically, the IPPC Directive applies to industrial and agricultural activities with a high pollution
potential including energy industries, production and processing of metals, mineral industry, chemical
industry, waste management, livestock farming, etc.[237]
For waste incineration plants treating
municipal waste (household waste and similar commercial, industrial and institutional wastes) the
IPPC directive applies if the facility capacity exceeds three tonnes per hour (72 tonnes per day).[238]
For WTE facilities that are subject to the IPPC Directive (2008/1/EC), meeting the requirements of
the WID Directive are not necessarily sufficient to meet IPPC requirements as they are broader and
may involve more stringent emissions limits.
The IPPC Directive is based on several principles, namely: (1) an integrated approach, (2) best
available techniques, (3) flexibility; and (4) public participation.
The integrated approach means that the permits must take into account the whole
environmental performance of the plant, covering e.g., emissions to air, water and land,
generation of waste, use of raw materials, energy efficiency, noise, prevention of accidents,
and restoration of the site upon closure. The purpose of the Directive is to ensure a high
level of protection of the environment taken as a whole.
236 http://www.eef.org.uk/policy-media/policy-briefs/briefings/Integrated-Pollution-Prevention-Control-(IPPC).htm 237 http://europa.eu/legislation_summaries/environment/waste_management/l28045_en.htm 238 DIRECTIVE 2008/1/EC OF THE EUROPEAN PARLIAMENT AND OF THE COUNCIL of 15 January 2008 concerning integrated pollution
prevention and control. January 29, 2008

Waste to Energy
A Technical Review of Municipal Solid Waste Thermal Treatment Practices
Final Report
Section 9: Emission Limits and Their Application
March 2011
Project No. 1231-10166
9-41
The permit conditions including emission limit values (ELVs) must be based on Best
Available Techniques (BAT), as defined in the IPPC Directive. To assist the licensing
authorities and companies to determine BAT, the Commission organizes an exchange of
information between experts from the EU Member States, industry and environmental
organizations. This work is coordinated by the European IPPC Bureau of the Institute for
Prospective Technological Studies at EU Joint Research Centre in Seville (Spain). This
results in the adoption and publication by the Commission of the BAT Reference
Documents (commonly referred to as BREFs). Executive summaries of the BREFs are
also translated into the official EU languages.
The BREF on Waste Incineration was issued in August 2006. It contains Chapter 5 – Best
Available Techniques with 63 numbered recommendations called BATs. One of these, BAT
35 contains a table with „operational emission levels for releases to air associated with the
use of BAT‟. The values in Table 9-18 are, of course, lower than the emission limit values
in WID Directive 2000/76, but the BREF states specifically that the BAT emission levels
are not the same as emission limit values.
It is important to stress that the BREF on Waste Incineration does not prescribe the
technology to be used at waste to energy facilities nor does the BREF prescribe one
technology to be better than the other.
Table 9-18: Comparison of the Requirements of the WID and the BAT Listed in the WI BREF
Contaminant Emissions to Air (mg/Nm
3 unless
stated)
WID BREF/BAT
Daily Average ELV Half Hourly
(100%/97% of the time) Daily Average
(operational BAT range) Half Hour Average
(operational BAT range)
Total Particulate 10 30/10 1 – 5 1 – 20
HCl 10 60/10 1 – 8 1 – 50
SO2 50 200/50 1 – 40 1 – 150
NOx (as NO2) <200 to <500 (size/new/existing
dependant) 400/200
40 – 100 (SCR)
120 – 180 (SNCR)
40 – 300 (SCR)
30 – 350 (SNCR)
VOC (as Total Organic Carbon)
10 20 1 – 10 1 – 20
CO 50
150 (10 min avg) (some alternatives)
5 – 30 5 – 100
Hg 0.05 (non-continuous sample) 0.001 – 0.02
Cd/Tl 0.05 (non-continuous sample) 0.005 – 0.05 (non-continuous sample)
PCDD/F 0.1 ng/m3 (non-continuous sample) 0.01 – 0.1 ng/m
3 (non-continuous sample)
Ammonia
Not included in WID
<10 1 – 10
N20
Information about control techniques is provided
Benz(a)pyrene
PAHs
PCBs
Waste to Energy
A Technical Review of Municipal Solid Waste Thermal Treatment Practices
Final Report
Section 9: Emission Limits and Their Application
March 2011
Project No. 1231-10166 9-42
The IPPC Directive contains elements of flexibility by allowing the licensing authorities in determining
permit conditions, to take into account:
The technical characteristics of the installation
Its geographical location
The local environmental conditions.
The Directive ensures that the public has a right to participate in the decision making process, and to
be informed of its consequences, by having access to:
Permit applications in order to give opinions
Permits
Results of the monitoring of releases
The European Pollutant Emission Register (EPER). In EPER, emission data reported by
Member States are made accessible in a public register, which is intended to provide
environmental information on major industrial activities. EPER will be replaced by the
European Pollutant Release and Transfer Register (E-PRTR) from 2007 reporting period
onwards.
9.1.9.3 IED – Industrial Emissions Directive
The European Commission's proposal from December 21, 2007 merges the IPPC directive
96/61/EC, the Waste Incineration directive (WID) 2000/76/EC and some other directives including
the Large Combustion Plants Directive 2001/80/EC. This will most likely not occur until 2013.[239]
The new Directive will include pre-treatment of waste for incineration and for co-incineration as well
as treatment of bottom ash and APC ashes. Through the IED, the European Commission aims to
strengthen the concept of BAT by making the BREFs more prominent.
One of the problems heavily discussed among the waste to energy sector and the authority, is not to
mix-up the emission limit values (ELV) with the BAT AEL (Associated Emission Levels) based on the
ranges presented in the BREF and mentioned in the chapter above.
The draft article 16.2 states "the competent authority shall set emission limit values that do not
exceed the emission levels associated with the best available techniques as described in the BAT
reference document".
The draft article 15.2 says " …the emission limit values and the equivalent parameters and technical
measures … shall be based on the best available techniques, without prescribing the use of any
technique or specific technology."
The time table for the approval of the IED has been delayed and the second reading will go before
the European Parliament plenary 18 May 2010.
239 http://europa.eu/legislation_summaries/environment/waste_management/l28045_en.htm

Waste to Energy
A Technical Review of Municipal Solid Waste Thermal Treatment Practices
Final Report
Section 9: Emission Limits and Their Application
March 2011
Project No. 1231-10166
9-43
The review of the BREF on Waste Incineration is expected to take place during the period from
2012 – 2014. It is not yet known if this will result in a general lowering of the ELV or if the IED will
result in lowering of the ELV for only some pollutants and discussions are going on among the
commission, the national member states and the industry. The general opinion among the member
states tends towards keeping the current ELV set out in the WID.
9.1.9.4 European Union Member States Regulatory Limits
Since the EU Directives are addressed to the Member States, countries that are members of the
European Union have to transpose the directives. The WID is a „minimum‟ directive which means
that the Member States are free to set stricter regulatory limits.
In general all European countries, with few exceptions, have implemented the WID and the emission
limits. Several have set lower limits as a result of local considerations. Germany and Norway (not an
EU member country) have implemented a more stringent emission limit for mercury. For NOx the
Netherlands have specified a limit at 70 mg/Nm3 and Austria and Switzerland (not an EU member
country) have specified a limit at 80 mg/Nm3.
Some member states have implemented lower emission values in certain areas, and some individual
facilities may have more stringent emission limits in their approvals/permits. An example of how the
WID and emissions have been applied in a member state (Germany) is outlined below.
In 2007, Germany had 72 operating WTE facilities that treated waste. Since 1985, waste incineration
capacity in Germany has nearly doubled.[240]
Alike to other members of the EU, Germany requires
that WTE facilities that operate within its boundaries, meet the emissions standards set out in the
EU‟s Waste Incineration Directive. Germany paved the way for the EU WID. The German Ordinance
on Waste Incineration and Co-Incineration (17.BlmSchV) which was developed in 1990 set stringent
limits on the emissions associated with WTE facilities. The 17.BlmSchV sets out the requirements for
construction, layout and operation of WTE facilities, and for emissions measurement and monitoring.
It outlined a transitional period of six years for existing facilities while new facilities were required to
comply with specific limits from the very beginning. Since 1996, all facilities have complied with the
stringent emissions requirements.[241]
The limits set out in Germany‟s 17.BlmSchV had a large
influence on the emissions limits developed in the EU‟s WID (2000/76/EC).
In 2003, the 17.BlmSchV was updated to incorporate the requirements outlined in the EU WID.
Moreover, it contains emission limit values for some additional compounds and it also requires that
Hg emissions be monitored continuously. The 17.BlmSchV incorporates all the requirements outlined
in the EU WID and must be adhered to by all operators of waste incineration facilities.[242]
240 Germany Federal Environmental Agency, 2005 241 Waste Incineration – A Potential Danger? Bidding Farewell to Dioxin Spouting. Federal Ministry of the Environment, Nature
Conservation and Nuclear Safety, September 2005 242 Ordinance on Waste Incineration and Co-Incineration – 17. BlmSchV. August 2003

Waste to Energy
A Technical Review of Municipal Solid Waste Thermal Treatment Practices
Final Report
Section 9: Emission Limits and Their Application
March 2011
Project No. 1231-10166 9-44
It should be noted that CEMS for mercury is an emerging approach for mercury emissions
monitoring. As noted above, it is required in Germany. The new CISWI rules proposed in the US
include proposed requirements for using Hg CEMS (performance specification 12A – Specifications
and Test Procedures for Total Vapor Phase Mercury Continuous Emission Monitoring Systems in
Stationary Sources) or an integrated sorbent trap Hg monitoring system.
9.2 Emission Limits for Criteria Air Contaminants and Hazardous Air Pollutants
This subsection identifies and evaluates regulatory emission limits for all air contaminants applicable
to WTE scenarios. Table 9-19, provides a comparison of the maximum allowable concentration of
various pollutants measured in the discharge under:
CCME
British Columbia Criteria for Municipal Solid Waste Incinerators (1991)
Old Ontario MOE Guideline A-7 (2004)
New Ontario MOE Guideline A-7 (2010)
Oregon Incinerator Regulations (OAC 340-230-310)
Washington Emission Standards for Combustion and Incineration Units (WAC 173-434-130)
US EPA New Incinerator Limits (i.e., the current US National Standard)
The European Union, New Incinerator Unit, Regulation (i.e., the current European Standard).
The US EPA and EU limits have been converted to equivalent units comparable to those set out in
the CCME and Ontario guidelines. These differ slightly in regards to reference conditions, where the
values identified reflect mass per reference cubic metres corrected to 11% oxygen and 0% moisture.
Reference conditions: 25 C, 101.3 kPA, except for British Columbia which is based on 20 C.
The emission limits provided are actual values with inherent consideration of achievability. These
limits are consistent with BC‟s Interim BAT policy.
The maximum allowable concentrations, otherwise known as maximum emissions limits values
(ELVs) for various jurisdictions are linked to appropriate averaging periods and monitoring
methodologies. The limits presented in Table 9-19 are checked for compliance with the methods
deemed appropriate by the individual jurisdictions either based on manual stack testing or CEMS
data depending on the parameter and applicable averaging periods. Table 9-19 makes note of the
applicable averaging periods.
As discussed in Section 7, Table 9-20 illustrates the direct connection between the stated ELVs and
the monitoring methodology. Specifically, where continuous emission monitoring instrumentation is
considered to be representative of emission quality, the ELV is commonly linked to an average
concentration calculated over some specified monitoring period. The ELV is also set considering
normal fluctuations in operating conditions that may affect emission quality, and must be set such that
the ELV is protective of human health and the environment in all cases. CEMs produce a significant

Waste to Energy
A Technical Review of Municipal Solid Waste Thermal Treatment Practices
Final Report
Section 9: Emission Limits and Their Application
March 2011
Project No. 1231-10166
9-45
volume of data and permit the application of statistical methodologies in determining the appropriate
ELV for any given parameter. Most commonly, simple averaging techniques are used, such as one half
hour average or daily average. These are reflected for certain parameters in Table 9-20.
Where periodic „stack‟ testing is conducted as the representative method for obtaining compliance
data, the results are typically averaged over the number of replicate sample runs completed during
the test. ELVs that are based on a single stack survey made up of three individual sampling runs. An
average can be inferred; however, as it is common for replicate tests on larger stacks to take a day
or more, and an average over the duration of the test can be calculated. Table 9-20 also indicates
where periodic tests form the basis for the ELV.
Monitoring technology is always evolving and consideration should be given to new and innovative
monitoring techniques where it can be shown these techniques are reliable and representative of
emission quality. Where CEMs can be shown to be equivalent to a periodic monitoring in terms of
quality of data, most regulatory agencies are specifying the CEMs could form the basis for the
monitoring program. The EPA protocol, SP-11, provides the guidance for demonstrating equivalence
between periodic stack sampling results and CEMS results.

Waste to Energy
A Technical Review of Municipal Solid Waste Thermal Treatment Practices
Final Report
Section 9: Emission Limits and Their Application
March 2011
Project No. 1231-10166 9-46
THIS PAGE INTENTIONALLY LEFT BLANK.

Waste to Energy
A Technical Review of Municipal Solid Waste Thermal Treatment Practices
Final Report
Section 9: Emission Limits and Their Application
March 2011
Project No. 1231-10166
9-47
Table 9-19: Comparison of Maximum Allowable Concentration of Pollutants Defined by CCME, BC, Ontario, US, and Europe
Contaminant Concentration Units
Canadian Council of Ministers of the
Environment (CCME) Guidelines (1989)
BC OLD ONTARIO OREGON WASHINGTON NEW ONTARIO US EPA 40 CFR Part 60 (May-10-06 Edition) Standards of Performance
for Large Municipal Waste Combustors (New Facilities
) (5,6)
EU Directive 2000/76/EC of the European Parliament
And Council on the incineration of waste
(6)
Emissions Criteria for Municipal Solid Waste
Incinerators (1991)
MOE A-7 (February 2004)
OAR 340-230-310 Incinerator Regulations – Emissions Limits
for New Facilities (April, 2010)
WAC 173-434-130 Emission Standards for Large
Combustion and Incineration Units (2003)
Guideline A-7 (October 2010)
Total Particulate Matter (TPM) mg/Rm3 @ 11% O2 20
(1) 20 17 18 32 14 14.0 9.22
(12)
Sulphur Dioxide (SO2) mg/Rm3 @ 11% O2 260
(2) 250 56 53
(17) 92
(22) 56 55.0
(7) 45.82
(12)
Hydrogen Chloride (HCl) mg/Rm3 @ 11% O2 75 or 90% removal
(1) 70 27 30
(18) 52
(22) 27 26.1
(8) 9.22
(12)
Nitrogen Oxides (NOx) (as NO2) mg/Rm3 @ 11% O2 400
(2) 350 207 270 N. Def. 198 197.5
(9) 183.22
(12)
Carbon Monoxide (CO) mg/Rm3 @ 11% O2 57 (114 for RDF Systems)
(1) 55 (14) N. Def. N. Def. N. Def. 40 41 to 200
(10) 45.82
(12)
Cadmium (Cd) µg/Rm
3 @ 11% O2 100
(2) 100
(15) 14 14 N. Def. 7 7.0 N. Def.
Lead (Pb) µg/Rm3 @ 11% O2 50
(2) 50
(15) 142 140 N. Def. 60 98.0 N. Def.
Mercury (Hg) µg/Rm3 @ 11% O2 20
(3) 200
(15) 20 35
(19) N. Def. 20 35.0 45.83
(13)
Cd + Tl µg/Rm3 @ 11% O2 N. Def. N. Def.. N. Def. N. Def. N. Def. N. Def. N. Def. 45.83
(13)
Sum (Sb, As, Pb, Cr, Co, Cu, Mn, Ni, V)
µg/Rm3 @ 11% O2 N. Def. N. Def. N. Def. N. Def. N. Def. N. Def. N. Def. 458.13
(13)
PCDD/F TEQ (Dioxins and Furans
ng/Rm3 @ 11% O2 0.08
(4) 0.5
(16) 0.08 25
(20) N. Def. 0.08 9.1
(11) 0.092
Organic Matter (as Methane) mg/Rm
3 N. Def. N. Def. 65.6 N. Def. N. Def. 33 N. Def. N. Def.
Opacity % 5 5 10 5
5 (2 hour avg) and 10 (6 minute avg)
10
NOTES:
N. Def. = Not Defined
Concentration Units: Mass per reference cubic metres corrected to 11% oxygen and 0% moisture. Reference conditions: 25 C, 101.3 kPA, except British Columbia which is based on 20 C
(1) CCME Operating and Emissions Guidelines for MSW Incinerators Report CCME-TS/WM-TRE003, June 1989. Table 4.2: Stack Discharge Limits (at 11% O2)
(2) CCME Operating and Emissions Guidelines for MSW Incinerators Report CCME-TS/WM-TRE003, June 1989. Table 4.3: Anticipated Emissions from MSW Incinerators
(3) CCME Canada-Wide Standards for Mercury Emissions (2000)
(4) CCME Canada-Wide Standards for Dioxins and Furans (2001) - 2007 review determine no need to update
(5) Large' = Large MWC units with an individual MWC capacity greater than 250 tons/d
(6) Units have been converted to Ontario MOE A-7 concentration units to allow direct comparison
(7) Or 80% reduction by weight or volume of potential SO2 emissions, whichever is less stringent
(8) Or 95% reduction of potential HCl emissions by weight, whichever is less stringent
(9) 180 ppmdv @ 7% O2 for 1st year of operation, 150 ppmdv @ 7% O2 after 1st year of operation
(10) CO limit varies per technology: 40 mg/Rm3 @11% O2 for Modular Starved-Air & Excess Air Unit; 200 mg/Rm3 @11% O2 for Spreader Stoker Refuse-derived fuel
(11) Limit not comparable to Canadian and European limits. Dioxins/furans on total mass basis measured as tetra- through octachlorinated dibenzo-p-dioxins and dibenzofurans. Not TEQ values
(12) Daily average value
(13) Average values over the sample period of a minimum of 30-minutes and a maximum of 8 h
(14) For RDF systems the limit shall be 110 mg/m3
(15) The concentration is total metal emitted as solid and vapour
(16) Expressed as Toxicity Equivalents. The value shall be estimated from isomer specific test data and toxicity equivalency factors by following a procedure approved by the ministry
(17) Or 25% of the potential SO2 emission concentration (75% reduction by weight or volume), whichever is less stringent.
(18) Or 5% of the potential HCl emission concentration (95% reduction by weight or volume), whichever is less stringent.
(19) Or 15% of the potential mercury emission concentration (85% reduction by weight), whichever is less stringent.
(20) Total mass. Applies to municipal waste combustor units that employ electrostatic precipitator-based emission control system. If electrostatic precipitator-based emission controls are not employed, 15 ng per dry m3 (total mass) @ 7% O2.

Waste to Energy
A Technical Review of Municipal Solid Waste Thermal Treatment Practices
Final Report
Section 9: Emission Limits and Their Application
March 2011
Project No. 1231-10166 9-48
Table 9-20: Permitted Emission Limit Values from Various Existing and Proposed Facilities Worldwide
Component Unit
Metro Vancouver
WTE Facility (Canada)
Durham/York Facility
Proposed[1]
(Canada)
SEMASS Boiler No. 3
(US)[3]
Spittelau (Austria)
[10]
Zisterdorf (Austria)
[10]
SITA Isle of Man Incinerator [2]
Linz
(Austria) [7]
I/S Reno-Nord WTE (Denmark)
Facility [5]
SELCHP (England)
[6]
TREA Breisgau (Germany)
[8]
Coventry WTE Facility (UK) (2009 Permit)
[9]
Lungsjoverket (Sweden)
[11]
Half Hour Average
Periodic Half Hour Average
Periodic Half Hour Average
Daily Average
Periodic Half Hour Average
Daily Average
Periodic Daily
Average Daily
Average Periodic
Half Hour Average
Daily Average
Periodic Hourly
Average 8 Hour
Average
Total Particulate Matter
mg/m3 20 9.2 19.6 14.0
7.5
28.0 9.3
4.7 9.3
9.3 4.7
28.0 9.3 28.0 9.3
CO mg/m3 55 45.8 124.9 93.2
46.6
93.2 46.6
46.6
93.2 46.6 93.2
SO2 mg/m
3 200 35.6 55.0 37.3
18.6
186.3 46.6
37.3 18.6
46.6 9.3
186.3 46.6 186.3 46.6
NOx mg/m
3 350 123.1 245.0 93.2
65.2
372.7 186.3
55.9
186.3 65.2
372.7 167.7 372.7 139.8
HCl mg/m
3 55 9.2 27.0 18.6
6.5
55.9 9.3
6.5 4.7
9.3 4.7
55.9 9.3 55.9 9.3
HF mg/m
3 3
0.7
0.3
1.9 0.28 0.9
1.9
TOC mg/m
3
18.6
7.5 18.6 9.3
7.5
9.3 4.7
18.6 9.3 18.6 9.3
Methane mg/m
3 40 49.8
As mg/m
3 0.004
Cr mg/m
3 0.01
Hg mg/m
3 0.2 0.015 0.020
0.093
0.047
0.047
0.047
0.009
0.047
Cd mg/m
3 0.1 0.007 0.029
0.093
0.009
Cd,Tl mg/m
3
0.047
0.047
0.047
0.009
0.047
Pb mg/m
3 0.05 0.051 0.313
Sum of As, Ni, Co, Pb, Cr, Cu, V, Mn, Sb
mg/m3
0.47
0.47
0.47
0.093
0.47
Dioxins/Furans I-TEQ ng/m3 0.5 0.061 22.9
[4]
0.093
0.093
0.093
0.047
0.093
0.093
NOTES:
N. Def. = Not Defined
Concentration Units: Mass per reference cubic metres corrected to 11% oxygen and 0% moisture. Reference conditions: 20°C, 101.3 kPA,
(1) Submitted to the Regions of Durham York from Covanta Energy Corporation.
(2) SITA Isle of Man Annual Public Report 2008.
(3) SEMASS Resource Recovery Facility Technology Description and Performance History
(4) ng/Ncm (tetra-octa) - not comparable to TEQ values (same conditions except 0 degrees C)
(5) Jeff Harnly. Europe's Continued Progress with Waste to Energy. Xcel Energy. (periodic measurements over a period of a minimum of 30 minutes and a maximum of 8 hours except dioxins/furans which is over a minimum of 6 hours and a maximum of 8 hours)
(6) Obtained from http://www.selchp.com/emissions.asp.
(7) Federal Environment Agency. 2009. Presentation entitled "Waste Management in Austria, How to Avoid Wasting Waste".
(8) Jeff Harnly. Europe's Continued Progree with Waste to Energy. Xcel Energy. (periodic measurements over a period of a minimum of 30 minutes and a maximum of 8 hours except dioxins/furans which is over a minimum of 6 hours and a maximum of 8 hours)
(9) Environment Agency. 2009. The CSWDC Waste to Energy Plant Permit Number NP3739PD.
(10) Federal Environment Agency - Austria. 2002. State of the Art for Waste Incineration Plants.
(11) LJUNGSJÖVERKET - PHASE 2 Waste Incineration Plant. Volund Systems Waste and Energy Technologies.

Waste to Energy
A Technical Review of Municipal Solid Waste Thermal Treatment Practices
Final Report
Section 9: Emission Limits and Their Application
March 2011
Project No. 1231-10166
9-49
Table 9-21: Overview of Key Jurisdictions Emission Criteria and Limits with Respect to Averaging Periods
Contaminant Concentration Units
British Columbia Emission Criteria for Municipal Solid Waste Incineration (1991)
US EPA Emissions Criteria for Large Municipal Waste Combustors
(May 10, 2006) (8)
European Union Waste Incineration Directive (2000)
Ontario MOE A-7 (October 2010)
Facilities Processing >400 kg/h
Average Period Monitoring Method New Large Facilities
Averaging Period
Monitoring Method
Daily Average (CEMS) (14)
Half Hourly (100%)
(CEMS) (9)
Half Hourly (97%)
(CEMS) (10)
In-Stack Emission
Limit Verification of Compliance (15) Period
Total Particulate Matter (TPM)
mg/Rm3 @ 11% O2 20
To be monitored over the approved sampling and monitoring period
Methods to be approved by Regional Manager
14.2
9.3 28 9 13.0
Results from compliance source testing or calculated as the rolling arithmetic average of four (4) hours of data before dilution with any other gaseous stream, measured by a continuous emission monitoring system that provides data at least once every fifteen minutes.
Carbon Monoxide (CO)
mg/Rm3 @ 11% O2 55 4-hour rolling average Continuous Monitoring 42-203 (6)
46.6 93.2 or 139.8 (1) 37.3
Calculated as the rolling arithmetic average of four (4) hours of data at the outlet of the piece of equipment where combustion of the gas stream resulting from thermal treatment of waste is completed but before dilution with any other gaseous stream, measured by a continuous emission monitoring system that provides data at least once every fifteen minutes.
Sulphur Dioxide (SO2)
mg/Rm3 @ 11% O2 250
To be monitored over the approved sampling and monitoring period
Methods to be approved by Regional Manager
56 (3)
46.6 186 47 52.2 Results from compliance source testing or calculated as the rolling arithmetic average of 24 hours of data measured by a continuous emission monitoring system that provides data at least once every 15 minutes.
Nitrogen Oxides (NOx as NO2)
mg/Rm3 @ 11% O2 350
To be monitored over the approved sampling and monitoring period
Methods to be approved by Regional Manager
201 (5)
186.3 373 186 184.5 Results from compliance source testing or calculated as the rolling arithmetic average of 24 hours of data measured by a continuous emission monitoring system that provides data at least once every 15 minutes.
Hydrogen Chloride (HCl)
mg/Rm3 @ 11% O2 70 8-hour rolling average Continuous Monitoring 26.5 (4)
9.3 56 9 25.2 (2)
Results from compliance source testing or calculated as the rolling arithmetic average of 24 hours of data measured by a continuous emission monitoring system that provides data at least once every 15 minutes.
Hydrogen Fluoride (HF)
mg/Rm3 @ 11% O2 3
To be monitored over the approved sampling and monitoring period
Methods to be approved by Regional Manager
N.D. 0.93 (12) 3.7 (12) 1.9 (12) N.D.
Total Hydrocarbons (as CH4)
mg/Rm3 @ 11% O2 40
To be monitored over the approved sampling and monitoring period
Methods to be approved by Regional Manager
N.D. N.D. N.D. N.D. N.D.
Organic Matter (as CH4)
mg/Rm3 @ 11% O2 - N.D. N.D. N.D. N.D. N.D. N.D. 30.7
Results from compliance source testing or calculated as the rolling arithmetic average of 10 minutes of data at the outlet of the piece of equipment where combustion of the gas stream resulting from thermal treatment of waste is completed but before dilution with any other gaseous stream takes place, measured by a continuous emission monitoring system that provides data at least once every minute.
VOCs (as Total Organic Carbon)
mg/Rm3 @ 11% O2 - N.D. N.D. N.D. 9.3 19 9.3 N.D.
Arsenic (As) µg/Rm3 @ 11% O2 4
To be monitored over the approved sampling and monitoring period
Methods to be approved by Regional Manager
N.D. N.D. N.D.
Cadmium (Cd) µg/Rm3 @ 11% O2 100
To be monitored over the approved sampling and monitoring period
Methods to be approved by Regional Manager
7.1
N.D. 6.5 Calculated as the arithmetic average of three stack tests conducted in accordance with standard methods
Chromium (Cr) µg/Rm3 @ 11% O2 10
To be monitored over the approved sampling and monitoring period
Methods to be approved by Regional Manager
N.D. N.D. N.D.
Lead (Pb) µg/Rm3 @ 11% O2 50
To be monitored over the approved sampling and monitoring period
Methods to be approved by Regional Manager
99.7
N.D. 55.9 Calculated as the arithmetic average of three stack tests conducted in accordance with standard methods
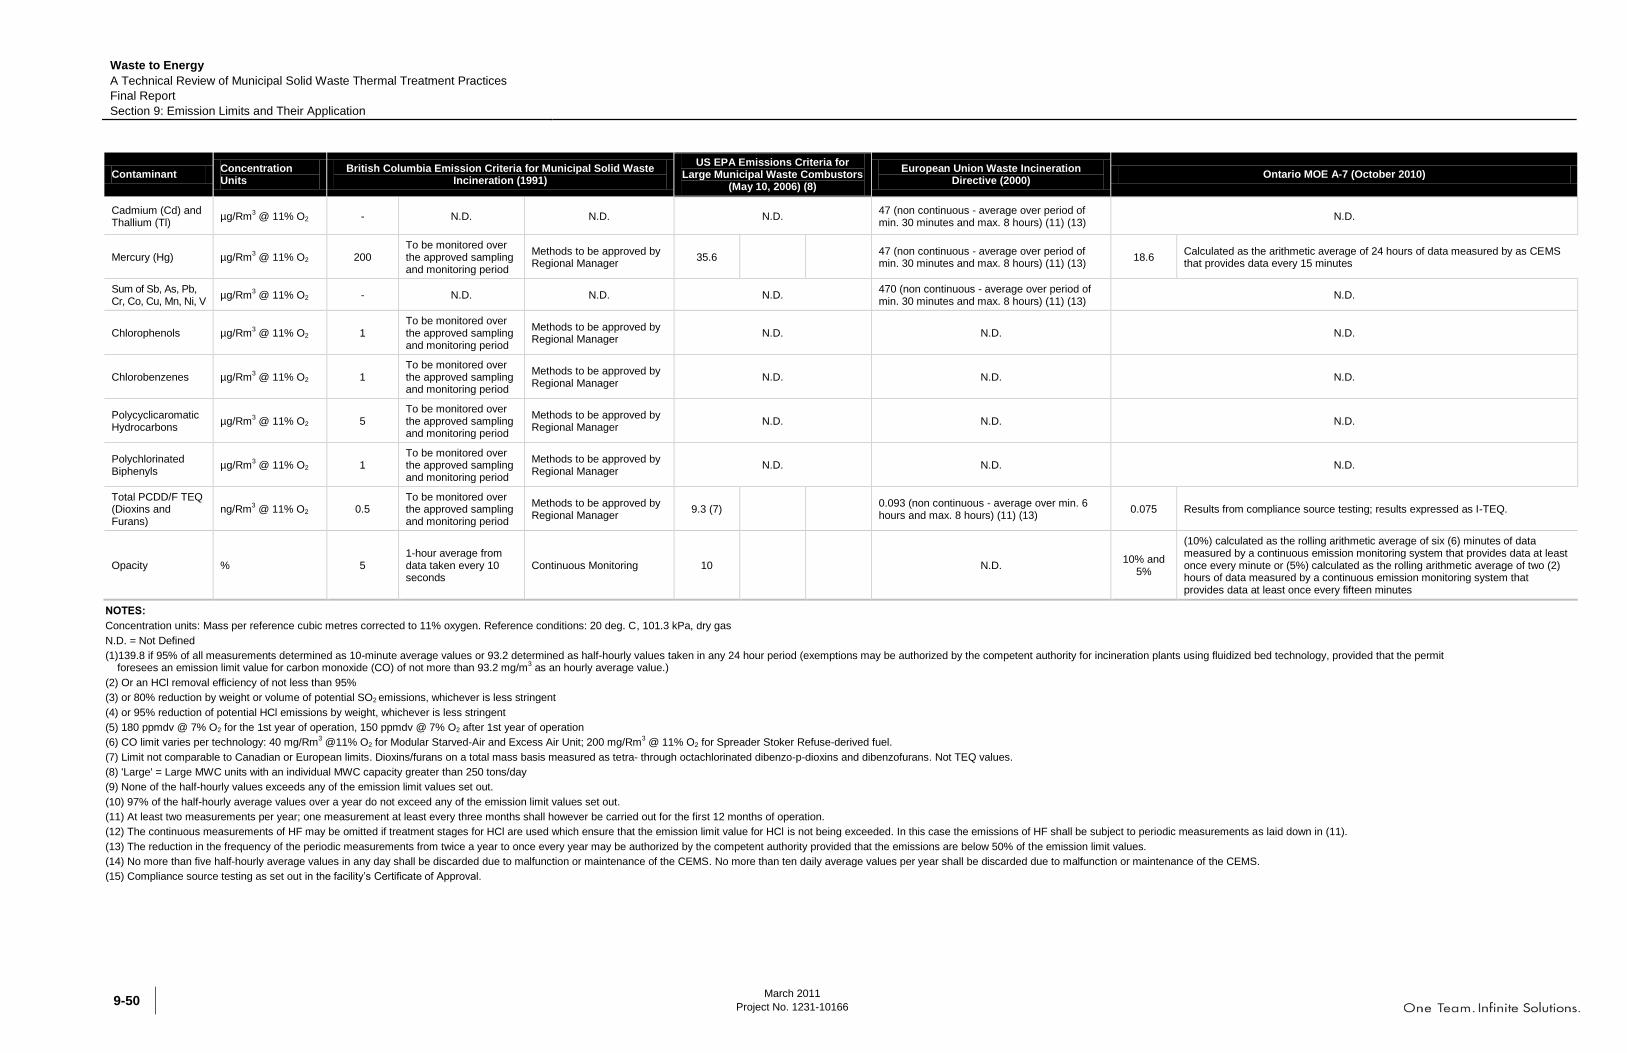
Waste to Energy
A Technical Review of Municipal Solid Waste Thermal Treatment Practices
Final Report
Section 9: Emission Limits and Their Application
March 2011
Project No. 1231-10166 9-50
Contaminant Concentration Units
British Columbia Emission Criteria for Municipal Solid Waste Incineration (1991)
US EPA Emissions Criteria for Large Municipal Waste Combustors
(May 10, 2006) (8)
European Union Waste Incineration Directive (2000)
Ontario MOE A-7 (October 2010)
Cadmium (Cd) and Thallium (Tl)
µg/Rm3 @ 11% O2 - N.D. N.D. N.D.
47 (non continuous - average over period of min. 30 minutes and max. 8 hours) (11) (13)
N.D.
Mercury (Hg) µg/Rm3 @ 11% O2 200
To be monitored over the approved sampling and monitoring period
Methods to be approved by Regional Manager
35.6
47 (non continuous - average over period of min. 30 minutes and max. 8 hours) (11) (13)
18.6 Calculated as the arithmetic average of 24 hours of data measured by as CEMS that provides data every 15 minutes
Sum of Sb, As, Pb, Cr, Co, Cu, Mn, Ni, V
µg/Rm3 @ 11% O2 - N.D. N.D. N.D.
470 (non continuous - average over period of min. 30 minutes and max. 8 hours) (11) (13)
N.D.
Chlorophenols µg/Rm3 @ 11% O2 1
To be monitored over the approved sampling and monitoring period
Methods to be approved by Regional Manager
N.D. N.D. N.D.
Chlorobenzenes µg/Rm3 @ 11% O2 1
To be monitored over the approved sampling and monitoring period
Methods to be approved by Regional Manager
N.D. N.D. N.D.
Polycyclicaromatic Hydrocarbons
µg/Rm3 @ 11% O2 5
To be monitored over the approved sampling and monitoring period
Methods to be approved by Regional Manager
N.D. N.D. N.D.
Polychlorinated Biphenyls
µg/Rm3 @ 11% O2 1
To be monitored over the approved sampling and monitoring period
Methods to be approved by Regional Manager
N.D. N.D. N.D.
Total PCDD/F TEQ (Dioxins and Furans)
ng/Rm3 @ 11% O2 0.5
To be monitored over the approved sampling and monitoring period
Methods to be approved by Regional Manager
9.3 (7)
0.093 (non continuous - average over min. 6 hours and max. 8 hours) (11) (13)
0.075 Results from compliance source testing; results expressed as I-TEQ.
Opacity % 5 1-hour average from data taken every 10 seconds
Continuous Monitoring 10
N.D. 10% and
5%
(10%) calculated as the rolling arithmetic average of six (6) minutes of data measured by a continuous emission monitoring system that provides data at least once every minute or (5%) calculated as the rolling arithmetic average of two (2) hours of data measured by a continuous emission monitoring system that provides data at least once every fifteen minutes
NOTES:
Concentration units: Mass per reference cubic metres corrected to 11% oxygen. Reference conditions: 20 deg. C, 101.3 kPa, dry gas
N.D. = Not Defined
(1)139.8 if 95% of all measurements determined as 10-minute average values or 93.2 determined as half-hourly values taken in any 24 hour period (exemptions may be authorized by the competent authority for incineration plants using fluidized bed technology, provided that the permit foresees an emission limit value for carbon monoxide (CO) of not more than 93.2 mg/m
3 as an hourly average value.)
(2) Or an HCl removal efficiency of not less than 95%
(3) or 80% reduction by weight or volume of potential SO2 emissions, whichever is less stringent
(4) or 95% reduction of potential HCl emissions by weight, whichever is less stringent
(5) 180 ppmdv @ 7% O2 for the 1st year of operation, 150 ppmdv @ 7% O2 after 1st year of operation
(6) CO limit varies per technology: 40 mg/Rm3 @11% O2 for Modular Starved-Air and Excess Air Unit; 200 mg/Rm
3 @ 11% O2 for Spreader Stoker Refuse-derived fuel.
(7) Limit not comparable to Canadian or European limits. Dioxins/furans on a total mass basis measured as tetra- through octachlorinated dibenzo-p-dioxins and dibenzofurans. Not TEQ values.
(8) 'Large' = Large MWC units with an individual MWC capacity greater than 250 tons/day
(9) None of the half-hourly values exceeds any of the emission limit values set out.
(10) 97% of the half-hourly average values over a year do not exceed any of the emission limit values set out.
(11) At least two measurements per year; one measurement at least every three months shall however be carried out for the first 12 months of operation.
(12) The continuous measurements of HF may be omitted if treatment stages for HCl are used which ensure that the emission limit value for HCl is not being exceeded. In this case the emissions of HF shall be subject to periodic measurements as laid down in (11).
(13) The reduction in the frequency of the periodic measurements from twice a year to once every year may be authorized by the competent authority provided that the emissions are below 50% of the emission limit values.
(14) No more than five half-hourly average values in any day shall be discarded due to malfunction or maintenance of the CEMS. No more than ten daily average values per year shall be discarded due to malfunction or maintenance of the CEMS.
(15) Compliance source testing as set out in the facility‟s Certificate of Approval.

Waste to Energy
A Technical Review of Municipal Solid Waste Thermal Treatment Practices
Final Report
Section 9: Emission Limits and Their Application
March 2011
Project No. 1231-10166
9-51
9.3 Application of Emission Limits in BC
9.3.1 Setting Objectives and Standards for Existing and New Facilities
As discussed in the sections above, the regulatory review process in BC includes a combination of
processes that may be triggered according to size of the WTE facility. In BC, these limits are to be
determined in accordance with the guidance provided by the province‟s interim Best Achievable
Technology (BAT) policy. In brief summary, the BAT policy requires the setting of limits based on
what is technically and economically feasible and in general accordance with accepted practice at
other similar facilities. Governing the emissions to atmosphere, however, is the EMA and associated
codes of practice, regulations and guidelines (used as the basis for setting permit limits or for WTE
facilities limits within SWMPs). The regulatory framework in BC currently utilizes the 1991 British
Columbia Criteria for Municipal Solid Waste Incinerators as well as the BC Air Quality Objectives
(last amended in April 2009). Emission guidelines and air quality objectives are non-statutory limits
that are used by the regulatory agencies to guide decisions with respect to allowable concentrations
of air pollutants in the discharge and ambient air.
The current system has been in place for many years and in general is functioning satisfactorily. The
MSW Criteria specify the general conditions for which these facilities must be operated, but it is the
permit or the SWMP that determines the average and maximum permissible point source
concentrations of contaminants that may be discharged. These point source limits are based on the
various guidelines directly for point source emissions, and indirectly for impacts to ambient air quality.
9.3.2 Operational Variability
All industrial processes have some variability. Specifically with WTE combustion technology,
variability is inherent in the process and in the incoming MSW material stream, and the control of the
facility operating conditions is the mandate of the operators so that the emission quality (and other
operational parameters) is met. Operators try to minimize the variability of the process to provide a
higher quality operation, but some variability in the operation and emission quality is certain.
In the combustion sector, particularly for WTE, there is a difference between the absolute minimum
concentrations of emission constituents that will be released from the facility during periods of normal
operating conditions and those greater concentrations that can be „reasonably‟ expected to be
produced during brief periods of operational and/or material stream flux. Well designed, maintained
and operated facilities are able to achieve the lower emission values a large proportion of the time,
generally over 95% of the time, potentially approaching 97% or more. During periods of upset
conditions, however, such as during some upset in combustion or in the treatment works, the
concentration of emissions may increase over a short period of time until the issue is resolved and
normal conditions return. The frequency and magnitude of this variance is facility-specific and is
mitigated to the extent possible by the use of CEMs to constantly monitor operating conditions and in
the design of the facility and air pollution control systems.

Waste to Energy
A Technical Review of Municipal Solid Waste Thermal Treatment Practices
Final Report
Section 9: Emission Limits and Their Application
March 2011
Project No. 1231-10166 9-52
As a result, some jurisdictions have addressed the need to set regulatory emissions limits that reflect
not only BAT but the expectations for performance under both normal and upset conditions, and
monitoring methods, by applying averaging periods for the emissions of various parameters and
expectations on how emissions would be monitored in order to demonstrate compliance.
9.3.3 Setting Emission Limits
The regulator desires to regulate the discharge such that:
a) The emission to atmosphere in all cases does not cause a risk to human health and the
environment.
b) The emission limit imposes an obligation on the operator to achieve the lowest practical
emission concentrations for the maximum period of time.
c) The emission limit is set such that it is achievable by the operator, is reasonable in terms of
cost to meet the limit and meets the protective requirements and is consistent with the
available monitoring equipment and techniques for a specific parameter.
Best Available Control Technology (BACT) refers to the use of equipment, operational practice
and treatment systems to produce an emission that represents the best of technology for the
sector. BACT is always changing because of advancements in technology. There is sufficient
comparable technology in the WTE sector, as evidenced in our report, to establish BACT-based
limits for the WTE sector in BC. In depth studies of BACT for WTE in other jurisdictions undertaken
in part to support the establishment of new regulatory limits, indicate that the quality of air
emissions from this sector have continually improved over the past 20 years ( i.e., lower
concentrations are being realized).[243]
In order to meet the three points above, consideration of a combination of factors, including:
emission quality (concentration and/or mass loading to the environment); variability of the emission
(frequency and magnitude of the variance); and, monitoring/testing technique limitations, is
necessary in the setting of the regulatory limits. Setting a limit too high does not incent the operator
to strive to improve emission quality to meet the “best achievable” quality. Setting a limit too low may
not be consistently achievable by the operator on a time scale consistent with the operation of the
facility. This is the essence of the problem posed with setting limits.
9.3.4 Proposed Approach
The proposed change in regulatory approach suggested as an outcome of the review of WTE
technologies, emissions quality from operating WTE and regulatory approaches in other jurisdictions,
is based on the consideration of emissions parameters considered suitable as an indicator of facility
performance, averaging periods and establishment of monitoring expectations as part of the
specified emission limits. BACT would form the basis for the emission limits, and the averaging
periods for a specific test would relate to the application of the BACT limit.
243 Ministry of Housing, Spatial Planning and the Environment. 2002. Dutch Notes on BAT for the Incineration of Waste
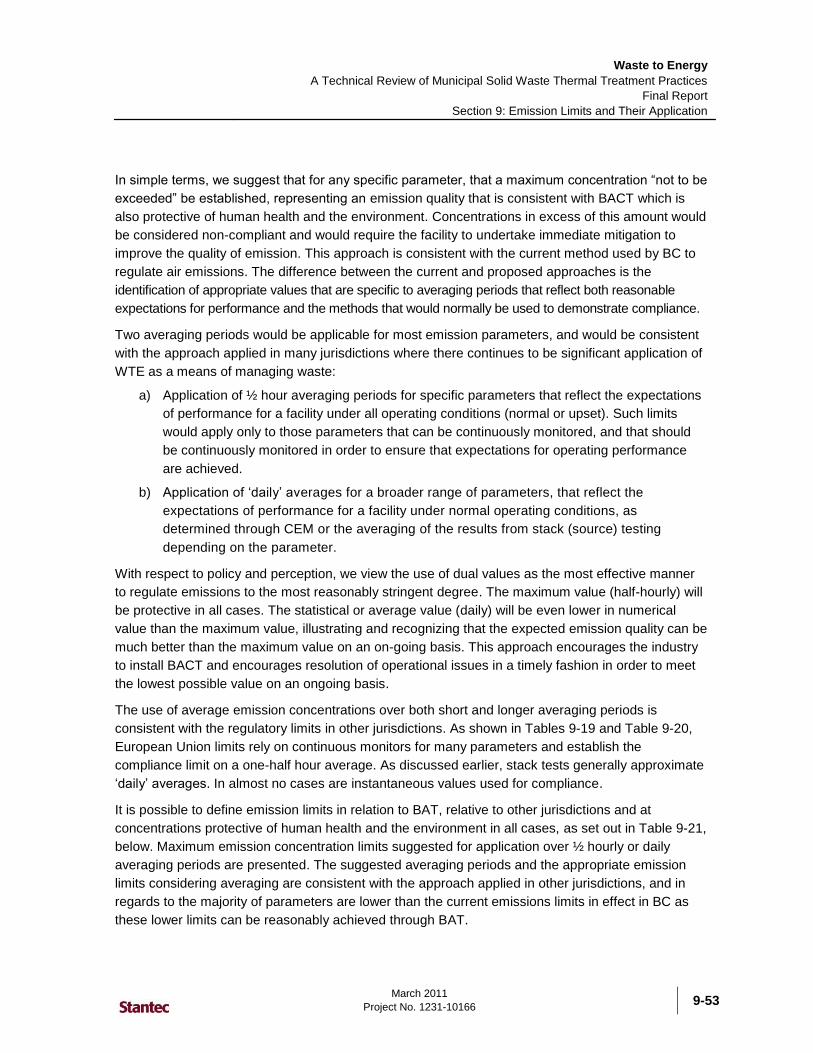
Waste to Energy
A Technical Review of Municipal Solid Waste Thermal Treatment Practices
Final Report
Section 9: Emission Limits and Their Application
March 2011
Project No. 1231-10166
9-53
In simple terms, we suggest that for any specific parameter, that a maximum concentration “not to be
exceeded” be established, representing an emission quality that is consistent with BACT which is
also protective of human health and the environment. Concentrations in excess of this amount would
be considered non-compliant and would require the facility to undertake immediate mitigation to
improve the quality of emission. This approach is consistent with the current method used by BC to
regulate air emissions. The difference between the current and proposed approaches is the
identification of appropriate values that are specific to averaging periods that reflect both reasonable
expectations for performance and the methods that would normally be used to demonstrate compliance.
Two averaging periods would be applicable for most emission parameters, and would be consistent
with the approach applied in many jurisdictions where there continues to be significant application of
WTE as a means of managing waste:
a) Application of ½ hour averaging periods for specific parameters that reflect the expectations
of performance for a facility under all operating conditions (normal or upset). Such limits
would apply only to those parameters that can be continuously monitored, and that should
be continuously monitored in order to ensure that expectations for operating performance
are achieved.
b) Application of „daily‟ averages for a broader range of parameters, that reflect the
expectations of performance for a facility under normal operating conditions, as
determined through CEM or the averaging of the results from stack (source) testing
depending on the parameter.
With respect to policy and perception, we view the use of dual values as the most effective manner
to regulate emissions to the most reasonably stringent degree. The maximum value (half-hourly) will
be protective in all cases. The statistical or average value (daily) will be even lower in numerical
value than the maximum value, illustrating and recognizing that the expected emission quality can be
much better than the maximum value on an on-going basis. This approach encourages the industry
to install BACT and encourages resolution of operational issues in a timely fashion in order to meet
the lowest possible value on an ongoing basis.
The use of average emission concentrations over both short and longer averaging periods is
consistent with the regulatory limits in other jurisdictions. As shown in Tables 9-19 and Table 9-20,
European Union limits rely on continuous monitors for many parameters and establish the
compliance limit on a one-half hour average. As discussed earlier, stack tests generally approximate
„daily‟ averages. In almost no cases are instantaneous values used for compliance.
It is possible to define emission limits in relation to BAT, relative to other jurisdictions and at
concentrations protective of human health and the environment in all cases, as set out in Table 9-21,
below. Maximum emission concentration limits suggested for application over ½ hourly or daily
averaging periods are presented. The suggested averaging periods and the appropriate emission
limits considering averaging are consistent with the approach applied in other jurisdictions, and in
regards to the majority of parameters are lower than the current emissions limits in effect in BC as
these lower limits can be reasonably achieved through BAT.

Waste to Energy
A Technical Review of Municipal Solid Waste Thermal Treatment Practices
Final Report
Section 9: Emission Limits and Their Application
March 2011
Project No. 1231-10166 9-54
The actual value that would be applied to a given WTE facility, through the application to amend a
current permit (e.g., for an upgrade to a current plant) or for a newly proposed facility, would be both
parameter and facility based, and should be linked to the ability to sample and monitor the emission
and specific facility design. On the basis of current practice in the WTE sector, values for guidance
are also provided.
In Table 9-22, where non-continuous measurements are indicated, the averaging period does not
apply. Sampling periods are generally in the order of four to eight hours for such measurements and
the ELV is reflective of the averaging of the replicate tests over the monitoring period.
It should be recognized that there are distinct differences in regulatory approaches used in
jurisdictions where WTE is a common practice. The proposed measures indicated in Table 9-22 are
intended to be generally consistent with the approach that has been applied in BC and reflective of
the BACT approaches adopted in other jurisdictions. That being said, some discussion is required to
reflect some of the key differences in monitoring approaches and the rationale for the choices
recommended for BC.
Organic Matter
During the incineration of organic waste, a large number of chemical reactions take place, some of
which may be incomplete, based on the efficiency of the combustion process. Emissions of organic
parameters depend on the grate and furnace design, and the optimal provision of incineration air,
control of temperature, residence time and the homogeneity of the waste stream. This leads to an
extremely complex set of organic compounds that may be emitted in very trace amounts. A complete
account of every organic substance is usually not available, however, incineration generally can
provide for high destruction efficiencies for organic substances. Various jurisdictions have chosen
alternative approaches to monitoring the destruction efficiency and quality of the combustion
process. Nearly all jurisdictions set limits on CO emissions, as this is a leading indicator of
incomplete combustion, and as a rule CO is usually monitored continuously. However, the point of
the flue gas management process at which CO concentrations is monitored does vary; it is generally
monitored in the „combustion gases‟ within the stack in the EU, and in Ontario and the USA it is
monitored at the outlet of the equipment where combustion of the gas stream is completed.
For the broad range of organic compounds that can be emitted, there is significant variation in
approaches, however in most cases in addition to CO, some form of organic compounds are
required to be monitored and reported. In the EU, total organic carbon (TOC) is monitored and
reported as the primary determinant of the emissions of volatile organic carbon (VOCs) and non-
methane volatile organic carbon (NMVOC) that make up the large part of the compounds that can be
measured continuously as a „group‟. Often the regulatory documents for EU jurisdictions make
various references to monitoring TOC, VOCs, NMVOC, CxHy and organic carbon, but they are all
essentially referring to one group of organic compounds measured and reported as TOC. In many
cases, in addition to TOC, emissions of individual organic parameters or groups such as PCBs
and/or PAHs may be reported, but generally there is no specified ELV for these parameters.
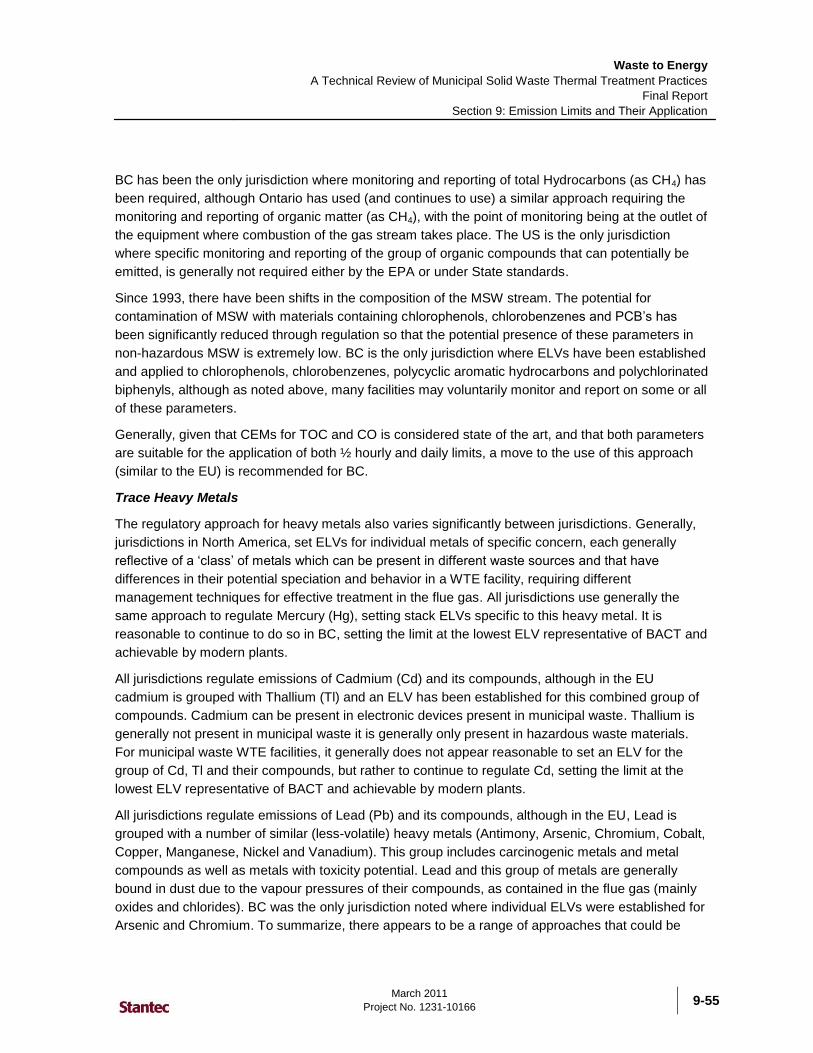
Waste to Energy
A Technical Review of Municipal Solid Waste Thermal Treatment Practices
Final Report
Section 9: Emission Limits and Their Application
March 2011
Project No. 1231-10166
9-55
BC has been the only jurisdiction where monitoring and reporting of total Hydrocarbons (as CH4) has
been required, although Ontario has used (and continues to use) a similar approach requiring the
monitoring and reporting of organic matter (as CH4), with the point of monitoring being at the outlet of
the equipment where combustion of the gas stream takes place. The US is the only jurisdiction
where specific monitoring and reporting of the group of organic compounds that can potentially be
emitted, is generally not required either by the EPA or under State standards.
Since 1993, there have been shifts in the composition of the MSW stream. The potential for
contamination of MSW with materials containing chlorophenols, chlorobenzenes and PCB‟s has
been significantly reduced through regulation so that the potential presence of these parameters in
non-hazardous MSW is extremely low. BC is the only jurisdiction where ELVs have been established
and applied to chlorophenols, chlorobenzenes, polycyclic aromatic hydrocarbons and polychlorinated
biphenyls, although as noted above, many facilities may voluntarily monitor and report on some or all
of these parameters.
Generally, given that CEMs for TOC and CO is considered state of the art, and that both parameters
are suitable for the application of both ½ hourly and daily limits, a move to the use of this approach
(similar to the EU) is recommended for BC.
Trace Heavy Metals
The regulatory approach for heavy metals also varies significantly between jurisdictions. Generally,
jurisdictions in North America, set ELVs for individual metals of specific concern, each generally
reflective of a „class‟ of metals which can be present in different waste sources and that have
differences in their potential speciation and behavior in a WTE facility, requiring different
management techniques for effective treatment in the flue gas. All jurisdictions use generally the
same approach to regulate Mercury (Hg), setting stack ELVs specific to this heavy metal. It is
reasonable to continue to do so in BC, setting the limit at the lowest ELV representative of BACT and
achievable by modern plants.
All jurisdictions regulate emissions of Cadmium (Cd) and its compounds, although in the EU
cadmium is grouped with Thallium (Tl) and an ELV has been established for this combined group of
compounds. Cadmium can be present in electronic devices present in municipal waste. Thallium is
generally not present in municipal waste it is generally only present in hazardous waste materials.
For municipal waste WTE facilities, it generally does not appear reasonable to set an ELV for the
group of Cd, Tl and their compounds, but rather to continue to regulate Cd, setting the limit at the
lowest ELV representative of BACT and achievable by modern plants.
All jurisdictions regulate emissions of Lead (Pb) and its compounds, although in the EU, Lead is
grouped with a number of similar (less-volatile) heavy metals (Antimony, Arsenic, Chromium, Cobalt,
Copper, Manganese, Nickel and Vanadium). This group includes carcinogenic metals and metal
compounds as well as metals with toxicity potential. Lead and this group of metals are generally
bound in dust due to the vapour pressures of their compounds, as contained in the flue gas (mainly
oxides and chlorides). BC was the only jurisdiction noted where individual ELVs were established for
Arsenic and Chromium. To summarize, there appears to be a range of approaches that could be
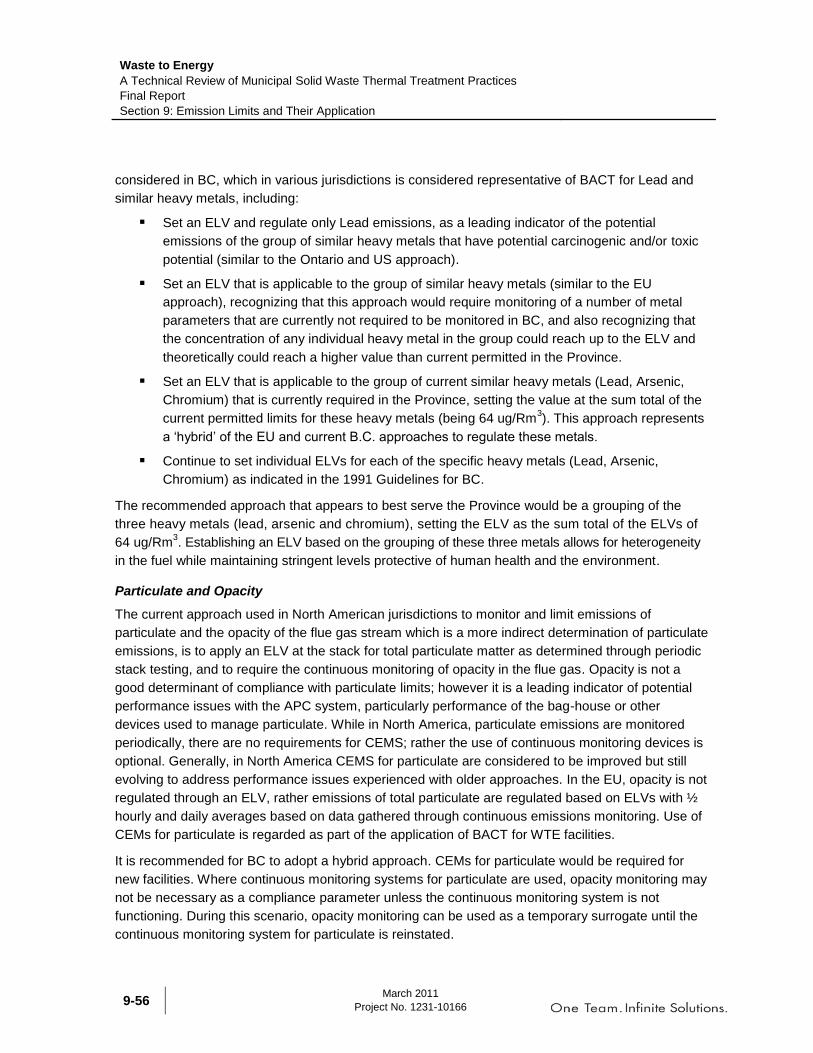
Waste to Energy
A Technical Review of Municipal Solid Waste Thermal Treatment Practices
Final Report
Section 9: Emission Limits and Their Application
March 2011
Project No. 1231-10166 9-56
considered in BC, which in various jurisdictions is considered representative of BACT for Lead and
similar heavy metals, including:
Set an ELV and regulate only Lead emissions, as a leading indicator of the potential
emissions of the group of similar heavy metals that have potential carcinogenic and/or toxic
potential (similar to the Ontario and US approach).
Set an ELV that is applicable to the group of similar heavy metals (similar to the EU
approach), recognizing that this approach would require monitoring of a number of metal
parameters that are currently not required to be monitored in BC, and also recognizing that
the concentration of any individual heavy metal in the group could reach up to the ELV and
theoretically could reach a higher value than current permitted in the Province.
Set an ELV that is applicable to the group of current similar heavy metals (Lead, Arsenic,
Chromium) that is currently required in the Province, setting the value at the sum total of the
current permitted limits for these heavy metals (being 64 ug/Rm3). This approach represents
a „hybrid‟ of the EU and current B.C. approaches to regulate these metals.
Continue to set individual ELVs for each of the specific heavy metals (Lead, Arsenic,
Chromium) as indicated in the 1991 Guidelines for BC.
The recommended approach that appears to best serve the Province would be a grouping of the
three heavy metals (lead, arsenic and chromium), setting the ELV as the sum total of the ELVs of
64 ug/Rm3. Establishing an ELV based on the grouping of these three metals allows for heterogeneity
in the fuel while maintaining stringent levels protective of human health and the environment.
Particulate and Opacity
The current approach used in North American jurisdictions to monitor and limit emissions of
particulate and the opacity of the flue gas stream which is a more indirect determination of particulate
emissions, is to apply an ELV at the stack for total particulate matter as determined through periodic
stack testing, and to require the continuous monitoring of opacity in the flue gas. Opacity is not a
good determinant of compliance with particulate limits; however it is a leading indicator of potential
performance issues with the APC system, particularly performance of the bag-house or other
devices used to manage particulate. While in North America, particulate emissions are monitored
periodically, there are no requirements for CEMS; rather the use of continuous monitoring devices is
optional. Generally, in North America CEMS for particulate are considered to be improved but still
evolving to address performance issues experienced with older approaches. In the EU, opacity is not
regulated through an ELV, rather emissions of total particulate are regulated based on ELVs with ½
hourly and daily averages based on data gathered through continuous emissions monitoring. Use of
CEMs for particulate is regarded as part of the application of BACT for WTE facilities.
It is recommended for BC to adopt a hybrid approach. CEMs for particulate would be required for
new facilities. Where continuous monitoring systems for particulate are used, opacity monitoring may
not be necessary as a compliance parameter unless the continuous monitoring system is not
functioning. During this scenario, opacity monitoring can be used as a temporary surrogate until the
continuous monitoring system for particulate is reinstated.
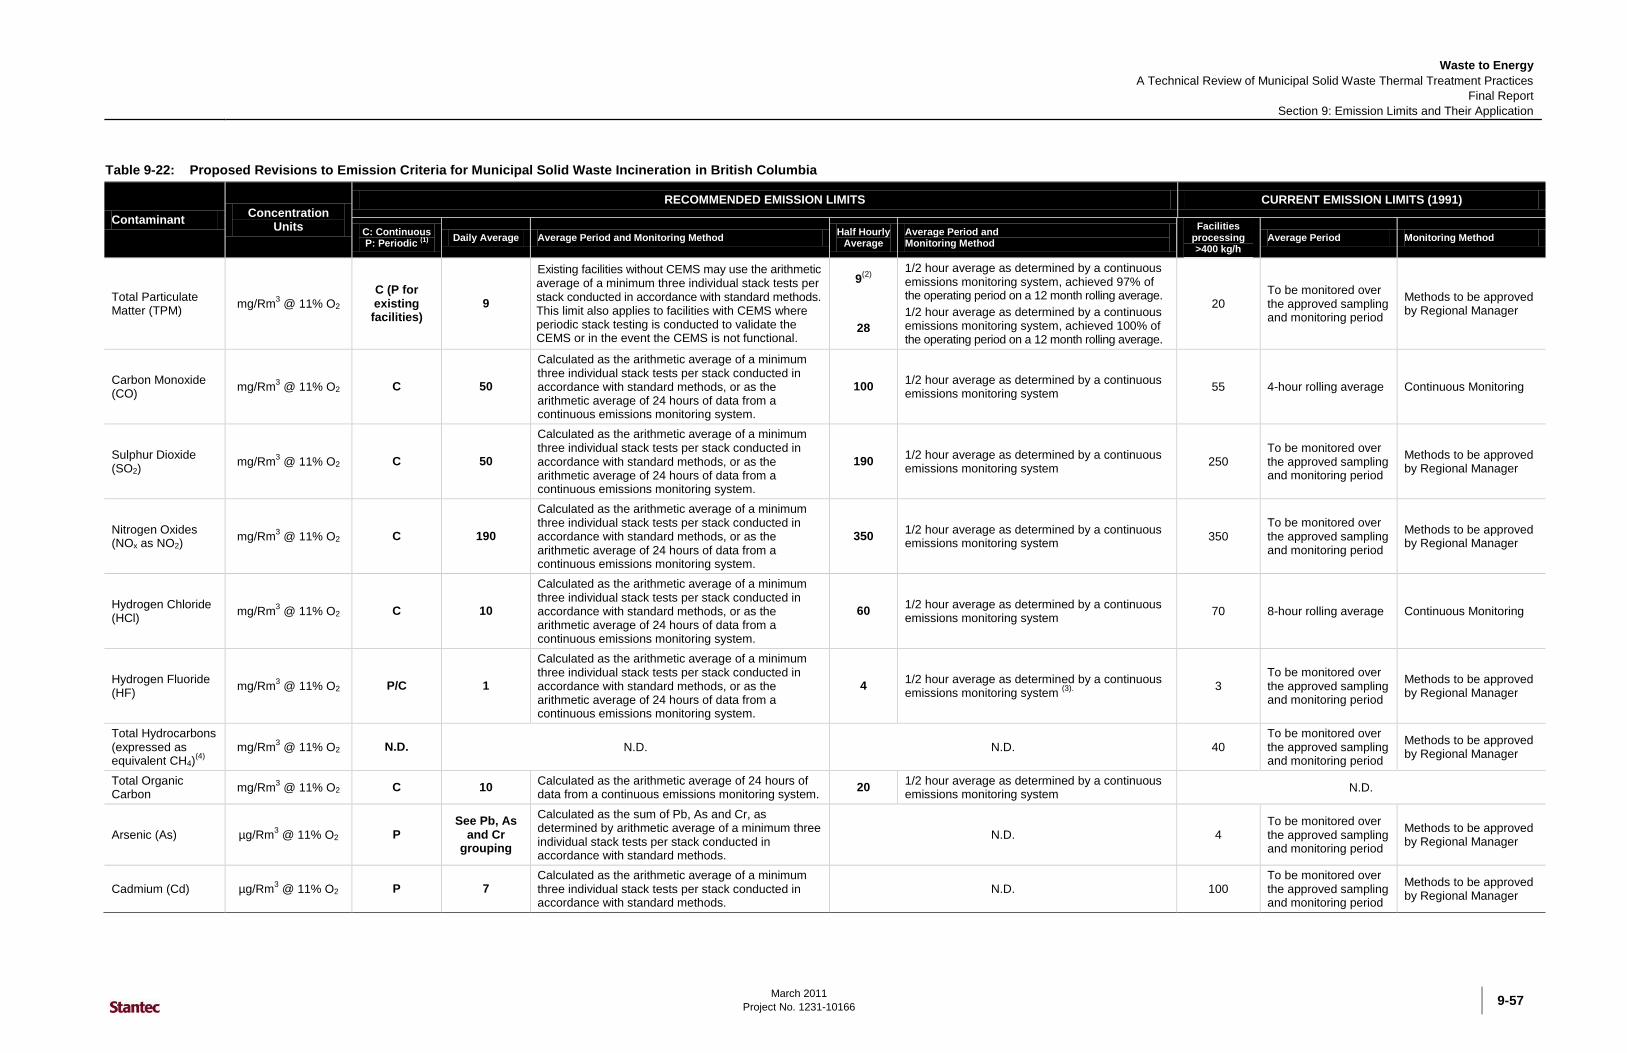
Waste to Energy
A Technical Review of Municipal Solid Waste Thermal Treatment Practices
Final Report
Section 9: Emission Limits and Their Application
March 2011
Project No. 1231-10166
9-57
Table 9-22: Proposed Revisions to Emission Criteria for Municipal Solid Waste Incineration in British Columbia
Contaminant Concentration
Units
RECOMMENDED EMISSION LIMITS CURRENT EMISSION LIMITS (1991)
C: Continuous P: Periodic (1)
Daily Average Average Period and Monitoring Method Half Hourly
Average Average Period and Monitoring Method
Facilities processing >400 kg/h
Average Period Monitoring Method
Total Particulate Matter (TPM)
mg/Rm3 @ 11% O2
C (P for existing facilities)
9
Existing facilities without CEMS may use the arithmetic average of a minimum three individual stack tests per stack conducted in accordance with standard methods. This limit also applies to facilities with CEMS where periodic stack testing is conducted to validate the CEMS or in the event the CEMS is not functional.
9(2)
28
1/2 hour average as determined by a continuous emissions monitoring system, achieved 97% of the operating period on a 12 month rolling average.
1/2 hour average as determined by a continuous emissions monitoring system, achieved 100% of the operating period on a 12 month rolling average.
20 To be monitored over the approved sampling and monitoring period
Methods to be approved by Regional Manager
Carbon Monoxide (CO)
mg/Rm3 @ 11% O2 C 50
Calculated as the arithmetic average of a minimum three individual stack tests per stack conducted in accordance with standard methods, or as the arithmetic average of 24 hours of data from a continuous emissions monitoring system.
100 1/2 hour average as determined by a continuous emissions monitoring system
55 4-hour rolling average Continuous Monitoring
Sulphur Dioxide (SO2)
mg/Rm3 @ 11% O2 C 50
Calculated as the arithmetic average of a minimum three individual stack tests per stack conducted in accordance with standard methods, or as the arithmetic average of 24 hours of data from a continuous emissions monitoring system.
190 1/2 hour average as determined by a continuous emissions monitoring system
250 To be monitored over the approved sampling and monitoring period
Methods to be approved by Regional Manager
Nitrogen Oxides (NOx as NO2)
mg/Rm3 @ 11% O2 C 190
Calculated as the arithmetic average of a minimum three individual stack tests per stack conducted in accordance with standard methods, or as the arithmetic average of 24 hours of data from a continuous emissions monitoring system.
350 1/2 hour average as determined by a continuous emissions monitoring system
350 To be monitored over the approved sampling and monitoring period
Methods to be approved by Regional Manager
Hydrogen Chloride (HCl)
mg/Rm3 @ 11% O2 C 10
Calculated as the arithmetic average of a minimum three individual stack tests per stack conducted in accordance with standard methods, or as the arithmetic average of 24 hours of data from a continuous emissions monitoring system.
60 1/2 hour average as determined by a continuous emissions monitoring system
70 8-hour rolling average Continuous Monitoring
Hydrogen Fluoride (HF)
mg/Rm3 @ 11% O2 P/C 1
Calculated as the arithmetic average of a minimum three individual stack tests per stack conducted in accordance with standard methods, or as the arithmetic average of 24 hours of data from a continuous emissions monitoring system.
4 1/2 hour average as determined by a continuous emissions monitoring system
(3).
3 To be monitored over the approved sampling and monitoring period
Methods to be approved by Regional Manager
Total Hydrocarbons (expressed as equivalent CH4)
(4)
mg/Rm3 @ 11% O2 N.D. N.D. N.D. 40
To be monitored over the approved sampling and monitoring period
Methods to be approved by Regional Manager
Total Organic Carbon
mg/Rm3 @ 11% O2 C 10
Calculated as the arithmetic average of 24 hours of data from a continuous emissions monitoring system.
20 1/2 hour average as determined by a continuous emissions monitoring system
N.D.
Arsenic (As) µg/Rm3 @ 11% O2 P
See Pb, As and Cr
grouping
Calculated as the sum of Pb, As and Cr, as determined by arithmetic average of a minimum three individual stack tests per stack conducted in accordance with standard methods.
N.D. 4 To be monitored over the approved sampling and monitoring period
Methods to be approved by Regional Manager
Cadmium (Cd) µg/Rm3 @ 11% O2 P 7
Calculated as the arithmetic average of a minimum three individual stack tests per stack conducted in accordance with standard methods.
N.D. 100 To be monitored over the approved sampling and monitoring period
Methods to be approved by Regional Manager

Waste to Energy
A Technical Review of Municipal Solid Waste Thermal Treatment Practices
Final Report
Section 9: Emission Limits and Their Application
March 2011
Project No. 1231-10166 9-58
Contaminant Concentration
Units
RECOMMENDED EMISSION LIMITS CURRENT EMISSION LIMITS (1991)
C: Continuous P: Periodic (1)
Daily Average Average Period and Monitoring Method Half Hourly
Average Average Period and Monitoring Method
Facilities processing >400 kg/h
Average Period Monitoring Method
Chromium (Cr) µg/Rm3 @ 11% O2 P
See Pb, As and Cr
grouping
Calculated as the sum of Pb, As and Cr, as determined by arithmetic average of a minimum three individual stack tests per stack conducted in accordance with standard methods.
N.D. 10 To be monitored over the approved sampling and monitoring period
Methods to be approved by Regional Manager
Lead (Pb) µg/Rm3 @ 11% O2 P
See Pb, As and Cr
grouping
Calculated as the sum of Pb, As and Cr, as determined by arithmetic average of a minimum three individual stack tests per stack conducted in accordance with standard methods.
N.D. 50 To be monitored over the approved sampling and monitoring period
Methods to be approved by Regional Manager
Sum of Lead (Pb), Arsenic (As), Chromium (Cr)
µg/Rm3 @ 11% O2 P 64
Calculated as the sum of Pb, As and Cr, as determined by arithmetic average of a minimum three individual stack tests per stack conducted in accordance with standard methods.
N.D. 50 To be monitored over the approved sampling and monitoring period
Methods to be approved by Regional Manager
Mercury (Hg) µg/Rm3 @ 11% O2 P or C
(4) 20
Calculated as the arithmetic average of a minimum three individual stack tests per stack conducted in accordance with standard methods, or as the arithmetic average of 24 hours of data from a continuous emissions monitoring system.
N.D. 200 To be monitored over the approved sampling and monitoring period
Methods to be approved by Regional Manager
Chlorophenols (5)
µg/Rm3 @ 11% O2 P 1
Calculated as the arithmetic average of a minimum three individual stack tests per stack conducted in accordance with standard methods.
N.D. 1 To be monitored over the approved sampling and monitoring period
Methods to be approved by Regional Manager
Chlorobenzenes (5)
µg/Rm3 @ 11% O2 P 1
Calculated as the arithmetic average of a minimum three individual stack tests per stack conducted in accordance with standard methods.
N.D. 1 To be monitored over the approved sampling and monitoring period
Methods to be approved by Regional Manager
Polycyclicaromatic Hydrocarbons
(5)
µg/Rm3 @ 11% O2 P 5
Calculated as the arithmetic average of a minimum three individual stack tests per stack conducted in accordance with standard methods.
N.D. 5 To be monitored over the approved sampling and monitoring period
Methods to be approved by Regional Manager
Polychlorinated Biphenyls
(5)
µg/Rm3 @ 11% O2 P 1
Calculated as the arithmetic average of a minimum three individual stack tests per stack conducted in accordance with standard methods.
N.D. 1 To be monitored over the approved sampling and monitoring period
Methods to be approved by Regional Manager
Total Dioxins and Furans (as PCDD/F TEQ)
ng/Rm3 @ 11% O2 P 0.08
Calculated as the arithmetic average of a minimum three individual stack tests per stack conducted in accordance with standard methods.
N.D. 0.5 To be monitored over the approved sampling and monitoring period
Methods to be approved by Regional Manager
Opacity(6)
%
C (P optional for existing facilities)
N.D. 5 1/2-hour average from data taken every 10 seconds, measured by a CEMS
5 1-hour average from data taken every 10 seconds
Continuous Monitoring
NOTES:
Concentration units: Mass per reference cubic metres corrected to 11% oxygen. Reference conditions: 20oC, 101.3 kPa, dry gas
N.D. = Not Defined (1)
Where Periodic stack test measurements (P) are indicated, the daily averaging period applies. For Continuous monitoring (C), the 1/2 hour averaging period applies. P/C indicates both technologies are available; ELV will be linked to sampling method. (2)
97% of the half-hour average values over an annual rolling average will not exceed 9 mg/Rm3. 100% of the half-hour average values will not exceed 28 mg/Rm
3.
(3) This requirement may be omitted at the discretion of the Regional Manager should treatment stages for HCl demonstrate that the ELV for HCl is not exceeded.
(4) Daily Average ELV for mercury applies regardless of monitoring method.
(5) Proponents may be able to demonstrate that monitoring both Total Organic Carbon (TOC) and Total Dioxin and Furans could negate the need to monitor Chlorophenols, Chlorobenzenes, Polycyclic Aromatic Hydrocarbons and Polychlorinated Biphenyls.
(6) Opacity will not be required for compliance purposes for facilities utilizing continuous particulate monitoring systems. Opacity monitoring is recommended for operational monitoring purposes. However, monitoring opacity can be used as a temporary surrogate for total particulate monitoring in the event a particulate monitoring system failure. Under these circumstances, the ELV of 5% opacity over a 1/2 hour averaging period should apply.

Waste to Energy
A Technical Review of Municipal Solid Waste Thermal Treatment Practices
Final Report
Section 9: Emission Limits and Their Application
March 2011
Project No. 1231-10166
9-59
Table 9-23 summarizes the rationale for recommended values for the ½ hourly or daily averaging
periods as set out in Table 9-22.
Table 9-23: Rationale for Recommended Values for the ½ Hourly or Daily Averaging Periods
Parameter Rationale for Daily Average Rationale for ½ Hourly Average
TPM The 1991 BC Criteria limit is 20 mg/Rm3 on a
daily basis with compliance based on manual stack testing.
The new proposed limit would be 10 mg/Rm3
on a daily basis using a CEM system. This is similar to the EU standard and is stricter than the EPA and Ontario standards.
The 1991 BC criteria limit is 20 mg/Rm3
with compliance based on manual stack testing, which typically occurs quarterly each year. The proposed limits are consistent with the EU ½ hourly averages which are coupled to CEM monitoring. Thus, compliance is determined every half hour.
The limit of 9 mg/Rm3 is based on ½ hour
averages throughout the year, to be achieved 97% of the time, as an annual rolling average. During rare occasions when upsets in the process or treatment systems cause the 9 mg/Rm
3 limit to be
exceeded the upper limit of 28 mg/Rm3 is
never to be exceeded. Thus, even when emission control systems require service, the 28 mg/Rm
3 limit would remain in effect.
Comparing the 1991 and proposed emission limits for particulate is difficult because they are monitored in completely different ways. The use of a CEM ensures that emissions are maintained at low levels on a consistent basis, whereas limits based on manual stack sampling do not have such assurance. That said, it is reasonable to suggest that a course comparison of the 20 mg/m
3 limit to the proposed limit of 9
mg/Rm3 is a reasonable benchmark
comparison. Thus, the new proposed limit is considerably more stringent than the one set in 1991.
CO The 1991 BC Criteria limit is 55 mg/Rm3 on a
daily basis with compliance based on a CEM system.
The new proposed limit would be 50 mg/Rm3
on a daily basis using a CEM system. This is similar to the Ontario, EPA and EU standards.
The 1991 BC Criteria limit is 55mg/Rm3 on
a daily basis with compliance based on a CEM system.
There would also be a new proposed limit of 100 mg/Rm
3 on a ½ hourly basis using a
CEM system. This would provide a stricter control on maximum allowable emissions. This is similar to the EU standard.
SO2 The 1991 BC Criteria limit is 250 mg/Rm3 on
a daily basis with compliance based on a CEM system.
The new proposed limit would be 50 mg/Rm3
on a daily basis using a CEM system. This is similar to the Ontario, EPA, and EU standards.
The 1991 BC Criteria limit is 250 mg/Rm3
on a daily basis with compliance based on a CEM system.
There would also be a new proposed limit of 190 mg/Rm
3 on a ½ hourly basis using a
CEM system. This would provide a stricter control on maximum allowable emissions. This is similar to the EU standard.

Waste to Energy
A Technical Review of Municipal Solid Waste Thermal Treatment Practices
Final Report
Section 9: Emission Limits and Their Application
March 2011
Project No. 1231-10166 9-60
Parameter Rationale for Daily Average Rationale for ½ Hourly Average
NOx as NO2 The 1991 BC Criteria limit is 350 mg/Rm3 on
a daily basis with compliance based on a CEM system.
The new proposed limit would be 190 mg/Rm
3 on a daily basis using a CEM
system. This is stricter than the Ontario and EPA standards and similar to the EU standard.
The 1991 BC Criteria limit is 350 mg/Rm3
on a daily basis with compliance based on a CEM system.
There would also be a new proposed limit of 350 mg/Rm
3 on a ½ hourly basis using a
CEM system. This would provide a stricter control on maximum allowable emissions. This is stricter than the EU standard.
HCl The 1991 BC Criteria limit is 70 mg/Rm3 on a
daily basis with compliance based on manual stack testing.
The new proposed limit would be 10 mg/Rm3
on a daily basis using a CEM system. This is stricter than the Ontario and EPA standards and similar to the EU standard.
The 1991 BC Criteria limit is 70 mg/Rm3 on
a daily basis with compliance based on manual stack testing.
There would also be a new proposed limit of 60 mg/Rm
3 on a ½ hourly basis using a
CEM system. This would provide a stricter control on maximum allowable emissions. This is similar to the EU standard.
HF The 1991 BC Criteria limit is 3 mg/Rm3 on a
daily basis with compliance based on manual stack testing.
The new proposed limit would be 1 mg/Rm3
on a daily basis using a CEM system. This is similar to the EU standard.
The 1991 BC Criteria limit is 3 mg/Rm3 on
a daily basis with compliance based on manual stack testing.
There would also be a new proposed limit of 4 mg/Rm
3 on a ½ hourly basis using a
CEM system. This would provide a stricter control on maximum allowable emissions. This is similar to the EU standard.
Organic Matter as CH4
NA – the parameters, organic matter, total hydrocarbons, and TOC are all primarily indicators of combustion efficiency although they may be monitored at different points of the process. A stack emission limit is not recommended for Organic Matter as the most appropriate monitoring point is at the outlet of the point of the process where combustion of the gas stream is completed. A stack emission limit is only being recommended for TOC.
NA – no value proposed. While regulation of emissions of organic matter at the outlet of the equipment where combustion of the gas stream takes place is a means of monitoring combustion efficiency, monitoring of TOC as discussed below can be accomplished through the use of CEMs and is consistent with BACT in the EU.
Total Hydrocarbons (as CH4)
NA – see organic matter rationale – no value proposed. The 1991 BC Criteria limit is 40 mg/Rm3 on a daily basis with compliance based on manual stack testing.
A regulatory limit for hydrocarbons is best addressed through limits on Volatile Organic Compounds (see VOCs below).
NA – no value proposed. A regulatory limit for hydrocarbons is best addressed through limits on Volatile Organic Compounds (see VOCs below).
TOC Consistent (rounded) with EU daily average. Consistent (rounded) with EU ½ hourly values achieved 100% of the time.

Waste to Energy
A Technical Review of Municipal Solid Waste Thermal Treatment Practices
Final Report
Section 9: Emission Limits and Their Application
March 2011
Project No. 1231-10166
9-61
Parameter Rationale for Daily Average Rationale for ½ Hourly Average
As The 1991 BC Criteria limit is 0.004 mg/Rm3
with compliance based on manual stack testing.
The new proposed limit would be on a class basis for As/Cr/Pb which exhibit similar properties, the limit would be set at 0.064 mg/Rm
3. This approach is similar to EU
standard (EU class basis includes Sb, As, Pb, Cr, Co, Cu, Mn, Ni, and V); no other jurisdictions have set a standard for arsenic.
NA
Cd The 1991 BC Criteria limit is 0. 1 mg/Rm3
with compliance based on manual stack testing.
New proposed limit would be 0.014 mg/Rm3
which is the same as the Ontario standard. This limit is stricter than the EPA standard; the EU sets a combined limit for cadmium and thallium.
NA
Cr The 1991 BC Criteria limit is 0.01 mg/Rm3
with compliance based on manual stack testing.
The new proposed limit would be class basis for As/Cr/Pb which exhibit similar properties, the limit would be set at 0.064 mg/Rm
3. This
approach is similar to EU standard (EU class basis includes Sb, As, Pb, Cr, Co, Cu, Mn, Ni, and V); no other jurisdictions have set a standard for chromium.
NA
Pb The 1991 BC Criteria limit is 0.05 mg/Rm3
with compliance based on manual stack testing.
The new proposed limit would be class basis for As/Cr/Pb which exhibit similar properties, the limit would be set at 0.064 mg/Rm
3. This
approach is similar to EU standard (EU class basis includes Sb, As, Pb, Cr, Co, Cu, Mn, Ni, and V); Ontario is the only other jurisdiction to set a proposed limit for lead this limit has yet to be included in a final authorization.
NA
Mercury The 1991 BC Criteria limit is 0.2 mg/Rm3
with compliance based on manual stack testing.
New proposed limit would be 0.02 mg/Rm3 is
consistent with the CCME Canada Wide Standard and Ontario standard. The proposed limit is stricter than the EPA and EU standards.
NA
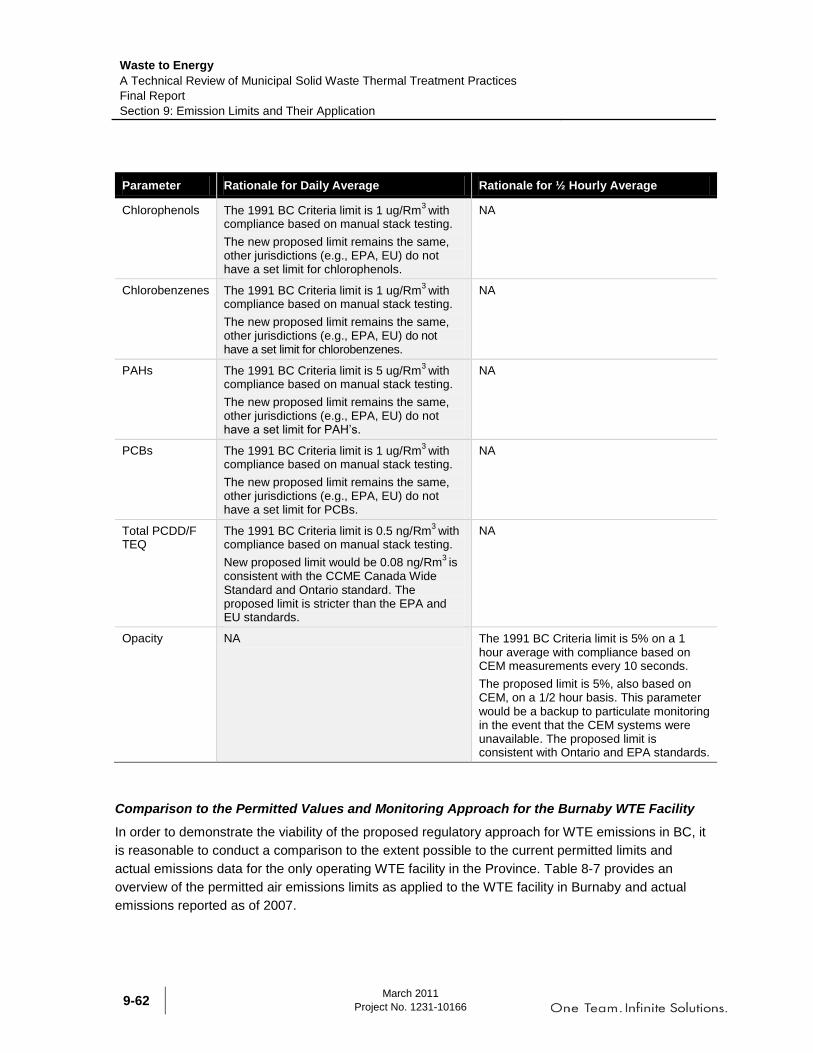
Waste to Energy
A Technical Review of Municipal Solid Waste Thermal Treatment Practices
Final Report
Section 9: Emission Limits and Their Application
March 2011
Project No. 1231-10166 9-62
Parameter Rationale for Daily Average Rationale for ½ Hourly Average
Chlorophenols The 1991 BC Criteria limit is 1 ug/Rm3
with compliance based on manual stack testing.
The new proposed limit remains the same, other jurisdictions (e.g., EPA, EU) do not have a set limit for chlorophenols.
NA
Chlorobenzenes The 1991 BC Criteria limit is 1 ug/Rm3
with compliance based on manual stack testing.
The new proposed limit remains the same, other jurisdictions (e.g., EPA, EU) do not have a set limit for chlorobenzenes.
NA
PAHs The 1991 BC Criteria limit is 5 ug/Rm3
with compliance based on manual stack testing.
The new proposed limit remains the same, other jurisdictions (e.g., EPA, EU) do not have a set limit for PAH‟s.
NA
PCBs The 1991 BC Criteria limit is 1 ug/Rm3
with compliance based on manual stack testing.
The new proposed limit remains the same, other jurisdictions (e.g., EPA, EU) do not have a set limit for PCBs.
NA
Total PCDD/F TEQ
The 1991 BC Criteria limit is 0.5 ng/Rm3
with compliance based on manual stack testing.
New proposed limit would be 0.08 ng/Rm3 is
consistent with the CCME Canada Wide Standard and Ontario standard. The proposed limit is stricter than the EPA and EU standards.
NA
Opacity NA The 1991 BC Criteria limit is 5% on a 1 hour average with compliance based on CEM measurements every 10 seconds.
The proposed limit is 5%, also based on CEM, on a 1/2 hour basis. This parameter would be a backup to particulate monitoring in the event that the CEM systems were unavailable. The proposed limit is consistent with Ontario and EPA standards.
Comparison to the Permitted Values and Monitoring Approach for the Burnaby WTE Facility
In order to demonstrate the viability of the proposed regulatory approach for WTE emissions in BC, it
is reasonable to conduct a comparison to the extent possible to the current permitted limits and
actual emissions data for the only operating WTE facility in the Province. Table 8-7 provides an
overview of the permitted air emissions limits as applied to the WTE facility in Burnaby and actual
emissions reported as of 2007.

Waste to Energy
A Technical Review of Municipal Solid Waste Thermal Treatment Practices
Final Report
Section 9: Emission Limits and Their Application
March 2011
Project No. 1231-10166
9-63
Note: as a point of interest, application of the MACT approach as used in the USA, results in the
setting of regulatory emissions limits based on the emissions from the top percentage of existing
facilities. This approach could not be easily used in BC given that there is currently only one
operating plant. However, comparison of the emissions from the Burnaby plant to the proposed
emissions limits is reasonable.
Note, that the proposed ½ hour and 24 hour emissions limits are not directly comparable to the
current permits and performance of the Burnaby WTE facility. The permitted discharge limits for the
Burnaby plant are generally applied as a „not to exceed‟ limit which is closer the proposed ½ hour
limits for emissions (to be achieved 100% of the time). There are no comparable equivalents using
the data provided in Table 8-7 to the proposed 24 hour limits, additional information regarding
current emissions as measured by CEMS is required for comparison.
Comparing the permitted and actual values with the suggested ½ hourly averages for application in
BC indicates that:
The proposed ½ hourly limits are generally comparable to the discharge limits set out in the
current permit, and are generally comparable to the ½ hour averages for the key parameters
that are normally monitored by CEMS (acid gases, NOx and CO). Actual 2007 emissions
information indicates that the proposed ½ hourly limits can be achieved.
It is uncertain based on the available data if, the proposed daily averages will be able to be
achieved. Further discussion and review is needed to determine the particulars in this case,
and to examine the differences in the design of this facility and waste stream managed,
versus that of BAT facilities permitted in other jurisdictions.
In regards to the current monitoring requirements and averaging periods applied to the Burnaby
incinerator, the recommended approach does diverge from that currently in place for the facility for
some parameters as summarized in Table 9-24.
Table 9-24: Comparison of Actual and Proposed Daily and ½ Hourly Monitoring Requirements for the Burnaby Incinerator
Parameter Comparison to Proposed Daily Average Requirements
Comparison to proposed ½ Hourly Average Requirements
TPM Consistent with current approach based on annual stack testing methods approved by the Regional Manager.
New requirement for CEM with new lower ½ hourly average achieved 97% of the time over an operating year.
CO New requirement. Current limit applied over 4-hour rolling average of CEM. Reporting based on ½ hourly averages would be new.
SO2 Consistent with current approach based on annual stack testing methods approved by the Regional Manager.
New requirement. Would require CEM.
NOx as NO2 Consistent with current approach which requires reporting based on 24-average of CEM.
New requirement.

Waste to Energy
A Technical Review of Municipal Solid Waste Thermal Treatment Practices
Final Report
Section 9: Emission Limits and Their Application
March 2011
Project No. 1231-10166 9-64
Parameter Comparison to Proposed Daily Average Requirements
Comparison to proposed ½ Hourly Average Requirements
HCl Consistent with current approach which requires reporting based on 24-average of CEM.
New requirement.
HF Consistent with current approach based on annual stack testing methods approved by the Regional Manager.
New requirement. Would require CEM. May be omitted should treatment stages for HCl demonstrate that the ELV for HCl is not exceeded.
Organic Matter as CH4
NA NA
TOC New requirement. New requirement. Would require CEM.
As Consistent with current approach based on annual stack testing methods approved by the Regional Manager.
NA
Cd Consistent with current approach based on annual stack testing methods approved by the Regional Manager.
NA
Cr Consistent with current approach based on annual stack testing methods approved by the Regional Manager.
NA
Pb Consistent with current approach based on annual stack testing methods approved by the Regional Manager.
NA
Mercury Consistent with current approach based on annual stack testing methods approved by the Regional Manager.
NA
Chlorophenols Consistent with current approach based on annual stack testing methods approved by the Regional Manager.
NA
Chlorobenzenes Consistent with current approach based on annual stack testing methods approved by the Regional Manager.
NA
PAHs Consistent with current approach based on annual stack testing methods approved by the Regional Manager.
NA
PCBs Consistent with current approach based on annual stack testing methods approved by the Regional Manager.
NA
Total PCDD/F TEQ
Consistent with current approach based on annual stack testing methods approved by the Regional Manager.
NA
Opacity NA Consistent with current approach, CEM used to determine average over ½ hour averaging period.

Waste to Energy
A Technical Review of Municipal Solid Waste Thermal Treatment Practices
Final Report
Section 9: Emission Limits and Their Application
March 2011
Project No. 1231-10166
9-65
Comparison to the Proposed Amendments to the ELVs for the Gold River Power Facility
It is also reasonable to conduct a comparison to the proposed permitted limits for the only other
permitted WTE facility in the Province. The proposed amendments to the existing permit for this
facility include suggested 1 hr and 24 hour limits for a number of parameters, and thus exhibit
greater alignment with the proposed ½ hour and 24 hour emissions limits. Comparing the proposed
values for the Gold River facility with the suggested ½ hourly and 24 hour averages for application in
BC indicates that:
The proposed ELV for total particulate matter for the Gold River plant of 15 is higher in value
than the proposed ½ hourly limit. However, the proposed ELV appears like it would have to
be achieved 100% of the time over the operating year, in comparison with the proposed
value that would have to be achieved 97% of the time over the operating year. The
proponent has also proposed ELVs for particulate less than 10 µm and less than 2.5 µm;
however, the proposed limits in both cases are above the proposed daily and ½ hour
averages for TPM in the proposed provincial limits.
The proposed ELV for CO is higher than the daily average proposed for the province but
less than the proposed ½ hour limit.
The proposed ELV for SO2 is just a little less than the daily average proposed for the
province and is less than the proposed ½ hour limit.
Hourly and daily averages are proposed for NOx, HCl and HF emissions, with the proposed
ELVs being somewhat less than the proposed ½ hourly and daily averages proposed for the
province, with the exception of the daily average for HCl which is over twice the proposed
provincial value. Follow-up would be required to determine why the proposed facility may not
be able to meet the 10 mg/Rm3 daily average limit.
Proposed Gold River ELVs for trace heavy metals are in all cases equal to or less than the
existing values for BC, and would be in general there should be no issue in meeting the
proposed daily average values for the individual and grouped metals.
Proposed Gold River ELVs for the range of organic parameters are in most cases equal to or
less than the proposed daily averages for BC, with the exception of dioxins and furans where
the proposed ELV is slightly higher than the proposed daily average for the province.
Generally it would appear that the proposed revisions to the emissions criteria for MSW incineration
in BC would be consistent with the proposed approach for the new Gold River Power WTE facility,
however, some modifications may be necessary for the ELVs for a few parameters.

Waste to Energy
A Technical Review of Municipal Solid Waste Thermal Treatment Practices
Final Report
Section 9: Emission Limits and Their Application
March 2011
Project No. 1231-10166 9-66
THIS PAGE INTENTIONALLY LEFT BLANK.
Waste to Energy
A Technical Review of Municipal Solid Waste Thermal Treatment Practices
Final Report
Section 10: Management of WTE Residues
March 2011
Project No. 1231-10166
10-1
10 MANAGEMENT OF WTE RESIDUES
By using thermal treatment (mass burn incineration or alternative approaches) to manage municipal
solid waste, a large reduction in the original volume and mass of the waste is achieved.
Conventional mass burn combustion results in the production of solid residuals which need to be
managed in an appropriate manner. Conventional WTE combustion residues include:
Bottom Ash – composed of post-combustion solid waste including the ash, non-combustible
residuals (such as metal, rock, concrete, some types of glass) and potentially residuals of
incomplete combustion (carbon)
Fly Ash – composed of particulate matter produced by waste incineration in the combustion
chamber and removed from the emission stream by the air pollution control (APC) system.
Dry particulate control systems such as baghouses and electrostatic precipitators collect fly
ash which can be managed as a dry solid waste
APC residues – composed of spent or waste by-products from the APC system, such as
reagents used in acid gas scrubbing (typically lime), activated carbon (used in dioxin/furan and
heavy metal removal) and scrubber sludge (if a wet acid gas control system is used). APC
residues typically include the fly ash the APC system has removed and may be dry solid
waste or contain some moisture from semi-dry or wet APC systems.
Historically, fly ash was collected separately from APC residues but in most modern WTE facilities, it is
collected and mixed together with APC residues. These are both referred to collectively as APC residues
in the remainder of this section.
This subsection of the report discusses the regulatory framework governing incinerator residue
management in Europe and North America and the current and emerging management strategies
being used worldwide to manage bottom ash and APC residues. First, however, the typical
composition (and the factors affecting the composition) of bottom ash and APC residues are
discussed in order to better understand each residue stream.
10.1 Composition of Residues The following subsections discuss the typical composition of bottom ash and APC residues from
municipal solid waste mass burn facilities, and the composition of residues from gasification facilities.
10.1.1 Bottom Ash
Bottom ash is the mineral material left after the combustion of the waste. Bottom ash from a MSW
incineration facility is a heterogeneous mixture of slag, metals, ceramics, glass, unburned organic
matter and other non-combustible inorganic materials. Bottom ash consists mainly of silicates, oxides
and carbonates. Typically, bottom ash makes up approximately 20 – 25% by weight or 5 to 10% by
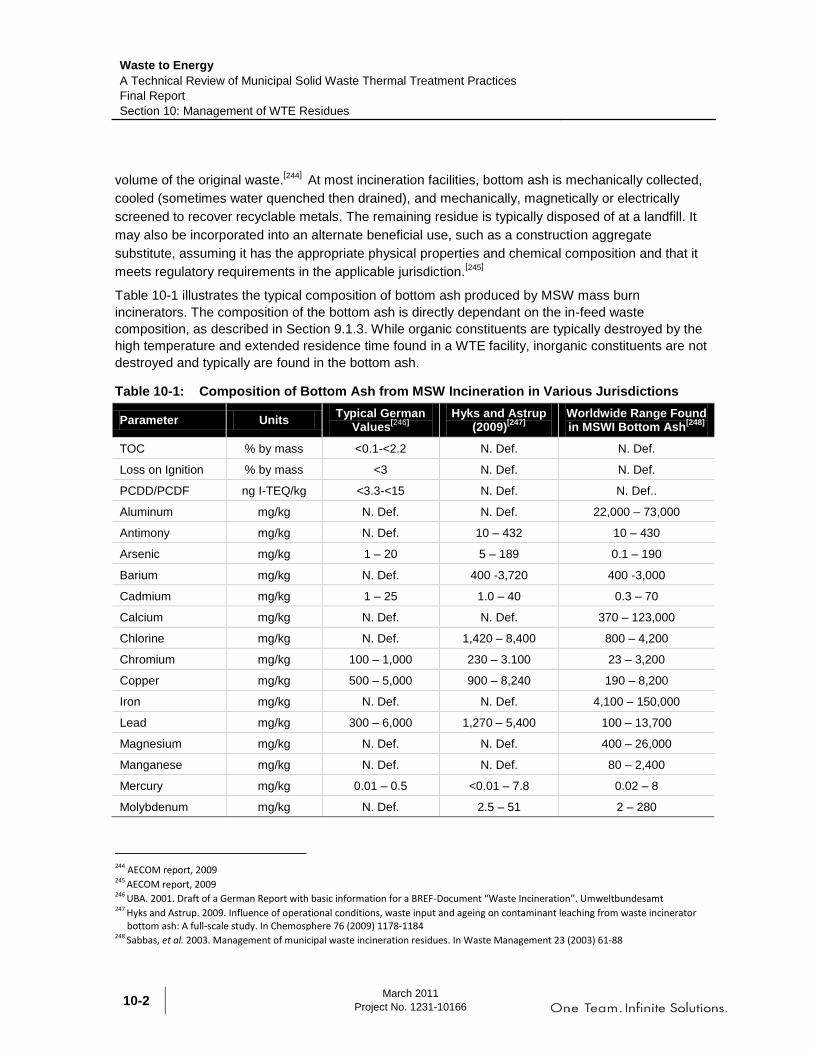
Waste to Energy
A Technical Review of Municipal Solid Waste Thermal Treatment Practices
Final Report
Section 10: Management of WTE Residues
March 2011
Project No. 1231-10166 10-2
volume of the original waste.[244]
At most incineration facilities, bottom ash is mechanically collected,
cooled (sometimes water quenched then drained), and mechanically, magnetically or electrically
screened to recover recyclable metals. The remaining residue is typically disposed of at a landfill. It
may also be incorporated into an alternate beneficial use, such as a construction aggregate
substitute, assuming it has the appropriate physical properties and chemical composition and that it
meets regulatory requirements in the applicable jurisdiction.[245]
Table 10-1 illustrates the typical composition of bottom ash produced by MSW mass burn
incinerators. The composition of the bottom ash is directly dependant on the in-feed waste
composition, as described in Section 9.1.3. While organic constituents are typically destroyed by the
high temperature and extended residence time found in a WTE facility, inorganic constituents are not
destroyed and typically are found in the bottom ash.
Table 10-1: Composition of Bottom Ash from MSW Incineration in Various Jurisdictions
Parameter Units Typical German
Values[246]
Hyks and Astrup
(2009)[247]
Worldwide Range Found in MSWI Bottom Ash
[248]
TOC % by mass <0.1-<2.2 N. Def. N. Def.
Loss on Ignition % by mass <3 N. Def. N. Def.
PCDD/PCDF ng I-TEQ/kg <3.3-<15 N. Def. N. Def..
Aluminum mg/kg N. Def. N. Def. 22,000 – 73,000
Antimony mg/kg N. Def. 10 – 432 10 – 430
Arsenic mg/kg 1 – 20 5 – 189 0.1 – 190
Barium mg/kg N. Def. 400 -3,720 400 -3,000
Cadmium mg/kg 1 – 25 1.0 – 40 0.3 – 70
Calcium mg/kg N. Def. N. Def. 370 – 123,000
Chlorine mg/kg N. Def. 1,420 – 8,400 800 – 4,200
Chromium mg/kg 100 – 1,000 230 – 3.100 23 – 3,200
Copper mg/kg 500 – 5,000 900 – 8,240 190 – 8,200
Iron mg/kg N. Def. N. Def. 4,100 – 150,000
Lead mg/kg 300 – 6,000 1,270 – 5,400 100 – 13,700
Magnesium mg/kg N. Def. N. Def. 400 – 26,000
Manganese mg/kg N. Def. N. Def. 80 – 2,400
Mercury mg/kg 0.01 – 0.5 <0.01 – 7.8 0.02 – 8
Molybdenum mg/kg N. Def. 2.5 – 51 2 – 280
244 AECOM report, 2009 245 AECOM report, 2009 246 UBA. 2001. Draft of a German Report with basic information for a BREF-Document “Waste Incineration”. Umweltbundesamt 247 Hyks and Astrup. 2009. Influence of operational conditions, waste input and ageing on contaminant leaching from waste incinerator
bottom ash: A full-scale study. In Chemosphere 76 (2009) 1178-1184 248 Sabbas, et al. 2003. Management of municipal waste incineration residues. In Waste Management 23 (2003) 61-88
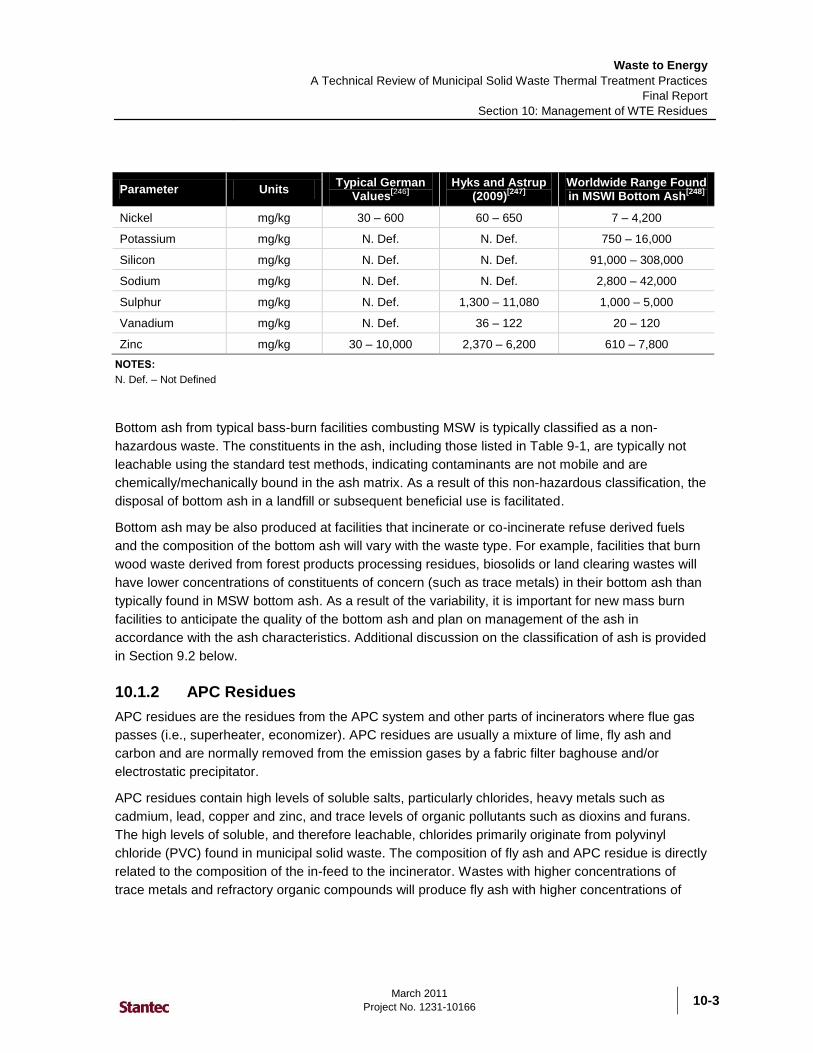
Waste to Energy
A Technical Review of Municipal Solid Waste Thermal Treatment Practices
Final Report
Section 10: Management of WTE Residues
March 2011
Project No. 1231-10166
10-3
Parameter Units Typical German
Values[246]
Hyks and Astrup
(2009)[247]
Worldwide Range Found in MSWI Bottom Ash
[248]
Nickel mg/kg 30 – 600 60 – 650 7 – 4,200
Potassium mg/kg N. Def. N. Def. 750 – 16,000
Silicon mg/kg N. Def. N. Def. 91,000 – 308,000
Sodium mg/kg N. Def. N. Def. 2,800 – 42,000
Sulphur mg/kg N. Def. 1,300 – 11,080 1,000 – 5,000
Vanadium mg/kg N. Def. 36 – 122 20 – 120
Zinc mg/kg 30 – 10,000 2,370 – 6,200 610 – 7,800
NOTES:
N. Def. – Not Defined
Bottom ash from typical bass-burn facilities combusting MSW is typically classified as a non-
hazardous waste. The constituents in the ash, including those listed in Table 9-1, are typically not
leachable using the standard test methods, indicating contaminants are not mobile and are
chemically/mechanically bound in the ash matrix. As a result of this non-hazardous classification, the
disposal of bottom ash in a landfill or subsequent beneficial use is facilitated.
Bottom ash may be also produced at facilities that incinerate or co-incinerate refuse derived fuels
and the composition of the bottom ash will vary with the waste type. For example, facilities that burn
wood waste derived from forest products processing residues, biosolids or land clearing wastes will
have lower concentrations of constituents of concern (such as trace metals) in their bottom ash than
typically found in MSW bottom ash. As a result of the variability, it is important for new mass burn
facilities to anticipate the quality of the bottom ash and plan on management of the ash in
accordance with the ash characteristics. Additional discussion on the classification of ash is provided
in Section 9.2 below.
10.1.2 APC Residues
APC residues are the residues from the APC system and other parts of incinerators where flue gas
passes (i.e., superheater, economizer). APC residues are usually a mixture of lime, fly ash and
carbon and are normally removed from the emission gases by a fabric filter baghouse and/or
electrostatic precipitator.
APC residues contain high levels of soluble salts, particularly chlorides, heavy metals such as
cadmium, lead, copper and zinc, and trace levels of organic pollutants such as dioxins and furans.
The high levels of soluble, and therefore leachable, chlorides primarily originate from polyvinyl
chloride (PVC) found in municipal solid waste. The composition of fly ash and APC residue is directly
related to the composition of the in-feed to the incinerator. Wastes with higher concentrations of
trace metals and refractory organic compounds will produce fly ash with higher concentrations of
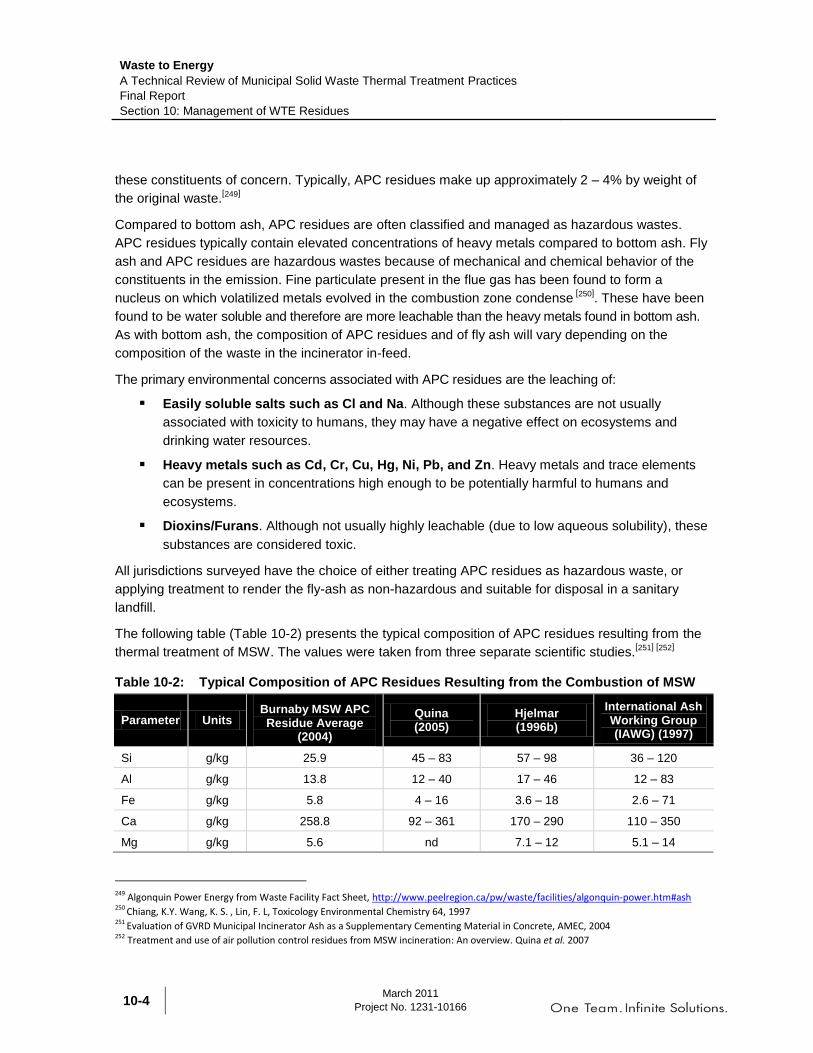
Waste to Energy
A Technical Review of Municipal Solid Waste Thermal Treatment Practices
Final Report
Section 10: Management of WTE Residues
March 2011
Project No. 1231-10166 10-4
these constituents of concern. Typically, APC residues make up approximately 2 – 4% by weight of
the original waste.[249]
Compared to bottom ash, APC residues are often classified and managed as hazardous wastes.
APC residues typically contain elevated concentrations of heavy metals compared to bottom ash. Fly
ash and APC residues are hazardous wastes because of mechanical and chemical behavior of the
constituents in the emission. Fine particulate present in the flue gas has been found to form a
nucleus on which volatilized metals evolved in the combustion zone condense [250]
. These have been
found to be water soluble and therefore are more leachable than the heavy metals found in bottom ash.
As with bottom ash, the composition of APC residues and of fly ash will vary depending on the
composition of the waste in the incinerator in-feed.
The primary environmental concerns associated with APC residues are the leaching of:
Easily soluble salts such as Cl and Na. Although these substances are not usually
associated with toxicity to humans, they may have a negative effect on ecosystems and
drinking water resources.
Heavy metals such as Cd, Cr, Cu, Hg, Ni, Pb, and Zn. Heavy metals and trace elements
can be present in concentrations high enough to be potentially harmful to humans and
ecosystems.
Dioxins/Furans. Although not usually highly leachable (due to low aqueous solubility), these
substances are considered toxic.
All jurisdictions surveyed have the choice of either treating APC residues as hazardous waste, or
applying treatment to render the fly-ash as non-hazardous and suitable for disposal in a sanitary
landfill.
The following table (Table 10-2) presents the typical composition of APC residues resulting from the
thermal treatment of MSW. The values were taken from three separate scientific studies.[251] [252]
Table 10-2: Typical Composition of APC Residues Resulting from the Combustion of MSW
Parameter Units Burnaby MSW APC Residue Average
(2004)
Quina (2005)
Hjelmar (1996b)
International Ash Working Group (IAWG) (1997)
Si g/kg 25.9 45 – 83 57 – 98 36 – 120
Al g/kg 13.8 12 – 40 17 – 46 12 – 83
Fe g/kg 5.8 4 – 16 3.6 – 18 2.6 – 71
Ca g/kg 258.8 92 – 361 170 – 290 110 – 350
Mg g/kg 5.6 nd 7.1 – 12 5.1 – 14
249 Algonquin Power Energy from Waste Facility Fact Sheet, http://www.peelregion.ca/pw/waste/facilities/algonquin-power.htm#ash 250 Chiang, K.Y. Wang, K. S. , Lin, F. L, Toxicology Environmental Chemistry 64, 1997 251 Evaluation of GVRD Municipal Incinerator Ash as a Supplementary Cementing Material in Concrete, AMEC, 2004 252 Treatment and use of air pollution control residues from MSW incineration: An overview. Quina et al. 2007
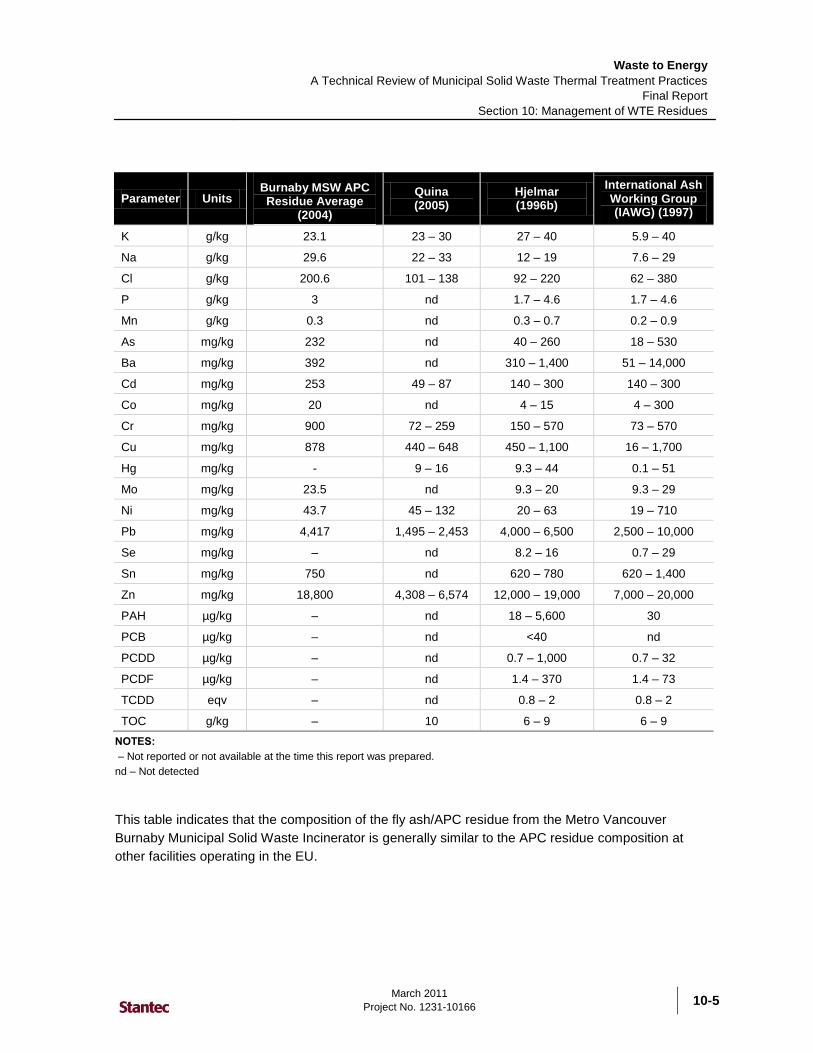
Waste to Energy
A Technical Review of Municipal Solid Waste Thermal Treatment Practices
Final Report
Section 10: Management of WTE Residues
March 2011
Project No. 1231-10166
10-5
Parameter Units Burnaby MSW APC Residue Average
(2004)
Quina (2005)
Hjelmar (1996b)
International Ash Working Group (IAWG) (1997)
K g/kg 23.1 23 – 30 27 – 40 5.9 – 40
Na g/kg 29.6 22 – 33 12 – 19 7.6 – 29
Cl g/kg 200.6 101 – 138 92 – 220 62 – 380
P g/kg 3 nd 1.7 – 4.6 1.7 – 4.6
Mn g/kg 0.3 nd 0.3 – 0.7 0.2 – 0.9
As mg/kg 232 nd 40 – 260 18 – 530
Ba mg/kg 392 nd 310 – 1,400 51 – 14,000
Cd mg/kg 253 49 – 87 140 – 300 140 – 300
Co mg/kg 20 nd 4 – 15 4 – 300
Cr mg/kg 900 72 – 259 150 – 570 73 – 570
Cu mg/kg 878 440 – 648 450 – 1,100 16 – 1,700
Hg mg/kg - 9 – 16 9.3 – 44 0.1 – 51
Mo mg/kg 23.5 nd 9.3 – 20 9.3 – 29
Ni mg/kg 43.7 45 – 132 20 – 63 19 – 710
Pb mg/kg 4,417 1,495 – 2,453 4,000 – 6,500 2,500 – 10,000
Se mg/kg – nd 8.2 – 16 0.7 – 29
Sn mg/kg 750 nd 620 – 780 620 – 1,400
Zn mg/kg 18,800 4,308 – 6,574 12,000 – 19,000 7,000 – 20,000
PAH µg/kg – nd 18 – 5,600 30
PCB µg/kg – nd <40 nd
PCDD µg/kg – nd 0.7 – 1,000 0.7 – 32
PCDF µg/kg – nd 1.4 – 370 1.4 – 73
TCDD eqv – nd 0.8 – 2 0.8 – 2
TOC g/kg – 10 6 – 9 6 – 9
NOTES:
– Not reported or not available at the time this report was prepared.
nd – Not detected
This table indicates that the composition of the fly ash/APC residue from the Metro Vancouver
Burnaby Municipal Solid Waste Incinerator is generally similar to the APC residue composition at
other facilities operating in the EU.

Waste to Energy
A Technical Review of Municipal Solid Waste Thermal Treatment Practices
Final Report
Section 10: Management of WTE Residues
March 2011
Project No. 1231-10166 10-6
10.1.3 Factors Affecting Ash Composition
There are several factors that affect the physical and chemical characteristics of bottom ash and
APC residues resulting from the thermal treatment of MSW. The following are considered to be the
primary factors affecting the quality of ash produced by MSW WTE facilities:
The composition of waste being incinerated will affect ash quality. MSW is heterogeneous,
with specific composition varying by jurisdiction. General ranges of composition have been
developed but actual composition is specific to the catchment or service area for the WTE
facility. Waste diversion strategies specific to a region can reduce the concentration of
recyclable materials such as paper, metals and plastic, leaving the MSW with higher
proportions of non-recoverable wastes including metallic and organic wastes. Diversion and
source removal of potentially harmful constituents from the MSW, such as batteries, lead-
based products, household hazardous wastes and fluorescent lamp tubes, prior to combustion
will have the benefit of improving the quality of the bottom ash and APC residues.
Front-end processing of the waste will also affect ash composition. Typically, MSW is
deposited in a large bunker at the facility where it can be homogenized manually before
entering the in-feed system. Some facilities also conduct source separation at this stage.
Removal of potentially harmful constituents and homogenization of the waste will improve
the quality of bottom ash and APC residues.
Type of APC system being used will have an effect on fly ash and APC residue quality
and quantity.
Operating conditions of the incinerator will affect the quality of bottom ash and the flue gas
and subsequently the APC residues. The physical geometry of the combustion zone will
affect the residence time at the temperature required for complete combustion and the
velocity of the flue gas through the incinerator and APC works. Also, upset operating
conditions, such as start-up or shut down, or failure of some portion of the incineration or APC
system, will affect ash quality. Steady operating conditions will produce a better quality ash.
Each jurisdiction will have a slightly different composition of MSW being incinerated; therefore the
range of ash composition provided above is illustrative of the types and magnitude of the
constituents of concern that may be contained in the ash.
10.1.4 Gasification Residue Management
The types and composition of the solid residues produced by gasification facilities treating MSW
depends on the particular gasification technology being considered as well as the composition of the
waste being treated. The following paragraphs discuss the solid residues arising from the Nippon
Steel “Direct Melting System” and the Thermoselect processes, as both processes have reasonable
documentation on the solid residues produced. It should be noted that both of these technologies are
considered high temperature gasifiers and produce residues which have different characteristics
from those produced by other gasification technologies where high temperatures are not reached.
Nippon Steel and Thermoselect are discussed because they are both more commercially proven
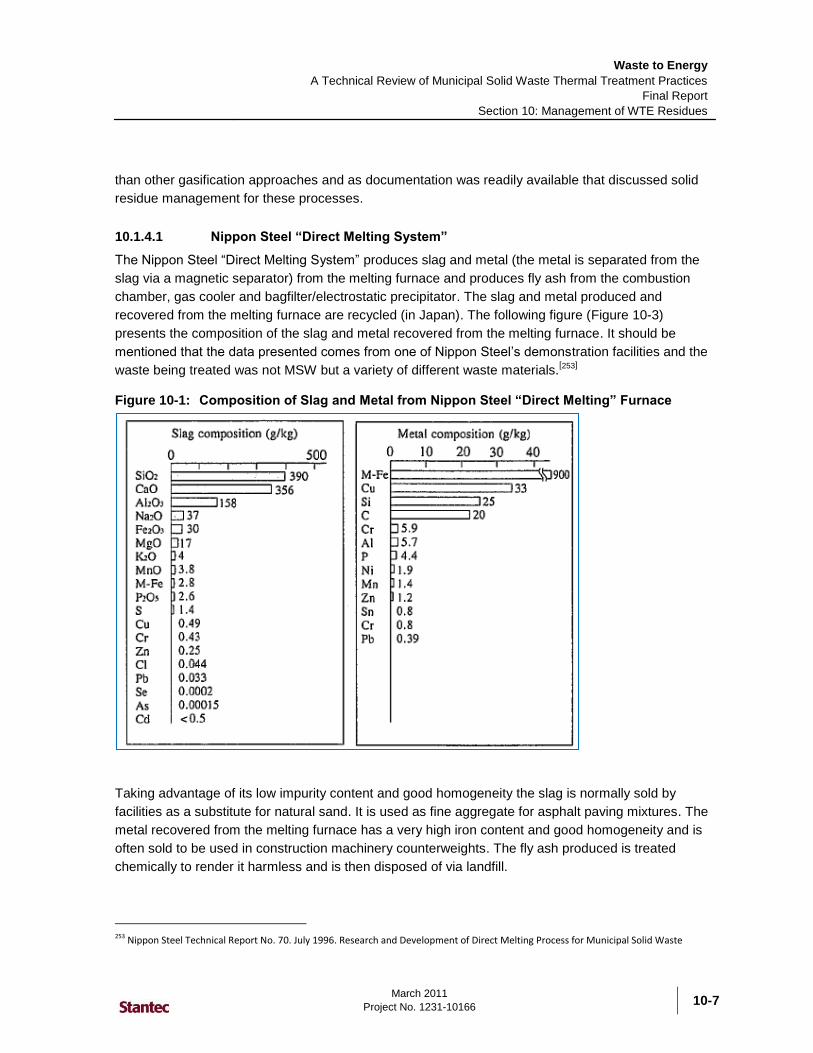
Waste to Energy
A Technical Review of Municipal Solid Waste Thermal Treatment Practices
Final Report
Section 10: Management of WTE Residues
March 2011
Project No. 1231-10166
10-7
than other gasification approaches and as documentation was readily available that discussed solid
residue management for these processes.
10.1.4.1 Nippon Steel “Direct Melting System”
The Nippon Steel “Direct Melting System” produces slag and metal (the metal is separated from the
slag via a magnetic separator) from the melting furnace and produces fly ash from the combustion
chamber, gas cooler and bagfilter/electrostatic precipitator. The slag and metal produced and
recovered from the melting furnace are recycled (in Japan). The following figure (Figure 10-3)
presents the composition of the slag and metal recovered from the melting furnace. It should be
mentioned that the data presented comes from one of Nippon Steel‟s demonstration facilities and the
waste being treated was not MSW but a variety of different waste materials.[253]
Figure 10-1: Composition of Slag and Metal from Nippon Steel “Direct Melting” Furnace
Taking advantage of its low impurity content and good homogeneity the slag is normally sold by
facilities as a substitute for natural sand. It is used as fine aggregate for asphalt paving mixtures. The
metal recovered from the melting furnace has a very high iron content and good homogeneity and is
often sold to be used in construction machinery counterweights. The fly ash produced is treated
chemically to render it harmless and is then disposed of via landfill.
253 Nippon Steel Technical Report No. 70. July 1996. Research and Development of Direct Melting Process for Municipal Solid Waste
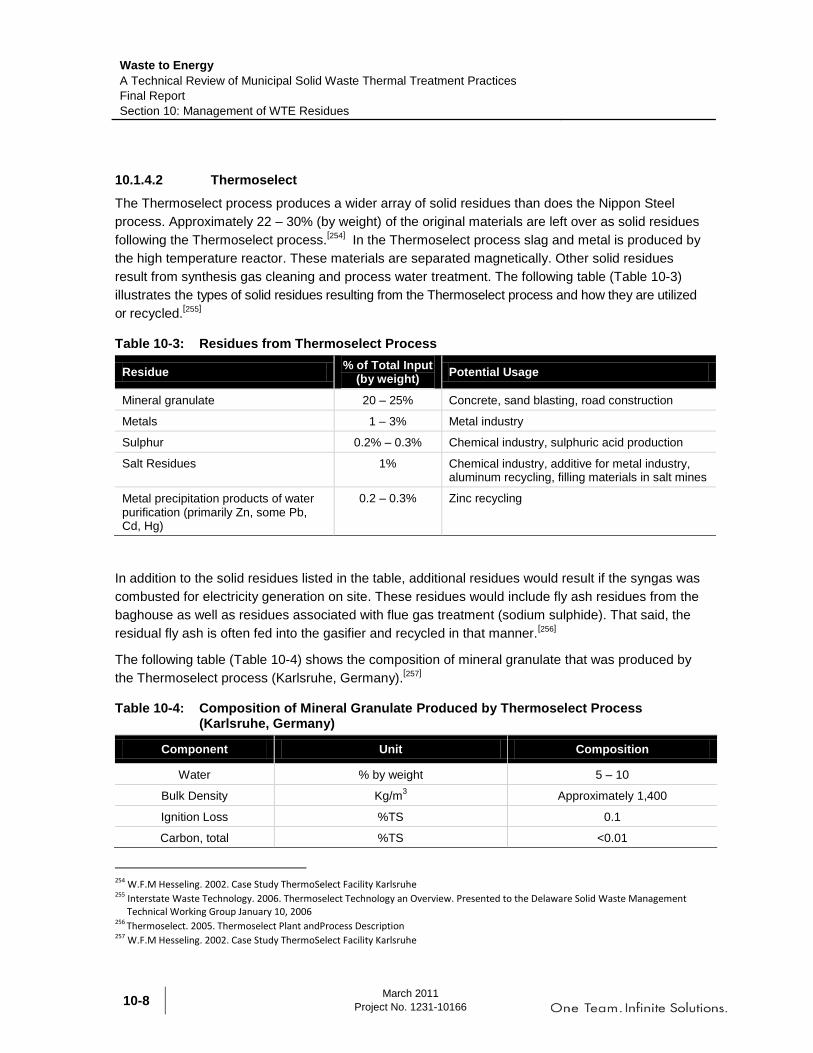
Waste to Energy
A Technical Review of Municipal Solid Waste Thermal Treatment Practices
Final Report
Section 10: Management of WTE Residues
March 2011
Project No. 1231-10166 10-8
10.1.4.2 Thermoselect
The Thermoselect process produces a wider array of solid residues than does the Nippon Steel
process. Approximately 22 – 30% (by weight) of the original materials are left over as solid residues
following the Thermoselect process.[254]
In the Thermoselect process slag and metal is produced by
the high temperature reactor. These materials are separated magnetically. Other solid residues
result from synthesis gas cleaning and process water treatment. The following table (Table 10-3)
illustrates the types of solid residues resulting from the Thermoselect process and how they are utilized
or recycled.[255]
Table 10-3: Residues from Thermoselect Process
Residue % of Total Input
(by weight) Potential Usage
Mineral granulate 20 – 25% Concrete, sand blasting, road construction
Metals 1 – 3% Metal industry
Sulphur 0.2% – 0.3% Chemical industry, sulphuric acid production
Salt Residues 1% Chemical industry, additive for metal industry, aluminum recycling, filling materials in salt mines
Metal precipitation products of water purification (primarily Zn, some Pb, Cd, Hg)
0.2 – 0.3% Zinc recycling
In addition to the solid residues listed in the table, additional residues would result if the syngas was
combusted for electricity generation on site. These residues would include fly ash residues from the
baghouse as well as residues associated with flue gas treatment (sodium sulphide). That said, the
residual fly ash is often fed into the gasifier and recycled in that manner.[256]
The following table (Table 10-4) shows the composition of mineral granulate that was produced by
the Thermoselect process (Karlsruhe, Germany).[257]
Table 10-4: Composition of Mineral Granulate Produced by Thermoselect Process (Karlsruhe, Germany)
Component Unit Composition
Water % by weight 5 – 10
Bulk Density Kg/m3 Approximately 1,400
Ignition Loss %TS 0.1
Carbon, total %TS <0.01
254 W.F.M Hesseling. 2002. Case Study ThermoSelect Facility Karlsruhe 255 Interstate Waste Technology. 2006. Thermoselect Technology an Overview. Presented to the Delaware Solid Waste Management
Technical Working Group January 10, 2006 256 Thermoselect. 2005. Thermoselect Plant andProcess Description 257 W.F.M Hesseling. 2002. Case Study ThermoSelect Facility Karlsruhe
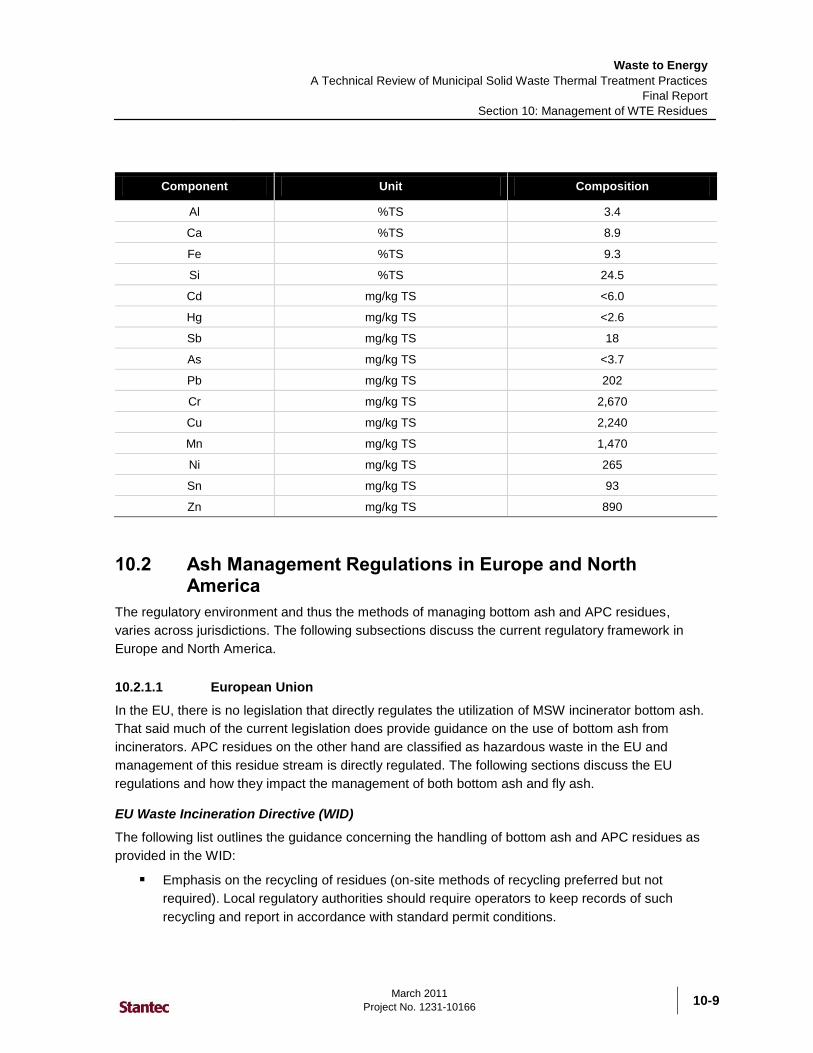
Waste to Energy
A Technical Review of Municipal Solid Waste Thermal Treatment Practices
Final Report
Section 10: Management of WTE Residues
March 2011
Project No. 1231-10166
10-9
Component Unit Composition
Al %TS 3.4
Ca %TS 8.9
Fe %TS 9.3
Si %TS 24.5
Cd mg/kg TS <6.0
Hg mg/kg TS <2.6
Sb mg/kg TS 18
As mg/kg TS <3.7
Pb mg/kg TS 202
Cr mg/kg TS 2,670
Cu mg/kg TS 2,240
Mn mg/kg TS 1,470
Ni mg/kg TS 265
Sn mg/kg TS 93
Zn mg/kg TS 890
10.2 Ash Management Regulations in Europe and North America
The regulatory environment and thus the methods of managing bottom ash and APC residues,
varies across jurisdictions. The following subsections discuss the current regulatory framework in
Europe and North America.
10.2.1.1 European Union
In the EU, there is no legislation that directly regulates the utilization of MSW incinerator bottom ash.
That said much of the current legislation does provide guidance on the use of bottom ash from
incinerators. APC residues on the other hand are classified as hazardous waste in the EU and
management of this residue stream is directly regulated. The following sections discuss the EU
regulations and how they impact the management of both bottom ash and fly ash.
EU Waste Incineration Directive (WID)
The following list outlines the guidance concerning the handling of bottom ash and APC residues as
provided in the WID:
Emphasis on the recycling of residues (on-site methods of recycling preferred but not
required). Local regulatory authorities should require operators to keep records of such
recycling and report in accordance with standard permit conditions.
Waste to Energy
A Technical Review of Municipal Solid Waste Thermal Treatment Practices
Final Report
Section 10: Management of WTE Residues
March 2011
Project No. 1231-10166 10-10
Total organic carbon should be limited to 3% while loss on ignition should be approximately 5%.
Fugitive dust releases from dusty wastes (including bottom ash) should be prevented by
using best available technology equipment. Although containers are not needed in all
circumstances (as damp storage may be sufficient for bottom ashes), new plants are
expected to provide for ash storage within a building and in an area of controlled drainage.
Bottom ash and APC residues (fly ash) should not be mixed together.
Particular attention should be paid to APC residues which should be held in bags or bulk
containers.
Appropriate physical and chemical testing must be performed on all residues to determine
the pollution potential of the residues prior to disposal or recycling. Analysis should be
carried out to determine the total soluble fraction and the heavy metals content of this
soluble fraction.
The process of revising the WID started in 2008 and the revisions may impact the allowable
emissions levels from incinerators as well as the composition of residues. The revised directive is
expected to be released in 2012. The new BREF for residue management is planned for 2010 – 2012.
EU Landfill Directive (LFD)
If the WTE residues are to be disposed via landfill, the management of these residues is governed
by the direction found in the Landfill Directive (LFD). The LFD governs the landfilling of waste in
Europe and was officially adopted in 1999. The LFD aims “to provide for measures, procedures and
guidance to prevent or reduce as far as possible the negative effects on the environment…from the
landfilling of waste.”[258]
Further clarification to the LFD was given in 2002 by a Council Decision which set out waste
acceptance criteria for waste that can be accepted at various types of landfills[259]
. The LFD
distinguishes between the main classes of landfills:
Landfills for inert waste
Landfills for non-hazardous waste
Landfills for hazardous waste
Underground storage.
Each of the three types of landfills has waste acceptance criteria which set out the types of waste
that the landfill can accept and the characteristics of that waste. The acceptance criteria include
performing standard leachability tests to quantify mobile toxic constituents.
Fly ash and APC residues with heavy metals and dioxins/furans are classified as hazardous wastes
and because of excessive leaching of salts; these residues are not accepted for disposal at
hazardous waste landfills without pre-treatment. Consequently, they must either be placed in
258 EU landfill directive 259 Management of municipal solid waste incineration residues. Sabbas, et al. 2001

Waste to Energy
A Technical Review of Municipal Solid Waste Thermal Treatment Practices
Final Report
Section 10: Management of WTE Residues
March 2011
Project No. 1231-10166
10-11
underground storage or stabilized prior to disposal at a hazardous waste landfill. The methods used
to stabilize fly ash and APC residues are discussed further in this report.[260]
Bottom ash does not contain the same concentrations of harmful substances and can therefore be
disposed of at a non-hazardous waste landfill or used for an alternative beneficial use.
The LFD is a minimum directive, and EU member states are allowed to set stricter national criteria
for waste acceptance at their own landfills.
Thematic Strategy on the Prevention and Recycling of Waste
The strategy on the prevention and recycling of waste was released in December 2005. “The aim of
the strategy is to reduce the negative impact on the environment that is caused by waste throughout
its life-span, from production to disposal, via recycling. This approach means that every item of
waste is seen not only as a source of pollution to be reduced, but also as a potential resource to be
exploited.”[261]
Although no specific issues related to ash management are mentioned, an introduction of life-cycle
thinking into waste management regulation may potentially have a large impact on the way residue
management is evaluated and discussed in the EU.
EU Statutory Order on POP
The EU Statutory Order on Persistent Organic Pollutants[262]
(POPs) regulates the management of
waste containing persistent organic compounds, including dioxins and furans (15 µg/kg), PCB, and a
variety of organic pesticide products (each 50 mg/kg). This directive requires that waste containing
POPs must be managed in such a way as to destroy or irreversibly transform the POPs by physico-
chemical treatment, incineration on land or use as a fuel to generate energy. With respect to APC
residue, physio-chemical pretreatment includes stabilization prior to disposal in a landfill.
10.2.1.2 European Union Member States
The following subsections outline the regulatory framework in place for the management of residues
in various European Member States.
Netherlands
In the Netherlands, the management of waste is regulated through the framework of the Landelijk
Afvalbeheer Plan (Federal Waste Management Plan) or simply LAP. The LAP sets out standards for
the use of both APC residues and bottom ash as follows:
Bottom ash and fly ash must be collected and managed separately. No mixing is permitted.
260 Air pollution control residues from waste incineration: Current UK situation and assessment of alternative technologies. Rani, et al. 2007 261 http://europa.eu/legislation_summaries/environment/sustainable_development/l28168_en.htm 262 Regulation (EC) No 850/2004 of the European Parliament and of the Council of 29 April 2004 on persistent organic pollutants and
amending Directive 79/117/EEC
Waste to Energy
A Technical Review of Municipal Solid Waste Thermal Treatment Practices
Final Report
Section 10: Management of WTE Residues
March 2011
Project No. 1231-10166 10-12
Close to 100% must be utilized (a total utilization rate of 90% is considered the minimum
standard for bottom ash + fly ash + APC residues).
For bottom ash, utilization in large scale controlled embankments is considered the minimum
option for utilization.
The Dutch Waste Incineration Directive also sets out compositional limits for bottom ash reflective of
WTE facility performance, namely that the loss of ignition must be lower than 5%.
In the Netherlands, another piece of legislation called the Building Materials Decree (which came into
force in 1998) sets the rules toward the environmentally safe utilization of building materials (such as
incinerator bottom ash). The Decree stipulates the increase of 21 pollutants to a maximum of 1%
over a 100 year period. As bottom ash is often used as a building material aggregate, it is subject to
the Decree.
If bottom ash is to be used in accordance with the Decree, the following requirements must be met:
The quantity of bottom ash used must be a minimum of 10,000 tonnes in foundations
The quantity of bottom ash used must be a minimum of 100,000 tonnes in embankments
A triple liner has to be used to cover the bottom ash
Leaching quality of the bottom ash has to be monitored.
The limits set out in the EU LFD are implemented in Dutch legislation.[263]
United Kingdom
In the UK, solid residues from municipal waste incinerators including bottom ash and air pollution
control residues are considered controlled wastes. APC residues are classified as hazardous waste
at the point they are generated at WTE facilities.
Ash residues are regulated by the UK‟s Environment Agency under the Environmental Protection
Act. In the UK, solid residues are disposed of or recovered in a number of ways:
Bottom ash is generally landfilled, used as landfill cover, or processed to produce an
aggregate for use in highway sub-bases and embankments.
APC residues are also landfilled or used in licensed waste treatment plants to neutralise and
solidify other hazardous wastes.
Operators of landfills and treatment plants accepting air pollution control residues or bottom ash
require a permit from the Environmental Agency (a waste management license). This permit must
include conditions designed to protect the environment and human health.[264],[265]
263 Management of APC residues from WTE Plants. ISWA. 2008 264 Solid Residues from Municipal Waste Incinerators in England and Wales. Environment Agency. May 2002 265 Management of Bottom Ash from WTE Plants. An overview of management options and treatment methods

Waste to Energy
A Technical Review of Municipal Solid Waste Thermal Treatment Practices
Final Report
Section 10: Management of WTE Residues
March 2011
Project No. 1231-10166
10-13
Denmark
Being densely populated, Denmark seeks to avoid landfilling of wastes. Consequently, since 1997
landfilling of combustible wastes has been banned in favor of incineration. To further facilitate this,
the Danish government has established a statutory order which allows the incinerator bottom ash to
be utilized as a substitute construction material. Depending on the leaching properties, the ash is
classified into three categories. Materials belonging to Category 1 may be utilized freely, while
materials in Category 3 may only be utilized in certain projects. Category 2 is an intermediate class.
10.2.1.3 United States
In the United States, the management of residual ash from WTE facilities is regulated at both the
federal and state level.
Federal
At the federal level, ash generated at WTE facilities is regulated under Subtitle C of the US Resource
Conservation and Recovery Act (RCRA). Under Subtitle C, operators of WTE facilities must
determine whether ash generated is hazardous based on the Toxicity Characteristic (TC) provision.
Ash first becomes subject to this hazardous waste determination at the point that the ash leaves the
“resource recovery facility”, defined as the combustion building (including connected APC
equipment). Ash that falls under the regulation includes bottom ash, APC residues (fly ash) or any
combination of the two (i.e., the common practice in the United States is to combine bottom ash and
fly ash and dispose of the material as a combined ash stream).[266]
The TC is one of four characteristics described in Subtitle C by which hazardous waste is identified.
It is determined by either testing using the Toxicity Characteristic Leaching Procedure (TCLP) or by
using knowledge of the combustion process to determine whether ash would exhibit the TC.
Typically, ash that fails the TC, leaches lead or cadmium above levels of concern. In addition to the
TCLP, alternative leaching procedures are sometimes used as specified by a state (e.g., California
requires the California Waste Extraction Text) and some states may require total metal and organic
analysis and fish bio assays.[267],[268]
The following table (Table 10-5) presents a list of TC contaminants and their associated
regulatory levels.
266 National Renewable Energy Laboratory. 1999. Beneficial Use and Recycling of Municipal Waste Combustion Residues – A
Comprehensive Resource Document 267 Environmental Protection Agency. 2005. 40 CFR Part 270: Determination of Point at Which RCRA Subtitle C Jurisdiction Begins for
Municipal Waste Combustion Ash at Waste-to-Energy Facilities 268 National Renewable Energy Laboratory. 1999. Beneficial Use and Recycling of Municipal Waste Combustion Residues – A
Comprehensive Resource Document
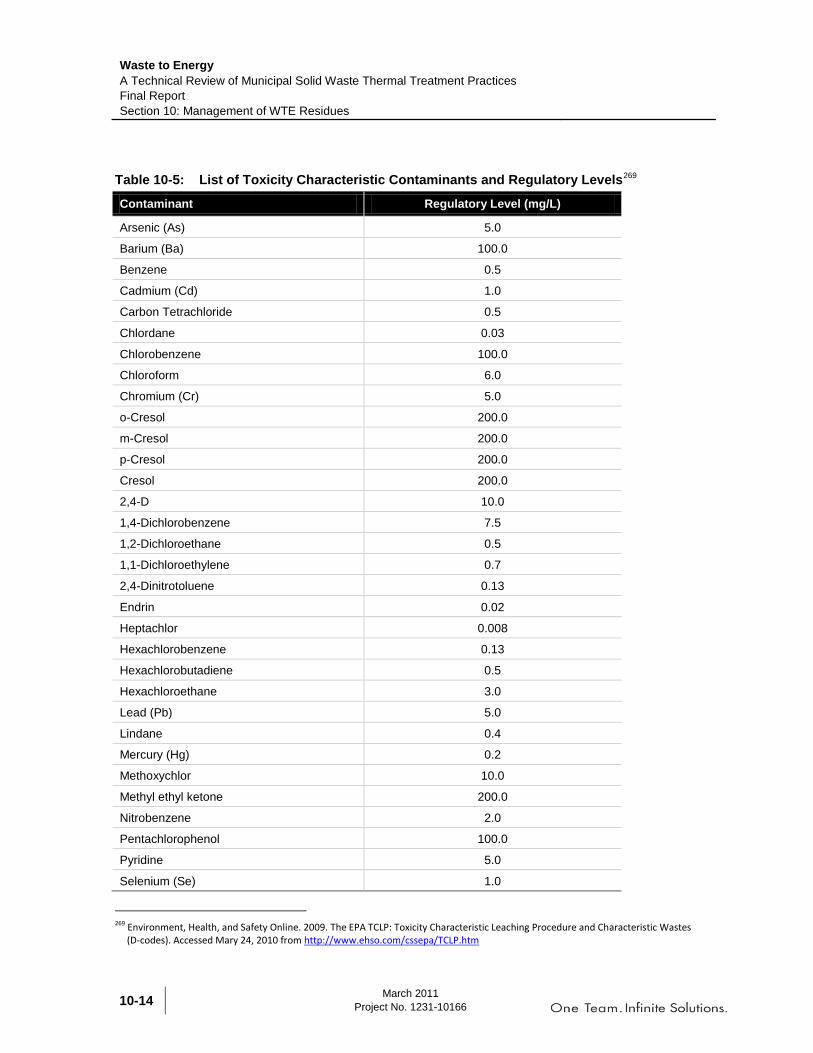
Waste to Energy
A Technical Review of Municipal Solid Waste Thermal Treatment Practices
Final Report
Section 10: Management of WTE Residues
March 2011
Project No. 1231-10166 10-14
Table 10-5: List of Toxicity Characteristic Contaminants and Regulatory Levels269
Contaminant Regulatory Level (mg/L)
Arsenic (As) 5.0
Barium (Ba) 100.0
Benzene 0.5
Cadmium (Cd) 1.0
Carbon Tetrachloride 0.5
Chlordane 0.03
Chlorobenzene 100.0
Chloroform 6.0
Chromium (Cr) 5.0
o-Cresol 200.0
m-Cresol 200.0
p-Cresol 200.0
Cresol 200.0
2,4-D 10.0
1,4-Dichlorobenzene 7.5
1,2-Dichloroethane 0.5
1,1-Dichloroethylene 0.7
2,4-Dinitrotoluene 0.13
Endrin 0.02
Heptachlor 0.008
Hexachlorobenzene 0.13
Hexachlorobutadiene 0.5
Hexachloroethane 3.0
Lead (Pb) 5.0
Lindane 0.4
Mercury (Hg) 0.2
Methoxychlor 10.0
Methyl ethyl ketone 200.0
Nitrobenzene 2.0
Pentachlorophenol 100.0
Pyridine 5.0
Selenium (Se) 1.0
269 Environment, Health, and Safety Online. 2009. The EPA TCLP: Toxicity Characteristic Leaching Procedure and Characteristic Wastes
(D-codes). Accessed Mary 24, 2010 from http://www.ehso.com/cssepa/TCLP.htm
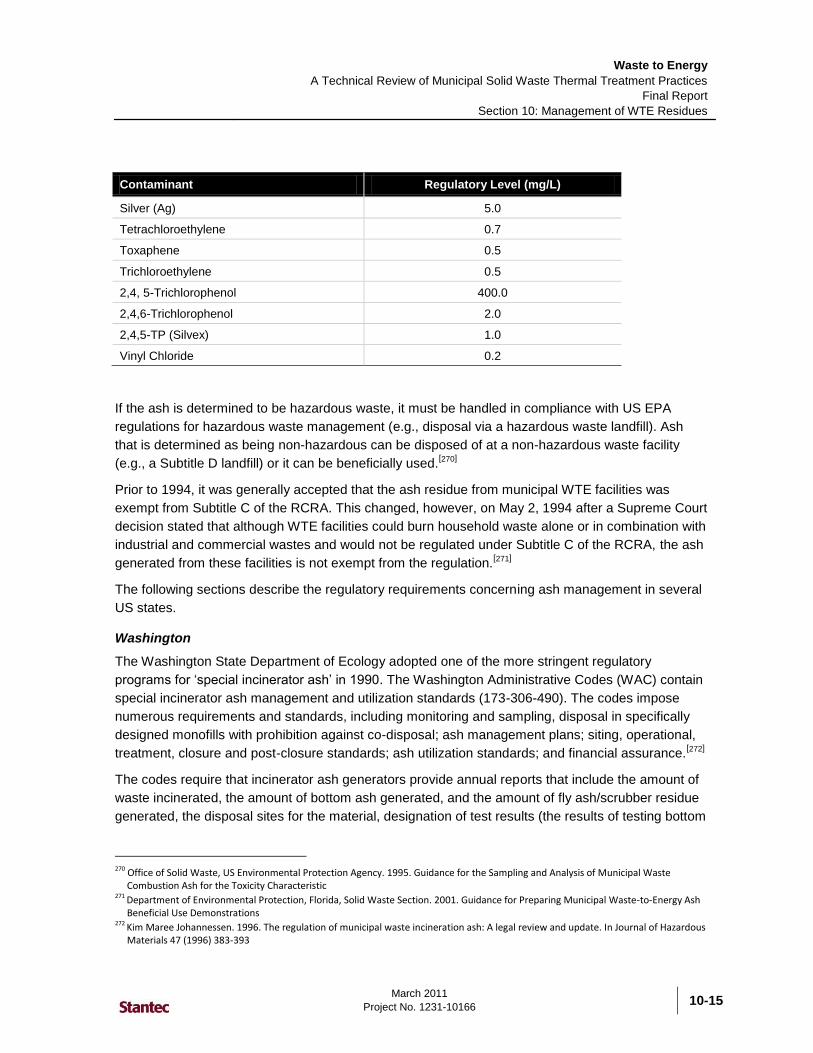
Waste to Energy
A Technical Review of Municipal Solid Waste Thermal Treatment Practices
Final Report
Section 10: Management of WTE Residues
March 2011
Project No. 1231-10166
10-15
Contaminant Regulatory Level (mg/L)
Silver (Ag) 5.0
Tetrachloroethylene 0.7
Toxaphene 0.5
Trichloroethylene 0.5
2,4, 5-Trichlorophenol 400.0
2,4,6-Trichlorophenol 2.0
2,4,5-TP (Silvex) 1.0
Vinyl Chloride 0.2
If the ash is determined to be hazardous waste, it must be handled in compliance with US EPA
regulations for hazardous waste management (e.g., disposal via a hazardous waste landfill). Ash
that is determined as being non-hazardous can be disposed of at a non-hazardous waste facility
(e.g., a Subtitle D landfill) or it can be beneficially used.[270]
Prior to 1994, it was generally accepted that the ash residue from municipal WTE facilities was
exempt from Subtitle C of the RCRA. This changed, however, on May 2, 1994 after a Supreme Court
decision stated that although WTE facilities could burn household waste alone or in combination with
industrial and commercial wastes and would not be regulated under Subtitle C of the RCRA, the ash
generated from these facilities is not exempt from the regulation.[271]
The following sections describe the regulatory requirements concerning ash management in several
US states.
Washington
The Washington State Department of Ecology adopted one of the more stringent regulatory
programs for „special incinerator ash‟ in 1990. The Washington Administrative Codes (WAC) contain
special incinerator ash management and utilization standards (173-306-490). The codes impose
numerous requirements and standards, including monitoring and sampling, disposal in specifically
designed monofills with prohibition against co-disposal; ash management plans; siting, operational,
treatment, closure and post-closure standards; ash utilization standards; and financial assurance.[272]
The codes require that incinerator ash generators provide annual reports that include the amount of
waste incinerated, the amount of bottom ash generated, and the amount of fly ash/scrubber residue
generated, the disposal sites for the material, designation of test results (the results of testing bottom
270 Office of Solid Waste, US Environmental Protection Agency. 1995. Guidance for the Sampling and Analysis of Municipal Waste
Combustion Ash for the Toxicity Characteristic 271 Department of Environmental Protection, Florida, Solid Waste Section. 2001. Guidance for Preparing Municipal Waste-to-Energy Ash
Beneficial Use Demonstrations 272 Kim Maree Johannessen. 1996. The regulation of municipal waste incineration ash: A legal review and update. In Journal of Hazardous
Materials 47 (1996) 383-393
Waste to Energy
A Technical Review of Municipal Solid Waste Thermal Treatment Practices
Final Report
Section 10: Management of WTE Residues
March 2011
Project No. 1231-10166 10-16
ash and fly ash/scrubber residues separately and combined) on representative samples taken each
quarter of the year (this may be reduced after the first year of testing). The report must also provide
results of testing bottom ash and fly ash separately for dioxins and dibenzofurans on a composite
sample made from the eight quarterly samples as well as ambient lead and cadmium samples taken
in the air and soil respectively at the property boundary.[273]
The test results are subjected to the criteria of WAC 173-303-100 (Dangerous Waste Criteria). A
waste is designated a dangerous waste if it meets one or more of the dangerous waste criteria listed
as toxicity criteria or persistence criteria. Toxicity criteria are determined by either a book designation
procedure (if enough information concerning the waste‟s composition is known) or biological testing
methods (e.g., fish, rat bioassays). Persistence criteria are determined by either applying knowledge
of the waste or by testing the waste according to WAC 173-303-110. Persistent constituents are
substances which are either halogenated organic compounds (HOC) or polycyclic aromatic
hydrocarbons (PAH). Depending on the concentration of the persistent substance present in the
waste, the waste will be defined as either dangerous or not.[274]
If ash is classified as a dangerous waste it must be disposed of at a facility which is operating either
under a valid permit, or if the facility is located outside of this state, under interim status or a permit
issued by United States EPA under 40 CFR Part 270, or under interim status or a permit issued by
another state which has been authorized by United States EPA pursuant to 40 CFR Part 271.[275]
If
ash is not classified as dangerous waste it must be disposed of at a site which holds a valid permit
(ash monofills).
California
In California, regulations require that WTE ash be tested for toxicity prior to disposal. The state
requires that for any substance that potentially fall under the RCRA, the use of a Waste Extraction
Text (WET) be used for toxicity testing. The WET test is more stringent that the TCLP, and measures
both soluble thresholds and total thresholds. The WET test dilutes the waste less, involves a longer
extraction period (48 hours vs. 18 hours) and includes the analysis of more parameters of concern.[276]
10.2.1.4 Canada
In Canada, the handling of residual ash is regulated by each province. The following sections
describe the applicable regulations in Ontario and British Columbia.
Ontario
In Ontario, the handling of residues from incinerators that process MSW is governed by Ontario
Regulation 347 under the Environmental Protection Act. Regulation 347 outlines several
273 WAC 173-306: Special incinerator ash management standards. 2000 274 WAC 173-303-100: Dangerous waste criteria 275 WAC 173-303-141: Treatment, storage, or disposal of dangerous waste. 2003 276 National Renewable Energy Laboratory. 1999. Beneficial Use and Recycling of Municipal Waste Combustion Residues – A
Comprehensive Resource Document

Waste to Energy
A Technical Review of Municipal Solid Waste Thermal Treatment Practices
Final Report
Section 10: Management of WTE Residues
March 2011
Project No. 1231-10166
10-17
requirements concerning the management of bottom ash and APC residues. The following is an
overview of the requirements:
Fly ash from an incinerator's energy recovery and pollution control system must be handled
separately from the burning zone's bottom ash.
Fly ash must be tested for leachate toxicity if the operator wants to classify the ash as non-
hazardous. The testing protocol for leachate toxicity is contained in Ontario Regulation 347
while the sampling procedure and results evaluation procedure is in the ministry's policy
publication "Protocol for Sampling and Evaluating Fly Ash from Non-Hazardous Solid Waste
Incineration Facilities". Ontario requires application of the TCLP for leachate toxicity similar
to the US EPA TL requirements.
Incinerator operators shall analyze bottom and fly ashes sent to disposal for leachate toxicity
and ultimate analysis during performance tests or at the direction of the Director of the
Ministry's Environmental Assessment and Approvals Branch.
Fly ash that is deemed hazardous must be disposed of at a landfill site that is capable of
accepting fly ash (i.e., is permitted to accept the waste via a waste certificate of approval).
Incinerators shall be operated such that the organic content of the bottom ash shall be
minimized to the greatest degree possible. A maximum organic content of 5% is generally
considered achievable by single chamber incinerators and 10% by multiple chamber
incinerators.[277]
British Columbia
Regulatory Framework
In British Columbia, the management of residual ash from the incineration of MSW is regulated by
the British Columbia Environmental Management Act [278]
(EMA) and associated enabling
Regulations, including the Waste Discharge Regulation, the Contaminated Sites Regulation and the
Hazardous Waste Regulation. In general terms in British Columbia, the introduction of waste into the
environment must be authorized by a permit issued under the EMA and Regulations. The
incineration of municipal waste originating from residential, commercial, institutional, demolition, land
clearing or construction sources is identified in Schedule 1 of the Waste Discharge Regulation. This
means the activity requires authorization from BCMOE for the introduction of waste into the
environment. If the waste discharge is governed by a Code of Practice approved by BCMOE, then
the operation is exempt from obtaining a permit if the discharge is conducted in a manner consistent
with the Code of Practice. For the municipal solid waste incineration sector, there is currently no
Code of Practice in place. Requirements specific to the management of bottom ash or APC residues
from a MSW incineration facility would be specified in the permit for the incineration facility and/or in
the authorization for the landfill site. Solid Waste Management Plans (SWMP) are required for each
277 GUIDELINE A-7 Combustion and Air Pollution Control Requirements for New Municipal Waste Incinerators. Ontario Ministry of the
Environment. 2004 278 BC Environmental Management Act, SBC 2003, October 23, 2003
Waste to Energy
A Technical Review of Municipal Solid Waste Thermal Treatment Practices
Final Report
Section 10: Management of WTE Residues
March 2011
Project No. 1231-10166 10-18
Regional District in the province. With respect to the operation of a municipally-owned and operated
landfill, the authorization for an approved SWMP is typically in the form of an Operational Certificate
(OC). The OC is issued by the Director of Waste Management and may contain conditions in the
same manner as a permit. Specific requirements for the management of incinerator ash at a
municipal landfill would be found in the Operational Certificate.
The Hazardous Waste Regulation [279]
(HWR) under the EMA specifies the requirements for the
management of hazardous waste in BC. Wastes are classified as Hazardous Wastes in BC in
several ways. The primary classification method is to determine if a waste is classified as a
Dangerous Good by the Canadian Transportation of Dangerous Goods Act [280]
, and if so it would be
considered Hazardous Waste. Wastes may also qualify as hazardous wastes if they contain
constituents that are considered hazardous or contain Specific Hazardous Wastes, such as asbestos
and waste oil. The HWR contains a leachate extraction test to determine if the constituents of
concern in the waste are leachable.
Classification of Residues
In BC, residuals such as bottom ash and fly ash produced by the incineration of MSW are
characterized by subjecting the ash to the US EPA as Method 1311Toxicity Characteristic Leaching
Procedure (TCLP). TCLP is widely used across North America to determine if a material is leachable
and therefore is classified as a hazardous waste.
Where constituents are found to be leachable by the TCLP in concentrations in excess of the
Leachate Quality Standards specified in Table 1 of Schedule 4 of the HWR, the waste would be
considered to be a leachable toxic waste and would be classified as a Hazardous Waste. Wastes
classified as hazardous waste must be managed in accordance with the requirements of the HWR.
Typically, bottom ash has been found to be non-leachable and suitable for alternative, beneficial
reuse, such as substitution aggregate in cement manufacture or road base material . Where reuse
is not practical, bottom ash can be disposed of in a permitted landfill as waste without
extraordinary precautions.
In contrast, APC residue and fly ash from incineration of MSW are typically found to be leachable by
TCLP tests. Constituents of concern are typically trace metals entrained in the fly ash, and potentially
include residual organic compounds not destroyed by the incineration process. APC or fly ash
residues that are leachable must be either stabilized to reduce the leachability to the point at which it
can be managed as a non-hazardous waste material, or disposed of at a secure landfill that is
licensed to accept hazardous waste.
As described above, the constituents of concern in the fly ash will vary with the composition of the
waste being incinerated. A homogeneous solid waste in-feed that has a low concentration of trace
metals or hazardous organic compounds, such as wood waste and land clearing debris, is unlikely to
produce a leachable fly ash.
279 BC Hazardous Waste Regulation, B.C. Reg. 63, April 1, 2009 280 Canadian Transportation of Dangerous Goods Act and Regulations, SOR/2008-34

Waste to Energy
A Technical Review of Municipal Solid Waste Thermal Treatment Practices
Final Report
Section 10: Management of WTE Residues
March 2011
Project No. 1231-10166
10-19
Financial Security for Ash Disposal Sites
As discussed above, landfills operating in British Columbia are authorized under the EMA by the BC
Ministry of Environment. These authorizations contain a variety of operational and monitoring
conditions, established on a site-specific basis to ensure the protection of human health and the
environment. One of the administrative requirements that can be included in a permit is the provision
of financial security by the permit holder.
Financial security is a tool available to the ministry to manage the financial risks associated with the
landfill site in the context of the license to operate and ultimately close the landfill. Typically, security
is required by the ministry where a potential long-term liability exists with a facility and where
adequate funds need to be available to the Province in the event of a default by the operator or to
address the operator‟s inability to manage pollution originating at the landfill. The need for security is
identified by the Director of Waste Management as defined by the EMA. Municipal governments are
typically are exempt from the requirement to post security, but private landfills and landfills managing
hazardous waste are often required to post financial security.
Similar principles apply to the management of contaminated sites in BC. The BC Ministry of
Environment document, Protocol 8[281]
, Security for Contaminated Sites, provides a basis where the
ministry considers the need for establishment of financial security. The requirements are
summarized generally in this section and we refer the reader to the protocol(s) for specific details on
their application.
The key guiding principles contained in the Protocol for determining the appropriate financial security
include:
Each site presents a unique set of circumstances that must be considered when determining
security requirements
Security is only required for sites that are considered high risk. Protocol 12[282]
, Site Risk
Classification, Reclassification and Reporting provides the guidance on the classification of a
site as high risk. In brief summary, this determination has its basis in ecological and human
health risk assessment, and considers the concentration of contaminants present at the site
and the exposure pathway to receptors of concern. Where wastes and contaminants at a
site pose a risk to human health or the environment, the requirement for posting financial
security is considered appropriate.
The requirement for security is the responsibility of the Director of Waste Management and
any required security is subject to review. Security should be consistent with precedents set
by the Ministry for other similar sites and be consistent, equitable and effective.
281 Protocol 8 for Contaminated Sites, Security for Contaminated Sites, prepared pursuant to Section 64 of the Environmental
Management Act, BC Ministry of Environment, November 19, 2007 282 Protocol 12 for Contaminated Sites, Site Risk Classification, Reclassification and Reporting, prepared pursuant to Section 64 of the
Environmental Management Act, BC Ministry of Environment, December 4, 2009
Waste to Energy
A Technical Review of Municipal Solid Waste Thermal Treatment Practices
Final Report
Section 10: Management of WTE Residues
March 2011
Project No. 1231-10166 10-20
Protocol 8 also includes a procedure for determining the value of financial security required. The
basis for the security is the estimate of the potential remediation cost necessary to address future
remediation of the high risk site, including capital costs, recurring costs, remediation schedule and
discount rates for determining net present value. The required financial security is based on the least
cost remedial alternative acceptable to the Director and is equal to 100% of the one-time remediation
capital costs plus the value of the total management and monitoring cost over the entire planning
and remediation period. The Director is to review the security requirements every one to five years.
Specific to the management of fly ash and bottom ash deposited in a permitted landfill facility,
financial security may be required of an operator subject to the qualification criteria discussed above.
Typically, bottom ash is not considered hazardous and as such is normally incorporated into the
landfill without special precautions. Fly ash typically requires stabilization to reduce the leachability of
contaminants and is considered to pose a higher risk than bottom ash. If the fly ash is suitably
stabilized so it is no longer leachable, it would be deemed to pose no greater risk than the material
contained in the landfill. The security required would therefore be consistent the security requirement
for other landfills, if any. Unstablilized fly ash would be considered hazardous waste and would
trigger a higher financial security for potential future remediation. There are few sites available in BC
for the deposition of unstabilized fly ash, even in specifically designed monofill cells.
Given this high degree of variability of site conditions (size of landfill, quantity of ash in proportion to
waste being deposited, environmental sensitivity of the site), and whether a site is classified as high
risk, it is not possible to provide a single estimate of the value of financial security. Each site and
each case must be evaluated, using the BCMOE Protocols, to determine the level of risk, the
potential cost to mitigate or remediate the risk and who the responsible party will be. Unit costs for
remediation will be higher for smaller landfills than for larger landfills, but the total cost will always be
linked to the volume of material required to be remediated. Therefore, it is not technically
unreasonable for the security requirement to be linked to volume of material deposited, but this
approach may be logistically difficult to administer. Setting a financial security based on the ultimate
capacity of the ash deposition site is more practical.
It is also difficult to differentiate between the risk posed by the ash in the landfill and the risk
attributed to the other wastes contained therein. Where ash is managed in separate cells, it may be
possible to apportion a remediation cost specific to the ash and separate from any financial security
requirement for the landfill as a whole.
In summary, the requirement for a financial security must be considered on a case-by-case basis.
It is reasonable for the landfill operator and WTE proponent to evaluate the potential risk posed by
the deposition of ash in a landfill site and to justify the appropriate level of financial security that
should be required by the Director, and have this requirement formally recognized by a legal
instrument issued by the province, such as a permit, Solid Waste Management Plan.

Waste to Energy
A Technical Review of Municipal Solid Waste Thermal Treatment Practices
Final Report
Section 10: Management of WTE Residues
March 2011
Project No. 1231-10166
10-21
10.3 Management of Bottom Ash and APC Residues
Bottom ash and APC residues can be managed in a variety of different ways but these can basically
all be grouped into two main methods:
Safe Disposal
Alternative Uses (Recycling and Reuse).
Much investigation has been given to finding alternative uses for bottom ash and APC residues to
divert these materials from landfill. Depending on the jurisdiction, bottom ash and APC residues are
managed in different ways due to local regulations and/or access to appropriate technologies and
markets in which to use the material.
10.3.1 Safe Disposal of Ash
There are several ways in which bottom ash and APC residues can be handled to ensure safe disposal.
Because bottom ash does not typically contain high concentrations of hazardous materials and is not
typically leachable, it can usually meet regulatory requirements for disposal via a conventional
sanitary landfill. Normally, bottom ash is „aged‟ to ensure that it is highly stable (exhibited through a
decrease in organic content, and fixing of metals) and less likely to leach its contents. Stabilization
by ageing of bottom ash is achieved by simply storing the bottom ash for several weeks or months.
For example in Germany, bottom ash is stored/aged for a minimum of three months while in the
Netherlands it is stored for a minimum of six weeks.[283]
APC residues typically contain high levels of leachable toxic substances which must be managed as
hazardous waste[284]
at a suitably designed and authorized landfill. Pre-treatment of the APC residue
may reduce the leachability and reduce the requirements on the landfill site.
Generally speaking, treatment options to ensure safe disposal for bottom and fly ash are based on
one or more of the following principles:
Physical or chemical separation
Stabilization/solidification
Thermal treatment.
Table 10-6 provides an overview of the current practices being used to handle ash residues from
solid waste incinerators in order to make them suitable for utilization or safe for disposal.
283 Management of Bottom Ash from WTE Plants. An overview of management options and treatment methods 284 Characteristics, Treatment and Utilization of Residues from Municipal Waste Incineration. H.A. van der Sloot, et al. 2001

Waste to Energy
A Technical Review of Municipal Solid Waste Thermal Treatment Practices
Final Report
Section 10: Management of WTE Residues
March 2011
Project No. 1231-10166 10-22
Table 10-6: Overview of Principles and Methods of Treatment of Ash Residues Resulting from the Thermal Treat of MSW
[285]
Treatment Principle Examples of Processes and Unit Operations Bottom Ash Fly Ash
Separation
Wash and extraction 1 1,2
Chemical precipitation 1,2
Crystallization/evaporation
Ion exchange
Density and particle size based separation 1 2
Distillation 2
Electrolysis
Electrokinetic separation
Magnetic separation 1
Eddy-current separation 1
Stabilization and/or Solidification
Addition of hydraulic binders 1 1,3
Addition of pore-filling additives 1,2 1
Chemical stabilization 1 1
Thermal Treatment Sintering 1 1,3
Melting/vitrification 1,3 1,3
NOTES:
1 = Part of existing and proven treatment technology
2 = Have shown promising results, may be expected to be included in future treatment systems
3 = Currently under investigation or have been investigated and not found technically and/or economically feasible
10.3.2 Alternative Uses of Bottom Ash
Recent developments have focused on recycling and reusing bottom ash for construction purposes
such as use in asphalt, cement bound materials, and pavement concrete. Bottom ash often shares
similar physical and chemical characteristics to conventional aggregates used in construction and
therefore may be suitable for substitution in some applications.
The main issues regarding the reuse and recycling of bottom ash are the release of harmful
contaminants into the environment, and the requirement that the ash material meets specific
technical material requirements to ensure that it has similar characteristics to the traditional materials
being used for the same purpose.[286]
285 Kosson, D.S. and van der Sloot, H.A. Integration of Testing Protocols for Evaluation of Contaminant Release from Monolithic and
Granular Wastes. In: Waste Materials In Construction – Putting Theory into Practice. Studies in Environmental Science 71. Eds. J.J.J.M Goumans, G.J. Senden, and H.A. van der Sloot. Elsevier Science Publishers, Amsterdam, 1997, 201-216
286 Characteristics, Treatment and Utilization of Residues from Municipal Waste Incineration. H.A. van der Sloot, et al. 2001

Waste to Energy
A Technical Review of Municipal Solid Waste Thermal Treatment Practices
Final Report
Section 10: Management of WTE Residues
March 2011
Project No. 1231-10166
10-23
In Europe, bottom ash recycling is very common. Bottom ash has been used successfully in Europe as:
Embankment fill
Road base material
Aggregate for asphalt
Aggregate for concrete building blocks
Daily cover material for landfills.
The following table (Table 10-7) illustrates how bottom ash is utilized in various countries worldwide
and the percent of bottom ash generated in these jurisdictions which is landfilled.[287]
Table 10-7: Quantity of Bottom Ash Produced and Utilized in Various Countries Worldwide
Country Primary Type of Utilization Bottom Ash Landfilled
Tonnes Percent
Belgium Construction Material No Data –
Czech Republic Landfill construction 12,577 11%
Denmark Primarily used as granular sub-base for car parking, bicycle paths and paved and un-paved roads, embankments and filler material for land reclamation.
[288]
15,348 2%
France Road construction 707,030 23%
Germany Civil works, Sub-paving applications 868,200 28%
Italy Civil works, based material for landfill 602,940 80%
Netherlands Road construction and embankments 150,000 13%
Norway Landfill construction 95,000 48%
Switzerland Landfill 600,000 100%
Spain Road construction No data –
Sweden Civil works and landfill construction No data –
UK Road construction, concrete aggregate No data –
USA Road construction and landfill No data 90%
Barriers to the utilization of bottom ash[289]
include:
Hazardous waste – a small percentage of MSW bottom ash can be at risk of being
classified as hazardous waste due to its high concentration of lead (>0.25%). This risk is
directly related to lead concentration in the in-feed waste.
Competition from other recyclables – in some cases there are other less polluted
recyclables/materials which can be used for the same purpose.
287 Management of Bottom Ash from WTE Plants. An overview of management options and treatment methods 288 Thomas Astrup. Pretreatment and utilization of waste incineration bottom ashes: Danish experiences. 2007 289 Management of Bottom Ash from WTE Plants. An overview of management options and treatment methods

Waste to Energy
A Technical Review of Municipal Solid Waste Thermal Treatment Practices
Final Report
Section 10: Management of WTE Residues
March 2011
Project No. 1231-10166 10-24
Easy access to landfill – cheap prices for landfill disposal discourages bottom ash
utilization (e.g., Germany).
Easy access to natural resources – abundance of cheap gravel and soil acts as a barrier
to utilization (e.g., Switzerland) as an aggregate substitute.
Export – possibilities of cheap disposal in landfills/mines of neighbouring countries can
hinder usage.
Leaching of salts and trace metals – potential for leaching must be addressed, often via
stabilization.
Practical barriers – if a contractor is not aware that bottom ash can be used it will be a
barrier, limited amounts of bottom ash is a practical obstacle.
Regulatory barriers – alternative uses of bottom ash are generally more difficult to permit in
jurisdictions that are unfamiliar with such uses, and regulatory change may be necessary in
order to permit such uses.
10.3.3 Treatment and Alternative Use of APC Residues
Table 10-8 presents an overview of the predominant management strategies currently being used for
managing Fly Ash and/or APC residues in various countries around the world.
Table 10-8: Overview of Management Strategies Used for APC Residue in Various Countries
[290]
Country Management Strategies of Fly Ash and APC Residue
United States APC residues and bottom ash are mixed at most MSW incineration plants and disposed as a “combined ash”. The most frequent approach used is disposal in landfills which receive only incineration residues (ash monofills).
Canada Bottom ash is typically non-hazardous and can have beneficial use or is deposited in a municipal landfill without extraordinary precautions. APC residues are disposed in a hazardous waste landfill after treatment or can be stabilized to reduce leachability and then landfilled.
Sweden APC residues are disposed in secure landfills after treatment.
Denmark APC residues and fly ash are classified as special hazardous waste and are currently exported. Significant efforts are being spent to develop treatment methods that can guarantee that APC residues can be landfilled in a sustainable way.
Germany The APC residues are mainly disposed of in underground disposal sites, such as old salt mines.
Netherlands Flue gas cleaning wastes are disposed temporarily in large sealed bags at a controlled landfill until better options are available. The utilization of APC residues is presently not considered. The re-use of the waste is subject to investigation.
290 Treatment and use of air pollution control residues from MSW incineration: An overview. Quina, et al. 2007
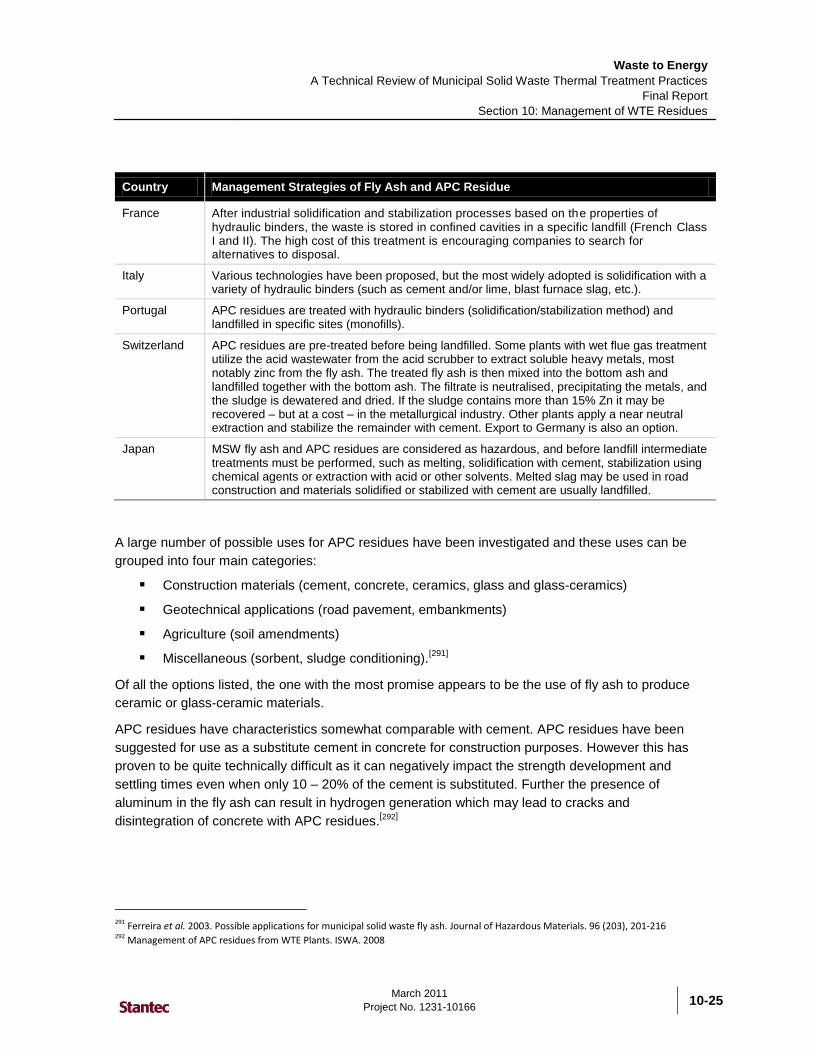
Waste to Energy
A Technical Review of Municipal Solid Waste Thermal Treatment Practices
Final Report
Section 10: Management of WTE Residues
March 2011
Project No. 1231-10166
10-25
Country Management Strategies of Fly Ash and APC Residue
France After industrial solidification and stabilization processes based on the properties of hydraulic binders, the waste is stored in confined cavities in a specific landfill (French Class I and II). The high cost of this treatment is encouraging companies to search for alternatives to disposal.
Italy Various technologies have been proposed, but the most widely adopted is solidification with a variety of hydraulic binders (such as cement and/or lime, blast furnace slag, etc.).
Portugal APC residues are treated with hydraulic binders (solidification/stabilization method) and landfilled in specific sites (monofills).
Switzerland APC residues are pre-treated before being landfilled. Some plants with wet flue gas treatment utilize the acid wastewater from the acid scrubber to extract soluble heavy metals, most notably zinc from the fly ash. The treated fly ash is then mixed into the bottom ash and landfilled together with the bottom ash. The filtrate is neutralised, precipitating the metals, and the sludge is dewatered and dried. If the sludge contains more than 15% Zn it may be recovered – but at a cost – in the metallurgical industry. Other plants apply a near neutral extraction and stabilize the remainder with cement. Export to Germany is also an option.
Japan MSW fly ash and APC residues are considered as hazardous, and before landfill intermediate treatments must be performed, such as melting, solidification with cement, stabilization using chemical agents or extraction with acid or other solvents. Melted slag may be used in road construction and materials solidified or stabilized with cement are usually landfilled.
A large number of possible uses for APC residues have been investigated and these uses can be
grouped into four main categories:
Construction materials (cement, concrete, ceramics, glass and glass-ceramics)
Geotechnical applications (road pavement, embankments)
Agriculture (soil amendments)
Miscellaneous (sorbent, sludge conditioning).[291]
Of all the options listed, the one with the most promise appears to be the use of fly ash to produce
ceramic or glass-ceramic materials.
APC residues have characteristics somewhat comparable with cement. APC residues have been
suggested for use as a substitute cement in concrete for construction purposes. However this has
proven to be quite technically difficult as it can negatively impact the strength development and
settling times even when only 10 – 20% of the cement is substituted. Further the presence of
aluminum in the fly ash can result in hydrogen generation which may lead to cracks and
disintegration of concrete with APC residues.[292]
291 Ferreira et al. 2003. Possible applications for municipal solid waste fly ash. Journal of Hazardous Materials. 96 (203), 201-216 292 Management of APC residues from WTE Plants. ISWA. 2008

Waste to Energy
A Technical Review of Municipal Solid Waste Thermal Treatment Practices
Final Report
Section 10: Management of WTE Residues
March 2011
Project No. 1231-10166 10-26
In addition to alternative uses, several components present in fly ash may be recovered and used
again. The primary interest is centered on the recovery of salts, acid, gypsum, and metals.[293]
Salts – salt recovery directly from the residues is possible after water extraction. This has
been considered in conjunction with several treatment technologies generating salt
containing process water. This technique is in commercial use today.
Acid – the solution from a first scrubber stage of a multi-stage APC setup is essentially
concentrated hydrochloric acid. Techniques to recover this acid are in commercial use.
Gypsum – production of gypsum can be achieved based on recovery of gypsum from the
scrubber solution from alkaline scrubbers. This technique is in commercial use.
Metals – metals can be recovered using extraction and thermal techniques. This technique
is in commercial use.
Several different treatment options have been developed to make APC residues suitable for disposal
or for other alternative uses. As discussed previously, these can be broken down into three main
treatment types: separation, stabilization/solidification, and thermal treatment. In practice it may be
useful to start the treatment with separation techniques (mainly washing or leaching with fluid
solutions that are more aggressive than water) followed by thermal treatment or
stabilization/solidification methods.
Separation methods are those that allow the removal or extraction of unwanted materials from the
residue so that the residue is of higher quality and can be used for other purposes or the unwanted
materials can be captured for other uses. Specific examples of separation techniques include
washing processes, leaching (for heavy metal removal), electrochemical processes, and thermal
treatment (evaporation). Some methodologies are very effective at removing the hazardous
substances, and consequently non-hazardous materials can be obtained. Separation processes can
also be used as the first step for further treatments. One study stated that the removal of soluble
salts is crucial for sustainable treatment of APC Residue and if the APC residue is going to be used
for another purpose.[294]
Solidification/stabilization (S/S) processes are those that use additives or binders in order to
physically and/or chemically immobilize hazardous components initially present in the waste.
Solidification reduces the mobility of the contaminants found in the APC residue through
encapsulation. Stabilization acts to convert the contaminants into less soluble or less toxic forms,
with or without solidification. In practice, it is often useful to combine stabilization with solidification in
order to further reduce the chances that hazardous materials can leach out of the APC residues.
Cements and pozzolanic materials are the most common binders. In Europe, S/S methods are
commonly used to treat APC residue due to the low cost of this approach and as this technology is
293 Management of APC residues from WTE Plants. ISWA. 2008 294 Quina, et al. Treatment and use of air pollution control residues from MSW incineration: An overview. Waste Management. 2008

Waste to Energy
A Technical Review of Municipal Solid Waste Thermal Treatment Practices
Final Report
Section 10: Management of WTE Residues
March 2011
Project No. 1231-10166
10-27
well established. It appears that most of the current research regarding APC residue management
involves investigation of solidification with binders, using in particular Portland cement.[295]
Thermal methods are those that involve the use of high heat to induce physicochemical changes in
the APC residues that reduces the volume and potential for leaching from the material while
producing a stable and non-hazardous slag.[296]
The thermal option is highly effective at reducing the
opportunities for the leaching of hazardous substances from the APC residues, reducing the volume
of the material (therefore using less landfill space), and also destroying dioxins/furans which may be
present in the residue. Thermal methods can be broken down into three main categories: sintering,
vitrification, and melting (or fusion). The main drawback to the thermal treatment of APC residues is
the high cost involved. Thermally treated fly ash results in the production of an environmentally
stable material for which secondary applications can be found.
Generally speaking, lower costs are associated with the stabilization/solidification methods than with
the separation or thermal treatment options.
10.3.4 Ash Management in Canada
In general, bottom ash is suitable for deposition in a permitted landfill or for selective beneficial use
as a construction material. APC residue is generally not suitable for reuse given the concentration of
hazardous constituents, the difficulty in stabilizing the ash for beneficial use, and the history of
managing this ash as a hazardous waste. Typically, APC residue is stabilized then disposed in a
designated monocell in a landfill.
As mentioned previously in this report, there are currently seven operating Canadian MSW
thermal treatment facilities. Table 10-9 provides an overview of the generated quantity and the
utilization/disposal of the bottom ash and fly ash/APC residues produced by these facilities as of
2006. Over 183,000 tonnes of bottom ash and over 26,000 tonnes of fly ash and APC residue were
generated in 2006 from the four largest facilities. The average quantity of bottom ash at these
facilities was 25% by weight of input material. Fly ash and APC residue combined represented 4%
of the input waste. Information on the quantity of ash generated at two of the operating facilities
was not available.
295 Quina, et al. Treatment and use of air pollution control residues from MSW incineration: An overview. Waste Management. 2008 296 Air pollution control residues from waste incineration: Current UK situation and assessment of alternative technologies. Rani, et al. 2007
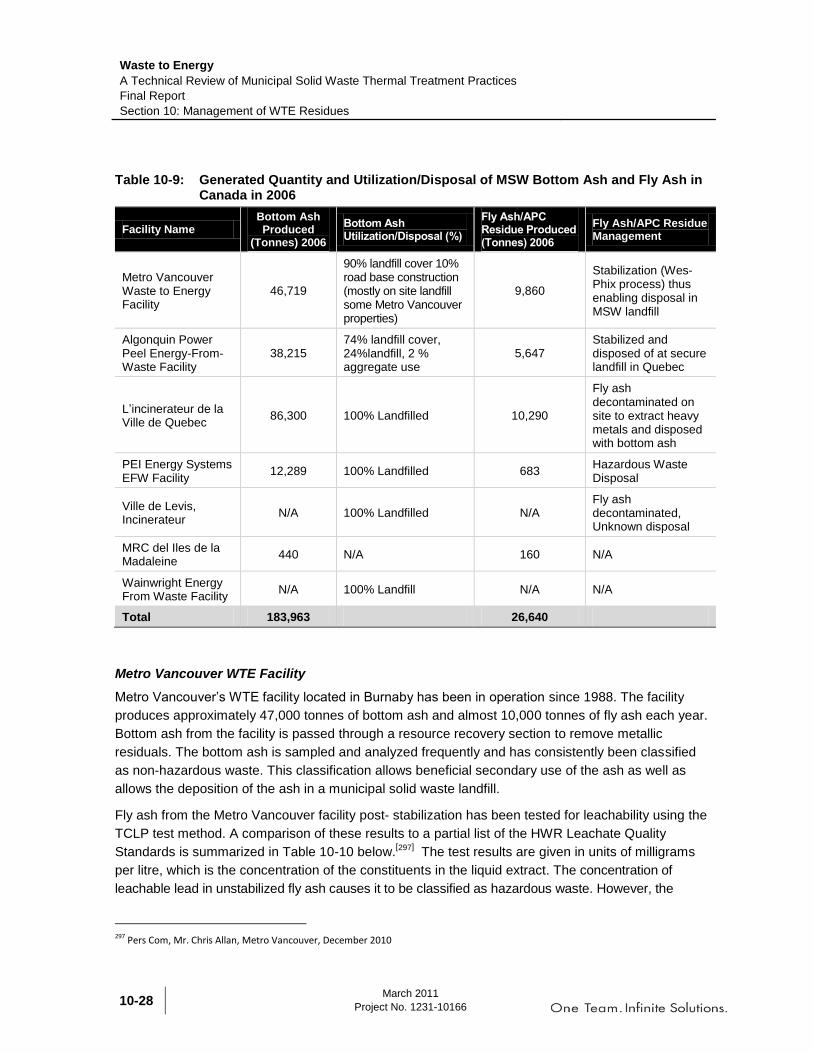
Waste to Energy
A Technical Review of Municipal Solid Waste Thermal Treatment Practices
Final Report
Section 10: Management of WTE Residues
March 2011
Project No. 1231-10166 10-28
Table 10-9: Generated Quantity and Utilization/Disposal of MSW Bottom Ash and Fly Ash in Canada in 2006
Facility Name Bottom Ash Produced
(Tonnes) 2006
Bottom Ash Utilization/Disposal (%)
Fly Ash/APC Residue Produced (Tonnes) 2006
Fly Ash/APC Residue Management
Metro Vancouver Waste to Energy Facility
46,719
90% landfill cover 10% road base construction (mostly on site landfill some Metro Vancouver properties)
9,860
Stabilization (Wes-Phix process) thus enabling disposal in MSW landfill
Algonquin Power Peel Energy-From-Waste Facility
38,215 74% landfill cover, 24%landfill, 2 % aggregate use
5,647 Stabilized and disposed of at secure landfill in Quebec
L‟incinerateur de la Ville de Quebec
86,300 100% Landfilled 10,290
Fly ash decontaminated on site to extract heavy metals and disposed with bottom ash
PEI Energy Systems EFW Facility
12,289 100% Landfilled 683 Hazardous Waste Disposal
Ville de Levis, Incinerateur
N/A 100% Landfilled N/A Fly ash decontaminated, Unknown disposal
MRC del Iles de la Madaleine
440 N/A 160 N/A
Wainwright Energy From Waste Facility
N/A 100% Landfill N/A N/A
Total 183,963 26,640
Metro Vancouver WTE Facility
Metro Vancouver‟s WTE facility located in Burnaby has been in operation since 1988. The facility
produces approximately 47,000 tonnes of bottom ash and almost 10,000 tonnes of fly ash each year.
Bottom ash from the facility is passed through a resource recovery section to remove metallic
residuals. The bottom ash is sampled and analyzed frequently and has consistently been classified
as non-hazardous waste. This classification allows beneficial secondary use of the ash as well as
allows the deposition of the ash in a municipal solid waste landfill.
Fly ash from the Metro Vancouver facility post- stabilization has been tested for leachability using the
TCLP test method. A comparison of these results to a partial list of the HWR Leachate Quality
Standards is summarized in Table 10-10 below.[297]
The test results are given in units of milligrams
per litre, which is the concentration of the constituents in the liquid extract. The concentration of
leachable lead in unstabilized fly ash causes it to be classified as hazardous waste. However, the
297 Pers Com, Mr. Chris Allan, Metro Vancouver, December 2010
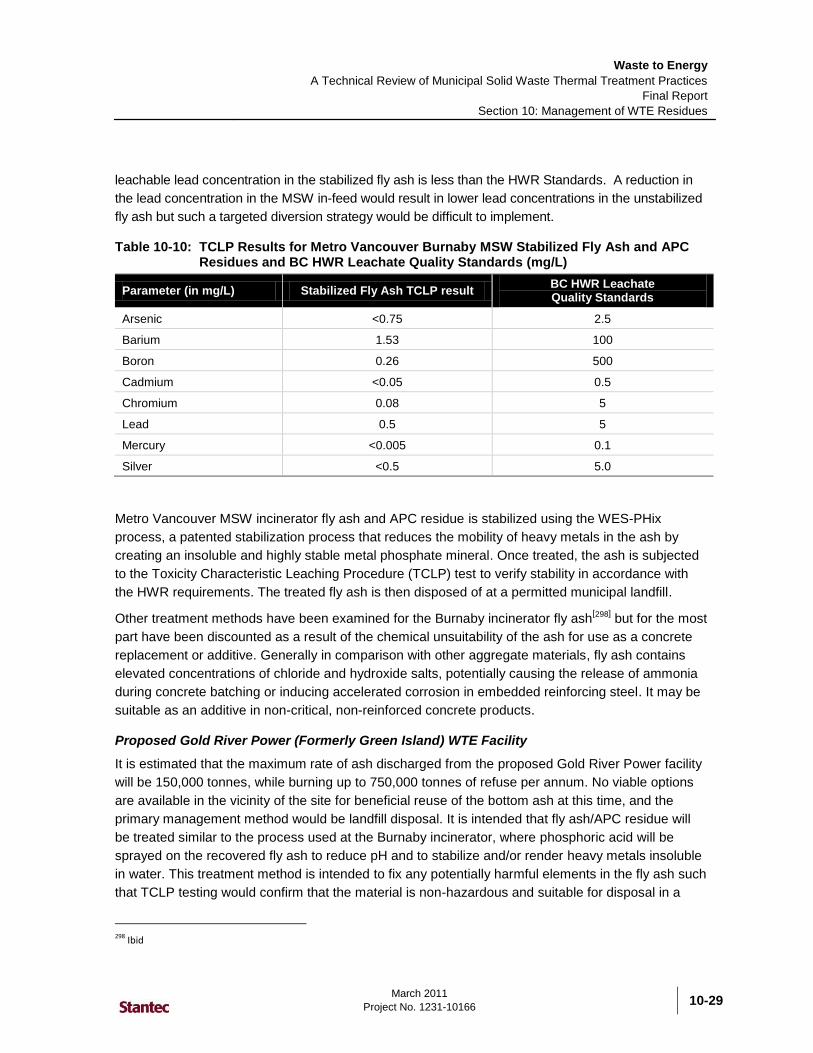
Waste to Energy
A Technical Review of Municipal Solid Waste Thermal Treatment Practices
Final Report
Section 10: Management of WTE Residues
March 2011
Project No. 1231-10166
10-29
leachable lead concentration in the stabilized fly ash is less than the HWR Standards. A reduction in
the lead concentration in the MSW in-feed would result in lower lead concentrations in the unstabilized
fly ash but such a targeted diversion strategy would be difficult to implement.
Table 10-10: TCLP Results for Metro Vancouver Burnaby MSW Stabilized Fly Ash and APC Residues and BC HWR Leachate Quality Standards (mg/L)
Parameter (in mg/L) Stabilized Fly Ash TCLP result BC HWR Leachate Quality Standards
Arsenic <0.75 2.5
Barium 1.53 100
Boron 0.26 500
Cadmium <0.05 0.5
Chromium 0.08 5
Lead 0.5 5
Mercury <0.005 0.1
Silver <0.5 5.0
Metro Vancouver MSW incinerator fly ash and APC residue is stabilized using the WES-PHix
process, a patented stabilization process that reduces the mobility of heavy metals in the ash by
creating an insoluble and highly stable metal phosphate mineral. Once treated, the ash is subjected
to the Toxicity Characteristic Leaching Procedure (TCLP) test to verify stability in accordance with
the HWR requirements. The treated fly ash is then disposed of at a permitted municipal landfill.
Other treatment methods have been examined for the Burnaby incinerator fly ash[298]
but for the most
part have been discounted as a result of the chemical unsuitability of the ash for use as a concrete
replacement or additive. Generally in comparison with other aggregate materials, fly ash contains
elevated concentrations of chloride and hydroxide salts, potentially causing the release of ammonia
during concrete batching or inducing accelerated corrosion in embedded reinforcing steel. It may be
suitable as an additive in non-critical, non-reinforced concrete products.
Proposed Gold River Power (Formerly Green Island) WTE Facility
It is estimated that the maximum rate of ash discharged from the proposed Gold River Power facility
will be 150,000 tonnes, while burning up to 750,000 tonnes of refuse per annum. No viable options
are available in the vicinity of the site for beneficial reuse of the bottom ash at this time, and the
primary management method would be landfill disposal. It is intended that fly ash/APC residue will
be treated similar to the process used at the Burnaby incinerator, where phosphoric acid will be
sprayed on the recovered fly ash to reduce pH and to stabilize and/or render heavy metals insoluble
in water. This treatment method is intended to fix any potentially harmful elements in the fly ash such
that TCLP testing would confirm that the material is non-hazardous and suitable for disposal in a
298 Ibid
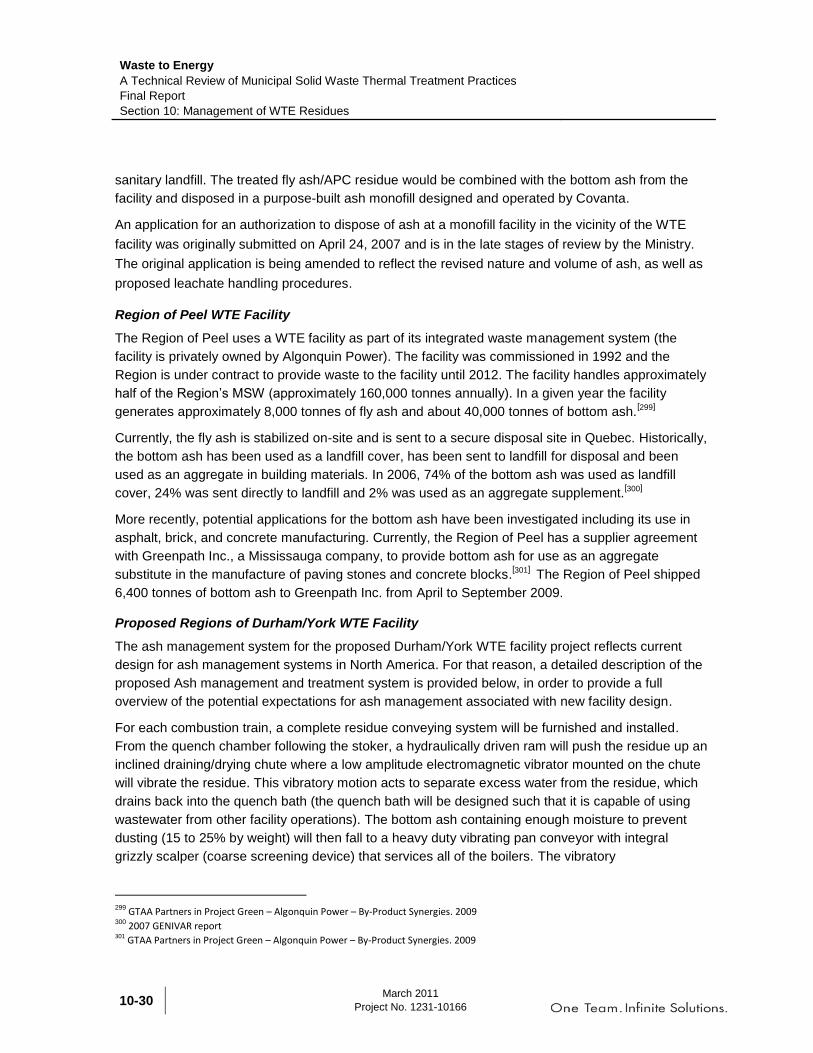
Waste to Energy
A Technical Review of Municipal Solid Waste Thermal Treatment Practices
Final Report
Section 10: Management of WTE Residues
March 2011
Project No. 1231-10166 10-30
sanitary landfill. The treated fly ash/APC residue would be combined with the bottom ash from the
facility and disposed in a purpose-built ash monofill designed and operated by Covanta.
An application for an authorization to dispose of ash at a monofill facility in the vicinity of the WTE
facility was originally submitted on April 24, 2007 and is in the late stages of review by the Ministry.
The original application is being amended to reflect the revised nature and volume of ash, as well as
proposed leachate handling procedures.
Region of Peel WTE Facility
The Region of Peel uses a WTE facility as part of its integrated waste management system (the
facility is privately owned by Algonquin Power). The facility was commissioned in 1992 and the
Region is under contract to provide waste to the facility until 2012. The facility handles approximately
half of the Region‟s MSW (approximately 160,000 tonnes annually). In a given year the facility
generates approximately 8,000 tonnes of fly ash and about 40,000 tonnes of bottom ash.[299]
Currently, the fly ash is stabilized on-site and is sent to a secure disposal site in Quebec. Historically,
the bottom ash has been used as a landfill cover, has been sent to landfill for disposal and been
used as an aggregate in building materials. In 2006, 74% of the bottom ash was used as landfill
cover, 24% was sent directly to landfill and 2% was used as an aggregate supplement.[300]
More recently, potential applications for the bottom ash have been investigated including its use in
asphalt, brick, and concrete manufacturing. Currently, the Region of Peel has a supplier agreement
with Greenpath Inc., a Mississauga company, to provide bottom ash for use as an aggregate
substitute in the manufacture of paving stones and concrete blocks.[301]
The Region of Peel shipped
6,400 tonnes of bottom ash to Greenpath Inc. from April to September 2009.
Proposed Regions of Durham/York WTE Facility
The ash management system for the proposed Durham/York WTE facility project reflects current
design for ash management systems in North America. For that reason, a detailed description of the
proposed Ash management and treatment system is provided below, in order to provide a full
overview of the potential expectations for ash management associated with new facility design.
For each combustion train, a complete residue conveying system will be furnished and installed.
From the quench chamber following the stoker, a hydraulically driven ram will push the residue up an
inclined draining/drying chute where a low amplitude electromagnetic vibrator mounted on the chute
will vibrate the residue. This vibratory motion acts to separate excess water from the residue, which
drains back into the quench bath (the quench bath will be designed such that it is capable of using
wastewater from other facility operations). The bottom ash containing enough moisture to prevent
dusting (15 to 25% by weight) will then fall to a heavy duty vibrating pan conveyor with integral
grizzly scalper (coarse screening device) that services all of the boilers. The vibratory
299 GTAA Partners in Project Green – Algonquin Power – By-Product Synergies. 2009 300 2007 GENIVAR report 301 GTAA Partners in Project Green – Algonquin Power – By-Product Synergies. 2009
Waste to Energy
A Technical Review of Municipal Solid Waste Thermal Treatment Practices
Final Report
Section 10: Management of WTE Residues
March 2011
Project No. 1231-10166
10-31
conveyor/grizzly scalper will remove large materials from the bottom ash before it is transferred by
an enclosed inclined conveyor for transport to the residue storage building (the large materials will be
collected and then transported independently via front-end loader to the residue storage building).
Within the residue storage building a magnetic drum and a vibratory screen will be used to separate
ferrous material from the bottom ash, and an eddy current separator will be used to remove the non-
ferrous metal from the bottom ash. After separation, each material will be directed into dedicated
storage bunkers that will store four days worth of each material. A front end loader will stack and
recast the materials. The front end loader will also load residue trucks inside the residue building that
will take the residue to its final disposal location. Similar to waste delivery trucks the residue trucks
will enter and exit through two motor operated doors, triggered automatically by inbound and outbound
vehicles to open and close as required. To minimize any dust escaping to the environment during the
conveying, separating, and truck loading process, the residue building will be totally enclosed and have
a filtered ventilation system complete with a filtration unit (baghouse). The ventilation system will also
draw air from the grizzly area and along the enclosed conveyor gallery. The residue storage building
will not be connected to any other structure to prevent dust from infiltrating other parts of the Facility.
Following appropriate testing to ensure the material is not hazardous as defined and regulated by the
Province, the bottom ash will be transported to a licensed landfill facility. At the time of this submission,
it is anticipated that the bottom ash will be utilized as daily cover material. Covanta‟s Research and
Development group are continually investigating new and more beneficial uses for this material.
Fly ash will be collected and managed separately from bottom ash.
The fly ash handling system for each combustion train will collect the fly ash from the convection
pass, superheater, economizer and the APC system of that train. Fly ash will be collected via
intermediate conveyors which will discharge into one of two redundant ash surge bins. The fly ash
conveyors will be water and dust proof. Each ash surge bin will feed an ash conditioner/mixer (pugmill)
that will combine and thoroughly mix the ash with Portland cement, pozzolan and water to fix any
potentially harmful elements in the fly ash. The conditioned fly ash will then be discharged into the first
of seven dedicated conditioned fly ash bunkers in the residue building.
Each bunker will hold three days worth of conditioned fly ash. To maintain a consistent and
manageable product, the conditioned fly ash will be turned regularly. After three days, the fly ash will
be transferred to the adjacent three-day storage bunker. This process will be repeated as required
for a total curing period of up to 21 days (three days in each of the seven bunkers). After the fly ash
has cured, it will be loaded into transportation vehicles by the front end loader. The conditioned fly
ash will be kept separate from the bottom ash in the residue building.
In Ontario, fly ash is designated as hazardous and therefore must be managed in accordance with
Ontario regulatory requirements.
Waste to Energy
A Technical Review of Municipal Solid Waste Thermal Treatment Practices
Final Report
Section 10: Management of WTE Residues
March 2011
Project No. 1231-10166 10-32
10.4 Summary – BAT for Management of Residues
BAT for the management of residues from WTE facilities have been developed by various European
Union Member States. The following list summarizes the generally accepted BAT principles:
The separate management of bottom ash from fly ash and APC residues to avoid
contamination of the bottom ash.
Each type of ash should be assessed for potential for recovery either alone or in
combination. It is important to assess the levels of contaminants in bottom ash and fly ash to
assess whether separation or mixing is appropriate.
Ferrous and non-ferrous metals should be recovered from the bottom ash to the extent
practical and economically viable.
If pre-dusting stages are used by the APC system, an assessment of the composition of the
fly ash should be carried out to assess whether it may be recovered, either directly or after
treatment, rather than disposed of at a secure landfill.
The treatment of bottom ash (either on or off site) by a suitable combination of:
Dry bottom ash treatment with or without ageing
Wet bottom ash treatment with or without ageing
Thermal treatment, or
Screening and crushing.
Treat APC residues to the extent required to meet the acceptance criteria for the waste
management option selected for them (i.e., cement solidification, thermal treatment, acid
extraction etc.).
In BC, BAT for the management of MSW incineration ash includes:
Diversion of undesirable constituents in the MSW stream, such as metals removal wherever
possible, to reduce the concentration of the constituents in the residuals.
Aging of bottom ash to improve chemical stability prior to reuse.
Reuse of bottom ash as a construction material substitute, such as a concrete or asphalt
aggregate, road base material, or intermediate cover material at a landfill. Other possible
beneficial reuses should be explored where practical.
Subjecting APC residues to leachability (TCLP) tests to determine if the ash qualifies as
hazardous waste. Ash that is classified as leachable can be managed as hazardous waste
at a secure landfill. Stabilized ash that is rendered non-leachable can be re- classified as
non-hazardous waste and can then be managed as solid waste. The BC Hazardous Waste
Regulation specifies the test methods and limits for classifying residue as hazardous waste.
Stabilization of APC residues from municipal solid waste incineration facilities to reduce
leachability is an acceptable management option. Several proprietary stabilization processes
have been developed and may be successfully applied to APC residue. It is important to test

Waste to Energy
A Technical Review of Municipal Solid Waste Thermal Treatment Practices
Final Report
Section 10: Management of WTE Residues
March 2011
Project No. 1231-10166
10-33
the leachability of the stabilized waste using the TCLP test. Materials that contain
concentrations less than the leachability standards provided in Table 1 of the HWR are not
considered hazardous waste and can then be deposited in a suitably designed monofill at an
authorized MSW landfill. Stabilized material that does not meet the HWR leachate standards
must be managed as hazardous waste, which in BC requires out-of-province disposal.
APC residues and fly ash from the incineration of biomass, wood and land clearing wastes
and some RDF should also be subjected to the TCLP test. The absence of constituents of
concern in these materials entering the thermal treatment facility results in the residue being
more likely to pass the leachate criteria and be suitable for landfilling or reuse similar to
bottom ash.
In practical terms, bottom ash from the Burnaby incinerator is deposited in a municipal landfill.
Fly ash and APC residue is stabilized (as described above) then placed in a municipal landfill.
The separate management of bottom ash from fly ash and APC residues to avoid contamination
of the bottom ash may not be a necessary approach in some contexts in BC. Generally, this
would be a best practice approach for WTE facilities located in areas that have reasonable
access to potential markets for reuse of the bottom ash, but this approach may be impractical for
facilities in more isolated locations. Disposal of combined bottom ash and treated APC residue in
a suitably designed secure facility and/or stabilization of the combined ash waste would be
acceptable option where beneficial reuse of these residues is unfeasible.
Waste to Energy
A Technical Review of Municipal Solid Waste Thermal Treatment Practices
Final Report
Section 10: Management of WTE Residues
March 2011
Project No. 1231-10166 10-34
THIS PAGE INTENTIONALLY LEFT BLANK.

Waste to Energy
A Technical Review of Municipal Solid Waste Thermal Treatment Practices
Final Report
Section 11: Conclusions and Recommendations
March 2011
Project No. 1231-10166
11-1
11 CONCLUSIONS AND RECOMMENDATIONS
Conclusions and recommendations reached following the review of technologies, BAT, BACT and
the regulatory approaches in other jurisdictions, and considerations for regulatory change in BC can
be summarized as follows:
Conclusions
1. Mass burn incineration continues to be the most common method of thermal treatment for
WTE facilities. It is reasonable to anticipate that this technology would be proposed for new
WTE facilities contemplated in BC.
2. Other thermal treatment technologies such as gasification, plasma gasification and pyrolysis
have historically had certain limitations due to their complexity, difficulty in handling
variations in the waste stream (which can be managed by waste pre-treatment), and lower
net energy recovery (electricity and heat energy) once in-plant parasitic consumption is
accounted for. These factors tend to make these other thermal treatment technologies less
viable. However, the industry continues to evolve and facilities that treat a portion of the
waste stream are being proposed, developed and commissioned. As more actual
performance data is generated, it will be better understood if the limitations of these
approaches can be resolved.
3. The 1991 BC Emission Criteria for Municipal Solid Waste Incinerators (1991 BC Criteria) cut
off between small and large facilities of 400 kg/hour (equivalent to 9.6 tonnes per day) was
put in place to differentiate between small facilities used for remote locations and/or on-site
waste management and larger WTE facilities. In Europe WTE operations generally handle
an average of 20 to 30 tonnes of MSW per hour (480 to 720 tonnes per day). To-date, various
studies indicate that it is difficult for commercial WTE facilities to be economically viable at
annual capacities less than 10 tonnes per hour (equivalent to 100,000 tonnes per year actual
throughput), unless there is a local economic driver (e.g., high value local market for heat
energy, high transportation costs and//or difficult logistics associated with other disposal
options). In some jurisdictions (e.g., Ontario) differentiation between large and small facilities
results in differentiation of approvals processes (large WTE requires full Environmental
Assessment (EA) Screening, small WTE does not) however, in regards to air emissions the
same criterion/limits apply regardless of size to all WTE applications except for very small
scale research applications. Other jurisdictions (e.g., United States Environmental Protection
Agency (US EPA)) apply different criterion/limits for smaller scale WTE approaches. For the
purpose of regulating MSW incineration in the BC context, it seems reasonable that the cut-
off of 400 kg/h between small and large facilities should be maintained.
4. The 1991 BC Criteria currently include the key substances of concern that would be
released from the main stack (point source) of an existing or new WTE facility. The 1991 BC
Criteria do not, however, provide limits for speciated total particulate matter in the 10 micron
(PM10) and 2.5 micron (PM2.5) size fractions. This approach is consistent with emission limits
observed in other jurisdictions evaluated in this report. The value of specifying limits for
Waste to Energy
A Technical Review of Municipal Solid Waste Thermal Treatment Practices
Final Report
Section 11: Conclusions and Recommendations
March 2011
Project No. 1231-10166 11-2
speciated particulate matter has not been demonstrated and thus limits for these parameters
have not been identified in the proposed revisions.
5. The 1991 BC Criteria do not consider fugitive emissions including dust, odour, and Volatile
Organic Compounds (VOCs).
6. The specification of temperature and retention time in the combustion zone varies between
North America and the EU, although generally these jurisdictions define the combustion
zone in a similar fashion (measured after the last point of air injection). In North America, a
minimum temperature of 1,000oC with a retention time of 1 second is typical. In the EU, the
specification is a minimum of 850oC with a retention time of 2 seconds. Operated correctly
within the design criteria for the incinerator, both specifications should produce an
acceptable quality of emission before entering the APC. Flexibility in specifying these
operating parameters should be considered and the appropriate balance of temperature and
retention time applied on a facility-specific basis.
In most jurisdictions, guidance on design and operation of WTE facilities is provided
including recommendations related to combustion temperature and residence time, and also
for other parameters such as combustion air distribution, oxygen availability, operation of
APC systems and ash management. In these jurisdictions as in BC, the recommendations
are not intended to restrict technology development or to dictate facility design or equipment
selection. Alternative designs and operating conditions may be proposed for approval, and
considered by the regulatory authority, provided that the systems are designed and operated
such that the Emission Limit Values (ELVs) can be achieved. Proponents are expected to
provide sufficient technical information to the regulatory authority to justify alternative design
and operational parameters. Once approved, these parameters are reflected in the
operational permit(s) and/or conditions set out for the facility.
7. The most common and effective air pollution systems applied to WTE facilities are dry/semi
dry, wet and semi wet systems. Several types of “end of pipe” air pollution controls have
been applied to WTE facilities. The selection of best technology (either BACT or BAT)
depends on the nature of the waste, design of the combustion process, flue gas composition
and fluctuation, energy supply, energy recovery and a number of other considerations.
8. Modern WTE facilities are capable of achieving substantial emission reduction through the
use of emission control technology. Reductions in the contaminants of concern across the
air pollution control system (APC) typically range from 90% up to 99.95% through the
application of typical APC systems.
9. Management of NOx can be accomplished through both Selective Non-Catalytic Reduction
(SNCR) and Selective Catalytic Reduction (SCR) systems, with economics in the form of
direct costs (including reagent and energy consumption) or financial incentives (e.g., tax
regimes) playing a role in the decision regarding which system is selected and in how the
system is operated. Lower NOx emissions can regularly be achieved through SCR. With
SNCR, the level of NOx reduction achieved is often linked to immediate economic drivers
since increasing quantities of ammonia injection (i.e., use of additional reagent) are required

Waste to Energy
A Technical Review of Municipal Solid Waste Thermal Treatment Practices
Final Report
Section 11: Conclusions and Recommendations
March 2011
Project No. 1231-10166
11-3
to achieve lower emission levels. There is also a trade-off with SNCR, as the odour
associated with ammonia slippage (stack ammonia releases due to excess ammonia not
reacting with NOx) must be considered.
10. Emission releases from WTE facilities have decreased substantially in the US between 1990
and 2005. SOx and NOx have been reduced by 88% and 24% respectively. The reductions
have resulted from improvements in thermal treatment technology and operational control,
improvements in waste diversion and source separation prior to thermal treatment, and
improvements in the design and operation of the APC equipment.
11. The EU Energy Efficiency Equation will be adopted by EU member states by the end of 2010
as a means of differentiating between the energy recovery performance of WTE facilities. In
general, the formula can be used for differentiating between energy recovery and disposal
within a waste hierarchy. The application of the equation varies between the various EU
member states. Further development and definition of the scope and application of the
equations is expected. The ministry‟s Environmental Protection Division operational policy
already states a preference for any MSW incineration facilities to meet energy recovery
criteria (over disposal, determined using an approach similar the Equation). Therefore, it
may be reasonable to modify the Equation to suit a BC context (i.e., modify the energy
equivalency factors for electrical and thermal energy as appropriate) as part of future policy
development in the Province. However, new WTE facilities in BC may not be able to achieve
an energy efficiency of 60% without further development of infrastructure such as district
heating that would facilitate the use of heat generated by a WTE facility, recognizing that a
high efficiency is difficult to reach through the production of electricity alone.
12. In regards to the use of Refuse Derived Fuel (RDF) as substitute fuel in existing industrial or
power generating facilities, the majority of jurisdictions examined in this study use a
regulatory approach that combines some facets of the regulatory environment associated
with WTE facilities (e.g., many of the same stack emissions limits, the same AAQO
requirements) but also tailor these approaches in a more industry specific fashion.
Generally, the approach applied to regulate use of RDF in other jurisdictions includes:
a) Ensuring that the composition of the RDF is similar in regards to fuel value and
general chemical composition to the primary fuel source for the intended combustion
facility (e.g., use of cellulosic waste materials in wood-fired boilers).
b) Requirement for RDF fuel analysis and comparison to current fuels to determine the
potential shift in contaminant mass balance and thus facility emissions.
c) The requirement to complete test burns and stack testing to measure and validate
predicted shifts in emission quality, if any.
d) Application of RDF quality standards, specific to parameters that cannot be
reasonably managed in the proposed industrial application (e.g., avoidance of fuels
with high PVC content if the control of acid gases is unfeasible).
e) Application of the same stack limits applied to WTE facilities, for parameters that are
directly associated with fuel quality (e.g., heavy metals, persistent organic pollutants
Waste to Energy
A Technical Review of Municipal Solid Waste Thermal Treatment Practices
Final Report
Section 11: Conclusions and Recommendations
March 2011
Project No. 1231-10166 11-4
(POPs)) but not for emission parameters that are driven largely by the primary
purpose and design of the facility (e.g., not including SOx emissions for cement kilns
as these emissions are largely driven by raw material quality).
13. In the EU, it is common for emission limits to be linked to monitoring techniques and
corresponding averaging periods. Typically, one-half hour average limits are specified for
parameters measured by continuous monitors, whereas daily average limits are specified for
parameters measured by periodic monitoring. For some parameters, limits for both
continuous and for periodic monitoring are specified. In the US, daily average emission limits
are specified regardless of the monitoring method. The industry trend is towards increased
use of continuous monitoring devices where they can be correlated as equivalent to periodic
monitoring techniques.
14. In the EU, where one-half hour average limits and daily average limits are specified for a
parameter, the one-half hour limit is numerically higher than the daily average limit. The dual
limits acknowledge that the daily average takes into account the fluctuations in the emission
over time, whereas the one-half hour limit more closely represents the maximum allowable
discharge concentration over the shorter averaging period.
15. This report highlights the potential use of the dual standards for some parameters as applied
in the EU. When comparing the emission limits proposed in this report to the 1991 BC
Criteria, the potential monitoring methods applicable for each parameter must be
considered. The proposed limits allow for continuous monitoring where appropriate and
technically feasible and in general these values are greater than the daily average. The limits
also allow for periodic monitoring for parameters that require stack testing and these
proposed daily average limits are equal to, or more stringent than, the 1991 BC Criteria. New
Ministry of Environment policy indicates that all WTE projects will be required to go through
an Environmental Impact Assessment process. This is similar to the approach in jurisdictions
such as Ontario, where all WTE projects (above a minimum size limit) are required to go
through screening under the Ontario Environmental Assessment Act.
16. The BC Hazardous Waste Regulation specifies the methodology for testing leachability of a
waste material and determining if it is classified as hazardous waste. Bottom ash, fly ash and
APC residue should be subjected to the TCLP test and the ash should then be handled
according to the classification.
17. Bottom ash is normally not classified as hazardous waste and it is acceptable practice to
deposit bottom ash in a permitted sanitary landfill or for the ash to be utilized for a beneficial
use, such as intermediate cover, concrete or asphalt aggregate substitution or road base
material. Jurisdictions such as Ontario, recognize that bottom ash from facilities that process
non-hazardous municipal waste and that has organic content of less than 10%, is a non-
hazardous material and do not require that TCLP testing be carried out on such ash, Fly ash
and air pollution control (APC) residue are more likely to contain leachable contaminants and
be classified as hazardous waste. Fly ash and APC residue must be disposed of in a secure
landfill authorized to receive this class of material. Alternatively, the fly ash/APC residue may be
Waste to Energy
A Technical Review of Municipal Solid Waste Thermal Treatment Practices
Final Report
Section 11: Conclusions and Recommendations
March 2011
Project No. 1231-10166
11-5
pre-treated/stabilized to reduce leachability prior to deposition in a municipal sanitary landfill
site. There is limited opportunity for beneficial use of fly ash and APC residues in BC, even
when stabilized, at the present time.
18. The Waste to Energy sector continues to evolve with the advent of new incineration and new
pollution control equipment technology and the further advances in municipal waste
diversion and separation technologies. Regulatory agencies including Ontario Ministry of the
Environment and the US EPA have either recently revised or are considering revisions to
current regulations and criteria. The BC Ministry of Environment should take into account
both the technical and regulatory advances underway in comparable jurisdictions when
developing revised guidelines.
Recommendations
1. The 1991 BC Criteria for municipal solid waste incineration should be updated to reflect
advancements in thermal treatment and pollution control technology and standards applied
in other jurisdictions. A table summarizing the recommended emission limits is provided at
the end of this section.
2. It is recommended that the Waste Discharge Regulation (WDR) exemption for remote
incinerators to accommodate fewer than 100 persons (section 3(7)) remain in place for
remote operations. If a facility is serving over 100 persons and is processing less than
400 kg/hr of municipal solid waste, site specific emission limits should be authorized by the
Ministry. Facilities over the 400 kg/hr capacity limit should be required to meet new revised
emission guidelines as set by the Ministry.
3. The design and operation requirements in the 1991 criteria should continue to apply
including the recommended minimum incineration temperature of 1,000°C and minimum
residence time of 1 second (after final secondary air injection ports). This requirement should
be maintained as the default specification; however proponents should be provided an
opportunity to seek an alternate temperature/retention time specification that would result in
equivalent thermal destruction efficiencies without impacting emission quality. Flexibility in
the application of the temperature and retention time specification is possible, as long as the
quality of the emission is maintained for a specific facility. A minimum temperature of 850°C
with a retention time of 2 seconds could be considered equivalent, depending on the proposed
technology. Adjustments to the temperature profile and retention time for a proposed facility
should be demonstrated as equivalent by a facility proponent at the application stage, and
would be reflected in the approved operating conditions set out for the facility.
4. The potential for fugitive emissions from WTE facilities should be addressed through site
specific design considerations such as maintaining appropriate areas of the facility (e.g.,
receiving and tipping floor) under negative pressure, using indoor facility air for combustion
and specific measures for loading, transfer, storage, accidental loss of containment, as well
as the handling of auxiliary fuels and reagents for the APC systems. Revisions to the 1991
BC Criteria should address fugitive emissions with references to Best Management Plans,
meeting ambient objectives and/or odours at the fence-line or other enforceable criteria.
Waste to Energy
A Technical Review of Municipal Solid Waste Thermal Treatment Practices
Final Report
Section 11: Conclusions and Recommendations
March 2011
Project No. 1231-10166 11-6
5. The revised emission limits presented at the end of this section (also as Table 8-21) should
be considered by the Ministry as proposed new emission criteria for WTE facilities in BC.
6. The recommended revised emission criteria generally reflect two approaches to setting in-
stack emissions limits. The one-half hour limit is intended to be used where the facility uses
continuous monitoring techniques. The one-half hour limit generally represents the maximum
allowable concentration of a contaminant not to be exceeded at any time. The daily average
limit applies when periodic stack sampling is used to characterize the emissions. The daily
average limit should be considered to be the default limit where the facility must use periodic
sampling to determine compliance or where continuous monitoring methods are not
available or practical. Both the daily average and one-half hour limits should apply to
parameters for which continuous monitoring is feasible and conducted, and where periodic
stack sampling is required.
7. The recommended revised emission criteria for particulate adopts a hybrid approach to
emission limit values from other jurisdictions. Where continuous monitoring systems are
used, it is proposed that the concentration of total particulate be less than 9 mg/Rm3 for 97%
of the operating period on a 12 month rolling average, and less than 28 mg/Rm3 for 100% of
the operating period on a 12 month rolling average. Where continuous monitoring systems
for particulate are used, opacity monitoring may not be necessary as a compliance
parameter unless the continuous monitoring system is not functioning. During this scenario,
opacity monitoring can be used as a temporary surrogate until the continuous monitoring
system for particulate is reinstated.
8. The recommended revised emission criteria for metals lead (Pb), arsenic (As) and chromium
(Cr) should be set as the sum of the three metals as determined by periodic sampling with
the ELV being set at 64 ug/Rm3.
9. Where a non-MSW thermal treatment facility intends to substitute fuel with RDF, or C&D
waste, the facility should be required to meet these revised WTE emission criteria for
parameters that are directly associated with fuel quality, such as trace heavy metals and
persistent organic pollutants. For particulate emissions, the facility could be required to meet
new applicable guidelines (for biomass boilers the Ministry may set new limits of 35 mg/m3
for facilities ranging in size from 3 to 39 MWh, and 20 mg/m3 for facilities of 40 MWh and
larger). The facility should still meet their permitted emission parameters that are established
based on the primary purpose and design of the facility, such as SOx, CO and NOx. The
range of permitted emission parameters that are established based on the primary purpose
and design of the facility will vary as appropriate between specific types of existing industrial
installations. This approach is permissive by allowing fuel substitution to occur but also
protective by requiring compliance with the appropriate, more stringent, limits for potentially
harmful contaminants related to the substituted fuel.
10. Generally, the approach applied to regulate use of RDF in BC should be similar to that used
in other jurisdictions, including application of the following sequence of steps during the
permitting process:

Waste to Energy
A Technical Review of Municipal Solid Waste Thermal Treatment Practices
Final Report
Section 11: Conclusions and Recommendations
March 2011
Project No. 1231-10166
11-7
a) Ensuring that the composition of the RDF is similar in regards to fuel value and
general chemical composition to the primary fuel source for the intended combustion
facility (e.g., use of cellulosic waste materials in wood-fired boilers).
b) Requiring RDF fuel analysis and comparison to current fuels within the applications
to use RDF, along with analysis that identifies the potential shift in contaminant
mass balance and thus facility emissions.
c) For use of dissimilar fuels and/or use of RDF where there is some potential for more
significant shifts in emissions or concern regarding the degree of emissions shift
demonstrated through desk top analysis, in addition to the fuel tests/analysis there
should be a requirement to complete test burns and stack testing to measure and
validate predicted shifts in emission quality.
d) Development and application of RDF quality standards and specifications, specific to
parameters that cannot be reasonably managed in the proposed industrial
application (e.g., avoidance of fuels with high PVC content if the control of acid gases
is unfeasible). This would include development of a definition for various fractions of
sorted MSW and construction and demolition waste, for example defining what
constitutes „clean‟ versus „contaminated‟ wood waste suitable for use as a substitute
fuel for wood waste boilers.
e) Application of the same stack limits applied to WTE facilities, for parameters that are
directly associated with fuel quality (e.g., heavy metals, POPs) but not for emission
parameters that are driven largely by the primary purpose and design of the facility
(e.g., not including SOx emissions for cement kilns as these emissions are largely
driven by raw material quality). For those parameters that are driven largely by the
primary purpose and design of the facility, facility specific ELVs will be determined
and applied, potentially resulting in some adjustment to the ELVs for these
parameters as set out in the operating permit.
The above represent preliminary recommendations. Further study is required to determine
the appropriate RDF fuel quality specifications applicable in BC, and to determine the
approach to stack emissions that would be most applicable to each of the major sectors
(pulp mill boilers, lime kilns, cement kilns) that would represent industrial users of RDF in
BC. The Province should consider development of specific regulatory instruments to address
RDF composition (similar to other jurisdictions that regulate RDF composition for various
applications) and use as a fuel alternative.
11. Dispersion modelling should be conducted to assess risks associated with the location and
potential operation of a new WTE facility. Modelling results should show in all cases that
AAQOs established or accepted by the Ministry would be not be exceeded with a wide
margin of safety for all conceivable modes of operation including upsets.
12. Potential effluent discharges from a WTE facility originating from process wastewater
(associated wet flue gas treatment), originating from bottom ash storage, or from other
process wastewater streams (boiler feed water, sanitary wastewater, storm water (either
Waste to Energy
A Technical Review of Municipal Solid Waste Thermal Treatment Practices
Final Report
Section 11: Conclusions and Recommendations
March 2011
Project No. 1231-10166 11-8
contaminated or clean) or used cooling water should be authorized as part of the Solid
Waste Management Plan or under a waste discharge permit with limits determined on a site
specific basis.
13. The current approach in BC used for leachability testing of bottom ash, fly ash and APC
residues is consistent with other jurisdictions. Testing the leachability of the ash continues to
be critical in the decision process for reuse and /or disposal of the bottom ash and APC
residues. The TCLP leachate extraction test prescribed in the BC HWR is a suitable test
method and widely accepted. Bottom ash found to be non-leachable is not hazardous waste
and can have some beneficial use or can be deposited in a permitted landfill. APC residue
from MSW treatment systems will likely be leachable and require stabilization prior to
disposal in a landfill or should be managed as hazardous waste.
14. Separate handling of bottom ash and APC residues represents best practice in order to
optimize recovery and/or beneficial use of bottom ash. New incineration technologies should
be required to identify the characteristics of the facility residuals. If residuals are determined
to have beneficial use characteristics the proponent should demonstrate the associated
environmental benefits and liabilities. If beneficial reuse is not practical, consideration for
comingling the ash for landfilling, with stabilization as may be necessary, may be permitted.
15. In the development of revised WTE guidelines, BC Ministry of Environment should take into
account ongoing technical and regulatory advancements currently evolving in Ontario, the
EU and USA.

Waste to Energy
A Technical Review of Municipal Solid Waste Thermal Treatment Practices
Final Report
Section 11: Conclusions and Recommendations
March 2011
Project No. 1231-10166
11-9
Table 11-1: Proposed Revisons to Emission Criteria for Municipal Solid Waste Incineration in British Columbia
Contaminant Concentration
Units
RECOMMENDED EMISSION LIMITS
C: Continuous P: Periodic
(1)
Daily Average Average Period and Monitoring Method Half Hourly
Average Average Period and Monitoring Method
Total Particulate Matter (TPM)
mg/Rm3 @ 11% O2
C (P for existing facilities)
9 Existing facilities without CEMS may use the arithmetic average of a minimum three individual stack tests per stack conducted in accordance with standard methods.
9(2)
28
1/2 hour average as determined by a continuous emissions monitoring system, achieved 97% of the operating period on a 12 month rolling average.
1/2 hour average as determined by a continuous emissions monitoring system, achieved 100% of the operating period on a 12 month rolling average
Carbon Monoxide (CO) mg/Rm3 @ 11% O2 C 50
Calculated as the arithmetic average of a minimum three individual stack tests per stack conducted in accordance with standard methods, or as the arithmetic average of 24 hours of data from a continuous emissions monitoring system.
100 1/2 hour average as determined by a continuous emissions monitoring system
Sulphur Dioxide (SO2) mg/Rm3 @ 11% O2 C 50
Calculated as the arithmetic average of a minimum three individual stack tests per stack conducted in accordance with standard methods, or as the arithmetic average of 24 hours of data from a continuous emissions monitoring system.
190 1/2 hour average as determined by a continuous emissions monitoring system
Nitrogen Oxides (NOx as NO2)
mg/Rm3 @ 11% O2 C 190
Calculated as the arithmetic average of a minimum three individual stack tests per stack conducted in accordance with standard methods, or as the arithmetic average of 24 hours of data from a continuous emissions monitoring system.
350 1/2 hour average as determined by a continuous emissions monitoring system
Hydrogen Chloride (HCl) mg/Rm3 @ 11% O2 C 10
Calculated as the arithmetic average of a minimum three individual stack tests per stack conducted in accordance with standard methods, or as the arithmetic average of 24 hours of data from a continuous emissions monitoring system.
60 1/2 hour average as determined by a continuous emissions monitoring system
Hydrogen Fluoride (HF) mg/Rm3 @ 11% O2 P/C 1
Calculated as the arithmetic average of a minimum three individual stack tests per stack conducted in accordance with standard methods, or as the arithmetic average of 24 hours of data from a continuous emissions monitoring system.
4 1/2 hour average as determined by a continuous emissions monitoring system
(3).
Total Organic Carbon mg/Rm3 @ 11% O2 C 10
Calculated as the arithmetic average of 24 hours of data from a continuous emissions monitoring system.
20 1/2 hour average as determined by a continuous emissions monitoring system
Arsenic (As) µg/Rm3 @ 11% O2 P
See Pb, As and Cr group
Calculated as the sum of three metals determined by arithmetic average of a minimum three individual stack tests per stack conducted in accordance with standard methods.
N.D.
Cadmium (Cd) µg/Rm3 @ 11% O2 P 7
Calculated as the arithmetic average of a minimum three individual stack tests per stack conducted in accordance with standard methods.
N.D.
Chromium (Cr) µg/Rm3 @ 11% O2 P
See Pb, As and Cr group
Calculated as the sum of three metals determined by arithmetic average of a minimum three individual stack tests per stack conducted in accordance with standard methods.
N.D.
Lead (Pb) µg/Rm3 @ 11% O2 P
See Pb, As and Cr group
Calculated as the sum of three metals determined by arithmetic average of a minimum three individual stack tests per stack conducted in accordance with standard methods.
N.D.
Sum of Lead (Pb), Arsenic (As), Chromium (Cr)
µg/Rm3 @ 11% O2 P 64
Calculated as the sum of three metals determined by arithmetic average of a minimum three individual stack tests per stack conducted in accordance with standard methods.
N.D.
Mercury (Hg) µg/Rm3 @ 11% O2 P or C
(4) 20
Calculated as the arithmetic average of a minimum three individual stack tests per stack conducted in accordance with standard methods, or as the arithmetic average of 24 hours of data from a continuous emissions monitoring system.
N.D.

Waste to Energy
A Technical Review of Municipal Solid Waste Thermal Treatment Practices
Final Report
Section 11: Conclusions and Recommendations
March 2011
Project No. 1231-10166 11-10
Contaminant Concentration
Units
RECOMMENDED EMISSION LIMITS
C: Continuous P: Periodic
(1)
Daily Average Average Period and Monitoring Method Half Hourly
Average Average Period and Monitoring Method
Chlorophenols (5)
µg/Rm3 @ 11% O2 P 1
Calculated as the arithmetic average of a minimum three individual stack tests per stack conducted in accordance with standard methods.
N.D.
Chlorobenzenes (5)
µg/Rm3 @ 11% O2 P 1
Calculated as the arithmetic average of a minimum three individual stack tests per stack conducted in accordance with standard methods.
N.D.
Polycyclic Aromatic Hydrocarbons
(5)
µg/Rm3 @ 11% O2 P 5
Calculated as the arithmetic average of a minimum three individual stack tests per stack conducted in accordance with standard methods.
N.D.
Polychlorinated Biphenyls (5)
µg/Rm3 @ 11% O2 P 1
Calculated as the arithmetic average of a minimum three individual stack tests per stack conducted in accordance with standard methods.
N.D.
Total Dioxins and Furans (as PCDD/F TEQ)
ng/Rm3 @ 11% O2 P 0.08
Calculated as the arithmetic average of a minimum three individual stack tests per stack conducted in accordance with standard methods.
N.D.
Opacity(6)
% C (P optional for
existing facilities)
N.D. 5 ½ hour average from data taken every 10 seconds, measured by a CEMS
NOTES:
Concentration units: Mass per reference cubic metres corrected to 11% oxygen. Reference conditions: 20oC, 101.3 kPa, dry gas
N.D. = Not Defined (1)
Where Periodic stack test measurements (P) are indicated, the daily averaging period applies. For Continuous monitoring (C), the 1/2 hour averaging period applies. P/C indicates both technologies are available; ELV will be linked to sampling method. (2)
97% of the half-hour average values over an annual rolling average will not exceed 9 mg/Rm3. 100% of the half-hour average values will not exceed 28 mg/Rm
3.
(3) This requirement may be omitted at the discretion of the Regional Manager should treatment stages for HCl demonstrate that the ELV for HCl is not exceeded.
(4) Daily Average ELV for mercury applies regardless of monitoring method.
(5) Proponents may be able to demonstrate that monitoring both Total Organic Carbon (TOC) and Total Dioxin and Furans could negate the need to monitor Chlorophenols, Chlorobenzenes, Polycyclic Aromatic Hydrocarbons and Polychlorinated Biphenyls.
(6) Opacity will not be required for compliance purposes for facilities utilizing continuous particulate monitoring systems. Opacity monitoring is recommended for operational monitoring purposes. However, monitoring opacity can be used as a temporary surrogate for total particulate monitoring in the event a particulate monitoring system failure. Under these circumstances, the ELV of 5% opacity over a ½ hour averaging period should apply.
Waste to Energy
A Technical Review of Municipal Solid Waste Thermal Treatment Practices
Final Report
Section 12: Closure
March 2011
Project No. 1231-10166
12-1
12 CLOSURE
This report has been prepared for the benefit of BC Ministry of Environment. The report may not be
used by any other person or entity without the express written consent of BCMOE and Stantec. Any
use of this report by a third party, or any reliance on decisions made based on it, are the
responsibility of such third parties. Stantec accepts no responsibility for damages, if any, suffered by
any third party as a result of decisions made or actions taken based on this report.
Some of the information presented in this report was provided through existing documents and
interviews. Although attempts were made, whenever possible, to obtain additional sources of
information, Stantec has assumed that the information provided is accurate.
The information and conclusions contained in this report are based upon work undertaken by trained
professional and technical staff in accordance with generally accepted engineering and scientific
practices current at the time the work was performed. The conclusions and recommendations
presented represent the best judgment of Stantec based on the data obtained during the
assessment. Conclusions and recommendations presented in this report should not be construed as
legal advice.


Waste to Energy
A Technical Review of Municipal Solid Waste Thermal Treatment Practices Final Report Appendix A: Database of Current Technology Vendors and Thermal Treatment Technologies
APPENDIX A Database of Current Technology Vendors
and Thermal Treatment Technologies

Appendix A: Database of Current Technology Vendors and Thermal Treatment Technologies
Database of Current Technology Vendors


Waste to Energy A Technical Review of Municipal Solid Waste Thermal Treatment Practices
Final Report
Appendix A – Database of Current Technology Vendors
February 2011
Project No. 1231-10166
A-1
Type of Technology Company Operating Since Reference Facility(ies) Size Website Comments
Conventional Combustion
Mass Burn Incineration Advanced Alternative Energy (AAEC) n/a n/a n/a www.aaecorp.com/power.html
No reference facilities, claims to be able to treat waste and biomass
Mass Burn Incineration ATCO Power n/a n/a n/a www.atcopower.com
No reference facilities, but actively investigating energy from waste
Mass Burn Incineration Babcock & Wilcox Volund 1997 Billingham, UK 224,000 tpy www.volund.dk
One of the 4 main suppliers of mass burn technology
Mass Burn Incineration CNIM n/a Thiverval-Grignon-Plaisir, France 2 x 8 t/h + 1 x 14.7 t/h of household waste www.CNIM.com DBO
Modular Two Stage Combustion Consutech Systems LLC n/a Iraq 5333 lbs/hr http://www.consutech.com/ Design and manufacture
incineration and APC equipment
Mass Burn Incineration Covanta 1990 Huntsville, Alabama 625 tpd www.covantaholding.com/
Operate 41 facilities in the US, 1 Burnaby - utilize Martin Gmbh tech
Modular Two Stage Combustion Enerwaste 2005 Egegik, Alaska 3.5 tpd www.enerwaste.com
Also provide a MCS (mass burn type) for pre-processed garbage
Mass Burn Incineration Fisia Babcock Environment GmbH 2005 Affaldscenter Århus, Denmark 17.5 tph http://www.fisia-babcock.com/
One of the 4 main suppliers of mass burn technology
Mass Burn Incineration JFE 2003 Hirano Plant, Japan 900 tpd www.jfe-eng.co.jp/en Fluidized Bed Incineration JFE 2006 Banpoo WTE Plant, Thailand 100 tpd www.jfe-eng.co.jp/en Mass Burn Incineration KAB TAKUMA GmbH 2003 Salzbergen, Germany 90.000 tpy http://www.kab-takuma.com/
Mass Burn Incineration Martin GmbH 1999 Neunkirchen, Germany 408 tpd http://www.martingmbh.de/index.php One of the four main suppliers of mass burn technology
Mass Burn Incineration Naanovo Energy Inc. March 2010 The Gambia n/a www.naanovo.com
14 MW facility. Not sure as to the status.
Mass Burn Incineration Seghers Keppel Technology Group n/a Beveren, Belgium 2 x 319 tpd www.keppelseghers.com
Mass Burn Incineration Standardkessel Baumgarte 2007 MSZ 3 Moscow, Russia 330,000 tpy http://www.standardkessel-baumgarte.com/
Five reference facilities located on their website.
Steinmuller n/a n/a n/a http://www.steinmuller.co.za/default.asp?fid=0&sid=24&L=1 Mechanical engineers
Mass Burn Incineration TPS Termiska 1992 Greve-in-Chianti, Italy 67,000 tpy www.tps.se/subpage.aspx?MS=14839,15014
Mass Burn Incineration Veolia Environmental Services 2003 Hampshire, UK 90,000 tpy www.VeoliaES.com More than 80 plants worldwide
Mass Burn Incineration Von Roll Nova 2007 Issy-les-Moulineaux (Paris), France 460,000 tpy http://www.aee-vonrollinova.ch
One of the four main suppliers of mass burn technology
Mass Burn Incineration Wheelabrator Technologies Inc. 1985 Baltimore 2,000 tpd www.wheelabratortechnologies.com Operates 21 facilities in the US
Mass Burn Incineration Wulff Energy and Environmental Systems n/a n/a n/a http://www.wulff-hamburg.de
Boiler, combustion and drier technologies
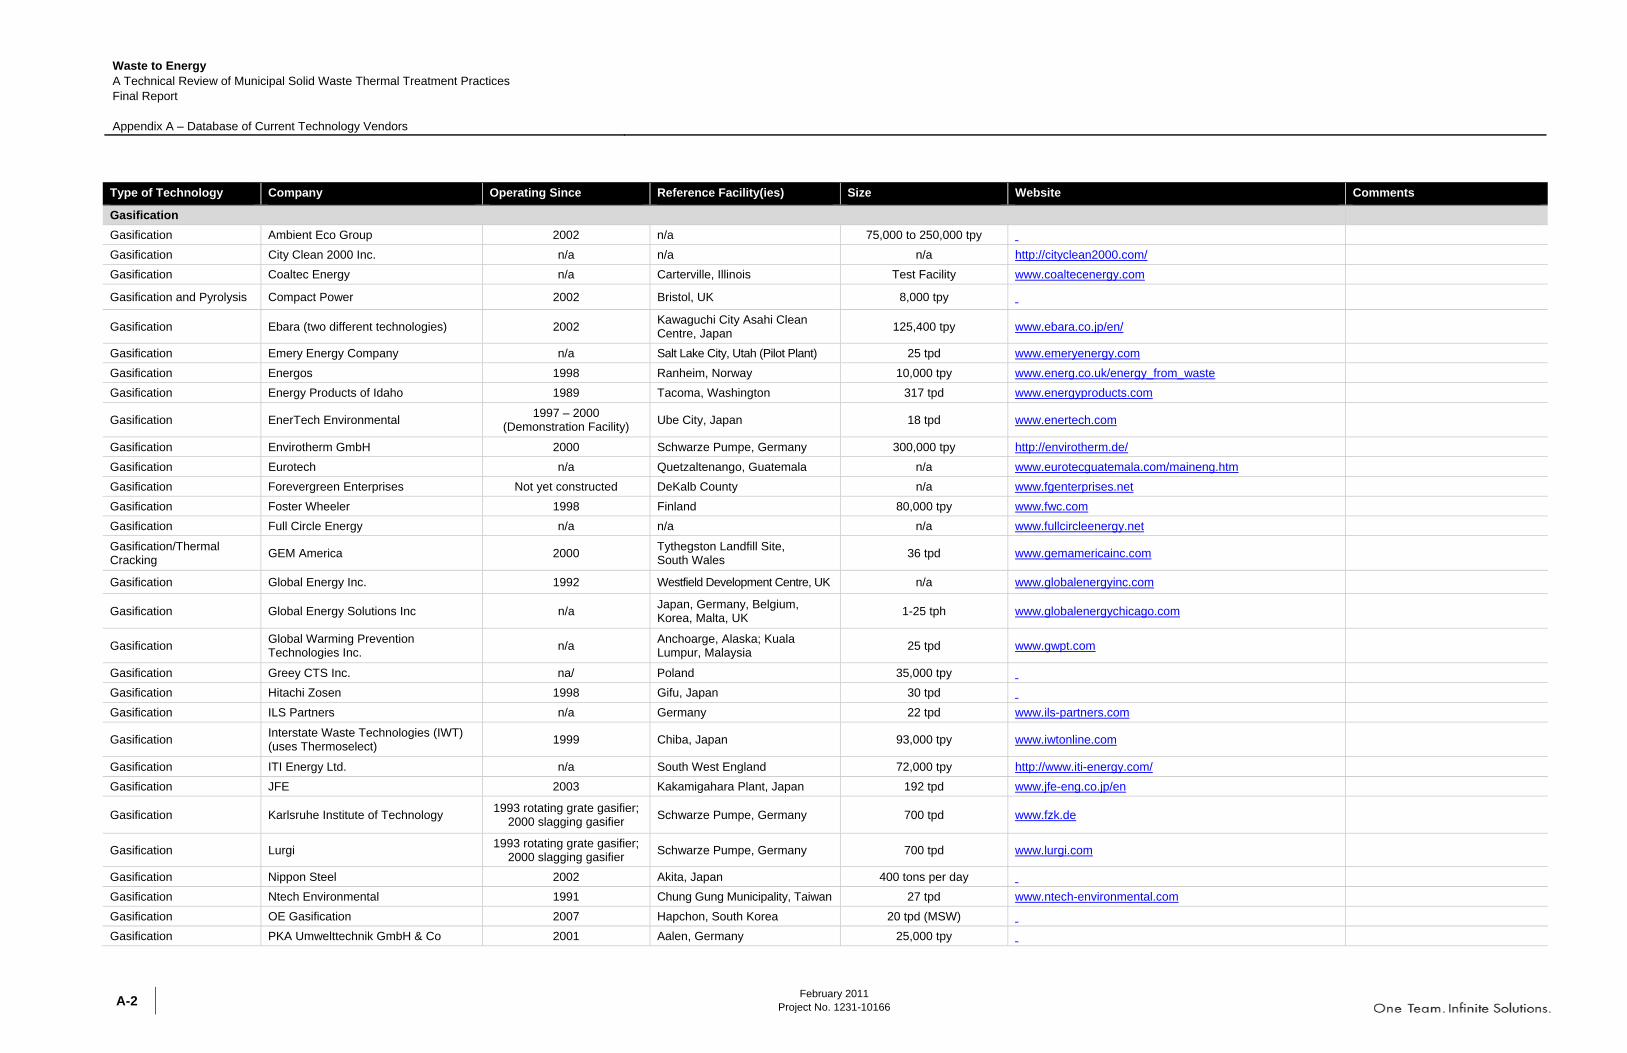
Waste to Energy A Technical Review of Municipal Solid Waste Thermal Treatment Practices Final Report Appendix A – Database of Current Technology Vendors
February 2011
Project No. 1231-10166 A-2
Type of Technology Company Operating Since Reference Facility(ies) Size Website Comments
Gasification Gasification Ambient Eco Group 2002 n/a 75,000 to 250,000 tpy Gasification City Clean 2000 Inc. n/a n/a n/a http://cityclean2000.com/ Gasification Coaltec Energy n/a Carterville, Illinois Test Facility www.coaltecenergy.com
Gasification and Pyrolysis Compact Power 2002 Bristol, UK 8,000 tpy
Gasification Ebara (two different technologies) 2002 Kawaguchi City Asahi Clean Centre, Japan 125,400 tpy www.ebara.co.jp/en/
Gasification Emery Energy Company n/a Salt Lake City, Utah (Pilot Plant) 25 tpd www.emeryenergy.com Gasification Energos 1998 Ranheim, Norway 10,000 tpy www.energ.co.uk/energy_from_waste Gasification Energy Products of Idaho 1989 Tacoma, Washington 317 tpd www.energyproducts.com
Gasification EnerTech Environmental 1997 – 2000 (Demonstration Facility) Ube City, Japan 18 tpd www.enertech.com
Gasification Envirotherm GmbH 2000 Schwarze Pumpe, Germany 300,000 tpy http://envirotherm.de/ Gasification Eurotech n/a Quetzaltenango, Guatemala n/a www.eurotecguatemala.com/maineng.htm Gasification Forevergreen Enterprises Not yet constructed DeKalb County n/a www.fgenterprises.net Gasification Foster Wheeler 1998 Finland 80,000 tpy www.fwc.com Gasification Full Circle Energy n/a n/a n/a www.fullcircleenergy.net
Gasification/Thermal Cracking GEM America 2000 Tythegston Landfill Site,
South Wales 36 tpd www.gemamericainc.com
Gasification Global Energy Inc. 1992 Westfield Development Centre, UK n/a www.globalenergyinc.com
Gasification Global Energy Solutions Inc n/a Japan, Germany, Belgium, Korea, Malta, UK 1-25 tph www.globalenergychicago.com
Gasification Global Warming Prevention Technologies Inc. n/a Anchoarge, Alaska; Kuala
Lumpur, Malaysia 25 tpd www.gwpt.com
Gasification Greey CTS Inc. na/ Poland 35,000 tpy Gasification Hitachi Zosen 1998 Gifu, Japan 30 tpd Gasification ILS Partners n/a Germany 22 tpd www.ils-partners.com
Gasification Interstate Waste Technologies (IWT) (uses Thermoselect) 1999 Chiba, Japan 93,000 tpy www.iwtonline.com
Gasification ITI Energy Ltd. n/a South West England 72,000 tpy http://www.iti-energy.com/ Gasification JFE 2003 Kakamigahara Plant, Japan 192 tpd www.jfe-eng.co.jp/en
Gasification Karlsruhe Institute of Technology 1993 rotating grate gasifier; 2000 slagging gasifier Schwarze Pumpe, Germany 700 tpd www.fzk.de
Gasification Lurgi 1993 rotating grate gasifier; 2000 slagging gasifier Schwarze Pumpe, Germany 700 tpd www.lurgi.com
Gasification Nippon Steel 2002 Akita, Japan 400 tons per day Gasification Ntech Environmental 1991 Chung Gung Municipality, Taiwan 27 tpd www.ntech-environmental.com Gasification OE Gasification 2007 Hapchon, South Korea 20 tpd (MSW) Gasification PKA Umwelttechnik GmbH & Co 2001 Aalen, Germany 25,000 tpy

Waste to Energy A Technical Review of Municipal Solid Waste Thermal Treatment Practices
Final Report
Appendix A – Database of Current Technology Vendors
February 2011
Project No. 1231-10166
A-3
Type of Technology Company Operating Since Reference Facility(ies) Size Website Comments
Gasification Pyrolyzer n/a n/a n/a http://pyrolyzerllc.com/ Gasification SenreQ International 2002 Barrow, Alaska 27 tpd Gasification Sierra Energy Corporation n/a n/a n/a http://www.sierraenergycorp.com/ Gasification SVZ n/a n/a n/a Gasification Rentech 1997 Burlington, Vermont 272 tpd www.silvasgas.com
Gasification Terragon Environmental Technologies Inc. n/a n/a Small-scale (Only for remote
communities, outposts etc.) www.terragon.net/MAGS.html
Gasification TGE Tech 2007 Tel Aviv 181 tpd Gasification Thermogenics, Inc. n/a n/a n/a www.thermogenics.com Gasification Thermoselect 1999 – 2004 Karlsruhe, Germany 250,000 tpy www.thermoselect.com Gasification Thide Environmental 2004 Arras, France 50,000 tpy www.thide.com
Gasification Waste-to-Energy Reference facilities do not process MSW (only biomass) n/a n/a www.wastetoenergy.co.uk
Gasification Whitten Group International 1991 Taiwan 8,100 tpy Plasma Arc Gasificaiton Plasma Arc Gasification AdaptiveNRG 2005 Monterey, Mexico (portable) 33,000 tpy www.adaptivenrg.com
Plasma Arc Gasification AlterNRG (Westinghouse Plasma Technology) 1999 Yoshi, Japan n/a www.alternrg.com
Plasma Arc Gasification EnviroArcTechnologies Pilot Plant Hofors, Sweden .7 tph www.enviroarc.com Europlasma n/a n/a n/a http://www.europlasma.com/ Plasma torches
Plasma Arc Gasification Geoplasma LLC 1999 Japan, Germany, Belgiu, Korea, Malta, UK 24 tpd www.geoplasma.com
Plasma Arc Gasification Global Environmental Technologies of Ontario Inc. n/a n/a n/a
Plasma Arc Gasification Green Power Systems n/a n/a n/a www.greenpowersystems.com Plasma Arc Gasification Hitachi Metals 2003 Utashinai City, Japan 180 tpd Plasma Arc Gasification Hi-Tech Enterprise Ltd n/a n/a n/a
Plasma Arc Gasification InEnTech Chemical (Integrated Environmental Technologies) n/a Richland, Washington 22 tpd www.inentec.com
Plasma Arc Gasification MPM Technologies Inc. 1987 – 1988 Libby, Montana (Pilot Plant) 45 tpd; 108 tpd (continuous feed) www.mpmtech.com
Plasma Arc Gasification Peat International Inc 2007 Kaohsiung, Taiwan 9 tpd www.peat.com Plasma Arc Gasification Plasco Energy Group 2007 Ottawa, Canada 31,100 tpy www.plasco.com Plasma Arc Gasification Plasma Arc Technologies n/a n/a n/a www.plasmaarctech.com Plasma Arc Gasification Plasma Environmental Technologies Inc. No operating facilities. n/a n/a www.plasmaenvironmental.com Plasma Arc Gasification Plasma Waste Recycling n/a n/a n/a www.plasma-wr.com Plasma Arc Gasification PyroGenesis Inc. 2000 Montreal, Quebec 10 tpd Plasma Arc Gasification Recovered Energy Inc. (Westinghouse) 1999 Hitachi plant in Japan 3 tph www.recoveredenergy.com
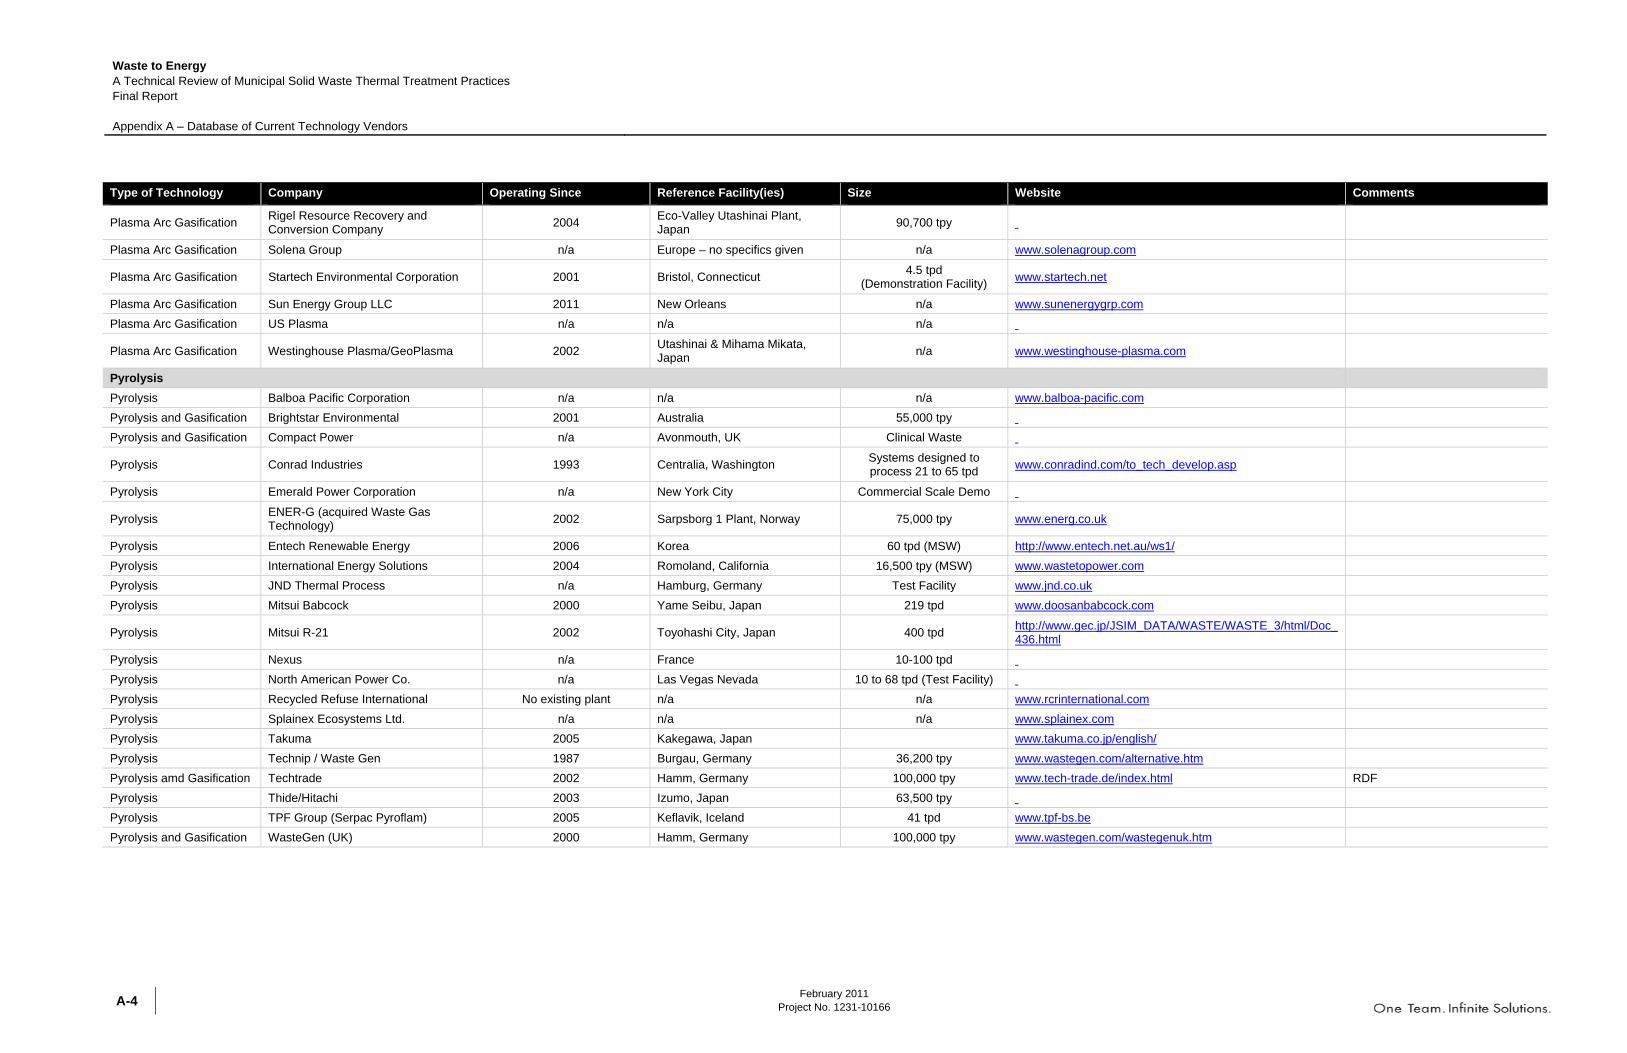
Waste to Energy A Technical Review of Municipal Solid Waste Thermal Treatment Practices Final Report Appendix A – Database of Current Technology Vendors
February 2011
Project No. 1231-10166 A-4
Type of Technology Company Operating Since Reference Facility(ies) Size Website Comments
Plasma Arc Gasification Rigel Resource Recovery and Conversion Company 2004 Eco-Valley Utashinai Plant,
Japan 90,700 tpy
Plasma Arc Gasification Solena Group n/a Europe – no specifics given n/a www.solenagroup.com
Plasma Arc Gasification Startech Environmental Corporation 2001 Bristol, Connecticut 4.5 tpd (Demonstration Facility) www.startech.net
Plasma Arc Gasification Sun Energy Group LLC 2011 New Orleans n/a www.sunenergygrp.com Plasma Arc Gasification US Plasma n/a n/a n/a
Plasma Arc Gasification Westinghouse Plasma/GeoPlasma 2002 Utashinai & Mihama Mikata, Japan n/a www.westinghouse-plasma.com
Pyrolysis Pyrolysis Balboa Pacific Corporation n/a n/a n/a www.balboa-pacific.com Pyrolysis and Gasification Brightstar Environmental 2001 Australia 55,000 tpy Pyrolysis and Gasification Compact Power n/a Avonmouth, UK Clinical Waste
Pyrolysis Conrad Industries 1993 Centralia, Washington Systems designed to process 21 to 65 tpd www.conradind.com/to_tech_develop.asp
Pyrolysis Emerald Power Corporation n/a New York City Commercial Scale Demo
Pyrolysis ENER-G (acquired Waste Gas Technology) 2002 Sarpsborg 1 Plant, Norway 75,000 tpy www.energ.co.uk
Pyrolysis Entech Renewable Energy 2006 Korea 60 tpd (MSW) http://www.entech.net.au/ws1/ Pyrolysis International Energy Solutions 2004 Romoland, California 16,500 tpy (MSW) www.wastetopower.com Pyrolysis JND Thermal Process n/a Hamburg, Germany Test Facility www.jnd.co.uk Pyrolysis Mitsui Babcock 2000 Yame Seibu, Japan 219 tpd www.doosanbabcock.com
Pyrolysis Mitsui R-21 2002 Toyohashi City, Japan 400 tpd http://www.gec.jp/JSIM_DATA/WASTE/WASTE_3/html/Doc_436.html
Pyrolysis Nexus n/a France 10-100 tpd Pyrolysis North American Power Co. n/a Las Vegas Nevada 10 to 68 tpd (Test Facility) Pyrolysis Recycled Refuse International No existing plant n/a n/a www.rcrinternational.com Pyrolysis Splainex Ecosystems Ltd. n/a n/a n/a www.splainex.com Pyrolysis Takuma 2005 Kakegawa, Japan www.takuma.co.jp/english/ Pyrolysis Technip / Waste Gen 1987 Burgau, Germany 36,200 tpy www.wastegen.com/alternative.htm Pyrolysis amd Gasification Techtrade 2002 Hamm, Germany 100,000 tpy www.tech-trade.de/index.html RDF Pyrolysis Thide/Hitachi 2003 Izumo, Japan 63,500 tpy Pyrolysis TPF Group (Serpac Pyroflam) 2005 Keflavik, Iceland 41 tpd www.tpf-bs.be Pyrolysis and Gasification WasteGen (UK) 2000 Hamm, Germany 100,000 tpy www.wastegen.com/wastegenuk.htm

Waste to Energy A Technical Review of Municipal Solid Waste Thermal Treatment Practices
Final Report
Appendix A – Database of Current Technology Vendors
February 2011
Project No. 1231-10166
A-5
Type of Technology Company Operating Since Reference Facility(ies) Size Website Comments
Gasplasma
Gasplasma Advanced Plasma Power n/a Oxfordshire, Eng. Small-scale Demonstration Plant www.advancedplasmapower.com
Thermal Cracking Technology Thermal Cracking Technology GEM Waste to Energy Inc. 1998 Romsey, England 0.7 tph www.gemcanadawaste.com/index2.html
Thermal Oxidation Thermal Oxidation Zeros Technology Holding No existing plant www.zerosinc.com Waste to Fuel Waste to Fuel BioEngineering Resources (BRI) 2003 Fayetteville, Arkansas 1.3 tpd (Pilot Plant) www.brienergy.com
Waste to Fuel BlueFire Ethanol Inc. 2002 Izumi, Japan
http://bluefireethanol.com/production_plant/
Waste to Fuel Changing World Technologies 1999 Philadelphia, PA Test Facility www.changingworldtech.com Waste to Fuel Enerkem 2003 Sherbrooke, Quebec 5 tpd (MSW pellets) www.enerkem.com Waste to Fuel Enerkem (Novera) To be constructed 2009 Edmonton, Alberta 100,000 tpy www.enerkem.com
Waste to Fuel Genahol Inc. 2007 Lake County, Indiana 30 million gallons ethanol/year Not constructed yet
Waste to Fuel Indiana Ethanol Power 2008 Lake County, Indiana 1,500 tons per day Not constructed yet Waste to Fuel Masada OxyNol n/a n/a n/a Waste to Fuel Power Ecalene Fuels n/a n/a n/a http://powerecalene.com Converts syngas to alcohol Waste to Fuel Range Fuels Inc. 2008 Denver Colorado 5 oven dried tonnes www.rangefuels.com Other Methodologies
Kearns Disintegrator Quantum Solutions Technology Ventures Inc. 1983 Cape Breton Isaldn, Nova Scotia Prototype www.qstv.ca/qstv-about.html
Steam Reforming Plant Elementa 2007 Sault Ste. Marie n/a http://www.elementagroup.com/


Appendix A: Thermal Treatment Technologies Database
Thermal Treatment Technologies Database


Type of Technology Company Operating Since Reference Facility(ies) Size Website Comments
Mass Burn Incineration Advanced Alternative Energy (AAEC) n/a n/a n/a www.aaecorp.com/power.html No reference facilities, claims to be able to treat waste and biomass.
Mass Burn Incineration ATCO Power n/a n/a n/a www.atcopower.com No reference facilities, but actively investigating energy from waste.
Mass Burn Incineration CNIM n/a Thiverval-Grignon-Plaisir, France 2 x 8 t/h + 1 x 14.7 t/h of household waste
www.CNIM.com DBO.
Modular Two Stage Combustion Consutech Systems LLC n/a Iraq 5333 lbs/hr http://www.consutech.com/ Design and manufacture incineration and APC equipment.
Mass Burn Incineration Covanta 1990 Huntsville, Alabama 625 tpd www.covantaholding.com/ Operate 41 facilities in the US, 1 Burnaby - utilize Martin Gmbh tech.
Modular Two Stage Combustion Enerwaste 2005 Egegik, Alaska 3.5 tpd www.enerwaste.com Also provide a MCS (mass burn type) for pre-processed garbage.
Mass Burn Incineration Fisia Babcock Environment GmbH 2005 Affaldscenter Århus, Denmark 17.5 tph http://www.fisia-babcock.com/ One of the 4 main suppliers of mass burn technology.
Mass Burn Incineration JFE 2003 Hirano Plant, Japan 900 tpd www.jfe-eng.co.jp/en
Fluidized Bed Incineration JFE 2006 Banpoo WTE Plant, Thailand 100 tpd www.jfe-eng.co.jp/en
Mass Burn Incineration KAB TAKUMA GmbH 2003 Salzbergen, Germany 90.000 tpy http://www.kab-takuma.com/
Mass Burn Incineration Martin GmbH 1999 Neunkirchen, Germany 408 tpd http://www.martingmbh.de/index.php One of the 4 main suppliers of mass burn technology.
Mass Burn Incineration Naanovo Energy Inc. March 2010 The Gambia n/a www.naanovo.com 14 MW facility. Not sure as to the status.
Mass Burn Incineration Seghers Keppel Technology Group n/a Beveren, Belgium 2 x 319 tpd www.keppelseghers.com
Mass Burn Incineration Standardkessel Baumgarte 2007 MSZ 3 Moscow, Russia 330,000 tpy http://www.standardkessel-baumgarte.com/ 5 reference facilities located on their website.
Steinmuller n/a n/a n/a http://www.steinmuller.co.za/default.asp?fid=0&sid=24&L=1 Mecanical engineers.
Mass Burn Incineration TPS Termiska 1992 Greve-in-Chianti, Italy 67,000 tpy www.tps.se/subpage.aspx?MS=14839,15014
Mass Burn Incineration Veolia Environmental Services 2003 Hampshire, UK 90,000 tpy www.VeoliaES.com More than 80 plants worldwide.
Mass Burn Incineration Von Roll Nova 2007 Issy-les-Moulineaux (Paris), France 460,000 tpy http://www.aee-vonrollinova.ch One of the 4 main suppliers of mass burn technology.
Mass Burn Incineration Wheelabrator Technologies Inc. 1985 Baltimore 2,000 tpd www.wheelabratortechnologies.com Operates 21 facilities in the US..
Mass Burn Incineration Wulff Energy and Environmental Systems n/a n/a n/a http://www.wulff-hamburg.de Boiler, combustion and drier technologies.
Thermal Treatment Technologies Database (MSW as a Feedstock)
Conventional Combustion
Page 1 of 4

Type of Technology Company Operating Since Reference Facility(ies) Size Website Comments
Gasification Ambient Eco Group 2002 n/a 75,000 to 250,000 tpy
Gasification City Clean 2000 Inc. n/a n/a n/a http://cityclean2000.com/
Gasification Coaltec Energy n/a Carterville, Illinois Test Facility www.coaltecenergy.com
Gasification and Pyrolysis Compact Power 2002 Bristol, UK 8,000 tpy
Gasification Ebara (two different technologies) 2002 Kawaguchi City Asahi Clean Centre, Japan 125,400 tpy www.ebara.co.jp/en/
Gasification Emery Energy Company n/a Salt Lake City, Utah (Pilot Plant) 25 tpd www.emeryenergy.com
Gasification Energos 1998 Ranheim, Norway 10,000 tpy www.energ.co.uk/energy_from_waste
Gasification Energy Products of Idaho 1989 Tacoma, Washington 317 tpd www.energyproducts.com
Gasification EnerTech Environmental 1997-2000 (Demonstration Facility)
Ube City, Japan 18 tpd www.enertech.com
Gasification Envirotherm GmbH 2000 Schwarze Pumpe, Germany 300,000 tpy http://envirotherm.de/
Gasification Eurotech n/a Quetzaltenango, Guatemala n/a www.eurotecguatemala.com/maineng.htm
Gasification Forevergreen Enterprises Not yet constructed DeKalb County n/a www.fgenterprises.net
Gasification Foster Wheeler 1998 Finland 80,000 tpy www.fwc.com
Gasification Full Circle Energy n/a n/a n/a www.fullcircleenergy.net
Gasification / Thermal Cracking GEM America 2000 Tythegston Landfill Site, South Wales 36 tpd www.gemamericainc.com
Gasification Global Energy Inc. 1992 Westfield Development Centre, UK n/a www.globalenergyinc.com
Gasification Global Energy Solutions Inc n/a Japan, Germany, Belgium, Korea, Malta, UK 1-25 tph www.globalenergychicago.com
Gasification Global Warming Prevention Technologies Inc. n/a Anchoarge, Alaska; Kuala Lumpur, Malaysia 25 tpd www.gwpt.com
Gasification Greey CTS Inc. na/ Poland 35,000 tpy
Gasification Hitachi Zosen 1998 Gifu, Japan 30 tpd
Gasification ILS Partners n/a Germany 22 tpd www.ils-partners.com
Gasification Interstate Waste Technologies (IWT) (uses Thermoselect)
1999 Chiba, Japan 93,000 tpy www.iwtonline.com
Gasification ITI Energy Ltd. n/a South West England 72,000 tpy http://www.iti-energy.com/
Gasification JFE 2003 Kakamigahara Plant, Japan 192 tpd www.jfe-eng.co.jp/en
Gasification Karlsruhe Institute of Technology 1993 rotating grate gasifier; 2000 slagging
Schwarze Pumpe, Germany 700 tpd www.fzk.de
Gasification Lurgi 1993 rotating grate gasifier; 2000 slagging
Schwarze Pumpe, Germany 700 tpd www.lurgi.com
Gasification Nippon Steel 2002 Akita, Japan 400 tons per day
Gasification Ntech Environmental 1991 Chung Gung Municipality, Taiwan 27 tpd www.ntech-environmental.com
Gasification OE Gasification 2007 Hapchon, South Korea 20 tpd (MSW)
Gasification PKA Umwelttechnik GmbH & Co 2001 Aalen, Germany 25,000 tpy
Gasification Pyrolyzer n/a n/a n/a http://pyrolyzerllc.com/
Gasification SenreQ International 2002 Barrow, Alaska 27 tpd
Gasification Sierra Energy Corporation n/a n/a n/a http://www.sierraenergycorp.com/
Gasification SVZ n/a n/a n/a
Gasification Rentech 1997 Burlington, Vermont 272 tpd www.silvasgas.com
Gasification Terragon Environmental Technologies Inc. n/a n/a Small-scale (Only for remote communities, outposts etc.)
www.terragon.net/MAGS.html
Gasification TGE Tech 2007 Tel Aviv 181 tpd
Gasification Thermogenics, Inc. n/a n/a n/a www.thermogenics.com
Gasification Thermoselect 1999-2004 Karlsruhe, Germany 250,000 tpy www.thermoselect.com
Gasification Thide Environmental 2004 Arras, France 50,000 tpy www.thide.com
Gasification Waste-to-Energy Reference facilities do not process MSW (only
n/a n/a www.wastetoenergy.co.uk
Gasification Whitten Group International 1991 Taiwan 8,100 tpy
Gasification
Page 2 of 4

Type of Technology Company Operating Since Reference Facility(ies) Size Website Comments
Plasma Arc Gasification AdaptiveNRG 2005 Monterey, Mexico (portable) 33,000 tpy www.adaptivenrg.com
Plasma Arc Gasification AlterNRG (Westinghouse Plasma Technology) 1999 Yoshi, Japan n/a www.alternrg.com
Plasma Arc Gasification EnviroArcTechnologies Pilot Plant Hofors, Sweden .7 tph www.enviroarc.com
Europlasma n/a n/a n/a http://www.europlasma.com/ Plasma torches.
Plasma Arc Gasification Geoplasma LLC 1999 Japan, Germany, Belgiu, Korea, Malta, UK 24 tpd www.geoplasma.com
Plasma Arc Gasification Global Environmental Technologies of Ontario Inc.
n/a n/a n/a
Plasma Arc Gasification Green Power Systems n/a n/a n/a www.greenpowersystems.com
Plasma Arc Gasification Hitachi Metals 2003 Utashinai City, Japan 180 tpd
Plasma Arc Gasification Hi-Tech Enterprise Ltd n/a n/a n/a
Plasma Arc Gasification InEnTech Chemical (Integrated Environmental Technologies)
n/a Richland, Washington 22 tpd www.inentec.com
Plasma Arc Gasification MPM Technologies Inc. 1987-1988 Libby, Montana (Pilot Plant) 45 tpd; 108 tpd (continuous feed) www.mpmtech.com
Plasma Arc Gasification Peat International Inc 2007 Kaohsiung, Taiwan 9 tpd www.peat.com
Plasma Arc Gasification Plasco Energy Group 2007 Ottawa, Canada 31,100 tpy www.plasco.com
Plasma Arc Gasification Plasma Arc Technologies n/a n/a n/a www.plasmaarctech.com
Plasma Arc Gasification Plasma Environmental Technologies Inc. No operating facilities. n/a n/a www.plasmaenvironmental.com
Plasma Arc Gasification Plasma Waste Recycling n/a n/a n/a www.plasma-wr.com
Plasma Arc Gasification PyroGenesis Inc. 2000 Montreal, Quebec 10 tpd
Plasma Arc Gasification Recovered Energy Inc. (Westinghouse) 1999 Hitachi plant in Japan 3 tph www.recoveredenergy.com
Plasma Arc Gasification Rigel Resource Recovery and Conversion Co 2004 Eco-Valley Utashinai Plant, Japan 90,700 tpy
Plasma Arc Gasification Solena Group n/a Europe - no specifics given n/a www.solenagroup.com
Plasma Arc Gasification Startech Environmental Corporation 2001 Bristol, Connecticut 4.5 tpd (Demonstration Facility) www.startech.net
Plasma Arc Gasification Sun Energy Group LLC 2011 New Orleans n/a www.sunenergygrp.com
Plasma Arc Gasification US Plasma n/a n/a n/a
Plasma Arc Gasification Westinghouse Plasma/GeoPlasma 2002 Utashinai & Mihama Mikata, Japan n/a www.westinghouse-plasma.com
Pyrolysis Balboa Pacific Corporation n/a n/a n/a www.balboa-pacific.com
Pyrolysis and Gasification Brightstar Environmental 2001 Australia 55,000 tpy
Pyrolysis and Gasification Compact Power n/a Avonmouth, UK Clinical Waste
Pyrolysis Conrad Industries 1993 Centralia, Washington Systems designed to process 21 to 65 tpd
www.conradind.com/to_tech_develop.asp
Pyrolysis Emerald Power Corporation n/a New York City Commercial Scale Demo
Pyrolysis ENER-G (acquired Waste Gas Technology) 2002 Sarpsborg 1 Plant, Norway 75,000 tpy www.energ.co.uk
Pyrolysis Entech Renewable Energy 2006 Korea 60 tpd (MSW) http://www.entech.net.au/ws1/
Pyrolysis International Energy Solutions 2004 Romoland, California 16,500 tpy (MSW) www.wastetopower.com
Pyrolysis JND Thermal Process n/a Hamburg, Germany Test Facility www.jnd.co.uk
Pyrolysis Mitsui Babcock 2000 Yame Seibu, Japan 219 tpd www.doosanbabcock.com
Pyrolysis Mitsui R-21 2002 Toyohashi City, Japan 400 tpd http://www.gec.jp/JSIM_DATA/WASTE/WASTE_3/html/Doc_436.html
Pyrolysis Nexus n/a France 10-100 tpd
Pyrolysis North American Power Co. n/a Las Vegas Nevada 10 to 68 tpd (Test Facility)
Pyrolysis Recycled Refuse International No existing plant. n/a n/a www.rcrinternational.com
Pyrolysis Splainex Ecosystems Ltd. n/a n/a n/a www.splainex.com
Pyrolysis Takuma 2005 Kakegawa, Japan www.takuma.co.jp/english/
Pyrolysis Technip / Waste Gen 1987 Burgau, Germany 36,200 tpy www.wastegen.com/alternative.htm
Pyrolysis amd Gasification Techtrade 2002 Hamm, Germany 100,000 tpy www.tech-trade.de/index.html RDF.
Pyrolysis Thide/Hitachi 2003 Izumo, Japan 63,500 tpy
Pyrolysis TPF Group (Serpac Pyroflam) 2005 Keflavik, Iceland 41 tpd www.tpf-bs.be
Pyrolysis and Gasification WasteGen (UK) 2000 Hamm, Germany 100,000 tpy www.wastegen.com/wastegenuk.htm
Plasma Arc Gasificaiton
Pyrolysis
Page 3 of 4
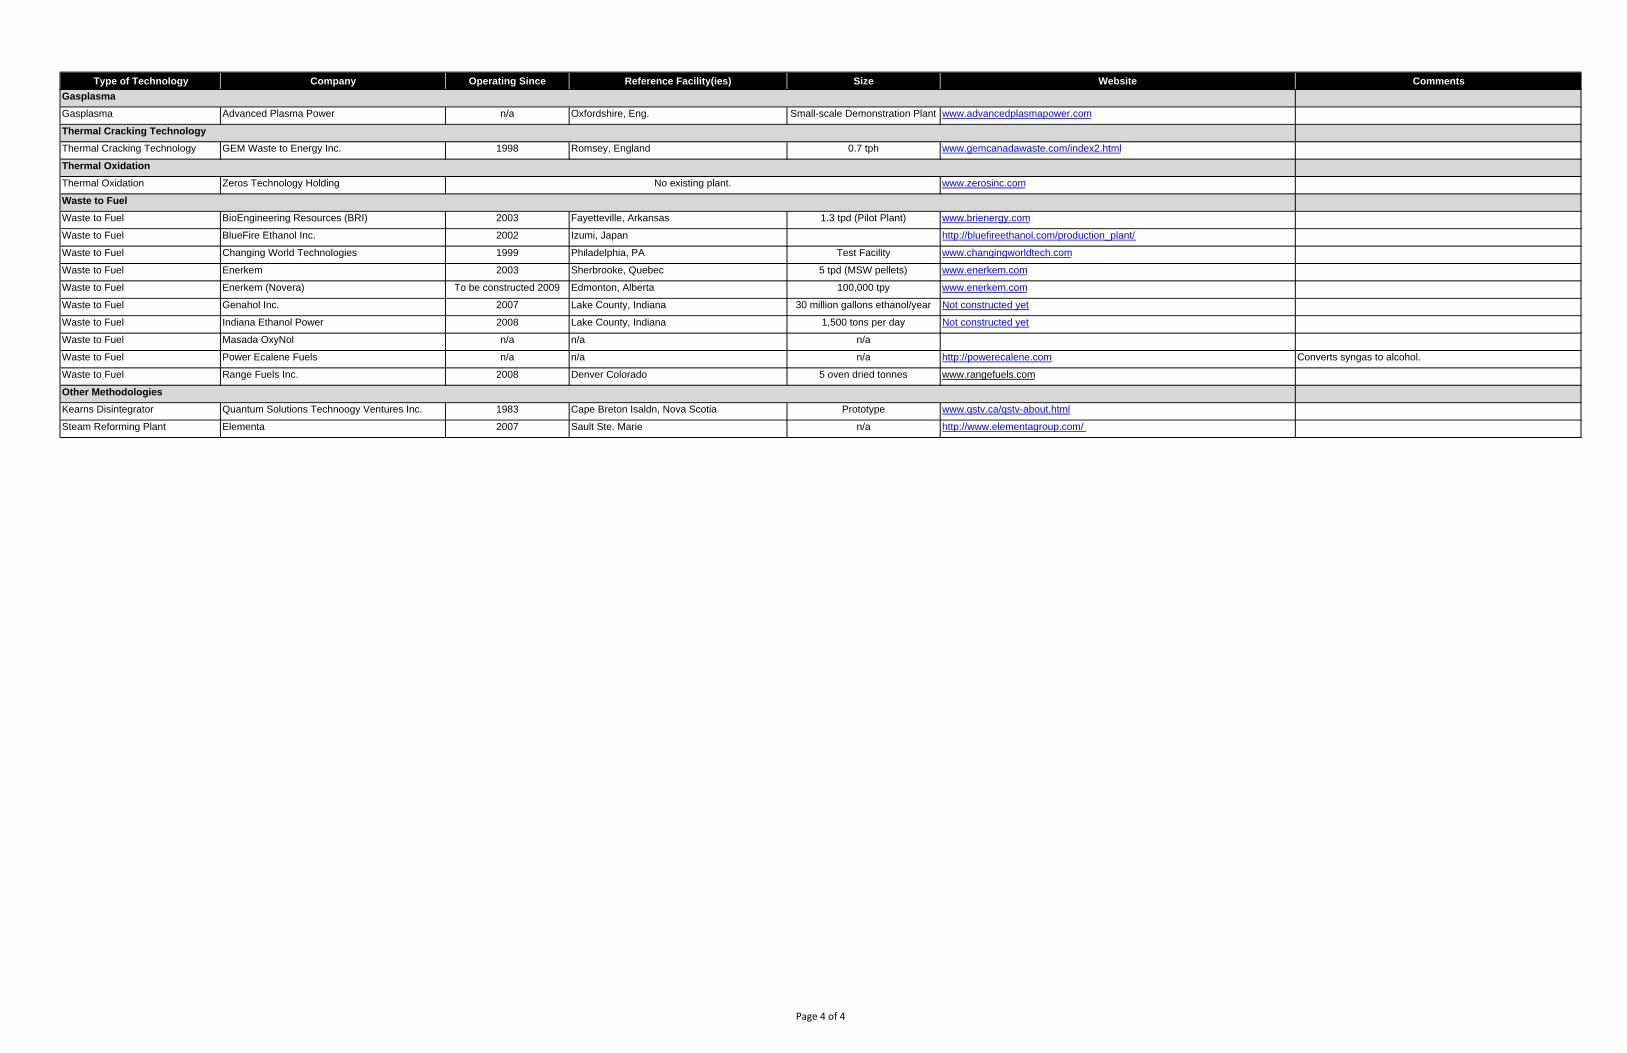
Type of Technology Company Operating Since Reference Facility(ies) Size Website Comments
Gasplasma Advanced Plasma Power n/a Oxfordshire, Eng. Small-scale Demonstration Plant www.advancedplasmapower.com
Thermal Cracking Technology GEM Waste to Energy Inc. 1998 Romsey, England 0.7 tph www.gemcanadawaste.com/index2.html
Thermal Oxidation Zeros Technology Holding www.zerosinc.com
Waste to Fuel BioEngineering Resources (BRI) 2003 Fayetteville, Arkansas 1.3 tpd (Pilot Plant) www.brienergy.com
Waste to Fuel BlueFire Ethanol Inc. 2002 Izumi, Japan http://bluefireethanol.com/production_plant/
Waste to Fuel Changing World Technologies 1999 Philadelphia, PA Test Facility www.changingworldtech.com
Waste to Fuel Enerkem 2003 Sherbrooke, Quebec 5 tpd (MSW pellets) www.enerkem.com
Waste to Fuel Enerkem (Novera) To be constructed 2009 Edmonton, Alberta 100,000 tpy www.enerkem.com
Waste to Fuel Genahol Inc. 2007 Lake County, Indiana 30 million gallons ethanol/year Not constructed yet
Waste to Fuel Indiana Ethanol Power 2008 Lake County, Indiana 1,500 tons per day Not constructed yet
Waste to Fuel Masada OxyNol n/a n/a n/a
Waste to Fuel Power Ecalene Fuels n/a n/a n/a http://powerecalene.com Converts syngas to alcohol.
Waste to Fuel Range Fuels Inc. 2008 Denver Colorado 5 oven dried tonnes www.rangefuels.com
Kearns Disintegrator Quantum Solutions Technoogy Ventures Inc. 1983 Cape Breton Isaldn, Nova Scotia Prototype www.qstv.ca/qstv-about.html
Steam Reforming Plant Elementa 2007 Sault Ste. Marie n/a http://www.elementagroup.com/
Thermal Cracking Technology
Thermal Oxidation
Waste to Fuel
Other Methodologies
No existing plant.
Gasplasma
Page 4 of 4

Waste to Energy
A Technical Review of Municipal Solid Waste Thermal Treatment Practices Final Report Appendix B: BC Emission Criteria for MSW Incinerators (June 1991)
APPENDIX B BC Emission Criteria for MSW Incinerators
(June 1991)


Page | 1
Emission Criteria for Municipal Solid Waste Incinerators (June 1991)
FOREWORD
The Emission Criteria for Municipal Solid Waste Incinerators have been developed in consultation with
British Columbia stakeholders.
The Executive Committee of the Ministry of Environment approved the release of these criteria on June
17, 1991.
The Environmental Management Branch is responsible for the development of these criteria. The Branch
intends to continue development work with British Columbia stakeholders in order that the emission
criteria continue to be current and valid. All stakeholders are invited to submit their comments and
recommendation for improvements to the Manager, Industry and Business Section.
1 Definitions "Acid Gases" mean those gaseous contaminants, as listed in Appendix A, which contribute towards the
formation of acidic substances in the atmosphere.
"Chlorobenzenes (CBs)" mean those chlorinated benzene compounds listed in Appendix A.
"Chlorophenols (CPs)" mean those chlorinated phenolic compounds listed in Appendix A.
"Incinerator" means any device designed specifically for controlled combustion of wastes, alone or in
conjunction with any auxiliary fossil fuel, for the primary purpose of reduction of the volume of the waste
charged by destroying the combustible portion therein and/or to recover the available energy from the waste.
Note: Only those incinerators which are designed to burn wastes in a controlled manner, whether in a
single-chamber or a multiple-chamber unit, and are capable of meeting the requirements of these
Emission Criteria, with or without any emission control devices are to be considered.
" Municipal Solid Waste (MSW)" means municipal refuse which originates from residential, commercial,
institutional and industrial sources and includes semi-solid sludges, household hazardous waste and any
other substances which are typically disposed of in municipal-type landfills, but does not include
biomedical waste.
"Polycyclicaromatic Hydrocarbons (PAHs)" mean those polycyclicaromatic hydrocarbon compounds listed
in Appendix A.
"Polychlorinated dibenzo-para-dioxins (PCDDS) and polychlorinated dibenzofurans (PCDFs)" mean those
PCDD and PCDF compounds listed in Appendix A.

Page | 2
"Refuse Derived Fuel (RDF)" means any fuel derived from municipal solid waste.
"Regional Manager" means the "manager" as well as the "district director" as interpreted in the current
edition of the Environmental Management Act.
" Standard cubic metre (m3) of gas" means the volume of dry gas in cubic metres measured at a pressure
of 101.3 kPa and a temperature of 20°C (293.15 K) .
"Toxicity Equivalency Factors (TEFs)" means those factors for Congeners of Concern in a Homologous
Group for PCDDs and PCDFs.
2 Applicability
2.1 New or Modified Incinerators These Emission Criteria are effective from the date of issuance and apply to all new incinerators designed
and installed for burning MSW.
2.2 Existing Incinerators Within five years or less after issuance of these Emission Criteria, the Environmental Management
Branch will identify and implement measures for:
1. Phasing out of all older, uncontrolled single chamber incinerators used to burn MSW authorized
under the current edition of the Environmental Management Act except for equipment which is
classified and exempted in the current edition of the Waste Management Regulations of the
Environmental Management Act; and
2. Modifications of all multiple-chamber, modular and mass burn incinerators used to burn MSW
authorized by the current edition of the Environmental Management Act but not able to comply
with these Emission Criteria.
2.3 Ambient Analysis and Site Specific Emission Limits Notwithstanding the provisions of these Emission Criteria, no person shall operate a facility to cause
emission of contaminants from an incinerator in quantities which may result in adverse impacts on the air
quality in the vicinity of the site.
2.3.1 Ambient Air Quality Impact Analysis
An ambient air quality impact analysis shall be one of the major criteria for the selection of a site for an
incineration facility. In general, the impacts of emissions from a proposed facility on the ambient air quality
shall be determined for the contaminants listed in Table 1 or Section 3.2.1, as applicable to a particular
facility. However, depending on the location of the proposed facility, the Regional Manager may require
an air quality impact analysis only for certain contaminants selected from Table 1 or Section 3.2.1.
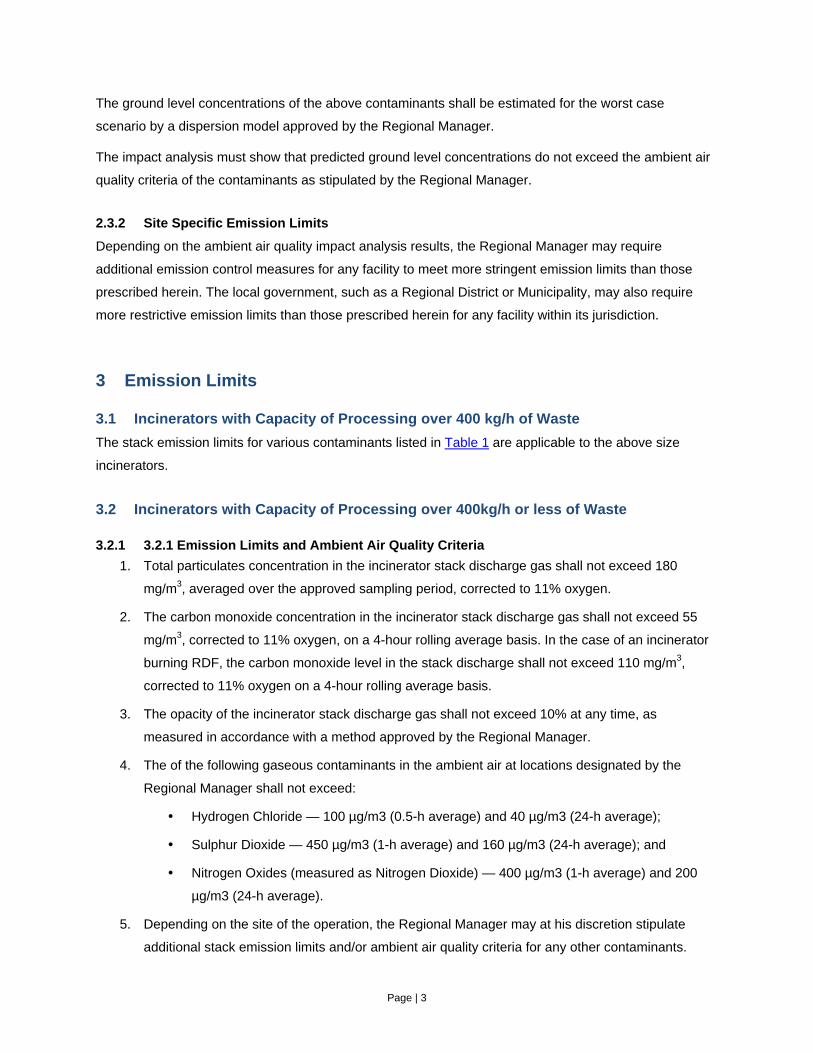
Page | 3
The ground level concentrations of the above contaminants shall be estimated for the worst case
scenario by a dispersion model approved by the Regional Manager.
The impact analysis must show that predicted ground level concentrations do not exceed the ambient air
quality criteria of the contaminants as stipulated by the Regional Manager.
2.3.2 Site Specific Emission Limits
Depending on the ambient air quality impact analysis results, the Regional Manager may require
additional emission control measures for any facility to meet more stringent emission limits than those
prescribed herein. The local government, such as a Regional District or Municipality, may also require
more restrictive emission limits than those prescribed herein for any facility within its jurisdiction.
3 Emission Limits
3.1 Incinerators with Capacity of Processing over 400 kg/h of Waste The stack emission limits for various contaminants listed in Table 1 are applicable to the above size
incinerators.
3.2 Incinerators with Capacity of Processing over 400kg/h or less of Waste
3.2.1 3.2.1 Emission Limits and Ambient Air Quality Criteria 1. Total particulates concentration in the incinerator stack discharge gas shall not exceed 180
mg/m3, averaged over the approved sampling period, corrected to 11% oxygen.
2. The carbon monoxide concentration in the incinerator stack discharge gas shall not exceed 55
mg/m3, corrected to 11% oxygen, on a 4-hour rolling average basis. In the case of an incinerator
burning RDF, the carbon monoxide level in the stack discharge shall not exceed 110 mg/m3,
corrected to 11% oxygen on a 4-hour rolling average basis.
3. The opacity of the incinerator stack discharge gas shall not exceed 10% at any time, as
measured in accordance with a method approved by the Regional Manager.
4. The of the following gaseous contaminants in the ambient air at locations designated by the
Regional Manager shall not exceed:
Hydrogen Chloride — 100 µg/m3 (0.5-h average) and 40 µg/m3 (24-h average);
Sulphur Dioxide — 450 µg/m3 (1-h average) and 160 µg/m3 (24-h average); and
Nitrogen Oxides (measured as Nitrogen Dioxide) — 400 µg/m3 (1-h average) and 200
µg/m3 (24-h average).
5. Depending on the site of the operation, the Regional Manager may at his discretion stipulate
additional stack emission limits and/or ambient air quality criteria for any other contaminants.

Page | 4
3.2.2 Limits on Number of Incinerator Units
The installation and simultaneous operation of more than one small capacity (400 kg/h or less of waste
processing) incinerator without any post-combustion emission control system at the same facility is not
permitted.
3.2.3 Provisions for Emission Control System
Subsequent to the issuance of a Waste Management Permit, the Regional Manager reserves the right to
require, at a later date, further control of emissions from an operating incinerator on the basis of an
evaluation of the incinerator performance, monitoring data, and any other relevant information. It is
recommended that provisions should be made for adequate space and other necessities at the initial
design stage of the facility.
4 Incinerator and Emission Control System Design and Operation Requirements
To minimize emission of contaminants from an incinerator, the required design and operation parameters
for the equipment as outlined below and summarized in Table 2, shall be followed. The incinerator design
and operation parameters listed in Table 2 are applicable to all sizes of incinerators. The emission control
system parameters will apply to all incinerators equipped with such systems.
These requirements are based on currently available information and may be revised at a future date, if
deemed necessary. Any alternative system of different design, which is operated outside the required
parameters, will be acceptable as long as it can be demonstrated that such a system can meet all other
requirements of the Emission Criteria. These requirements do not preclude development of any new
technology.
4.1 Minimum Incineration Temperature and Residence Time The incinerator shall be designed, equipped and operated in such a manner that a minimum temperature
of 1000°C is maintained in the final combustion zone, at the fully mixed height after the final introduction
of combustion air.
The incinerator design must provide for a minimum residence time of 1 second for the combustion gases
at 1000°C at the said location during normal operation.
The residence time is to be calculated from the point where most of the combustion has been completed
and the incineration temperature fully developed.
In multi-chamber incinerators the residence time is calculated from the secondary burner(s) flame front or
final secondary air injection point(s).
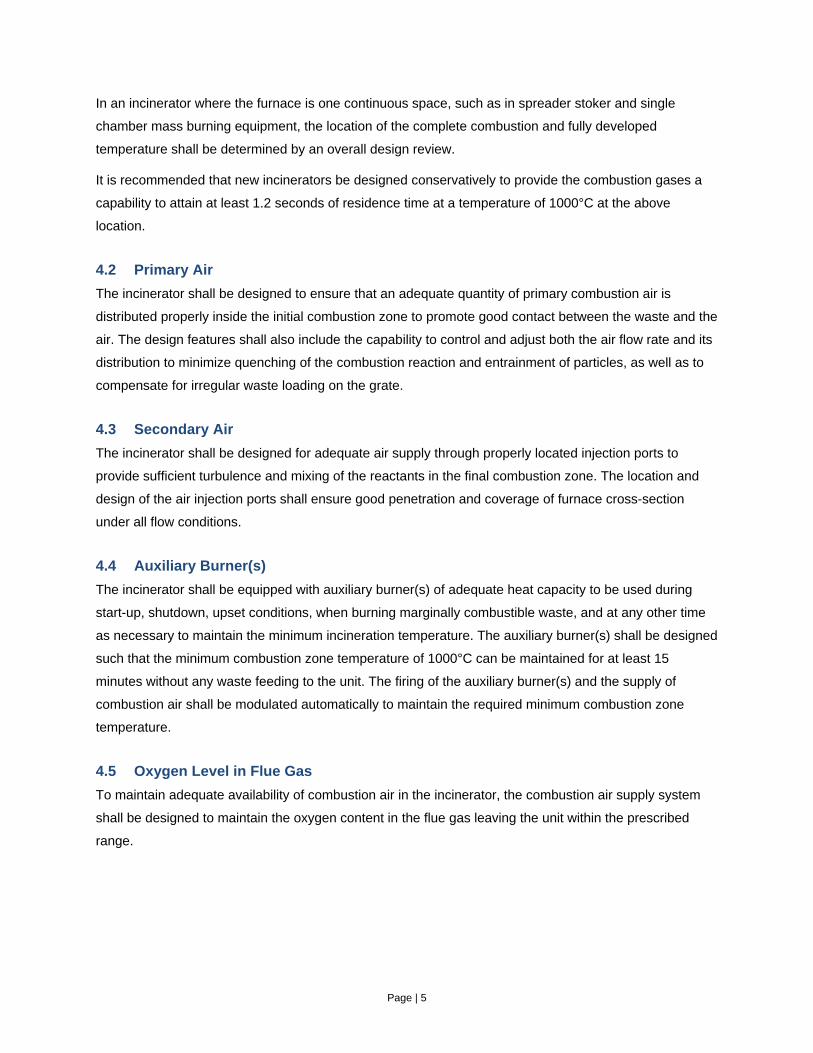
Page | 5
In an incinerator where the furnace is one continuous space, such as in spreader stoker and single
chamber mass burning equipment, the location of the complete combustion and fully developed
temperature shall be determined by an overall design review.
It is recommended that new incinerators be designed conservatively to provide the combustion gases a
capability to attain at least 1.2 seconds of residence time at a temperature of 1000°C at the above
location.
4.2 Primary Air The incinerator shall be designed to ensure that an adequate quantity of primary combustion air is
distributed properly inside the initial combustion zone to promote good contact between the waste and the
air. The design features shall also include the capability to control and adjust both the air flow rate and its
distribution to minimize quenching of the combustion reaction and entrainment of particles, as well as to
compensate for irregular waste loading on the grate.
4.3 Secondary Air The incinerator shall be designed for adequate air supply through properly located injection ports to
provide sufficient turbulence and mixing of the reactants in the final combustion zone. The location and
design of the air injection ports shall ensure good penetration and coverage of furnace cross-section
under all flow conditions.
4.4 Auxiliary Burner(s) The incinerator shall be equipped with auxiliary burner(s) of adequate heat capacity to be used during
start-up, shutdown, upset conditions, when burning marginally combustible waste, and at any other time
as necessary to maintain the minimum incineration temperature. The auxiliary burner(s) shall be designed
such that the minimum combustion zone temperature of 1000°C can be maintained for at least 15
minutes without any waste feeding to the unit. The firing of the auxiliary burner(s) and the supply of
combustion air shall be modulated automatically to maintain the required minimum combustion zone
temperature.
4.5 Oxygen Level in Flue Gas To maintain adequate availability of combustion air in the incinerator, the combustion air supply system
shall be designed to maintain the oxygen content in the flue gas leaving the unit within the prescribed
range.
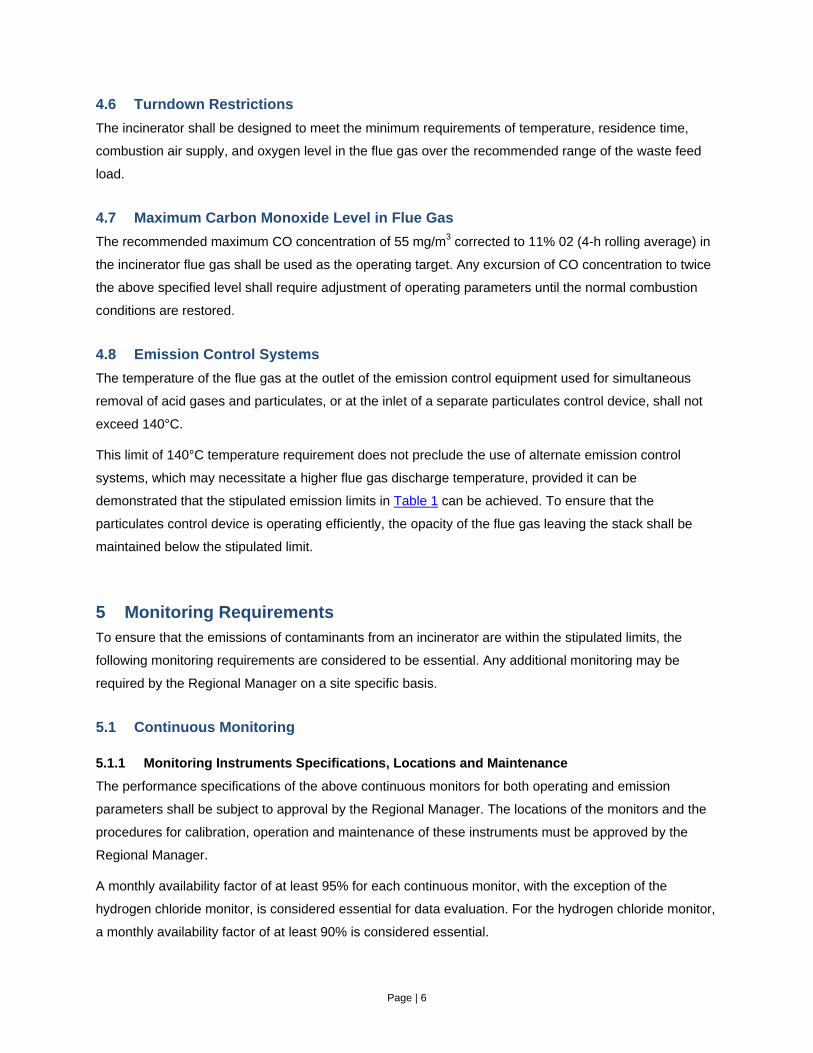
Page | 6
4.6 Turndown Restrictions The incinerator shall be designed to meet the minimum requirements of temperature, residence time,
combustion air supply, and oxygen level in the flue gas over the recommended range of the waste feed
load.
4.7 Maximum Carbon Monoxide Level in Flue Gas The recommended maximum CO concentration of 55 mg/m3 corrected to 11% 02 (4-h rolling average) in
the incinerator flue gas shall be used as the operating target. Any excursion of CO concentration to twice
the above specified level shall require adjustment of operating parameters until the normal combustion
conditions are restored.
4.8 Emission Control Systems The temperature of the flue gas at the outlet of the emission control equipment used for simultaneous
removal of acid gases and particulates, or at the inlet of a separate particulates control device, shall not
exceed 140°C.
This limit of 140°C temperature requirement does not preclude the use of alternate emission control
systems, which may necessitate a higher flue gas discharge temperature, provided it can be
demonstrated that the stipulated emission limits in Table 1 can be achieved. To ensure that the
particulates control device is operating efficiently, the opacity of the flue gas leaving the stack shall be
maintained below the stipulated limit.
5 Monitoring Requirements To ensure that the emissions of contaminants from an incinerator are within the stipulated limits, the
following monitoring requirements are considered to be essential. Any additional monitoring may be
required by the Regional Manager on a site specific basis.
5.1 Continuous Monitoring
5.1.1 Monitoring Instruments Specifications, Locations and Maintenance
The performance specifications of the above continuous monitors for both operating and emission
parameters shall be subject to approval by the Regional Manager. The locations of the monitors and the
procedures for calibration, operation and maintenance of these instruments must be approved by the
Regional Manager.
A monthly availability factor of at least 95% for each continuous monitor, with the exception of the
hydrogen chloride monitor, is considered essential for data evaluation. For the hydrogen chloride monitor,
a monthly availability factor of at least 90% is considered essential.
Page | 7
The Regional Manager must be notified of any continuous monitor failure for a period which may result in
non-attainment of the recommended availability factor.
5.1.2 Continuous Monitoring Parameters
The following operating and emission parameters, applicable to all incinerator sizes, shall be monitored
continuously:
1. Combustion Temperature;
2. Oxygen; and
3. Carbon Monoxide.
Additional continuous monitoring of emission and operating parameters listed below shall be required for
incinerators of over 400 kg/h capacities:
1. Opacity;
2. Hydrogen Chloride; and
3. Emission Control Device Inlet or Outlet Temperature.
The above additional parameters shall also be monitored continuously for an incinerator of 400 kg/h or
less capacity if it is equipped with an emission control system.
5.1.2.1 Combustion Temperature
The temperature at the fully mixed height in the final combustion zone of the incinerator shall be
measured and recorded continuously. Temperature sensors shall be located such that flames from the
auxiliary burners do not impinge on the sensors.
With respect to the continuous measurement and recording of the combustion temperature, a suitable
and approved alternate location downstream of the final combustion zone may be acceptable, provided:
1. It is demonstrated that the temperature in the final combustion zone cannot be measured
continuously without damaging the temperature sensors; and
2. A correlation between the final combustion zone temperature and that at the approved location
downstream is established to the satisfaction of the Regional Manager.
5.1.2.2 Oxygen and Carbon Monoxide
Oxygen and carbon monoxide concentrations in the incinerator flue gas shall be measured at the same
location downstream of the incinerator, but upstream of the emission control devices and where no
dilution of the flue gas will occur.
It is recommended that the incinerator be equipped with automatic control and suitable alarm systems,
preferably both visual and audible, in conjunction with the monitors for temperature, oxygen and carbon
monoxide. The alarms should be set to ensure that whenever the minimum incineration temperature

Page | 8
and/or oxygen level drops below, or the carbon monoxide level exceeds, that recommended in Table 2,
auxiliary burner(s) should be turned on and/or the waste feed be discontinued automatically, until the
normal operating conditions are reestablished.
5.1.2.3 Opacity
The opacity monitor should be equipped with suitable alarms set at an opacity level approved by the
Regional Manager.
An alarm for excessive opacity level should be investigated for poor combustion of waste and/or
malfunction of the particulate control device, and appropriate measures should be taken to rectify the
situation.
5.1.2.4 Hydrogen Chloride
The continuous monitor for hydrogen chloride emission should be equipped with suitable alarms set at a
predetermined hydrogen chloride concentration level approved by the Regional Manager. This monitor
should be linked with the emission control system for acid gases, and the system should be adjusted
automatically to reduce the emission, when the preset hydrogen chloride level is exceeded.
Alternatively, at facilities where continuous monitoring of sulphur dioxide is performed, a similar alarm and
acid gas emission control system adjustment could be used to maintain the hydrogen chloride emission
below the prescribed limit.
5.1.2.5 Emission Control Device Inlet or Outlet Temperature
The location of the sensor for continuous measurement of temperature at the outlet or inlet of the
emission control device, depending on the particular emission control system in use, should be approved
by the Regional Manager.
5.2 Source Testing Within 90 days of the start of full normal operation of the incinerator, source testing shall be conducted
for: oxygen, carbon dioxide and the contaminants listed in Table 1 or Section 3.2.1, as applicable to a
particular facility. The Regional Manager may require source testing of additional contaminants on a site
specific basis.
The Regional Manager must be notified in writing well in advance of the actual testing. All source testing
procedures shall be approved by the Regional Manager. Any subsequent source testing requirements will
be determined by the Regional Manager based on his review of the initial source test results, continuous
monitoring data and/or any other information related to the incinerator operation.

Page | 9
5.3 Other Monitoring The following additional monitoring requirements are listed in general terms to encompass all facilities
irrespective of the incinerator capacity. The Regional Manager shall determine the applicable items on a
case by case basis.
5.3.1 General
The incineration facility shall be inspected daily by trained personnel to investigate the status of various
components, so that malfunctioning of any components is identified and corrective actions are taken
immediately. Such inspection should include, but not be limited to: waste and other materials delivery and
storage area for spills, equipment leaks, corrosion, hot spots, gauges, monitors and recorders, etc.
Records of daily inspection shall include the following items and any others which are considered to be
necessary:
1. Inspection time and date;
2. Descriptions of the items inspected;
3. Observations made for each item inspected;
4. Any test, maintenance repair or any other corrective measures taken during or after the
inspection; and
5. Inspector's name, position and signature.
5.3.2 Hours of Operation, Waste, Ash and Residue Handling
Records of operation of the incinerator and its ancillary facilities in hours per day shall be maintained.
Daily records shall be maintained, in terms of weight, of quantities of:
1. Waste shipments delivered and their sources of origin;
2. Waste feed rate to the incinerator on an hourly basis or per batch, if the operation is in batch
mode, and the number of batches per day; and
3. Daily rates of bottom ash, fly ash and/or residue generation and treatment, if any, and disposal.
5.3.3 Auxiliary Burner Operation
Records shall be maintained of operation of auxiliary burner(s) and the rate of auxiliary fuel used in each
burner on an hourly basis for a continuous operation or on an "as used" basis, with the duration of each
period, when operated intermittently. If the auxiliary fuel used is oil, then its source, type and sulphur
content shall also be recorded for each batch of oil supplied. In no event shall the sulphur content in the
auxiliary fuel exceed the limit stipulated in the current edition of the Sulphur Content of Fuel Regulation of
the Environmental Management Act.
Page | 10
5.3.4 Emission Control Device
Records shall be maintained for emission control devices for removal of acid gases and/or particulates as
follows:
1. Hourly average temperature at the inlet or outlet of the device, as the case may be, in degrees C;
2. Frequency and duration of any period when the device is not fully operational, and appropriate
description of each period of malfunction of any device, as well as of the rectifying measure taken
in each case;
3. Hourly average pressure drop in kPa across the wet scrubber and/or fabric filter;
4. Reagent chemicals used in kg/h by chemical; and
5. The volume of water used, if any, in m3/h.
The following additional records on an hourly basis shall be maintained for any separate particulates
emission control device:
For fabric filter:
1. Average pressure drop in kPa across each module; and
2. Number of compartments in use.
For electrostatic precipitator:
1. Number of fields in use;
2. Applied voltage per field;
3. Current flow per field in amperes; and
4. Sparking rate per field.
5.4 Emission Control Device By-Pass Conditions Records of relevant operating conditions during any discharge of flue gases by-passing the emission
control device and the duration of such discharge shall be maintained.
6 Reports
6.1 Monthly Reports For records of monitoring of items under Sections 5.1, 5.3 and 5.4 above, monthly reports shall be
submitted to the Regional Manager within 20 calendar days following the end of each month.
The report for item Section 5.1 shall include the following:
1. Data from each continuous monitor shall be tabulated in the specified averaging period for each
parameter with both the minimum and maximum values recorded for each parameter during the
Page | 11
corresponding averaging period. The monthly average, minimum and maximum values for each
parameter shall also be reported. Prior to discarding this data the Regional Manager shall be
contacted regarding archiving;
2. Performance specifications and calibration data for each monitor;
3. Percentage of availability of each monitor;
4. Percentage of data capture for each monitor for the contaminants, oxygen and carbon dioxide;
5. The number of exceedances above the specified limit for each gaseous parameter and opacity,
and the number of occasions when such exceedances lasted more than 1 hour, or the stipulated
rolling averaging period for any particular parameter, with appropriate comments about remedial
measures taken in each case;
6. The number of occasions when the combustion temperature dropped below 1000°C, and for
each occasion indicate the recorded minimum temperature reached, the duration of operation at
sub-1000°C temperature, and the corrective measures taken; and
7. The number of occasions when the flue gas temperature at the inlet or outlet of the emission
control device exceeded 140°C, and for each occasion indicate the recorded maximum
temperature reached, the duration of operation above 140°C temperature, and the corrective
measures taken.
The records of monitoring of items under Sections 5.3.1 to 5.3.4 and Section 5.4 inclusive shall be
summarized for the whole month in appropriate formats and submitted to the Regional Manager.
6.2 Source Testing Report A complete report for the Source Testing (Section 5.2) results, with the exception of trace organics, shall
be submitted to the Regional Manager within 60 days of the completion of the actual testing. The results
for trace organics shall be submitted to the Regional Manager within 90 days of the completion of actual
testing.
6.3 Annual Performance Report An annual report reviewing the performance of the incinerator shall be submitted to the Regional Manager
within 90 days following the end of a calendar year. The report shall contain evaluation of at least the
following aspects:
1. The quantities of waste shipments received from different sources and waste processed at the site;
2. An overview of the plant performance describing the incinerator availability and the duration and
causes of any non-availability; the status of operation and maintenance of various equipment and
their adequacies; plant output, if any energy recovery is practiced; the quantities of bottom ash,
fly ash and/or residue generated and their disposal methods; general housekeeping practices;
Page | 12
incidence of any emergencies and the response measures implemented; incidence of emission
control system by-passing; and
3. Operation, performance and maintenance of emission control devices and continuous monitoring
systems.
7 Start-up, Shutdown and Upset Condition Periods, and Spill Management The owner or operator of an incineration facility shall prepare a detailed operating plan and procedures
for the incinerator start-up, shutdown and upset condition periods, and submit it to the Regional Manager
for approval prior to the issuance of a Permit. Such plan and procedures must be developed following the
recommendations outlined in Appendix B and consultation with the equipment manufacturers, as
necessary, so that the essential safety procedures for operation of any equipment are not overlooked or
compromised.
Spill protection and/or reporting for the site shall be handled in accordance with the current edition of the
Special Waste Regulation and/or Spill Reporting Regulation of the Environmental Management Act.
8 General Requirements for the Facility
8.1 The waste unloading and storage area shall be enclosed in order to minimize odorous and fugitive
emissions. The area shall be designed and maintained on negative draft and in such a manner that the
air from this area is used as combustion air for the incinerator.
8.2 The waste storage area shall be of sufficient capacity to store the delivered waste in the event of a
shutdown of the incinerator due to malfunctions of equipment, labour dispute or any other interruption of
operation.
8.3 The vehicular traffic areas at the facility shall be paved to minimize fugitive dust emissions.
8.4 Daily clean-up at the facility must be practiced so that any spilled waste or any other material is collected
on a regular basis.
Page | 13
8.5 A standby electrical power generator of sufficient capacity must be available at the site to supply
necessary power to maintain full operation of the facility in the event of a failure of the general electric
power supply system. The standby electric power supply must be provided until the general electric
power supply is restored or the incinerator is shut down in a manner prescribed in Section 7 and
Appendix B.
9 Requirement for Training of Incinerator Operator All incineration facilities subject to these Emission Criteria must be operated by properly qualified
personnel. Copies of certificates of the operating staff verifying the satisfactory completion of a training
program shall be submitted to the Regional Manager.
All incinerator operators shall be trained by a recognized technical organization or an institution with
capabilities to provide necessary training in the operating practices and procedures of all equipment. The
content of the training program shall be submitted to the Regional Manager for approval. The training
program shall include, but not be limited to, the following:
1. The basic principles of waste incineration and emission of contaminants there from;
2. Knowledge of the Waste Management Permit requirements;
3. The basic features and location of the incinerator, emission control system, and other equipment
at the facility;
4. Proper operation, functioning and maintenance of all mechanical, emission control and monitoring
equipment;
5. Detection of excessive emissions and procedures to be followed during such occasions; and
6. Response procedures and measures to be taken during emergency situations.
This requirement does not eliminate the need for any staff involved with the facility from obtaining any
other licenses or certificates necessary to carry out other duties as may be required by any other
agencies.
10 Wastewater Management Any wastewater generated at the site from the waste handling, storage and incineration area, any
emission control system, ash and/or residue quench and conveyance systems, sanitary effluent, and from
any other sources shall be treated and disposed of in a manner approved by the Regional Manager.

Page | 14
11 Ash and Residue Management To minimize fugitive emissions of ash and residue particles, adequate precautions shall be taken at the
time of handling, conveyance and storage of these materials. Wind-sheltered, enclosed storage areas
shall be provided for these materials. As some of these materials may be classified as special waste, the
final disposal methods for these materials must be approved by the Regional Manager. The disposal
methods shall be determined after testing these materials in accordance with the procedures outlined in
the current edition of the Special Waste Regulation of the Environmental Management Act.
Table 1: Stack Emission Limits for Incinerators of Capacity Over 400 kg/h of Waste
(Concentrations corrected to 11% 02)
Contaminant Limit Averaging Period Monitoring Method
Total Particulate 20 mg/m3 (1) (2)
Carbon Monoxide 55 mg/m3 (3) 4-hour rolling average Continuous Monitoring
Sulphur Dioxide 250 mg/m3 (1) (2)
Nitrogen Oxides (NOx as NO2)
350 mg/m3 (1) (2)
Hydrogen Chloride 70 mg/m3 8-hour rolling average Continuous Monitoring
Hydrogen Fluoride 3 mg/m3 (1) (2)
Total Hydrocarbons (as Methane CH4) 40 mg/m3 (1) (2)
Arsenic (4) 4 µg/m3 (1) (2)
Cadmium (4) 100 µg/m3 (1) (2)
Chromium (4) 10 µg/m3 (1) (2)
Lead (4) 50 µg/m3 (1) (2)
Mercury (4) 200 µg/m3 (1) (2)
Chlorophenols 1 µg/m3 (1) (2)
Chlorobenzenes 1 µg/m3 (1) (2)
Polycyclicaromatic Hydrocarbons 5 µg/m3 (1) (2)
Polychlorinated Biphenyls 1 µg/m3 (1) (2)
Total PCDDs & PCDFs (6) 0.5 ng/m3 (1) (2)
Opacity 5% 1-hour average from data taken every 10 seconds
Continuous Monitoring
(1) To be averaged over the approved sampling and monitoring method. (2) All sampling and monitoring methods, including continuous monitors, are to be approved by the Regional Manager. (3) For RDF systems the limit shall be 110 mg/m3. (4) The concentration is total metal emitted as solid and vapour. (5) For existing incinerators the limit shall be 200 µg/m3, for the initial 2 years after the issuance of these Emission Objectives. (6) Expressed as Toxicity Equivalents. The value shall be estimated from isomer specific test data and toxicity equivalency factors by following a procedure approved by the ministry.

Page | 15
Table 2: Design and Operation Requirements for Municipal Solid Waste Incinerators
and Emission Control Systems
Parameter Incinerator Type Modular (Excess Air
and Starved Air)
Incinerator Type Mass Burn
Incinerator Type RDF
Incinerator
Minimum Incineration Temperature
1000 degrees C at fully mixed height
1000 degrees C determined by an overall design review
1000 degrees C
Minimum Residence Time
1 second after final secondary air injection ports
1 second calculated from the point where most of the combustion has been completed and the incineration temperature fully developed
1 second calculated from point where most of the combustion has been completed and the incineration temperature fully developed
Primary Air (Underfire)
Utilize multi-port injection to minimize waste distribution difficulties
Use multiple plenums with individual air flow control
Use air distribution matched to waste distribution
Secondary Air (Overfire)
Up to 80% of total air required (1)
At least 40% of total air required
At least 40% of total air required
Overfire Air Injector Design
That required for penetration and coverage of furnace cross-section
That required for penetration and coverage of furnace cross-section
That required for penetration and coverage of furnace cross-section
Auxiliary Burner Capacity
Secondary burner 60% of total rated heat capacity, and that required to meet start-up and part-load temperatures
60% of total output, and that required to meet start-up and part-load temperatures
60% of total output, and that required to meet start-up and part-load temperatures
Oxygen Level at the Incinerator Outlet
6 to 12% 6 to 12% 3 to 9%
Turndown Restrictions
80 to 110% of designed capacity
80 to 110% of designed capacity
80 to 110% of designed capacity
Maximum CO Level 55 mg/m3 @ 11% O2 (4-h rolling average)
55 mg/m3 @ 11% O2 (4-h rolling average)
110 mg/m3 @ 11% O2 (4-h rolling average)
Emission Control Systems (2)
Flue Gas Temperature at Inlet or Outlet of Emission Control Device (3)
Not to exceed 140 degrees C
Not to exceed 140 degrees C
Not to exceed 140 degrees C
Opacity (4) Less than 5% Less than 5% Less than 5%
(1) For excess Air type — as required by design. (2) Applicable to incinerators equipped with such systems. (3) The flue gas temperature at the inlet or outlet will depend on the type of emission control device in use. (4) For incinerators with capacity or processing 400 kg/h or less of waste the opacity shall be less than 10%.

Page | 16
12 Appendix A
Acid Gases: Hydrogen chloride
Hydrogen fluoride
Oxides of nitrogen
Oxides of sulphur
Chlorobenzenes (CBs): Cl-2 benzene
Cl-3 benzene
Cl-4 Benzene
Cl-5 benzene
Cl-6 benzene
Chlorophenols (CPs): Cl-2 phenol
Cl-3 phenol
Cl-4 phenol
Cl-5 phenol
Polycyclic Aromatic Hydrocarbons (PAHs): Acenaphthylene
Acenaphthene
Fluorene
Phenanthrene
Anthracene
Fluoranthene
Pyrene
Chrysene
Benzo [a] anthracene
Benzo [e] pyrene
Benzo [a] pyrene
Benzo [b] fluoranthene
Benzo [k] fluoranthene
Perylene
Indeno [1,2,3-cd] pyrene
Dibenzo [a,h] anthracene
Benzo [g,h,i] perylene
Benzo [l ] phenanthrene

Page | 17
Polychlorinated Biphenyls (PCBs):
Polychlorinated dibenzo-para-dioxins (PCDDS) and polychlorinated dibenzofurans (PCDFs) in the
following homologue groups:
T — tetra
Pa — penta
Hx — hexa
Hp — hepta
O — octa
Appendix B: Recommendations for an Operating Plan and Procedure for Incinerator Start-up, Shutdown, and Upset Condition Periods
1 Incinerator Start-up and Shutdown Without limiting the scope of the plan, provisions for the following must be included in the detailed plan
and procedures:
1.1 Combustion Temperature and Waste Feed The systems for waste feed, combustion control, and continuous monitoring of combustion parameters
must be integrated in such a manner that proper incinerator operating conditions are maintained
automatically. In addition, the procedures outlined below must be adhered to under the following
circumstances:
1.1.1 No waste shall be charged to the incinerator until the required minimum temperature in the final
combustion zone is achieved and maintained for at least 15 minutes by using the auxiliary burner(s).
1.1.2 In the event of any unscheduled or scheduled shutdowns:
1. The waste feed to the incinerator shall be automatically discontinued; and
2. The minimum required temperature in the final combustion zone shall be maintained by using
auxiliary burner(s): (a) until the carbon monoxide concentration in the stack gas can be
maintained below the required level, and the combustion and burndown cycles of the remaining
waste in the incinerator are complete; and (b) for a minimum of 15 minutes from the beginning of
an unscheduled shutdown and when an emergency discharge of the flue gas directly to the
atmosphere becomes necessary.
1.2 Continuous Monitoring and Emission Control Systems The continuous monitoring systems for combustion and emission parameters and emission control
systems must be in proper operating conditions: (a) prior to any waste charging to the system during
Page | 18
start-up; (b) during normal operation of the incinerator; and (c) until the burndown cycle is complete at the
time of any planned shutdown.
The emission control systems shall not be by-passed at any time when the incinerator is in operation,
except under the following circumstances, if necessary, and during start-up and shutdown:
1. When the temperature of the flue gas at the emission control device is below or above that
specified by the manufacturer; and
2. During an emergency shut down, for example, due to fire hazard or failure of the induced draft fan.
2 Upset Condition Periods Some variations in the incinerator operating parameters and in the emission control parameters are to be
expected; however, during normal operation of the incinerator the specified average values of these
parameters can be maintained. Common indications of upset conditions may include but not be limited to:
1. An operating parameter which varies consistently for any unusual duration; and
2. The development of a trend towards a higher or lower value, as the case may be, than that
specified for any particular parameter.
The incinerator operators must be trained to recognize abnormal operations as well as to take corrective
actions in a systematic manner. A suggested list of potential measures is provided below; however, these
measures should be reviewed with the manufacturers' specifications for the particular equipment installed
at the facility.
2.1 Continuous Monitoring Systems All continuous monitors and recorders should be checked for their performance and calibration by zero
and fullscale span as applicable.
2.1.1 Combustion Parameters
In the event of low combustion temperature, low oxygen level and/or high carbon monoxide level, the
following checks should be made:
1. Auxiliary burner(s) operation, including the fuel and air supplies;
2. The waste feed system;
3. Combustion air supplies to the incinerator;
4. Visual inspection of the incinerator grates; and
5. Other ancillary equipment which could influence the incinerator performance.
Page | 19
2.1.2 Opacity and Emission Control Parameters
During any exceedances of the flue gas temperature at the inlet or outlet of emission control device, of
opacity, and of hydrogen chloride the following checks should be necessary:
1. The normalcy of the incinerator operation;
2. The flue gas conditioning system, if any, upstream of the emission control device;
3. Particulates emission control device; and
4. Acid gas scrubbing system.
2.2 Emergency Shutdown Emergency shutdown procedures should be followed if the malfunctioning of the incinerator or emission
control system persists even after implementation of the corrective measures to rectify any upset
conditions.


