matti nikkola emission monitoring authority …
TRANSCRIPT
MATTI NIKKOLA
EMISSION MONITORING AUTHORITY REQUIREMENTS AT
POWER PLANTS IN EU
Master of Science Thesis
Examiner: professor Pentti Lautala
Examiner and subject approved by the Faculty Council in 4th December 2009
II
ABSTRACT
TAMPERE UNIVERSITY OF TECHNOLOGY Faculty of Automation, Mechanical and Materials Engineering Department of Automation Science and Engineering
NIKKOLA, MATTI: Emission monitoring authority requirements at power plants in EU Master of Science Thesis, 60 pages, 7 Appendix pages
May 2010 Major: Process Automation Examiner: Professor Pentti Lautala
Keywords: Emissions, large combustion plants, waste incineration plants, authority requirements, implementation, emission monitoring and reporting
Protection of environment and human health is major concern for European Union.
European Commission has established integrated pollution prevention and control
directive and directives concerning large combustion plants (LCP) and waste
incineration (WI) plants to prevent emissions from industrial installations. The LCP and
WI directives set the lowest requirements such as emission limit values and monitoring
requirements that the operators have to comply in EU. European Commission has also
published best available technique (BAT) reference documents to help authorities
determine the requirements in environmental permits for the installations.
This thesis is looking into the authority requirements for continuous emission
monitoring systems (CEMS) that are set by the competent authorities in Spain, Estonia,
France, Poland, Czech and UK. Power plants have to monitor and report air emissions
with the help of CEMS. It consists of measurement equipment, analysers and sample
conditioning systems as well as environmental data management solution. Directives
and standards set the requirements for the CEMS, but still requirements differ between
the target countries. For instance, according to the study only in UK certification
(MCERTS) for the analyser is required and only in Spain plant owner is not allowed to
perform the compliance reporting of the plants emissions. It is the responsibility of
competent authority. Also the charging and trading emissions differ between the target
countries.
The coming directive on industrial emissions will be possibly accepted in the
end of 2010. It will unify and straiten the requirements. Emission limit values will lower
and the emission monitoring requirements will be stricter. Due to the directive, the
importance of the use of best available technique will be emphasized. BAT reference
documents for large combustion plants and monitoring emissions are reviewed in 2010.
The subject of this thesis was wide and the special requirements are presented in
general level. Further studies can use this thesis as a ground for more detailed research
in monitoring and reporting emissions from power plants in EU. More research should
be done because monitoring of local environmental legislation of Member States is
ongoing process.

III
TIIVISTELMÄ
TAMPEREEN TEKNILLINEN YLIOPISTO Automaatiotekniikan koulutusohjelma Systeemitekniikan laitos
NIKKOLA, MATTI: Päästöjen valvonnan viranomaisvaatimukset voimalaitoksilla EU: n alueella Diplomityö, 60 sivua, 7 liitesivua
Toukokuu 2010 Pääaine: Prosessiautomaatio Tarkastaja: Professori Pentti Lautala
Avainsanat: Päästöt, suuret polttolaitokset, jätteenpolttolaitokset, viranomaisvaatimukset, täytäntöönpano, päästöjen tarkkailu ja raportointi Ympäristön ja ihmisten terveyden suojeleminen ovat tärkeitä asioita Euroopan
Unionille. Euroopan komissio säätelee päästöjen määrää voimalaitoksilta vesiin, ilmaan
ja maaperään lainsäädännön ja standardien avulla. Direktiivi ympäristön pilaantumisen
ehkäisemisen ja vähentämisen yhtenäistämiseksi (IPPC direktiivi) asettaa ehdot
ympäristöluvan antamiselle muun muassa suurille polttolaitoksille ja
jätteenpolttolaitoksille. IPPC direktiivi koskee yli 50 MW polttolaitoksia.
Suurten polttolaitosten päästöjä rajoitetaan direktiivillä 2001/80/EY (LCP
direktiivi). LCP direktiivi koskee polttolaitoksia, joiden polttoteho on 50 MW tai
enemmän. Se asettaa vähimmäisvaatimukset, joita suuret polttolaitokset joutuvat
noudattamaan. Vaatimukset koskevat muun muassa päästöraja-arvoja, päästömittauksia
ja raportointia. Päästöraja-arvot on määritelty LCP direktiivissä rikkidioksidille (SO2),
typpioksideille (NOx) ja hiukkasille. Näiden päästökomponenttien lisäksi myös
happipitoisuutta, vesihöyrypitoisuutta sekä savukaasun lämpötilaa ja painetta joudutaan
mittaamaan jatkuva-aikaisesti.
Direktiivi 2000/76/EC (WI direktiivi) asettaa jätteenpolttolaitoksille tiukemmat
vaatimukset kuin LCP direktiivi suurille polttolaitoksille. Polttotehorajaa ei ole, vaan
direktiivi koskee kaikkia jätteenpolttolaitoksia. Direktiivi sisältää myös rajoituksia
vesipäästöille.
Euroopan komissio on julkaissut ohjekirjoja muun muassa LCP- ja WI-
laitoksille sekä parhaan mahdollisen tekniikan (BAT) käytöstä. Myös päästöjen
tarkkailulle on oma BAT-ohje. Nämä BREF-asiakirjat ovat tarkoitettu
lupaviranomaisten ohjeasiakirjoiksi arvioitaessa parhaan mahdollisen tekniikan käyttöä
ympäristölupien myöntämisen yhteydessä.
Tämä diplomityö tutkii jatkuva-aikaisen päästövalvontajärjestelmän (CEMS)
erityisiä viranomaisvaatimuksia sekä direktiivien ja standardien paikallisia tulkintoja
seuraavissa maissa: Espanja, Viro, Tsekki, Puola, Iso-Britannia ja Ranska. CEMS
koostuu mittalaitteista, näytteenottojärjestelmästä, analysaattorista sekä valvonta- ja
raportointisovelluksesta. Analysaattorista saatu raakadata muutetaan vertailukelpoisiksi
päästökeskiarvoiksi valvonta- ja raportointisovelluksessa tapahtuvassa
päästölaskennassa.
IV
Direktiivit ja standardit asettavat vaatimukset CEMS:lle. Tutkimuksen ja Metson
aikaisemman kokemuksen perusteella vaatimusten tulkinnat eroavat niin EU:n
jäsenmaiden kuin myös tämän diplomityön kohteena olevien maiden kesken.
Tutkimuksen mukaan paikallisessa päästökaupassa ja -verotuksessa on eroja. Iso-
Britanniassa voimalaitokset käyvät kauppaa SO2:lla, NOx:lla ja hiukkasilla, kun taas
Viro verottaa voimalaitoksia samoista päästökomponenteista.
Metson Automaatioliiketoiminta oli muun muassa kiinnostunut siitä,
rajoitetaanko jossain kohdemaassa CEMS:n integroimista automaatiojärjestelmään. Jos
CEMS:iä ei voida integroida automaatiojärjestelmään, raportointi- ja valvontasovellus
on täysin itsenäinen päästölaskenta yksikkö. Tällaista eristettyä mallia ei kuitenkaan
mistään kohdemaasta löytynyt. CEMS:n ja automaatiojärjestelmän integroimisesta on
paljon hyötyä. Automaatiojärjestelmä voi esimerkiksi päästötietojen avulla ajaa laitosta
optimaalisella tavalla.
Tutkimuksessa parhaiten tietoa oli saatavilla Iso-Britanniasta. Ainoastaan UK:n
alueella vaaditaan kahdennettu CEMS, mikä tarkoittaa käytännössä sitä, että jokaista
päästökomponenttia kohden vaaditaan kahdennettu mittausjärjestelmä. Iso-Britannia on
myös ainoa alue, missä vaaditaan MCERTS:n (Monitoring Certification Scheme)
sertifikaatti analysaattorille. MCERTS on Iso-Britannian ympäristöviraston nimittämä
sertifiointi toimielin. Missään muussa kohdemaassa ei tutkimuksen mukaan vaadita
MCERTS:n tai vastaavanlaisen sertifiointiyrityksen sertifikaattia analysaattorille.
Tutkimuksen mukaan valvonta- ja raportointisovelluksille sertifiointivaatimusta ei vielä
Iso-Britanniassa ole, mutta se on suunnitteilla ja vaatimus saattaa tulla voimaan 1-2
vuoden kuluttua.
Espanjan osalta tuli esille vaatimus, jota ei missään muualla tullut vastaan.
Tutkimuksen mukaan Espanjassa viranomaisraportointi tapahtuu pelkästään
viranomaisten toimesta. He ottavat analysaattorista raa’an päästödatan ja tekevät itse
vaadittavat päästölaskelmat.
Vaatimukset päästöjen valvonnalle ja raportoinnille asettaa tulevaisuudessa
industrial emission directive (IED). IED kokoaa seitsemän olemassa olevaa direktiiviä
mukaan lukien IPPC- , LCP- ja WI-direktiivit. IED hyväksytään mahdollisesti vuoden
2010 loppuun mennessä. IED tulee kiristämään nykyisiä vaatimuksia. Päästöraja-arvot
alenevat ja valvontavaatimukset tiukkenevat, mikä näkyy muun muassa siinä, että LCP-
laitokset joutuvat mittaamaan CO:a jatkuva-aikaisesti. CO-pitoisuudet pitää myös
raportoida vironomaisille.
IED:n myötä parhaan mahdollisen tekniikan käyttö korostuu. BAT BREF-
asiakirjojen käyttöä tullaan valvomaan aiempaa tarkemmin. BREF-asakirjat LCP-
laitoksille ja valvonnalle ovat parhaillaan päivityksen alla. Myös niissä vaatimukset
tiukkenevat. Uusien BREF-asiakirjojen päästötasojen odotetaan olevan alempana kuin
IED:n päästöraja-arvot. Tämä saattaa koitua ongelmaksi, sillä IED:n mukaan BREF-
asiakirjoja tulee pitää ensisijaisena lähestymistapana viranomaisten myöntämissä
ympäristöluvissa. Tällä hetkellä ei ole tietoa kumpaa, IED:tä vai BAT BREF-asiakirjoja
sovelletaan päätettäessä päästöraja-arvoja laitokselle.

V
Tämän diplomityön aihe oli laaja ja kohdemaita, joista tietoa kerättiin, oli paljon.
Koska työn aikataulu oli tiukka, yksityiskohtaisempien tulosten hankkiminen ja
etsiminen oli mahdotonta. Työn tulokset jäivät yleiselle tasolle, mutta tämän työn
tuloksia on hyvä käyttää vahvana pohjana jatkotutkimuksille.

VI
ACKNOWLEDGEMENTS
This Master of Science thesis was carried out in cooperation with Metso Automation
and Metso Power. The whole thesis process has offered me enormous amount of
experience. I have learned a lot from the emission monitoring at power plants. It has
been intriguing to study such dynamic area of industry.
I wish to express my gratitude to my supervisors Tiina Stenvik and Juha
Särkijärvi for guidance and endless patience in commenting my work. I acknowledge
my appreciation to Marika Salmela and Maria Nurmoranta for great support. I would
also like to thank Asko Rantee, Tuomo Suhonen and Henri Montonen as well as all the
other persons who have been part of this thesis process.
I want thank my examiner Professor Pentti Lautala and Research Scientist M.Sc
Yrjö Majanne.
Sincere thanks go to my parents Aulis and Anita for encouraging me in life and
studies. Also my friends, especially my beloved Mimmi deserve special thanks for
indefatigable support.
Tampere, May 19, 2010
Matti Nikkola

VII
CONTETS
Abstract .................................................................................................................................. II
Tiivistelmä ........................................................................................................................... III
Acknowledgements ............................................................................................................. VI
Abbreviations....................................................................................................................... IX
1. Introduction ................................................................................................................... 1
2. EU’s means for power plants to prevent pollution ..................................................... 2
2.1. Causes to prevent pollution .................................................................................. 3
2.2. Integrated Pollution Prevention and Control (IPPC) directive .......................... 4
2.2.1. Main principles of IPPC directive ......................................................... 4
2.2.2. Applying environmental permit ............................................................. 5
2.3. Large Combustion Plant (LCP) directive ............................................................ 6
2.3.1. Emission limit values.............................................................................. 6
2.3.2. Total annual emission ............................................................................. 6
2.3.3. Monitoring requirements ........................................................................ 7
2.4. Waste incineration directive................................................................................. 8
2.4.1. Emission limit values.............................................................................. 8
2.4.2. Monitoring requirements ........................................................................ 9
2.5. Best Available Technique .................................................................................. 10
3. Measurement techniques ............................................................................................ 13
3.1. Sulphur dioxide ................................................................................................... 13
3.2. Nitrogen oxides ................................................................................................... 14
3.3. Dust ...................................................................................................................... 15
4. Comparison of CEMS authority requirements at target countries in EU ................ 18
4.1. Certification requirements for the system and reporting solution ................... 20
4.1.1. MCERTS for environmental data management software .................. 23
4.1.2. MCERTS for analysers/CEMS ............................................................ 25
4.2. CEMS integration to automation system .......................................................... 26
4.3. Continuous measurements ................................................................................. 30
4.3.1. Criteria for continuous measurement system in target countries ....... 31
4.3.2. Required continuous measurements in target countries ..................... 32
4.3.3. Supplying process of CEMS ................................................................ 35
4.4. Reported emissions and units............................................................................. 36
4.4.1. Large combustion plants ...................................................................... 36
4.4.2. Waste incineration plants ..................................................................... 37
4.4.3. EU regulations of the emissions to water ............................................ 38
4.5. Calculation of limit values for multi-firing unit ............................................... 39
4.6. National emission trading/taxation .................................................................... 40
5. Implementation of EN 14181 standard ...................................................................... 43
5.1. Quality Assurance Levels................................................................................... 44
5.1.1. QAL 1 .................................................................................................... 44
VIII
5.1.2. QAL 2 .................................................................................................... 45
5.1.3. QAL 3 .................................................................................................... 46
5.1.4. Annual Surveillance Test ..................................................................... 48
5.2. QAL 1-3 responsibilities .................................................................................... 48
5.2.1. Specific QAL2 responsibilities ............................................................ 50
6. Outlook for the future ................................................................................................. 51
6.1. Industrial Emission Directive............................................................................. 51
6.1.1. Emission limit values............................................................................ 51
6.1.2. Emission monitoring requirements ...................................................... 52
7. Conclusion ................................................................................................................... 54
References ............................................................................................................................ 57
Appendix 1 ........................................................................................................................... 61
Appendix 2 ........................................................................................................................... 65
Appendix 3 ........................................................................................................................... 66
Appendix 4 ........................................................................................................................... 67

IX
ABBREVIATIONS
c Concentration.
E Extinction.
k Extinction factor.
l Measurement gap.
C Total emission limit value for the pollutants and specific
industrial sector in specific oxygen content determined
according to which type of fuel is used.
Cproc Emission limit value set for pollutants that are generated in
combustion of other fuels (waste excluded). These emission
limit values vary according to which type of fuel is used
and what is the rated thermal input of the installation.
Cwaste Emission limit value set for incineration of waste for
relevant pollutants and carbon monoxide.
Vproc Flue gas volume caused by other fuels (waste excluded).
Vwaste Flue gas volume caused by the incinerated waste.
As Arsenic.
Cd Cadmium.
Cl Chlorine.
Co Cobalt.
Cr Chromium.
Cu Copper.
F Fluorine.
Hg Mercury.
Mn Manganese.
N Nitrogen.
Ni Nickel.
P Phosphorus.
Pb Lead.
S Sulphur.
Sb Antimony.
Sn Tin.
Tl Thallium.
V Vanadium.
Zn Zinc.
X
CO Carbon monoxide.
CO2 Carbon dioxide.
H2O Hydrogen monoxide.
HCl Hydrogen chloride.
HF Hydrogen fluoride.
N2 Nitrogen.
N2O Nitrous oxide.
NO Nitrogen monoxide.
NO2 Nitrogen dioxide.
NOx Nitrogen oxides.
((NH2)2CO) Urea.
NH3 Ammonia.
O2 Oxygen.
SO2 Sulphur dioxide.
SO3 Sulphur trioxide.
TOC Total organic carbon.
AEL Associated Emission Level.
AMS Automated Measuring System.
AST Annual Surveillance Test.
BAT Best Available Technique.
BOD Biochemical Oxygen Demand.
BREF Best Available Technique Reference .
BTEX Benzene, Toluene, Ethyl benzene and Xylene.
CEMS Continuous Emission Monitoring System.
CEN European Committee of Standardization.
COD Chemical Oxygen Demand.
CUSUM Cumulative Sum chart.
DCS Digital Control System, Distributed Control System.
EA Environment Agency.
ELV Emission Limit Value.
EMRS Emission Monitoring and Reporting Solution.
EN European Standard.
EOX Extractable Organic Halogens.
E-PRTR European Pollutant Release and Transfer Register.
EPER European Pollutant Emission Register.
EST Emission Trading Scheme.
EU European Union.
FTIR Fourier Transform Infrared Spectroscopy.
GHG Greenhouse Gas.
IEC International Electrotechnical Commission.
XI
IED Industrial Emission Directive.
IPPC Integrated Pollution Prevention and Control.
ISO International Organization for Standardization.
LCP Large combustion plant.
MCERTS Monitoring Certification Scheme.
MID Method Implementation Document.
NDIR Non-Dispersive Infra Red.
NDUV Non Dispersive Ultraviolet.
NERP National Emission Reduction Plan.
NIEA Northern Ireland Environment Agency.
QAL1 Quality Assurance Level 1.
QAL2 Quality Assurance Level 2.
QAL3 Quality Assurance Level 3.
SCR Selective Catalytic Reduction.
SEPA Scottish Environment Protection Agency.
SNCR Selective non-Catalytic Reduction.
SQP Software Quality Plan.
SRM Standard Reference Method.
Swedish EPA Swedish Environmental Protection Agency.
TDS Total Dissolved Solids.
TGN Technical Guidance Note.
TSS Total Suspended Solids.
TÜV Technical Inspection Association (Technischer
Überwachungs-Verein).
UK United Kingdom.
UV Ultra Violet Radiation.
WI Waste incineration.

1
1. INTRODUCTION
This Master of Science Thesis was done for Metso Automation and Metso Power. Both
of them are part of larger Energy and Environmental Technology segment of Metso
Corporation. This thesis will look into matters which are concerning one of the product
of Metso Automation, monitoring and reporting solution and continuous emission
monitoring systems which are supplied by Metso Power alongside with the boiler
plants.
For the protection of the environment and human health, European Commission
has established Integrated Pollution Prevention and Control Directive and specifically
for power plants, Large Combustion Plant and Waste Incineration Directives [1; 2; 3].
Directives define the lowest threshold that the power plants have to comply in
restricting pollution.
Member States can tighten up the requirements stated in the directives and set
other special requirements. Different interpretations of the EU requirements are causing
conflicts. The primary goal of this thesis was to find out how the Member States has
implemented the directives as well as find out possible special requirements for
monitoring, controlling and preventing emissions at power plants. Also clarifying
prospects for the developing requirements was one goal of the thesis. The target
countries for this thesis were Estonia, UK, France, Poland, Czech and Spain. Portugal
and Slovakia were dropped out from the list, because the information from those
countries was not available.
Lot of the information in this thesis is based on the questionnaire. The
questionnaire was developed in accordance with the experience of Metso and in such
way that the answers would clarify the known issues concerning the interpretations. The
questionnaire can be seen in appendix 1. Another information source of this thesis was
the internet, specifically the web pages of the environmental agencies of the target
countries and the web pages of the European Commission. Also the consultations with
employees of Metso, clarified the environmental field through previous and ongoing
projects.
According to the study the requirements differ between the target countries and
are expected to differ in the future as well. New directive on industrial emissions will
unify and straiten the present requirements and the use of best available technique in
granting environmental permits for power plants, will be emphasized.
2. EU’S MEANS FOR POWER PLANTS TO
PREVENT POLLUTION
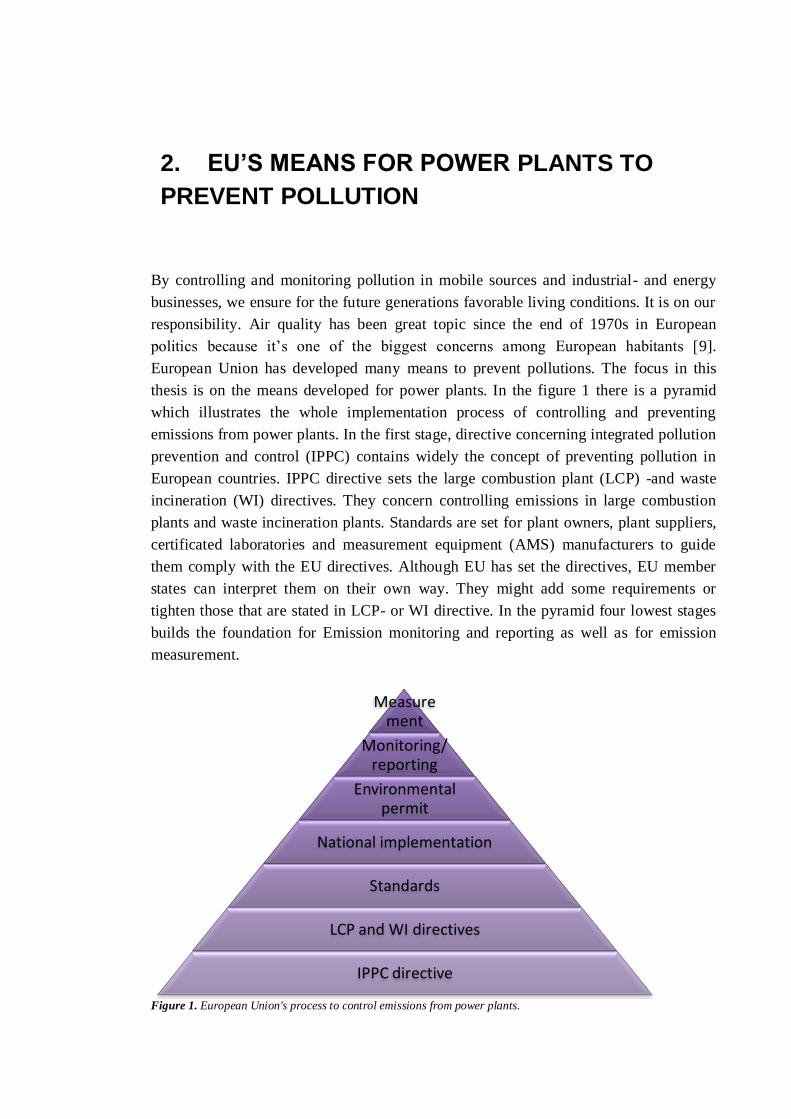
By controlling and monitoring pollution in mobile sources and industrial- and energy
businesses, we ensure for the future generations favorable living conditions. It is on our
responsibility. Air quality has been great topic since the end of 1970s in European
politics because it’s one of the biggest concerns among European habitants [9].
European Union has developed many means to prevent pollutions. The focus in this
thesis is on the means developed for power plants. In the figure 1 there is a pyramid
which illustrates the whole implementation process of controlling and preventing
emissions from power plants. In the first stage, directive concerning integrated pollution
prevention and control (IPPC) contains widely the concept of preventing pollution in
European countries. IPPC directive sets the large combustion plant (LCP) -and waste
incineration (WI) directives. They concern controlling emissions in large combustion
plants and waste incineration plants. Standards are set for plant owners, plant suppliers,
certificated laboratories and measurement equipment (AMS) manufacturers to guide
them comply with the EU directives. Although EU has set the directives, EU member
states can interpret them on their own way. They might add some requirements or
tighten those that are stated in LCP- or WI directive. In the pyramid four lowest stages
builds the foundation for Emission monitoring and reporting as well as for emission
measurement.
Figure 1. European Union's process to control emissions from power plants.
Measurement
Monitoring/reporting
Environmental permit
National implementation
Standards
LCP and WI directives
IPPC directive
2. EU’S MEANS FOR POWER PLANTS IN PREVENTING POLLUTION 3
2.1. Causes to prevent pollution
The quality of air, water and soil is very important to humans well being in earth. Air
quality has worsened since the industrial revolution mainly because of the great increase
of traffic, industrial and energy production and fossil fuel incineration. Cities are
enormous and still growing. In the big cities the impaired quality of air has increased the
amount of people that suffer from lung diseases. Today there is twice as much
asthmatics than 20 years ago. Fine particulate matter and ozone are considered as a
significant reason of health issues. Fine particulate matter covers dust, soot, smoke and
pollen. Although the fact that emissions of several pollutants have been decreased since
1990, concentration of particulate matter and ozone hasn’t dropped. Many people living
in cities have been exposed to a bigger concentration of particulate matter than the
European Union’s target value. [16]
Climate warming is a cause of increase of greenhouse gases. Aqueous steam of
atmosphere and gases, such as carbon dioxide block the heat radiation leaving from
earth. Blocked heat warms-up the atmosphere. Among other things, use of fossil fuels
increases the amount of the greenhouse gases in atmosphere and thereby accelerates the
greenhouse effect. [29]
Sulphur dioxide (SO2) and nitrogen oxide (NOx) are acidifying gases. Power
production is one of the significant producers of SO2 and NOx emissions. After the
emissions change to sulphate-, nitrate- and ammonium form, they descend to the
ground. Our ecosystems has limit estimate for the fall-out after which in the long run the
pollution will cause detrimental effects. The sulphur and the nitrogen of the emissions
originate from the fuels that are incinerated. [24.] Significant source of nitrogen is also
the combustion air. The sulphur and the nitrogen oxidize in the combustion process.
Due to the acidification, forests might get damaged and in the water system species of
plants can change and some species might even disappear for good. [43.]
Particulate emissions are almost purely ash from the fuels. It drifts to the air
along with the flue gas. Unburned fuel might contain detrimental heavy metals,
carcinogenic and other mutagenic compound. Heavy metals are emitted through two
channels: Into the air through flue gas and into the water through fly ash. Heavy metals
have characteristic that is hard to control. Many of the heavy metals associates with
smallest components of fly ash and therefore it is hard for flue gas purificator to stop
them getting into the atmosphere. [26.] For instance, mercury (Hg) is such metal
element that can get through the flue gas purificators. That is not desirable because
mercury is very harmful for the nature and for the humans. Mercury can be purified
from the flue gases, but the reduction rate depends on the composition of the mercury.
[13.]

2. EU’S MEANS FOR POWER PLANTS IN PREVENTING POLLUTION 4
2.2. Integrated Pollution Prevention and Control (IPPC)
directive
Significant proportion of emissions is produced by industry. Due to the growing
industry, emissions increases and thereby needs attention. Operators in different
industry sectors have to cut down emissions to air and water due to the EU regulations.
Investments for appropriate equipment to comply the regulations need lot of money.
Today environmental matters are part of the performance for the organizations
participating in the energy production
The image which the operators show to the customers is very important in the
business. Customers see operators that care about the pollution prevention and the
greener future of the earth in more positive light than those that does not take
environment’s wellbeing into account in their operations. Nowadays operators find
controlling and cutting down emissions also as business opportunity than as coercive
and money wasting measures. EU legislative regulations such as IPPC directive set the
ground for the controlling and preventing pollution [1].
EU set in 1996 IPPC (Integrated pollution prevention and control) directive
1996/61/EC on preventing and cutting down pollutions to air, water as well as to ground
from different sectors of industry. In 2008 IPPC directive got revised (2008/1/EC). In
the energy industry, combustion plants which output are higher than 50 MW falls under
the directive. The directive contains rules on permitting and controlling industrial
installation. IPPC directive concerns the largest industrial plants, such as energy
production plants, gas- and oil refineries, metal production and refining, mineral
industry, chemical industry, paper- and board industry as well as waste management
plants. Since 30 October 1999 new installations and existing plants which had been
facing significant changes have been required to meet the IPPC requirements. Deadline
for the other installations was in 30 October 2007. [11]
It is stated in the directive that every industrial plant that pollutes the
environment significantly has to comply with the regulations of the local authority to be
competent. Plant operators have to apply environmental permit from the competent
authority of the member state in question. Operators falling under the IPPC directive
have to comply with the conditions set in permit. [1]
2.2.1. Main principles of IPPC directive
First of the four principles is integrated approach. It looks the whole environmental
performance in a wide perspective. Emissions to air, water and ground, energy
efficiency, noise, waste generation, use of raw materials, prevention of accidents and
restoration of the plant upon closure [11]. Integrated approach integrates the
environmental way of thinking to every part of the plants performance.
Use of best available technique (BAT) is the second principle. Emission limit
values set in environmental permits have to be based on best available technique.
European IPPC Bureau organizes the change of information between industry,
2. EU’S MEANS FOR POWER PLANTS IN PREVENTING POLLUTION 5
authorities, experts from EU countries and environmental organizations. [11.] It helps
the authorities to determining BAT while licensing permits. The results of the change
of information are published in BAT reference (BREF) documents. [13.] They are
available to all people in the European IPPC Bureau web-site.
Flexibility is one of the principles. Authorities have some room in determining
the permit conditions depending on the installation. They can take into account the
technical characteristic of the installation, its geographical location and local
environment condition. [11.] Installations differ from each other in many ways, such as
which fuels are used and size of the plant. The permit conditions might be considered as
tighter in locations where the nature is more vulnerable such as near settlement, near
conservation area or near groundwater area.
The fourth principle states that public is allowed to participate in the decision
making process. Public has access to permit applications, permits, results of the
monitoring releases and The European Pollutant Emission Register (EPER). EPER is a
public register that is meant to provide environmental information. It holds emission
reports reported by EU Member States. EPER has been European Pollutant Release and
Transfer Register (E-PRTR) since 2007. [11]
2.2.2. Applying environmental permit
Permit applications are delivered to competent authority of the member state.
Applications must contain for example following information:
General description of operations;
Plant location and of the conditions of the environment at the site;
Possible neighbors and concerned bodies;
Products, processes, production, equipment and plant structures;
Emissions, noise and trembling;
Information on the waste generated and procedures to reduce waste generation;
Estimated effects on the environment;
Fuels, chemicals, water usage and storage;
Water acquiring and sewerage;
Risks, accidents and fault situation;
Emission sources;
Operations on the reduction and purification of the emissions;
Information on the quality of the environment;
Monitoring;
Usage of the energy (energy efficiency);
Best available technique (BAT). [4; 42]
2. EU’S MEANS FOR POWER PLANTS IN PREVENTING POLLUTION 6
2.3. Large Combustion Plant (LCP) directive
The aim of the directive is to restrict emissions to air generated by large combustion
plants. Installations which rated thermal inputs are 50 MW or higher fall under the LCP
directive excluding waste derived fuels and waste incineration [3]. The new version of
the directive 2001/80/EC tightened the Community requirements from previous version
88/609/EEC (amended by 94/66/EC) from new installations because technical
development had enabled the change to use more competent equipments and techniques
to limit stack emissions.
2.3.1. Emission limit values
LCP directive sets air emission limit values for sulphur dioxide (SO2), nitrogen
dioxide (NO2) and dust in the flue gas. Those pollutants cause acidification and
eutrophication of the nature as they reach the ground. Such effects as well as ground-
level ozone are major concerns. By establishing LCP directive European Commission
wanted to take action against those undesirable effects on nature. Emission limit values
for SO2, NOx and dust vary in accordance with which types of fuels are used. Also the
rated thermal input (MW) of the plant is affecting on the emission limit values.
Emission limit values are presented in dry flue gas as mg/Nm3. NOx emissions are also
taken into account for gas turbines. In order that the measured emission values could be
compared with emission limit values, the oxygen concentration has to be same as well
as if the measurements are taken from wet flue gases the results have to be changed as
they were measured from dry flue gases. For liquid and gaseous fuels the oxygen
content by volume is 3%, for solid fuels 6% and for gas turbines it is 15%. The limit
values are different for new and existing plants. Plants licensed before 27 November
2002 or plants that are put into operation after 27 November 2003 are stated as new
plants. Existing plants are defined as those built before 1988 and those built from 1988
up to 2003. There are also other derogations that effects on the emission limit values.
For instance, emission limit value for sulphur dioxide depends on the plant’s operation
hours per year. Derogations are also possible for plants which location is far away from
settlement. [3]
2.3.2. Total annual emission
Since year 2004 the member states have had to report annually to the competent
authority the total annual emissions of sulphur dioxide, nitrogen oxides and dust. The
requirement concern all the combustion plants that has rated thermal input 50 MW or
over. Report has to also include information on the plants total annual input energy. It
shall be based on the net caloric value. Total annual emissions are classified based on
the fuel types which are biomass, other solid fuels, liquid fuels, natural gas and other
gases. [3]

2. EU’S MEANS FOR POWER PLANTS IN PREVENTING POLLUTION 7
2.3.3. Monitoring requirements
LCP directive requires continuous measurements of sulphur dioxide, nitrogen oxides
and dust from installations which rated thermal input is 100 MW or over. Continuous
measurements are not required for all installations even if the input is over 100 MW.
The directive states in which situations installation does not have to measure the
pollutants continuously. If the pollutants are not measured continuously periodic
measurements at least in six months interval are required. [3]
Operators have to also measure continuously process parameters such as oxygen
concentration, water vapor concentration as well as pressure and temperature of the flue
gas. If the sample gas is dried before it is analyzed there is no need to measure the water
vapor concentration continuously. [3]
The measurement methods have to be based on the CEN (European Committee
of Standardization) standards. If CEN standards are not available ISO standards,
international or national standards should be used. In order that the measurements
would be representative and reliable the methods used for sampling and for sample gas
analysis as well as the methods used for reference measurements to calibrate the
continuous emission monitoring system (CEMS) have to be based also on the CEN
standards. Operation of CEMS has to be checked by parallel measurement at least once
in year. Parallel measurements are done with reference methods. [3]
According to the LCP directive the value of 95 % confidence interval of single
measurement cannot exceed following percentages of the pollutants’ emission limit
values. The 95 % confidence interval means that a single measurement value remains
within the allowed maximum uncertainty limits with a probability of 95 %. Before the
average values are compared to the emission limit values the confidential interval is
subtracted. [3.]
Table 1. Exceedance limits.
Suphur dioxide 20%
Nitrogen oxide 20%
Dust 30%
The uncertainty of the emission measurements consist of systematic and
stochastic errors. Systematic error remains constant in standard conditions and it cannot
be eliminated by increasing measurements. For example, the systematic error of the flue
gas volume measurement device can be determined by calibration. It can be fixed with
correction factor. Stochastic errors are considered as unforeseeable changes in
measurements. For instance, reading and registry errors are stochastic errors in emission
measurements. Stochastic errors cannot be fixed by correction factors but it can be
minimized by adding more parallel measurements. Total uncertainty of the emission
2. EU’S MEANS FOR POWER PLANTS IN PREVENTING POLLUTION 8
measurement result consists of measurement devices and process condition and
measurement event. [19]
LCP directive has set high availability criteria for CEMS. If three hours or more
are discarded because of malfunction or maintenance of measurement system daily
value is discarded. If more than 10 days are discarded in a one year competent authority
has a responsibility to make sure that the operator does improvements to the emission
monitoring system in order to gain better quality of the continuous measurements. [3]
2.4. Waste incineration directive
Incineration of waste can cause undesirable effects on soil, air, groundwater and surface
water as well as on human health [5]. The directive 2000/76/EC was established to
control and prevent the pollution from incineration and co-incineration plants
concerning European Union member states. WI directive replaced two former
directives: directive on incineration of hazardous waste (94/67/EC) and directive on
household waste (89/369/EEC and 89/429/EEC). The directive consists of technical
requirements, applications of operational conditions and emission limit values for
specific pollutants into air and water. According to the WI directive operation of waste
incineration plants is based on the thermal treatment of waste and sometimes the heat,
generated in combustion is recovered. Co-incineration plant covers cement or lime
kilns, steel plants and power plants. The main objectives of those plants are energy
generation and production of material products. In co-incineration plants the waste is
used as a fuel or the waste is just meant to be disposed. [8.]
2.4.1. Emission limit values
WI directive sets emission limit values for incineration and co-incineration plants.
Emission limit values are set for pollutants into air: sulphur dioxide, nitrogen oxides
and dust. In addition to the ELVs for the main three pollutants the directive sets
emission limit values also for air pollutants carbon monoxide (CO), hydrogen chloride
(HCl), total organic carbon (TOC), hydrogen fluoride (HF), heavy metals and dioxins
and furans. WI directive sets also emission limit values for heavy metals and dioxins
and furans in waste water from flue gas purification devices. Emission limit values vary
according to the rated thermal input of the installation as well as according to the type of
the fuel used. Fuels are classified as solid fuels, liquid fuels and biomass. [2]
Emission limit values for co-incineration of waste are determined by
calculations and in relation to the flue gas volume. They are calculated with the formula
underneath and the definition of the parameters in the formula can be seen from the
table 2. All the emission limit values are presented in mg/Nm3. [2]
(1)
2. EU’S MEANS FOR POWER PLANTS IN PREVENTING POLLUTION 9
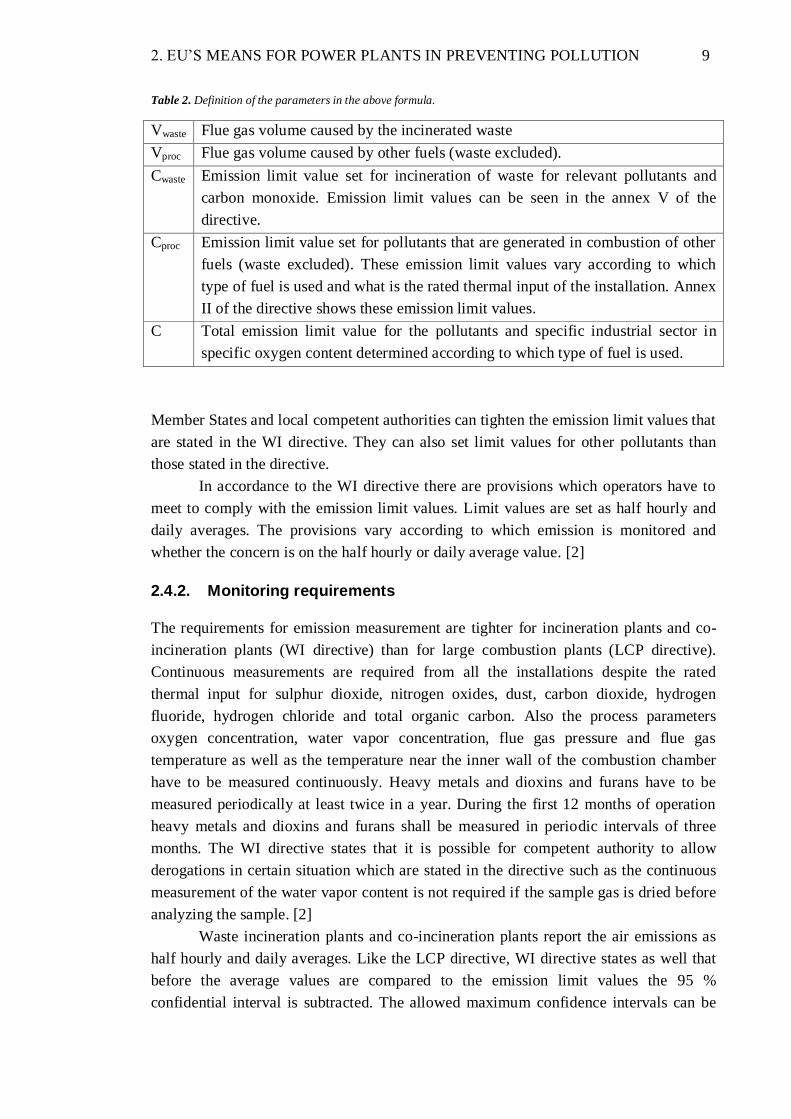
Table 2. Definition of the parameters in the above formula.
Vwaste Flue gas volume caused by the incinerated waste
Vproc Flue gas volume caused by other fuels (waste excluded).
Cwaste Emission limit value set for incineration of waste for relevant pollutants and
carbon monoxide. Emission limit values can be seen in the annex V of the
directive.
Cproc Emission limit value set for pollutants that are generated in combustion of other
fuels (waste excluded). These emission limit values vary according to which
type of fuel is used and what is the rated thermal input of the installation. Annex
II of the directive shows these emission limit values.
C Total emission limit value for the pollutants and specific industrial sector in
specific oxygen content determined according to which type of fuel is used.
Member States and local competent authorities can tighten the emission limit values that
are stated in the WI directive. They can also set limit values for other pollutants than
those stated in the directive.
In accordance to the WI directive there are provisions which operators have to
meet to comply with the emission limit values. Limit values are set as half hourly and
daily averages. The provisions vary according to which emission is monitored and
whether the concern is on the half hourly or daily average value. [2]
2.4.2. Monitoring requirements
The requirements for emission measurement are tighter for incineration plants and co-
incineration plants (WI directive) than for large combustion plants (LCP directive).
Continuous measurements are required from all the installations despite the rated
thermal input for sulphur dioxide, nitrogen oxides, dust, carbon dioxide, hydrogen
fluoride, hydrogen chloride and total organic carbon. Also the process parameters
oxygen concentration, water vapor concentration, flue gas pressure and flue gas
temperature as well as the temperature near the inner wall of the combustion chamber
have to be measured continuously. Heavy metals and dioxins and furans have to be
measured periodically at least twice in a year. During the first 12 months of operation
heavy metals and dioxins and furans shall be measured in periodic intervals of three
months. The WI directive states that it is possible for competent authority to allow
derogations in certain situation which are stated in the directive such as the continuous
measurement of the water vapor content is not required if the sample gas is dried before
analyzing the sample. [2]
Waste incineration plants and co-incineration plants report the air emissions as
half hourly and daily averages. Like the LCP directive, WI directive states as well that
before the average values are compared to the emission limit values the 95 %
confidential interval is subtracted. The allowed maximum confidence intervals can be
2. EU’S MEANS FOR POWER PLANTS IN PREVENTING POLLUTION 10
seen in the table 3. Measurement values during shut-downs and start-ups are excluded if
waste is not incinerated. The daily averages are defined from the validated half hourly
averages. [2]
Table 3. The value of 95 % confidence interval of single measurement cannot exceed following percentages of the
pollutants’ emission limit values.
Carbon dioxide 10%
Sulphur dioxide 20%
Nitrogen dioxide 20%
Dust 30%
Total organic carbon 30%
Hydrogen chloride 40%
Hydrogen fluoride 40%
2.5. Best Available Technique
European Commission established the European IPPC bureau. The main goal of the
IPPC bureau is to assist the implementation of the IPPC directive and organize the
exchange of information between experts from the EU Member States, industry and
environmental organizations [15]. Best available technique reference documents
(BREFs) are the outcome of the information exchange process [13]. The bureau has
published many BREF documents for different industrial sector. There is BREF
document for large combustion plants as well as for waste incineration plants. Also
BREF document for monitoring is available. Current LCP and WI BREFs are from
2006 and the monitoring BREF is from 2003. Monitoring and WI BREF documents are
under review which has started in 2010. [6.] During the review the BREFs are updated
to cover the newest and best available techniques available today. Competent authorities
are using these guidance documents in a situation where they are determining the
content of the environmental permits (IPPC permits) for specific installation [13].
BREF document for large combustion plant concerns installation which rated
thermal input is 50 MW or over. The document is used for industrial installations which
use fuels such as peat, coal, lignite, biomass, liquid and gaseous fuels. In addition to the
combustion process the document covers also fuel handling, flue gas treatment,
handling of combustion residues and raw water treatment. The document covers
information on the common techniques for energy generation and techniques which by
using the operators can reduce emissions from large combustion plants. Techniques for
efficient use of energy is also went through in the LCP BREF document. Energy
efficiency is nowadays seen as an indicator of the industrial installations’ effects on the
environment. High efficiency in energy use is economically worthwhile and it indicates
of the use of the environmentally right techniques in the processes. The techniques for
2. EU’S MEANS FOR POWER PLANTS IN PREVENTING POLLUTION 11
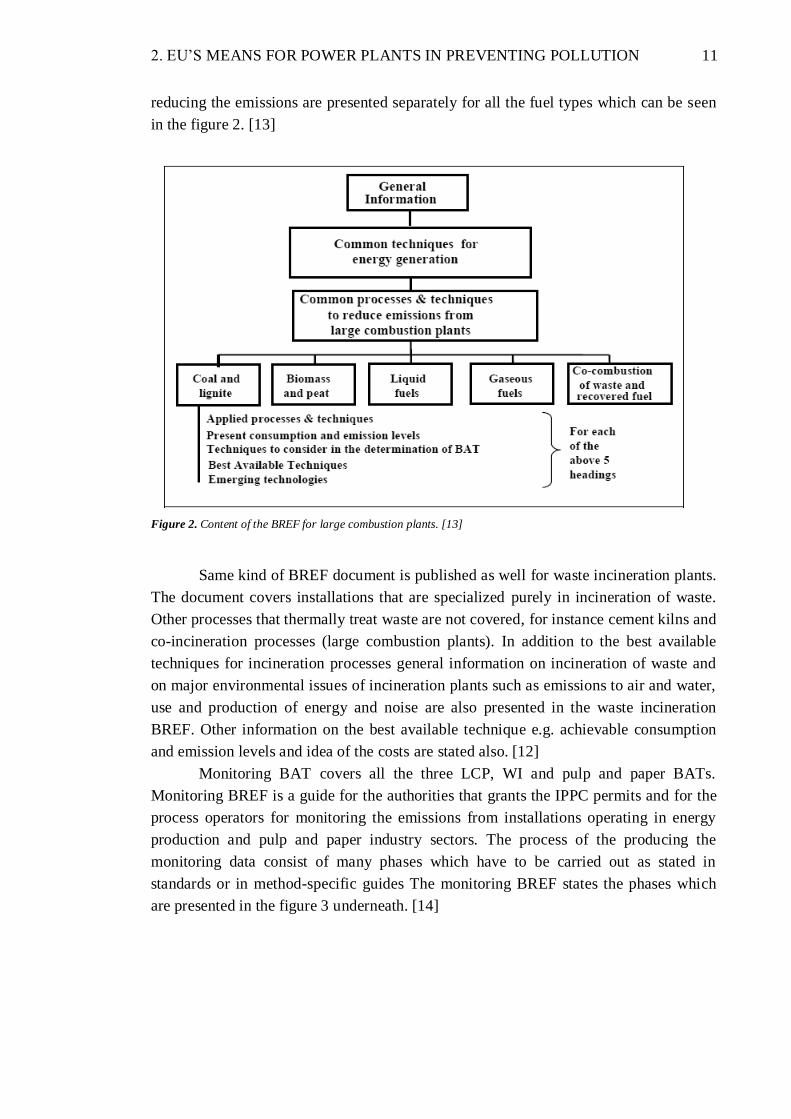
reducing the emissions are presented separately for all the fuel types which can be seen
in the figure 2. [13]
Figure 2. Content of the BREF for large combustion plants. [13]
Same kind of BREF document is published as well for waste incineration plants.
The document covers installations that are specialized purely in incineration of waste.
Other processes that thermally treat waste are not covered, for instance cement kilns and
co-incineration processes (large combustion plants). In addition to the best available
techniques for incineration processes general information on incineration of waste and
on major environmental issues of incineration plants such as emissions to air and water,
use and production of energy and noise are also presented in the waste incineration
BREF. Other information on the best available technique e.g. achievable consumption
and emission levels and idea of the costs are stated also. [12]
Monitoring BAT covers all the three LCP, WI and pulp and paper BATs.
Monitoring BREF is a guide for the authorities that grants the IPPC permits and for the
process operators for monitoring the emissions from installations operating in energy
production and pulp and paper industry sectors. The process of the producing the
monitoring data consist of many phases which have to be carried out as stated in
standards or in method-specific guides The monitoring BREF states the phases which
are presented in the figure 3 underneath. [14]

2. EU’S MEANS FOR POWER PLANTS IN PREVENTING POLLUTION 12
Figure 3. The process of emission monitoring according to monitoring BREF document. [14]
Reporting of the data
Data processing
Sample analysis
Sample treatment
Storage, transport and preservation of the sample
Sampling
Measurements
13
3. MEASUREMENT TECHNIQUES
From the performance of the measurement equipment is required a lot because of the
strict requirements of the European Commission. Also the emission limit values are
becoming lower which is in relation to the European Commission’s requirements.
Controlling and monitoring the quality of the performance of the measurement
equipment is important part of the emissions monitoring process in EU.
There are many different measurement techniques which can be used for the
measurement of the flue gas emissions from the power plant. This chapter focuses on
couple of commonly used techniques which are used to measure sulphur dioxide,
nitrogen oxides and dust which according to LCP directive are required to be measured
continuously.
Continuous Emission Monitoring Systems are divided into two main categories
that are following: sample taking measuring system and in-situ-technique. Sample
taking measuring systems are based on the processing of the sample. Measuring probe
takes the sample after which the heated sampling line transfers the sample to the cooler
and finally to the gas analyzer. [19.] In-situ-technique is quite different than the sample
taking technique. It doesn’t have any detached sample processing operation. It analyzes
the sample in the measuring device assembled in the stack [22].
3.1. Sulphur dioxide
SO2 (sulphur dioxide) forms when the sulphur of the fuel reacts with oxygen during the
combustion process. Almost all of the sulphur will oxidize to SO2. 1-2% of the sulphur
will oxidize to SO3 (sulphur trioxide) but the concentration of SO3 is very difficult to
verify by measuring. SO3 reacts with aqueous steam of the flue gas and forms little
drops of sulphuric acid, which produces corrosion. The temperature of the flue gas has
to be high enough because of the acid condensation point. Cold areas in the stack should
be avoided, because then the acid drops will condensate and produce corrosion on the
walls. [23]
It is important to take into account in sampling that the sulphur dioxide is very
water dissoluble. Also the sampling line, valves and connectors have to be heated so
that the corrosion can be avoided. [23]
SO2 concentration can be measured with many different analysis techniques:
FTIR, NDIR and UV-fluorescence techniques. In FTIR technique concentrations are
measured directly from the wet gases without cooling the samples. Technique is suitable
for minor concentration. [23.] FTIR is based on the absorption of the infrared light in
different wavelengths. Infrared light is led through the sample gas but first the

3. MEASUREMENT TECHNIQUES 14
modulator cuts the infrared light into different wavelengths. Detector in the other end
detects the infrared light that has passed through the sample gas. The absorption values
are changed into concentrations with Fourier transformation mathematics. [17.]
NDIR (Non Dispersive Infrared) technique is based also on the absorption of the
infrared light. It differs little bit of the FTIR technique: After the infrared light has
passed the sample gas optical filter will determine the wavelength which is absorbed by
the SO2 particles and passes it through. The wavelength area of the NDIR technique is
much narrower than in the FTIR technique. Narrow wavelength area prevents one
device to measure many gas components at the same time. [17]
In UV-fluorescence technique the measurement is done with dilution probes
and the temperature of the sample gas is kept above condensation point. Analysis is
done with sensitive UV-fluorescence technique. Figure 4 shows the structure of the
technique. SO2 molecule is set to certain wavelength with the help of UV-lamp during
the analysis. When the molecule returns to its normal energy state, it emits light in other
wavelength which is measured with photomultiplier tube. [23]
Figure 4. Principle of the UV-fluorescence method. [21]
3.2. Nitrogen oxides
Only a little part of the NOx is NO2. 95% of the NOx is NO. Techniques that the
analyzers use are based on the measurement of NO. NO2 is converted to NO in detached
converter. For the measurement of the NO there are analyzers that operate in infrared
and analyzers that operate in ultraviolet. NDIR and FTIR analyzers operate in infrared
and NDUV and UV-fluorescence analyzers operate in ultraviolet. The measurement
principles of these techniques are defined in the chapter 2.5.1. [23]
Chemiluminescence technique is more commonly used method in measuring
nitrogen oxides. It is based on the reaction between ozone and NO. Nitrogen monoxide
3. MEASUREMENT TECHNIQUES 15
contained by the sample gas reacts with the required amount of ozone produced by the
analyzer. This reaction emits scintillation of light. It is measured with a scintillation
indicator. Converter transforms NO2 to NO. NO2 is measured in turns with NO. Total
amount is presented in NOx and the other value that is presented is NO. Difference
between the measurement signals is the amount of NO2. The difference is very difficult
to identify because the concentration of NO2 is so low, only a few ppm (parts per
million). Ppm is defined as the volume of gaseous pollutant per 106. If the NO2
measurement is essential considering the NOx emissions, it is important to minimize the
sample loss in the sample cooler. Alternatively it is possible to use another drying
method, such as permeation drier or completely another in-situ technique. [23.]
Measurement devices which operation is based on the Chemiluminescence technique is
more expensive than the FTIR, NDIR and UV-fluorescence devices [17].
3.3. Dust
Operation of dust measuring devices is typically based on optics. Measurement device
has a light source that sends light across the stack and the light damps because of the
absorption and scattering. The ratio of the intensity between sent and received light is
called transmission. Extinction (optic density) can be calculated by using the law of
Labert- Beer. Equation between dust concentration and extinction is
(2)
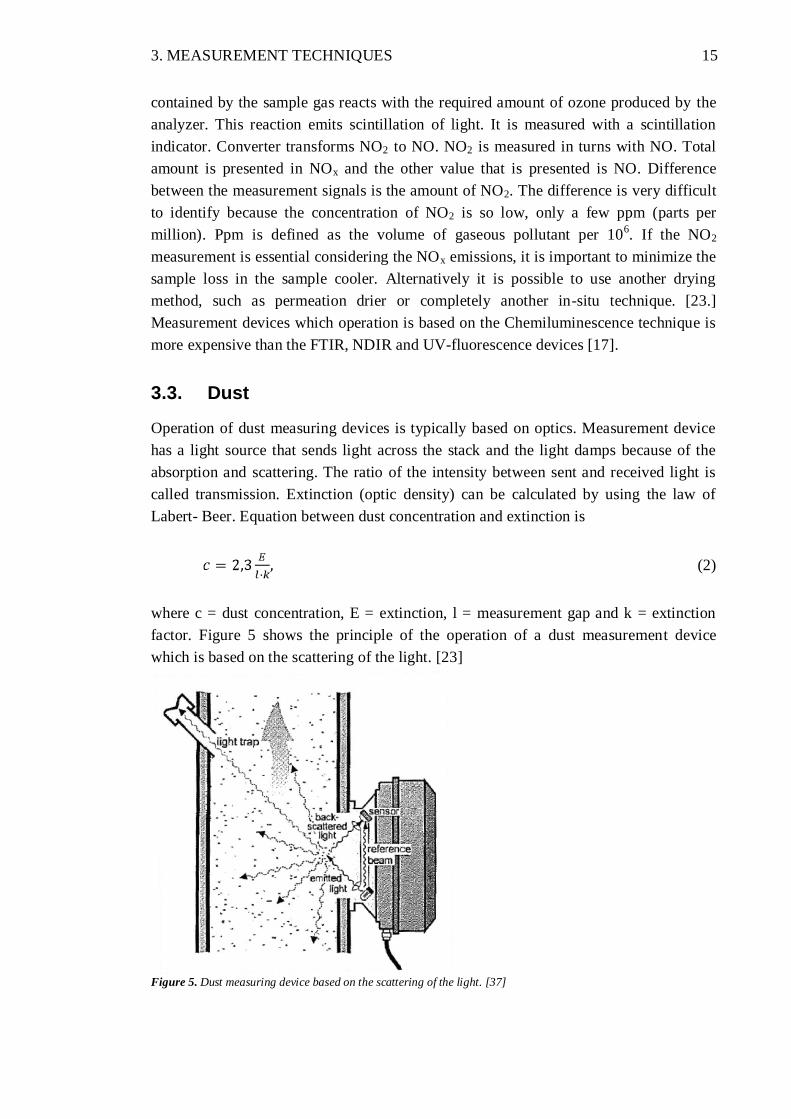
where c = dust concentration, E = extinction, l = measurement gap and k = extinction
factor. Figure 5 shows the principle of the operation of a dust measurement device
which is based on the scattering of the light. [23]
Figure 5. Dust measuring device based on the scattering of the light. [37]

3. MEASUREMENT TECHNIQUES 16
Optical dust measurement devices measure the concentration through or partly
through of the stack. Sender/receiver is assembled to the wall of the stack and the optics
is placed on the other side of the wall. Optics turns the light beam back to the receiver
and by doing so it increases the density of the measurement of minor concentrations.
The newest dust measurement devices have measurement probes assembled into the
stack. Operation of those devices is based on the scattering of the laser light in the
probe. The advantages of this method are: it is easy to assemble and the equipment is
not subject to the change of the alignment. [23.] The alignment does not change because
the device consists of only one measurement probe. Other devices that has sender on the
other side and receiver on the other side, are subject to change of alignment because the
sender or receiver can move and change the alignment. Figure 6 shows the principles of
the measurement device which performance is based on the scattering of laser light.
Figure 6. Dust measurement device based on scattering the laser light.[37]
Lately the principles of a triboelectricity have been applied to emission
measurement. Triboelectricity is used in the particle separators. Operation of such
emission measurement device is based on electric charge of the particles. Particles will
donate their electric charge by colliding with the sensor probe when they are passing by.
By measuring the electric charge it is possible to calculate the concentration of dust.
Advantages of triboelectricity are cheap acquisition cost and ease of assembly. Size of
the particles, electric charge, condensed water drops and velocity of running gas affects
to the measurement. [23]
There is also measurement technique that is based on gravimetry. Gravimetric
measurement technique is considered to be very accurate in dust measurements. The
technique is used to measure under 50 mg/m3 concentrations [33]. It is not usually used
as continuous measurement in power plants, because it is expensive. Test laboratories
3. MEASUREMENT TECHNIQUES 17
use gravimetric technique as reference measurement in calibrating the dust
measurement devices. The measurement procedure is simple. The dust particles are
separated into weighted filter. The filter is dried and weighted again after the sampling.
Dust concentration is determined from the weight increase of the filter in relation to the
volume of the sample gas. [33.]

4. COMPARISON OF CEMS AUTHORITY
REQUIREMENTS AT TARGET COUNTRIES IN EU
Main purpose of this thesis was to find special authority requirements of CEMS. The
focus was on the large combustion plants and waste incineration plants. It is obvious
that all the target countries are complying with the EU directives because they are in
EU. Still it is possible for the EU countries to set special requirements and that is the
reason why this thesis is been done. In the beginning of the thesis the target countries
were Spain, Portugal, France, UK, Estonia, Poland Slovakia and Czech but Portugal and
Slovakia dropped out due to the lack of information on them. Metso’s interest was to
gain knowledge about minimum requirements of CEMS in each target country. It is
major advantage to be aware of the national requirements when approaching the market
of a specific country. When all the needed information is available already in sales
phase, lot of money and time is saved during the project implementation.
The situation is not always that simple. Each target country consists of different
regional administrations concerning environmental matters. Each region has its own
environmental department. The problem is that each region can interpret the
environmental regulations in different way. Some requirements depend on what the
local environmental department thinks is best for the region. Approaching the market of
these kinds of countries it has to be done case by case. Of course some requirements are
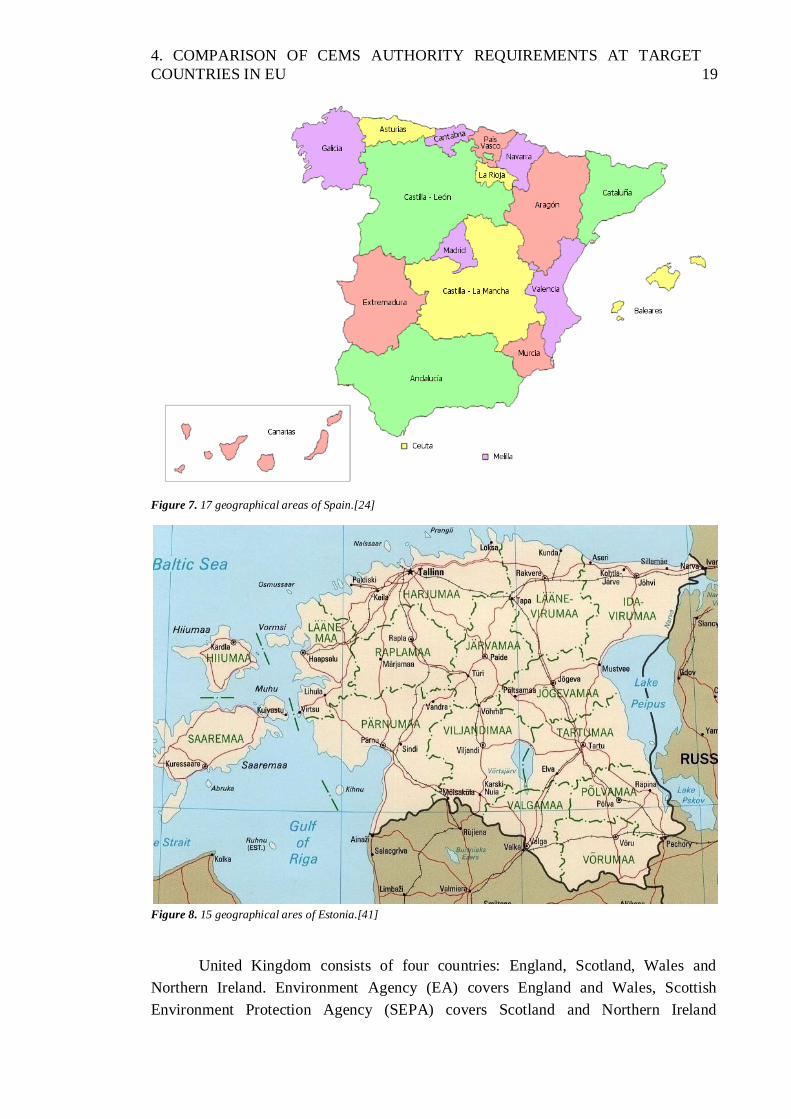
the same in each area. Good example is Spain. According to the questionnaire it has 17
different regional administration areas which interpret the environmental requirements
in different way. The regions are shown in the figure 7 below. The study clarified also
that Estonia is divided into 15 different counties. Each county has its own
Environmental Department which operates as competent authority of the specific
county. These Environmental Departments has power, inside the counties, to implement
national environmental, nature protection, forest and fisheries legislation. County
environmental department grants environmental permit to those plants that are located
inside the county’s borders. Figure 8 shows the 15 counties of Estonia.
4. COMPARISON OF CEMS AUTHORITY REQUIREMENTS AT TARGET
COUNTRIES IN EU 19
Figure 7. 17 geographical areas of Spain.[24]
Figure 8. 15 geographical ares of Estonia.[41]
United Kingdom consists of four countries: England, Scotland, Wales and
Northern Ireland. Environment Agency (EA) covers England and Wales, Scottish
Environment Protection Agency (SEPA) covers Scotland and Northern Ireland

4. COMPARISON OF CEMS AUTHORITY REQUIREMENTS AT TARGET
COUNTRIES IN EU 20
Environment Agency (NIEA) operates in Northern Ireland. All the three Agencies are
responsible for their own country’s pollution control.
The information gathered for the thesis is derived from internet, documents sent
by local representatives (e.g. local environment agencies and equipment vendors) or
questionnaire. Contact network was built and emission monitoring questionnaire was
sent throughout the target countries. Metso was aware that some of the emission
monitoring requirements are interpreted in a different way and wanted this thesis to
clarify those interpretations. Questions in the questionnaire were planned according to
Metso’s experience and in such way that the answers would clarify the known issues
concerning the interpretations. The questionnaire can be seen in appendix 1. Lot of the
information is interpretation or opinions of individual people such as consultants,
employees in local environment agency and employees in equipment vendor companies.
Some information is not available from official documents. Only way of getting
information from the existing methods is to interview people who have experience
concerning those matters. These opinions can’t be taken as official information.
The main interests of this thesis are: Requirements for the reporting solution,
possibility of integration of CEMS to process automation system, continuous
measurements, reported emissions and units, calculation of limit values for multi-fuel
boilers as well as national emission trading (other than CO2) and taxation.
4.1. Certification requirements for the system and
reporting solution
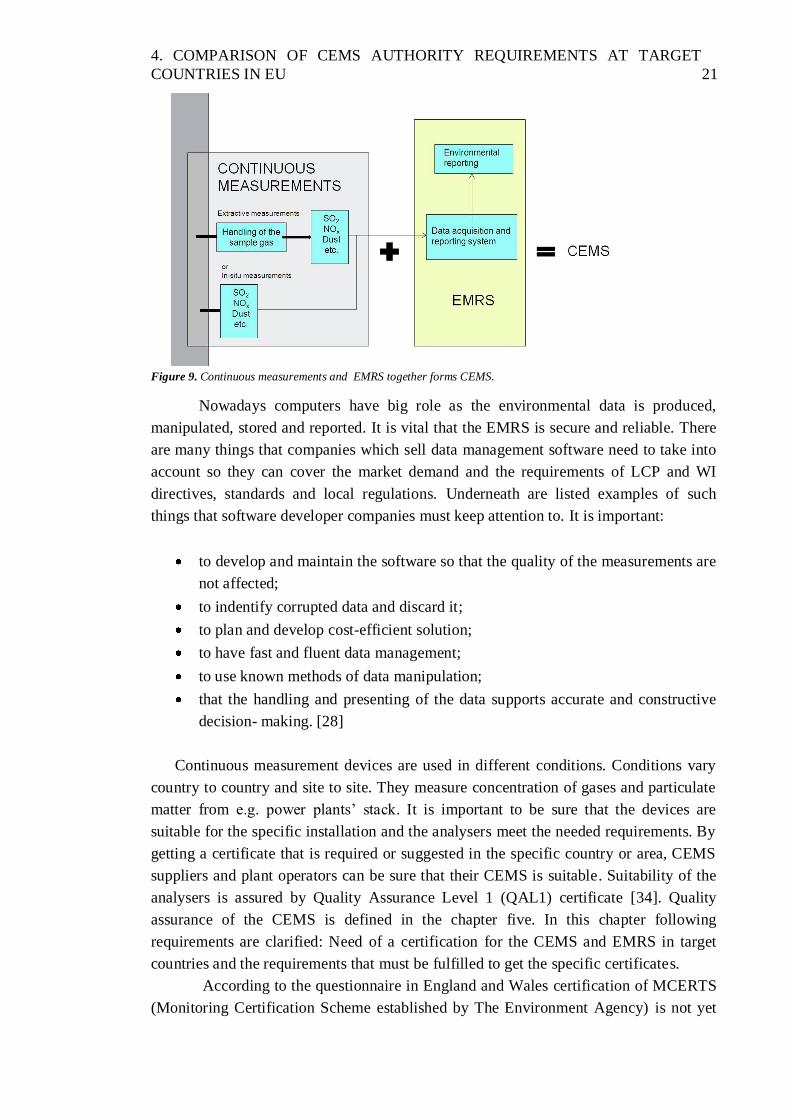
From certification point of view, CEMS consist of two parts: continuous measurements
devices and environmental data management solution as shown in figure 9. Metso
Automation has developed Emission Monitoring and Reporting Solution (EMRS) to
manage environmental data. Such data management application is usually mandatory,
required by the local authorities. With environmental data management application
operators shall be able to record required emission data. It takes the measurement data
from the gas analyser. Data is manipulated and calculated into needed form and
accumulated into reports. Then the emission reports are delivered to the local
authorities.
4. COMPARISON OF CEMS AUTHORITY REQUIREMENTS AT TARGET
COUNTRIES IN EU 21
Figure 9. Continuous measurements and EMRS together forms CEMS.
Nowadays computers have big role as the environmental data is produced,
manipulated, stored and reported. It is vital that the EMRS is secure and reliable. There
are many things that companies which sell data management software need to take into
account so they can cover the market demand and the requirements of LCP and WI
directives, standards and local regulations. Underneath are listed examples of such
things that software developer companies must keep attention to. It is important:
to develop and maintain the software so that the quality of the measurements are
not affected;
to indentify corrupted data and discard it;
to plan and develop cost-efficient solution;
to have fast and fluent data management;
to use known methods of data manipulation;
that the handling and presenting of the data supports accurate and constructive
decision- making. [28]
Continuous measurement devices are used in different conditions. Conditions vary
country to country and site to site. They measure concentration of gases and particulate
matter from e.g. power plants’ stack. It is important to be sure that the devices are
suitable for the specific installation and the analysers meet the needed requirements. By
getting a certificate that is required or suggested in the specific country or area, CEMS
suppliers and plant operators can be sure that their CEMS is suitable. Suitability of the
analysers is assured by Quality Assurance Level 1 (QAL1) certificate [34]. Quality
assurance of the CEMS is defined in the chapter five. In this chapter following
requirements are clarified: Need of a certification for the CEMS and EMRS in target
countries and the requirements that must be fulfilled to get the specific certificates.
According to the questionnaire in England and Wales certification of MCERTS
(Monitoring Certification Scheme established by The Environment Agency) is not yet
4. COMPARISON OF CEMS AUTHORITY REQUIREMENTS AT TARGET
COUNTRIES IN EU 22
mandatory for the reporting software, but is expected to be in 1-2 years. In the
upcoming version of Technical Guidance Note (TGN) M20 are expected to be a clause
about the data management software. TGN M20 is guidance document for quality
assurance of continuous emission monitoring systems published by Environment
Agency in United Kingdom. For the continuous measurement equipment the certificate
is mandatory. Certification of TÜV is also acceptable under some circumstances. This
thesis does not focus on the requirements of TÜV. MCERTS has higher Operator
Monitoring Assessment audit score because it has stricter requirements than TÜV. Such
audits help Environment Agency to assess self-monitoring operators. Operator
Monitoring Assessment audits are made to all operator sites in England and Wales. In
Scotland and Northern-Ireland MCERTS isn’t required for the data management
software, but for the analysers MCERTS is mandatory. Derogation can be made if the
equipment supplier can prove the suitability of their equipment in another way. This is
also possible in England and Wales, but MCERTS is usually required by the local
regulators. In a case of software in Scotland and Northern Ireland, authorities would like
that the MCERTS is used if it is available.
In Scotland they are using the EN 15259 which is a standard for the
requirements for measurement sections and sites and for the measurement objective,
plan and report. EN 15259 is considered as the “European version” of MCERTS. EN
15259 relates to the Technical Guidance Note M1 which MCERTS applies under
Environment Agency. Technical Guidance Note M1 is a guidance document for
sampling requirements for stack emission monitoring. There is also a sister document
for EN 15259 which is EN 15675. In 2009 and all the stack monitoring test laboratories
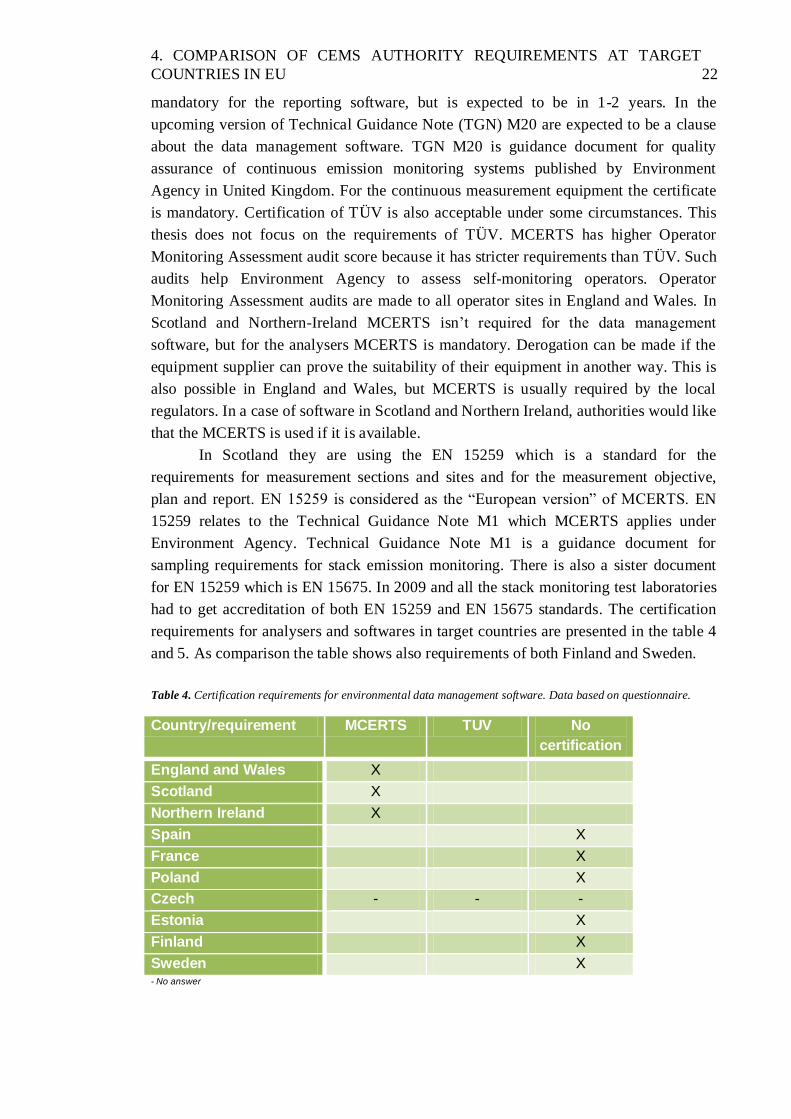
had to get accreditation of both EN 15259 and EN 15675 standards. The certification
requirements for analysers and softwares in target countries are presented in the table 4
and 5. As comparison the table shows also requirements of both Finland and Sweden.
Table 4. Certification requirements for environmental data management software. Data based on questionnaire.
Country/requirement MCERTS TUV No
certification
England and Wales X
Scotland X
Northern Ireland X
Spain X
France X
Poland X
Czech - - -
Estonia X
Finland X
Sweden X - No answer

4. COMPARISON OF CEMS AUTHORITY REQUIREMENTS AT TARGET
COUNTRIES IN EU 23
Table 5. Certification requirements for the automated measuring system (AMS). Data based on questionnaire.
Country/requirement MCERTS TUV No
certification
England and Wales X X*
Scotland X
Northern Ireland X
Spain X
France X* X*
Poland X**
Czech - - -
Estonia X
Finland X
Sweden X * Not mandatory, but preferred.
** No certification required, but operators usually demand certificate for the analyser.
- No answer
4.1.1. MCERTS for environmental data management software
MCERTS defines the requirements for the data management software in the document
Performance standards and Test procedures for the Environmental Data Management
Software. EMRS supplier has to comply it, if they want the MCERTS certificate for
their data management software. Sira Certification Service make to software evaluations
whether the suppliers application complies with the standards. Sira has been appointed
as MCERTS’s certification body by Environment Agency. [28.]
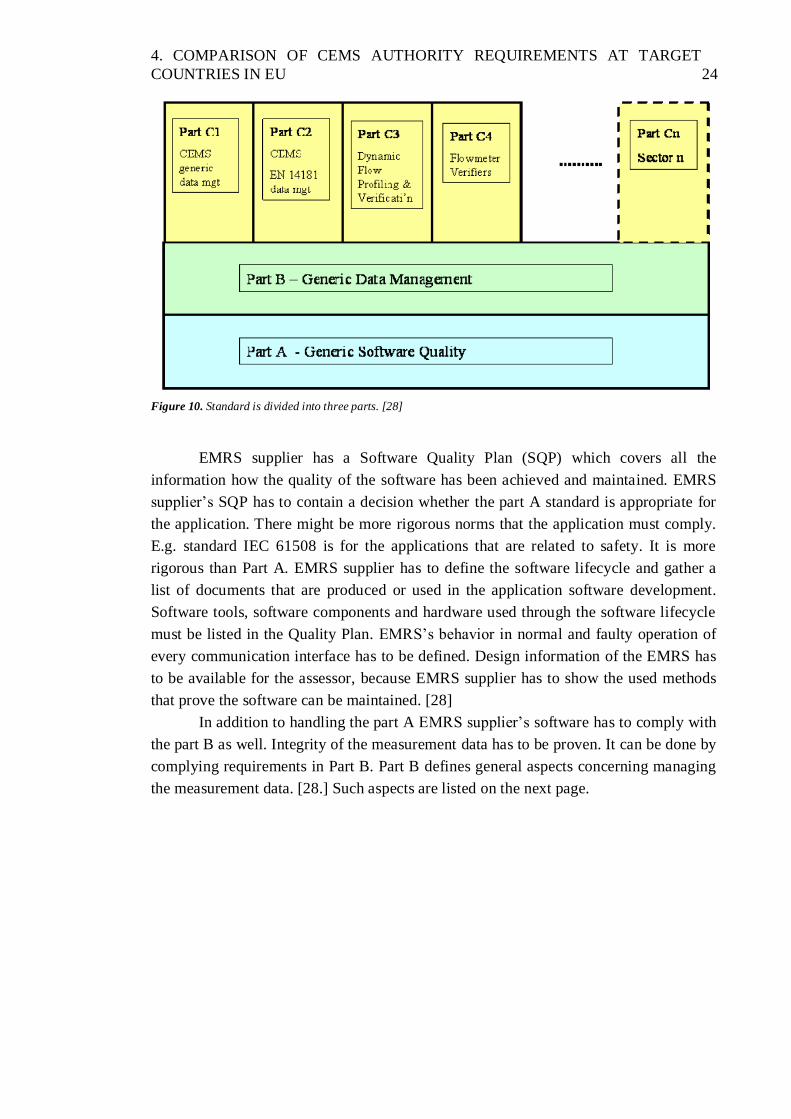
The standard is divided in three parts. Part A specifies the generic quality
requirements of the software. It also defines a standard for the lifecycle used to develop
and maintain the data management application. Performance requirements for the data
management application are stated in part B. Part C is divided in different sectors C1 -
Cn that defines specific sub-areas of the application. [28.] Figure 10 shows the
alignment of the three parts.
4. COMPARISON OF CEMS AUTHORITY REQUIREMENTS AT TARGET
COUNTRIES IN EU 24
Figure 10. Standard is divided into three parts. [28]
EMRS supplier has a Software Quality Plan (SQP) which covers all the
information how the quality of the software has been achieved and maintained. EMRS
supplier’s SQP has to contain a decision whether the part A standard is appropriate for
the application. There might be more rigorous norms that the application must comply.
E.g. standard IEC 61508 is for the applications that are related to safety. It is more
rigorous than Part A. EMRS supplier has to define the software lifecycle and gather a
list of documents that are produced or used in the application software development.
Software tools, software components and hardware used through the software lifecycle
must be listed in the Quality Plan. EMRS’s behavior in normal and faulty operation of
every communication interface has to be defined. Design information of the EMRS has
to be available for the assessor, because EMRS supplier has to show the used methods
that prove the software can be maintained. [28]
In addition to handling the part A EMRS supplier’s software has to comply with
the part B as well. Integrity of the measurement data has to be proven. It can be done by
complying requirements in Part B. Part B defines general aspects concerning managing
the measurement data. [28.] Such aspects are listed on the next page.

4. COMPARISON OF CEMS AUTHORITY REQUIREMENTS AT TARGET
COUNTRIES IN EU 25
Aspects defined in Part B:
Application documentation;
Mathematical specification and processing of measurement data;
Traceability and auditability of data;
The storage and security of data;
Interfaces to measurement devices;
Report generation and the display and presentation of data;
Certification of new installation;
Software installation and acceptance;
Commercial status of the supplier. [28]
The part C of the standard defines the MCERTS performance standards for
environmental data management software (EMRS). EMRS gather measurement data
from automated measuring system. MCERTS performance standards meet the LCP-
and WI directives as well as the IPPC directive. [28]
It has to be ensured that the software is able to gather, handle and report the data
in the formats that the WI Directive, LCP Directive and Environmental Permitting
Regulations, 2007 require. EMRS has to be able to produce needed (LCP- , WI- , IPPC
directives) averages (e.g. half hourly- , hourly- , weekly averages) of the emissions.
EMRS needs to gather data within the entire ranges used in the CEMS. [28]
EN 14181 must be complied by the environmental data management software
within specific requirements. EMRS must be capable to operate according to the EN
14181 QAL 3 requirements concerning zero and span checks. [28]
4.1.2. MCERTS for analysers/CEMS
Environment Agency has published document Performance standards and Test
procedures for Continuous Emission Monitoring System for certification of analysers. It
sets requirements the equipment must meet to gain MCERTS certificate. European and
international standards are used to monitor sites and accept laboratories. MCERTS
complies with EN 15267-3 standard which sets EN 14181 standard’s QAL 1 and QAL 3
requirements. EN 15267-3 standard states also the uncertainty requirements that
automated measuring system have to meet. [27.] Metso Power can be sure that if their
provided automated measuring system is MCERTS certified, equipment does comply
with all the required standards. MCERTS is recognized in UK and accepted
internationally
Testing laboratories that test the equipment must meet the requirements of
internationally recognized ISO/IEC 17025 standard, EN 15267-3 as well as MCERTS
requirements. The ISO/IEC 17025 standard sets requirements for carrying out tests,
calibrations and samplings. [27]
4. COMPARISON OF CEMS AUTHORITY REQUIREMENTS AT TARGET
COUNTRIES IN EU 26
These are the test made to assess the CEMS:
lack of fit;
response time;
detection limit (repeatability at zero);
repeatability at span;
influence of ambient conditions on zero and span readings;
performance and accuracy under field conditions;
cross-sensitivity to likely components of the stack gas other than the
determinant;
influence of sample pressure and sample temperature;
susceptibility to physical disturbances;
time-dependent zero and span drift under field conditions;
availability and maintenance interval under field conditions;
reproducibility under field conditions;
design features. [27]
The document holds requirements for three different particulate monitors. Plants
that fall under the LCP- or WI directive, uses Class 1 particulate monitors. Class 1
monitors are the monitors that Metso Power is delivering to their customers. Class 1
monitors have to comply EN 14181 standard. Class 2 monitors also measures emissions
in mg/m3. These monitors are said to be filter dust monitors. Class 2 monitors are been
used in PPC installations which have emission values less than 50% of the emission
limit values. Class 3 monitors are said to be filter leakage monitors. Class 1 particulate
monitors must be able to measure and record zero and span drifts as it is stated in EN
14181 QAL 3 requirements. Classes 2 and 3 don’t have to comply with QAL 3 in EN
14181. [27]
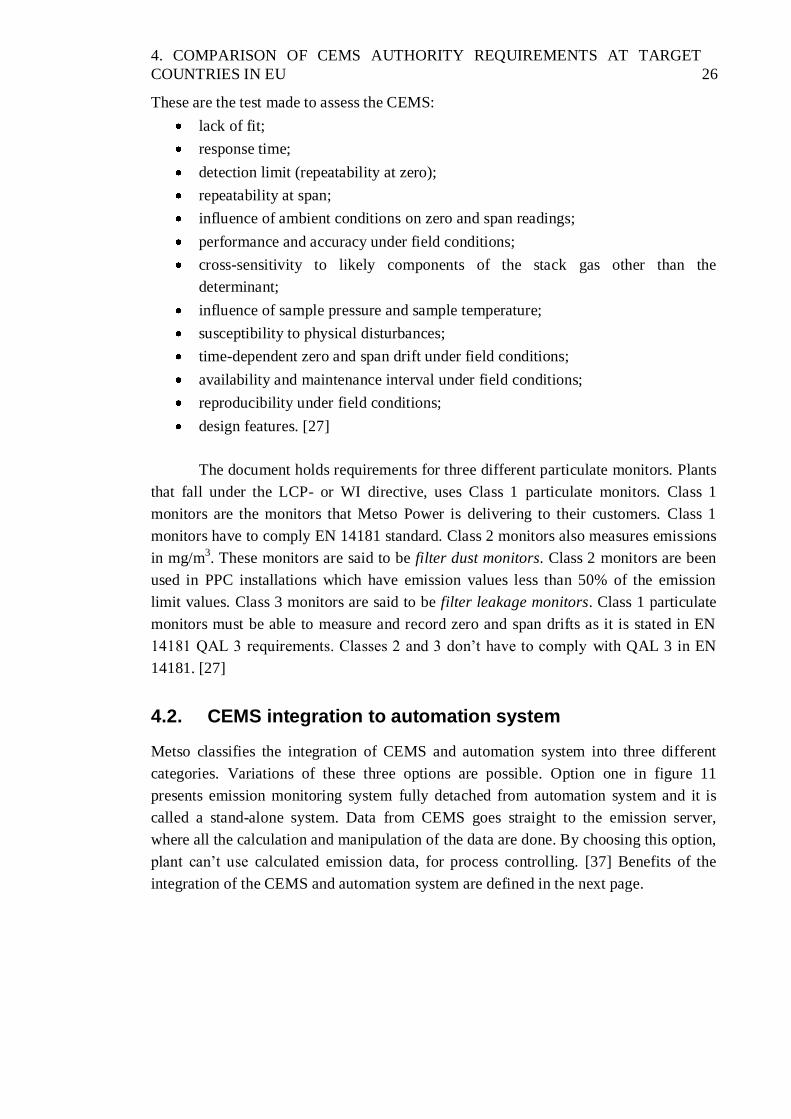
4.2. CEMS integration to automation system
Metso classifies the integration of CEMS and automation system into three different
categories. Variations of these three options are possible. Option one in figure 11
presents emission monitoring system fully detached from automation system and it is
called a stand-alone system. Data from CEMS goes straight to the emission server,
where all the calculation and manipulation of the data are done. By choosing this option,
plant can’t use calculated emission data, for process controlling. [37] Benefits of the
integration of the CEMS and automation system are defined in the next page.
4. COMPARISON OF CEMS AUTHORITY REQUIREMENTS AT TARGET
COUNTRIES IN EU 27
Figure 11. Detached emission monitoring system.
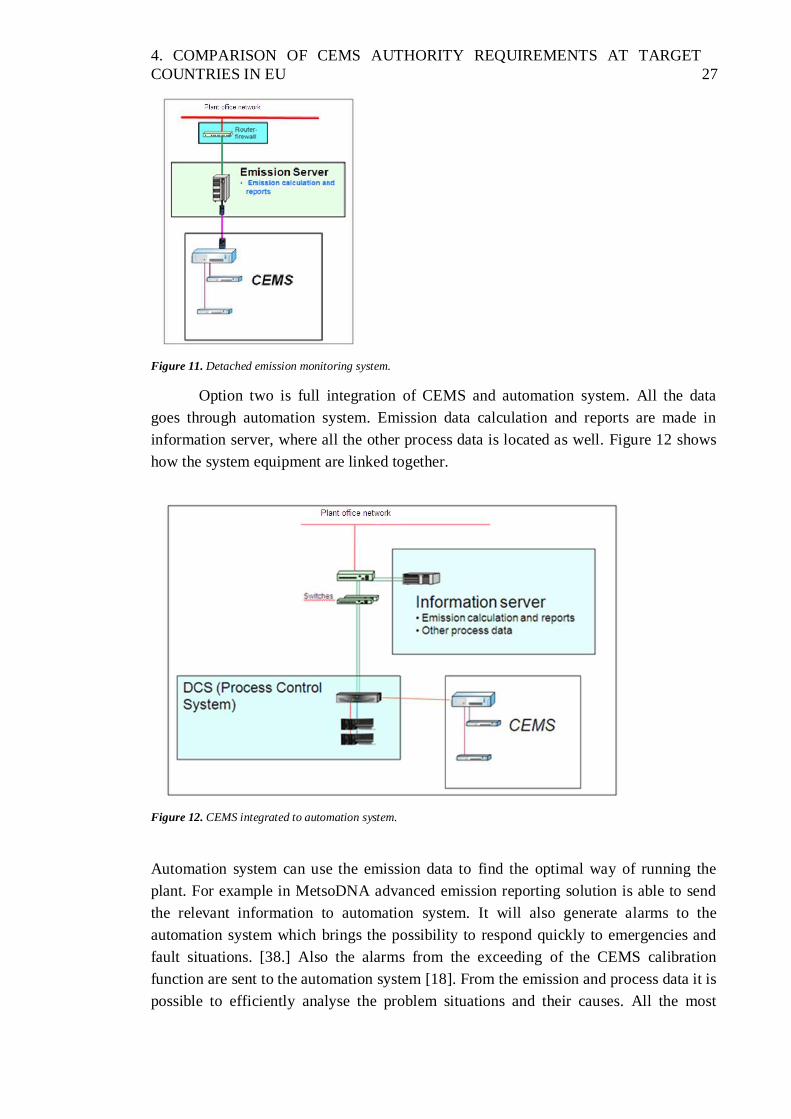
Option two is full integration of CEMS and automation system. All the data
goes through automation system. Emission data calculation and reports are made in
information server, where all the other process data is located as well. Figure 12 shows
how the system equipment are linked together.
Figure 12. CEMS integrated to automation system.
Automation system can use the emission data to find the optimal way of running the
plant. For example in MetsoDNA advanced emission reporting solution is able to send
the relevant information to automation system. It will also generate alarms to the
automation system which brings the possibility to respond quickly to emergencies and
fault situations. [38.] Also the alarms from the exceeding of the CEMS calibration
function are sent to the automation system [18]. From the emission and process data it is
possible to efficiently analyse the problem situations and their causes. All the most

4. COMPARISON OF CEMS AUTHORITY REQUIREMENTS AT TARGET
COUNTRIES IN EU 28
important monitored pollutants are shown on the screen of an operating station. Access
rights for the emission information are allocated to different user groups. For instance,
from MetsoDNA emission information is easily available for the different users via
browser based user interface. Users can monitor relevant information of the permit
conditions and emission limit values. [37.] Figure 13 presents example of daily report
and measurement equipment down time report of LCP-plant.
Figure 13. Daily and equipment down time reports.
In option three CEMS is semi-integrated to automation system. Data goes
through automation system, but there is still detached emission server which does all the
manipulating and calculations of the measurement data. All the reports as well are
produced in the server. The principle of the option three is shown in the figure 14.
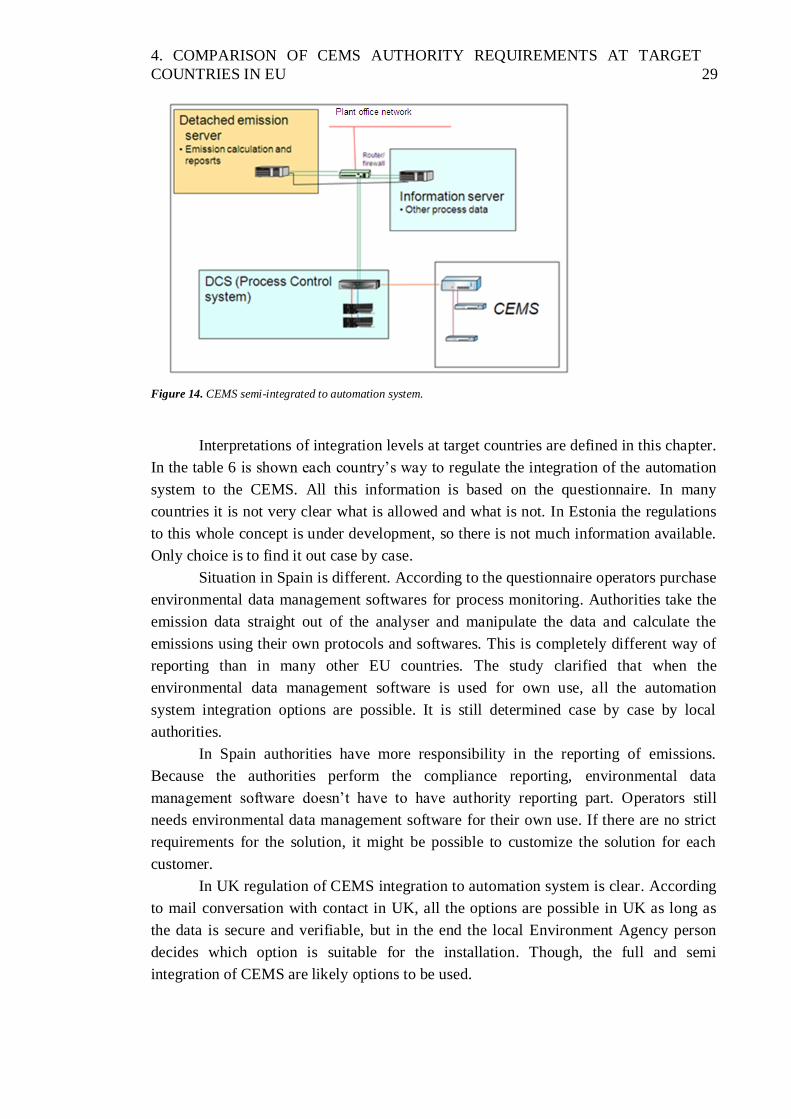
4. COMPARISON OF CEMS AUTHORITY REQUIREMENTS AT TARGET
COUNTRIES IN EU 29
Figure 14. CEMS semi-integrated to automation system.
Interpretations of integration levels at target countries are defined in this chapter.
In the table 6 is shown each country’s way to regulate the integration of the automation
system to the CEMS. All this information is based on the questionnaire. In many
countries it is not very clear what is allowed and what is not. In Estonia the regulations
to this whole concept is under development, so there is not much information available.
Only choice is to find it out case by case.
Situation in Spain is different. According to the questionnaire operators purchase
environmental data management softwares for process monitoring. Authorities take the
emission data straight out of the analyser and manipulate the data and calculate the
emissions using their own protocols and softwares. This is completely different way of
reporting than in many other EU countries. The study clarified that when the
environmental data management software is used for own use, all the automation
system integration options are possible. It is still determined case by case by local
authorities.
In Spain authorities have more responsibility in the reporting of emissions.
Because the authorities perform the compliance reporting, environmental data
management software doesn’t have to have authority reporting part. Operators still
needs environmental data management software for their own use. If there are no strict
requirements for the solution, it might be possible to customize the solution for each
customer.
In UK regulation of CEMS integration to automation system is clear. According
to mail conversation with contact in UK, all the options are possible in UK as long as
the data is secure and verifiable, but in the end the local Environment Agency person
decides which option is suitable for the installation. Though, the full and semi
integration of CEMS are likely options to be used.
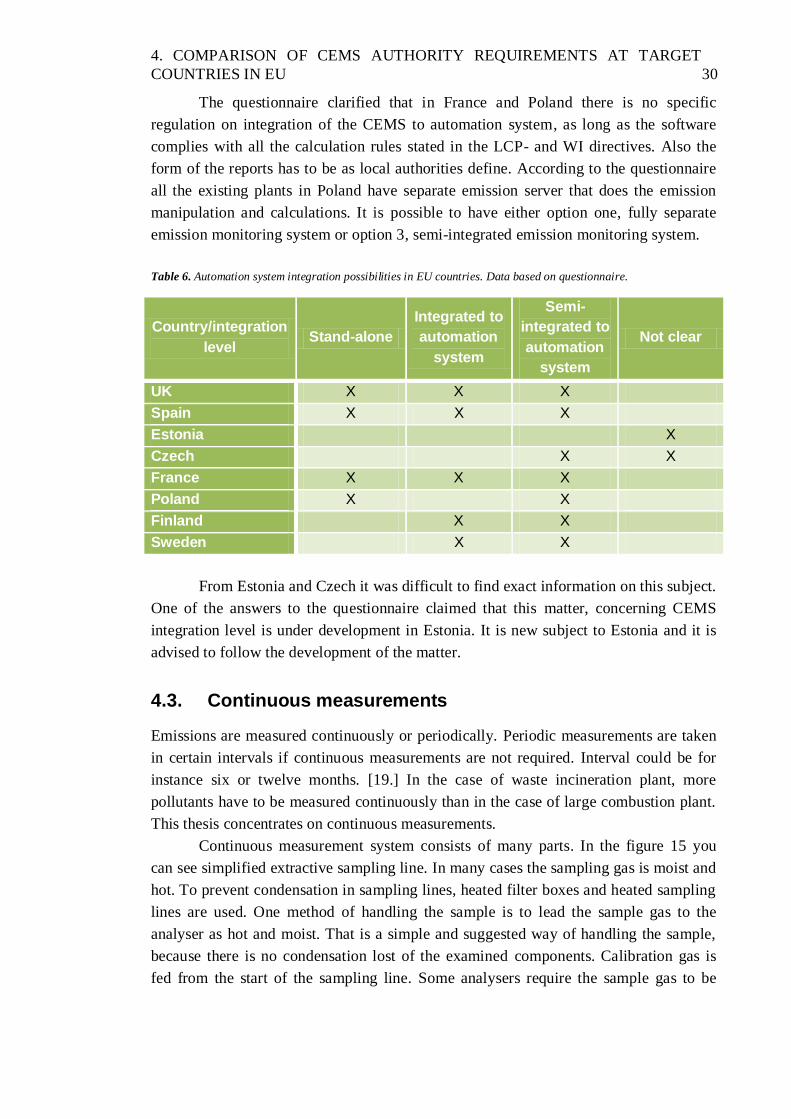
4. COMPARISON OF CEMS AUTHORITY REQUIREMENTS AT TARGET
COUNTRIES IN EU 30
The questionnaire clarified that in France and Poland there is no specific
regulation on integration of the CEMS to automation system, as long as the software
complies with all the calculation rules stated in the LCP- and WI directives. Also the
form of the reports has to be as local authorities define. According to the questionnaire
all the existing plants in Poland have separate emission server that does the emission
manipulation and calculations. It is possible to have either option one, fully separate
emission monitoring system or option 3, semi-integrated emission monitoring system.
Table 6. Automation system integration possibilities in EU countries. Data based on questionnaire.
Country/integration
level Stand-alone
Integrated to
automation
system
Semi-
integrated to
automation
system
Not clear
UK X X X
Spain X X X
Estonia X
Czech X X
France X X X
Poland X X
Finland X X
Sweden X X
From Estonia and Czech it was difficult to find exact information on this subject.
One of the answers to the questionnaire claimed that this matter, concerning CEMS
integration level is under development in Estonia. It is new subject to Estonia and it is
advised to follow the development of the matter.
4.3. Continuous measurements
Emissions are measured continuously or periodically. Periodic measurements are taken
in certain intervals if continuous measurements are not required. Interval could be for
instance six or twelve months. [19.] In the case of waste incineration plant, more
pollutants have to be measured continuously than in the case of large combustion plant.
This thesis concentrates on continuous measurements.
Continuous measurement system consists of many parts. In the figure 15 you
can see simplified extractive sampling line. In many cases the sampling gas is moist and
hot. To prevent condensation in sampling lines, heated filter boxes and heated sampling
lines are used. One method of handling the sample is to lead the sample gas to the
analyser as hot and moist. That is a simple and suggested way of handling the sample,
because there is no condensation lost of the examined components. Calibration gas is
fed from the start of the sampling line. Some analysers require the sample gas to be
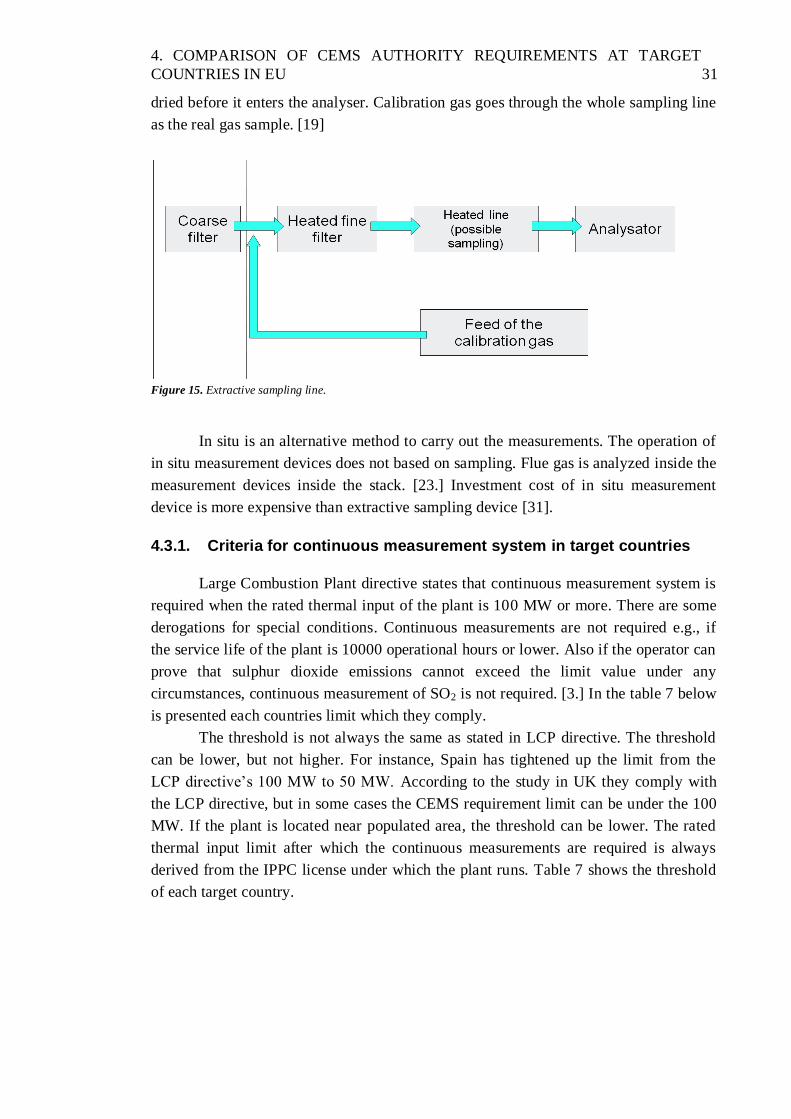
4. COMPARISON OF CEMS AUTHORITY REQUIREMENTS AT TARGET
COUNTRIES IN EU 31
dried before it enters the analyser. Calibration gas goes through the whole sampling line
as the real gas sample. [19]
Figure 15. Extractive sampling line.
In situ is an alternative method to carry out the measurements. The operation of
in situ measurement devices does not based on sampling. Flue gas is analyzed inside the
measurement devices inside the stack. [23.] Investment cost of in situ measurement
device is more expensive than extractive sampling device [31].
4.3.1. Criteria for continuous measurement system in target countries
Large Combustion Plant directive states that continuous measurement system is
required when the rated thermal input of the plant is 100 MW or more. There are some
derogations for special conditions. Continuous measurements are not required e.g., if
the service life of the plant is 10000 operational hours or lower. Also if the operator can
prove that sulphur dioxide emissions cannot exceed the limit value under any
circumstances, continuous measurement of SO2 is not required. [3.] In the table 7 below
is presented each countries limit which they comply.
The threshold is not always the same as stated in LCP directive. The threshold
can be lower, but not higher. For instance, Spain has tightened up the limit from the
LCP directive’s 100 MW to 50 MW. According to the study in UK they comply with
the LCP directive, but in some cases the CEMS requirement limit can be under the 100
MW. If the plant is located near populated area, the threshold can be lower. The rated
thermal input limit after which the continuous measurements are required is always
derived from the IPPC license under which the plant runs. Table 7 shows the threshold
of each target country.
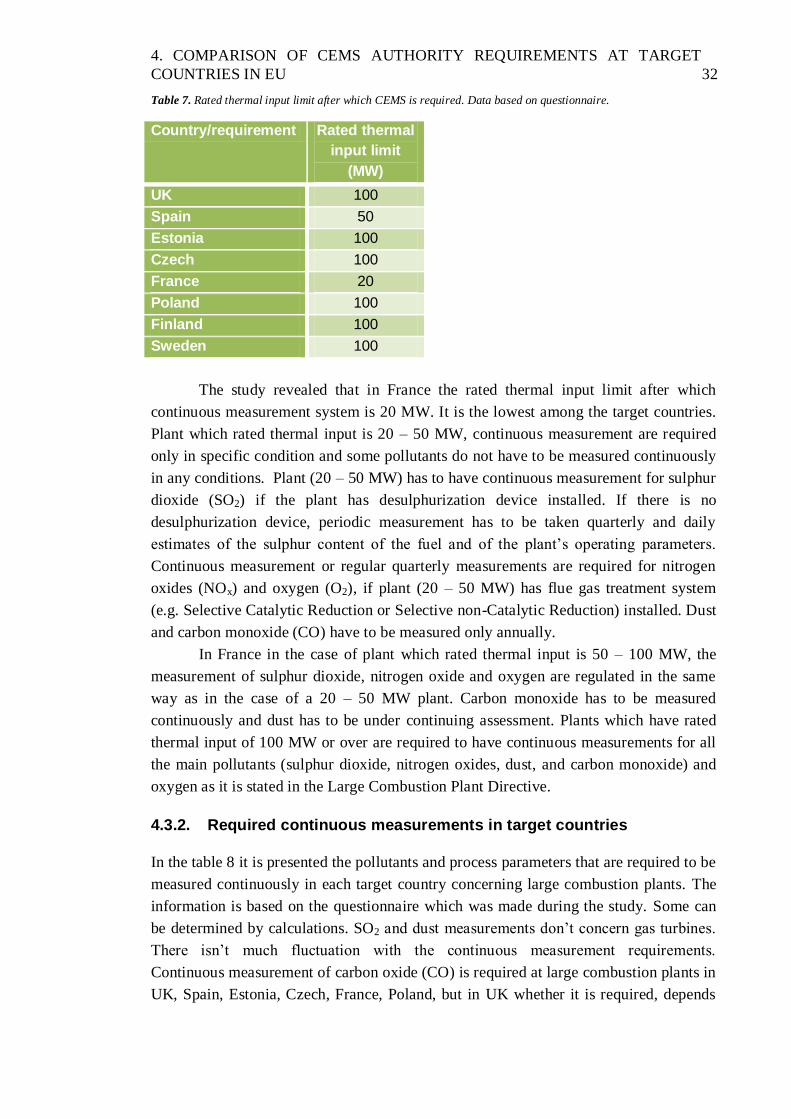
4. COMPARISON OF CEMS AUTHORITY REQUIREMENTS AT TARGET
COUNTRIES IN EU 32
Table 7. Rated thermal input limit after which CEMS is required. Data based on questionnaire.
Country/requirement Rated thermal
input limit
(MW)
UK 100
Spain 50
Estonia 100
Czech 100
France 20
Poland 100
Finland 100
Sweden 100
The study revealed that in France the rated thermal input limit after which
continuous measurement system is 20 MW. It is the lowest among the target countries.
Plant which rated thermal input is 20 – 50 MW, continuous measurement are required
only in specific condition and some pollutants do not have to be measured continuously
in any conditions. Plant (20 – 50 MW) has to have continuous measurement for sulphur
dioxide (SO2) if the plant has desulphurization device installed. If there is no
desulphurization device, periodic measurement has to be taken quarterly and daily
estimates of the sulphur content of the fuel and of the plant’s operating parameters.
Continuous measurement or regular quarterly measurements are required for nitrogen
oxides (NOx) and oxygen (O2), if plant (20 – 50 MW) has flue gas treatment system
(e.g. Selective Catalytic Reduction or Selective non-Catalytic Reduction) installed. Dust
and carbon monoxide (CO) have to be measured only annually.
In France in the case of plant which rated thermal input is 50 – 100 MW, the
measurement of sulphur dioxide, nitrogen oxide and oxygen are regulated in the same
way as in the case of a 20 – 50 MW plant. Carbon monoxide has to be measured
continuously and dust has to be under continuing assessment. Plants which have rated
thermal input of 100 MW or over are required to have continuous measurements for all
the main pollutants (sulphur dioxide, nitrogen oxides, dust, and carbon monoxide) and
oxygen as it is stated in the Large Combustion Plant Directive.
4.3.2. Required continuous measurements in target countries
In the table 8 it is presented the pollutants and process parameters that are required to be
measured continuously in each target country concerning large combustion plants. The
information is based on the questionnaire which was made during the study. Some can
be determined by calculations. SO2 and dust measurements don’t concern gas turbines.
There isn’t much fluctuation with the continuous measurement requirements.
Continuous measurement of carbon oxide (CO) is required at large combustion plants in
UK, Spain, Estonia, Czech, France, Poland, but in UK whether it is required, depends

4. COMPARISON OF CEMS AUTHORITY REQUIREMENTS AT TARGET
COUNTRIES IN EU 33
on what is stated in the environmental permit. LCP directive states that SO2, NOx and
dust have to be measured continuously as well as all the peripherals, but no CO.
Table 8. Parameters that are required to be measured continuously in Large Combustion Plants (LCP). Data based
on questionnaire.
Measured parameters UK Spain Estonia Czech France Poland Finland Sweden
NOx X X X X X X X X
SO2 X X X X X X X X
Dust X X X X X X X X
CO X X X X X X X X
TOC
HCl
HF
N2O X
NH2
NH3 X
CO2 X
Flue gas flow (wet) X X X X X X
Flue gas flow (dry) X X X X
Flue gas pressure X X X X X X X
Flue gas temperature X X X X X X X X
O2 concentration X X X X X X X X
H2O concentration X X X X X X X
It seems that it is quite common to measure CO continuously, though it is not
required by the European Union. By measuring emissions of carbon monoxide,
operators gain important knowledge of combustion process. It is then possible to gain
efficient combustion, reduction of pollutant emissions and safe operation. With the
knowledge of CO concentration in the flue gas, it is possible to fine tune the air to fuel
ratio so that the efficiency of the combustion process is optimal. Possible unburned
combustibles are detected as well from the concentration of carbon monoxide. That is
important because too high amount of unburned combustibles causes unsafe situation in
the process. In combustion process there is always excess air. If the amount of the
excess air is too low, generation of unburned combustibles (e.g. carbon monoxide, coal)
in the flue gas will increase. That is called “fuel rich” situation. It is not safe because the
unburned fuel might fire up afterwards. Another situation is called “air rich“ situation
which means there is too much excess air. That is not desirable, because efficiency of
the combustion suffers and concentration of nitrogen increases in the flue gas, because
air comprises lot of nitrogen. Though, in air rich situation the combustion is complete
and does not cause any dangerous situations. [44.]
In the case of a large combustion plant continuous measurement of N2O is
required in UK, but not always. According to the questionnaire, in other countries it is
not required in any conditions. The reason why it is sometimes required in UK is
explained underneath the table 9 where the continuous measurement requirements of
waste incineration plant are explained. Czech is the only target country that
continuously measure carbon dioxide (CO2), but not all the plants have continuous
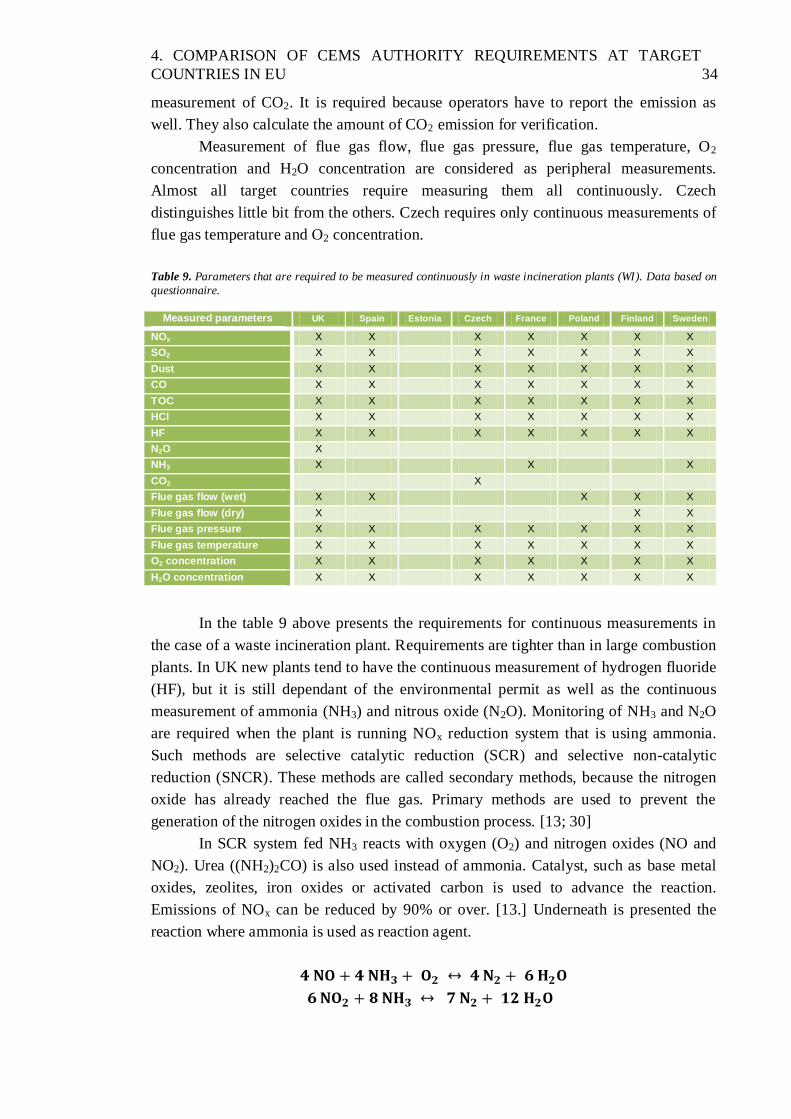
4. COMPARISON OF CEMS AUTHORITY REQUIREMENTS AT TARGET
COUNTRIES IN EU 34
measurement of CO2. It is required because operators have to report the emission as
well. They also calculate the amount of CO2 emission for verification.
Measurement of flue gas flow, flue gas pressure, flue gas temperature, O2
concentration and H2O concentration are considered as peripheral measurements.
Almost all target countries require measuring them all continuously. Czech
distinguishes little bit from the others. Czech requires only continuous measurements of
flue gas temperature and O2 concentration.
Table 9. Parameters that are required to be measured continuously in waste incineration plants (WI). Data based on
questionnaire.
Measured parameters UK Spain Estonia Czech France Poland Finland Sweden
NOx X X X X X X X
SO2 X X X X X X X
Dust X X X X X X X
CO X X X X X X X
TOC X X X X X X X
HCl X X X X X X X
HF X X X X X X X
N2O X
NH3 X X X
CO2 X
Flue gas flow (wet) X X X X X
Flue gas flow (dry) X X X
Flue gas pressure X X X X X X X
Flue gas temperature X X X X X X X
O2 concentration X X X X X X X
H2O concentration X X X X X X X
In the table 9 above presents the requirements for continuous measurements in
the case of a waste incineration plant. Requirements are tighter than in large combustion
plants. In UK new plants tend to have the continuous measurement of hydrogen fluoride
(HF), but it is still dependant of the environmental permit as well as the continuous
measurement of ammonia (NH3) and nitrous oxide (N2O). Monitoring of NH3 and N2O
are required when the plant is running NOx reduction system that is using ammonia.
Such methods are selective catalytic reduction (SCR) and selective non-catalytic
reduction (SNCR). These methods are called secondary methods, because the nitrogen
oxide has already reached the flue gas. Primary methods are used to prevent the
generation of the nitrogen oxides in the combustion process. [13; 30]
In SCR system fed NH3 reacts with oxygen (O2) and nitrogen oxides (NO and
NO2). Urea ((NH2)2CO) is also used instead of ammonia. Catalyst, such as base metal
oxides, zeolites, iron oxides or activated carbon is used to advance the reaction.
Emissions of NOx can be reduced by 90% or over. [13.] Underneath is presented the
reaction where ammonia is used as reaction agent.

4. COMPARISON OF CEMS AUTHORITY REQUIREMENTS AT TARGET
COUNTRIES IN EU 35
As the NH3/NOx ratio increases, the NH3-slip will also increase. NH3 slip is the amount
of unused ammonia. With higher NH3/NOx ratio better removal of NOx is achieved, but
then it is possible that the threshold set for the NH3 slip is exceeded. This kind of
situation can be avoided by continuous measurement of ammonia in the flue gas. It is
important to maintain the NH3 slip as low as possible because the ammonia can react
with sulphur trioxide (SO3) and cause corrosion and fouling of the heating surfaces.
[13.]
SNCR method differ little bit from the SCR method. SNCR does not use
catalyst. With SNCR is possible to achieve 30–50% reduction of the NOx emissions in
the flue gas. It can be used together with the primary reduction methods. It very
important to monitor the temperature of the flue gas, because the reagent (ammonia,
urea, caustic ammonia) used is decided according to the temperature of the flue gas. If
the temperature is too low, the conversion rate decreases and the NH3 slip will increase.
Secondly if the temperature is too high, ammonia will oxidize and more NOx is
produced. [13.] Underneath is presented the equations of the wanted reaction and un-
wanted reaction.
Wanted reaction:
Unwanted reaction:
Primary methods are based on the control of the combustion conditions. It is
advised to use primary methods before secondary methods. If burners are used in the
combustion, the LowNOx-burners can be used to prevent the generation of the NOx
emissions. LowNOx-burners phase the feed of the combustion air to the combustion
zone. In a situation of fluidized bed combustion, NOx emissions can be reduced with
well controlled partitioning of the primary- , secondary- and possible tertiary air and
recycling of the flue gas back to the combustion zone. [13.] With primary reduction
methods it is possible to attain 10-50% reduction of the NOx emissions depending on
the separation process and combustion method as well as fuel [31].
4.3.3. Supplying process of CEMS
Metso Power is supplying continuous emission monitoring systems alongside with
boilers, when it is part of the contract. Plant owner might require that the CEMS has to
be supplied from a specific manufacturer. The CEMS supplying process begins as
Metso Power receives the boiler enquiry and the material and the type of boiler is
decided. Also reporting solution can be part of the contract. The CEMS and reporting
solution manufacturers are preliminary defined according to process and technical

4. COMPARISON OF CEMS AUTHORITY REQUIREMENTS AT TARGET
COUNTRIES IN EU 36
requirement. The final selection will be made based on the best price-quality ratio.
Information of the previous CEMS projects is sometimes used for helping the decision
making. After the appropriate vendor has been chosen the next step is to start
engineering. The needed assemblies and location of the analysers are defined as well.
[39.] Also possible double measurements of the pollutants and double analysers have to
be taken into account at this point. At the moment, in UK this kind of double CEMS is
required. [38.]
The delivery cover information on the following requirements: Training of the
end users, definition of the guaranty measurements, maintenance of the equipment and
delivery time as well as the definitions of the assembly and commissioning. The quality
of the CEMS deliver is ensured together with the CEMS supplier and needed final
reports are given to customer before taking over the delivery. Customer has
responsibility to maintain and test the CEMS after the takeover. [38; 39]
4.4. Reported emissions and units
Large Combustion Plant (LCP) directive requires monitoring and reporting of sulphur
dioxide (SO2), nitrogen oxides (NOx) and dust. Waste Incineration directive requires
also reporting of carbon monoxide (CO), total organic carbon (TOC), hydrogen chloride
(HCl) and hydrogen fluoride (HF) in addition to previous LCP requirements. All the
installations in Europe falling under the LCP directive or WI directive has to report
these pollutants to the local authorities. These directives set the foundation of the
reporting in EU area. [2; 3] In addition to the requirements of the directives there are the
local environmental permits that usually sets more pollutants that has to be reported to
local authorities. In the case of a LCP plant, CO is one of the most common
amendments to the reporting scheme. Below the tables 10 and 11 shows the emissions
that are required to be reported in each country, including units they are reported in.
Table 10 covers LCP plants and table 11 covers WI plants.
4.4.1. Large combustion plants
Of the table 10 it is possible to see some variety between the target countries, but some
requirements seems to be quite standard. For instance UK and Spain has almost same
requirements between themselves, but comparing to other countries you begin to notice
more variation. According to the questionnaire only UK reports N2O to the authorities,
but it is not always required. Reporting of the N2O in UK is done in the same format as
all the other pollutants (SO2, NOx, Dust). LCP directive is partly applied: LCP plants in
UK report nitrous oxides as hourly averages and 48 hourly averages rather than daily
averages. LCP directive states that the main pollutants sulphur dioxide, nitrogen oxides
and dust are reported as hourly and daily averages.

4. COMPARISON OF CEMS AUTHORITY REQUIREMENTS AT TARGET
COUNTRIES IN EU 37
Table 10. LCP-plants: emissions that are reported to authorities in each target country. Data based on
questionnaire.
Pollutant/country UK Spain Estonia Czech France Poland
NOx X X X X X X
SO2 X X X X X X
Dust X X X X X X
CO X X X X X X
TOC X
HCl X X
HF X
N2O X
CO2 X All the pollutants are reported in mg/Nm
3 and in specific oxygen content.
Peripherals, such as flue gas flow, temperature, pressure, oxygen content and
moisture content are used to correct the raw values of the measured parameters.
Measured oxygen content is used to calculate specific oxygen content for reported
pollutants and measured moisture content is used to calculate emission concentrations in
a dry content, if the emission concentrations are measured from moist flue gas. Answers
to the questionnaire from Czech and France claimed, that they don’t report flue gas flow
to the authorities. It could be misunderstanding, because measurement results of flue gas
flow is used to calculate e.g. total annual emissions.
Reporting of carbon monoxide (CO) seems to be required in all countries though
it is not required by the LCP directive. It is dependent on the plant’s environmental
permit. Carbon monoxide is an indicator of the combustion efficiency. Nowadays
emission limit value for carbon monoxide is around 75 – 250 mg/Nm3 (6% oxygen
content) depending on local requirements and conditions [31].
Requirements in Czech vary the most compared to the other target countries.
According to the questionnaire it is the only country that requires reporting of total
organic carbon (TOC), hydrogen chloride (HCl) and hydrogen fluoride (HF) which are
required in the WI directive. Measurements of those pollutants are taken periodically in
three years intervals. Authorities in Czech might require also the reporting of carbon
dioxide (CO2). The amount of CO2 can be determined by calculation or it can be
measured continuously.
4.4.2. Waste incineration plants
In the table 11 emissions starting from NOx and ending to HF is required in each target
country as it is required in WI directive, except HF. If plant in UK is running some kind
of NOx reduction system, such as Selective Catalytic Reduction or Selective non-
Catalytic Reduction, the operator is required to report emissions from N2O and NH3
pollutants and that is why they are measured continuously as well. The reporting of
nitrous oxide and ammonia in UK is still dependent on the local environmental permit,
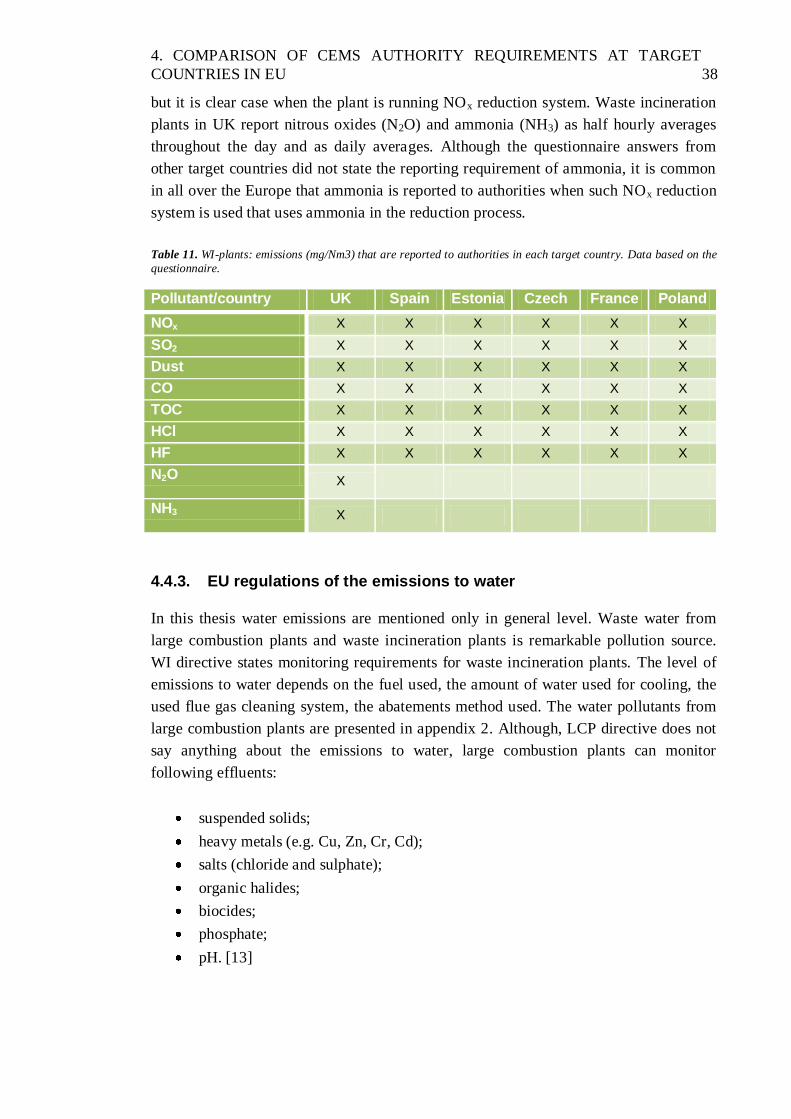
4. COMPARISON OF CEMS AUTHORITY REQUIREMENTS AT TARGET
COUNTRIES IN EU 38
but it is clear case when the plant is running NOx reduction system. Waste incineration
plants in UK report nitrous oxides (N2O) and ammonia (NH3) as half hourly averages
throughout the day and as daily averages. Although the questionnaire answers from
other target countries did not state the reporting requirement of ammonia, it is common
in all over the Europe that ammonia is reported to authorities when such NOx reduction
system is used that uses ammonia in the reduction process.
Table 11. WI-plants: emissions (mg/Nm3) that are reported to authorities in each target country. Data based on the
questionnaire.
Pollutant/country UK Spain Estonia Czech France Poland
NOx X X X X X X
SO2 X X X X X X
Dust X X X X X X
CO X X X X X X
TOC X X X X X X
HCl X X X X X X
HF X X X X X X
N2O X
NH3 X
4.4.3. EU regulations of the emissions to water
In this thesis water emissions are mentioned only in general level. Waste water from
large combustion plants and waste incineration plants is remarkable pollution source.
WI directive states monitoring requirements for waste incineration plants. The level of
emissions to water depends on the fuel used, the amount of water used for cooling, the
used flue gas cleaning system, the abatements method used. The water pollutants from
large combustion plants are presented in appendix 2. Although, LCP directive does not
say anything about the emissions to water, large combustion plants can monitor
following effluents:
suspended solids;
heavy metals (e.g. Cu, Zn, Cr, Cd);
salts (chloride and sulphate);
organic halides;
biocides;
phosphate;
pH. [13]

4. COMPARISON OF CEMS AUTHORITY REQUIREMENTS AT TARGET
COUNTRIES IN EU 39
The quality of the incineration process has effect on the formation of emissions
to water. Flue gas and fly ash composition will worsen if the incineration process is in-
complete. Waste incineration directive has regulations on the measuring and monitoring
emissions to water. Waste incineration or co-incineration plant operators have to apply a
permit for waste water discharges from cleaning of exhaust gases. Waste incineration
directive states emission limit values for water discharges from flue gas cleaning
devices. Those emission limit values are presented in appendix 4. Underneath is a list of
the requirements that waste incineration directive states of the measurement of the
pollutants into waste water. The measurements are taken out in a spot where the waste
water is discharged into the environment. [2]
Continuous measurement is required for pH, temperature and flow of the
discharges.
Suspended solids have to be measured daily by spot sample measurement.
Flow proportional representative sample over 24 hours period can be required by
the regulators
At least monthly measurements of a flow proportional representative sample of
the discharge over a period of 24 hours of the heavy metals.
At least every six months measurements of dioxins and furans; for the first 12
months of operation, measurements have to be taken at least every three months.
If regulators have set emission limit values for polycyclic aromatic hydrocarbons
or for other pollutants, they can define the measurement periods for them self.
[2]
4.5. Calculation of limit values for multi-firing unit
Multi-firing unit is described as a plant which uses two different fuels or more.
Emission limit values are determined in a different way than in the case of plant using
only one fuel. LCP directive has stated how the emission limit values are calculated.
First the emission limit values are listed for every fuel type. Then the fuel-weighted
limit values are determined. That is done by multiplying individual emission limit
values with each fuels’ thermal input and dividing the result with the total thermal input
of the plant. Lastly the fuel-weighted limit values are aggregated. [3]
LCP directive states that the local authorities calculate these limit values. If the
used fuel-mix is changing during operation, the limit values are changing also. They
have to be calculated again. That can be done by the authorities or by the operator. The
goal was to collect information from each target country about how they are calculating
emission limit values for multi-firing units. If it is done online the limit values are
calculated instantly as the fuel-mix changes by calculating application.
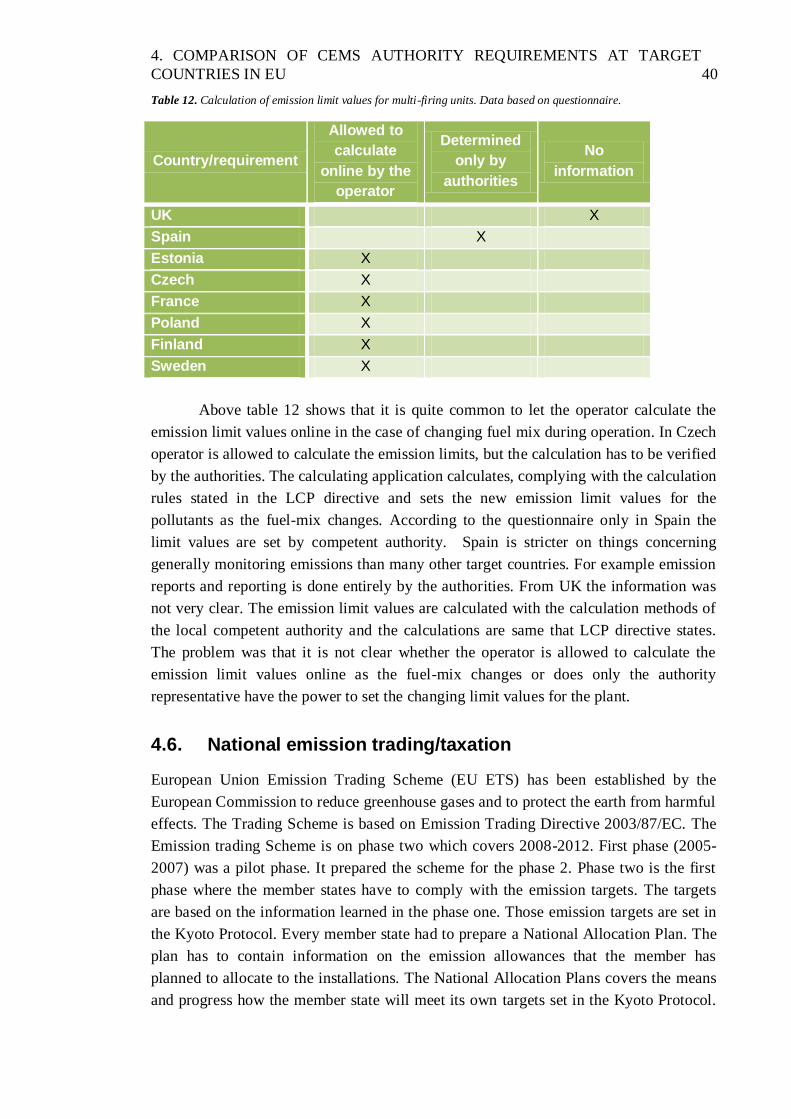
4. COMPARISON OF CEMS AUTHORITY REQUIREMENTS AT TARGET
COUNTRIES IN EU 40
Table 12. Calculation of emission limit values for multi-firing units. Data based on questionnaire.
Country/requirement
Allowed to
calculate
online by the
operator
Determined
only by
authorities
No
information
UK X
Spain X
Estonia X
Czech X
France X
Poland X
Finland X
Sweden X
Above table 12 shows that it is quite common to let the operator calculate the
emission limit values online in the case of changing fuel mix during operation. In Czech
operator is allowed to calculate the emission limits, but the calculation has to be verified
by the authorities. The calculating application calculates, complying with the calculation
rules stated in the LCP directive and sets the new emission limit values for the
pollutants as the fuel-mix changes. According to the questionnaire only in Spain the
limit values are set by competent authority. Spain is stricter on things concerning
generally monitoring emissions than many other target countries. For example emission
reports and reporting is done entirely by the authorities. From UK the information was
not very clear. The emission limit values are calculated with the calculation methods of
the local competent authority and the calculations are same that LCP directive states.
The problem was that it is not clear whether the operator is allowed to calculate the
emission limit values online as the fuel-mix changes or does only the authority
representative have the power to set the changing limit values for the plant.
4.6. National emission trading/taxation
European Union Emission Trading Scheme (EU ETS) has been established by the
European Commission to reduce greenhouse gases and to protect the earth from harmful
effects. The Trading Scheme is based on Emission Trading Directive 2003/87/EC. The
Emission trading Scheme is on phase two which covers 2008-2012. First phase (2005-
2007) was a pilot phase. It prepared the scheme for the phase 2. Phase two is the first
phase where the member states have to comply with the emission targets. The targets
are based on the information learned in the phase one. Those emission targets are set in
the Kyoto Protocol. Every member state had to prepare a National Allocation Plan. The
plan has to contain information on the emission allowances that the member has
planned to allocate to the installations. The National Allocation Plans covers the means
and progress how the member state will meet its own targets set in the Kyoto Protocol.
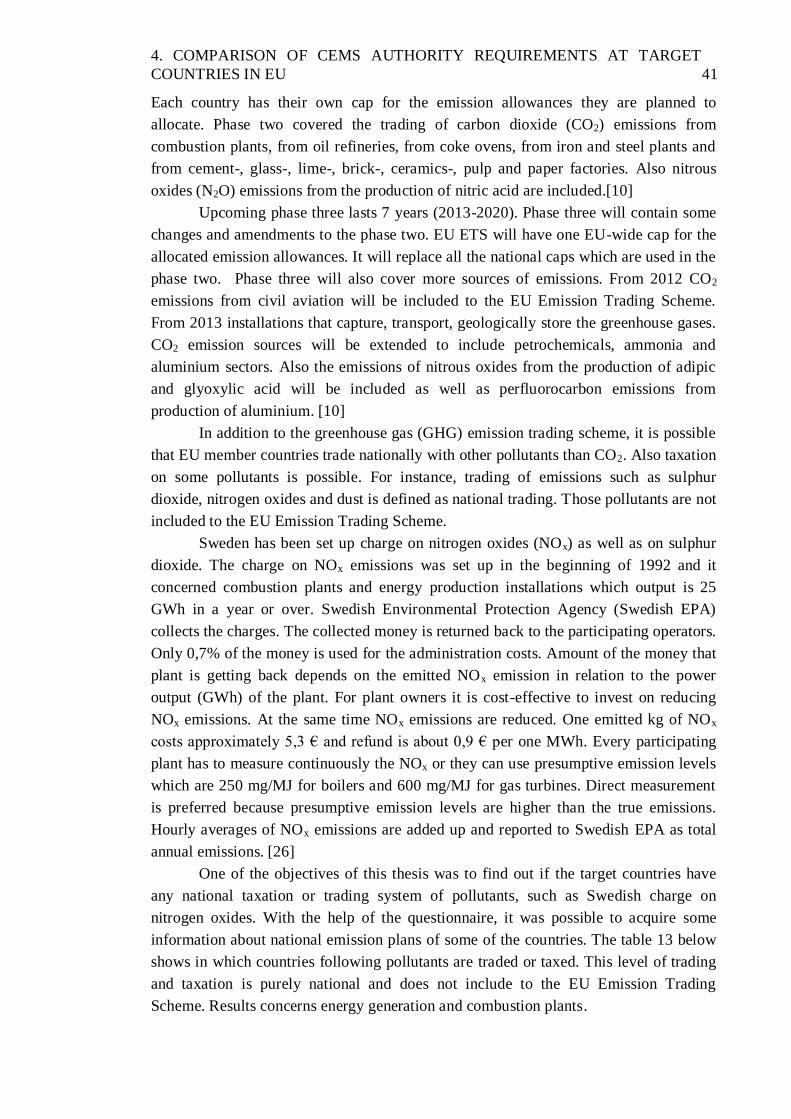
4. COMPARISON OF CEMS AUTHORITY REQUIREMENTS AT TARGET
COUNTRIES IN EU 41
Each country has their own cap for the emission allowances they are planned to
allocate. Phase two covered the trading of carbon dioxide (CO2) emissions from
combustion plants, from oil refineries, from coke ovens, from iron and steel plants and
from cement-, glass-, lime-, brick-, ceramics-, pulp and paper factories. Also nitrous
oxides (N2O) emissions from the production of nitric acid are included.[10]
Upcoming phase three lasts 7 years (2013-2020). Phase three will contain some
changes and amendments to the phase two. EU ETS will have one EU-wide cap for the
allocated emission allowances. It will replace all the national caps which are used in the
phase two. Phase three will also cover more sources of emissions. From 2012 CO2
emissions from civil aviation will be included to the EU Emission Trading Scheme.
From 2013 installations that capture, transport, geologically store the greenhouse gases.
CO2 emission sources will be extended to include petrochemicals, ammonia and
aluminium sectors. Also the emissions of nitrous oxides from the production of adipic
and glyoxylic acid will be included as well as perfluorocarbon emissions from
production of aluminium. [10]
In addition to the greenhouse gas (GHG) emission trading scheme, it is possible
that EU member countries trade nationally with other pollutants than CO2. Also taxation
on some pollutants is possible. For instance, trading of emissions such as sulphur
dioxide, nitrogen oxides and dust is defined as national trading. Those pollutants are not
included to the EU Emission Trading Scheme.
Sweden has been set up charge on nitrogen oxides (NOx) as well as on sulphur
dioxide. The charge on NOx emissions was set up in the beginning of 1992 and it
concerned combustion plants and energy production installations which output is 25
GWh in a year or over. Swedish Environmental Protection Agency (Swedish EPA)
collects the charges. The collected money is returned back to the participating operators.
Only 0,7% of the money is used for the administration costs. Amount of the money that
plant is getting back depends on the emitted NOx emission in relation to the power
output (GWh) of the plant. For plant owners it is cost-effective to invest on reducing
NOx emissions. At the same time NOx emissions are reduced. One emitted kg of NOx
costs approximately 5,3 € and refund is about 0,9 € per one MWh. Every participating
plant has to measure continuously the NOx or they can use presumptive emission levels
which are 250 mg/MJ for boilers and 600 mg/MJ for gas turbines. Direct measurement
is preferred because presumptive emission levels are higher than the true emissions.
Hourly averages of NOx emissions are added up and reported to Swedish EPA as total
annual emissions. [26]
One of the objectives of this thesis was to find out if the target countries have
any national taxation or trading system of pollutants, such as Swedish charge on
nitrogen oxides. With the help of the questionnaire, it was possible to acquire some
information about national emission plans of some of the countries. The table 13 below
shows in which countries following pollutants are traded or taxed. This level of trading
and taxation is purely national and does not include to the EU Emission Trading
Scheme. Results concerns energy generation and combustion plants.
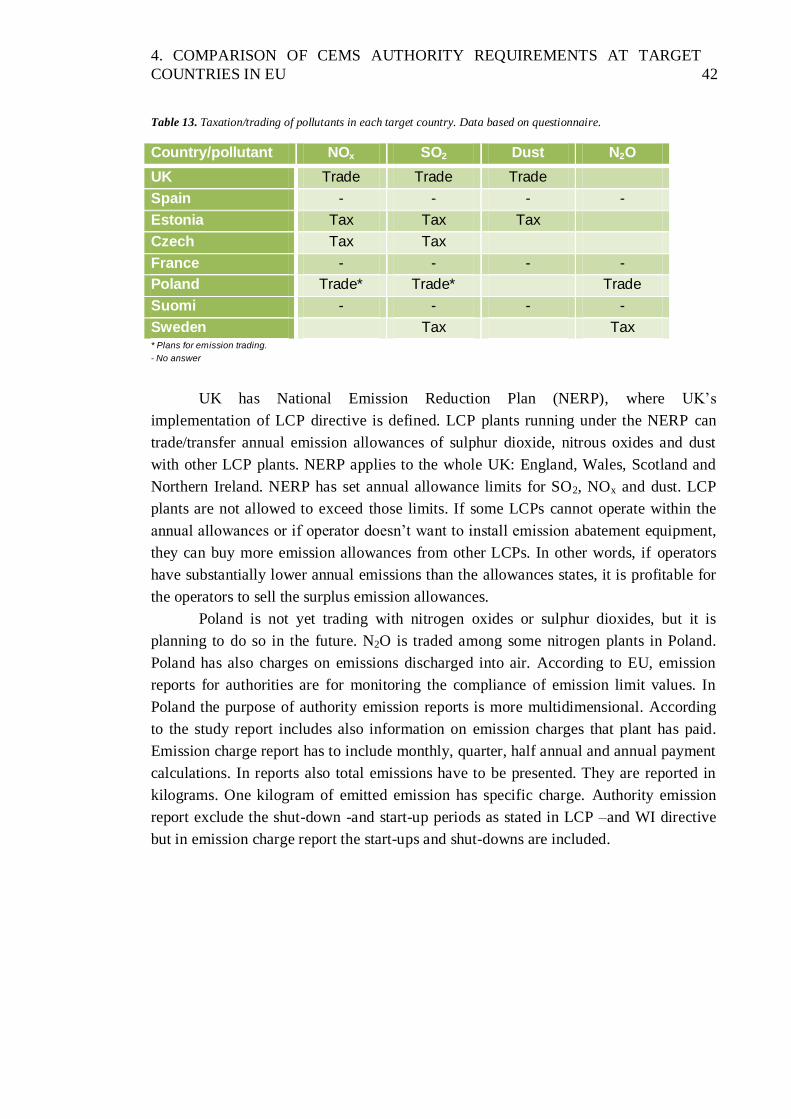
4. COMPARISON OF CEMS AUTHORITY REQUIREMENTS AT TARGET
COUNTRIES IN EU 42
Table 13. Taxation/trading of pollutants in each target country. Data based on questionnaire.
Country/pollutant NOx SO2 Dust N2O
UK Trade Trade Trade
Spain - - - -
Estonia Tax Tax Tax
Czech Tax Tax
France - - - -
Poland Trade* Trade* Trade
Suomi - - - -
Sweden Tax Tax * Plans for emission trading.
- No answer
UK has National Emission Reduction Plan (NERP), where UK’s
implementation of LCP directive is defined. LCP plants running under the NERP can
trade/transfer annual emission allowances of sulphur dioxide, nitrous oxides and dust
with other LCP plants. NERP applies to the whole UK: England, Wales, Scotland and
Northern Ireland. NERP has set annual allowance limits for SO2, NOx and dust. LCP
plants are not allowed to exceed those limits. If some LCPs cannot operate within the
annual allowances or if operator doesn’t want to install emission abatement equipment,
they can buy more emission allowances from other LCPs. In other words, if operators
have substantially lower annual emissions than the allowances states, it is profitable for
the operators to sell the surplus emission allowances.
Poland is not yet trading with nitrogen oxides or sulphur dioxides, but it is
planning to do so in the future. N2O is traded among some nitrogen plants in Poland.
Poland has also charges on emissions discharged into air. According to EU, emission
reports for authorities are for monitoring the compliance of emission limit values. In
Poland the purpose of authority emission reports is more multidimensional. According
to the study report includes also information on emission charges that plant has paid.
Emission charge report has to include monthly, quarter, half annual and annual payment
calculations. In reports also total emissions have to be presented. They are reported in
kilograms. One kilogram of emitted emission has specific charge. Authority emission
report exclude the shut-down -and start-up periods as stated in LCP –and WI directive
but in emission charge report the start-ups and shut-downs are included.
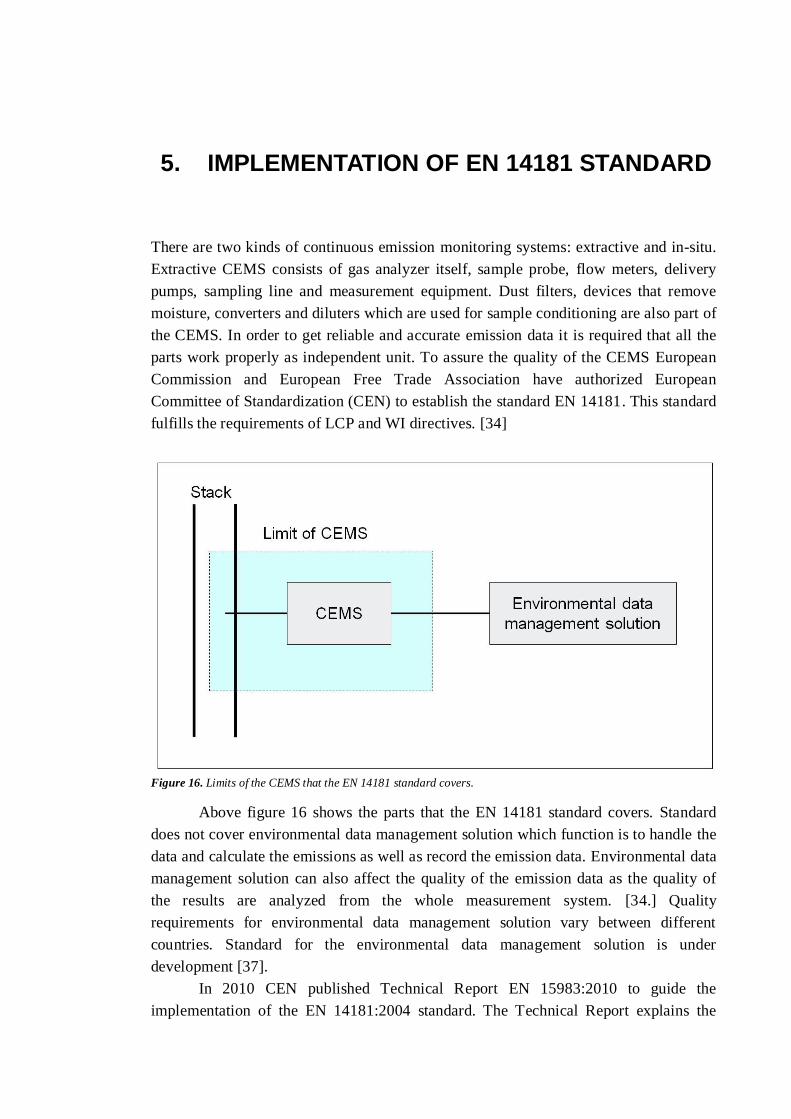
5. IMPLEMENTATION OF EN 14181 STANDARD
There are two kinds of continuous emission monitoring systems: extractive and in-situ.
Extractive CEMS consists of gas analyzer itself, sample probe, flow meters, delivery
pumps, sampling line and measurement equipment. Dust filters, devices that remove
moisture, converters and diluters which are used for sample conditioning are also part of
the CEMS. In order to get reliable and accurate emission data it is required that all the
parts work properly as independent unit. To assure the quality of the CEMS European
Commission and European Free Trade Association have authorized European
Committee of Standardization (CEN) to establish the standard EN 14181. This standard
fulfills the requirements of LCP and WI directives. [34]
Figure 16. Limits of the CEMS that the EN 14181 standard covers.
Above figure 16 shows the parts that the EN 14181 standard covers. Standard
does not cover environmental data management solution which function is to handle the
data and calculate the emissions as well as record the emission data. Environmental data
management solution can also affect the quality of the emission data as the quality of
the results are analyzed from the whole measurement system. [34.] Quality
requirements for environmental data management solution vary between different
countries. Standard for the environmental data management solution is under
development [37].
In 2010 CEN published Technical Report EN 15983:2010 to guide the
implementation of the EN 14181:2004 standard. The Technical Report explains the
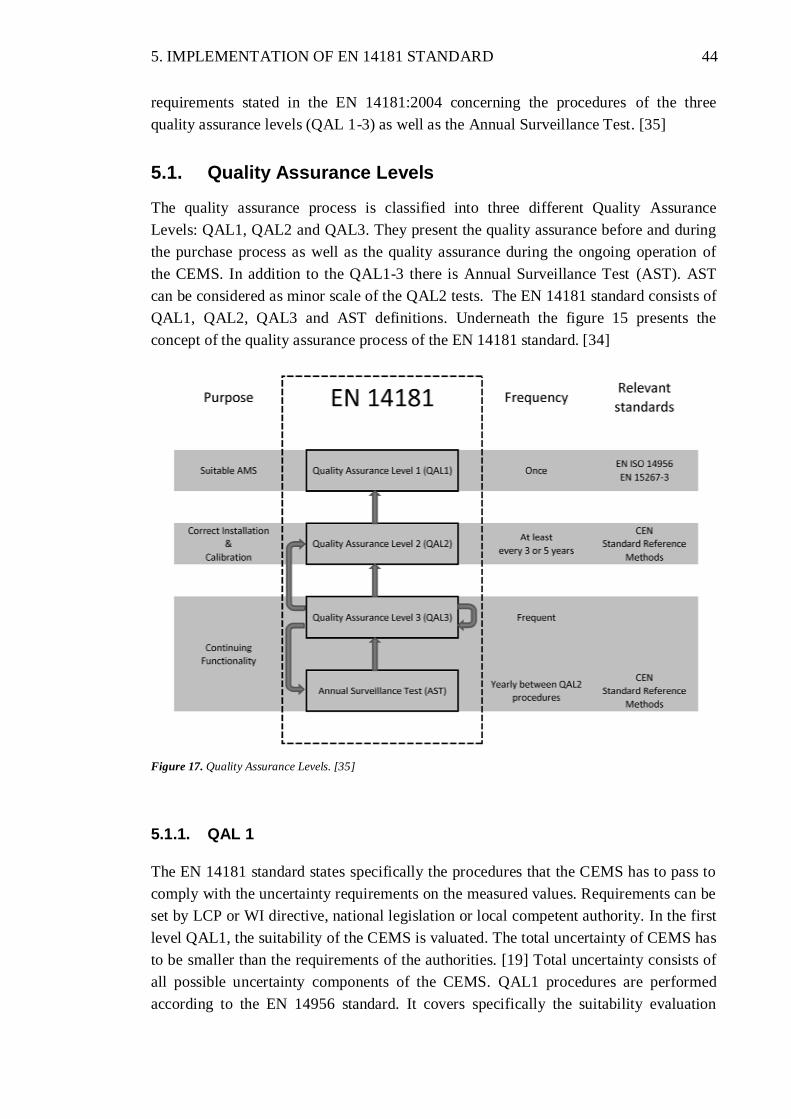
5. IMPLEMENTATION OF EN 14181 STANDARD 44
requirements stated in the EN 14181:2004 concerning the procedures of the three
quality assurance levels (QAL 1-3) as well as the Annual Surveillance Test. [35]
5.1. Quality Assurance Levels
The quality assurance process is classified into three different Quality Assurance
Levels: QAL1, QAL2 and QAL3. They present the quality assurance before and during
the purchase process as well as the quality assurance during the ongoing operation of
the CEMS. In addition to the QAL1-3 there is Annual Surveillance Test (AST). AST
can be considered as minor scale of the QAL2 tests. The EN 14181 standard consists of
QAL1, QAL2, QAL3 and AST definitions. Underneath the figure 15 presents the
concept of the quality assurance process of the EN 14181 standard. [34]
Figure 17. Quality Assurance Levels. [35]
5.1.1. QAL 1
The EN 14181 standard states specifically the procedures that the CEMS has to pass to
comply with the uncertainty requirements on the measured values. Requirements can be
set by LCP or WI directive, national legislation or local competent authority. In the first
level QAL1, the suitability of the CEMS is valuated. The total uncertainty of CEMS has
to be smaller than the requirements of the authorities. [19] Total uncertainty consists of
all possible uncertainty components of the CEMS. QAL1 procedures are performed
according to the EN 14956 standard. It covers specifically the suitability evaluation

5. IMPLEMENTATION OF EN 14181 STANDARD 45
procedures and the methods to calculate the total uncertainty of the measured values of
the CEMS. [34.] The equipment vendor is responsible for assuring the QAL1
requirements are complied.
QAL1 compliance is usually proved by certificate of competent certification
body such as MCERTS or TÜV. [19.] All the analysers have to have own QAL1
certificates. Also the sample conditioning system has to be QAL1 certified. Due to the
EN 14181 standard, it was unclear if the QAL1 certificate is required for the
independent analysers and also for whole the measurement system. [38.] The study
clarified that in UK such QAL1 certificate for the whole measurement system covering
all the analysers and sample conditioning system is not required at the moment. It is
enough to have separate certificates for the measuring devices and sample conditioning
system.
5.1.2. QAL 2
QAL2 consists of three parts: Functional test, determination of the calibration function
with parallel measurement and testing of the variability of the measurement devices.
Functional tests are performed first. Functional tests cover the tests shown in the table
14 below.
Table 14. Functional tests.
Operation QAL2
Extractive CEMS In-situ CEMS
Cleanliness and Alignment of the
measurement device X
Sample handling X
Documentation X X
Serviceability X X
Leak test X
Zero and span check X X
Linearity
Interferences
Zero and span drift (audit)
Response time X X
Report X X
After functional tests calibration and validation of the CEMS are done. After the
installation of the CEMS the calibration is carried out with parallel measurements.
Measurements are based on the standard reference method (SRM). Then the variability
and the uncertainty compliance of the CEMS are determined. Parallel measurements
have to be taken at least period of five years interval or more often if required by local
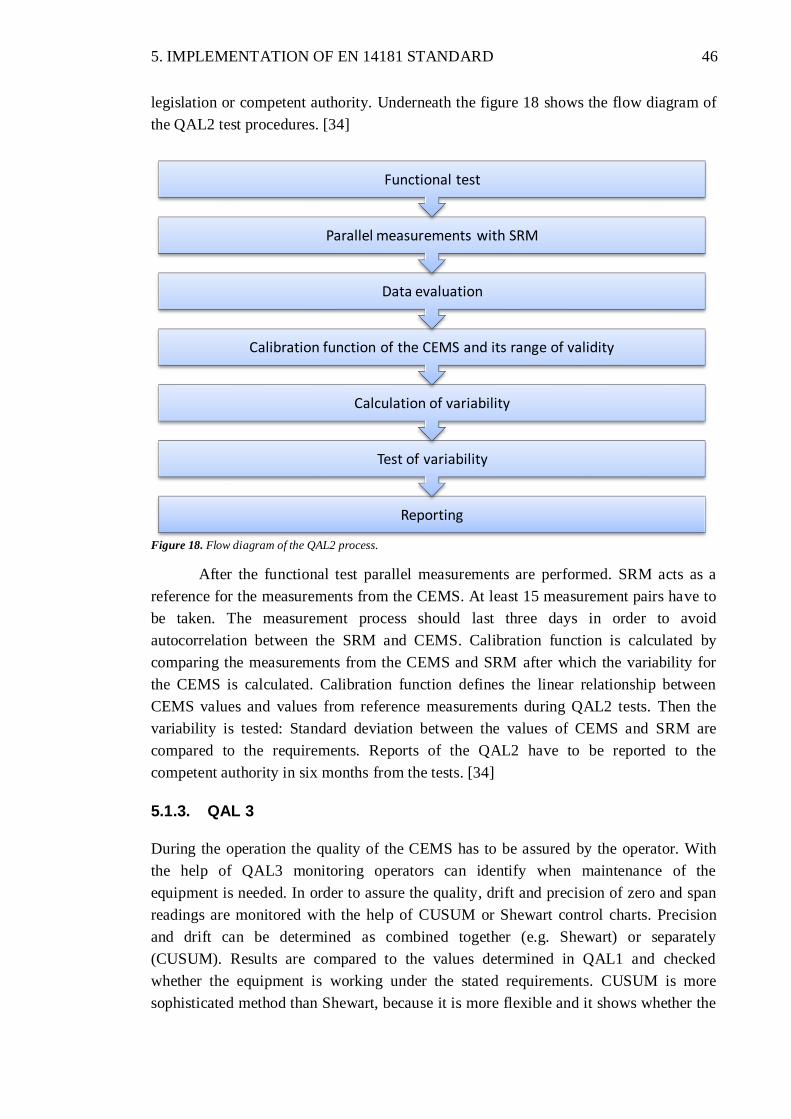
5. IMPLEMENTATION OF EN 14181 STANDARD 46
legislation or competent authority. Underneath the figure 18 shows the flow diagram of
the QAL2 test procedures. [34]
Figure 18. Flow diagram of the QAL2 process.
After the functional test parallel measurements are performed. SRM acts as a
reference for the measurements from the CEMS. At least 15 measurement pairs have to
be taken. The measurement process should last three days in order to avoid
autocorrelation between the SRM and CEMS. Calibration function is calculated by
comparing the measurements from the CEMS and SRM after which the variability for
the CEMS is calculated. Calibration function defines the linear relationship between
CEMS values and values from reference measurements during QAL2 tests. Then the
variability is tested: Standard deviation between the values of CEMS and SRM are
compared to the requirements. Reports of the QAL2 have to be reported to the
competent authority in six months from the tests. [34]
5.1.3. QAL 3
During the operation the quality of the CEMS has to be assured by the operator. With
the help of QAL3 monitoring operators can identify when maintenance of the
equipment is needed. In order to assure the quality, drift and precision of zero and span
readings are monitored with the help of CUSUM or Shewart control charts. Precision
and drift can be determined as combined together (e.g. Shewart) or separately
(CUSUM). Results are compared to the values determined in QAL1 and checked
whether the equipment is working under the stated requirements. CUSUM is more
sophisticated method than Shewart, because it is more flexible and it shows whether the
Reporting
Test of variability
Calculation of variability
Calibration function of the CEMS and its range of validity
Data evaluation
Parallel measurements with SRM
Functional test

5. IMPLEMENTATION OF EN 14181 STANDARD 47
span and zero need adjustment. Some QAL3 applications provide also the appropriate
adjustment value. [34]
EN 14181 standard defines what should the QAL3 application do. It does not
define how to do it [37]. Metso has its own QAL3 application, which can be used for
different types of analysers. The analysers can be classified into three categories
according to their different testing and adjusting. The first option in the table 15
analyser performs the span and zero checks automatically. The test results are
transferred automatically into the QAL3 application. QAL3 application executes
automatically all the calculations and provides the adjustment values. The analyzer
adjustment procedure is performed manually using the adjustment values from the
QAL3 application. [32.]
In the second option the span and zero check has to be performed manually and
the results are entered manually into the QAL3 application. The adjustment is
performed manually, in the same way as in the option one. [32]
Third option is the easiest for the user. The QAL3 procedure of the analyser is
completely automatic. The analyser performs automatically the span and zero checks.
The analyser itself also performs the adjustments if necessary. The test results are
automatically transferred to the QAL3 application. The application just provides the test
history in a report. [32]
Table 15. Analyzers categorized according to QAL3.
QAL3 Span and zero check of
analyzer
Adjustment of analyzer
1 Automatic Manual
2 Manual Manual
3 Automatic Automatic
In the case of a CUSUM chart, QAL3 monitoring is based on the standard
deviation sAMS. The calculation of the standard deviation is done under the plant
conditions not. Formula 3 is used to calculate the sAMS. [34]
where
is the uncertainty of the instability;
is the uncertainty which is caused by the variation in the air temperature;
is the uncertainty which is caused by the variation in voltage;
is the uncertainty which is caused by the variation in ambient pressure;
covers all the other uncertainties that might effect to the span and zero
readings. [34]

5. IMPLEMENTATION OF EN 14181 STANDARD 48
5.1.4. Annual Surveillance Test
Annual Surveillance Test (AST) is carried out once a year. AST is a similar
procedure as the QAL2 tests but in minor scale. It consists of functional test and parallel
measurements with SRM. AST is performed only for checking whether the calibration
function determined in the previous QAL2 test is still valid. New parallel measurements
according to QAL2 are required if the AST is not passed. At least five measurement
pairs are required (15 measurement pairs in QAL2). [34]
5.2. QAL 1-3 responsibilities
One of the goals of this thesis was to find out and clarify the responsibilities relating to
the three quality assurance levels. Many parties that are operating under the EN 14181
quality assurance standard are involved in verifying the quality of the CEMS such as
plant owner, boiler supplier, CEMS manufacturers, CEMS suppliers, test laboratories
and regulators. There are clear regulations about the QAL responsibilities in the EN
14181 standard. For example, in UK the responsibilities and roles of the participating
organizations, concerning MCERTS QAL1 certification of the CEMS and QAL2 and
QAL3 procedures are as it is stated in the table 16 on next page.

5. IMPLEMENTATION OF EN 14181 STANDARD 49
Table 16. Quality assurance responsibilities and roles in implementing EN 14181.
CEMS
manufacture
r and
supplier
Plant owners Test
laboratories Regulators
Obtain QAL1
MCERTS certificate
for the CEMS
X
Supplying and
commissioning of
proper CEMS
X
CEMS installation X
Acquire ISO 17025
and MCERTS
performance
standard
accreditations for
SRMs
X
QAL2 and AST
parallel
measurements
X
Assessing or
performing the
QAL2/AST
functional tests
X
QAL3 procedures X
QAL2, QAL3, and
AST reports X
Operator
compliance
assessment
X
Definition of the EN
14181 requirements X
The plant owner has the overall responsibility for complying with EN 14181 standard.
Competent authority assesses only the plant owner’s operation on the quality assurance.
The requirements of the EN 14181 standard can be complicated to implement. Every
organization plays its own part in the implementation. For example, UK’s Environment
Agency has stated that there is a need of a co-operation between the different
organizations involved in the implementation process. [40]

5. IMPLEMENTATION OF EN 14181 STANDARD 50
5.2.1. Specific QAL2 responsibilities
Information on the quality assurance of the CEMS from other target countries than UK
could not be found during the study. This subject was a little obscure for the involved
organizations. The answers to the questions about QAL 1-3 in the questionnaire were all
quite superficial. As a summary of the answers it can be said that the plant owner has
the overall responsibility of the compliance with the QAL2 procedures.
Test laboratories are required to perform the QAL2 and AST procedures, but
sometimes it can be difficult for them to perform for instance the functional tests
because the operation of the different CEMS varies. Environment Agency has allowed
some derogation in order to help the implementation of the EN 14181. QAL2 and AST
functional tests can be carried out by either operator or CEMS supplier but the test
laboratory is required to audit these tests according to the requirements in Annex A of
the EN 14181 standard. If the test laboratory representative is not able to audit the tests
there have to be some kind of proof that the tests have being carried out. [40]
When boiler supplier is delivering new plant, sometimes the boiler deliverer is
required to supply the CEMS for the plant depending of the contract. The boiler owner
sometimes wants the boiler deliverer to carry out or manage also the first QAL2 tests. In
UK QAL2 tests have to be carried out after the QAL3 has been running successfully at
least three months. In practice it means that the plant is running in normal operating
conditions. Although the boiler supplier is managing the QAL2 tests, the overall
responsibility is on the plant owner according to the questionnaire. QAL2 covers tests
from all the determinants that are required to be measured continuously. Next list shows
more specifically the responsibilities of the QAL2 procedures that Environment Agency
has established for the CEMS in UK plants. [25]
Figure 19. Responsibilities for QAL2 and AST procedures.
Functional tests Plant owner
Selection of measurement
rangePlant owner
Parallel measurements
with a SRMTest laboratory
Calibration function and
its validity
Test laboratory and/or equipment supplier
Variability test Test laboratory
ReportingPlant owner, test laboratory or
equipment supplier

6. OUTLOOK FOR THE FUTURE
EU has made future plans in reducing and monitoring emissions from power plants.
New proposed industrial emission directive (IED) will come into force. IED will be
possibly accepted by the end of 2010. [20.] The proposal recasts seven existing directive
related to industrial emissions into single, clear and coherent legislative instrument. The
recast includes in particular the IPPC, LCP and WI Directives. The main goal of the
industrial emission directive is to achieve higher level of the protection of the
environment and human health. It will simplify the legislation and also the unnecessary
administrative costs will be cut down by the directive. [7.]
6.1. Industrial emission directive
In the directive there is a general part which is to be applied for all the operations the
IED affects on. Such operations are: combustion plants, chemical industry and other
industrial operations and waste incineration and co-incineration plants. Next chapters
will define the special requirements for each industry.
Requirements for LCP plants in the proposed directive will apply for the plants
which rated thermal input is 50 MW or over. The changes to the existing legislation in
the IED will concern mostly the large combustion plants. Changes are more moderate
on the operations using solvents. [20]
The proposal includes aggregation rules for the combustion plants. For the
existing combustion plants, if flue gases of two or more separate plants are discharged
through one stack, the combination of those plants is considered as a single combustion
plant and the rated thermal inputs of units are calculated together. Same aggregation
rule is applied for the new plants if the plant is installed in such way that, taking into
account technical and economical matters, the flue gases of two or more combustion
plants could be discharged through one stack. The decision is under consideration of the
competent authority.
6.1.1. Emission limit values
As the IED will come into force the emission limit values of power plant shall be
determined according to the BAT. Generally the emission limit values shall be stricter
than present emission limit values. The difference between the proposed emission limit
values for the old and the new plants is small. Emission limit values for sulphur dioxide
and nitrogen dioxide in LCP plants will be stricter for almost all sizes of plants. Dust
emission limit values will be stricter despite the size of the LCP plant. In the case of
combustion of peat separate emission limit values are set for sulphur dioxide. Today the

6. OUTLOOK FOR THE FUTURE 52
sulphur dioxide emission limit value for the combustion of peat is considered as
emission limit value for solid fuels. The proposal will set emission limit value for
carbon monoxide for combustion plants. There is no emission limit value for carbon
monoxide in present LCP Directive. Underneath there is table 17 where is the difference
between the existent emission limits compared to the emission limit values proposed by
the IED for the old plants. The emission limit values in BAT BREF documents can also
be seen from the table. BAT BREF documents work as guides for applying the Best
Available Technique. The emission limit values for combustion of coal will lower 17-
40% depending of the rated thermal input of the plant. [20]
Table 17. Proposed emission limit values for dust emissions in IED and BAT BREF compared to existent limits in
LCP directive.
Emission limit values (mg/Nm3)
Coal Liquid fuels
50-100 MW
IED
LCP directive
BAT BREF
30
50
5-30
30
50
5-30
100-300 MW
IED
LCP directive
BAT BREF
25
30
5-25
25
30
5-25
>300 MW
IED
LCP directive
BAT BREF
20
30
5-20
20
30
5-20
6.1.2. Emission monitoring requirements
The existent continuous measurement requirements for large combustion plants will be
valid also in the directive on industrial emissions but the coming directive includes also
monitoring requirements for the carbon monoxide emissions to air. Also the plants that
use coal or lignite in the combustion the total emissions of mercury (Hg) have to be
determined once a year. [20]
Validated monthly and daily averages are determined in the same way as they
are determined today. The confidence interval can be subtracted before the averages are
compared to the emission limit values as stated in chapter 2.3.3. [20]
Importance of best available technique will be emphasized and the use of the
BREF documents will be controlled more strictly. In the process of restricting emissions
in EU the best available technique will be the primary method of approach. Though, the

6. OUTLOOK FOR THE FUTURE 53
emission limit values are based on the BAT there is no requirement for specific
technique or technology to be used to comply with the emission limit values. [20]
Best available technique BREF document for LCP plants will apply for plants
which rated thermal input is 50 MW or over. The LCP BREF covers traditional fuels:
Coal, lignite, biomass, peat , liquid fuels and gaseous fuels as well as co-combustion of
waste derived fuels. Emission levels are stated in the BREF for the pollutants in LCP
plants as well as definition of techniques how to reach the emission levels. Specific
emission limit values are not stated. The emission levels are based on the daily average
values, standard conditions and in specific oxygen content. Oxygen contents are the
same as in the LCP directive and coming industrial emission directive. [20]
The means how the best available technique is applied for the specific plant have
to be considered in the IPPC permit procedure. With the help of BAT BREF document
the operator has to define in the permit application the means how the plant is going to
apply best available technique. [20]
Emission levels in the BREF documents are called BAT AEL (Associated
Emission Level). Emission limit values which differ from the BAT emission levels can
be granted in environmental permits on special occasion. Despite of that the emission
limit values cannot exceed the final emission levels stated in the industrial emission
directive. Competent authorities shall have the responsibility to confirm that the
emission limit values determined for the IPPC permit of the plant will comply with the
IED requirements. [20]

7. CONCLUSION
Important source of information for this thesis was the questionnaire that was sent to the
representatives of the target countries. There is a histogram in the appendix 3 which
shows the number of sent questionnaires to each target country and the number of
received answers. Information of the local implementation of environmental matters is
difficult to get which can also be seen from the histogram. These matters are
complicated for the participating organizations such as authorities, operators, boiler and
CEMS suppliers and test laboratories. In some cases the culture or simply the language
barrier can block the communication.
This thesis answered to the need of Metso Automation and Metso Power which
concerned the level of communication between automation system and emission
monitoring system, emission reporting, emission measurement, national emission
trading/taxation and determination of emission limit values as well as certification of
emission monitoring and reporting solution and continuous emission monitoring
system. This thesis built up the knowledge level of Metso Automation and Metso Power
on the target countries. This information helps when approaching the market of specific
country.
Almost all of the contacts in UK answered to questionnaire. That indicates that
they are aware of their own environmental requirements and how they are implemented.
The communication language was not an obstacle due to the questionnaire which was in
English.
The information gathered by this thesis did not found such information that
would block Metso Automation from approaching any of the target country. For
instance, according to the study competent authorities in the target countries do not
require emission monitoring system to be fully detached from the automation system.
Many of the countries allow the full integration of the CEMS and automation system
and all of them allow also the semi-integration option
At the moment it is considered that redundant CEMS is required only in UK. It
is relevant information to Metso Power, because they often have to manage continuous
emission monitoring systems for the customer alongside with the boilers. It means that
redundant analysers have to be installed.
In UK MCERTS certification is required for analysers and highly preferred for
monitoring and reporting solution. According to the study, no other Member State
requires any kind of certification for instance from MCERTS or TÜV. MCERTS
certification is planned to be mandatory for the monitoring and reporting solution in one
or two years. Though, it is not required yet it is worthwhile to acquire the MCERTS
7. CONCLUSION 55
certification now. Communication with the authorities can be easier with the certificate
and monitoring and reporting solution suppliers have to acquire it afterwards anyhow.
The study reviled that in Spain authorities perform the emission reporting of the
plants. They take the emission data straight out from the analyser and perform needed
calculations. Plant owner can use the emission monitoring and reporting solution for
process monitoring. The study should be taken further because many things have to be
clarified. For example, what are the specific responsibilities of each participating
organization? Before Metso Automation can supply EMRS to a plant in Spain, the
requirements of competent authority have to be clarified.
Metso Power is supplying continuous emission monitoring systems alongside
with boilers. Depending on the contract, Metso Power has to manage sometimes the
first QAL2 test. The plant owner has the overall responsibility, but it can share the
responsibility with CEMS supplier through the contract.
According to the study and the experience of Metso the requirements differ
between the Member States and are expected to differ in the future as well. For instance,
many countries tax or trade nationally other pollutants than CO2 (GHG) and the
taxed/traded pollutants differ between countries. Due to the charges, there can be special
requirements for the emission calculations. Further studies should be performed to get
more detailed information on the effects of national taxation or trading to the CEMS.
In the future the requirements will become stricter due to the industrial emission
directive and by the growing importance of best available technique. The emission limit
values will lower and the monitoring requirements will be stricter. Emission limit values
shall be based on the emission levels stated in the best available technique reference
document. It is interesting to see how the IED directive will be implemented by the
Member States and does it resolve the problems of today such as the variation in the
environmental permit requirements. The Best Available Technique BREF documents
are under review at the moment. IED will come into force before the reviewed LCP and
Monitoring BAT BREF documents. The emission levels in BAT documents are
expected to be stricter than the IED requirements. It is conflicting because the idea of
today is that the emission limit values granted in the environmental permits can exceed
neither the BAT emission levels nor the IED emission limit values. It is unclear which
requirement should be applied. That problem has not been solved yet.
The subject of this thesis was very wide and there was many target countries
from which the information was gathered. The results were partly superficial and more
detailed information was difficult to find. The schedule of the study was too tight for
more detailed investigations, because of the wide subject of the thesis. The results can
be still considered as a strong ground for further studies. It covers information on wide
perspective from six Member States of EU.
Monitoring of the local environmental legislation is ongoing process.
Requirements change and become stricter. Metso’s products and services have to adapt
with them. Research has to be done continuously. The study on this subject should be
done with narrower perspective. For example, it is better to take only one country at a

7. CONCLUSION 56
time under examination. Another option could be to look into single area of information
and find out how it is interpreted in specific countries. The contact network gathered by
this thesis will help in this process.

REFERENCES
[1] 2008/1/EY. Directive concerning integrated pollution prenvention and control.
2008, European parliament and council. 21 p.
[2] 2000/76/EC. Directive on the incineration of waste. 2000, European parliament
and council. 20 p.
[3] 2001/80/EY. Directive on the limitation of emissions of certain pollutants into
the air from large combustion plants. 2001, European parliament and council. 21
p.
[4] Europa. 2008. Ympäristön pilaantumisen ehkäisemisen ja vähentämisen
yhtenäistäminen: IPPC direktiivi [WWW]. [Assessed 09.12.2009]. Available at:
http://europa.eu/legislation_summaries/environment/waste_management/l28045
_fi.htm.
[5] Europa. 2008. Jätteenpoltto. [WWW]. [Assessed 16.4.2010]. Available at:
http://europa.eu/legislation_summaries/environment/waste_management/l28072
_fi.htm.
[6] European Commission. European IPPC Bureau: Reference documents. [WWW].
[Assessed 16.4.2010]. Available at: http://eippcb.jrc.es/reference/.
[7] European Commission. 2010. Towards a future policy on industrial emissions.
[WWW]. [Assessed 5.5.2010]. Available at:
http://ec.europa.eu/environment/air/pollutants/stationary/ippc/index.htm.
[8] European Commission. 2010. Waste incineration directive. [WWW]. [Assessed
16.4.2010]. Available at:
http://ec.europa.eu/environment/air/pollutants/stationary/wid.htm.
[9] European Commission. 2009. Air quality [WWW]. [Assessed 04.12.2009].
Available at: http://ec.europa.eu/environment/air/quality/index.htm.

58
[10] European Commission. 2009. EU action against climate change [WWW].
[Assessed 6.4.2010]. Available at:
http://ec.europa.eu/environment/climat/pdf/brochures/ets_en.pdf.
[11] European Commission. 2009. The IPPC directive [WWW]. [Assessed
09.12.2009]. Available at:
http://ec.europa.eu/environment/air/pollutants/stationary/ippc/summary.htm.
[12] European commission. 2006. Reference Document on Best Available Technique
for incineration of waste. [WWW]. [Assessed 13.4.2010]. Available at:
http://eippcb.jrc.es/reference/wi.html.
[13] European commission. 2006. Reference Document on Best Available Technique
for Large Combustion Plants. [WWW]. [Assessed 13.4.2010]. Available at:
ftp://ftp.jrc.es/pub/eippcb/doc/lcp_bref_0706.pdf.
[14] European commission. 2003. Reference Document on Best Available Technique
for monitoring. [WWW]. [Assessed 13.4.2010]. Available at:
http://eippcb.jrc.es/reference/mon.html.
[15] European Commission. More information on the European IPPC Bureau.
[WWW]. [Assessed 20.4.2010]. Available at:
http://eippcb.jrc.es/about/more_information.html.
[16] European Environment Agency. Air pollution [WWW]. [Assessed 4.12.2009].
Available at: http://www.eea.europa.eu/themes/air/about-air-pollution.
[17] Flsmidth. Measuring principles. [WWW]. [Assessed 2.5.2010]. Available at:
http://www.flsmidth.com/FLSmidth+Airloq/English/Product/Measuring+Princip
les/Measuring+Principles.htm#header_anchor{807C88A7-5011-44CB-89A9-
C333AFD23792}.
[18] Hakola, P. Kehittynyt päästöjen valvonta- ja raportointiratkaisu – vastaus
kiristyneisiin EU-vaatimuksiin. Atomaatioseminaari, 27 -28.3.2007.
[19] Ilmansuojeluyhdistys ry. 2004. Päästömittausten käsikirja. Osat 1-2. [WWW].
[Assessed 19.8.2008]. Available at: http://www.isy.fi/kasikirja.html.
[20] Karjalainen, A. Ympäristölainsäädännön muutostuulet ja vaikutukset päästöjen
rajoittamiseen. Järvenpää 18. – 19.3.2009, Ympäristöministeriö. Esitelmä.

59
[21] Jahnke, J.A. Continuous emission monitoring. Second edition. United States
2000, John Wiley & Sons Inc. 320 p.
[22] Leskelä, J. Uusien säädösten vaikutus savukaasupäästöjen mittauksiin. Helsinki
2005, Electrowatt-Ekono Oy Tutkimusraportti 14. 50 s. + liitt. 30p.
[23] Majanne, Y., Joronen, T., Kovacs, J. Voimalaitosautomaatio. Second Edition.
Helsinki 2007, Suomen Automaatioseura ry. 276 p.
[24] Mapsof.net. Autonomous communities of Spain. [WWW]. [Assessed
16.5.2010]. Available at: http://mapsof.net/uploads/static-
maps/autonomous_communities_of_spain_01.png.
[25] Method implementation document, EN 1418: Stationary source emissions.
Quality assurance of automated measuring systems. 2009. Environment agency.
29 p.
[26] Natur vårds verket. 2010. The Swedish charge on nitrogen oxides – Cost
effective emission reduction. [WWW]. [Assessed 13.4.2010]. Available at:
http://www.naturvardsverket.se/Documents/publikationer/620-8245-0.pdf.
[27] Performance standards and Test Procedures for continuous emission monitoring
systems. 2008, Environment Agency. 67 p.
[28] Performance standards and Test Procedures for Environmental Data
Management Software. 2008, Environment Agency. 37 p.
[29] Raiko, R. & Kirvelä, K. 2005. Energiatekniikan perusteet. Luentomateriaali.
Tampereen teknillinen yliopisto.
[30] Raiko, R. & Saarenpää, I. 2005. Höyrytekniikka. Luentomateriaali. Tampereen
teknillinen yliopisto.
[31] Rantee, A. 2010. Product manager, Metso Power Oy. Tampere. Interview
23.3.2010.
[32] Salmela, M. 2010. Application specialist, Metso Automation Oy. Tampere. Free
form conversations during the thesis.
[33] SFS-EN 13284-1. Stationary source emissions. Determination of low range mass
concentration of dust. Part 1: Manual gravimetric method. Helsinki 2002,
Suomen standardisoimisliitto. 38 p.

60
[34] SFS-EN 14181. Stationary source emissions. Quality assurance of automated
measuring system. Helsinki 2004, Suomen standardisoimisliitto. 59 p.
[35] SFS-EN 15983. Stationary source emissions. Guidance on the application of EN
14181:2004. Helsinki 2010, Suomen standardisoimisliitto. 44 p.
[36] SICK Oy. 2008. Product specification. [WWW]. [Assessed 16.12.2009]
Available at:
http://www.sick.com.au/sickmaihak/product/categories/dust/fw100ex/en.toolbox
par.0002.file.tmp/PI_FW100_en_8008903.pdf.
[37] Stenvik, T. 2010. Product manager, Metso Automation Oy. Tampere. Free form
conversations during the thesis.
[38] Särkijärvi, J. 2010. Project engineer, Metso Power Oy. Tampere. Free form
conversations during the thesis.
[39] Tella, S. 2010. Product manager, Metso Power Oy. Tampere. Private e-mail.
Addressee: Matti Nikkola. Sent 23.2.2010, 11.16 am (GMT +0200).
[40] Technical guidance note M20, Quality assurance of continuous emission
monitoring systems - application of BS EN 14181 and BS EN 13284-2. 2008.
Environment agency. 36 p.
[41] University of Texas Libraries. Estonia Maps. [WWW]. [Assessed 26.03.2010].
Available at: http://www.lib.utexas.edu/maps/estonia.html.
[42] Valtion ympäristövirasto. 2005. Kattilalaitoksen ympäristölupahakemuksen
laatiminen. [WWW]. [Assessed 13.4.2010]. Available at:
http://www.ymparisto.fi/download.asp?contentid=2310&lan=fi.
[43] Valtion ympäristövirasto. 2009. Tietoa eri ilmansaasteista. [WWW]. [Assessed
07.12.2009]. Available at: http://www.ymparisto.fi/default.asp?contentid=
16561&lan=fi.
[44] Yokogawa. 2008. Product specification. [WWW]. [Assessed 15.4.2010]
Available at:
http://www.yokogawa.com/us/is/downloads/pdf/analytical/APPNOTES/TDLS_
A_001.pdf.
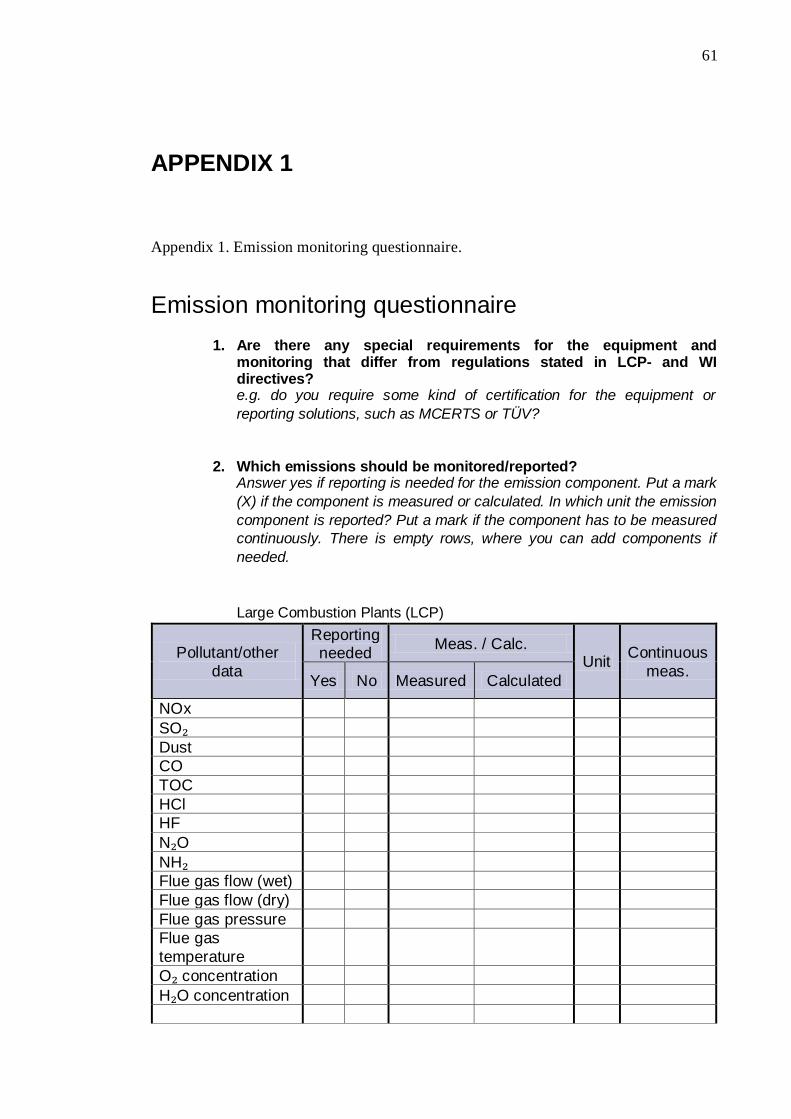
61
APPENDIX 1
Appendix 1. Emission monitoring questionnaire.
Emission monitoring questionnaire
1. Are there any special requirements for the equipment and monitoring that differ from regulations stated in LCP- and WI directives? e.g. do you require some kind of certification for the equipment or
reporting solutions, such as MCERTS or TÜV?
2. Which emissions should be monitored/reported? Answer yes if reporting is needed for the emission component. Put a mark
(X) if the component is measured or calculated. In which unit the emission
component is reported? Put a mark if the component has to be measured
continuously. There is empty rows, where you can add components if
needed.
Large Combustion Plants (LCP)
Pollutant/other
data
Reporting needed
Meas. / Calc. Unit
Continuous
meas. Yes No Measured Calculated
NOx
SO₂
Dust
CO
TOC
HCl
HF
N₂O
NH₂
Flue gas flow (wet)
Flue gas flow (dry)
Flue gas pressure
Flue gas
temperature
O₂ concentration
H₂O concentration

62
Waste incineration (WI)
Pollutant/other data
Reporting
needed Meas. / Calc.
Unit Continuous
meas. Yes No Measured Calculated
NOx
SO₂
Dust
CO
TOC
HCl
HF
N₂O
NH₂
Flue gas flow (wet)
Flue gas flow (dry)
Flue gas pressure
Flue gas temperature
O₂ concentration
H₂O concentration
3. What is the output limit (MW) of a plant after which continuous
measurement system is required?
In LCP directive the limit is 100 MW.
4. How are the emission limits calculated for multi-fuel boilers?
e.g. is it allowed to calculate online by operator or is it set by competent
authority? Please, define more detailed.
5. Do you comply only the emission limit values mg/m3(n) stated in LCP- and WI directives? If not, what are the tightened limits you have set for your country? Please specify the unit that they are reported in.

63
5.1 Do you have any other special requirements?
e.g. requirements for the time the equipment are allowed to be off or out of order.
6. Is it inevitable to have detached emission reporting system or is it
possible to integrate it to DCS (Process Control System)?
Choose one of the three options. Please specify if needed. (CEMS =
Continuous emission monitoring system)
7. How long plant owner has to store the measurement results and
emission reports?
8. Implementation of EN 14181 standard
8.1 What are the uncertainty requirements for the new plants AMS
(Automated Measuring System)?
Do you comply the EN standards (EN 14181, EN 14956 and EN
15267-3)?
Please, specify more detailed.
64
8.2 In general whose responsibility is to manage the first QAL2 tests
in the situation of delivering new power plant?
Plant deliverer or Plant owner?
8.3 In the situation that plant supplier starts trial run for the plant,
when at the latest the first authority QAL2 tests have to be
carried out?
8.4 Which measurands has to be measured/tested in the first QAL 2
test/ reference measurement?
9. Do you have some national emission trading in addition to EU`s CO2
trading or some taxation on emissions, such as in Sweden there is
tax on NOx emissions.
10. Do you have monitoring requirements for effluents (waste water)?
e.g. is it allowed to empty the condensation water to river/lake? Do you
require some measurements from waste water (fly ash)?
11. Do you have local requirements for measurement platform?
e.g. accessories, reference measurement connections or power supplies?
If you have, can you sent related information for us?
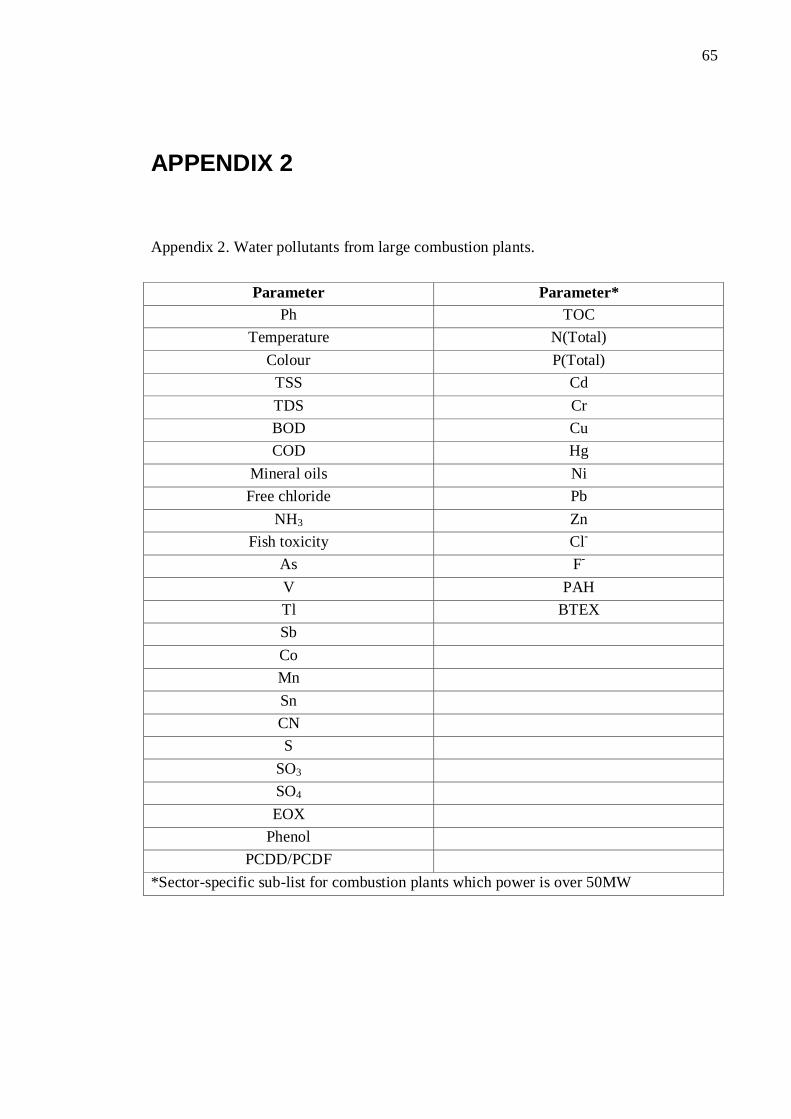
65
APPENDIX 2
Appendix 2. Water pollutants from large combustion plants.
Parameter Parameter*
Ph TOC
Temperature N(Total)
Colour P(Total)
TSS Cd
TDS Cr
BOD Cu
COD Hg
Mineral oils Ni
Free chloride Pb
NH3 Zn
Fish toxicity Cl-
As F-
V PAH
Tl BTEX
Sb
Co
Mn
Sn
CN
S
SO3
SO4
EOX
Phenol
PCDD/PCDF
*Sector-specific sub-list for combustion plants which power is over 50MW

66
APPENDIX 3
Number of sent questionnaires to each target country and the number of received
answers.
0
2
4
6
8
10
12
UK France Spain Estonia Poland Czech PortugalSlovakia
Sent questionnaires
Answers
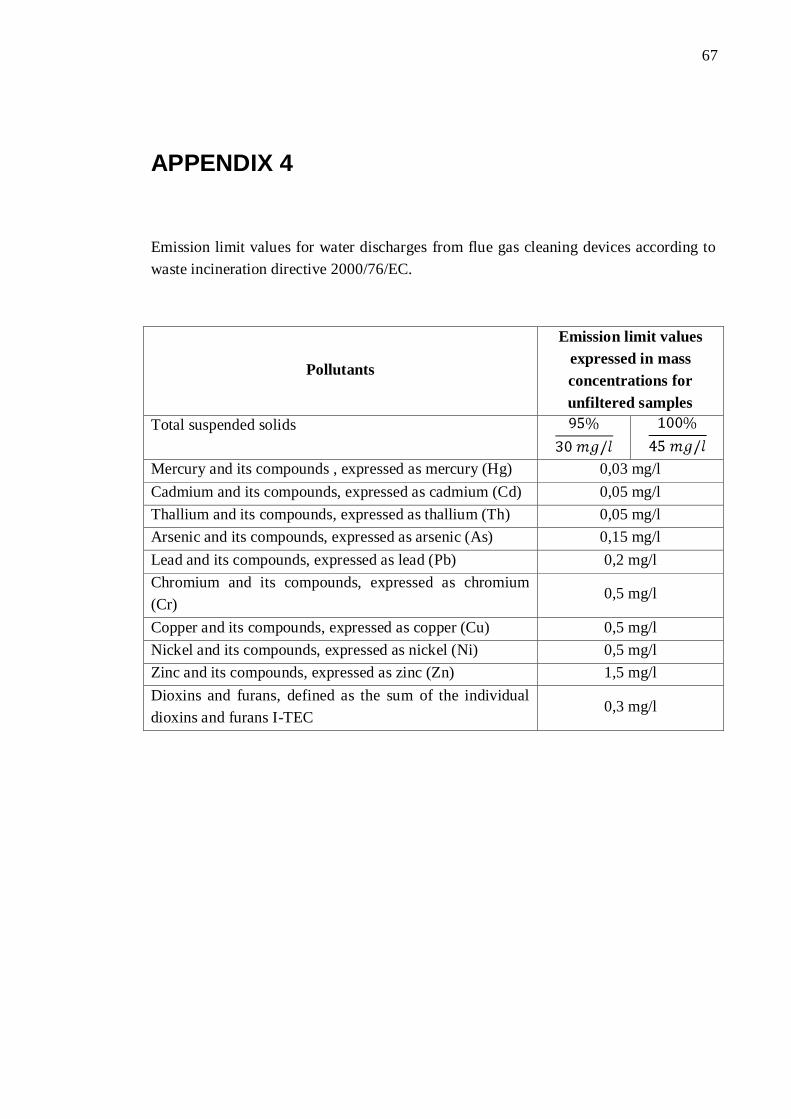
67
APPENDIX 4
Emission limit values for water discharges from flue gas cleaning devices according to
waste incineration directive 2000/76/EC.
Pollutants
Emission limit values
expressed in mass
concentrations for
unfiltered samples
Total suspended solids
Mercury and its compounds , expressed as mercury (Hg) 0,03 mg/l
Cadmium and its compounds, expressed as cadmium (Cd) 0,05 mg/l
Thallium and its compounds, expressed as thallium (Th) 0,05 mg/l
Arsenic and its compounds, expressed as arsenic (As) 0,15 mg/l
Lead and its compounds, expressed as lead (Pb) 0,2 mg/l
Chromium and its compounds, expressed as chromium
(Cr) 0,5 mg/l
Copper and its compounds, expressed as copper (Cu) 0,5 mg/l
Nickel and its compounds, expressed as nickel (Ni) 0,5 mg/l
Zinc and its compounds, expressed as zinc (Zn) 1,5 mg/l
Dioxins and furans, defined as the sum of the individual
dioxins and furans I-TEC 0,3 mg/l