download the publication (996.0 kb) - knight foundation
TRANSCRIPT

Results of Sustained Participationin Akron’s Perkins Activities Central
AuthorDebbie Shama-Davis, Ph.D., Kent State UniversityMarch 2007
Commissioned by Julie E. Tarr, Ph.D., Director of Evaluation, [email protected] S. and James L. Knight Foundation
Abstract
In almost every area, students who attended PAC programs frequently over a
two-year period had higher reading and math achievement scores and
passing rates, better attendance, and better behavior. This was especially
true for 7th graders, indicating the importance of students beginning the
PAC program early in their middle school career.
Knight Community Included
Akron, Ohio.
John S. and James L.
Writing the Story of TransformationKnight Foundation

Sustained Attendance Sustained Attendance StudyStudy

Report for 2005Report for 2005--2006 72006 7thth & 8& 8thth Graders Graders Tracking Progress:Tracking Progress:
Results of Sustained Attendance in PACResults of Sustained Attendance in PAC
Bureau of Research, Kent State University330-672-7918
Prepared By:Debbie Shama-Davis, Ph.D.
March 2007

Focus of StudyFocus of Study
This study examines achievement, attendance, and behavior indicators for Perkins students in the 7th and 8th grades in the 2005/2006 school year.This study attempts to determine the value of both frequency of attendance and sustainedattendance over a two-year period (2004/2005 and 2005/2006) in the PAC program.For 7th graders, their 6th and 7th grade indicators will be examined.For 8th graders, their 7th and 8th grade indicators will be examined.

Inclusion CriteriaInclusion Criteria
Student must have been registered at Perkins in the 2005-2006 school year for at least 120 days.Student must have taken the 2006 spring Ohio Achievement Tests pertinent to student’s grade level.Only 7th and 8th graders were included because groups were formed based on sustainability in PAC over two years.
In order to be included in the study, each student is evaluated according to the following criteria:

Definition of PAC Definition of PAC Attendance GroupsAttendance Groups
“Attended None” Group: Did not attend a PAC activity at all during the school year.“Attended Some” Group: Attended 1-15 times during the school year.“Attended Frequently” Group: Attended 16 or more times during the school year.
Groups were formed separately for each school year (2004-2005 and 2005-2006).
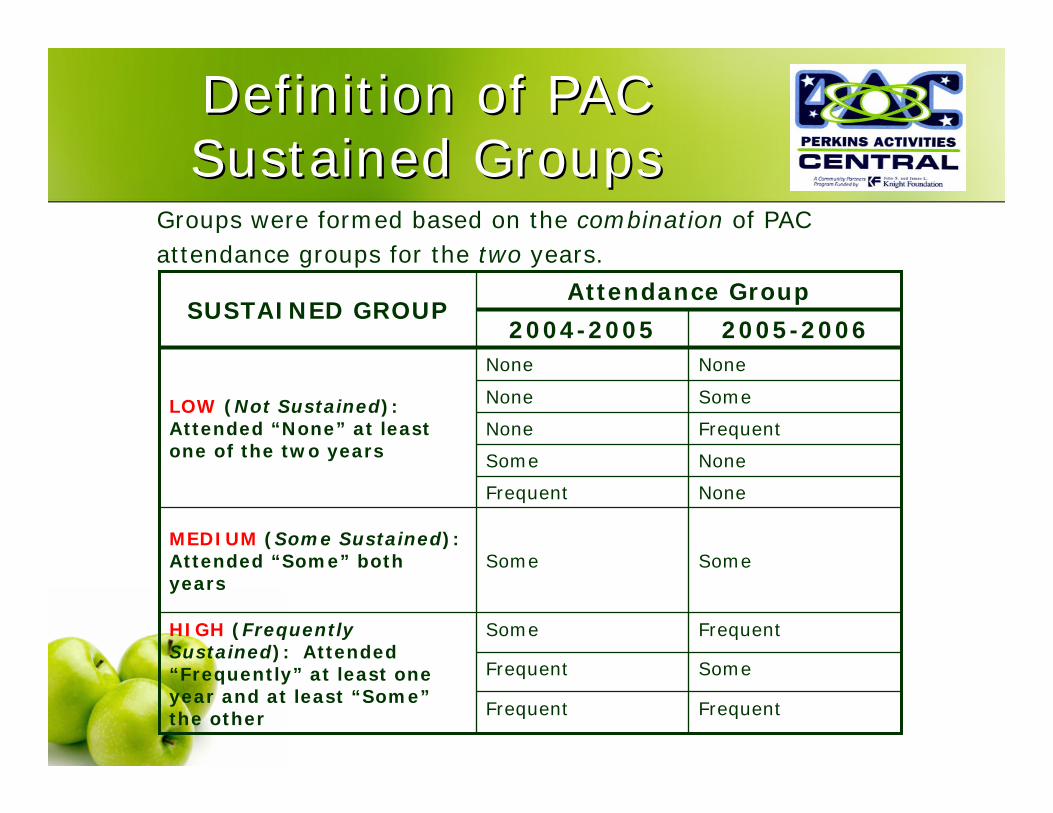
Definition of PAC Definition of PAC Sustained GroupsSustained Groups
Groups were formed based on the combination of PAC attendance groups for the two years.
Attendance Group
NoneSome
HIGH (Frequently Sustained): Attended “Frequently” at least one year and at least “Some”the other
MEDIUM (Some Sustained): Attended “Some” both years
LOW (Not Sustained): Attended “None” at least one of the two years
SUSTAINED GROUP
FrequentFrequent
SomeFrequent
FrequentSome
SomeSome
NoneFrequent
FrequentNone
SomeNone
NoneNone
2005-20062004-2005

Number of Students in Number of Students in Each GroupEach Group
1466HIGH(Frequently Sustained)
2027MEDIUIM(Some Sustained)
9455LOW(Not Sustained)
8th Grade7th GradeSustained Groups

Reports for 7Reports for 7THTH Graders Graders and 8and 8THTH GradersGraders
INCLUDED FOR EACH GRADE:
Comparison of Sustained Groups on ScantronScores in Reading and Math Tracked Over Two Years.
Comparison of Sustained Groups on Average OAT Reading and Math Scores.
Comparison of Sustained Groups on Percentages Passing OAT Reading and Math Tests.
Comparison of Sustained Groups on Attendance and Behavior Rates.
All results will be given first for 7th grade, then for 8th grade.
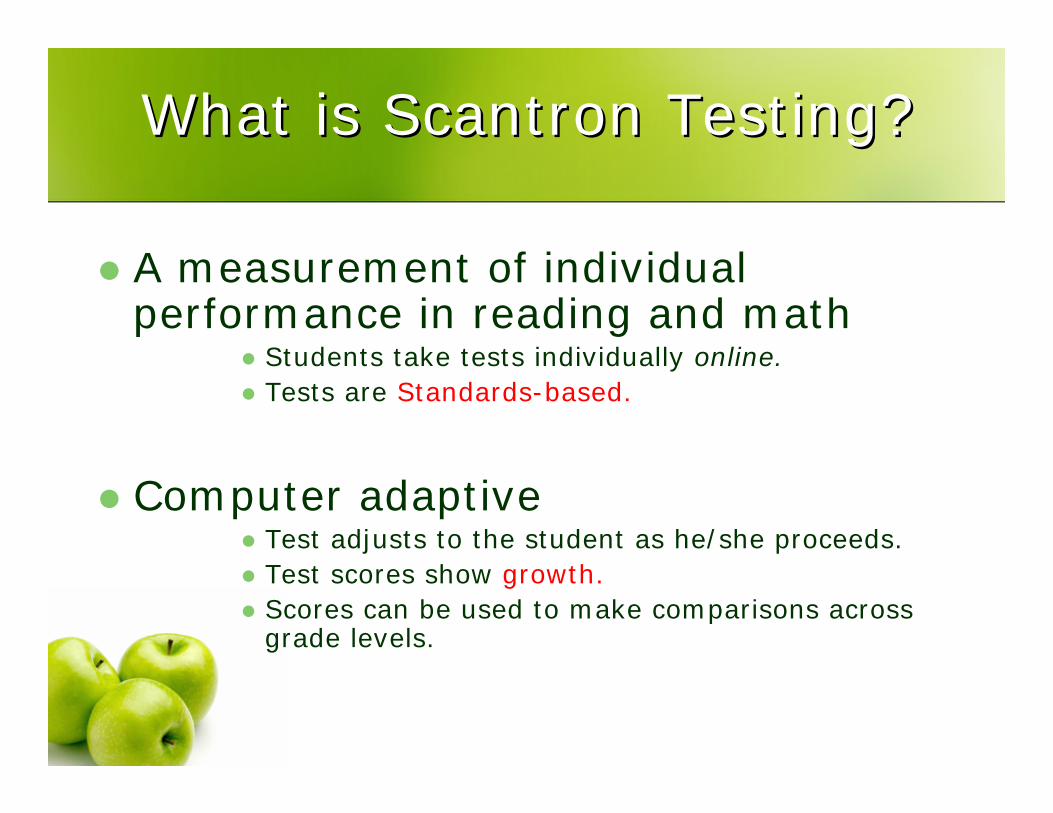
What is Scantron Testing?What is Scantron Testing?
A measurement of individual performance in reading and math
Students take tests individually online.Tests are Standards-based.
Computer adaptiveTest adjusts to the student as he/she proceeds.Test scores show growth.Scores can be used to make comparisons across grade levels.

What do Scantron Scores Signify?What do Scantron Scores Signify?Median Scaled Scores for Each GradeMedian Scaled Scores for Each Grade
(Based on National Norms)(Based on National Norms)
27112645287227588
26632578282227037
26042500273226296
SpringFallSpringFallGrade
MATHREADING
Examine students’ scores relative to these medians to determine if the students’ scores are above or below the national median. Note: For winter scores, compare to the fall national median.

Tracking Sustained Groups onTracking Sustained Groups onScantron READING TestsScantron READING Tests20052005--2006 2006 7th Graders7th Graders
2300
2400
2500
2600
2700
2800
2900
LOW 2434.65 2517.59 2629.98 2663.84
MEDIUM 2493.71 2592.82 2696.39 2714.09
HIGH 2556.52 2659.18 2728.59 2737.05
Fall '05 Winter '05 Fall '06 Winter '06
Mea
ns
* ** Above the national median
**
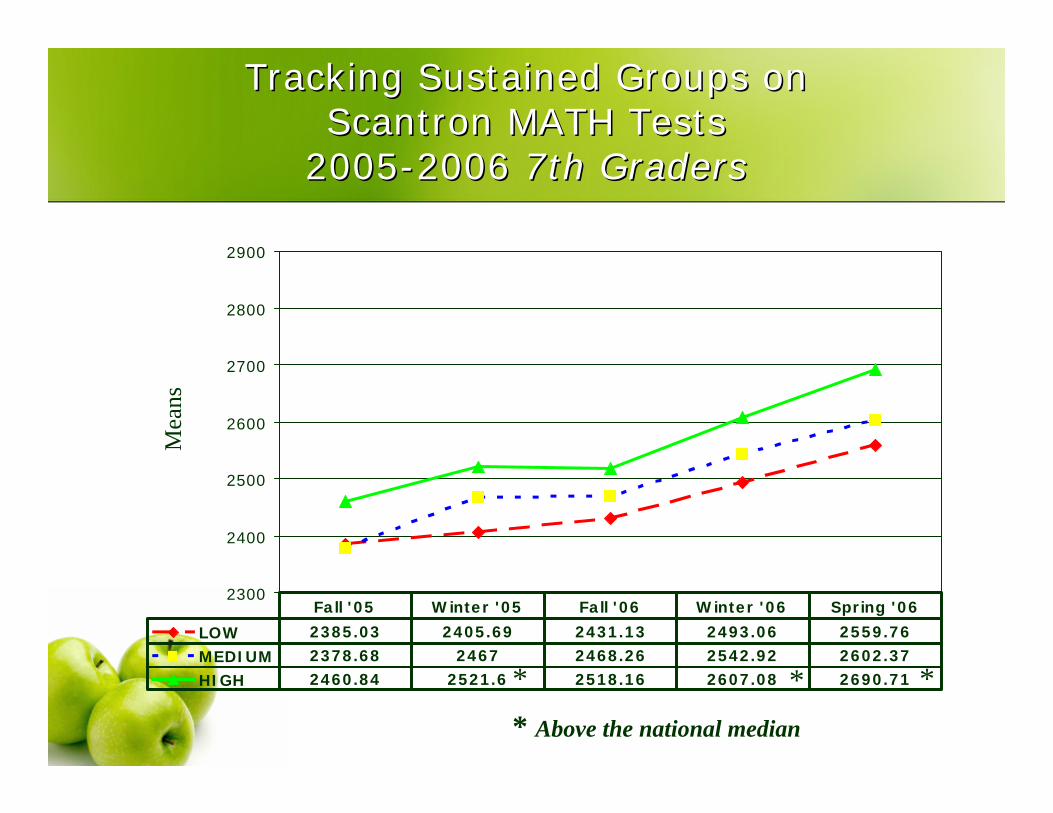
Tracking Sustained Groups onTracking Sustained Groups onScantron MATH Tests Scantron MATH Tests
20052005--2006 2006 7th Graders7th Graders
2300
2400
2500
2600
2700
2800
2900
LOW 2385.03 2405.69 2431.13 2493.06 2559.76
MEDIUM 2378.68 2467 2468.26 2542.92 2602.37
HIGH 2460.84 2521.6 2518.16 2607.08 2690.71
Fall '05 Winter '05 Fall '06 Winter '06 Spring '06
Mea
ns
** Above the national median
**

Tracking Sustained Groups onTracking Sustained Groups onScantron READING Tests Scantron READING Tests 20052005--2006 2006 8th Graders8th Graders
2400
2500
2600
2700
2800
2900
3000
3100
LOW 2644.55 2719.18 2779.56
MEDIUM 2686.83 2777.21 2804.9
HIGH 2692.67 2806 2818.79
Winter '05 Fall '06 Winter '06
Mea
ns
**
**
* Above the national median
*

Tracking Sustained Groups onTracking Sustained Groups onScantron MATH Tests Scantron MATH Tests
20052005--2006 2006 8th Graders8th Graders
2300
2400
2500
2600
2700
2800
2900
LOW 2461.32 2506.71 2573.1
MEDIUM 2479.35 2512.11 2583.94
HIGH 2488 2513.31 2546.5
Winter '05 Fall '06 Winter '06
Mea
ns
Note: The spring national median score for 8th grade is 2711.

Results of 2005Results of 2005--2006 72006 7thth Grade OAT:Grade OAT:AVERAGE SCORES IN READINGAVERAGE SCORES IN READING
by Sustained Groupby Sustained Group
395.78 396.54
405.32
370
380
390
400
410
420
Low Medium High
Mea
ns
Sustained Group
Significantly higher at p<.10

Results of 2005Results of 2005--2006 72006 7thth Grade OAT:Grade OAT:AVERAGE SCORES IN MATHAVERAGE SCORES IN MATH
by Sustained Groupby Sustained Group
385.55
392.22
397.41
370
380
390
400
410
420
Low Medium High
Mea
ns
Sustained Group
Significantly higher at p<.05

Average Average PercentPercent Passing Passing 20052005--2006 72006 7thth Grade OAT: Grade OAT: READINGREADING
45.5
55.660.6
0
10
20
30
40
50
60
70
80
90
100
Low Medium High
Perc
ents
Passing Score = 400
Sustained Group
Significantly higher at p<.05

Average Average Percent PassingPercent Passing 20052005--2006 72006 7thth Grade OAT: Grade OAT: MATHMATH
29.1 29.6
47
0
10
20
30
40
50
60
70
80
90
100
Low Medium High
Perc
ents
Passing Score = 400
Significantly higher at p<.05

20052005--2006 72006 7thth Grade:Grade:ATTENDANCE RATESATTENDANCE RATES
(Percents Based on Total No. Days Registered at Perkins)(Percents Based on Total No. Days Registered at Perkins)
88.16 88.04
93.06
50
60
70
80
90
100
Low Medium High
Mea
n Pe
rcen
tage
s
Sustained Group
Significantly higher at p<.01

20052005--2006 72006 7thth Grade:Grade:NOTNOT TARDY RATESTARDY RATES
(Percents Based on Total No. Days Registered at Perkins)(Percents Based on Total No. Days Registered at Perkins)
91.72
94.7495.47
50
60
70
80
90
100
Low Medium High
Mea
n Pe
rcen
tage
s
Sustained Group
Significantly higher at p<.10

20052005--2006 72006 7thth Grade:Grade:ININ--SCHOOL SUSPENSION RATESSCHOOL SUSPENSION RATES
(Percents Based on Total No. Days Registered at Perkins)(Percents Based on Total No. Days Registered at Perkins)
3.6
2.462.62
0
1
2
3
4
5
Low Medium High
Mea
n Pe
rcen
tage
s
Sustained Group

20052005--2006 72006 7thth Grade:Grade:OUTOUT--OFOF--SCHOOL SUSPENSION RATESSCHOOL SUSPENSION RATES(Percents Based on Total No. Days Registered at Perkins)(Percents Based on Total No. Days Registered at Perkins)
1.571.4
0.85
0
1
2
3
4
5
Low Medium High
Mea
n Pe
rcen
tage
s
Sustained Group
Significantly lower at p<.10
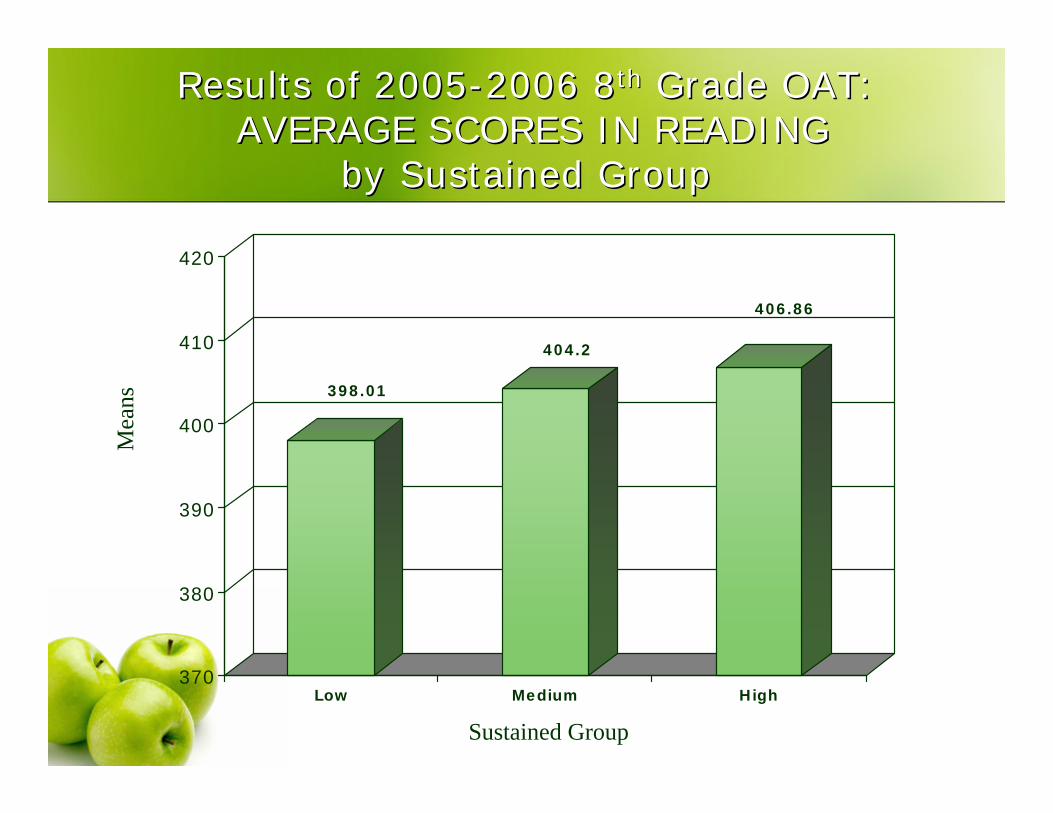
Results of 2005Results of 2005--2006 82006 8thth Grade OAT:Grade OAT:AVERAGE SCORES IN READINGAVERAGE SCORES IN READING
by Sustained Groupby Sustained Group
398.01
404.2
406.86
370
380
390
400
410
420
Low Medium High
Mea
ns
Sustained Group

Results of 2005Results of 2005--2006 82006 8thth Grade OAT:Grade OAT:AVERAGE SCORES IN MATHAVERAGE SCORES IN MATH
by Sustained Groupby Sustained Group
394.95
403.15 401.29
370
380
390
400
410
420
Low Medium High
Mea
ns
Sustained Group

Average Average Percent PassingPercent Passing 20052005--2006 82006 8thth Grade OAT: Grade OAT: READINGREADING
45.750
64.3
0
10
20
30
40
50
60
70
80
90
100
Low Medium High
Perc
ents
Passing Score = 400
Sustained Group

Average Average Percent PassingPercent Passing 20052005--2006 82006 8thth Grade OAT: Grade OAT: MATHMATH
40.4
55
50
0
10
20
30
40
50
60
70
80
90
100
Low Medium High
Perc
ents
Passing Score = 400
Sustained Group

20052005--2006 82006 8thth Grade:Grade:ATTENDANCE RATESATTENDANCE RATES
(Percents Based on Total No. Days Registered at Perkins)(Percents Based on Total No. Days Registered at Perkins)
89.77 90.36
95.92
50
60
70
80
90
100
Low Medium High
Mea
n Pe
rcen
tage
s
Sustained Group
Significantly higher at p<.01

20052005--2006 82006 8thth Grade:Grade:NOTNOT TARDY RATESTARDY RATES
(Percents Based on Total No. Days Registered at Perkins)(Percents Based on Total No. Days Registered at Perkins)
94.25 94.06
96.65
50
60
70
80
90
100
Low Medium High
Mea
n Pe
rcen
tage
s
Sustained Group
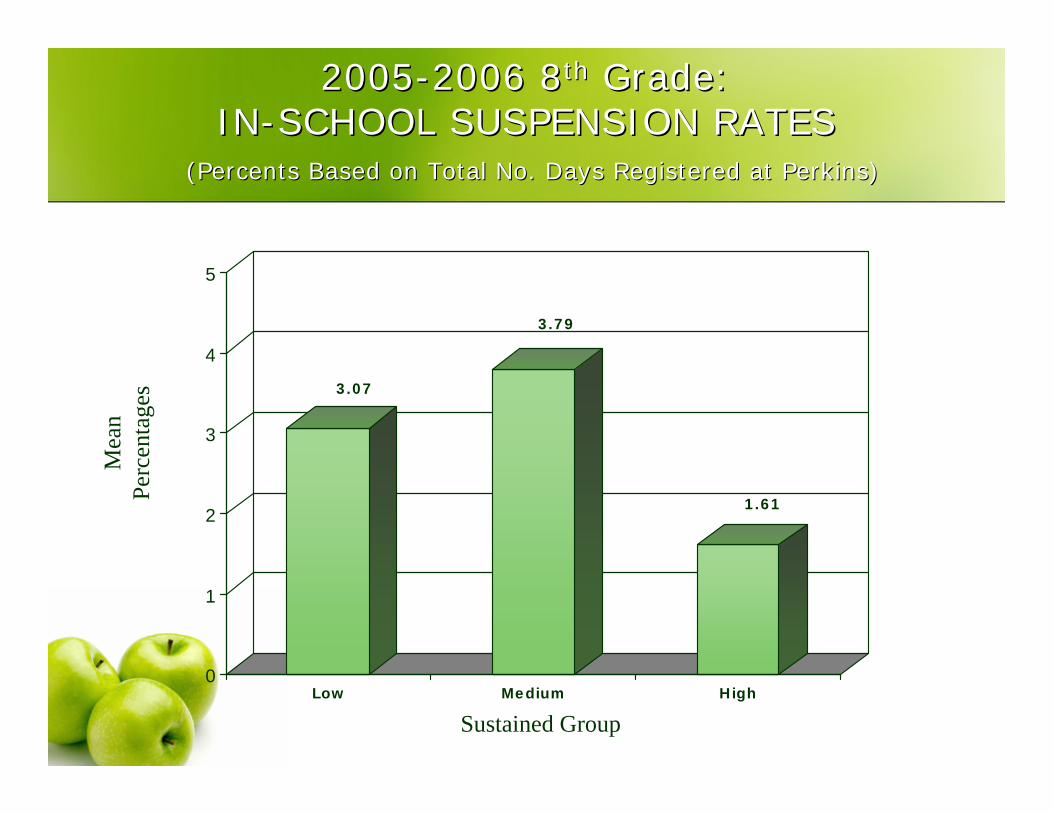
20052005--2006 82006 8thth Grade: Grade: ININ--SCHOOL SUSPENSION RATESSCHOOL SUSPENSION RATES
(Percents Based on Total No. Days Registered at Perkins)(Percents Based on Total No. Days Registered at Perkins)
3.07
3.79
1.61
0
1
2
3
4
5
Low Medium High
Mea
n Pe
rcen
tage
s
Sustained Group

20052005--2006 82006 8thth Grade: Grade: OUTOUT--OFOF--SCHOOL SUSPENSION RATESSCHOOL SUSPENSION RATES
(Percents Based on Total No. Days Registered at Perkins)(Percents Based on Total No. Days Registered at Perkins)
1.141.34
0.37
0
1
2
3
4
5
Low Medium High
Mea
n Pe
rcen
tage
s
Sustained Group
Significantly lower at p<.10

SUMMARY OF AVERAGE SUMMARY OF AVERAGE ACHIEVEMENT TEST SCORESACHIEVEMENT TEST SCORES
401.29406.86397.41405.32HIGH
403.15404.20392.22394.96MEDIUM
394.95398.01385.55395.78LOW
MathReadingMathReading
8TH GRADE7TH GRADESustained
Group

SUMMARY OF PERCENT PASSING SUMMARY OF PERCENT PASSING ACHIEVEMENT TESTSACHIEVEMENT TESTS
50.064.347.060.6HIGH
55.050.029.655.6MEDIUM
40.445.729.145.5LOW
MathReadingMathReading
8TH GRADE7TH GRADESustained
Group

SUMMARY: ATTENDANCE AND DISCIPLINE SUMMARY: ATTENDANCE AND DISCIPLINE RATES FOR SUSTAINED GROUPSRATES FOR SUSTAINED GROUPS
(All values are average percents, based on days registered at Pe(All values are average percents, based on days registered at Perkins)rkins)
OSS
ISS
Not Tardy
Attendance
Rates
0.371.341.140.851.401.57
1.613.793.072.622.463.60
96.6594.0694.2595.4794.7491.72
95.9290.3689.7793.0688.0488.16
HighMediumLowHighMediumLow
GRADE 8GRADE 7
ISS: In-School Suspensions. OSS: Out-of-School Suspensions.

HIGHLIGHTSHIGHLIGHTSTracking Reading Growth: SCANTRONTracking Reading Growth: SCANTRON
2005-2006 7th GradersAll sustained groups showed growth over time from fall 2005 through winter 2006.The “High” sustained group was above the Scantron national median score in winter, 2005, as well as both fall and winter, 2006.The “Medium” sustained group was above the Scantron national median score in winter, 2006.
HIGHLIGHTSHIGHLIGHTSTracking Math Growth: SCANTRONTracking Math Growth: SCANTRON
2005-2006 7th GradersAll sustained groups showed growth over the two years from fall 2005 through spring 2006.The “High” sustained group showed the greatest rate of growth.The “High” sustained group was above the national median score in winter 2005, winter 2006, and spring 2006.Neither of the other sustained groups was above the national median.
2005-2006 8th GradersEighth graders were tested across a one-year period, from winter 2005 to winter 2006.All sustained groups showed growth, but the “Medium Sustained” group showed the highest rate of growth.Of all the Scantron tracking, the smallest growth was demonstrated in math for 2005-2006 8th graders.No groups were above the national median in any test period.

HIGHLIGHTSHIGHLIGHTSOhio Achievement Test: ReadingOhio Achievement Test: Reading
2005-2006 7th GradersThe “High” sustained group had, on average, substantially higher OAT reading scores than either the “Medium” or “Low”sustained groups.In terms of percent passing the OAT reading test, both the “High” and “Medium” sustained groups were substantially higher than the “Low” sustained group.The “High” sustained group had the significantly highest percentage of students passing the 2006 7th grade reading OAT.
2005-2006 8th GradersThe “High” sustained group had the highest reading OAT scores, with the “Medium” sustained group having the next highest.The “Low” sustained group had, on average, substantially the lowest reading scores.In terms of percent passing the OAT reading test, the “High”sustained group had a substantially higher percentage than either of the other two groups, and the “Medium” group had a higher percentage passing than did the “Low” group.

HIGHLIGHTSHIGHLIGHTSOhio Achievement Test: MathOhio Achievement Test: Math
2005-2006 7th GradersThe “High” sustained group had, on average, the significantly highest OAT math scores compared to the “Medium” or “Low”sustained groups. In addition, the “Medium” sustained group (as well as the “High” group) was substantially higher than the “Low” sustained group on their math OAT scores.In terms of percent passing the 7th grade OAT math test, the “High” sustained group was substantially and significantly higher than the other two groups.
2005-2006 8th GradersThe “Medium” sustained group had slightly higher math OAT scores than did the “High” sustained group, but both groups were substantially higher than the “Low” sustained group.In terms of percent passing the OAT math test, the “Medium”sustained group had the highest percentage passing, but the “High” sustained group had a nearly 10% higher pass rate than the “Low” sustained group.

HIGHLIGHTSHIGHLIGHTSAttendanceAttendance
2005-2006 7th GradersThe “High” sustained group had the significantly highest rate of attendance. The “Medium” and “Low” sustained groups both had attendance rates below 90%.In terms of “Not Tardy,” the “High” sustained group had the highest percentage of students who were not tardy (excused and unexcused combined). They were slightly higher than the “Medium” sustained group.The “Low” sustained group had the lowest rate of “not tardy,”indicating that they had the highest amount of combined excused and unexcused tardies.
2005-2006 8th GradersThe “High” sustained group had a significantly and substantially higher rate of attendance than either of the other two groups, with an attendance rate of over 96%.In terms of “Not Tardy,” the “High” sustained group had the highest rate of no tardies (indicating the fewest tardies), but all groups demonstrated good “no tardy” rates.

HIGHLIGHTSHIGHLIGHTSBehaviorBehavior
2005-2006 7th GradersThe “Medium” sustained group had the smallest rate of in-school suspensions, but just slightly less than the “High” sustained group. The “Low” sustained group had the highest rate of in-school suspensions.The “High” sustained group also had the smallest rate of out-of-school suspensions, with the “Medium” sustained group having the next smallest rate. The “Low” sustained group had the highest rate of out-of-school suspensions.
2005-2006 8th GradersThe “High” sustained group had a substantially lower rate of in-school suspensions than either of the other two groups.In addition, the “High” sustained group had the substantially lowest rate of out-of-school suspensions .

CONCLUSIONSCONCLUSIONS
The results indicate that in almost every area, students who attended PAC programs frequently over a two-year period had higher reading and math achievement scores and passing rates, better attendance, and better behavior. This was especially true for 7th graders, indicating the importance of students beginning the PAC program early in their middle school career.