dot&e reliability course - institute for defense analyses€¦ · estimation of the reliability...
TRANSCRIPT

IDA Document NS D-5836
June 2016
DOT&E Reliability Course
Matthew AveryJonathan Bell
Rebecca DickinsonLaura Freeman
Log: H 16-000799
I N S T I T U T E F O R D E F E N S E A N A L Y S E S
INSTITUTE FOR DEFENSE ANALYSES4850 Mark Center Drive
Alexandria, Virginia 22311-1882
Approved for public release.

The Institute for Defense Analyses is a non-profit corporation that operates three federally funded research and development centers to provide objective analyses of national security issues, particularly those requiring scientific and technical expertise, and conduct related research on other national challenges.
About This PublicationThis reliability course provides information to assist DOT&E action officers in their review and assessment of system reliability. Course briefings cover reliability planning and analysis activities that span the acquisition life cycle. Each briefing discusses review criteria relevant to DOT&E action officers based on DoD policies and lessons learned from previous oversight efforts.
Copyright Notice© 2016 Institute for Defense Analyses4850 Mark Center Drive, Alexandria, Virginia 22311-1882 • (703) 845-2000.
This material may be reproduced by or for the U.S. Government pursuant to the copyright license under the clause at DFARS 252.227-7013 (a)(16) [Jun 2013].

DOT&E Reliability Course
Matthew AveryJonathan Bell
Rebecca DickinsonLaura Freeman
I N S T I T U T E F O R D E F E N S E A N A L Y S E S
IDA Document NS D-5836


i
Executive Summary
This reliability course provides information to assist DOT&E action officers in their review and assessment of system reliability, focusing on review criteria relevant to the DOT&E action officers based on DoD policies and lessons learned from previous oversight efforts. The course consists of seven briefings that cover reliability planning and analysis activities that span the acquisition life cycle, including:
An introduction that provides an overview of the course and motivation for improving system reliability.
A Reliability, Availability, Maintainability (RAM) Requirements Review briefing that highlights the importance of reviewing RAM requirements early in the program’s lifecycle and the criteria that should be considered during the review process.
An overview of the importance and process of reliability growth planning, focusing on information essential to support review of Test and Evaluation Master Plans (TEMP) and test plans. The briefing also describes how to use typical reliability planning growth models.
A briefing on the importance of design reviews in the Reliability Growth Planning process that focuses on the relevant questions to consider during design reviews.
Detail on how programs should document their reliability growth plan in the TEMP including a discussion on criteria that should be considered during the review process and how to assess the adequacy of an OT to evaluate reliability.
A briefing that focuses on analysis of reliability in Developmental Testing (DT) that provides an overview of DT activities that are essential to support reliability assessment and tracking and explains how to determine if the proposed DT will be adequate.
Detail on how to analyze RAM data for DOT&E reports using common methods such as development of confidence bounds, analysis of censored data, comparison to legacy systems, estimation of the reliability growth potential, and subsystem failure analysis.


7/7/2016-1
DOT&E Reliability Course
Catherine WarnerMatthew AveryJonathan Bell
Rebecca DickinsonLaura Freeman
2 June 2016

7/7/2016-2
Course Objective and Overview
Objective
• Provide information to assist DOT&E action officers in their review and assessment of system reliability.
Overview and Agenda
• Course briefings cover reliability planning and analysis activities that span the acquisition life cycle. Each briefing discusses review criteria relevant to DOT&E action officers based on DoD policies and lessons learned from previous oversight efforts
Time Topic Presenter0900 – 0920 Course Introduction Catherine Warner0920 – 1000 RAM Requirements Review Matthew Avery1000 – 1045 Reliability Growth Planning
Jonathan Bell1045 – 1100 Break
1100 – 1145 Importance of Design Reviews in the Reliability Growth Planning Process
1145 – 1245 Lunch Break1245 – 1330 TEMP Review and OT Planning Rebecca Dickinson1330 – 1400 Analysis of Reliability in DT Rebecca Dickinson1400 – 1415 Break1415 – 1530 Analysis of RAM data for LRIP/BLRIP reports Matthew Avery
7/7/2016-3
Motivation for Improving System Reliability
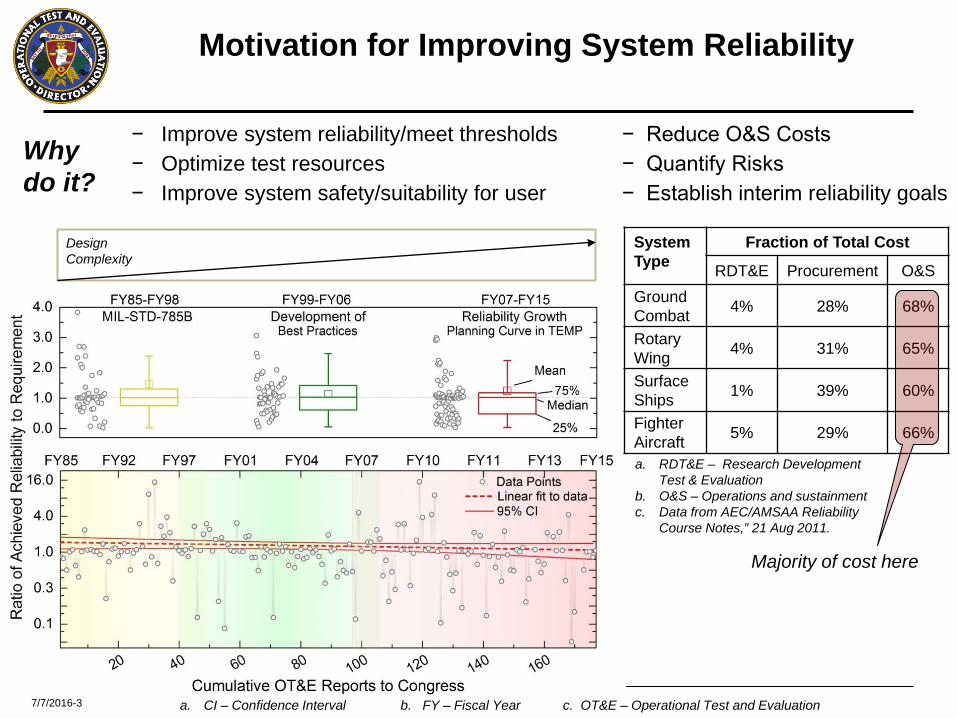
− Improve system reliability/meet thresholds − Reduce O&S Costs− Optimize test resources − Quantify Risks− Improve system safety/suitability for user − Establish interim reliability goals
System Type
Fraction of Total Cost
RDT&E Procurement O&SGround Combat 4% 28% 68%
Rotary Wing 4% 31% 65%
Surface Ships 1% 39% 60%
Fighter Aircraft 5% 29% 66%
Majority of cost here
a. RDT&E – Research Development Test & Evaluation
b. O&S – Operations and sustainmentc. Data from AEC/AMSAA Reliability
Course Notes,” 21 Aug 2011.
a. CI – Confidence Interval b. FY – Fiscal Year c. OT&E – Operational Test and Evaluation
Why do it?
DesignComplexity

7/7/2016-4
Reliability must be designed into the product from the beginning.
Design for Reliability (DfR)
• Understand user requirements and constraints
• Design and redesign for reliability
• Produce reliable systems
• Monitor and assess user reliability
A common problem failure: to reach desired initial system reliability indicating failure in the design phase to engineer reliability into the system.
7/7/2016-4

7/7/2016-5
Evaluation of Test Adequacy for Assessing Reliability
1 3 60%
10%
20%
30%
40%
50%
60%
70%
80%
90%
100%
10 20 30 40 50 60
Cum
ulat
ive
Perc
ent o
f Met
rics
(201
3-20
14 A
sses
smen
t)
Operational Test Length/Actual Requirement
27%
15%
17%
32%
10%
Design Margin=1.4(80% power/50% confidence) Can reasonably
demonstrate reliability with 80% power/80% confidence
Can reasonably demonstrate reliability with 80% power and between 50% and 80% confidence
Test length shorter than requirement
Satisfies previous rule of thumb
Does not satisfy previous rule of thumb
Design Margin=1.4(80% power/80% confidence)
Various methods are being used to develop adequate reliability test lengths

7/7/2016-6
TEMP Guidebook 3.0 Reliability Updates
Reliability Growth Guidance
• Relatively unchanged from TEMP Guidebook 2.1
Reliability Test Planning Guidance
• New section of the TEMP Guidebook
• Emphases the use of operating characteristic curves for planning operational tests
• Provides guidance on using data collected outside of an operational test for reliability assessments
7/7/2016-7
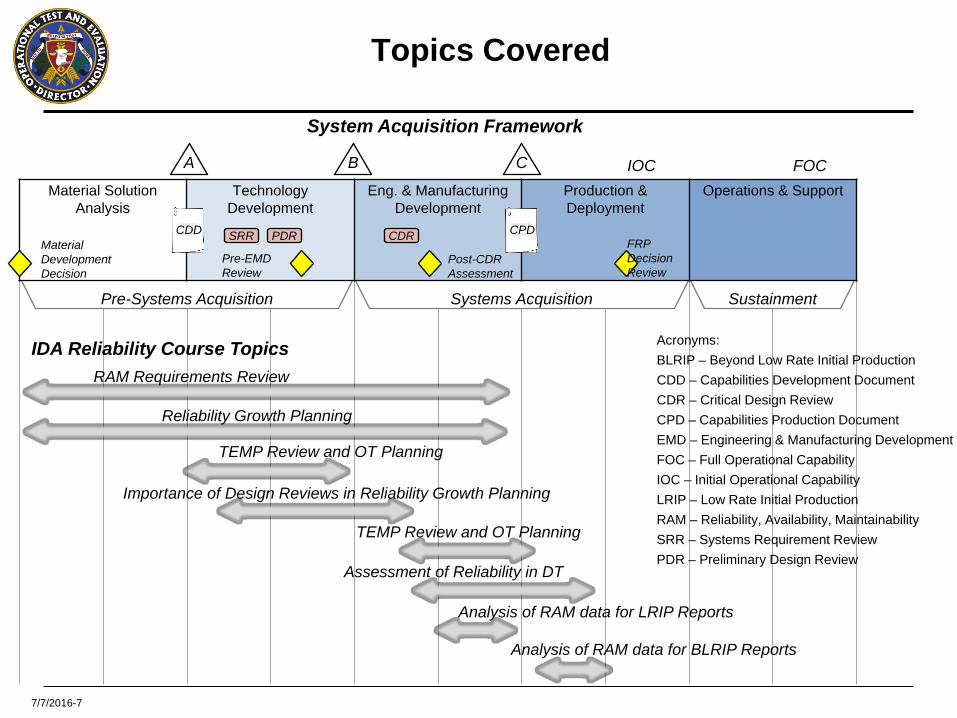
Systems Acquisition SustainmentPre-Systems Acquisition
Material Solution Analysis
TechnologyDevelopment
Eng. & Manufacturing Development
Production & Deployment
Operations & Support
A B C IOC FOC
Material Development Decision
Post-CDRAssessment
Pre-EMDReview
FRPDecision Review
System Acquisition Framework
SRR PDR CDRCDD CPD
IDA Reliability Course TopicsRAM Requirements Review
Reliability Growth Planning
Assessment of Reliability in DT
Importance of Design Reviews in Reliability Growth Planning
TEMP Review and OT Planning
TEMP Review and OT Planning
Analysis of RAM data for BLRIP Reports
Analysis of RAM data for LRIP Reports
Topics Covered
Acronyms:BLRIP – Beyond Low Rate Initial ProductionCDD – Capabilities Development DocumentCDR – Critical Design ReviewCPD – Capabilities Production DocumentEMD – Engineering & Manufacturing DevelopmentFOC – Full Operational CapabilityIOC – Initial Operational CapabilityLRIP – Low Rate Initial ProductionRAM – Reliability, Availability, MaintainabilitySRR – Systems Requirement ReviewPDR – Preliminary Design Review

7/7/2016-8
Topic Briefing Purpose/Objectives
Reliability, Availability, Maintainability (RAM) Requirements Review
• Highlight the importance of reviewing RAM requirements early in the program’s lifecycle
• Discuss criteria that should be considered during the review process
Reliability Growth Planning
• Provide an overview of the importance and process of reliability growth planning, focusing on information essential to support review of TEMPs and test plans
• Demonstrate how to use the Projection Methodology (PM2) and Crow Extended reliability growth models
Importance of Design Reviews in the Reliability Growth Planning Process
• Highlight the importance of design reviews in the Reliability Growth Planning process, and identify the relevant questions to consider during design reviews
• Provide programmatic examples of this process.
TEMP Review and Operational Test (OT) Planning
• Using examples, discuss how programs should document their reliability growth plan in the TEMP
• Discuss criteria that should be considered during the review process• Describe how to assess the adequacy of an OT to evaluate reliability
Analysis of Reliability in Developmental Testing (DT)
• Explain how to determine if the proposed DT will be adequate to growth reliability• Provide an overview of DT activities that are essential to support reliability
assessment and tracking
Analysis of RAM data for LRIP/BLRIP reports
• Discuss common methods for analyzing OT RAM data including development of confidence bounds, analysis of censored data, comparison to baseline/legacy, estimation of the reliability growth potential, subsystem failure analysis, etc.
Software Reliability • Describe how the procedures for reliability growth planning and evaluation of software systems differ compared to hardware-based systems
Topics Covered (cont.)

7/7/2016-1
Reliability, Availability, Maintainability (RAM)Requirements Review
Institute for Defense Analyses4850 Mark Center Drive • Alexandria, Virginia 22311-1882
Matthew AveryLaura Freeman
12 November 2015

7/7/2016-2
Reliability in the DoD Context
• Operational mission reliability – Most complex defense systems serve more than one required
function (e.g., ships may provide transportation, defense, self-protection, etc.)
– Multiple operating environments: desert, littoral, mountain, etc.– Operating conditions vary depending on mission– Requirements typically specify a fixed time period
• An additional consideration in operational mission reliability– Diverse population of system operators: crew-caused failures are still
failures.
• Concept of operations / Design reference mission – Essential for defining operational mission reliability
– Defines standard mission length– Provides a breakdown the expected activities during a mission– Can change over time as operational missions evolve
Reliability : the ability of an item to perform a required function, under given environmental and operating conditions and for a stated period of time
(ISO 8402, International Standard: Quality Vocabulary, 1986)

7/7/2016-3
Scoring the Severity of a Failure
• Operational Mission Failure (OMF) or System Abort (SA): failure discovered during mission execution that result in an abort or termination of a mission in progress
» Reliability requirements are typically written in terms of OMFs or Sas.
• Essential Function Failures (EFF) or Essential Maintenance Action (EMA): failures of mission essential components. By definition all OMFs are EFFs
» EFFs include a large portion of the failure modes that drive maintenance costs and reduce system availability
• Comparing EFFs and OMFs » Engine: temporary power failure vs. not starting at all » Steering: excessive pulling in one direction vs. vehicle rolling» Brakes: brake fluid leak/line worn vs. brake lock up

7/7/2016-4
Traditional Reliability Analysis
• A traditional reliability analysis models the mean time between operational mission failures (MTBOMF) as a constant value (constant failure rate)
– Exponential distribution– Failure mode is ignored– Only operational test data is
considered
• Reliability is calculated by:
�MMBOMF =Total Time
# of 𝐎𝐎𝐎𝐎𝐎𝐎 Failures
7/7/2016-5
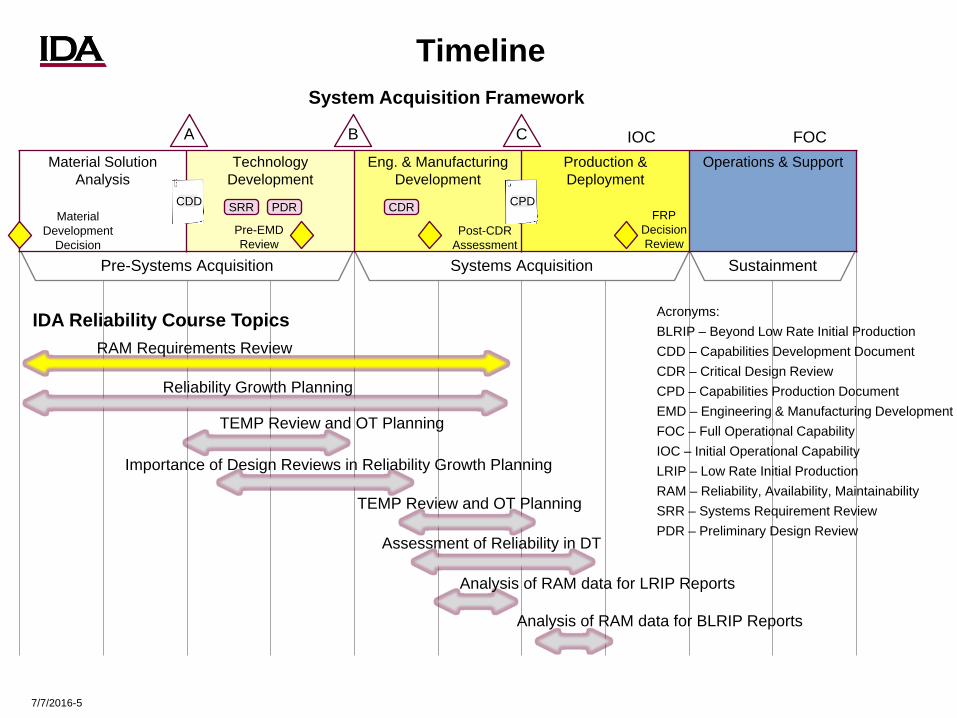
Timeline
Systems Acquisition SustainmentPre-Systems Acquisition
Material Solution Analysis
TechnologyDevelopment
Eng. & Manufacturing Development
Production & Deployment
Operations & Support
A B C IOC FOC
Material Development
DecisionPost-CDR
AssessmentPre-EMDReview
FRPDecision Review
System Acquisition Framework
SRR PDR CDRCDD CPD
IDA Reliability Course TopicsRAM Requirements Review
Reliability Growth Planning
Assessment of Reliability in DT
Importance of Design Reviews in Reliability Growth Planning
TEMP Review and OT Planning
TEMP Review and OT Planning
Analysis of RAM data for BLRIP Reports
Analysis of RAM data for LRIP Reports
Acronyms:BLRIP – Beyond Low Rate Initial ProductionCDD – Capabilities Development DocumentCDR – Critical Design ReviewCPD – Capabilities Production DocumentEMD – Engineering & Manufacturing DevelopmentFOC – Full Operational CapabilityIOC – Initial Operational CapabilityLRIP – Low Rate Initial ProductionRAM – Reliability, Availability, MaintainabilitySRR – Systems Requirement ReviewPDR – Preliminary Design Review

7/7/2016-6
Topics Covered
• Importance of reviewing Reliability, Availability, Maintainability (RAM) requirements early in the program’s lifecycle
• Criteria that should be considered when reviewing RAM requirements:
– What are your RAM requirements?» Reliability, Availability, Maintainability Requirements» By System Type (Single-Use, Repairable, One-off)
– Levels of Failure» Aborts or Operational Mission Failures» Failures or Essential Function Failures» Non Essential Function Failures
– Mission-Level Reliability– Requirements in the Mission Context– Achievability of Requirements– Assessing the Failure Definition Scoring Criteria (FDSC) and/or Joint
Reliability & Maintainability Evaluation Team (JRMET) documents

7/7/2016-7
Importance of Early Review of RAM requirements
• Requirements are generally established early in the program’s lifecycle– Before Milestone B for most programs
• The first step in acquiring reliable systems is ensuring that they have achievable, testable, and operationally meaningful reliability requirements
• All systems have requirements– Is this requirement operationally meaningful?– Is this requirement achievable?
» How reliable are similar systems that have already been fielded?» Is the requirement achievable given its reliability growth plan?
– Is the requirement testable?
• Requirements Rationale in TEMP– Starting at MS A– Reliability, maintainability, availability requirements should be addressed if not
adequately addressed in the requirements document– When requirements are provided for all three metrics, DOT&E AO’s should
review to ensure they are mathematically consistent

7/7/2016-8
Different Types of Systems
• Single-use systems– System is destroyed upon use– Missiles, rockets, MALD, etc.– Reliability is a simple probability (e.g., “Probability kill > 90%”)
• Repairable Systems– If the system breaks, it will be repaired and usage resumed– Tanks, vehicles, ships, aircraft, etc. – Reliability is typically time between events, i.e., failures, critical failures,
aborts, etc. » A howitzer must have a 75 percent probability of completing an 18-hour
mission without failure.» A howitzer mean time between failures must exceed 62.5 hours.
• One-off systems– Only a single (or very few) systems will be produced– Satellites, aircraft carriers, etc.– Like a repairable system, though often very few chances to improve
reliability once system has been produced– Often no assembly line leading to different reliability concerns

7/7/2016-9
Translating Reliability Requirements
• 90% probability of no Operational Mission Failure (OMF) over 24 hours
– Alternatively: Probability that time to failure > 24 hours is at least 90%
What is the average “Time to Failure”? What is the distribution of failure times?
– Based on exponential failure times:
𝑃𝑃 𝑇𝑇𝑓𝑓𝑓𝑓𝑓𝑓𝑓𝑓𝑓𝑓𝑓𝑓𝑓𝑓 > 24 = 0.9
→ 𝑀𝑀𝑇𝑇𝑀𝑀𝑀𝑀𝑀𝑀𝑀𝑀 ≥ − 24/log 0.9 = 228 ℎ𝑜𝑜𝑜𝑜𝑜𝑜𝑜𝑜
After review, CDD determined that a clarification of the Mean Time Between Operational Mission Failure (MTBOMF) Key system Attribute (KSA) is appropriate and is rewritten as follows: “Radar Program X shall have a MTBOMF that supports a 90% probability of successful completion of a 24 Hour operational period (Threshold), 90% probability of
successful completion of a 72 Hour operational period (Objective) to achieve the Operational Availability (Ao) of 90%”
Radar Program X’s Capabilities Development Document (CDD):

7/7/2016-10
Translating Requirements: A Point of Caution• Assumptions in translation
– Mean is an appropriate metric to describe the failure distribution– The failures are exponentially distributed and therefore the failure rate is
constant– No degradation (“wear-out”) over time
• Translation should be operationally meaningful
• Extremely high probability requirements can result in untestable/unrealistic mean duration requirements
Probability of Mission Completion / Mission Duration Mean Time Between Failure (MTBF)
99% (2-hour mission) 199 Hours
95% (2-hour mission) 39 Hours
95% (4-hour mission) 78 Hours

7/7/2016-11
Availability Requirements
“The UAS shall achieve an A0 of at least 80% at IOC [Initial Operational Capability].”
• Availability is a crucial measure of system performance and in many cases, is directly related to reliability
• Sometimes, reliability requirements are derived from availability requirements
– May need to make assumptions about repair times
80% availability given 1 hour MTTR MTBF= 4 hours:𝐴𝐴0 =
𝑀𝑀𝑇𝑇𝑀𝑀𝑀𝑀𝑀𝑀𝑇𝑇𝑀𝑀𝑀𝑀 + 𝑀𝑀𝑇𝑇𝑇𝑇𝑀𝑀
→ .8 =𝑀𝑀𝑇𝑇𝑀𝑀𝑀𝑀
𝑀𝑀𝑇𝑇𝑀𝑀𝑀𝑀 + 1→ 𝑀𝑀𝑇𝑇𝑀𝑀𝑀𝑀 = 4
– Should only use this approach if no other reliability requirements are provided
– Does not account for concurrent repairs
It is important to check for consistency between availability and reliability requirements!
MTTR – Mean Time To RepairUAS – Unmanned Aerial System

7/7/2016-12
Common Formulations of Availability
• Each service defines availability differently– See Memorandum of Agreement for different definitions and explanations
• Operational availability 𝐴𝐴𝑂𝑂 is the percentage of time that a system is available to perform its mission.
𝐴𝐴𝑂𝑂 =𝑈𝑈𝑈𝑈𝑈𝑈𝑈𝑈𝑈𝑈𝑈𝑈
𝑈𝑈𝑈𝑈𝑈𝑈𝑈𝑈𝑈𝑈𝑈𝑈 + 𝐷𝐷𝑜𝑜𝐷𝐷𝐷𝐷𝑈𝑈𝑈𝑈𝑈𝑈𝑈𝑈=
∑𝑈𝑈𝑈𝑈𝑈𝑈𝑈𝑈𝑈𝑈𝑈𝑈𝑓𝑓∑𝑈𝑈𝑈𝑈𝑈𝑈𝑈𝑈𝑈𝑈𝑈𝑈𝑓𝑓 + ∑𝐷𝐷𝑜𝑜𝐷𝐷𝐷𝐷𝑈𝑈𝑈𝑈𝑈𝑈𝑈𝑈𝑓𝑓
• 𝐴𝐴𝑂𝑂 is commonly computed: 𝐴𝐴0 = 𝑀𝑀𝑀𝑀𝑀𝑀𝑀𝑀𝑀𝑀𝑀𝑀𝑀𝑀𝑀𝑀+𝑀𝑀𝑀𝑀𝑀𝑀𝑀𝑀
• Confidence interval methods for 𝐴𝐴0 are equally valid for operational dependability 𝐷𝐷𝑂𝑂:
𝐷𝐷𝑂𝑂 =𝑀𝑀𝑇𝑇𝑀𝑀𝐶𝐶𝑀𝑀
𝑀𝑀𝑇𝑇𝑀𝑀𝐶𝐶𝑀𝑀 + 𝑀𝑀𝑇𝑇𝑇𝑇𝑀𝑀𝑀𝑀
• Alternative formulation of 𝑨𝑨𝑶𝑶:𝐴𝐴𝑂𝑂 =
𝑀𝑀𝑇𝑇 + 𝑆𝑆𝑇𝑇𝑀𝑀𝑇𝑇 + 𝑆𝑆𝑇𝑇 + 𝑇𝑇𝐶𝐶𝑀𝑀 + 𝑇𝑇𝑃𝑃𝑀𝑀 + 𝑇𝑇𝐴𝐴𝑇𝑇𝐷𝐷𝑇𝑇
MTBF- Mean Time Between FailureMTTR- Mean Time To RepairMTCBF- Mean Time Between Critical FailureMTTRF- Mean Time To Restore FunctionOT- Operating TimeST- Standby TimeTCM- Total Corrective MaintenanceTPM- Total Preventative MaintenanceTALDT- Total Administrative and Logistics Downtime

7/7/2016-13
Maintainability Requirements“The UAS equipment and hardware components shall have a Mean Time to Repair
(MTTR) for hardware of 1 hour.”
• Maintainability requirements often stated in terms of repair times (“mean time to repair” or “maximum time to repair”)
– Some systems don’t have specific values beyond being able to conduct field repairs
“The Light Armored Vehicle-Recovery (LAV-R) shall enable the maintenance team to conduct battle damage repair and recovery.”
• Sometimes stated in terms of maintenance ratio– “The Ground Combat Vehicle (GCV) will have a field level maintenance ratio
(MR) that includes scheduled, unscheduled, and condition-based maintenance not to exceed 0.13 (Threshold) / 0.05 (Objective) maintenance man-hours per operating hour (MMH/OH).”
• Median values and high percentile requirement can be more meaningful for systems with highly skewed repair times
– E.g., 90% of failures should be corrected within 5 hours– Or, the median repair for hardware should be 1 hour
Medians and percentiles are better maintainability requirements than means.
7/7/2016-14
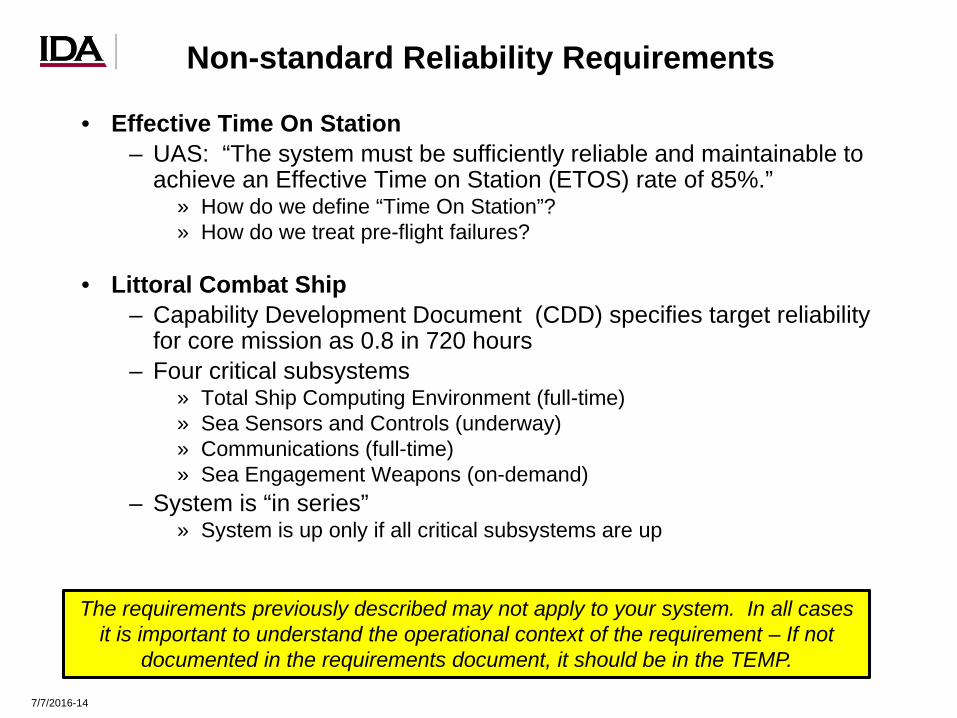
Non-standard Reliability Requirements
• Effective Time On Station– UAS: “The system must be sufficiently reliable and maintainable to
achieve an Effective Time on Station (ETOS) rate of 85%.”» How do we define “Time On Station”? » How do we treat pre-flight failures?
• Littoral Combat Ship– Capability Development Document (CDD) specifies target reliability
for core mission as 0.8 in 720 hours– Four critical subsystems
» Total Ship Computing Environment (full-time)» Sea Sensors and Controls (underway)» Communications (full-time)» Sea Engagement Weapons (on-demand)
– System is “in series”» System is up only if all critical subsystems are up
The requirements previously described may not apply to your system. In all cases it is important to understand the operational context of the requirement – If not
documented in the requirements document, it should be in the TEMP.
7/7/2016-15
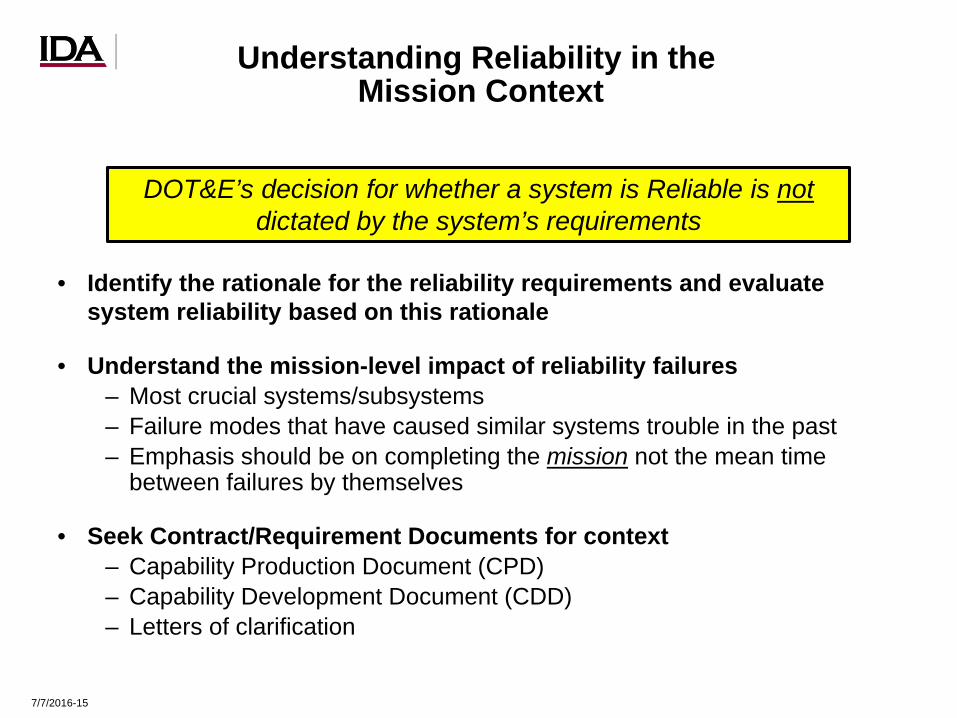
Understanding Reliability in the Mission Context
• Identify the rationale for the reliability requirements and evaluate system reliability based on this rationale
• Understand the mission-level impact of reliability failures– Most crucial systems/subsystems– Failure modes that have caused similar systems trouble in the past– Emphasis should be on completing the mission not the mean time
between failures by themselves
• Seek Contract/Requirement Documents for context– Capability Production Document (CPD)– Capability Development Document (CDD)– Letters of clarification
DOT&E’s decision for whether a system is Reliable is notdictated by the system’s requirements

7/7/2016-16
Achievability of Requirements
• Critical question: Are this system’s reliability requirements achievable? – Reliability for similar existing systems– Systems engineering plans
• When requirements are unreasonable, push for an update early– Unreasonable given existing technology– Unnecessary given mission– Untestable/unverifiable
» What is testable?
• What is on contract?– Typically, you will get what you pay for (or less!)– Identifying what is on contract will help you assess systems risk for achieving
reliability requirement
• Example of a high-risk reliability requirement:– Early in the development of a tactical vehicle, the reliability requirement was
set at 6,600 miles Mean Miles Between Operational Mission Failures (MMBOMF)
– The legacy system being replaced achieved a reliability of ~1,200 miles MMBOMF
– The tactical vehicle program eventually reduced the requirement to 2,400 miles MMBOMF

7/7/2016-17
Scoring Reliability Testing
• Failure Definition Scoring Criteria (FDSC)– Master document describing failure modes and criteria for
determining the level of a failure– Areas of concern/confusion should be addressed as early as
possible and prior to testing
• Joint Reliability and Maintainability Evaluation Team (JRMET) and Scoring Conferences
– May include representatives from Program Manager, Operational Test Agencies, and DOT&E
– Events are scored by the JRMET at scoring conferences– Determine if a Test Incident Report is a failure and if so, how
sever of a failure– Without a clearly discussed FDSC, reaching agreements may
be difficult
Disagreements about reliability scoring criteria should be discussed prior to the start of testing

7/7/2016-18
Failure Definition Scoring Criteria• The Failure Definition/Scoring Criteria (FDSC) is essential for defining
failure, and scoring test results
• Failure Definitions– Defines mission essential functions – minimum operational tasks the system
must perform to accomplish assigned mission» E.g., Maintain constant communications for a command and control system
• Scoring Criteria– Provides classification criteria that will be consistent across all phases of
testing» System Abort/ Operational Mission Failure» Essential Function Failure/ Essential Maintenance Action» Non Essential Function Failure/ Unscheduled Maintenance Action» “No Test”
– Rates Hazard/Severity of the failure or incident– Specifies chargeability of the failure
» Hardware, software» Operator error» Government furnished equipment (GFE)
DOT&E requires independent scoring of reliability failures – FDSCshould provide guidance only! – 05 October 2012 Guidance Memo

7/7/2016-19
Value of Lower Level Reliability Requirements
• Examples of lower level reliability requirements– Essential Function Failures (EFFs)– Unscheduled Maintenance Actions (UMAs)
• Focus on maintenance burden of the system/system availability/logistical supportability of system/ensuring full mission capability
• More useful for measuring and tracking reliability growth
• More accurate estimates of system reliability
Action Officers should encourage the use of lower level reliability requirements for systems with extremely high mission level
requirements and/or systems with built-in redundancy.

7/7/2016-20
Example Program:UAS Reliability Requirements
• System of systems– Modern systems are often complex and involve multiple
subsystems– UAS includes 5 Air Vehicle, STUAS Recovery System,
Launcher, and four Operator Work Stations – Government-Furnished Equipment (GFE) & Commercial Off-
The-Shelf (COTS)
UAS –Unmanned Aircraft System
Notional System Configuration

7/7/2016-21
Example Program:UAS Reliability Requirements
• Air Vehicle reliability: MFHBA > 60 hours– Five air vehicles in the system
• Surface Components reliability: MTBA > 240 hours– Launcher, Recovery System, Ground Control Station, etc.– Applies to both Land- and Ship-based configuration, though
each configuration evaluated separately
• Overall System Reliability: MFHBA > 50 hours
• Operational Availability > 80%– Requires Recovery System, Launcher, at least 2 Air Vehicles,
and at least two Operator Work Stations
Requirements include by subcomponent-level reliability and system-of-systems level reliability.
MFHBA – Mean Flight Hours Between AbortMTBA – Mean Time Between Abort

7/7/2016-22
Evaluating UAS Reliability Requirements
• Are the requirements achievable? – Other small Unmanned Aerial Vehicles (UAV) have achieved ~20
hours MFHBA
• What is the impact of reliability in the mission context?– 5 air vehicles in the system means considerable redundancy
» Pre-flight aborts to Air Vehicle (AV) may not impact system’s ability to provide Intelligence, Surveillance, and Reconnaissance
– Single points of failure for launcher and recovery system» High reliability necessary for these systems
• Avoid situational scoring
Question: “Once the air vehicle is off station and RTB, do critical failures (e.g., AV crashes) count against MFHBA?”
Answer: YES!!!
– Reliability calculations & reliability growth modeling assume constant failure no situational scoring!MFHBA – Mean Flight Hours Between AbortRTB – Return To Base

7/7/2016-23
Recommendations for AOs
• Ensure reliability requirements are:– Operationally meaningful – understand translations between
mission completion– Testable– Achievable
• Encourage the use of two-level reliability requirements– Operational mission failures and essential function failures matter
• Ensure consistency for reliability, maintainability, and availability requirements
• Participate in FDSC development
• Remember all failures count (GFE/Operator) and DOT&E scores independently
– Failure means system is not available
• Avoid situational scoring

7/7/2016-24
Backup

7/7/2016-25
Reliability Requirements
• Testing the above is difficult as stated– Would need to conduct many OMS/MP-sized missions to assess
77% success probability
• Alternative framing– “The Amphibious Vehicle shall have a Mean Time Between
System Abort (MTBSA) of at least 69 hours”» Based on an 18-hour OMS/MP
– Based on success probability and length of OMS/MP (or “mission” or “flight”)
– Easier to estimate MTBSA – Can translate MTBSA estimates back into “Probability of
completing X-hour mission without failure”» Useful for missions of variable length
“The Amphibious Vehicle shall have a 0.77 probability of completing any single one of the scenarios described in the OMS/MP”
OMS/MP - Operational Mode Summary/Mission Profile

7/7/2016-26
Impact of Requirements on Future Testing
• Will the requirements be testable as written?– Ground Terminal Mean Time Between Critical Failure
(MTBCF)» Ground Fixed: 1150 hours » Ground Transportable: 700 hours
• Very high requirements necessitate very long tests– One month’s time: 720 hours– Three-failure test: 4300 hours
Some programs have especially high reliability requirements. In these cases, careful consideration must be given early on
to the best approach to assess reliability.

Reliability Growth Planning
Jonathan L. Bell2 June 2016
Institute for Defense Analyses4850 Mark Center Drive • Alexandria, Virginia 22311-1882


7/7/2016-1
Timeline
Systems Acquisition SustainmentPre-Systems Acquisition
Material Solution Analysis
TechnologyDevelopment
Eng. & Manufacturing Development
Production & Deployment
Operations & Support
A B C IOC FOC
Material Development
DecisionPost-CDR
AssessmentPre-EMDReview
FRPDecision Review
System Acquisition Framework
SRR PDR CDRCDD CPD
IDA Reliability Course TopicsRAM Requirements Review
Reliability Growth Planning
Assessment of Reliability in DT
Importance of Design Reviews in Reliability Growth Planning
TEMP Review and OT Planning
TEMP Review and OT Planning
Analysis of RAM data for BLRIP Reports
Analysis of RAM data for LRIP Reports
Acronyms:BLRIP – Beyond Low Rate Initial ProductionCDD – Capabilities Development DocumentCDR – Critical Design ReviewCPD – Capabilities Production DocumentEMD – Engineering & Manufacturing DevelopmentFOC – Full Operational CapabilityIOC – Initial Operational CapabilityLRIP – Low Rate Initial ProductionRAM – Reliability, Availability, MaintainabilitySRR – Systems Requirement ReviewPDR – Preliminary Design Review

7/7/2016-2
Purpose of Briefing
• Provide an overview that describes the importance and process of reliability growth planning, focusing on information essential to review of TEMPs and test plans
• Demonstrate how to use common reliability growth planning models
− Planning Model Based on the Projection Methodology (PM2)
− Crow Extended Reliability Growth Planning Models

7/7/2016-3
Reliability Growth Planning Overview
• Reliability Growth− The process of eliminating initial design or manufacturing weaknesses in a
system via failure mode discovery, analysis, and effective correction
• Reliability Growth Planning is a structured process that is intended to occur early in the acquisition cycle
MS A MS B MS C FRPTD EMD P&D
Growth Planning Tracking/Projection
EMD – Engineering and Manufacturing Development FRP – Full-Rate Production MS – MilestoneP&D – Production and Deployment TD – Technology DevelopmentAcronyms:

7/7/2016-4
Motivation for Reliability Growth Planning
− Improve system reliability/meet thresholds − Reduce O&S Costs− Optimize test resources − Quantify Risks− Improve system safety/suitability for user − Establish interim reliability goals
System Type
Fraction of Total Cost
RDT&E Procurement O&SGround Combat 4% 28% 68%
Rotary Wing 4% 31% 65%
Surface Ships 1% 39% 60%
Fighter Aircraft 5% 29% 66%
Majority of cost here
a. RDT&E – Research Development Test & Evaluation
b. O&S – Operations and sustainmentc. Data from AEC/AMSAA Reliability
Course Notes,” 21 Aug 2011.
a. CI – Confidence Interval b. FY – Fiscal Year c. OT&E – Operational Test and Evaluation
Why do it?
DesignComplexity
*Between 2000 and 2014, 22% of systems were found not reliable in IOT&E as result of failure modes attributed primarily to Software faults.
*

7/7/2016-5
• Systems are inservice for a longtime, which drivesup Operations andSustainment costsa
a. “Improving Reliability,” Presentation to IDA by Dr. Ernest Seglie, 17 March 2009.
b. HEMTT – Heavy Expanded Mobility Tactical Truck
Motivation for Reliability Growth Planning (cont.)
1940 1950 1960 1970 1980 1990 2000 2010 2020 2030 2040
94 yrsB-5267 yrs2.5 Ton Truck93 yrsC-130
UH-1 69 yrsM-113 59 yrs
72 yrsAIM-9
56 yrsSSN 688
36 yrsF-14
71 yrsCH-47
44 yrsHEMTTb
51 yrsF-15
86 yrsKC-135
• It’s Developmental Test and Evaluation’s (DT&E) job, why should I do it?− Some DOT&E oversight programs are not on DT&E oversight
− Reliability growth planning is linked to entire acquisition cycle, including OT events Part of reliability growth planning is ensuring that there is adequate testing/resources to evaluate
reliability during OT Data from a Limited User Test (LUT) or Operational Assessment (OA) is often analyzed to
determine if system reliability is consistent with the reliability growth curve Data from the Initial Operational Test and Evaluation (IOT&E) is often analyzed to prove whether
system meets reliability requirements The reliability growth contractual goal often depends on the length of the IOT&E

7/7/2016-6
Reliability Growth Planning: DOT&E TEMP Guidebook 3.0
• Includes additional specific guidance for different system types− Software-intensive systems characterized by built-in redundancies that result in high
reliability for the hardware (or hardware is not a component of the system), leaving the software reliability as the limiting factor (safety critical systems, automated information systems, and some space systems).
− Hardware-only systems, which contain no software (bullets, personal protective equipment)
− Hybrid systems containing a combination of software, hardware, and human interfaces. Critical functionality is a combination of hardware and software subsystems (complicated ground combat vehicles, aircraft, and ships) interfaces
• For software-only systems, recommends:− Addressing reliability growth by providing a reliability growth planning curve or a
reliability growth tracking curve− Using the Crow-Extended Planning Model or the Planning Model based on
Projection Methodology (PM2), if appropriate
• For hardware-only and hybrid systems, recommends :− Developing reliability growth planning curves using PM2 Model or Crow-Extended
Planning Model*
*PM2 and Crow Extended models encourage more realistic inputs that are based on the systems engineering and design process.

7/7/2016-7
Adequate requirements c
Elements of a Well-Run Reliability Growth Program
c
Realistic ReliabilityGrowth (RG) Curve
• Based on funding
• System-level valuesachieved before fielding
• Contract Spec• Interim thresholds• Entrance/Exit criteria• Appropriate DT metric
Dedicated Test Events for Reliability
Reliability Analyses
Data collection, reporting,and tracking
Adequate Requirements
• Independent DT/OT data collection
• Scoring/assessment conferences
• Root cause analysis
Corrective Actions
• Failure Definition Scoring Criteria• Failure Reporting and Corrective Action System• Failure Review Board• Field Data• Reliability, Maintainability, Availability Working Group
• Funding and time allottedwith commitment from the management
• Failure Mode Effects and Criticality Analysis
• Level of Repair• Reliability
Predictions
• Component Design for Reliability
• Built-In-Test Demonstration
Reliability GrowthModel is the “tip of the iceberg”
• Operational Testing
• Accelerated Life Testing
• Logistics Demo• Integration Testing
• Realistic assumptions

7/7/2016-8
Reliability Growth (RG) Planning Processa
UnderstandPolicies
Understand System and Requirements
Understand Contractor Reliability and Engineering Practices
Determine FinalReliability Target
• FMEA• HALT• Reliability
Prediction• Design Reviews
• DfR• FRB
Reliability Requirement
Producer Risk
IOT Resource
NeedsDT/OT
Derating
Consumer Risk
00.10.20.30.40.50.60.70.80.9
1
0 200 400 600 800 1000 1200 1400
Prob
abili
ty o
f Acc
epta
nce
True MTBF (miles)
1,015-mile test, 1 failures permitted1,451-mile test, 2 failures permitted1,870-mile test, 3 failures permitted2,278-mile test, 4 failures permitted2,680-mile test, 5 failures permitted4,628-mile test, 10 failures permitted12,056-mile test, 30 failures permittedProbability of Acceptance LevelMTBF Requirement
Operating Characteristic Curve Analysis
Determine RG Parameters
Identify Resource Needs
Mea
n Ti
me
Betw
een
Failu
re (M
TBF)
Test Time
Reliability Growth Potential
Initial Reliability
• Fix Effectiveness
• ManagementStrategy
DoD 5000.02
DOT&EDTM 11-003
ServicePolicies
Requirements
OMS/MPScoringCriteria
ContractSpecs
Number ofAssets and
Configuration
MTB
F
Interim ReliabilityTargets
CorrectiveAction
Periods
MTB
F
TestSchedule/Duration
0 1 2 3 4 5
Phase 4Phase 3Phase 2Phase 1
Assess Risk and Effectiveness of Growth Plan Finalize ReliabilityGrowth Plan
Rate of New B-modes
Fraction Surfaced
Expected B-modes
MTB
F
Ratio of DT Goaland Growth Potential
• Producer Risk• Consumer Risk• Number/length of test phases• Management Strategy• Fix Effectiveness Factors
a. Figure adapted from ATEC Presentation on RG Planning, Joint Service RAM WG Meeting, SURVICE Engineering, Aberdeen, MD, 10-13 Jan 2011
DfR – Design for ReliabilityFMEA - Failure Mode Effects AnalysisFRB – Failure Review BoardHALT – High Accelerated Life Testing

7/7/2016-9
Reliability Growth (RG) Planning Process (cont.)
• Reliability Growth Planning for Software Intensive Systems − Follows a similar process as planning for hybrid and hardware-only systems:
Requires robust systems engineering support, dedicated testing, adequate funding and schedule time, reasonable requirements, scoring criteria, data collection and reporting, meetings to assess and score data, etc.
Ideally, should have an OT of sufficient length to demonstrate compliance with requirement Can be described using Non-Homogeneous Poisson Process (NHPP) models in the relation
to time (e.g., the AMSAA PM2 and Crow Extended Models) due to their simplicity, convenience, and tractability.
− Growth planning can also be accomplished using a reliability tracking curve IEEE Standard 1633 describes the practice for software reliability prediction prior to testing Typically involves tracking the number of open and resolved problem reports over time
− The basis for scoring criteria and prioritization can be found in IEEE Standard 12207 for Systems and Software Engineering — Software Life Cycle Processes:
Priority Applies if the Problem Could
1 Prevents the accomplishment of an essential capability, or jeopardizes safety, security, or requirement designated as critical
2 Adversely affects the accomplishment of an essential capability and no workaround solution is known, or adversely affects technical, cost, or schedule risks to the project or to life cycle support of the system, and no work-around solution is known
3 Adversely affects the accomplishment of an essential capability but a work-around solution is known, or adversely affects technical, cost, or schedule risks to the project or to life cycle support of the system, but a work-around solution is known
4 Results in user/operator inconvenience or annoyance but does not affect a required operational or mission essential capability, or results in inconvenience or annoyance for development or maintenance personnel, but does not prevent the accomplishment of those responsibilities
5 All other effects

7/7/2016-10
Reliability Growth (RG) Planning Process (cont.)
• Notional Examples of reliability tracking curves for Software Intensive Systems
*SIR – Software Issue Report
Prio
rity
2 SI
Rs

7/7/2016-11
Planning Model based on Projection Methodology (PM2)
“Department of Defense Handbook Reliability Growth Management,” MIL-HDBK-189C, 24 June 2011.
Typical PM2 Reliability Growth Planning Curve
Other Model Parameters• Management Strategy - fraction of the initial
system failure intensity due to failure modes that would receive corrective action. Considers A and B modes, which are failure modes that will (B modes) or will not (A modes) be addressed via corrective action
• Average Fix Effectiveness Factor - the reduction in the failure rate due to implementation of a corrective actions
• Growth Potential - theoretical upper limit on reliability which corresponds to the reliability that would result if all B-modes were surfaced and fixed with the realized failure mode FEF values
DT Reliability Goal
Reliability Requirement = 200 hours
Corrective Action PeriodsIdealized Projection
Milestones
Initial Reliability
Calculated by dividing OT reliability goal of 300-hrs MTBF by 0.9 to account for planned 10% reduction in DT MTBF due to OT environment
OT reliability goal of 300-hrs MTBF based on demonstrating 200-hr MTBF requirement with 20% consumer and 20% producer risks
Mea
n Ti
me
Bet
wee
n Fa
ilure
(MTB
F)
FRP – Full Rate ProductionMS - Milestone
Acronyms:

7/7/2016-12
Operating Characteristic (OC) Curves
Help us to consider whether test scope is adequate to assess system reliability Illustrate allowable test risks (consumer’s and producer’s risks) for assessing the progress
against the reliability requirement
11520.80.8
1.75
Reliability requirement
Confidence (1-consumer risk)
Probability of Acceptance (producer risk)
Ratio of DT reliability goal to requirement
0
0.1
0.2
0.3
0.4
0.5
0.6
0.7
0.8
0.9
1
0 1000 2000 3000 4000 5000 6000
Prob
abili
ty o
f Acc
epta
nce
True Mean Time Between Failures (MTBF) (miles)
3,449-mile test, 1 failure permitted4,929-mile test, 2 failures permitted6,353-mile test, 3 failures permitted7,743-mile test, 4 failures permitted9,108-mile test, 5 failures permitted15,726-mile test, 10 failures permitted40,968-mile test, 30 failures permittedProbability of Acceptance LevelMTBF Requirement
User inputs
Planning Model based on Projection Methodology (PM2) (cont.)

7/7/2016-13
Planning Model based on Projection Methodology (PM2) (cont.)
In Class Exercise

7/7/2016-14
Crow-Extended Reliability Growth Model
Typical Crow-Extended Reliability Growth Planning Curve
Test Time (hours)
Mea
n Ti
me
Bet
wee
n Fa
ilure
(MTB
F)
Planning InformationInputGoal Mean Time Between Failure (MTBF)
334
Growth Potential Design Margin
1.39
Average Fix Effectiveness 0.70Management Strategy 0.95Discovery Beta 0.57ResultsInitial Time [t(0)] 84Initial MTBF 155Final MTBF 336Time at Goal 3,677
Idealized ProjectionDT Phase 1Limited User Test (LUT)DT Phase 2DT Phase 3DT Phase 4Termination LineGoal Value
Note: Crow Extended does not use OC curves to determine the reliability growth goal.

7/7/2016-15
Crow-Extended Reliability Growth Model (cont.)
In Class Exercise

7/7/2016-16
Common Reasons Why Programs Fail to ReachReliability Goals and What We Can Do About It
1. Failure to start on the reliability growth curve due to poor initial reliability of design2. Failure to achieve sufficient reliability growth during developmental testing (DT)3. Failure to demonstrate required reliability in operational testing (OT)
Failure to start on the reliability growth curve due to poor initial reliability of designCommon Causes Recommended DoD Mitigations
Poor integration or lack of a “design for reliability” effort
Review contractor’s reliability engineering processes; Establish contractual requirements that encourage system engineering “best practices”
Unrealistic initial reliability predictions based on MIL-HDBK-217
Review prediction methodology; Require/encourage more realistic prediction methods such as physics of failure method using validated models and/or test data; Have experts review contractor software architecture and specifications
Early contractor testing is carried out in a non-operational environment
Understand how the contractor conducted early testing; Encourage contractor to test system in an operationally realistic environment as early as possible
Unrealistic reliability goals relative to comparable systems or poorly stated requirements
Compare reliability goals to similar systems; Push for more realistic requirements
Overestimating the reliability of COTS/GOTS in a military environments
Communicate the operational environment to the contractor, and the contractor, in turn, has to communicate that information to any subcontractors; If available, consider field data and prior integration experience to estimate reliability
Lack of understanding of the definition of “system failure”
Review system design/scoring criteria early and ensure all parties understand and agree with it; Communicate scoring criteria in Request For Proposal
Reliability requirement is very high and would require impractically long tests to determine the initial reliability with statistical confidence
Consider using “lower-level” reliability measures (e.g., use MTBEFF, instead of MTBSA); Investigate if the specified level of reliability is really required for the mission; Emphasize the importance of having a significant design for reliability efforts
MTBEFF – Mean Time Between Essential Function Failures MTBSA – Mean Time Between System Aborts

7/7/2016-17
Common Reasons Why Programs Fail to Reach Reliability Goals and What We Can Do About It (cont.)
Failure to achieve sufficient reliability growth during developmental testing (DT)
Common Causes Recommended Mitigation
Development of the reliability growth planning curve was a “paper exercise” that was never fully supported by funding, contractual support, and systems engineering activities
Verify reliability program is included in contracting documents and that there is sufficient funding to support testing and system engineering activities; Ensure program has processes in place to collect and assess reliability data; Investigate realism of reliability growth model inputs
Insufficient testing or time to analyze failure modes and devise/implement corrective actions
Evaluate how many B-mode failures are expected to surface over the test period; Ensure there are sufficient test assets and push for additional assets when the testing timeline is short; Evaluate if there will be sufficient time to understand the cause of failures and develop, implement, and verify corrective actions
Urgent fielding of systems that are not ready for deployment
Inadequate tracking of software reliability or testing of patches
Ensure contract includes provisions to support software tracking andanalysis; TEMP should define how software will be tracked/prioritized
System usage conditions or environment changed during testing
Analyze data to see if the failure mode distributions varied with changing conditions, Consider whether to reallocate resources and conduct additional testing in more challenging conditions
Initial design or manufacturing processes underwent major changes during testing
Discuss whether it is necessary to rebaseline the reliability growth planning curve based on the new design
System/subsystem components reaches wear-out state during testing
Investigate cause of wear-out; Consider recommending redesign for subsystems showing early wear-out or taking steps to mitigate overstresses to these components, if applicable
Reliability requirement is very high and would require impractically long tests to surface failure modes and grow reliability
Consider using “lower-level” reliability measures (e.g., use MTBEFF, instead of MTBSA); Investigate if the specified level of reliability is really required for the mission; Emphasize the importance of having a significant design for reliability efforts
MTBEFF – Mean Time Between Essential Function Failures MTBSA – Mean Time Between System Aborts

7/7/2016-18
Common Reasons Why Programs Fail to Reach Reliability Goals and What We Can Do About It (cont.)
Failure to demonstrate required reliability in operational testing (OT)
Common Causes Recommended Mitigation
Reliability of the system was poor coming in to the OT
Encourage program to establish OT reliability entrance criteria and ensure these criteria are achieved prior to entering the OT
User employment, environment, and/or system configuration was different in OT than in DT
Seek to operationalize reliability testing in DT to the maximum extent possible
Data collection and scoring procedures were different in OT compared to DT
Ensure data collection in DT and OT are adequate; Encourage program office and test agency to establish procedures that encourage data collection quality and consistency; Perform a pilot test to assess data collection adequacy
OT length was too shortUse operating characteristic curves and other appropriate statistical methods to scope the OT length; Use DT data to estimate system reliability

7/7/2016-19
Takeaway Points
• Given the poor performance of producing reliable systems in the DoD, development of a comprehensive reliability growth plan is important and is required by policy
• Reliability planning is more than producing a growth curve; it requires adequate funding, schedule time, contractual and systems engineering support, reasonable requirements, scoring criteria, data collection and assessment, etc.
• Reliability growth planning models, such as PM2 and Crow-Extended, provide useful ways to quantify how efforts by the management can lead to improved reliability growth over time
• Reliability growth planning for software intensive systems generally follows a similar process as planning for hybrid and hardware-only systems, although use of a tracking curve can also support quantification of growth planning efforts
• Programs fail to reach their reliability goals for a variety of reasons; development of a robust growth plan early on can help avoid some of the common pitfalls

7/7/2016-20
Reliability References
DOT&E references
• “DOT&E TEMP Guide,” 28 May 2013 (Version 3.0 Update in progress)
• “ Independent Operational Test and Evaluation (OT&E) Suitability Assessments,” Memo, 5 Oct 2012.
• “State of Reliability,” Memo from Dr. Gilmore to Principal Deputy Under Secretary of Defense (AT&L), 30 June 2010.
• “Next Steps to Improve Reliability,” Memo from Dr. Gilmore to Principal Deputy Under Secretary of Defense (AT&L), 18 Dec 2009.
• “Test and Evaluation (T&E) Initiatives,” Memo from Dr. Gilmore to DOT&E staff, 24 Nov 2009.
• “DOT&E Standard Operating Procedure for Assessment of Reliability Programs by DOT&E Action Officers,” Memo from Dr. McQuery, 29 May 2009.
• “DoD Guide for Achieving Reliability, Availability, and Maintainability,” DOT&E and USD(AT&L), 3 Aug 2005.
Other references
• “Reliability Growth: Enhancing Defense System Reliability,” National Academies Press, 2015.
• “Department of Defense Handbook Reliability Growth Management,” MIL-HDBK-189C, 14 June 2011.
• “Improving the Reliability of U.S. Army Systems,” Memo from Assistant Secretary of the Army AT&L, 27 June 2011.
• “Reliability Analysis, Tracking, and Reporting,” Directive-Type Memo from Mr. Kendall, 21 March 2011.
• “Department of Defense Reliability, Availability, Maintainability, and Cost Rationale Report Manual,” 1 June 2009.
• “Implementation Guide for U.S. Army Reliability Policy,” AEC, June 2009.
• “Reliability Program Standard for Systems Design, Development, and Manufacturing,” GEIA-STD-009, Aug. 2008.
• “Reliability of U.S. Army Materiel Systems,” Bolton Memo from Assistant Secretary of the Army AT&L, 06 Dec 2007.
• “Empirical Relationships Between Reliability Investments And Life-cycle Support Costs,” LMI Consulting, June 2007.
• “Electronic Reliability Design Handbook,” MIL-HDBK-338B, 1 Oct. 1998.
• “DoD Test and Evaluation of System Reliability, Availability, and Maintainability: A primer,” March 1982.
Software
• AMSAA Reliability Growth Models, User Guides and Excel files can be obtained from AMSAA.
• RGA 7, Reliasoft.
• JMP, SAS Institute Inc.

7/7/2016-21
Backup Slides

7/7/2016-22
PM2 Continuous RG Curve Risk Assessment
“AEC/AMSAA Reliability Short Course,” SANGB, MI, 22 August 2012.

7/7/2016-23
PM2 Continuous RG Curve Risk Assessment(cont.)

7/7/2016-24
DOT&E TEMP Guide 3.0
• Provides guidance on incorporation of the Program’s Reliability Growth Strategy in the TEMP
• Requires that the TEMP include an overview of the reliability program and testing needed to assess/monitor reliability growth, including design for reliability T&E activities.
• Requires a brief description of key engineering activities supporting the reliability growth program:
− Reliability allocations to components and subsystems,− Reliability block diagrams (or system architectures for software intensive systems)
and predictions− Failure definitions and scoring criteria (FDSC)− Failure mode, effects and criticality analysis (FMECA)− System environmental loads and expected use profiles− Dedicated test events for reliability such as accelerated life testing, and
maintainability and built-in test demonstrations− Reliability growth testing at the system and subsystem level− Failure reporting analysis and corrective action system (FRACAS) maintained
through design, development, production, and sustainment.

7/7/2016-25
DOT&E TEMP Guide 3.0 (cont.)
• The reliability growth program described in the TEMP should contain the following
− Initial estimates of system reliability and a description of how this estimates were arrived at
− Reliability growth planning curves (RGPC) illustrating the reliability growth strategy, and including justification for assumed model parameters (e.g. fix effectiveness factors, management strategy)
− Estimates with justification for the amount of testing required to surface failure modes and grow reliability
− Sources of sufficient funding and planned periods of time to implement corrective actions and test events to confirm effectiveness of those actions
− Methods for tracking failure data (by failure mode) on a reliability growth tracking curve (RGTC) throughout the test program to support analysis of trends and
− changes to reliability metrics− Confirmation that the Failure Definition Scoring Criteria (FDSC) on which the RGPC
is based is the same FDSC that will be used to generate the RGTC− Entrance and exit criteria for each phase of testing Operating characteristic (OC)
curves that illustrate allowable test risks (consumer’s and producer’s risks) for assessing the progress against the reliability requirement. The risks should be related to the reliability growth goal.
7/7/2016-26
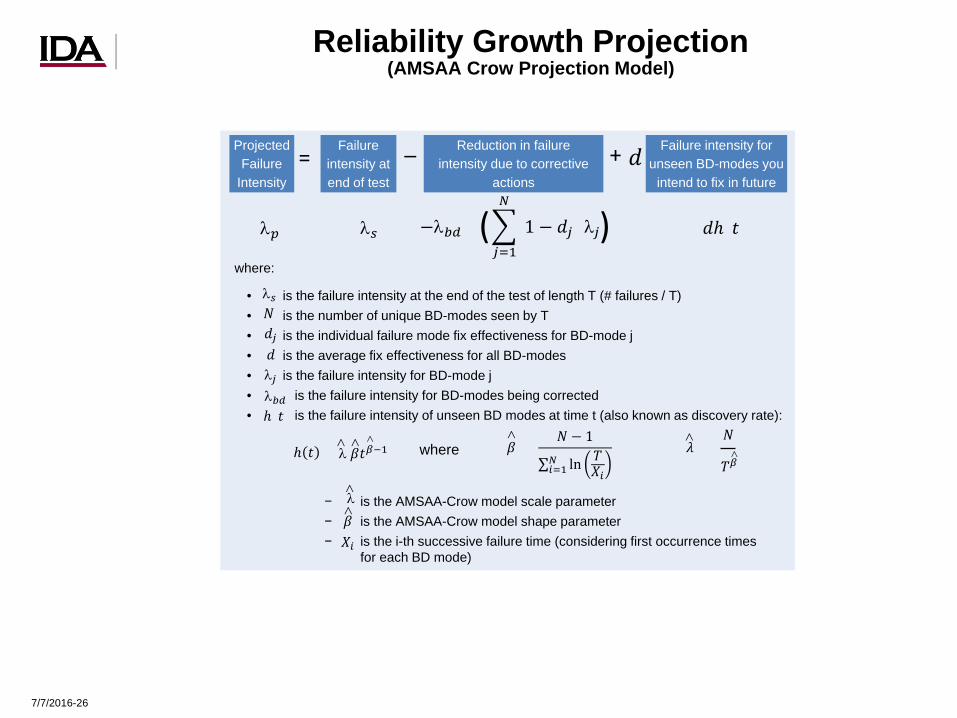
Reliability Growth Projection(AMSAA Crow Projection Model)
Projected Failure
Intensity
Failure intensity at end of test
Reduction in failure intensity due to corrective
actions
Failure intensity for unseen BD-modes you
intend to fix in future= _ +
λ𝑝𝑝 λ𝑠𝑠 𝑑𝑑𝑑(𝑡𝑡)
𝑑𝑑
−λ𝑏𝑏𝑏𝑏 + �𝑗𝑗=1
𝑁𝑁
(1 − 𝑑𝑑𝑗𝑗)λ𝑗𝑗( ) where:
• is the failure intensity at the end of the test of length T (# failures / T)• is the number of unique BD-modes seen by T• is the individual failure mode fix effectiveness for BD-mode j• is the average fix effectiveness for all BD-modes• is the failure intensity for BD-mode j• is the failure intensity for BD-modes being corrected• is the failure intensity of unseen BD modes at time t (also known as discovery rate):
λ𝑠𝑠𝑁𝑁𝑑𝑑𝑗𝑗𝑑𝑑
λ𝑏𝑏𝑏𝑏
λ𝑗𝑗
𝑑(𝑡𝑡)
𝑑 𝑡𝑡 = λ 𝛽𝛽𝑡𝑡𝛽𝛽−1 𝛽𝛽 =𝑁𝑁 − 1
∑𝑖𝑖=1𝑁𝑁 ln 𝑇𝑇𝑋𝑋𝑖𝑖
𝜆𝜆 => > > > >
where
− is the AMSAA-Crow model scale parameter− is the AMSAA-Crow model shape parameter− is the i-th successive failure time (considering first occurrence times
for each BD mode)
𝑁𝑁
𝑇𝑇𝛽𝛽
>
λ
𝛽𝛽
>>
𝑋𝑋𝑖𝑖

7/7/2016-27
Reliability Growth Projection (cont.)(AMSAA Crow Projection Model)
Test Time (hours) 500Total Failures 42
Number of A-mode Failures 8Number of BD-mode Failures 34Number of Unique BD-modes 16
𝜆𝜆𝑠𝑠Mean Time Between Failure 11.90System Failure Intensity ( ) 0.084
BD-mode Failure Intensity ( ) 0.068A-mode failure intensity 0.016
Average FEF 0.713
Suppose a system demonstrated the following failures in a 500-hour test:
BD Mode
BD Mode FirstOccurrence times (Xi)
No. of failures
(ni)
Estimated FEF (dj)
1 14 3 0.772 27.2 4 0.633 57 1 0.654 63 1 0.785 99 2 0.96 125 2 0.57 159 1 0.858 176 1 0.859 180 4 0.7210 181.5 5 0.7211 275 3 0.712 295 2 0.6313 356 1 0.7514 379.4 2 0.815 450 1 0.6516 485 1 0.5
Calculations
�𝑗𝑗=1
𝑁𝑁
(1 − 𝑑𝑑𝑗𝑗) λ𝑗𝑗
λ𝑏𝑏𝑏𝑏
Adjusted BD-mode Failure Intensity for
all BD-modes 0.020
(1 − 𝑑𝑑𝑗𝑗) λ𝑗𝑗
𝛽𝛽 =𝑁𝑁 − 1
∑𝑖𝑖=1𝑁𝑁 ln 𝑇𝑇𝑋𝑋𝑖𝑖
𝜆𝜆 =
>
> 𝑁𝑁
𝑇𝑇𝛽𝛽
>
AMSAA Crow Shape Parameter
0.756
AMSAA Crow Scale Parameter
0.146
Adjusted Failure Intensity for each
BD Mode( )
0.00140.00300.00070.00040.00040.00200.00030.00030.00220.00280.00180.00150.00050.00080.00070.0010
Failure intensity of unseen BD-modes at T=500 hours
𝑑 𝑡𝑡 = λ 𝛽𝛽𝑡𝑡𝛽𝛽−1
> > >
0.024
1) Correct Projection Method: Consider FEF and unseen BD-mode failure rate
2) Incorrect Projection Method 1: Ignore FEF and unseen BD-mode failure rate
3) Incorrect Projection Method 2: Account for FEF but ignore unseen BD-mode failure rate
λ𝑝𝑝 = 0.084 - 0.068 + 0.020 + 0.024 (0.713) = 0.0531
MTBF = 18.8 hours
λ𝑝𝑝 = 0.084 - 0.068 = 0.016
MTBF = 62.5 hours
λ𝑝𝑝 = 0.084 - 0.068 + 0.020 = 0.036
MTBF = 27.8 hours
Reliability Projection Using Correct and Incorrect Approaches


Importance of Design Reviews in the Reliability Growth Planning Process
Jonathan L. Bell2 June 2016
Institute for Defense Analyses4850 Mark Center Drive • Alexandria, Virginia 22311-1882


7/7/2016-1
Timeline
Systems Acquisition SustainmentPre-Systems Acquisition
Material Solution Analysis
TechnologyDevelopment
Eng. & Manufacturing Development
Production & Deployment
Operations & Support
A B C IOC FOC
Material Development
DecisionPost-CDR
AssessmentPre-EMDReview
FRPDecision Review
System Acquisition Framework
SRR PDR CDRCDD CPD
IDA Reliability Course TopicsRAM Requirements Review
Reliability Growth Planning
Assessment of Reliability in DT
Importance of Design Reviews in Reliability Growth Planning
TEMP Review and OT Planning
TEMP Review and OT Planning
Analysis of RAM data for BLRIP Reports
Analysis of RAM data for LRIP Reports
Acronyms:BLRIP – Beyond Low Rate Initial ProductionCDD – Capabilities Development DocumentCDR – Critical Design ReviewCPD – Capabilities Production DocumentEMD – Engineering & Manufacturing DevelopmentFOC – Full Operational CapabilityIOC – Initial Operational CapabilityLRIP – Low Rate Initial ProductionRAM – Reliability, Availability, MaintainabilitySRR – Systems Requirement ReviewPDR – Preliminary Design Review

7/7/2016-2
Purpose of Briefing
Highlight the importance of design reviews in the reliability growth planning process.
Identify the relevant questions to consider during design review activities.
Provide programmatic examples of this process.

7/7/2016-3
Outline
Overview of Design Reviews
Key Reliability Growth Planning Considerations During Design Reviews
Programmatic Examples
7/7/2016-4
Overview of Design Reviews
Systems Acquisition SustainmentPre-Systems Acquisition
Material Solution Analysis
Technology Maturation and Risk Reduction
Eng. & Manufacturing Development
Production & Deployment
Operations & Support
A B C IOC FOC
Material Development Decision
Post-CDRAssessment
Pre-EMDReview
FRPDecision Review
SRR PDR CDRCDD CPD
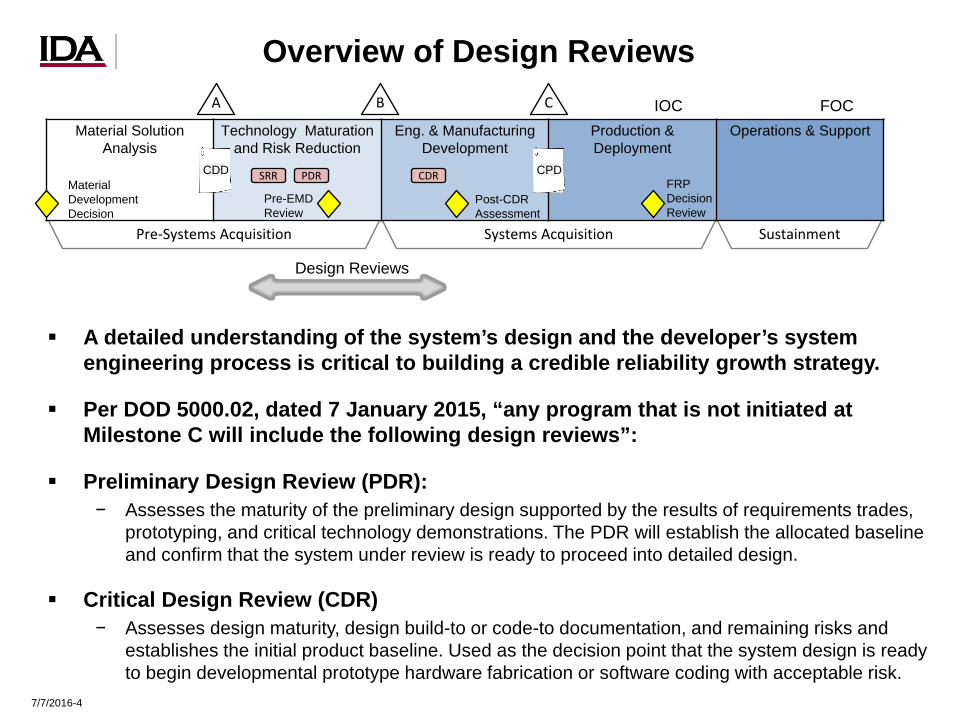
Design Reviews
A detailed understanding of the system’s design and the developer’s system engineering process is critical to building a credible reliability growth strategy.
Per DOD 5000.02, dated 7 January 2015, “any program that is not initiated at Milestone C will include the following design reviews”:
Preliminary Design Review (PDR):− Assesses the maturity of the preliminary design supported by the results of requirements trades,
prototyping, and critical technology demonstrations. The PDR will establish the allocated baseline and confirm that the system under review is ready to proceed into detailed design.
Critical Design Review (CDR)− Assesses design maturity, design build-to or code-to documentation, and remaining risks and
establishes the initial product baseline. Used as the decision point that the system design is ready to begin developmental prototype hardware fabrication or software coding with acceptable risk.

7/7/2016-5
Overview of Design Reviews (cont.)
Systems Acquisition SustainmentPre-Systems Acquisition
Material Solution Analysis
Technology Maturation and Risk Reduction
Eng. & Manufacturing Development
Production & Deployment
Operations & Support
A B C IOC FOC
Material Development Decision
Post-CDRAssessment
Pre-EMDReview
FRPDecision Review
SRR PDR CDRCDD CPD
Design Reviews
Per DOD 5000.02, dated 7 January 15, the Program Manager will formulate a comprehensive Reliability and Maintainability program to ensure reliability and maintainability requirements are achieved; the program will consist of engineering activities including for example”:
− R&M allocations− Block diagrams and predictions− Failure definitions and scoring criteria− Failure mode, effects and criticality analysis
Reliability growth planning is an integral part of the systems engineering process.
In addition to design reviews, contract deliverables, developed early in a program, might also provide documentation on the system design and the extent that the contractor had included reliability in the systems engineering process.
− Maintainability and built-in test demonstrations− Reliability testing at the system /subsystem level− Failure reporting, analysis, and corrective action
system maintained through design, development, production, and sustainment

7/7/2016-6
Key Reliability Growth Planning Questions to Address
Are the reliability requirement(s) understood by the developer?− Are reliability goal(s) included in contractual documents?− Is the reliability growth goal linked to the user’s reliability requirement, if applicable?− Is the developer aware of interim reliability goals such as entrance/exit criteria for various test
phases, if applicable?− Has the failure definition and/or scoring criteria been communicated to the developer? For
software, has the defect prioritization been defined?− Does the developer have reliability test data that can be assessed to verify compliance with the
Government’s scoring process?
Are reliability predictions credible?− Does the developer have an estimate for the initial reliability of the system/subsystems? If so, is
the estimate consistent with the reliability growth planning curve?− Are predictions supported by test data that are based on use of the system over its representative
mission profile and scoring of failures in accordance with approved failure definition and/or scoring criteria?
− Was testing and data collection performed by a government test site?− Does developer have a reliability block diagram?− Were reliability predictions based on MIL-STD-217 or is progeny (common on space programs)?− Were reliability predictions based on a physics of failure model?− Did the contractor implement a Design for Reliability (DfR) process?− Does the developer have a history of producing reliability hardware/software?

7/7/2016-7
Is the developer’s Management Strategy (MS)* credible?− Is there adequate funding and time to discover failure modes and develop, implement, and verify
corrective actions.− How mature is the design/software code? Is the design a new build? Does it incorporate
Commercial Off-the-Shelf (COTS), Government Off-the-Shelf (GOTS), or Government Furnished Equipment (GFE)?
− Will the program address failures due to COTS/GOTS/GFE or borrowed software code? If not, were these subsystems/components/code included as part of the A-mode failure intensity.
− Is there representative field failure data on the subsystems/components/software? If so, has this data been appropriately scored in accordance with the the failure definition and/or scoring criteria? Was this information used to develop an estimate for MS?
How mature is the system that will enter testing?− When will a functional prototype or fully function software code be available?− Has the developer conducted testing of the system on their own?− Does the program anticipate major design/manufacturing changes or software drops after MS C?
Is the developer required to conduct break-in or shakedown testing?− If so, are there specific criteria that should be met?− What is the mitigation plan if the developer fails to meet break-in or shakedown criteria?
Management Strategy* 𝑀𝑀𝑀𝑀 =𝜆𝜆𝐵𝐵
𝜆𝜆𝐴𝐴 + 𝜆𝜆𝐵𝐵
𝜆𝜆𝐵𝐵 = initial B-mode failure intensity
𝜆𝜆𝐴𝐴 = initial A-mode failure intensity
Key Reliability Growth Planning Questions to Address (cont.)

7/7/2016-8
Programmatic Examples
AH-64E Apache
F-15 Radar Modernization
Program
Joint Light TacticalVehicle
OH-58FKiowa
Warrior
Design reviews provide information that is essential to reliability growth planning
This section provides programmatic examples, including the following:
− Reliability Planning for System Upgrades (x2)− Importance of Understanding Scoring Criteria− It Doesn’t Matter What We Did Before− Growth to infinity

7/7/2016-9
“Reliability Planning For System Upgrades”
• OH-58F Kiowa Warrior− During the System Requirement Review and subsequent Preliminary Design
Review, DOT&E learned that most of OH-58F parts were not new; they came from the legacy OH-58D aircraft
− Program office stated they would not implement corrective actions for any of the legacy components
− Initial program growth curve had a 0.95 Management Strategy (MS), which is typical of a new start program.
− DOT&E obtained detailed failure mode data from the program office on legacy and new system components.
− Analysis of the failure mode data indicated that a 0.5 MS was more realistic.
Ensure estimates of growth and management strategy are realistic. They should accurately quantify what the program intends to fix.
𝑀𝑀𝑀𝑀 =𝜆𝜆𝐵𝐵
𝜆𝜆𝐴𝐴 + 𝜆𝜆𝐵𝐵𝜆𝜆𝐵𝐵 = initial B-mode failure intensity 𝜆𝜆𝐴𝐴 = initial A-mode failure intensity

7/7/2016-10
F-15E Radar Modernization Program (RMP)
− RMP initially had a hardware reliability requirement only
− For AESA radars, software accounts for the majority of failures
− Program established Mean Time Between Software Anomalies (MTBSA) requirement
− RMP software code maturity
DOT&E and IDA assessed the programs stability growth curve as overly aggressive
PM2 Model Fit to Notional Contractor Curve
Acronyms:FEF – Fix Effectiveness Factor Mg – Reliability Growth GoalMS – Management Strategy PM2 – Planning Model based Mi – Initial Reliability on Projection Methodology
“Reliability Planning For System Upgrades”
0
5
10
15
20
25
30
35
40
0 100 200 300 400 500 600 700
MTB
SA (h
ours
)
Cumulative test time (flight hours)
PM2 Model
Contractor Growth Curve
PM2 InputsMg = 37 hours MTBSAMi = 5.0 hours MTBSA
PM2 Fit ParametersMS = 1.02FEF = 1.02
Physically impossible
80
70
60
50
40
30
20
10
0c
PM2 ModelNotional Growth Curve

7/7/2016-11
Ensure reliability growth estimates are realistic. They should accurately quantify what the program intends to fix.
“Reliability Planning For System Upgrades (cont)”
• Comparison of notional curve to Duane model suggests that growth curve projections are aggressive
• Fitted growth rate parameter (α) ∼ 0.70
Military Standard 189C:
Historical mean/median for α is 0.34/0.32 Historical range for α is 0.23 - 0.53 An α of 0.70 is unrealistically aggressive,
particularly for a program that is incorporating mostly mature technology
MTBSA – Mean Time Between Software Anomalies
1
10
100
10 100 1000
MTB
SA (h
ours
)
Cumulative test time (flight hours)
Contractor Planning CurveDuane Model FitNotional Growth Planning CurveDuane Model
100
100
10

7/7/2016-12
OH-58F Kiowa Warrior
“Understanding Scoring Criteria”
− Reliability requirement based on 1990s document
− OH-58D had multiple upgrades and reliability improvements since 1990
− Combat reliability estimates were much higher than the requirement
− Rescored combat data with Failure Definition Scoring Criteria (FDSC) to obtain a more accurate reliability estimate
o Estimated reliability of current system exceeded requirement.
Ensure initial reliability estimate reflects the reliability of the current system considering all engineering changes made over the years.
FRPToday
Requirement
Current OH-58D fleet Performance
Mea
n Ti
me
Bet
wee
n S
yste
m A
bort
Test Time (Flight Hours)
PM TradeSpace

7/7/2016-13
“It Doesn’t Matter What We Did Before”
Joint Light Tactical Vehicle (JLTV)− The early JLTV TEMP included three growth curves projecting growth out
to the objective reliability requirement for Mean Miles Between Operational Mission Failure (MMBOMF):
Make sure the reliability growth curves are based on realistic assumptions.
MM
BOM
F
Test Time
“Piggyback approach”
a
b
c
Problems with this approach Subsequent steps overestimate
the growth that can be achieved since the bulk of high rate failure modes were already addressed in the first step
Steps “b” and “c” essentially assume system redesigns
0%10%20%30%40%
1 2 3 4 5 6 7 8 9 10
Initi
al F
ailu
re
Inte
nsity
Failure Mode
Equivalent to saying there is a new design at each step

7/7/2016-14
“Growth to Infinity”
− Permits growth to infinity as t→ ∞
− Growth potential not considered− Converges to zero as t→0− 100% fix effectiveness− Growth not linked to engineering
or management
F-15E Radar Modernization Program (RMP)− Had a Mean Time Between Critical Failure (MTBCF) requirement at Full
Operational Capability (FOC) − Used Duane model reliability growth planning curve
Duane Model is more appropriate for tracking/analysis vice reliability growth planning because it has the following limitations:
Ensure reliability growth curve is based on realistic assumptions that are tied to engineering, program management, and the test plan.

7/7/2016-15
“Mission Aborts in DT”
Programs typically build reliability growth strategy/curves for mission failure or mission abort requirement
Mission aborts occur less frequently than Essential Function Failures (EFFs) or Essential Maintenance Actions (EMAs)
Growth strategies based on EMAs produce a more credible and less resource-intensive reliability growth strategy by:− Incorporating a larger share of the failure modes− Addressing problems before they turn into mission aborts− Improving the ability to assess and track reliability growth− Increasing the statistical power and confidence to evaluate reliability in
testing− Enabling more reasonable reliability growth goals − Reducing subjectivity that can creep into the reliability scoring process
AH-64E decided to focus growth strategy on Mean Time Between EMAs as well as Mean time between Mission Aborts

7/7/2016-16
Takeaway Points
Get involved early in developing reasonable estimates for growth parameters − Participate in design reviews to understand proposed design.
o The design for a system upgrade might have changed many times over the years (e.g., OH-58F)− Work with Reliability Integrated Product Team to ensure growth parameters are tied to
engineering, contracting documentation, program management, and the test plan
Discuss requirements: KPPs are not always the best for reliability growth planning curves
− Fight inadequate requirements (e.g., F-15 Radar Modernization Program (RMP) Full Operational Capability reliability requirement)
− In the absence of adequate requirements, compare to legacy performance in testing (e.g., OH-58F Kiowa Warrior)
− Push for reliability growth planning curves based on EMAs/EFFs
Build a realistic reliability growth plan that is based on systems engineering− Ensure it considers the reliability growth potential and does not permit infinite growth (e.g.,
Duane model)− Ensure it represents the specific failure modes the program intends to fix. It should consider
all A-modes, particularly for non new-start systems (e.g., OH-58F, F-15E RMP radar software)
− Confirm that it is supported with a Failure Reporting and Corrective Action System and Failure Review Board
− Update model inputs once test results are available− Ensure design margins are adequate

7/7/2016-1
TEMP Review and OT Planning
Institute for Defense Analyses4850 Mark Center Drive • Alexandria, Virginia 22311-1882
Rebecca Dickinson2 June 2016

7/7/2016-2
Timeline
Systems Acquisition SustainmentPre-Systems Acquisition
Material Solution Analysis
TechnologyDevelopment
Eng. & Manufacturing Development
Production & Deployment
Operations & Support
A B C IOC FOC
Material Development
DecisionPost-CDR
AssessmentPre-EMDReview
FRPDecision Review
System Acquisition Framework
SRR PDR CDRCDD CPD
IDA Reliability Course TopicsRAM Requirements Review
Reliability Growth Planning
Assessment of Reliability in DT
Importance of Design Reviews in Reliability Growth Planning
TEMP Review and OT Planning
TEMP Review and OT Planning
Analysis of RAM data for BLRIP Reports
Analysis of RAM data for LRIP Reports
Acronyms:BLRIP – Beyond Low Rate Initial ProductionCDD – Capabilities Development DocumentCDR – Critical Design ReviewCPD – Capabilities Production DocumentEMD – Engineering & Manufacturing DevelopmentFOC – Full Operational CapabilityIOC – Initial Operational CapabilityLRIP – Low Rate Initial ProductionRAM – Reliability, Availability, MaintainabilitySRR – Systems Requirement ReviewPDR – Preliminary Design Review

7/7/2016-3
Purpose of Briefing
• How should programs document their reliability growth plan in the TEMP?
• What criteria that should be considered during the review process?
• How do we assess the adequacy of an OT ?
Reliability is the chief enabler of operational suitability, and failure to achieve reliability requirements typically results in a system being assessed "not suitable"; consequently, its
independent evaluation is pivotal to OT&E. Independent Operational test and Evaluation (OT&E) Suitability Assessments – October 05 2012 DOT&E Memo

7/7/2016-4
OT&E for Reliability
• The TEMP must include a plan (typically via a working link to the Systems Engineering Plan) to allocate reliability requirements down to components and sub-components.
• Beginning at Milestone B, the TEMP must include Test & Evaluation (T&E) for reliability growth and reliability growth curves (RGCs) for the whole system and the reliability of critical systems, sub-systems, components, and sub-components.
• RGCs must display planned initial reliability, the allocated reliability requirement, a curve showing reliability that is expected during each reliability test event, and points marking reliability test results to date.
• Beginning at Milestone B, the TEMP must include a working link to the failure mode, effects and criticality analysis (FMECA)
• Updated TEMPs at Milestone C must include updated RGCs that reflect test results to date, any updates to the planned T&E for reliability growth, and a working link to the updated FMECA.
Reliability and Maintainability Policy: DoDI 5000.02
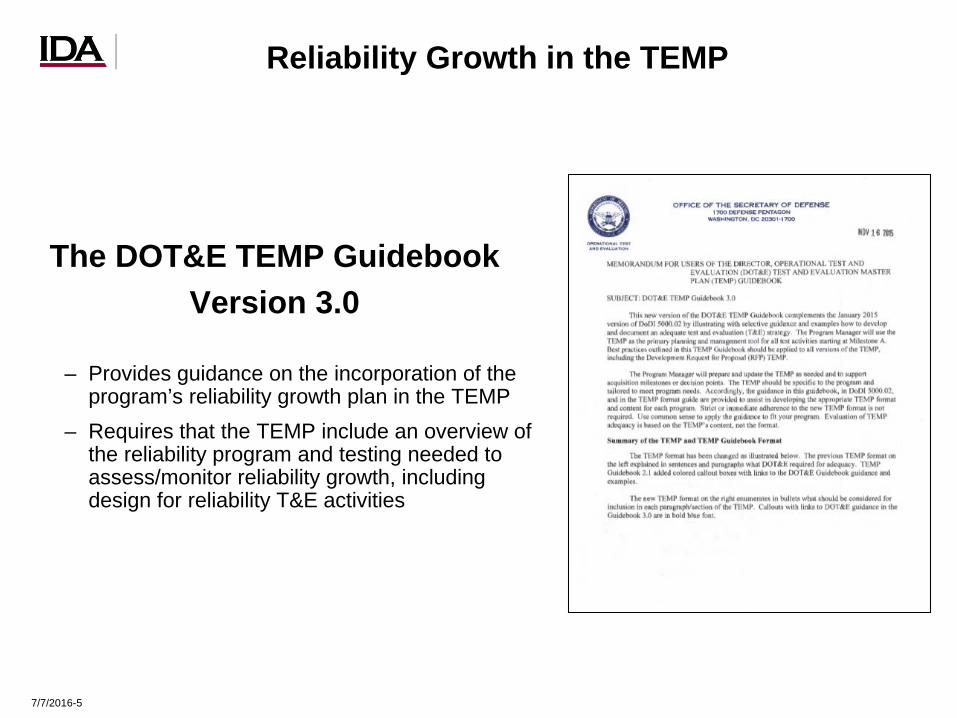
7/7/2016-5
The DOT&E TEMP GuidebookVersion 3.0
– Provides guidance on the incorporation of the program’s reliability growth plan in the TEMP
– Requires that the TEMP include an overview of the reliability program and testing needed to assess/monitor reliability growth, including design for reliability T&E activities
Reliability Growth in the TEMP

7/7/2016-6
Key Engineering Activities
• The TEMP requires a brief description of key engineering activities that support the reliability growth program:
– Reliability allocations to components and subsystems
– Reliability block diagrams (or system architectures for software intensive systems) and predictions
– Failure definitions and scoring criteria (FDSC)
– Failure mode, effects and criticality analysis (FMECA)
– Systems environmental loads and expected use profiles
– Dedicated test events for reliability such as accelerated life testing, and maintainability and built-in test demonstrations
– Reliability growth testing at the system and subsystem level
– A failure reporting analysis and corrective action system (FRACAS) maintained through design, development, production, and sustainment
• The key engineering activities should be discussed in much more detail in the appropriate supporting references. References, such as the System Engineering Plan or the Reliability Program Plan, should be provided in the TEMP

7/7/2016-7
Reliability Growth Program
• The TEMP should contain the following information with respect to the reliability growth program:
– Initial estimates of system reliability and how estimates were determined– Reliability growth planning curves (RGPC) illustrating the growth strategy, and justification for
assumed model parameters (fix effectiveness factors, management strategy, corrective actions)
– Estimates with justification for the amount of testing required to surface failure modes and grow reliability
– Methods for tracking failure data (by failure mode) on a reliability growth tracking curve (RGTC) throughout the test program to support analysis of trends and changes to reliability metrics
– Confirmation that the FDSC on which the RGPC is based is the same FDSC that will be used to generate the RGTC
– Entrance and exit criteria for each phase of testing– Operating characteristic curves that illustrate allowable test risks (consumer’s and producer’s
risks) for assessing the progress against the reliability requirement. The risks should be related to the reliability growth goal.
Reliability growth curves are excellent planning tools, but programs will not achieve their reliability goals if they treat reliability growth as a “paper policy.” Good reliability
planning must be backed up by sound implementation and enforcement. (DOT&E FY 2014 Annual Report)
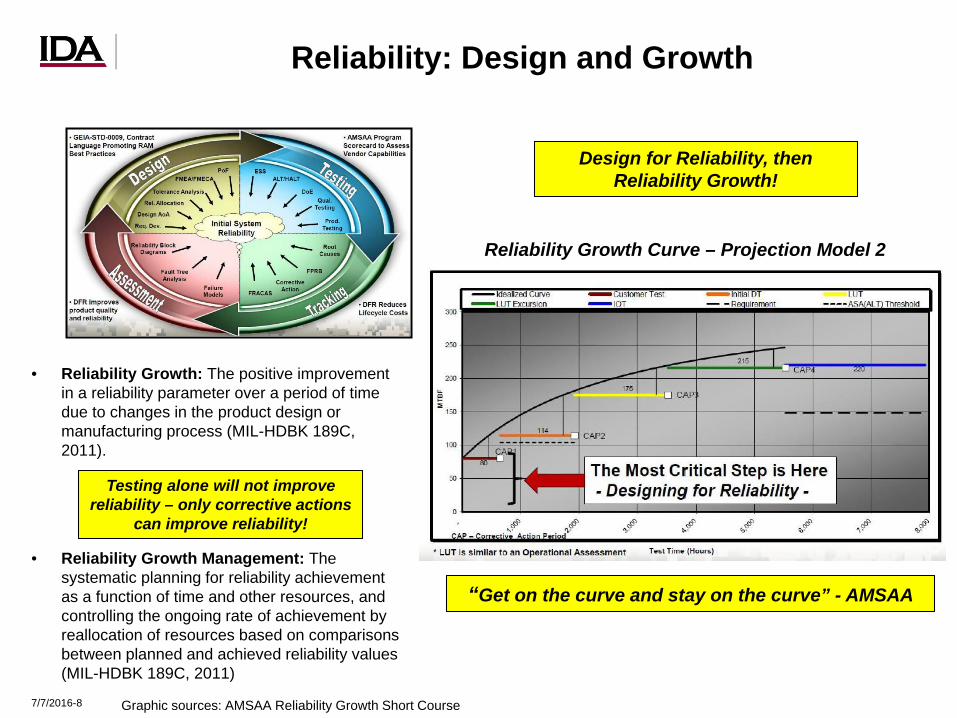
7/7/2016-8
Reliability: Design and Growth
• Reliability Growth: The positive improvement in a reliability parameter over a period of time due to changes in the product design or manufacturing process (MIL-HDBK 189C, 2011).
• Reliability Growth Management: The systematic planning for reliability achievement as a function of time and other resources, and controlling the ongoing rate of achievement by reallocation of resources based on comparisons between planned and achieved reliability values (MIL-HDBK 189C, 2011)
Graphic sources: AMSAA Reliability Growth Short Course
“Get on the curve and stay on the curve” - AMSAA
Design for Reliability, then Reliability Growth!
Reliability Growth Curve – Projection Model 2
Testing alone will not improve reliability – only corrective actions
can improve reliability!
7/7/2016-9
Reliability Growth Tracking
• Does the TEMP describe how reliability will be tracked across the developmental life cycle?
• Why is tracking important?– Determine if growth is occurring and to what degree.– Estimate the demonstrated reliability based on test data– Compare the demonstrated reliability to the requirements
• How do we track reliability?– The most common methods of growth tracking are scoring and assessment
conferences, measures to determine if reliability is increasing in time, tracking models, and FRACAS.
• Defense Acquisition Executive Summary requires Major Defense Acquisition Programs with a documented reliability growth curve in the SEP or TEMP to report reliability data on a quarterly basis.
• Systems not meeting entrance and exit criteria should revise the reliability growth strategy to reflect current system reliability
Reliability should be measured, monitored, and reported throughout the acquisition process.

7/7/2016-10
Reliability Entrance and Exit Criteria
Systems not meeting entrance and exit criteria should revise the reliability growth strategy to reflect current system reliability
Are reliability entrance criteria specified for the OA? Are they consistent with the curve?
DT Goal = 95 MTBF
IOT&E Goal = 86 MTBF
Is the DT MTBOMF on contract?
Requirement = 69 MTBF
What are the intermediate goals or entrance and exit goals?Is there enough time planned in each test phase to surface failure modes? Are there planned CAPs at the end of phase? Are the CAPs of reasonable length?If a requirement is not met – will a CAP be initiated?
Will we even start on the curve?

7/7/2016-11
TEMP Example
• System Engineering Strategy– Engineering Activities: R&M allocations; block diagrams and predictions; FMECA; FDSC
• Comprehensive Growth Plan Overview outlined in TEMP– Described for both MTBOMF and MTBF
» Provide adequate justification for initial system level reliability, Management Strategy, FEF, CAPs, etc.
• Pre-IOT&E Reliability Qualification Test – Program Office wants to evaluate system reliability prior to IOT&E.
» Expected 69 hour MTBOMF will be demonstrated with 80% confidence and have a 70% probability of acceptance during RQT
• IOT&E is long enough– If the vehicle meets it DT reliability growth goal of 95 hours the IOT&E will be long enough to demonstrate the
69-hour MTBFOM requirement with 80% confidence and 84% power (assuming a 10% degradation from DT to OT).
• Growth Goal is on Contract!– The reliability growth goal was included in
the program’s Request for Proposals!
Projected Miles Supporting Reliability Growth
Reliability Growth Curve Assumptions
RQT = 3,700 hours

7/7/2016-12
The DOT&E TEMP GuidebookVersion 3.0
– Provides guidance on the Reliability Test Planning
» Reliability Requirements» Planning an Adequate Test » Incorporating Additional Information
Reliability Test Planning

7/7/2016-13
Reliability Test Planning
• Operational testing provides the ability to assess mission reliability - testing is conducted to evaluate how systems improve mission accomplishment under realistic combat conditions.
• Ideally, adequate data on the mission reliability will be collected during operational testing, using representative users under a range of operationally realistic conditions.
• Operating characteristic (OC) curves are useful statistical tools for can be constructed to plan to length of a reliability test.
Operational Mission Reliability: the ability of a system toperform its required function, under stated environmentaland operating conditions and for a stated period of time.
7/7/2016-14
Reliability Requirements impact Test Duration
• The duration of a test depends on the reliability requirement
– Pass/Fail
» Probability of a fuse igniting without failure in a weapon system > 90%
– Time/Duration based
» A howitzer must have a 75 percent probability of completing an 18-hour mission without failure.
– Mean time between failures (MTBF)
» A howitzer mean time between failures must exceed 62.5 hours.

7/7/2016-15
Assessing Reliability Test Program Adequacy
• Current DOT&E Guidance: OT should provide sufficient data to assess system reliability with statistical power and confidence
» No default criteria is given for the level of statistical confidence and power.
• Operating Characteristic (OC) curves can be used to determine the statistical confidence and power that a test is sized for.
– Required Inputs for OC curve (what needs to be documented in the TEMP)» What is the IOT/FOT test length/test size described in the TEMP or test plan?
» What is the system's reliability requirement?
» What is the ultimate reliability growth goal?
– Provide a visual of the risk trade space
» Consumer Risk: the probability that a bad system (i.e. below the reliability threshold) will be accepted
» Producer Risk: the probability that a good system (i.e. above the reliability threshold) will be rejected
• While the statistical properties of a test do not determine its adequacy, they provide an objective measure of how much we are learning about reliability based on operational testing.
Will there be enough information to adequately assess system reliability?

7/7/2016-16
Operating Characteristic Curves Background
• Required Inputs for OC curve
– What is the test length/test size?
– What is the system's reliability requirement?
– What is the desired confidence level?
• Confidence level manages Consumer Risk.
– An 80% confidence level requires the system to demonstrate a lower 80% confidence limit on the reliability estimate from testing of at least equal to the requirement.
– Translates into a maximum number of failures that can be witnessed during the test, called critical number of failures
– 80% confidence equals 20% chance a system with true reliability below the requirement will be accepted

7/7/2016-17
Operating Characteristic Curves Background
• Outputs of the OC Curve
– Plots probability of demonstrating the reliability requirement with confidence as a function of the system under test’s true reliability
» This is the probability of exhibiting the critical number of failures, or fewer, during the test as a function of true reliability.
• This is the power of the test
– Power manages Producer Risk, the higher the power the less the Producer Risk
– Indicates the tests ability to show that a system with a true reliability higher than the requirement actually beats the requirement
• In general, the longer the test, the higher the power for a given confidence level

7/7/2016-18
Example: Application of OC Curve
• What reliability metrics can we apply OC Curves to?– MTBOM, MTBEFF
• Reliability Requirements:– Requirement: “The system shall have a MTBOMF that supports a 90% probability of successful
completion of a 24-hour operational period”
– Translation: a system with a MTBOMF of 228 hours, has a 90 percent chance of experiencing zero failures in a 24 hour mission
• Assessing the planned length of IOT&E: – What risks do we take on with a planned 1,000 hours of testing in IOT&E?
• Required Inputs for OC Curve
– What is the test length/test size?» 1,000 hours of testing are planned for IOT&E
– What is the system’s reliability requirement?» Threshold values for MTBOMF 228 hours
– What is the desired confidence level? » Traditionally taken to be 80% but can be varied if necessary

7/7/2016-19
Constructing and Evaluating the OC Curve
Test Length – Allowed Failures
The True MTBOMF is what the system needs to achieve in order to demonstrate the requirement with confidence; the reliability growth goal

7/7/2016-20
Exercise
Constructing an OC curve

7/7/2016-21
Avoid Rules of Thumb: Test 3x the Requirement
0
0.1
0.2
0.3
0.4
0.5
0.6
0.7
0.8
0.9
1
0 0.5 1 1.5 2 2.5 3
Prob
abili
ty o
f dem
onst
ratin
g re
quire
men
t with
80%
Con
fiden
ce
True MTBF/Requirement
1.6xRequirement, 0 Failures Allowed3xRequirement, 1 Failure Allowed5.5xRequirement, 3 Failures Allowed10xRequirement, 7 Failures Allowed20xRequirement, 16 Failures Allowed50xRequirement, 43 Failures AllowedReliability Growth Goal
Test Length, Failures Allowed
If a system has achieved reliability equal to 2x the requirement, a test lasting 3x the requirement will achieve an 80% lower confidence bound greater than the requirement 55% of the time (45% producer risk ).
Producer risk 45%
Consumer Risk 20% fixed at Requirement
• A Rule of Thumb should not be the strategy employed to develop or assess a reliability test plan.
Comparison across multiple OC curves helps to gauge test size as a function of allowable failures and risk.

7/7/2016-22
Incorporating Additional Information
• As it turns out, many operational tests are not statistically adequate (confidence and power) to assess requirements…
– Cost and Schedule Constraints
– Requirements are not testable or not operationally meaningful
• In most cases, there is still sufficient data to asses system reliability performance.
– When system reliability is substantially below the requirement, it is possible to determine with statistical confidence that the system did not meet is requirement with less testing than would otherwise be required.
– Other sources of data can be leveraged to assess reliability…
7/7/2016-23
TEMP Guidance on Incorporating Additional Information
• If additional information (like DT data) will be used in the reliability assessment then the TEMP should specify:
– Conditions the data must be collected under to be acceptable for OT use
– Methodology for scoring reliability data collected outside of an OT
– Statistical models and methodologies for combining information (e.g. Bayesian Methods).
– Methodology for determining an adequate operational test duration
Data from different test events should not be combined into one pool of data and used to calculate and average reliability, rather advanced analysis methodologies should be used to combine information from multiple tests.

7/7/2016-24
Bayesian Reliability & Assurance Testing
Objective – Scope an appropriately sized Operational Test (OT) using the
demonstrated reliability and growth of the system under test
Demonstration Test (OC Curve Analysis)– A classical hypothesis test, which uses only data from single test to
assess whether reliability requirements are met - often requires an exorbitant amount of testing!
» OC Curve scopes the size of a Demonstration Test, balancing consumer and producer risk
Assurance Test (Bayesian Analysis)– Leverages information from various sources to reduce the amount of
testing required to meet a requirement.

7/7/2016-25
Example: Comparison to Traditional Test Plan
A Bayesian assurance testing approach to test planning can be used to reduce test duration and control both risk criteria
Bayesian assurance test miles in table are hypothetical – only to illustrate a proof of concept
Failures Allowed
Bayesian Assurance Test Miles10% Consumer Risk
5% Producer Risk
Classical OC Curve Miles10% Consumer Risk
Producer Risk Varies
1 2,9407,780
58% Producer Risk
2 4,28010,645
50% Producer Risk
3 5,68013,362
43% Producer Risk
4 7,12015,988
37% Producer Risk
5 8,58018,550
32% Producer Risk

7/7/2016-26
Takeaway Points
• Reliability Growth
– The TEMP must provide an overview of the reliability program and the testing needed to asses and monitor reliability growth.
– Reliability Growth Planning Curves (RGPC) should be included in the TEMP and reflect the reliability growth strategy.
– Reliability should be measured, monitored and reported throughout the acquisition process.
• Test Planning
– The duration of test depends on the reliability requirement.– OC Curves can be employed to visualize the risk trade space for a
given test length.– If additional information will be used in the reliability assessment then
the TEMP needs to clearly outline the source, fidelity, and methodology for combining the information.

7/7/2016-1
Analysis of Reliability in Developmental Testing (DT)
Rebecca Dickinson2 June 2016
Institute for Defense Analyses4850 Mark Center Drive • Alexandria, Virginia 22311-1882

7/7/2016-2
Timeline
Systems Acquisition SustainmentPre-Systems Acquisition
Material Solution Analysis
TechnologyDevelopment
Eng. & Manufacturing Development
Production & Deployment
Operations & Support
A B C IOC FOC
Material Development
DecisionPost-CDR
AssessmentPre-EMDReview
FRPDecision Review
System Acquisition Framework
SRR PDR CDRCDD CPD
IDA Reliability Course TopicsRAM Requirements Review
Reliability Growth Planning
Assessment of Reliability in DT
Importance of Design Reviews in Reliability Growth Planning
TEMP Review and OT Planning
TEMP Review and OT Planning
Analysis of RAM data for BLRIP Reports
Analysis of RAM data for LRIP Reports
Acronyms:BLRIP – Beyond Low Rate Initial ProductionCDD – Capabilities Development DocumentCDR – Critical Design ReviewCPD – Capabilities Production DocumentEMD – Engineering & Manufacturing DevelopmentFOC – Full Operational CapabilityIOC – Initial Operational CapabilityLRIP – Low Rate Initial ProductionRAM – Reliability, Availability, MaintainabilitySRR – Systems Requirement ReviewPDR – Preliminary Design Review

7/7/2016-3
Overview
• Tracking Reliability in Developmental Testing– Updates to the reliability growth program
» Reliability Growth Curves must be updated at Milestone C– Full system reliability tracking– Component level reliability tracking– Formal methods of reliability tracking
• Guidance for using DT data for OT evaluations

7/7/2016-4
Importance of Developmental Test Data
• DOT&E AO’s should ensure that the Milestone C TEMP contains a reasonable reliability growth program that reflects the test results to date
• Key questions when assessing usefulness of developmental reliability test data:
– Is the test schedule/duration sufficient to surface failure modes in accordance with the reliability growth plan?
– Is the testing being run in accordance with the Operations Mode Summary Mission Profile (OMS/MP) or Design Reference Mission (DRM)?
– Does the program consistently document how reliability problems discovered in DT are being corrected?
– Does the program hold assessment conferences to assess fix effectiveness of corrective actions, use reliability tracking models to assess progress, and determination if the reliability is increasing with time?
– Do the reliability results suggest the system will be ready for OT?
5000.02: “Updated TEMPs at Milestone C will include updated Reliability Growth Curves (RGC) that reflect test results to date, any updates to the planned T&E
for reliability growth, and a working link to the updated Failure mode, effects and criticality analysis (FMECA).”

7/7/2016-5
Comprehensive DT Reliability Test Program: Command and Control System
• Provides the command and control system for the Marine Corps three primary control agencies
• Reliability Requirement:– 228 Hour Mean Time Between
Critical Failure– Derived from 90% probability of
completion for a 24 hour mission
• Key elements of the reliability program:
– Program manager has made reliability a priority
– Program has a dedicated reliability expert that attends testing, reviews all data, and tracks reliability over time
– Planned developmental testing is 3200 hours
– Operational realism of developmental testing is clearly documented
– Program office conducts deficiency review boards after each test
– Reliability tests conducted in an operational manner are also scored in an operational scoring conference according to the failure definition scoring criteria.

7/7/2016-6
Proposed TestingMS C TEMP Content
DatesTest Event/
LocationType of Test
#Full Systems/Agency
Actual Full System
Operational Hours
Planned Full System Operational Hours
10 Feb-7 Mar 2014 Camp Pendleton DT-B1 1 192 200
28 May -21 Jun 2014
Camp Pendleton/MCAS Miramar DT-B2 3 564 600
4th Quarter FY14 Camp Pendleton Data Fusion Testing 1 26.5 N/A11-27 Sep 2014 MCAS Yuma, AZ DT-B3 3 459 45029 Sep-18 Oct 2014 MCAS Yuma, AZ OT-B1 (OA) 3 500 450
3rd Quarter FY15 Wallops Island, VA CEC Certification 1 - 100
3rd Quarter FY15
Camp Pendleton/MCAS Miramar/Wallops Island
DT-C1 3 600
1st Quarter FY16
Camp Pendleton/MCAS Miramar/MCAS Yuma, AZ
DT-C2 (IOT&E Readiness) 4 - 800
2nd Quarter FY16 MCAS Yuma, AZ OT-C1 (IOT&E) 3 - 684
Test Event Hardware Production Rep
(Y/N)
Non Standard Config Items (Y/N)
Software Production Representative (Y/N)
Operational Scenarios (Y/N)
DT-B1 No Yes, Stand Alone CEP
No No
DT–B2 No No No YesDT–B3 No No No YesOT-B1 (OA) No No No YesDT-C1 No No No YesDT-C2 (IOT&E Readiness Event)
Yes No Yes Yes
OT-C1 (IOT&E) Yes No Yes Yes
Hours are adequate to find failure modes in DT
Test events are space appropriately to correct discovered failures
System configurationand operational scenarios are clearly documented. The majority of developmental testing is conducted using operational scenarios

7/7/2016-7
Update to Reliability Growth Curve MS-C TEMP Content
• Good example of one method for updating the reliability growth curve for a Milestone C TEMP– Reliability for each
test event is clearly documented
– Could be improved by including confidence intervals
– Reliability point estimates are consistent with the curve

7/7/2016-8
Update to Reliability Growth Curve MS-C TEMP Content
• In many cases we have seen curves that do not reflect existing test data
• Options for MS C– Update curve to
reflect new initial reliability estimate –this may require:
» A new curve with additional corrective action periods
» Context on how existing failures will be fixed
– Review requirement – what is the operational context?
CAP1
CAP2
CAP3CAP4
70
168
192 192200
0000
182
Requirement = 100
202
0
50
100
150
200
250
MTB
F
Test Time
Requirement DT 1 DT 2DT 3 OA DT4
Hypothetical Last StepIOT Idealized Curve
Test results are not consistent with
reliability growth curve!

7/7/2016-9
Estimating Reliability with Limited Full System Data
• Many programs cannot test the full system to assess reliability prior to MS-C– Example: Littoral Combat Ship
• Additionally, many systems will have limited full system level testing in an operational scenario, but lots of component level testing
– Example: Small Diameter Bomb II
• In these cases it is still important to address the key developmental test considerations:
– Is the test schedule/duration sufficient to surface failure modes in accordance with the reliability growth plan?
– Is the testing being conducted to address the operational context (for example temperature cycling in the lab)?
– Does the program consistently document how reliability problems discovered in DT are being corrected?
– Does the program hold assessment conferences to assess fix effectiveness of corrective actions, use reliability tracking models to assess progress, and determination if the reliability is increasing with time?
– Do the reliability results suggest the system will be ready for OT?
• However, the answers to these questions may be based on critical subsystem testing.

7/7/2016-10
Estimating System Reliability Model: A Small Bomb
• Reliability Key system Attribute (KSA) has a Free Flight and Material component– Completion of MOT&E Free Flight Reliability (PFFR)= 0.80; Lot 5 PFFR = 0.90– Material reliability MOT&E = 125 hours; Lot 5 RM = 500 hours
• Prior to MS-C limited full-system free flight data is available to assess reliability– However, each of the 24 critical components of the small bomb (ex: seeker, battery,
fuze) have been tested to a greater extent, can use that information to improve the MS-C assessment of free-flight reliability.
𝑅𝑅𝑠𝑠𝑠𝑠𝑠𝑠 = �𝑖𝑖=1
𝑛𝑛
𝑅𝑅𝑐𝑐𝑐𝑐𝑐𝑐𝑐𝑐(𝑖𝑖)
Series System Parallel SystemSeries Reliability
0.5 0.6 0.7 0.8 0.9 1.0
02
46
810
12
Air Turbine Alternator (ATA) 13
Reliability
Den
sity
Mean Rel = 0.963Median Rel = 0.995% Quant = 0.832
95% Quant = 1
0.5 0.6 0.7 0.8 0.9 1.0
05
1015
20
Global Positioning System (GPS) 18
Reliability
Den
sity
Mean Rel = 0.998Median Rel = 15% Quant = 0.98795% Quant = 1
*
Air Turbine Alternator Reliability GPS Reliability
For example previous testing had shown the following success rates for two of the components:• 19/20 for Air Turbine Alternator• 72/72 for GPS

7/7/2016-11
Update to Reliability Growth Curve: MS-C TEMP Content
Trails Failures Reliability 90% Upper 10% LowerPFFR
Traditional Analysis
15 4 0.7333 0.88 0.54
PFFR
Series ModelNA NA 0.799 0.87 0.69

7/7/2016-12
Reliability TrackingFormalReliabilityTracking

7/7/2016-13
• Reliability Tracking Objectives− Determine if system reliability is increasing with time (i.e., growth is occurring) and
to what degree (i.e., growth rate)
− Estimate the demonstrated reliability based on test data for the system configuration under test at the end of the test phase
− Compare the demonstrated reliability to the threshold value to ascertain that reliability is growing in accordance with planned growth.
Reliability Tracking Objectives
MS A MS B MS C FRPTD EMD P&D
Growth Planning Tracking/Projection
EMD – Engineering and Manufacturing Development FRP – Full-Rate Production MS – MilestoneP&D – Production and Deployment TD – Technology Development0
Acronyms:

7/7/2016-14
Reliability Tracking Process
Acronyms: AMSAA – Army Materiel Systems Analysis Activity EFF – Essential Function FailureOMF – Operational Mission Failure
Test
ScoringCriteria
Score Reliability DataCollect and
Review Data
• Consistency• Omissions• Errors• Does it align with
observations?
Organize Data as Appropriate• Test phase• Corrective action period• Failure type (EFFs, OMFs) • Failure mode• System or subsystem• Aggregate or group• Data from legacy system(s)
• Determine what conditions might have impacted data (e.g., weather, location, etc.)
Cum
ulat
ive
EFFs
Cumulative Operating Time100 200 300 400 500
87654321
Reliability Growth Potential(MGP)
Cumulative plot
Consider Using Tracking Data to Preform Reliability Projection Analyses
Reliability Projection Models
• AMSAA-Crow Projection Model• Crow Extended Projection Model• AMSAA Maturity Projection Model• Discrete Projection Model
Cumulative Operating Time
Rel
iabi
lity
(MTB
F)
Reliability demonstratedin each phase
Track Reliability Growth Over Time
0.0
4.0
8.0
12.0
0 2500 5000 7500 10000
Cum
ulat
ive
EFFs
Cumulative Operating Time
AMSAA-Crow Model Fit
β = 0.75
Estim
ated
Rel
iabi
lity
Non-Parametric Reliability Plot
Cumulative Operating Time

7/7/2016-15
Reliability Growth Plan
Reliability Tracking and Growth Potential Examples
Reliability Growth PotentialReliability Measure: Mean Miles Between Operational Mission Failures
Initial Reliability (Ri) from CAP 1
Reliability Growth
Potential (RGP)
80% of the Reliability
Growth PotentialPre-IOT&E Reliability
Goal
1,600 5,220 4, 176 3,800
AMSAA Crow Tracking Model (in JMP)
100
200
300400500
700
1000
2000
3000M
TBF
100 200 300 400 500 700 1000 2000 3000 4000 6000 10000
Hours
0.0
5.0
10.0
15.0
Cum
ulat
ive
Even
ts
0 2000 4000 6000 8000 10000 12000
Hours
Parameter
lambda
beta
Reliability Growth Slope
Estimate
0.01306317
0.74878556
0.25121444

7/7/2016-16
• Once data is appropriately acquired and organized, use reliability tracking methods to:
− Determine if system growing reliability in accordance with reliability growth curve− Determine if the estimated reliability at the end of the phase is consistent with user
requirements
• If tracking and/or projection analysis indicates that the system is not growing reliability in accordance with the reliability growth curve:
− Update the reliability growth strategy and planning curve(s) based on more realistic inputs
− Consider if additional resources/testing are necessary to reach goals− If reliability is poor, use growth potential analysis to see if it is feasible for system to
reach reliability goals; if it is not feasible, system might require a redesign
Reliability Tracking Points/Recommendations

7/7/2016-17
Guidance on using DT data for OT evaluations
• The conditions the data must be collected under to be acceptable for OT use.– Developmental testing does not have to be conducted according to the Operational
Mode Summary/Mission Profile (OMS/MP) or Design Reference Mission (DRM), but there must be a clear consideration of operational conditions in the developmental testing.
• Use a common scoring criteria– If you plan to use developmental test data for operational evaluation,
developmental test reliability failures must be scored by the same methods as the operational reliability data.
• Clearly describe the statistical models and methodologies for combining information.
– Data should not simply be pooled together and an average reliability calculated. The analysis should account for the conditions the reliability data were collected under to the extent possible.
• The methodology for determining adequate operational test duration must be specified.
– Bayesian assurance testing can be used in place of traditional operating characteristic curves to determine adequate operational testing when prior information will be incorporated.


7/7/2016-1
Analysis of RAM Data for LRIP/BLRIP Reports
Institute for Defense Analyses4850 Mark Center Drive • Alexandria, Virginia 22311-1882
Matthew AveryRebecca Dickinson11 December 2015
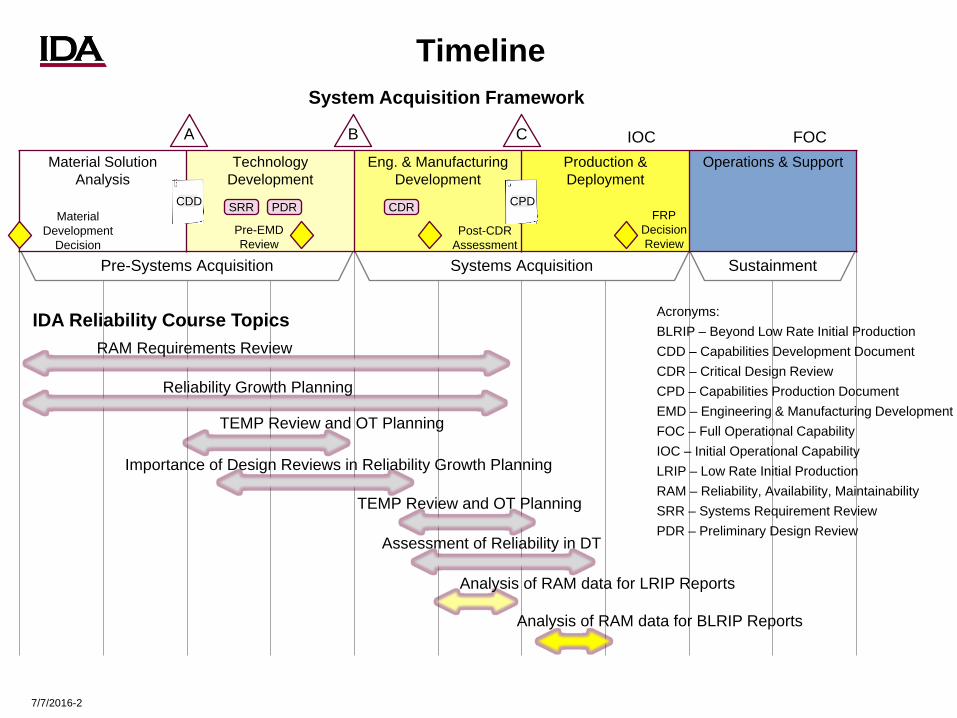
7/7/2016-2
Timeline
Systems Acquisition SustainmentPre-Systems Acquisition
Material Solution Analysis
TechnologyDevelopment
Eng. & Manufacturing Development
Production & Deployment
Operations & Support
A B C IOC FOC
Material Development
DecisionPost-CDR
AssessmentPre-EMDReview
FRPDecision Review
System Acquisition Framework
SRR PDR CDRCDD CPD
IDA Reliability Course TopicsRAM Requirements Review
Reliability Growth Planning
Assessment of Reliability in DT
Importance of Design Reviews in Reliability Growth Planning
TEMP Review and OT Planning
TEMP Review and OT Planning
Analysis of RAM data for BLRIP Reports
Analysis of RAM data for LRIP Reports
Acronyms:BLRIP – Beyond Low Rate Initial ProductionCDD – Capabilities Development DocumentCDR – Critical Design ReviewCPD – Capabilities Production DocumentEMD – Engineering & Manufacturing DevelopmentFOC – Full Operational CapabilityIOC – Initial Operational CapabilityLRIP – Low Rate Initial ProductionRAM – Reliability, Availability, MaintainabilitySRR – Systems Requirement ReviewPDR – Preliminary Design Review

7/7/2016-3
Outline
• Reporting on Reliability– Point & interval estimation– Comparisons with legacy systems– Comparisons against requirements
• Reliability Models– Exponential Distribution – Other models (Weibull, LogNormal, … )– Nonparametric methods (Bootstrap)
• Scoring Reliability
• Leveraging Information from Multiple Test Periods– Can we combine data across OT events?– Can we capitalize on DT data?
• Qualitative Assessment– Identifying drivers of reliability
• Summary

7/7/2016-4
Reporting on Reliability
• Top level assessment– Was the system reliable? – In the first sentence/paragraph in the Operational Suitability section
• What was the system’s demonstrated reliability?– Point estimate– Confidence interval
• Did the system meet its requirements? – Is there a statistically significant difference? – Is the difference meaningful in operational context?
• How does the system’s reliability compare to legacy system?– Did an upgrade improve reliability? Degrade reliability?
Is the system sufficiently reliable to successfully conduct its mission?

7/7/2016-5
Estimating System Reliability
• Failure times are the primary metric used to evaluate reliability
• Average of all times between failure = Mean Time Between Failures (MTBF)– Easy to calculate– Requirements often given in terms of MTBF– Implies assumption of constant failure rates
• Failure rates are not always constant!
– Median failure time provides more direct measure of frequency of failures
• Different assumptions require different analyses

7/7/2016-6
Interval Estimation
• Requirement: 100 MFHBSA
• Operational Assessment (OA):– 723 hours– 5 failures observed– 144.6 MFHBSA
• Initial Operational Test (IOT): – 7052 hours– 49 failures observed– 143.9 MFHBSA
Both versions demonstrated the
requirement, but we have more information about
one than the other.
MFHBSA – Mean Flight Hours Between System Aborts

7/7/2016-7
Quantifying Uncertainty
• We can quantify our certainty about point estimates (such as MFHBSA) using confidence intervals
– Provides range of plausible values – Shows how sure we are about system reliability– Helps us evaluate risk that system meets requirement
• Increment 1:– 723 hours– 5 failures observed– 144.6 MFHBSA – 80% CI: (77.9,297.2)
• Increment 2: – 7052 hours– 49 failures observed– 143.9 MFHBSA– 80% CI: (119.0,175.1)
Confidence Intervals for Exponential Failure Times
2𝑇𝑇
𝜒𝜒2 1 − 𝛼𝛼2 , 2 𝑟𝑟 + 1
< 𝑀𝑀𝑀𝑀𝑀𝑀𝑀𝑀𝑀𝑀𝑀𝑀 <2𝑇𝑇
𝜒𝜒2 𝛼𝛼2 ,2𝑟𝑟
T: Total Test Time𝜒𝜒2: Critical Value of a Chi-Squared distribution\𝑟𝑟: Observed number of failures𝛼𝛼: 1-confidence level (for 80%, 𝛼𝛼 = 0.2)
MFHBSA – Mean Flight Hours Between System Aborts

Did your observe failures of the system?
Was the system tested longer than its requirement?
Is the LCB greater than the requirement?
How many failures were observed?
LCB UCBPoint Estimate
MTBF
Estimate 2-sided confidence interval
Yes
No
Yes
No
(1) We have too little information
to draw any conclusions about system reliability
Yes
No
(2) The system has met its reliability requirement with
statistical confidence
𝑅𝑅𝑅𝑅𝑅𝑅 < 𝐿𝐿𝐿𝐿𝑀𝑀
(5) The system has failedto meet its reliability
requirement with statistical confidence
𝑈𝑈𝐿𝐿𝑀𝑀 < 𝑅𝑅𝑅𝑅𝑅𝑅
LegendUCB – Upper Confidence BoundLCB – Lower Confidence Bound�𝑀𝑀𝑇𝑇𝑀𝑀𝑀𝑀- Point Estimate𝑅𝑅𝑅𝑅𝑅𝑅- Requirement
(3) The system has demonstrated its requirement
but not with statistical confidence (4) The system has failed to
demonstrate its requirement but not with statistical confidence
5 or more
Fewer than 5
(6) Substantial data is available for a precise estimate of reliability
(7) Only limited data is available to evaluate system reliability
No

7/7/2016-9
Comparisons to Legacy Systems and Thresholds
• Does the system improve on the reliability of the legacy system?
– Test legacy system in side-by-side comparison– Use past deployment data from legacy system
» How closely does OT environment mimic deployment? OMS/MP?– Legacy system test data
» How closely does new test environment mimic legacy testing?
• Did the system meet its threshold?– Point estimate?– Lower bound of confidence interval?
“The demonstrated system reliability was [better/worse] than the requirement*, and the difference [was/was not] statistically significant.”
*When evaluating reliability prior to the IOT, demonstrated reliability should also be compared to the reliability growth curve to determine of programs are on track to eventually meet their requirement.

7/7/2016-10
Reporting Reliability in the Mission Context
• Reliability Requirement: “The Amphibious Vehicle shall have a 0.77 probability of completing any single one of the scenarios described in the OMS/MP”
– Scenarios described last at most 18 hours 69 hours MTBSA
– Hypothetical result from testing: 55.4 (48.6, 63.4) hours MTBSA
– “The probability of the Amphibious Vehicle completing an 18 hour mission without experiencing a system abort is 0.72 (0.69, 0.75).”
“Over the course of the 4-day mission described in the OMS/MP, a Reinforced Rifle Company supported by 21 vehicles would expect to
experience 27.3 system aborts vice 21.9 system aborts if the Amphibious Vehicle had achieved its requirement.”
Provide interpretation of demonstrated system reliability in the context of the mission
MTBSA – Mean Time Between System AbortsOMS/MP – Operational Mode Summary/Mission Profile

7/7/2016-11
Reliability Models: Modeling Failure Times
• Approaches discussed previously rely on statistical models– When reporting the MTBF ( = Total Time / Total # of Failures) we are
inherently assuming that failure time data follow an exponential distribution!
• To ensure estimates of reliability are accurate, choosing the correct model is crucial
– Exponential– Weibull– Nonparametric approaches
Statistical models allow us to:− Estimate overall failure rates− Quantify uncertainty through confidence intervals− Compute probability of completing a mission without a
failure − Compare system reliability against a threshold or a
legacy system

7/7/2016-12
The Exponential Distribution
• Constant Failure Rates– No “infant mortality”– No “wear out”– Should always attempt to validate
these assumptions with test data
Exponential Distribution
𝑓𝑓 𝑡𝑡 = 𝜆𝜆𝑅𝑅−𝜆𝜆𝜆𝜆
𝜆𝜆 ∶ the rate parameter�̂�𝜆 =
𝑛𝑛∑𝑖𝑖=1𝑛𝑛 𝑡𝑡𝑖𝑖
Mean:1�𝜆𝜆
= ∑𝑖𝑖=1𝑛𝑛 𝜆𝜆𝑖𝑖𝑛𝑛
= MTBF
�̂�𝜆 = .04Mean = 25

7/7/2016-13
Why Use the Exponential Distribution?
• Intuitive, Traditional, Convenient– Constant failure rates make interpretation easier– 1982 DoD Reliability Primer showed the calculations for mean and
confidence interval– Someone put it in an excel spreadsheet
• “Mean Time Between Failure”– This measure makes the most sense in the context of exponential
distribution– For alternative models (lognormal, Weibull), measures like median
failure time make more sense
• Minimal data collection requirements– Total number of hours/miles– Total number of failures 𝑀𝑀𝑇𝑇𝑀𝑀𝑀𝑀 =
𝑇𝑇𝑇𝑇𝑡𝑡𝑇𝑇𝑇𝑇 𝑀𝑀𝑇𝑇𝐻𝐻𝑟𝑟𝐻𝐻/𝑀𝑀𝑀𝑀𝑇𝑇𝑅𝑅𝐻𝐻𝑇𝑇𝑇𝑇𝑡𝑡𝑇𝑇𝑇𝑇 𝑀𝑀𝑇𝑇𝑀𝑀𝑇𝑇𝐻𝐻𝑟𝑟𝑅𝑅𝐻𝐻

7/7/2016-14
Downside of Exponential
• Assumptions may be invalid– Wider confidence intervals– Mis-represent system reliability
» Over-estimate frequency of early failures
Exponential Distribution? Exponential Distribution?

7/7/2016-15
Alternatives to Exponential Distribution
WeibullDistribution
Lognormal Distribution
Exponential Distribution
𝑓𝑓 𝑡𝑡 =𝛽𝛽𝜂𝜂
𝑡𝑡𝜂𝜂
𝛽𝛽−1
exp −𝑡𝑡𝜂𝜂
𝛽𝛽
Mean = 𝜂𝜂Γ 1 + 1𝛽𝛽
𝑓𝑓 𝑡𝑡 = 1𝜆𝜆 𝜎𝜎 2𝜋𝜋
exp(− ln 𝑥𝑥 −𝜇𝜇 2
2𝜎𝜎2)
Mean = exp(𝜇𝜇 + 𝜎𝜎2
2)
𝑓𝑓 𝑡𝑡 = 𝜆𝜆𝑅𝑅−𝜆𝜆𝜆𝜆Mean = 1
𝜆𝜆

7/7/2016-16
Weibull and Lognormal
• Multiple parameters allow for both infant mortality and wear-out at end of life
– Better fit of the data
• Need time between each failure – Requires planning prior to test to ensure adequate data collection

7/7/2016-17
Fitting Failure Time Data

7/7/2016-18
Checking Model Assumptions
• Compare plotted data to estimated model
• Goodness of fit criteria– Likelihood– AIC/BIC
Exponential Lognormal
Model Likelihood AIC BICExponential 16.24 6.50 10.89Lognormal 18.16 3.54 6.02

7/7/2016-19
Moving Away From Assumptions
• Observed 10 failures over 970 hours of testing:

7/7/2016-20
Moving Away From Assumptions
• Observed 10 failures over 970 hours of testing:
• These models don’t appear to fit the data well
• Alternative methods that don’t assume a particular distribution can be used to generate uncertainty estimates
Exponential Lognormal

7/7/2016-21
Bootstrapping
• Regardless of what the data is, allows you to provide uncertainty estimates
• Resampling based exclusively on observed data shows what “could have been”
• Need failure times vice aggregation
• Can’t bootstrap with too few (<7) data points
• Less precise than parametric approach
Observed Failures MFHBSA Distribution with CI

7/7/2016-22
Reliability Scoring
• DOT&E’s reliability scoring should be independent– DOT&E participates in reliability scoring conferences for many
programs, but DOT&E’s evaluations are never bound by their decisions
• DOT&E is not a signatory to the FDSC– Failure Definition Scoring Criteria (FDSC) are developed by the
services for their evaluations of systems– Definitions provided in FDSCs can vary substantially from service to
service and may even be different for similar programs within the same service
– DOT&E’s definition of Operational Mission Failures (OMF) or system Aborts (SA) may be different from the FDSC
• Disagreements between DOT&E scoring and OTA scoring should be highlighted in test reports, since these differences will lead to different results in reliability evaluation and estimates of failure rate
DOT&E’s evaluation of reliability is not constrained by the scoring decisions of Operational Test Agencies (OTA) or Program
Managers (PM)

7/7/2016-23
Determining Whether Test Time Should Count for Reliability
• System operating time should only accrue if the system is being operated in realistic conditions
– OMS/MP, CONOPS, or design reference missions may be used as resources to determine the stress expected on a system over time
• Passive/overwatch time– OMS/MP may specify that electronic systems will operate for a
certain percentage of the time » Anti-Tank Vehicle (ATV) turret is only credited with 37.5 hours of
operating time over a 48-hour mission in the OMS/MP
Terrain Type Miles (%)
Primary Road 10
Secondary Road 20
Trail 30
Cross Country 40
DOT&E will make independent decisions regarding what constitutes score-able test time
• Environmental stresses– OMS/MP may specify, for example, the
type of terrain the system is expected to endure
» ATV OMS/MP specifies:
CONOPS – Concept of OperationsOMS/MP – Operational Mode Summary/Mission Profile

7/7/2016-24
Using All of the Data Available
• Combining data across OT events has many advantages– More information to use in system assessment– Alleviates pressure to size test based on reliability requirement– Greater efficiency in testing– May not be possible to adequately assess some requirements
through Initial Operational Test (IOT) alone– In some cases, may even incorporate DT data
• However, the approach used to combine data must account for differences in data collection across phase
– How much does the system change from one phase to the next?– Is the system being operated by warfighters with the same level of
training in all phases?– Are the operating conditions the same across test phase?– Was data collection/scoring conducted in the same way across
different phases?

7/7/2016-25
Combining Operational Test Data: The Gray-Lewis Test
• Compare failure rates across two periods of testing– Different periods of time– Different system configurations (be careful with this one)– Different test venue
• The Grey-Lewis test is a formal statistical hypothesis test for comparing failure rates (𝝀𝝀)
𝑀𝑀0: 𝜆𝜆𝐼𝐼𝐼𝐼𝐼𝐼 = 𝜆𝜆𝐹𝐹𝐼𝐼𝐼𝐼𝑀𝑀1: 𝜆𝜆𝐼𝐼𝐼𝐼𝐼𝐼 ≠ 𝜆𝜆𝐹𝐹𝐼𝐼𝐼𝐼
– If failure rates are very different, the test periods should be evaluated separately
– If failures rates are roughly similar, we can combine the data for analysis
• CAUTION:– Best used when dealing with operational test data only – No way to get partial credit– Will only detect large deviations when the individual test durations are
small– The test cannot prove that you can combine information– The test can only prove that you cannot combine information

7/7/2016-26
Example: UAS IOT&E Reliability
• UAS is a small, tactical UAV– Five air vehicles, ground control station with four operator
work stations, launcher, recovery system, other surface components
– IOT&E conducted January through December, 2014 » 29 Palms» Camp Lejeune » Aboard USS Anchorage
• Test Event Similarities– Same test system– Same test personnel
• Differences– Surface components/configuration different aboard ship and
on ground– Environment (altitude, humidity, etc.) different across test
sites
Is it appropriate to combine data across these OT when estimating reliability?
Launcher
Land GSC Configuration
STUAS Recovery System

7/7/2016-27
Example: UAS IOT&E Reliability
Metric(Aborts)
Test Event Hours Aborts Value (hours) [80% CI]
Requirement Comparison1 of Reliability Data with 29 Palms
MFHBASystem
29 Palms 188.3 12 15.7 [10.6 – 24.1]50 hours
(≡82% probability of completing 10 hour
mission)
Lejeune 20.9 5 4.2 [2.3 – 8.6] p-value = 0.02
USS Anchorage 24.4 2 12.2 [4.6 – 45.9] p-value = 0.67
All 3 Phases 233.6 19 12.3 [9.0 -17.1]
29 Palms & Anchorage 212.7 14 15.2 [10.6 – 22.5]
MTBASurface
Components
29 Palms 379.6 6 63.3 [36.0 – 120.4]
240 hours
p-value = 0.66Lejeune 90.6 2 45.3 [17.0 – 170.4]
USS Anchorage 72.9 2 36.5 [13.7 – 137.1] N/A
29 Palms & Lejeune2 470.2 8 58.8 [36.2 – 101.0]
MFHBAAir
Vehicle
29 Palms 188.3 6 31.4 [17.9 – 59.7]
60 hours
Lejeune 20.9 3 7.0 [3.1 – 19.0] p-value = 0.053
USS Anchorage 24.4 0 15.2 LCB p-value = 1
All 3 Phases 233.6 9 25.9 [16.4 – 43.0]
29 Palms & Anchorage 212.7 6 35.5 [20.2 – 67.5]
Note 1: Gray-Lewis Two Sided Test for Exponential MeansNote 2: Only 29 Palms and Lejeune data can be combined. The surface components differ for shipboard configuration.
MFHBA – Mean Flight Hours Between AbortsMTBA – Mean Time Between Aborts
15.2 MFHBASystem ≡ 51.8% probability of completing 10 hour mission

7/7/2016-28
Leveraging DT Data for an OT Assessment
• Typically, we focus our reliability analysis to a single test period.
– But, shorter test periods, high reliability requirements, and/or few observed failures can result in little confidence in the reliability estimates.
• We can employ statistical approaches to capitalize on all available data from multiple test periods.
– In support of DOT&E, IDA has begun to explore improved techniques for estimating reliability using data from multiple test periods
• More advanced methodologies for assessing reliability are required.
– Censored Data– Generalized Linear Models – Bayesian Methodologies

7/7/2016-29
Bayesian Methodology – The Big Picture
Model for
Data
Data
LikelihoodL(data | θ) Inference
Priorf(θ)
Classical Statistics
The inclusion of the prior distribution allows us to incorporate different types of information into the analysis
Posteriorf(θ | data)

7/7/2016-30
Example: Family of Armored Vehicles Reliability
• Family of Combat vehicles*:– Infantry Carrier Vehicle (ICV)– Antitank Guided Missile Vehicle (ATGMV)– Commander’s Vehicle (CV)– Engineer Squad Vehicle (ESV)– Fire Support Vehicle (FSV)– Medical Evacuation Vehicle (MEV)– Mortar Carrier Vehicle (MCV)– Reconnaissance Vehicle (RV)
• Reliability Requirements: “The Armored Vehicle will have a reliability of 1000 mean miles between critical failure (i.e. system abort)”
• Leveraging Information across two test phases: DT and OT – There are known differences between DT and OT that should result in practical differences in their
reliability estimates: Test length, Road conditions, vehicle drivers and mission durations varied between DT and OT.
– Rather than consider each test phase and vehicle independently of each other, we can improve on the reliability analysis by using a statistical model to formally combine the data and make inference.
*The NBC RV was excluded from the study because of its different acquisition timeline.
Vehicles share a high degree of commonality.

7/7/2016-31
Family of Armored Vehicles
* A right censored observations occurs when the testing of the vehicle was terminated before a failure (i.e. system abort) was observed
Very limited information available for the MEV in both DT and OT
The DT Estimate was 2,197 MMBSAThe OT Estimate was 8,494MMBSA, because of limited miles on each vehicle and
only 1 observed failure

7/7/2016-32
Family of Armored Vehicles
Traditional Analysis:• Extremely wide confidence intervals!
Frequentist Analysis (Exponential Regression) & Bayesian Analysis: • Mean Miles Between System Aborts (MMBSA) estimate and intervals calculated using DT and OT data • Allows for a degradation in MMBSA from DT to OT • Leverages all information
– Better estimates of MMBSA and Tighter confidence intervals• Bayesian Analysis allows for an estimate of the MEV MMBSA
0
2000
4000
6000
8000
10000 Traditional AnalysisFrequentist AnalysisBayesian Analysis
Operational Test MMBSA Estimates(95% Confidence and Credible Intervals)
MM
BSA
ATGMV CV ESV FSV ICV MCV RV MEV
?

7/7/2016-33
Example: Ambulance Reliability
• The primary mission of the Ambulance-equipped unit is medical evacuation.
• Limited User Test – The Army conducted a Limited User Test (LUT) of the Ambulance to assess its capability to support rapid
collection, evacuation, and pre-hospital life support of combat casualties. The LUT provided human factors, safety, and reliability, availability, and maintainability (RAM) data.
• Reliability Requirements: – These vehicles have a mean miles between operational mission failure requirement of at least 600 miles.
• Leveraging information across two test phases: DT and LUT – There are known differences between DT and LUT that should result in practical differences in their
reliability estimates: test length, road conditions, vehicle drivers and mission durations varied between DT and LUT.
– Rather than consider each test phase independently of each other, we can improve on the reliability analysis by using a statistical model to formally combine the data and make inference.

7/7/2016-34
Bayesian Traditional Analysis Analysis
Greater precision in the estimate of MMBOMF during LUT
MM
BO
MF
• These vehicles have a MMBOMF requirement of at least 600 miles.
• There was one OMF in LUT (1,025 miles) and four OMFs in DT (3,026 miles)
– One flat tire in LUT– Three flat tires and one air conditioner failure in
DT
• The Ambulance MMBOMF was estimated to be 1,479 miles during LUT and 824 miles during DT
– Point estimate and credible intervals calculated using DT and LUT data (Bayesian statistical method)
Ambulance: Reliability
Method Phase MMBOMF 80% Confidence Interval
BayesianAnalysis
DT 824.4 (320.5, 1362.9)
LUT 1478.7 (141.4, 4610.8)
TraditionalAnalysis
DT 605.2 (326.3, 1243.9)
LUT 1025 (263.5, 9758.5)

7/7/2016-35
Combining Data Requires Forethought
• If the program wants to use DT data for OT:– Data collection procedures need to be consistent with OT
procedures» Time between failures» Failure modes identified
– PM should note which failure modes (and which corresponding failures observed in testing) are addressed by corrective actions between test events
• If the program wants to use data from earlier OT events for Initial or Follow-on Operational Test evaluation:
– Data collection procedures need to be consistent between OT events
What deviations from operational testing standards are acceptable and what deviations will preclude data from earlier test events from being used in evaluation?

7/7/2016-36
Combining Reliabilities: Assessing the Reliability of a Complex System
• One of the more difficult aspects of system reliability assessment is integrating multiple sources of information, including component, subsystem, and full system data, as well as previous test data or subject matter expert opinion.
• Reliability requirements for ships are often broken down into threshold for the critical or mission-essential subsystems.
• For example, the Capability Development Document for Small Shallow Ship (SSS) provides a reliability requirements for four functional areas.
– Sea Frame Operations, Core Mission, Mission Package Support, Phase II SUW Mission Package
– The target reliability for Core Mission is 0.80 in 720 hours.
• How do we assess the reliabilities of a system composed of multiple subsystems or components?
– Different Types of Data» On-demand, continuous underway, continuous full
– Not all subsystems have failures
The Bayesian approach to combining information from various subsystems/components and other sources to estimate full system reliability has many advantages.
USS Small Ship

7/7/2016-37
Example: Reliability of a Multi-Mission Ship
• Example: The Capability Development Document for SSS provides a reliability threshold for Core Mission functional area.
– The target reliability for Core Mission is 0.80 in 720 hours.
Assume the functional area is a series system: system is up if all subsystems are up.
Test Data
Critical Subsystem Total System Operating Time Operational Mission Failures
Total Ship Computing Environment (full-time) 4500 hours 1
Sea Sensors and Controls (underway) 2000 hours 3
Communications (full-time) 4500 hours 0
Sea Engagement Weapons (on-demand)
11 missions 2
Data are notional.

7/7/2016-38
Comparison of Results
ClassicalMTBOMF
ClassicalReliability at
720hrs
BayesianMTBOMF
BayesianReliability at
720hrsTSCE 4500 hrs
(1156 hrs, 42710 hrs)0.85
(0.54,0.98)3630 hrs
(1179 hrs, 6753 hrs)0.73
(0.54,0.90)
SSC 667 hrs(299 hrs, 1814 hrs)
0.33(0.09,0.67)
697 hrs(332 hrs, 1172 hrs)
0.31 (0.11,0.54)
Comm > 2796 hrs* > 0.77* 10320 hrs(1721 hrs, 18210 hrs)
0.83 (0.66,0.96)
SEW 0.82(0.58,0.95)
0.77(0.62,0.91)
CoreMission ????? 0.15
(0.05, 0.27)
* A conservative 80 percent lower confidence bound; frequentist MTBF does not exist
Comm – CommunicationsMTBOMF – Mean Time Between Operational Mission FailuresSEW – Sea Engagement WeaponsSSC – Sea Sensors and ControlsTSCE – Total Ship Computing Environment

7/7/2016-39
Qualitative Assessments of Reliability
• Mission impact of reliability– Reliability failures preclude mission accomplishment– Excessive failures cause low availability– Maintainers unable to keep up with pace of system failures if system
operated at OMS/MP-level tempo
• Investigation of failure modes– Are particular failure modes driving reliability estimates? – Are particular subsystems more prone to fail?– Are failures based on system use or do parts arrive broken “out of the
box”?
• Impact of sparing & redundancy on reliability– Redundancy may ameliorate impact of failures– Are sufficient spares available to maintain operational tempo?– Was the number of spares available to maintainers representative of real-
world operations? – Field-level vs. depot-level maintenance
• Do any observed failures modes have an impact on user safety?
• Are failures being charged to users or maintainers?

7/7/2016-40
Takeaway Points
• Reporting Reliability– Was the system sufficiently reliable to successfully conduct its mission?
» What is the demonstrated reliability? » Did the system meet its requirement? If not, what is the operational impact?» How does the system’s reliability compare to the legacy system?
• Reliability Models– To ensure estimates of reliability are accurate, choosing the correct
statistical model is crucial.
• Combining Information– There are sound statistical approaches that can be used to capitalize on
all available data in assessing the reliability of a system.