don't believe the hype: local ... -...
TRANSCRIPT

THE JOURNAL OF FINANCE • VOL. LXVII, NO. 2 • APRIL 2012
Don’t Believe the Hype: Local Media Slant, LocalAdvertising, and Firm Value
UMIT G. GURUN and ALEXANDER W. BUTLER∗
ABSTRACT
When local media report news about local companies, they use fewer negative wordscompared to the same media reporting about nonlocal companies. We document thatone reason for this positive slant is the firms’ local media advertising expenditures.Abnormal positive local media slant strongly relates to firm equity values. The effectis stronger for small firms; firms held predominantly by individual investors; andfirms with illiquid or highly volatile stock, low analyst following, or high dispersion ofanalyst forecasts. These findings show that news content varies systematically withthe characteristics and conflicts of interest of the source.
NOT ALL MEDIA STORIES are created equal. On June 9, 2004, May DepartmentStores Co. of St. Louis, Missouri announced that it planned to buy the MarshallField’s store chain. The next day, the St. Louis Post-Dispatch announced thenews to its readers as follows (emphasis added):
May Department Stores Co. announced Wednesday that it will buy theMarshall Field’s department store chain and a handful of Mervyn’s storesfor $3.24 billion in cash. May Chief Executive Gene Kahn said he had highhopes for Marshall Field’s, whose flagship store is an anchor in downtownChicago. “This is a banner day for May” Kahn said in an interview. “Allof us here are truly excited about the potential of this acquisition, and wethink it will reward the share owners handsomely.”1
∗Gurun is with School of Management, University of Texas at Dallas, and Butler is with JonesGraduate School of Management, Rice University. We thank Vikas Agarwal, Anup Agrawal, UtpalBhattacharya, Geoffrey Booth, Lee Ann Butler, Bill Cready, Hemang Desai, Steve Dimmock, TedFee, Ayfer Gurun, Charlie Hadlock, Doug Hanna, Steve Hillegeist, Zoran Ivkovic, Rick Johnston,Jayant Kale, Naveen Khanna, Omesh Kini, Qin Lei, Alina Lerman, Erik Lie, Dong Lou (AFADiscussant), Ram Natarajan, Barb Ostdiek, Joel Peress, Suresh Radhakrishnan, Michael Rebello,Chip Ryan, Andrei Siminov, Nitish Sinha (WFA Discussant), David Solomon, Mark Vargus, ScottWeisbenner, James Weston, seminar participants at University of Texas at Dallas, Universityof Alabama, Georgia State University, Southern Methodist University, Michigan State University,University of Iowa, Case Western Reserve University, McMaster University, the 2010 AFA meeting,and the 2011 WFA meeting for comments, and Adithya Surampudi and Mustafa Kamasak fortheir able research assistance. Kerry Hennigan provided excellent editorial assistance. We thankCampbell Harvey, an anonymous associate editor, and an anonymous referee for useful suggestionsthat helped us improve the paper substantially. Any errors are ours.
1 Bess, Allyce, “May Co. Will Buy Marshall Fields,” St. Louis Post-Dispatch, June 10, 2004, A1.
561

562 The Journal of Finance R©
The Wall Street Journal article on the same event began (emphasis added):
Winning a showdown between the nation’s two largest department-storecompanies, May Department Stores Co. agreed to buy the MarshallField’s chain from Target Corp. for $3.24 billion. May outbid FederatedDepartment Stores Inc., the owner of Bloomingdale’s and Macy’s. Thepurchase price is significantly higher than the loftiest analyst predictionsfor the sale.2
Both stories are based on the same underlying event. Yet by selective omis-sion (e.g., analyst predictions) and choice of words (e.g., CEO’s assessment ofthe acquisition), each conveys a very different impression of what happened.Gentzkow and Shapiro (2006) describe the choice to present information selec-tively as media slant. Such bias has been widely documented (e.g., Grosecloseand Milyo (2005)). In this paper, we investigate whether major U.S. newspa-pers exhibit such slant in their reports on local firms, the determinants of slant,and the consequences of slant for firm value.
We measure slant using the number of negative financial words in firm-specific news stories that are in a large database of news reported by DowJones Newswire, Wall Street Journal, and eight major local newspapers thatmeet our data requirements (Boston Globe, Chicago Sun Times, Denver Post,Pittsburgh Post-Gazette, San Francisco Chronicle, Seattle Post-Intelligencer, St.Louis Post-Dispatch, and Washington Post) between 2002 and 2006. To quantifyslant, we use the financial dictionary of Loughran and McDonald (2011).
Local media may act as watchdogs (Dyck, Volchkova, and Zingales (2008)).If local media are more likely to discover information from local sources (suchas employees and local suppliers) and report negative news that is as-of-yetundisclosed by a firm, local media stories may exhibit more negative slant intheir news compared to national media stories. In other words, proximity tonews sources and asymmetric disclosure by firms’ managers (Kothari, Shu, andWysocki (2009)) may cause local media to publish stories with negative slantbefore distant newspapers.
However, our results show that, on average and holding other factors con-stant, when the media report news about companies headquartered nearby—that is, local companies—they use fewer negative words compared to their re-ports about nonlocal companies. That is, rather than serving as watchdogs, wefind that local media in our sample act as cheerleaders. We refer to the abnor-mally positive slant that a firm receives from local media as “hype.” There areat least three reasons local newspapers may produce hype about local firms; wecharacterize these reasons as the catering hypothesis, the constrained reportinghypothesis, and the advertising hypothesis.
The first of these hypotheses relates to a demand-side source of hype: lo-cal media produce hype in response to demand from local readership for lessnegative stories. Local media may write favorably about local firms becauseemployees of local firms are more likely to be the audience of local newspapers.
2 Merrick, Amy, and Ellen Byron, “May Purchases Marshall Field’s from Target Corp.,” WallStreet Journal, June 10, 2004, A3.

Don’t Believe the Hype 563
If these employees demand favorable news about their company, then the localmedia may cater to them. Although the idea that local media cater the tone oftheir articles to address readers’ demand has intuitive appeal, our evidence isinconsistent with the catering hypothesis.
The second of these hypotheses relates to a supply-side source of hype inwhich local media’s capacity to produce critical reports is a binding constraint.Local coverage could be more positive if local reporters have more constrainedbudgets for investigating and reporting critically on companies. In such a case,local newspapers may be more likely to reproduce the qualitative content ofcompany press releases, which are likely to be positive in tone. Under theconstrained reporting hypothesis, local newspapers produce positive slant, butthis slant does not reflect a conflict of interest or a reporting bias per se.Constrained reporting is more likely when writing original stories is moredifficult, such as when firms are more opaque or complex. We use measuressuch as the firm’s organizational complexity and the readability of the firm’sfinancial reports to describe the complexity of a firm’s information environment.We find mixed evidence in support of this hypothesis.
The third of these hypotheses relates to a demand-side source of hype inwhich the corporate subjects of media stories demand less negative storiesabout themselves in the local media. Herman and Chomsky (1988) hypothe-size that the media cater to advertisers. Our third hypothesis formalizes thispossibility in our setting as the advertising hypothesis. We test whether localmedia slant is related to the advertising expenditures of local firms. Media,particularly local newspapers, generate a large proportion of their revenuesthrough advertising. For instance, according to Pew Research Center’s Projectfor Excellence in Journalism, advertising accounts for about 75% of newspaperrevenues during a period similar to our sample.3 This raises the question ofwhether advertising by local firms in local media creates a conflict of interestresulting in overly positive articles. Our results show that positive slant aboutlocal companies is strongly positively related to the local advertising budgetsof those companies.
One challenge to establishing evidence of a causal role of the advertisinghypothesis is that advertising expenses are likely to be endogenous—the char-acteristics of firms that make them likely to be the subject of media coveragemay also be the characteristics of firms that advertise a lot. We use an instru-mental variables approach to deal with this endogeneity. Our instruments fora given firm’s advertising expenditures in local and national media outlets areindustry-year averages (omitting the firm’s contribution to the average), whereindustry is classified by two-digit SIC codes. When we use this instrumentalvariable procedure, the magnitude of the local advertising effect on slant in-creases more than three-fold and the effect of national advertising on mediaslant becomes negligible. This finding establishes a causal relation betweenlocal advertising and local media slant. Our interpretation of this result isthat local media are more susceptible to conflicts of interest from advertising
3 See http://www.stateofthenewsmedia.org/2005/printable newspapers economics.asp.
564 The Journal of Finance R©
dollars than national media. This conflict of interest is particularly importantbecause it undermines local media’s potential role as a source of external gover-nance (Miller (2006), Dyck, Morse, and Zingales (2010), Dyck, Volchkova, andZingales (2008)).
To reinforce our instrumental variables approach, we use two alternativeempirical approaches. First, we use a propensity score matching method andshow that, after matching on multiple firm characteristics, local firms havesignificantly more positive slant than nonlocal firms, and firms that adver-tise in local newspapers receive significantly more positive slant than firmsthat do not advertise in local newspapers. Our second approach uses a quasi-natural experiment. Local newspapers in two of our sample cities, Pittsburghand St. Louis, faced new competition for their advertising revenues when anonline posting site, Craigslist, entered their markets in October 2003. Based onextensive anecdotal evidence that Craigslist sapped noncorporate advertising(classifieds) revenues from newspapers, we hypothesize that Craigslist’s entryinto these cities made the Pittsburgh Post-Gazette and St. Louis Post-Dispatchmore susceptible to supplying slant in response to corporate advertising. Con-sistent with the argument that a corporation’s local advertising causes localmedia to provide more positive slant, we find evidence that sensitivity of localmedia slant to firms’ local media advertising increased after Craigslist’s entryinto their market.
We also examine whether local media slant matters for firms. Because stockmarket participants may rely on information from the media in making in-vestment decisions, we examine whether abnormal local media slant relatesto firms’ stock market valuations. We find that it does. In a portfolio setting, along-short portfolio based on abnormal local media slant (i.e., long stocks withcomparatively low abnormal local media slant and short stocks with compara-tively high abnormal local media slant) generates annual abnormal returns of5.52%, controlling for other well-known asset pricing factors and including afactor premium for no media coverage.
In regressions of Tobin’s Q on abnormal local media slant and a vector ofcontrol variables, a one standard deviation increase in abnormal local me-dia slant is associated with 4.29% higher firm value on average. When weparse the sample we find this relation appears only in firms with relativelypoor information environments and/or high arbitrage costs, consistent withthe view that local slant might impact a firm’s value if the marginal investor inthe firm’s stock is a local investor. Hong, Kubik, and Stein (2008) proposea theory that investigates the asset pricing implications of local bias andpresent empirical findings consistent with ours: local investors are likely tobe marginal investors of less visible local firms. We find that local media slanthas a stronger effect on firm value for firms in which arbitrage trades arelikely to be costly (illiquid firms and firms with high idiosyncratic volatility),firms that are otherwise informationally opaque (small firms, firms with littleanalyst following, firms that have high dispersion of analyst forecasts), andfirms that are predominantly owned by individual, rather than institutional,investors.

Don’t Believe the Hype 565
Our results shed some light on home bias, one of the puzzling empiricalfindings in the literature on how market participants invest. Home bias isthe phenomenon whereby people tend to invest disproportionately in the com-panies to which they are geographically close. The literature on home biassometimes attributes this local preference to the possibility that investors’proximity to local firms facilitates the acquisition of disproportionately accu-rate value-relevant information (Van Nieuwerburgh and Veldkamp (2009)). Ourresults suggest a different channel: because of their proximity to local firms,investors acquire disproportionately positive (though not necessarily more ac-curate) value-relevant information from local media.
The paper proceeds as follows. Section I provides a detailed discussion ofwhy local media matter for information production and how advertising affectsnewspapers. Section II describes the paper’s data and methods. Section IIIdiscusses our main results. Section IV concludes.
I. Why Should Local Media Matter for Information Production?
The local media may matter to investors or firms. First, if the local mediaare one of the sources for the national media, then it is possible that partof the national media’s content is bolstered by information provided by localmedia. As such, linguistic media content—the tone that derives from articles’word choices—at the local level may capture previously overlooked informationabout companies above and beyond the information contained in other sourcessuch as earnings announcements, corporate disclosures, analysts’ forecasts,rating agencies’ assessments, and so forth. Second, the local media are morelikely to be followed by a local audience. For instance, a recent survey by theReadership Institute of Northwestern University finds that local papers havemuch higher local readership than other papers—in 2006, 71% of respondentsread a local paper whereas 24% read a paper other than (or in addition to) alocal paper. Thus, story content and tone in local media may be a potentiallyimportant source of information to investors because local media are one ofthe information channels that local investors have a comparative advantage(though not necessarily absolute advantage) at accessing. We test whether theslant of articles by local media about local firms is different from the slant ofarticles about nonlocal firms.
There are several reasons why we might expect slanted news on average.For instance, one role the media can play is providing external corporate gov-ernance and monitoring firms, thereby influencing investors and the generalpublic (Dyck, Volchkova, and Zingales (2008)). Companies might try to managetheir relationship with the media through investments in public relations andcorporate social responsibility events.
Another channel that connects firms and media outlets is firms’ advertis-ing activities. Advertising constitutes a significant portion of local newspa-per revenues, and media outlets may want to avoid writing negative storiesabout firms that advertise heavily and risk alienating those firms. There ismuch anecdotal evidence that firms’ advertising choices and expenditures are

566 The Journal of Finance R©
related to the qualitative nature of the coverage they receive from the me-dia, such as around product recalls, unflattering product reviews, and editorialanalysis4. Whether the collective force of corporate advertising has any ef-fect on media content is an empirical question, and one of the focuses of ourpaper.
If local media matter for information production about firms, media slantmay be correlated with firm value for two reasons. First, local media mayimprove the information environment, and therefore reduce the informationasymmetry between investors and firms. Second, the local media may influencethe perceptions and sentiment of individual investors. We expect individualinvestors to be influenced by the slant that local media create to a greaterextent than institutional investors. If this channel links media slant to firmvalue, then we expect a contemporaneous association between media slant anda firm’s value.
Previous work on media slant emphasizes the biases generated by advertis-ing pressure (Reuter and Zitzewitz (2006)), media ownership (Besley and Pratt(2006)), the influence of board members with media expertise (Gurun (2010)),competition for audience (Baron (2005), Mullainathan and Shleifer (2005),and Gentzkow and Shapiro (2006)), whether media hype can create bubbles(Bhattacharya et al. (2009)), and the quid pro quo between journalists andsources (Dyck and Zingales (2003)). Our paper extends this literature by pro-viding evidence that media bias not only has geographical attributes, but alsovaluation implications for some firms.
II. Data Description
We collect data on firm-specific news published by local newspapers, as wellas a firm’s advertising expenditures, location, financial analyst following, andinstitutional ownership. We obtain stock return and accounting data fromCRSP/COMPUSTAT. Data on financial analyst coverage come from First Call.We use SEC 13-F filings for all reporting institutions to construct firm-levelinstitutional ownership.
A. Advertising Measures
We obtain monthly advertising information from the TNS Media Intelligence(TNSMI) database for the 2002 to 2006 period. TNSMI gathers its data by con-tinually monitoring multiple media channels and collecting information aboutobserved advertisements. The media channels include advertising expendi-tures by firms in newspapers, network TV, cable TV, magazines, and networkradio (see Appendix A for the list of categories covered by the advertisingdatabase). Of these categories, we focus on two newspaper-related advertising
4 Adams, Russell, “Major Detroit Newspaper Takes Cues from Advertisers,” Wall Street Journal,November 2, 2009. Motavalli, Jim, “Toyota Dealers Pull Ads on ABC for ‘Excessive Stories’ onRecalls,” Wall Street Journal, February 9, 2010. Rhee, Joseph, and Mark Schone, “Toyota DealersPull ABC TV Ads; Anger over ‘Excessive Stories’,” http://abcnews.go.com/Blotter/toyota-dealers-pull-abc-tv-ads-anger-excessive/story?id=9776474, February 8, 2010.

Don’t Believe the Hype 567
expenditures: (1) National newspaper dollars, and (2) Newspaper dollars. Thefirst category measures advertising in three national newspapers: New YorkTimes, USA Today, and Wall Street Journal. Advertising expenditures spent inregional editions of these newspapers are also included in this category. Thesecond category measures advertising expenditures in any of over 250 dailyand Sunday newspaper editions and Sunday magazines. That is, the secondcategory pertains to newspaper advertising that is not at the national level(i.e., not included in category (1)). Although the data allow us to observe howmuch firms spend in these categories, the data do not identify which specificlocal/national newspaper they used.
The database reports media spending by brand. For example, media spendingby Johnson & Johnson is reported separately by its brands, which includeBand-Aid, Tylenol, Neutrogena, etc. We aggregate the advertising outlays ofall brands that belong to a particular sample firm. We use the names of thesecompanies and the SOUNDEX algorithm5 of SAS to match firm identifiers inother databases such as CRSP. After generating a list of potential matches tothe name, we hand-match the names to the corresponding PERMNO number(CRSP Identifiers) by inspecting the firm’s name using a conservative approach:names for which we cannot identify a unique match are excluded from thesample. As a result, from a total of 9,604 company names that exist in CRSPover our sample period, our matching procedure matches 1,457 unique companynames in the TNSMI database. The frequency of most TNSMI data is weekly;however, the variables we are interested in present little variation during amonth for two reasons: (1) often the data provider divides monthly advertisingexpenditures by four to get to the weekly frequency if the weekly frequency isnot available, and (2) companies themselves sometimes report data based onsimply dividing their monthly advertising budget into weeks. To minimize theimpact of such measurement errors, we conduct our analysis at the monthlyfrequency.
B. Firm Location
We collect company location information (zip codes) from Bloomberg andobtain local newspaper locations from newspaper websites. We then identify thelatitude and longitude for each county from the U.S. Census Bureau’s GazetteerPlace and Zip Code Database. Following Ivkovic and Weisbenner (2005), wecompute distances between media outlets and firms using the latitude andlongitude information.
C. Local Newspapers and National News Outlets
Our news stories come from media that have a content agreement withFactiva in 2001 and are in the database from 2002 to 2006. We collectfrom Factiva the lead paragraphs of stories from eight local newspapers
5 SOUNDE is a phonetic algorithm developed by Robert C. Russell and Margaret K. Odell forindexing names by sound as pronounced in English. For further information on this algorithm, seehttp://www.archives.gov/research/census/soundex.html.

568 The Journal of Finance R©
(Boston Globe, Chicago Sun-Times, Denver Post, Pittsburgh Post-Gazette, SanFrancisco Chronicle, Seattle Post-Intelligencer, St. Louis Post-Dispatch, andWashington Post), one national newspaper (Wall Street Journal), and anewswire (Dow Jones Newswire). Appendix B provides additional informationabout the location of the local newspapers.
Dow Jones Newswire differs from other outlets because, unlike traditionalnewspapers, Dow Jones Newswire has no physical capacity constraint in termsof number of print pages available to run stories. We refer to Dow JonesNewswire as a “national” news outlet with the idea being that a wider au-dience can more easily follow it compared to local newspapers.
Not all local newspapers provide content to Factiva. Our sample does notinclude several large metropolitan newspapers (such as Los Angeles Times)because Factiva blocks their content to public libraries and universities. Oursample selection requirement also excludes local newspapers such as DallasMorning News and Miami Herald that have inadequate coverage in Factiva.For Dallas Morning News, for example, Factiva reports “Factiva’s agreementwith the Dallas Morning News calls for the ‘daily’ text of the Dallas MorningNews to be sent to Factiva from March 28, 2003 forward, but not for archivedcontent information prior to March 28, 2003. There would also be a conflictfor material older than 2002 because of certain effects of the Tasini v. NewYork Times Supreme Court decision . . . ”6 We exclude newspapers that are con-strained by such content sharing.
In order to match news stories to other databases, we use the ticker symbols,firm names, and name variants of the stocks from the CRSP database as thesearch strings in Factiva. The name variants we use include singular andplural versions of the following abbreviations from the company names: ADR,CO, CORP, HLDG, INC, IND, LTD, and MFG. The search algorithm and namematching can be done in various ways. Our search algorithm first searchesfor capital letters within brackets (e.g., GM, the ticker symbol for GeneralMotors) in the title and lead paragraph. If no match is found, then we searchfor the name and name variants. We use the CRSP company name changefile to identify situations in which a firm changes its name. Newspapers mayreport on companies that are bankrupt or that will go public in an initial publicoffering (IPO). In order to accommodate this possibility, we keep the names offirms before an IPO and after delisting for an additional 6-month period.
In searching for news stories featuring the company names, we follow theguidelines provided by Tetlock, Saar-Tsechansky, and Macskassy (2008) exceptthat we do not limit our sample firms to those in the S&P 500. Because of thelarge number of firms and news stories, we use an automated story retrievalsystem. We construct a query that specifies firm names to be searched. Thesystem then submits the query and records the retrieved stories. In total,
6 In Tasini v. New York Times, freelance writers complained that their work was posted on theInternet without their permission and, in some cases, was used to earn extra revenue for publisherswho sold access to the archived material. The court found that publishing the same article in printand online is two separate things when it comes to copyright.

Don’t Believe the Hype 569
we retrieve the lead paragraph of over 330,000 qualifying news stories—over240,000 from Dow Jones Newswire, over 60,000 from Wall Street Journal, andthe rest from local newspapers—containing over 100 million words between2002 and 2006.
D. Measure of Slant
Previous papers that quantify the qualitative content of news stories useas a measure of interest scaled counts of certain words. These quantitativemeasures have been dubbed “media content” (Tetlock (2007)), “media slant”(Gentzkow and Shapiro (2008)), and “media bias” (Dyck, Volchkova, and Zin-gales (2008)). We use the negative and positive word categorization of theLoughran and McDonald (2011) dictionary to count the number of negativeand positive words in a given news story. The Loughran and McDonald (2011)dictionary differs from other dictionaries used in research using context anal-ysis in that it includes financial words that carry negative or positive tone. Wemake the simplifying assumption that all negative words in the predetermineddictionary are equally informative, and other words are uninformative. TheLoughran and McDonald (2011) dictionary lists 2,337 words as negative and353 words as positive. We measure a story’s slant according to the frequency ofnegative financial words in each news story. Each of the stories in our samplemeets certain requirements that we impose to eliminate irrelevant stories andblurbs. Specifically, we require that each firm-specific story include the firm’sofficial name at least once within the first 25 words of the lead paragraph ofthe article and the headline. We further require that each story have at least50 words in total. Using more stringent filters for story requirements, suchas requiring at least five words that are either positive or negative, or requir-ing that at least three of the five positive/negative words be unique, does notchange our results.
It is possible that some words in an article that are classified as negative orpositive may not truly relate to the company. This creates noise in the measureof positive or negative content. With more than 100 million words in our sample,a more hands-on approach of subjectively assessing the information content ofeach word is not feasible. The noise inherent in our measure is thus the cost ofhaving a large sample and eschewing the use of subjective judgment.
As our primary measure of media slant, we use the fraction of negative wordsto total words in each news story. We then transform this measure into a mea-sure of positive slant by multiplying it by −100. Our slant measure is thereforebounded between −100 and zero, with higher values indicating more positiveslant, that is, less usage of negative words. We prefer this method to using afraction of positive words to total words because negative information may havemore impact than positive information (see Tetlock (2007), Baumeister et al.(2001), and Rozin and Royzman (2001)). To reduce our computational burden,before counting instances of negative words we produce a “composite story” bycombining all qualifying news stories from a given media outlet for each firm ina given month, which gives us a panel of firm-month-outlet observations. (We

570 The Journal of Finance R©
note that we obtain similar results if we use shorter windows—for examplebiweekly or weekly—to combine the articles. Using shorter windows increasesthe likelihood that articles in different media outlets cover the same event orissue, but shorter windows also mean that the advertising data are measuredwith error.) Formally, we define the following measure:
Slantitm = −100 × number of negative wordsnumber of total words
,
where i is the firm identifier, t is the month, and m is the media outlet. We notethat newspapers may have their own editorial dictionaries and news writingstyles, and these styles can change over time based on editorial preferences. Ourresults do not change when we standardize Slant by the mean and standarddeviation of media outlets’ slant over prior years.
III. Results and Discussion
This section presents our empirical results.
A. Summary Statistics
Table I reports firm characteristics of the 5,330 CRSP-listed firms that weinclude in the empirical analysis. (We note that some of our tests use fewer firmsdue to data limitations.) For a firm-month-outlet observation to be included inthe analysis, we require that there exist at least one monthly composite story.The annual news coverage variables in Table I report the number of timesin a given year that newspapers (both local and national) report a story on acompany. On average, a company appears in our news sample an average of2.01 times per year.
Compared to the universe of COMPUSTAT firms for the same 2002 to 2006time period, our sample contains larger firms. The pooled average firm size inthe sample is 3.6 billion dollars in assets, with a median of 379 million dollarsin assets, whereas the pooled average firm size in COMPUSTAT is 3.1 billiondollars in assets with a median of 271 million dollars in assets. For our sam-ple, Tobin’s Q has a mean of 1.52 and median of 1.10. The average number ofanalysts following a firm’s stock is 3.65, which is statistically larger than theaverage analyst following of COMPUSTAT firms (1.93). The average institu-tional ownership in our sample (47%) is also high compared to the universe offirms covered in COMPUSTAT (35%).
The average annual total advertising expenses to sales ratio as reportedin COMPUSTAT for our sample firms is about 0.011, with a median of zero.This figure corresponds to annual advertising spending of 320 million dol-lars. Local newspaper advertising outlays tracked by the TNSMI database are0.29 million dollars annually, on average, and national newspaper advertisingoutlays tracked by the TNSMI database are $1.49 million annually, on aver-age, for the same set of firms. The correlation between the annual advertising

Don’t Believe the Hype 571
Table IDescriptive Statistics on Companies
This table summarizes the characteristics of the firms analyzed in the paper. The sample pe-riod is 2002 to 2006. The unit of observation is the firm-year. For the COMPUSTAT column, wecode missing observations of Advertising Expenditures, R&D Expenses, CAPX, Analyst Following,Institutional Ownership, Annual National, and Local Media Coverage as zero. A description of thevariables is provided in Appendix C.
COMPUSTATMean Median SD 75%ile 25%ile Mean
Market value of equity(million $)
3,567 379 15,863 1,509 90 3,126
Book leverage 0.429 0.463 0.750 0.672 0.234 0.320Momentum 0.220 0.102 0.826 0.381 −0.153 0.210Idiosyncratic risk 0.131 0.103 0.098 0.163 0.068 0.121R&D expenses/sales 0.045 0.000 1.800 0.058 0.000 0.042Advertising
expenditures/sales0.011 0.000 0.039 0.007 0.000 0.009
CAPX/sales 0.467 0.026 42.585 0.057 0.010 0.055Tobin’s Q 1.517 1.102 1.744 1.818 0.656 1.618ROA 0.008 0.024 0.320 0.077 −0.018 0.017Analyst following 3.645 1.000 5.254 5.000 0.000 1.930Institutional ownership (%) 0.479 0.509 0.321 0.761 0.171 0.351Number of employees 10.092 1.118 41.340 5.400 0.256 9.019Employees/population
(×1,000)0.356 0.004 3.851 0.025 0.001 0.293
Number of segments 1.713 1.000 1.302 2.000 1.000 1.457Plain English 0.668 0.474 2.219 2.193 −0.908 0.671Annual nat’l and local media
coverage2.014 1.609 1.752 2.565 1.099 3.996
Local newspaper advertising(million $)
0.286 0.000 3.214 0.000 0.000 n/a
Nat’l newspaper advertising(million $)
1.493 0.000 19.139 0.000 0.000 n/a
Slant −1.689 −1.087 1.940 −0.556 −2.051 n/a
expenses reported in COMPUSTAT and the annual newspaper-related adver-tising in our database is 0.36. The mean value of our sample firms’ advertisingexpenditures as a percentage of sales (0.011) is statistically not different fromthat for the average COMPUSTAT firm (0.009). In our sample, on average eachyear 42% of firms have nonzero advertising spending. For large firms (abovesample median assets), this percentage is 47%; for small firms (below samplemedian assets), this percentage is 38%.
Table II reports summary statistics for our slant measure (defined above) byeach media outlet. We report the distribution of composite stories, number offirms covered, and slant (about a firm for a given media outlet in a particularmonth) by the geographical location of firms with respect to each local newspa-per. For each firm-media outlet pair, we construct the dummy variable LocalFirm. This variable takes a value of one if the firm’s headquarters is within
572 The Journal of Finance R©
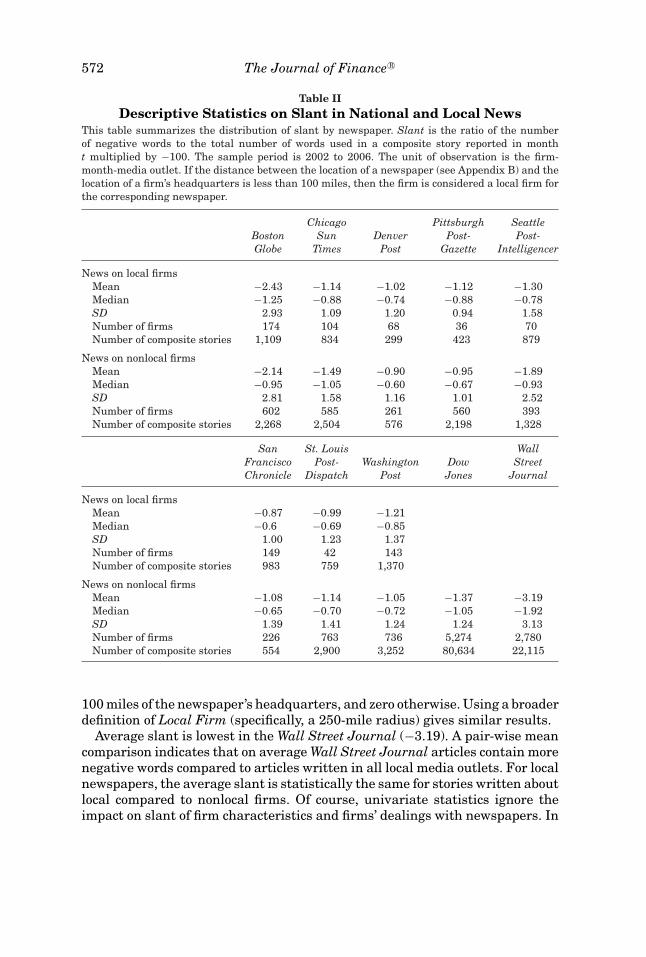
Table IIDescriptive Statistics on Slant in National and Local News
This table summarizes the distribution of slant by newspaper. Slant is the ratio of the numberof negative words to the total number of words used in a composite story reported in montht multiplied by −100. The sample period is 2002 to 2006. The unit of observation is the firm-month-media outlet. If the distance between the location of a newspaper (see Appendix B) and thelocation of a firm’s headquarters is less than 100 miles, then the firm is considered a local firm forthe corresponding newspaper.
Chicago Pittsburgh SeattleBoston Sun Denver Post- Post-Globe Times Post Gazette Intelligencer
News on local firmsMean −2.43 −1.14 −1.02 −1.12 −1.30Median −1.25 −0.88 −0.74 −0.88 −0.78SD 2.93 1.09 1.20 0.94 1.58Number of firms 174 104 68 36 70Number of composite stories 1,109 834 299 423 879
News on nonlocal firmsMean −2.14 −1.49 −0.90 −0.95 −1.89Median −0.95 −1.05 −0.60 −0.67 −0.93SD 2.81 1.58 1.16 1.01 2.52Number of firms 602 585 261 560 393Number of composite stories 2,268 2,504 576 2,198 1,328
San St. Louis WallFrancisco Post- Washington Dow StreetChronicle Dispatch Post Jones Journal
News on local firmsMean −0.87 −0.99 −1.21Median −0.6 −0.69 −0.85SD 1.00 1.23 1.37Number of firms 149 42 143Number of composite stories 983 759 1,370
News on nonlocal firmsMean −1.08 −1.14 −1.05 −1.37 −3.19Median −0.65 −0.70 −0.72 −1.05 −1.92SD 1.39 1.41 1.24 1.24 3.13Number of firms 226 763 736 5,274 2,780Number of composite stories 554 2,900 3,252 80,634 22,115
100 miles of the newspaper’s headquarters, and zero otherwise. Using a broaderdefinition of Local Firm (specifically, a 250-mile radius) gives similar results.
Average slant is lowest in the Wall Street Journal (−3.19). A pair-wise meancomparison indicates that on average Wall Street Journal articles contain morenegative words compared to articles written in all local media outlets. For localnewspapers, the average slant is statistically the same for stories written aboutlocal compared to nonlocal firms. Of course, univariate statistics ignore theimpact on slant of firm characteristics and firms’ dealings with newspapers. In

Don’t Believe the Hype 573
the next section, we control for these factors and investigate the relationshipbetween localness and slant.
B. Local Firms and Media Slant
In Table III, we examine the determinants of slant in newspaper media. Wehypothesize that slant is a function of firms’ proximity to the location of thenewspaper. The first regression in Table III shows one of our main results: thecorrelation between slant and a dummy that denotes whether a firm is geo-graphically close to media outlets is positive and statistically significant aftercontrolling for firm-month fixed effects. This specification forces identificationthrough variation in slant across newspapers, controlling for the timing of newsevents for a given firm. Our firm-month dummies subsume all our other controlvariables, and so the controls are omitted. In this specification, we find thatthe coefficient estimate on Local Firm is 0.515. The interpretation of this resultis that local media outlets write more positive stories about local firms thanthey do about nonlocal firms, controlling for the information environment for agiven firm and for the average slant of a given media outlet.
The firm-month fixed effects provide clean identification but obscure otherinteresting variation in the data. In the next specification, we omit the strin-gent firm-month fixed effects and regress newspapers’ monthly slant on LocalFirm, proxies to test the catering hypothesis and the constrained reporting hy-pothesis, and several control variables. We consider the advertising hypothesisseparately below. The number of observations drops by almost half when weadd variables to the regressors.
To test the catering hypothesis, we include variables that capture readers’demand for slanted news. If employees of local firms are more likely to be theaudience of local newspapers and if these employees demand favorable newsabout their company, then the local media may cater to them. Accordingly, weinclude in our specification (1) the log of the number of firm employees and (2)the number of employees scaled by the population of the local media’s coveragearea. We use COMPUSTAT’s data on total number of employees.
To test the constrained reporting hypothesis, we include variables that cap-ture a media outlet’s inclination to reproduce, paraphrase, or play off of com-pany press releases. Our first variable measures the readability of a firm’sfinancial reports. A resource-constrained journalist is likely to spend less timeand effort to decipher a financial report that is difficult to read and understand.We use the Plain English measure developed by Loughran and McDonald(2010) as our measure of the complexity of a firm’s information environment.Higher values of this measure indicate SEC filings (e.g., 10Ks) that are eas-ier to read. Our second measure is the number of business segments (per theCOMPUSTAT segment files) in a firm. We hypothesize that the complexity ofanalyzing a firm will be more difficult as the number of business segmentsincrease.
Our control variables include firm characteristics that might affect slantabout the company: log of firm size, return on assets, book leverage,

574 The Journal of Finance R©
Table IIIDeterminants of Media Slant, Catering, and Constrained Reporting
HypothesesThis table reports the results of the following pooled OLS regression: Slant = a + b × Local Firm +c × Controls + d × Fixed Effects + residual. The unit of analysis is the firm-month-media outlet.Slant is the ratio of the number of negative words to the total number of words used in a com-posite story reported in month t multiplied by −100. The regressors are defined in Appendix C.Heteroskedasticity-robust standard errors are clustered by firm and provided in parentheses. ∗∗∗,∗∗, and ∗ represent statistical significance at the 1%, 5%, and 10% levels, respectively.
Slant Slant Slant
Local firm 0.515∗∗∗ 0.192∗∗∗ 0.325∗∗∗(0.033) (0.055) (0.041)
Log(market value) 0.142∗∗∗ 0.092∗∗∗(0.013) (0.022)
ROA 0.160∗∗∗ 0.168∗∗∗(0.029) (0.039)
Book leverage −0.035 0.140∗(0.052) (0.077)
Analyst following 0.001 0.002(0.002) (0.002)
Inst. ownership (%) −0.128∗∗ 0.128∗∗(0.050) (0.065)
Momentum 0.064∗∗∗ 0.062∗∗∗(0.008) (0.009)
Idiosyncratic volatility −0.787∗∗∗ −0.366∗∗(0.143) (0.146)
Return 0.262∗∗∗ 0.219∗∗∗(0.045) (0.044)
Sales growth 0.006 0.042(0.007) (0.063)
Log(employees) −0.040∗∗∗ 0.126∗∗∗(0.014) (0.038)
Employees/population −7.603∗∗∗ −16.886∗∗∗(1.999) (1.657)
Number of segments 0.004 0.003(0.009) (0.014)
Plain English 0.016∗∗ 0.002(0.006) (0.007)
Firm fixed effects Subsumed No IncludedMedia fixed effects Included Included IncludedIndustry fixed effects Subsumed Included SubsumedMonth fixed effects Subsumed Included IncludedFirm-month fixed effects Included No NoConstant Included Included Included
N 124,585 69,334 69,334Adjusted-R2 0.43 0.19 0.27
analyst following, percentage of institutional ownership, prior 12-month re-turn, idiosyncratic volatility, current month return, and sales growth. Severalof our control variables (log of firm size, analyst following, and percentageof institutional ownership) characterize companies’ information environment.

Don’t Believe the Hype 575
Information asymmetry between the firm and investors may affect media slant.For instance, if the media serve as an external governance mechanism, thenthis role may impact the disclosure behavior of firm managers because whatthe media report is often supplied by the management.7
Using publicly traded companies in our analysis is an advantage of our em-pirical design. We can control for the market’s perception of a firm’s prospectsby including prior stock return variables in our regressions. For instance, whenthe market views a firm favorably, stock prices tend to go up. The stock mar-ket return variables that we use in our tests are: momentum (prior 12-monthstock return), idiosyncratic volatility, and current month return. We also in-clude accounting variables—sales growth, book leverage, and return on assets(ROA)—to capture the overall financial health of the firm. If the firm is notdoing well, it could be subject to more media coverage with a more negativeslant.
To capture the possibility that some outlets are systematically more positiveor negative than others, we also include media outlet fixed effects. We furthercontrol for unobserved heterogeneity by including industry fixed effects (basedon two-digit SIC classifications), month dummies, and an intercept term. Wenote that excluding Dow Jones Newswire, dividing the sample into two sub-periods, or using alternate industry definitions does not alter our results. Wecompute heteroskedasticity-robust standard errors that are adjusted for clus-tering by firm.
Our baseline regression, the second specification in Table III, includes allthe variables mentioned above and the fixed effects for media outlet, industry,and month. The results do not support the catering hypothesis: the coefficientson both the log of the number of employees and number of employees scaledby coverage population are negative, suggesting that slant is higher for firmswith fewer employees and firms with a smaller share of the local population.These findings are inconsistent with catering by newspapers to firms’ employ-ees. Unfortunately, the COMPUSTAT employment data do not allow us toidentify the number of local employees around firm headquarters. To exam-ine the impact of potential measurement problems, in untabulated regressionswe restrict our sample to firms with a single business segment because suchfirms are less likely to have geographically diffused employees. Our results donot change. Further restricting the sample to single-segment firms that have
7 See McChesney (2003) for a detailed discussion of the information sources used by the media.Kothari, Shu, and Wysocki (2009), Healy and Palepu (2001), and Verrecchia (2001) provide adetailed discussion of factors affecting disclosure behavior. For example, litigation risk may forcemanagers to quickly reveal bad news to outside investors (Kasznik and Lev (1995), Skinner (1994)).Managers may also time the release of bad and good news to increase the value of their optiongrants or the sale price of their stock. Frankel, McNichols, and Wilson (1995) report that managersrelease good news prior to raising external finance. Yermack (1997) and Aboody and Kasznik (2000)show that managers accelerate bad news and/or withhold good news in the period immediatelypreceding option grant dates to lower the exercise price of the options and thus increase the valueof their option-grant portfolios. Managers also have incentives to withhold bad news when theyface opposite incentives, such as career concerns (e.g., promotion, employment opportunities withinand outside the firm, and potential termination).

576 The Journal of Finance R©
below-median employee size also leaves the results qualitatively unchanged.In addition, because both variables that we use to capture the catering effecthave high variation compared to their medians, in untabulated results we useoutlier-robust regression to see if the results are driven by firms with few ormany employees. We find that they are not.
The negative coefficients on the catering proxy variable suggest that, on av-erage, the media in our sample are more critical of firms with more employees.This result could arise for a couple of reasons. First, bad news may be morelikely to leak to the media for a firm that has more employees. Second, themedia may voice the concerns of employees or unions.
We also do not find support for the constrained reporting hypothesis. Thishypothesis predicts that news of more complex firms will have higher slant.Inconsistent with the constrained reporting hypothesis, we find that firms witheasier-to-understand financial statements have higher slant, as indicated bythe positive coefficient on Plain English. Our other measure of complexity,Number of Segments, is insignificant.
The result that local firms receive abnormally positive stories remains qual-itatively unchanged. The results of the baseline results in Table III supportthe notion that local media provide more positive slant (larger reporting bias)for local firms compared to nonlocal firms. The coefficient on Local Firm is0.192 and statistically significant. To put this magnitude in perspective, thecoefficient estimates suggest that the difference in slant for local compared tononlocal firms is the same as a firm improving its profitability (as measured byROA) by almost a full standard deviation.
In the third specification, we replace industry dummies with firm fixed ef-fects. Here, identification comes from the different nature of stories about agiven firm across newspapers. If some omitted firm-specific, time-invariantfactors drive the results in our first specification, adding firm dummies willcapture the impact of these factors. The coefficient estimate on Local Firm ismore than 50% higher than the estimates obtained in the previous specifica-tions. Thus, even within-firm, cross-media localness is related to slant.
C. Advertising Dollars and Local Media Slant
Newspapers get much more of their revenue from advertising than from sub-scriptions; for instance, in 2006, advertising revenues were about 65% of totalrevenues at the New York Times. If local firms are more likely to provide asignificant amount of local newspapers’ revenues, then it is possible that localnewspapers may choose the tone of the news so as to protect its future revenues.We test this advertising hypothesis by including variables on how many adver-tising dollars firms spend in national media (log of national newspaper adver-tising) and local media (log of local newspaper advertising) in that month in ourbaseline specification (i.e., Table III, Column 2). Using prior 1-month, 3-month,6-month, or 12-month rolling advertising expenditures gives similar results.
Requiring advertising expenditure data for our tests reduces the number ofobservations from that of Table III. First, in Column 1 of Table IV we re-run

Don’t Believe the Hype 577
Tab
leIV
Med
iaS
lan
tan
dA
dve
rtis
ing
Hyp
oth
esis
Th
efi
rst
thre
eco
lum
ns
ofth
eta
ble
repo
rtth
ere
sult
sof
the
foll
owin
gpo
oled
OL
Sre
gres
sion
:S
lan
t=
a+
b×
Loc
alF
irm
+c
×L
og(L
ocal
Ad
vert
isin
g)+
d×
Log
(Nat
ion
alA
dve
rtis
ing)
+e
×C
ontr
ols
+f×
Fix
edE
ffec
ts+
resi
dual
.Th
ela
stth
ree
colu
mn
sof
the
tabl
ere
port
the
firs
t-an
dse
con
d-st
age
resu
lts
ofth
e2S
LS
regr
essi
onth
atu
ses
the
log
ofin
dust
rylo
cala
nd
nat
ion
alad
vert
isin
gsp
endi
ng
for
Loc
alA
dve
rtis
ing
and
Nat
ion
alA
dve
rtis
ing
asin
stru
men
ts.
We
excl
ude
the
firm
’sco
ntr
ibu
tion
toin
dust
ryav
erag
ew
hen
calc
ula
tin
gth
ein
stru
men
ts.
Th
eu
nit
ofan
alys
isis
the
firm
-mon
th-m
edia
outl
et.T
he
depe
nde
nt
vari
able
,Sla
nt,
isth
era
tio
ofth
en
um
ber
ofn
egat
ive
wor
dsto
the
tota
lnu
mbe
rof
wor
dsu
sed
ina
com
posi
test
ory
repo
rted
inm
onth
tm
ult
ipli
edby
−100
.Th
ere
gres
sors
are
defi
ned
inA
ppen
dix
C.H
eter
oske
dast
icit
y-ro
bust
stan
dard
erro
rsar
ecl
ust
ered
byfi
rman
dpr
ovid
edin
pare
nth
eses
.∗∗∗
,∗∗ ,
and
∗re
pres
ent
stat
isti
cals
ign
ifica
nce
atth
e1%
,5%
,an
d10
%le
vels
,res
pect
ivel
y.
IV:S
econ
dIV
:Fir
stS
tage
Sta
geO
LS
OL
SO
LS
Log
(Nat
ion
alL
og(L
ocal
Sla
nt
Sla
nt
Sla
nt
Sla
nt
Ad
vert
isin
g)A
dve
rtis
ing)
(2S
LS
)
Loc
alfi
rm0.
325∗
∗∗0.
354∗
∗∗0.
345∗
∗∗−0
.612
∗∗−1
.559
∗∗∗
0.38
2∗∗∗
(0.0
71)
(0.0
71)
(0.0
55)
(0.2
59)
(0.4
53)
(0.0
67)
Log
(mar
ket
valu
e)0.
152∗
∗∗0.
126∗
∗∗0.
124∗
∗∗0.
601∗
∗∗1.
373∗
∗∗0.
107∗
∗∗(0
.023
)(0
.023
)(0
.014
)(0
.156
)(0
.187
)(0
.038
)R
OA
0.20
40.
242∗
0.25
0∗∗
−0.8
85−1
.697
0.26
2∗∗
(0.1
39)
(0.1
37)
(0.1
04)
(1.2
64)
(1.1
78)
(0.1
17)
Boo
kle
vera
ge0.
024
0.04
80.
044
−0.8
39−1
.063
0.03
6(0
.118
)(0
.112
)(0
.057
)(0
.660
)(1
.006
)(0
.072
)A
nal
yst
foll
owin
g0.
003
0.00
30.
003
0.00
80.
018
0.00
2(0
.002
)(0
.002
)(0
.002
)(0
.016
)(0
.025
)(0
.002
)In
st.o
wn
ersh
ip(%
)−0
.307
∗∗∗
−0.2
56∗∗
∗−0
.254
∗∗∗
−0.3
52−3
.200
∗∗∗
−0.1
40(0
.091
)(0
.088
)(0
.057
)(0
.671
)(0
.794
)(0
.086
)M
omen
tum
0.09
1∗∗∗
0.09
4∗∗∗
0.09
1∗∗∗
0.05
9−0
.201
0.10
7∗∗∗
(0.0
23)
(0.0
22)
(0.0
20)
(0.1
17)
(0.1
63)
(0.0
21)
Idio
syn
crat
icvo
lati
lity
−1.0
33∗∗
∗−1
.138
∗∗∗
−1.1
43∗∗
∗−1
.086
7.66
9∗∗∗
−1.5
46∗∗
∗(0
.307
)(0
.309
)(0
.216
)(2
.162
)(2
.638
)(0
.289
)R
etu
rn0.
099
0.10
10.
099
−0.1
08−0
.039
0.09
8(0
.093
)(0
.093
)(0
.088
)(0
.246
)(0
.304
)(0
.088
)
(con
tin
ued
)

578 The Journal of Finance R©
Tab
leIV
—C
onti
nu
ed
IV:S
econ
dIV
:Fir
stS
tage
Sta
geO
LS
OL
SO
LS
Log
(Nat
ion
alL
og(L
ocal
Sla
nt
Sla
nt
Sla
nt
Sla
nt
Ad
vert
isin
g)A
dve
rtis
ing)
(2S
LS
)
Sal
esgr
owth
0.46
7∗∗∗
0.46
2∗∗∗
0.46
2∗∗∗
0.32
10.
027
0.47
7∗∗∗
(0.1
56)
(0.1
48)
(0.1
19)
(1.1
11)
(1.5
38)
(0.1
20)
Log
(em
ploy
ees)
−0.0
29−0
.051
∗−0
.051
∗∗∗
1.10
4∗∗∗
0.68
4∗∗∗
−0.0
06(0
.028
)(0
.028
)(0
.014
)(0
.177
)(0
.233
)(0
.058
)E
mpl
oyee
s/po
pula
tion
−6.9
07∗∗
−7.4
60∗∗
−6.0
34∗∗
3.20
836
.205
−8.7
37∗∗
∗(3
.187
)(3
.136
)(2
.359
)(1
4.97
6)(2
3.93
3)(2
.391
)N
um
ber
ofse
gmen
ts−0
.012
−0.0
17−0
.016
∗∗0.
106
0.27
5∗∗
−0.0
21∗∗
(0.0
13)
(0.0
13)
(0.0
07)
(0.0
79)
(0.1
35)
(0.0
09)
Pla
inE
ngl
ish
0.02
0∗∗
0.01
6∗0.
016∗
∗∗0.
130∗
0.15
60.
019∗
∗(0
.010
)(0
.010
)(0
.006
)(0
.067
)(0
.095
)(0
.009
)L
og(n
atio
nal
adve
rtis
ing)
0.01
4∗∗∗
0.01
4∗∗∗
−0.0
56(0
.003
)(0
.002
)(0
.054
)L
og(l
ocal
adve
rtis
ing)
0.01
1∗∗
0.01
1∗∗∗
0.05
7∗∗∗
(0.0
04)
(0.0
03)
(0.0
21)
IV:L
og(i
ndu
stry
nat
ion
alad
vert
isin
g)0.
457∗
∗∗−0
.27
(0.1
59)
(0.2
45)
IV:L
og(i
ndu
stry
loca
ladv
erti
sin
g)0.
055
0.52
9∗∗∗
(0.0
57)
(0.1
03)
Med
ia-m
onth
fixe
def
fect
sN
oN
oIn
clu
ded
No
No
No
Med
iafi
xed
effe
cts
Incl
ude
dIn
clu
ded
Incl
ude
dIn
clu
ded
Incl
ude
dIn
clu
ded
Indu
stry
fixe
def
fect
sIn
clu
ded
Incl
ude
dIn
clu
ded
Incl
ude
dIn
clu
ded
Incl
ude
dM
onth
fixe
def
fect
sIn
clu
ded
Incl
ude
dS
ubs
um
edIn
clu
ded
Incl
ude
dIn
clu
ded
Con
stan
tIn
clu
ded
Incl
ude
dIn
clu
ded
Incl
ude
dIn
clu
ded
Incl
ude
d
N28
,383
28,3
8328
,383
28,3
7828
,378
28,3
78A
dju
sted
-R2
0.22
0.22
0.24
0.47
0.43
0.52
F-t
est
41.5
115
8.64
Cra
gg-D
onal
dW
ald
FS
tati
stic
s40
.25

Don’t Believe the Hype 579
our tests from Table III, Column 2 using the sample of observations for whichwe have advertising data. We confirm that the results using this sample arequalitatively similar to what we report above. Next, we turn our attention to theeffect of advertising on slant, adding to the regression specification variablesthat measure local and national advertising expenditures.
In Table IV, Column 2 the OLS coefficient on Local Advertising is 0.014 andstatistically significant. The coefficient on National Advertising is 0.011 andalso statistically significant. The coefficients on local and national advertisingindicate that spending 100,000 dollars in 1 month for local (national) adver-tising expenditures is associated with an increase in slant of approximately15.2% (18.0%). To put these results in perspective, it is worth noting thataverage local (national) newspaper advertising in our sample is 0.29 (1.49)million dollars per year (Table I). These figures understate the magnitudeof advertising expenditures, however, because many firms do not advertisefrequently. Annual average local (national) advertising expenditures of firmstracked by TNSMI are 1.01 (5.46) million dollars. Total revenues from printadvertising in the United States in 2007 were 42 billion dollars.8 Advertisingrevenues of New York Times and Boston Globe in the same year were 504 and361 million dollars, respectively.
It is possible that firms with relatively localized shareholder and customerbases may use local media as a cost-effective way to disseminate informationand promote their products. If, in turn, local media relay stories that have pos-itive slant to encourage revelation of information by managers or if local mediathat lack resources are inclined to reproduce company press releases, then localnewspapers may produce positive slant. To force identification through varia-tion across firms and their advertising expenditures at a given paper in a givenmonth while controlling for the resources of the media outlet in the same month,we include month-media dyad fixed effects in the third column of Table IV.9 Wefind that the estimated relation between advertising and slant does not changein this specification, providing further support for the advertising hypothesis.
Of course, a firm’s choices of advertising levels and venues are likely tobe related to the firm’s characteristics (Kimbrough and McAlister (2009) andSrinivasan and Hanssens (2009)). In other words, an omitted firm character-istic could explain both a firm’s choice to use newspaper advertising and alsoits allocation to local/national newspapers. Consequently, the OLS coefficientscapture both the possibility that firms’ advertising expenditures directly in-fluence (cause) slant, and the possibility that firms increase their advertisingexpenditures in response to having good news.
We use an instrumental variables approach to address the possibility of code-termination of advertising and slant. We need instruments that are correlatedwith a firm’s advertising choices but uncorrelated with the residuals in the
8 http://www.naa.org/TrendsandNumbers/Advertising-Expenditures.aspx9 Restricting the sample to firms that are local to at least one of the media sources gives a similar
result in terms of the relation between advertising and slant. In this alternative specification, LocalFirm is not included in the specification as it is a linear combination of media-firm dummies.

580 The Journal of Finance R©
slant regression. Our instruments are Average Industry Local Advertising Ex-penditures and Average Industry National Advertising Expenditures for thecorresponding calendar year. We exclude the firm’s advertising expendituresfrom the industry average in these calculations. The idea is that, if the firm’sindustry has increased its overall advertising expenditures in a certain type ofnewspaper (national/local), then a given firm will also tend to spend more foradvertising in that type of outlet, independent of its own characteristics.
Our instruments strongly relate to firm-level advertising expenditures. TheF-statistics on the instruments in our first stage are above critical values froma Stock-Yogo weak identification test. The F-statistic for local advertising is 41and for national advertising it is 158. Furthermore, the first-stage R2 is large(47% for local advertising and 43% for national advertising), indicating thatour estimation is efficient. Because it seems unlikely that average industry ad-vertising expenditures would induce slant in a particular local newspaper for aparticular firm in that industry, it seems plausible that our instruments meetexclusion requirements.10 We conclude that our instruments are good ones.11
In Table IV, the third and fourth columns, we report the first-stage regressionestimates. The results suggest that industry-level national (local) advertisingexpenditures are correlated with firm-level national (local) advertising expen-diture variables.
We report the second-stage results of the instrumental variables regressionin the last column of Table IV. Consistent with abnormally positive storiesbeing a quid pro quo for advertising expenditures, we find that the coefficienton the instrumented local advertising expenditure variable is statisticallysignificant, with a coefficient estimate of 5.7%. This quid pro quo bias does notextend to national media, however. We find that the coefficient on the instru-mented national advertising expenditure variable is statistically insignificant.The results in Table IV support the notion that local media write more positivearticles about firms advertising more heavily in local newspapers. That is, tothe extent that our instrumenting strategy successfully captures the exoge-nous portion of advertising expenditures, local advertising causes slant in localmedia.
10 It is possible that the media may write positive stories about a firm in an industry thatadvertises a lot in the hope that the firm will advertise in the future or that some other firm inthe industry will do so. In this case, industry average advertising expenditures may fail to satisfythe necessary exclusion restriction. On the other hand, although some slant could benefit a wholeindustry (e.g., media denying that investment banks are categorically evil), other forms of slantmay favor one competitor over another. But generally, it seems less likely that a media outlet willslant news in the hope of winning advertising, rather than responding to advertising with slant,because if slant is provided free there is no need for firms to pay for it with advertising.
11 Even if our instruments are not perfectly suited for the task, asymptotically, the bias froman instrumental variables approach like ours should be less than the bias of an ordinary leastsquares approach (OLS) so long as the correlation between the endogenous variable and the OLSresiduals, ρ(x, u), is larger than the ratio of the correlation of the instrument and the residualsto the correlation of the instrument and the endogenous variable, ρ(z, u)/ρ(z, x). Based on thestrength of our instruments (i.e., we find that ρ(z, x) is large), unless ρ(z, u) is very large (i.e., theinstruments are far from meeting the exclusion requirement), our instrumental variables approachprobably improves upon OLS.

Don’t Believe the Hype 581
C.1. Propensity Score Matching
The results we obtain from the instrumental variables approach support thenotion that local advertising causes local media to slant their news. However, ifour instruments fail the exclusion requirement that they are uncorrelated withthe error term in the second-stage equation, our estimates can be biased. Forexample, nonlinear impacts of our variables or omitted covariates could biasour coefficients of interest in the direction we observe. One way to deal with thisissue is our instrumental variables approach; another is to use propensity scorematching to estimate an average treatment effect on slant of a firm advertisingin local newspapers.
The first stage of our propensity score matching procedure uses a Probitmodel to estimate the probability of being in the treated group (i.e., of adver-tising in local newspapers) as a function of observable characteristics. Next,we use the estimated ex ante probability of being in the treated group to formmatched pairs of observations with similar estimated ex ante probability ofbeing in the treated group but different ex post realizations of the treatment.Thus, unlike our instrumental variables estimation, we are using a discretemeasure of local advertising—an indicator for nonzero local advertising—asthe dependent variable in the first stage.
Our propensity score matching essentially puts together firms that are sim-ilar in all the matching dimensions—jointly, rather than individually—butdifferent in terms of their advertising choices. Underlying this technique is theassumption that matching on observable characteristics will mitigate the factthat the firms’ advertising choices are made based on their characteristics sothat we can make causal inferences from the analysis.
In our matching procedure, we use all the control variables and fixed effectswe use in our baseline specification (Table III, Column 2) except the treatmentvariable. We find that firms that advertise in local newspapers have signifi-cantly more positive slant than firms that do not advertise in local newspapers.In Table V, where the treatment is local advertising expenditures exceed zero,the average treatment effect is a 13.2% increase in positive slant.
Following Abadie and Imbens (2008), we obtain confidence intervals using amatching estimator that uses a normal kernel with 500 bootstrap repetitions.Because we are matching jointly on multiple dimensions, treatment and controlsamples may not have similar characteristics in all matched characteristics.Our results do not change if we use different subsets of these matching char-acteristics, and our results are robust to other matching procedures as well.12
12 We find qualitatively similar results using the following alternative procedure. Specifically, forevery firm-month observation that has a local media report and positive local advertising dollars,we generate a list of potential matches by picking local media reports of firms in the same city in thesame month but with no local advertising dollars. For every potential match, we pick the one thathas the closest size. We then compute differences in slant and the control variables between oursample and matched sample. We regress the difference in slant on the differences in the controls.(We note that including or excluding industry fixed effects makes no qualitative difference in theresults.) The intercept in this model reflects the difference in slant that is due to having local

582 The Journal of Finance R©
Table VPropensity Score Matching Estimates: Local Advertising
Panel A reports the results of the propensity score matching estimates (Column 1) and the samplemeans of the treatment (Column 2) and control (Column 3) samples for the corresponding vari-ables. The last column reports the p-values of the difference in means. Heteroskedasticity-robuststandard errors are clustered by firm. Panel B reports the average treatment effects on Slant,where the treatment is defined as “Local Advertising > 0.” Slant is the ratio of the number of neg-ative words to the total number of words used in a composite story reported in month t multipliedby −100. Matching estimates use the Gaussian kernel with a fixed bandwidth of 0.10. Standard er-rors (in parentheses) are obtained using 500 bootstrap repetitions. ∗∗∗, ∗∗, and ∗ represent statisticalsignificance at the 1%, 5%, and 10% levels, respectively.
Panel A: Propensity Score Model Estimates for Local Media Advertising Spending
Treatment ControlDep. Variable = 1 Sample Sample
if Local Advertising > 0 Mean Mean Pr (difference)
Log (market value) 0.286∗∗∗ 7.480 8.981 0.000ROA −0.559 0.037 0.052 0.487Book leverage −0.340 0.461 0.461 0.997Analyst following 0.001 7.221 11.294 0.000Inst. ownership (%) −0.577∗∗∗ 0.663 0.639 0.276Momentum −0.082∗ 0.215 0.149 0.269Idiosyncratic volatility 2.132∗∗∗ 0.119 0.109 0.414Return −0.043 0.012 0.005 0.319Sales growth −0.231 1.056 1.059 0.766Local firm −0.412∗∗∗ 0.059 0.066 0.671Log (national advertising) 0.090∗∗∗ 7.982 11.995 0.000Log (employees) 0.014 8.559 9.680 0.000Employees/population 7.083 0.000 0.003 0.043Number of segments 0.065∗∗∗ 2.875 3.248 0.317Plain English 0.018 0.495 0.636 0.753Media fixed effects IncludedIndustry fixed effects IncludedMonth fixed effects IncludedConstant Included
Number of treatedobservations
14,918
Number of untreatedobservations
13,460
Panel B: Average Treatment Effect (ATE) on Slant for Local Media Advertising Spending
ATE
Local media advertising spending (expenditure > 0 vs. = 0) 13.2%∗∗∗(0.042)
advertising or not. We find that the intercept is positive and statistically significant. We concludethat our matching results are not sensitive to these changes in the matching procedure, and, tothe extent that our matching criteria are reasonable, the relation between local advertising andslant is not driven by the characteristics on which we matched.

Don’t Believe the Hype 583
We obtain similar results if we use neighborhood matching instead of Gaussiankernel.
C.2. A Quasi-Natural Experiment: Entry of Craigslist to the Local AdvertisingMarket
As an alternative to our instrumental variables approach, we exploit aquasi-natural experiment presented by the entry in October 2003 of an im-portant competitor, Craigslist, for newspaper advertising revenue. Copiousanecdotal evidence suggests that Craigslist competes heavily for newspapers’noncorporate advertising revenues (i.e., classified ads). For example, accordingto the New York Times, San Jose Mercury News’s revenue from help-wanted adsdropped from $118 million to $18 million between 2000 and 2005, as financiallytroubled dot-com companies in the Silicon Valley turned to “Internet firms likeCraigslist.com and Monster.com to post job ads.”13
We hypothesize that the entry of Craigslist to Pittsburgh and St. Louis madePittsburgh Gazette and St. Louis Post-Dispatch, respectively, more susceptibleto the pressures of slant-for-advertising. Using a Craigslist entry indicator andthis indicator interacted with national and local media advertising expendi-tures, we test whether the sensitivity of slant for advertising at PittsburghGazette and St. Louis Post-Dispatch increased after the expansion of Craigslistto Pittsburgh and St. Louis. Because we use articles written only by PittsburghGazette and St. Louis Post-Dispatch in this test, the sample size drops sub-stantially. We use the same variables and fixed effects as in Column 1 ofTable IV (omitting the month fixed effects) and add a Craigslist dummy forpost-October 2003 (i.e., whether Craigslist had entered the market yet) as wellas interaction terms between Craigslist and our advertising measures. In thefirst specification, the coefficient on Craigslist is negative but statistically in-distinguishable from zero. The statistically significant positive coefficient inthe second specification indicates that in the environment after Craigslist isintroduced, Pittsburgh Gazette and St. Louis Post-Dispatch increased theiroverall slant for all types of firms in the Pittsburgh and St. Louis areas, onaverage.
In the first column of Table VI, we find that the interaction variable Log(Local Advertising) × Craigslist is positive and statistically significant, indi-cating that, after the exogenous shock, these two newspapers increased theirslant to those firms with more advertising dollars. In Column 2 of Table VIwe keep the variables and fixed effects the same, but restrict the sample toarticles written about firms that are headquartered close to (within 100 milesof ) these two newspapers. In this specification we find the change in slant-for-advertising sensitivity is much stronger, consistent with the notion that localadvertising causes slant in local media.
13 Darlin, Damon, “In Boomtown, but Still Stuck on a Bubble,” New York Times, March 20, 2006.

584 The Journal of Finance R©
Table VISlant and the Effect of Competition from Craigslist
This table reports the results of the following pooled OLS regression: Slant = a + b × Craigslist +Log (National Advertising) + c × Log (Local Advertising) +d × Log (National Advertising) ×Craigslist + e × Log (Local Advertising) × Craigslist + f × Controls + g × Fixed Effects + residual.The unit of analysis is the firm-month-media outlet. Slant is the ratio of the number of negativewords to the total number of words used in a composite story reported by the Pittsburgh Gazette andthe St. Louis Post-Dispatch in month t (multiplied by −100). Craigslist is an indicator variable thattakes a value of one after October 2003. Heteroskedasticity-robust standard errors are clusteredby firm and provided in parentheses. ∗∗∗, ∗∗, and ∗ represent statistical significance at the 1%, 5%,and 10% levels, respectively.
Slant: Articles about PittsburghSlant: All Articles and St. Louis Firms Only
Craigslist −0.013 0.380∗∗∗(0.201) (0.129)
Log (national advertising) 0.008 0.021(0.017) (0.019)
Log (local advertising) −0.007 −0.018(0.011) (0.013)
Log (national advertising) × Craigslist −0.005 −0.045∗∗∗(0.016) (0.012)
Log (local advertising) × Craigslist 0.020∗ 0.045∗∗∗(0.011) (0.016)
Local firm 0.391∗∗∗ −0.205(0.149) (0.129)
Log (market value) 0.099∗∗∗ −0.362(0.042) (0.252)
ROA 0.063 −0.141(0.386) (0.646)
Book leverage −0.324 −1.209(0.252) (0.815)
Analyst following 0.002 −0.014(0.005) (0.033)
Inst. ownership (%) 0.149 0.629(0.236) (0.547)
Momentum 0.124∗ 0.045(0.064) (0.157)
Idiosyncratic volatility −1.494∗ 1.161(0.820) (0.998)
Return 0.792∗∗∗ 0.451(0.368) (0.345)
Sales growth 0.653 4.655∗∗∗(0.615) (1.201)
Log (employees) −0.049 0.943∗∗∗(0.074) (0.340)
Employees/population 0.011 −81.576∗∗∗(5.081) (11.537)
Number of segments 0.004 0.056(0.021) (0.057)
Plain English −0.027 0.130∗∗∗(0.021) (0.045)
(continued)

Don’t Believe the Hype 585
Table VI—Continued
Slant: Articles about PittsburghSlant: All Articles and St. Louis Firms Only
Media fixed effects Included IncludedMonth fixed effects Included IncludedIndustry fixed effects Included IncludedConstant Included Included
N 1,848 215Adjusted-R2 0.10 0.34
D. Returns, Firm Values, and Slant of National and Local Media
In this section, we analyze the effect of local media slant on firm values. Hong,Kubik, and Stein (2008) present evidence consistent with the notion that localinvestors are likely to be the marginal investors in the stock of less visible localfirms. If local newspapers disseminate slanted information to local investorswho are marginal investors, then local media slant may affect asset prices ofstocks with more local investors. Based on HonG, Kubik, and Stein’s (2008)predictions about which types of firms are most likely to be impacted by mediaslant, we hypothesize that small firms, firms held predominantly by individualinvestors, and firms with illiquid or highly volatile stock, low analyst following,or high dispersion of analyst forecasts are likely to be held by local investors.
We examine whether the qualitative content of media coverage affects assetvaluation. Prior literature on media coverage and asset prices suggests that thequantity of media coverage matters. For instance, the investor recognition hy-pothesis of Merton (1987) says that stocks with lower investor recognition needto offer higher returns to compensate their holders for being imperfectly diver-sified, and Fang and Peress (2009) find empirical support for that hypothesis.To examine the incremental effect of local media slant—that is, the qualitativecontent of stories—on asset prices, it is important to control for previously doc-umented media coverage effects on asset prices. We perform two types of tests,one based on stock returns and the other based on a firm’s market value.
First, we test whether stocks with abnormal slant earn lower abnormal re-turns. We create a portfolio that is long in stocks with low abnormal localmedia slant in the previous month (informally, “negative local news content”stocks) and short in stocks with high abnormal local media slant in the previousmonth (informally, “positive local news content” stocks), where abnormal localmedia slant is calculated as local media slant minus national media slant. Fangand Peress (2009) show that a trading strategy that goes long in stocks thathave media coverage and short in stocks that have no media coverage earns3.00% per annum.
To identify the incremental impact of slant (the qualitative nature of stories)over coverage (the quantity of stories), we follow Fang and Peress (2009) andcalculate a coverage factor (NOCOV) that is a zero net investment portfolio longin stocks with no coverage and short in stocks with coverage in any of the media

586 The Journal of Finance R©
outlets in our sample (national and local). However, whereas Fang and Peress(2009) construct their measure using mentions of firm names in national media(New York Times, USA Today, Wall Street Journal, and Washington Post), ourmeasure uses media coverage in both local and national media outlets becauseour intent is to isolate the local media slant effect from the coverage effect atthe national or the local level. In a four-factor model that includes factors forthe excess return on the market, size, book-to-market, and momentum, thealpha for the NOCOV portfolio in our sample is 34 basis points per month(p-value = 0.036), which is similar in magnitude to the corresponding alphain Fang and Peress (2009) of 39 basis points per month (p-value = 0.004). Inthis analysis we only include stocks headquartered around our sample of localmedia outlets. Both the long and the short positions are held for 1 month afterportfolio formation, after which portfolios are rebalanced.
Next, we create a portfolio that is long stocks with low abnormal local mediaslant and short stocks with high abnormal local media slant. This portfoliogenerates 5.52% per year after controlling for other well-known risk factorsthat influence the cross section of stock returns and NOCOV, the coverage fac-tor (Table VII, column 5). The alpha in the six-factor model is 46 basis pointsper month, compared to 50 basis points in the market model, indicating that10% of the alpha relative to the market model is captured by other risk factors.Of the risk factors, the coefficient on the market risk premium is significantand negative in models (1) to (4), indicating that the zero investment strategyof buying low abnormal local media slant stocks and shorting high abnormallocal media slant stocks has a negative exposure to the market. In model (5)we include the media coverage factor (NOCOV). The coefficient on media cov-erage is significant and positive, indicating that a zero investment media slantportfolio co-moves with NOCOV.
We use regressions to test the hypothesis that firm value is positively relatedto local media slant. Formally, we test the null hypothesis that local media slantdoes not affect Tobin’s Q, controlling for national media slant, the quantity ofmedia coverage in both the local and the national media, and other factors thattheory suggests and prior empirical work has shown to have a significant effecton Tobin’s Q.14
If any bias in local newspapers’ coverage distorts information, this distortionmay affect firm value through its impact on local investors’ demand for thestock. Local media stories may simply reflect and report changes in firm fun-damentals. Above, we show that national media slant is not associated withfirm advertising expenditures. Our interpretation of this result is that nationalslant captures news that reflects changes in firm fundamentals, but is other-wise unrelated to firms’ advertising expenditures. Because we are controllingfor national media slant, we interpret local media slant as reflecting content
14 Proxies for Tobin’s Q are imperfect measures of firm value. Following others studying thedeterminants of firm value (e.g., Gompers, Ishii, and Metrick (2010) and Ferreira and Matos(2008)), we also use median regressions and use a transformation of Q: −1/Q. The results aresimilar using these alternative methods.

Don’t Believe the Hype 587
Table VIILocal Media-Slant Trading Profits
We regress the returns of a portfolio that longs stocks with low abnormal local media slant andshorts stocks with high abnormal local media slant on various asset pricing factors. Each month,stocks are sorted according to abnormal local media slant. Abnormal local media slant is calculatedas the difference between local media slant and national media slant. We define high abnormallocal media slant as having abnormal local media slant above the sample mean. Both the long andshort positions are held for 1 month after portfolio formation. Portfolios are rebalanced monthly.We examine five different factor models: the market model, the Fama and French (1993) three-factor model, the Carhart (1997) four-factor model, a five-factor model that includes the Pastorand Stambaugh (2003) liquidity factor, and a six-factor model that includes a factor for no mediacoverage. RM-RF, SMB, HML, UMD, LIQ, and NOCOV are defined in Appendix C. ∗∗∗, ∗∗, and ∗represent statistical significance at the 1%, 5%, and 10% levels, respectively.
Model 1 Model 2 Model 3 Model 4 Model 5
RM-RF −0.1734∗∗∗ −0.1934∗∗∗ −0.1483∗ −0.1483∗ −0.0755(0.066) (0.069) (0.078) (0.075) (0.072)
SMB 0.0859 0.0564 0.0565 0.0278(0.085) (0.090) (0.091) (0.085)
HML −0.0013 −0.0340 −0.0339 −0.0351(0.098) (0.093) (0.120) (0.109)
UMD 0.0639 0.0639 0.0338(0.052) (0.048) (0.054)
LIQ −0.0001 −0.0180(0.052) (0.041)
NOCOV 0.4184∗∗∗(0.162)
Intercept 0.0050∗∗∗ 0.0046∗∗∗ 0.0046∗∗∗ 0.0046∗ 0.0046∗(0.0024) (0.0022) (0.0021) (0.0026) (0.0023)
N 60 60 60 60 60Adjusted-R2 0.11 0.13 0.14 0.14 0.32
separate from fundamentals reported by the national media. The distortion invalue, if any, caused by local media slant is likely to be larger for some firmsand smaller for others. We examine cross-sectional variation in the effects oflocal media slant on firm value in the next section.
We define the following variables to capture different dimensions of the me-dia’s effect on a firm’s market value: (1) annual national (or local) slant, whichis calculated by taking the arithmetic average of monthly slant variables, and(2) annual national (or local) coverage, which is calculated by counting thenumber of stories about a company in national (or local) newspapers. Higheroverall media coverage of a firm may lead to an increase in investor basethrough increased visibility, and therefore may increase firm’s value (Fang andPeress (2009), Grullon, Kanatas, and Weston (2004), Miller (1977)). We usethe number of actual stories rather than the number of our composite storiesas a coverage variable to capture the intensity of news coverage. Nonethe-less, using composite stories instead gives the same qualitative results. A firmwith many news stories is likely to be more visible than a firm that has fewerstories.

588 The Journal of Finance R©
Following Lang and Stulz (1994) and Rountree, Weston, and Allayanis(2008), we add control variables for the following factors: (1) size, measuredas the log of total assets; (2) profitability, measured as ROA; (3) investmentgrowth and intangible assets, measured using as proxies the ratio of capitalexpenditures to sales, the ratio of R&D to sales, and the ratio of advertisingexpenditures to sales; and (4) book leverage, measured using the ratio of long-term debt to total assets. In addition, we include the following factors suggestedby the literature as a determinant of Tobin’s Q: analyst following (Lang, Lins,and Miller (2003)), institutional investors (Badrinath, Gay, and Kale (1989)),and idiosyncratic volatility (Rountree, Weston, and Allayanis (2008)).
We also control for industry effects using two-digit SIC definitions and yearfixed effects. Standard errors are clustered by firm. We take the logarithm ofour dependent variable, Tobin’s Q. This log transformation reduces the poten-tial impact of outliers on our analysis and converts the interpretation of alllogged independent variables to elasticities. (We note that, if we do not uselogged variables, our results do not change qualitatively.) Table VIII, Column1 presents the results of the OLS regression with Tobin’s Q (logged) as the de-pendent variable and the variables described above as independent variables.
The coefficient on the national media slant is 0.064 and the coefficient onlocal media slant is 0.024. These coefficients mean that an increase in nationalor local media slant of one standard deviation (1.007 and 1.788, respectively)is associated with an increase in firm value of 6.64% and 4.29%, respectively.From this evidence we conclude that firm value is linked to media slant usedin local and national media, and that local media have nontrivial effects onfirm value. Thus, once we control for the fundamental information content ofnews (proxied by national media slant, which we presume to be unbiased), localmedia slant is still significant. In the second specification of Table VIII, we usea narrower industry definition (four-digit SIC code); our results do not change.Thus, although alternative stories, that is, the effect of firm fundamentals andvisibility, find empirical support in the data, slant is still an economically andstatistically significant determinant of firm value after controlling for theseother factors.15
The results in Table VIII are also broadly consistent with Lang and Stulz(1994) and Rountree, Weston, and Allayanis (2008). In our findings, size isnegatively related to Tobin’s Q. Profitability and one of the intangible assetmeasures (Advertising) are positively and significantly correlated with value(Myers (1977), Smith and Watts (1992)). Book leverage and R&D expendituresare both insignificant. The negative association between idiosyncratic risk andfirm value is consistent with findings in recent asset pricing literature claimingthat idiosyncratic risk matters (see, for example, Green and Rydqvist (1997)and Goyal and Santa-Clara (2003)). Consistent with the arguments that link
15 We note that we find similar results from propensity score matching tests in which the treatedgroup comprises firms with above-median local media slant and the control group comprises firmswith below-median local media slant. The results are reported in the Internet Appendix, availableat http://www.afajof.org/supplements.asp.

Don’t Believe the Hype 589
Table VIIINewspaper Slant and Firm Value
This table reports the results of the following pooled OLS regression: Log of Tobin’s Q = a + b ×Annual Local Slant + c × Annual National Slant + d × Annual Local Coverage + e × AnnualNational Coverage + f × Controls + g × Fixed Effects + residual. The unit of analysis is thefirm-year. The regressors are defined in Appendix C. Heteroskedasticity-robust standard errorsare clustered by firm and provided in parentheses. ∗∗∗, ∗∗, and ∗ represent statistical significanceat the 1%, 5%, and 10% levels, respectively.
Ln(Q) Ln(Q)
Annual local slant 0.024∗∗∗ 0.025∗∗∗(0.009) (0.006)
Annual national slant 0.064∗∗∗ 0.060∗∗∗(0.014) (0.011)
Annual local coverage 0.006 0.009(0.014) (0.012)
Annual nat’l coverage 0.127∗∗∗ 0.103∗∗∗(0.020) (0.014)
Log (total assets) −0.158∗∗∗ −0.132∗∗∗(0.016) (0.010)
Return on assets 0.093 0.061∗∗∗(0.100) (0.027)
CAPX-to-sales −0.724∗∗∗ −0.633∗∗∗(0.126) (0.089)
Book leverage 0.262∗∗∗ 0.172∗∗∗(0.085) (0.039)
R&D-to-sales 0.318∗∗∗ 0.074(0.144) (0.105)
Advertising-to-sales 0.72 0.298(0.515) (0.266)
Analyst following 0.023∗∗∗ 0.021∗∗∗(0.002) (0.002)
Inst. ownership (%) 0.359∗∗∗ 0.368∗∗∗(0.060) (0.044)
Momentum 0.117∗∗∗ 0.112∗∗∗(0.019) (0.011)
Idiosyncratic volatility −1.067∗∗∗ −0.852∗∗∗(0.197) (0.143)
Sales growth 0.643∗∗∗ 0.563∗∗∗(0.109) (0.077)
Industry fixed effects Included NoYear fixed effects Included IncludedConstant Included IncludedFour-digit industry fixed effects No Included
N 3,020 3,020Adjusted-R2 0.54 0.65
analyst following and institutional investors to smoothed earnings, and witharguments that smoothed earnings lead to higher firm value, we find positiveassociations between analyst following, institutional investor holdings, andfirm value.

590 The Journal of Finance R©
Taken together, the returns tests of Table VII and the firm value tests ofTable VIII suggest both a transitory and a persistent component of local mediaslant on valuations. The abnormal returns suggest that the market corrects forat least part of the mispricing induced by local media slant, that is, stock priceseventually reflect a build-up of information, perhaps gradually. If investors donot sufficiently discount the local media slant following such a correction, it ispossible that they will buy in response to the next wave of local slant comingfrom media stories. In the absence of alternative information sources (e.g., ifthe firm has low analyst coverage) and correction mechanisms (e.g., if the firmhas low institutional ownership or low liquidity), it is possible that local mediaslant may have persistent long-term effects on valuation as well as short-termprice corrections.
E. Slant, Coverage, and Firm Value: Evidence from Sample Splits
Hong, Kubik, and Stein (2008) propose a theory that suggests that localinvestors are likely to be the marginal investors of less visible firms. If localinvestors use information in local newspapers in their investment decisions,then the effect that local media slant has on firm value may be more pronouncedin such stocks. To study this possibility, in Table IX we repeat the analysis fromTable VIII on subsamples of the data. We use the last specification from TableVIII in these tests; that is, we are controlling for local and national slant, localand national media coverage, and the other firm characteristic control variablesand fixed effects. These subsample tests allow us to isolate the types of firmsfor which media slant has stronger effects on firm value. Our splits are basedon high (above the median) compared to low (below the median) institutionalownership, size, analyst following, and analyst forecast dispersion. Althoughwe find that the effect of national slant is comparable across both parts of mostof the sample splits (the size split is a notable exception: national slant hasdouble the effect in large firms as opposed to small), the effect of local slant isdifferent across subsamples.
For firms whose ownership is dominated by institutional investors, there isno effect of local slant on firm value (the coefficient is very small in magnitudeand statistically indistinguishable from zero). But for the firms whose own-ership tends to be from individual investors, the effect of local slant is quitestrong (coefficient = 0.026, t-statistic = 2.0). Similarly, the value of small firmsis more susceptible to local media slant than is the value of large firms. Forlarge firms, the impact of local slant on firm value is negligible. But for smallfirms, local slant has a statistically significant and economically meaningful ef-fect (coefficient = 0.018, t-statistic = 1.66). Likewise, local slant has no impacton firm value for firms with high levels of analyst following, but has a strongeffect for firms with little analyst following (coefficient = 0.027, t-statistic =2.45). Local slant has no impact on firm value for firms with low levels of an-alyst forecast dispersion, but has a strong effect for firms with high forecastdispersion (coefficient = 0.024, t-statistic = 2.18).
Finally, we examine whether slant has a stronger effect on firm value instocks that have large impediments to arbitrage. We split the sample by two

Don’t Believe the Hype 591
Tab
leIX
New
spap
erS
lan
t,C
over
age,
and
Fir
mV
alu
e:S
ub
sam
ple
An
alys
isT
his
tabl
ere
port
sre
sult
sof
the
foll
owin
gpo
oled
OL
Sre
gres
sion
for
the
subs
ampl
esde
scri
bed
inth
eco
lum
nh
eadi
ngs
:Log
ofTo
bin
’sQ
=a
+b
×A
nn
ual
Loc
alS
lan
t+c
×A
nn
ual
Nat
ion
alS
lan
t+d
×A
nn
ual
Loc
alC
over
age
+e
×A
nn
ual
Nat
ion
alC
over
age
+f×
Con
trol
s+
g×
Fix
edE
ffec
ts+
resi
dual
.Th
eu
nit
ofan
alys
isis
the
firm
-yea
r.T
he
regr
esso
rsar
ede
fin
edin
App
endi
xC
.Het
eros
keda
stic
ity-
robu
stst
anda
rder
rors
are
clu
ster
edby
firm
and
prov
ided
inpa
ren
thes
es.∗
∗∗,∗
∗ ,an
d∗
repr
esen
tst
atis
tica
lsig
nifi
can
ceat
the
1%,5
%,a
nd
10%
leve
ls,r
espe
ctiv
ely.
Inst
itu
tion
alA
nal
yst
For
ecas
tId
iosy
ncr
atic
Ow
ner
ship
Siz
eF
ollo
win
gD
ispe
rsio
nV
olat
ilit
yL
iqu
idit
y
Low
Hig
hS
mal
lL
arge
Low
Hig
hL
owH
igh
Low
Hig
hL
owH
igh
Ln
(Q)
Ln
(Q)
Ln
(Q)
Ln
(Q)
Ln
(Q)
Ln
(Q)
Ln
(Q)
Ln
(Q)
Ln
(Q)
Ln
(Q)
Ln
(Q)
Ln
(Q)
An
nu
allo
cals
lan
t0.
026∗∗
∗0.
012
0.01
8∗0.
010.
027∗∗
∗0.
005
0.01
50.
024∗∗
∗0.
004
0.02
3∗∗∗
0.02
8∗∗∗
0.00
2(0
.013
)(0
.008
)(0
.011
)(0
.010
)(0
.011
)(0
.010
)(0
.012
)(0
.011
)(0
.010
)(0
.011
)(0
.011
)(0
.008
)A
nn
ual
nat
’lsl
ant
0.05
3∗∗∗
0.07
1∗∗∗
0.05
1∗∗∗
0.08
3∗∗∗
0.05
5∗∗∗
0.07
1∗∗∗
0.07
0∗∗∗
0.05
6∗∗∗
0.07
6∗∗∗
0.05
1∗∗∗
0.07
2∗∗∗
0.03
2∗∗∗
(0.0
20)
(0.0
16)
(0.0
17)
(0.0
20)
(0.0
17)
(0.0
21)
(0.0
21)
(0.0
16)
(0.0
18)
(0.0
18)
(0.0
21)
(0.0
15)
An
nu
allo
calc
over
age
0.01
−0.0
02−0
.009
0.02
0.00
60.
016
0.01
30.
001
0.01
1−0
.036
∗−0
.023
0.00
6(0
.020
)(0
.016
)(0
.021
)(0
.016
)(0
.018
)(0
.019
)(0
.017
)(0
.017
)(0
.016
)(0
.021
)(0
.022
)(0
.014
)A
nn
ual
nat
’lco
vera
ge0.
159∗∗
∗0.
064∗∗
∗0.
083∗∗
∗0.
133∗∗
∗0.
137∗∗
∗0.
098∗∗
∗0.
091∗∗
∗0.
128∗∗
∗0.
117∗∗
∗0.
085∗∗
∗0.
164∗∗
∗0.
065∗∗
∗(0
.028
)(0
.024
)(0
.024
)(0
.030
)(0
.024
)(0
.031
)(0
.031
)(0
.022
)(0
.028
)(0
.024
)(0
.027
)(0
.024
)C
ontr
olva
riab
les
use
din
Tabl
eV
III
Incl
ude
dIn
clu
ded
Incl
ude
dIn
clu
ded
Incl
ude
dIn
clu
ded
Incl
ude
dIn
clu
ded
Incl
ude
dIn
clu
ded
Incl
ude
dIn
clu
ded
Adj
ust
ed-R
20.
560.
590.
540.
740.
490.
690.
720.
510.
720.
500.
460.
76

592 The Journal of Finance R©
commonly used arbitrage cost measures, namely, idiosyncratic volatility andilliquidity.16 We measure idiosyncratic volatility by calculating the standarddeviation of the market model residuals of equity returns in the prior year. Ourilliquidity measure is the prior year’s average daily Amihud (2002) illiquiditymeasure. We find that local slant has no effect on the value of firms that havelow idiosyncratic volatility or that have high liquidity. However, the effect oflocal slant on firm value is statistically significant and economically meaningfulfor both high idiosyncratic volatility firms (coefficient = 0.023, t-statistic =2.09) and highly illiquid firms (coefficient = 0.028, t-statistic = 2.54). Ourinterpretation of these sample split results is that local slant has a stronginfluence on unsophisticated traders (low institutional ownership firms), onfirms that are relatively opaque (small firms, firms with little analyst coverage,and firms about which analysts disagree on earnings forecasts), and on firmsthat have higher arbitrage costs (high idiosyncratic risk and low liquidity).
IV. Conclusions and Implications
We find that, when local newspapers report news about local companies,they use fewer negative words compared to local media reporting about nonlo-cal companies. Furthermore, we show and quantify that this local media biasis more pronounced for companies with higher local advertising expenditures,whereas national media do not exhibit such a bias. We also provide empiricalevidence that this bias is economically meaningful, as firm value is relatedto the slant of both national and local newspapers. This finding is importantbecause prior finance literature has shown that people tend to invest dispropor-tionately in the companies that they are geographically close to. Our conjectureis that local media slant may influence local investors, with home bias arisingas a result.
Newspapers not only report events but also influence the public’s perceptionof them. The unique contribution of our article is to show that the way the mediareport the news can be a function of their characteristics, such as proximityto a firm’s headquarters and the firm’s advertising expenditures. These resultsshow that news content varies systematically with these characteristics andwith conflicts of interest with respect to the news source. Consumers of newscan use this information to discount news content accordingly.
Appendix A: Media Outlets from Which the Advertising Data AreCollected
TNS Media Intelligence (TNSMI) provides advertising expenditures at thebrand level (as defined by TNSMI) across 11 advertising categories, as listedbelow.
16 Shleifer and Vishny (1997) argue that the risk associated with the volatility of arbitragereturns deters arbitrage activity. Roll, Schwartz, and Subrahmanyam (2007) present empiricalevidence that violation of no-arbitrage relations is related to liquidity because liquidity facilitatesarbitrage.

Don’t Believe the Hype 593
1. Network TV: The Network TV service provides expenditure informationfor seven broadcast networks, ABC, CBS, FOX, NBC, PAX/I, MNTV, andCW.
2. Cable TV: The Cable TV service provides expenditure information for 52cable television networks.
3. Syndication TV: The Syndication TV service provides expenditure in-formation for major local markets. Syndication advertising scope is some-where in between that for Network TV and that for Spot TV.
4. Spot TV: The Spot TV service provides expenditure information for majorlocal markets.
5. Magazine: This service measures and compiles all expenditure data forPublishers Information Bureau, Inc. (PIB). Publications measured mustbe members of PIB, and currently include 350+ consumer magazines.
6. Sunday Magazines: The Sunday Magazines service measures five PIBSunday Magazines: New York Times Magazine, Los Angeles Times Maga-zine, Life Magazine, Parade, and USA Weekend.
7. National Newspapers: This service measures advertising in three na-tional newspapers: New York Times, USA Today, and Wall Street Journal.
8. Newspapers: Newspaper service measures advertising in over 250 dailyand Sunday newspaper editions and Sunday magazines.
9. Network Radio: Network Radio includes the following networks: ABC,American Urban, Premier, and Westwood.
10. National Spot Radio: National Spot Radio service provides nationallyplaced spot radio data for approximately 4,000 stations in major localmarkets.
11. Outdoor Advertising: Outdoor Advertising service reports billboard ex-penditures in major local markets in the United States.
Appendix B: Newspapers and Their Locations
Name of News Source Zip Code
Local mediaBoston Globe 02205Chicago Sun Times 60654Denver Post 80202Pittsburgh Post-Gazette 15222San Francisco Chronicle 94103Seattle Post-Intelligencer 98119St. Louis Post-Dispatch 63101Washington Post 22216
National mediaWall Street JournalDow Jones Newswire

594 The Journal of Finance R©
Appendix C: Variable Definitions
Advertising Expenditures: The cost of advertising media (radio, televi-sion, newspapers, periodicals) and promotional expenses in the most currentannual financial statement reported prior to month t (COMPUSTAT dataitem 45).
Analyst Following: Number of earnings estimates at the end of the calendaryear prior to month t (First Call database item Num esti).
Annual Local (National) Slant: The average Slant in local (national) mediafor a given company in a given year.
Annual Local (National) Coverage: The number of times local (national) me-dia report a story on a company in a given year.
Book Leverage: Ratio of book equity to total assets in the most current annualfinancial statement reported prior to month t (COMPUSTAT data item 60/Totalassets).
Capital Expenditures (CAPX): Capital expenditures in the most current an-nual financial statement reported prior to month t (COMPUSTAT data item128).
Return: Return of common stock in month t (CRSP monthly stock file).Employees: Number of employees in all segments of the firm in the most
current annual financial statement reported prior to month t (represented inthousands) (COMPUSTAT data item 29).
HML: The return on a portfolio of stocks with high book-to-market ratio,minus the return on a portfolio of stocks with low book-to-market ratio (Famaand French (1993)).
Idiosyncratic Risk: The standard deviation of monthly returns for the 2 yearsbefore month t.
Institutional Ownership (%): Number of shares owned by institutional in-vestors divided by total number of outstanding shares at the end of the calendaryear prior to month t (source: Thomson Financial).
LIQ: Traded liquidity factor constructed by Pastor and Stambaugh (2003).Local Advertising Expense: The newspaper advertising figure in any of over
250 daily and Sunday newspaper editions and Sunday magazines in month t(source: TNS Media Intelligence).
Local Firm: If the distance between the location of a newspaper (seeAppendix B) and the location of a firm’s headquarters is less than 100 miles,then the firm is considered a local firm for the corresponding newspaper andthe variable takes a value of one; the variable takes a value of zero otherwise.
Long-Term Debt: This variable measures the debt obligations due in morethan 1 year or due after the current operating cycle and is measured us-ing the most current annual financial statement reported prior to month t(COMPUSTAT data item 9).
Market Value of Equity (in thousands): This variable measures the marketvalue of the firm at the end of the fiscal year in the most current annualfinancial statement reported prior to month t (multiplication of COMPUSTATdata item 25 and data item 199).

Don’t Believe the Hype 595
Momentum: Cumulative prior 12-month raw return prior to month t (source:CRSP monthly stock file).
National Advertising Expense: The newspaper advertising figure in threenational newspapers: New York Times, USA Today, and Wall Street Journal inmonth t (source: TNS Media Intelligence).
NOCOV: Return to portfolio formed by longing stocks with no media coverageand shorting stocks with media coverage in any of the media outlets. Thepositions are held for 1 month after portfolio formation, after which portfoliosare rebalanced.
Number of Common Shares Outstanding: Net number of all commonshares outstanding at fiscal year-end (in millions) (COMPUSTAT dataitem 25).
Number of Segments: Number of business segments reported in the mostcurrent annual financial statement reported prior to month t.
Plain English: A standardized statistic that uses a series of six writing com-ponents specifically identified by the SEC to measure 10-K readability (seeLoughran and McDonald (2010) for details). Measured using the most currentannual financial statement reported prior to month t.
Population: Population of local newspaper’s coverage area (100 miles aroundthe local media’s location). Measured using the most current population infor-mation prior to month t.
R&D Expenses: Spending on research and development expenses as reportedby the firm and represented in millions (COMPUSTAT data item 46). Mea-sured using the most current annual financial statement reported prior tomonth t.
RM-RF: Market return minus return on the U.S. Treasury bond.ROA: Return on assets. Measured using the most current annual financial
statement reported prior to month t. (COMPUSTAT data item 171 scaled bydata item 6).
Sales: COMPUSTAT data item 12 in the most current annual financial state-ment reported before month t.
Sales Growth: The percentage change in sales compared to prior year’s sales.SMB: The return of a portfolio of small stocks minus the return of a portfolio
of large stocks (Fama and French (1993)).Slant: The ratio of the number of negative words to the total number of words
used in a composite article reported in month t (multiplied by −100).Tobin’s Q: The firm’s market-to-book ratio. Constructed as the ratio of the
market value of equity and book value of long-term debt all divided by totalassets. Measured using the most current annual financial statement reportedprior to month t.
Total Assets: COMPUSTAT annual data item 6. Measured using the mostcurrent annual financial statement reported prior to month t.
UMD: Return on a portfolio of stocks with a high past 12-month re-turn, minus the return on a portfolio of stocks with a low past 12-monthreturn.

596 The Journal of Finance R©
REFERENCESAbadie, Alberto, and Guido Imbens, 2008, On the failure of the bootstrap for matching estimators,
Econometrica 76, 1537–1557.Aboody, David, and Ron Kasznik, 2000, CEO stock option awards and the timing of corporate
voluntary disclosures, Journal of Accounting & Economics 29, 73–100.Amihud, Yakov, 2002, Illiquidity and stock returns, Journal of Financial Markets 5, 31–56.Badrinath, S. G., Gerry D. Gay, and Jayant D. Kale, 1989, Patterns of institutional invest-
ment, prudence and the managerial safety net hypothesis, Journal of Risk and Insurance 56,605–629.
Baron, D. P., 2005, Competing for the public through the news media, Journal of Economics &Management Strategy 14, 339–376.
Baumeister, Roy F., Ellen Bratslavsky, Catrin Finkenauer, and Kathleen D. Vohs, 2001, Bad isstronger than good, Review of General Psychology 5, 323–370.
Besley, Timothy, and Andrea Prat, 2006, Handcuffs for the grabbing hand? Media capture andgovernment accountability, American Economic Review 96, 720–736.
Bhattacharya, Utpal, Neal Galpin, Rina Ray, and Xiaoyun Yu, 2009, The role of the media in theinternet IPO bubble, Journal of Financial and Quantitative Analysis 44, 657–682.
Carhart, Mark, 1997, On persistence in mutual fund performance, Journal of Finance 52, 57–82.Dyck, Alexander, Adair Morse, and Luigi Zingales, 2010, Who blows the whistle on corporate
fraud?, Journal of Finance 65, 2213–2253.Dyck, Alexander, Natalya Volchkova, and Luigi Zingales, 2008, The corporate governance role of
the media: Evidence from Russia, Journal of Finance 63, 1093–1135.Dyck, Alexander, and Luigi Zingales, 2003, Media and asset prices, Working paper, University of
Chicago.Fama, Eugene F., and Kenneth French, 1993, Common risk factors in the returns on stocks and
bonds, Journal of Financial Economics 33, 3–56.Fang, Lily H., and Joel Peress, 2009, Media coverage and the cross-section of stock returns, Journal
of Finance 64, 2023–2052.Ferreira, Miguel A., and Pedro Matos, 2008, The colors of institutions’ money: The role of institu-
tional investors around the world, Journal of Financial Economics 88, 499–533.Frankel, Richard, Maureen McNichols, and G. Peter Wilson, 1995, Discretionary disclosure and
external financing, Accounting Review 70, 135–150.Gentzkow, Matthew, and Jesse M. Shapiro, 2006, Media bias and reputation, Journal of Political
Economy 114, 280–316.Gentzkow, Matthew, and Jesse M. Shapiro, 2008, Competition and truth in the market for news,
Journal of Economic Perspectives 22, 133–154.Gompers, Paul, Joy Ishii, and Andrew Metrick, 2010, Extreme governance: An analysis of dual-
class firms in the United States, Review of Financial Studies 23, 1051–1088.Goyal, Amit, and Pedro Santa-Clara, 2003, Idiosyncratic risk matters, Journal of Finance 58,
975–1007.Green, Richard C., and Kristian Rydqvist, 1997, The valuation of nonsystematic risks and the
pricing of Swedish lottery bonds, Review of Financial Studies 10, 447–480.Groseclose, Tim, and Jeffrey Milyo, 2005, A measure of media bias, Quarterly Journal of Economics
120, 1191–1237.Grullon, Gustavo, George Kanatas, and James P. Weston, 2004, Advertising, breadth of ownership
and liquidity, Review of Financial Studies 17, 439–461.Gurun, Umit G., 2010, Good news is endogenous, Working paper, University of Texas at Dallas.Healy, Paul M., and Krishna G. Palepu, 2001, Information asymmetry, corporate disclosure, and
the capital markets: A review of the empirical disclosure literature, Journal of Accounting &Economics 31, 405–440.
Herman, Edward S., and Noam Chomsky, 1988, Manufacturing Consent: The Political Economyof the Mass Media (Pantheon Books, New York).
Hong, Harrison, Jeffrey Kubik, and Jeremy Stein, 2008, The only game in town: Stock-priceconsequences of local bias, Journal of Financial Economics 90, 20–37.

Don’t Believe the Hype 597
Ivkovic, Zoran, and Scott Weisbenner, 2005, Local does as local is: Information content of thegeography of individual investors’ common stock investments, Journal of Finance 60, 267–306.
Kasznik, Ron, and Baruch Lev, 1995, To warn or not to warn—Management disclosures in the faceof an earnings surprise, Accounting Review 70, 113–134.
Kimbrough, Michael D., and Leigh McAlister, 2009, Linking marketing actions to value creationand firm value: Insights from accounting research, Journal of Marketing Research 46, 313–319.
Kothari, S. P., Susan Shu, and Peter D. Wysocki, 2009, Do managers withhold bad news? Journalof Accounting Research, 47, 241–276.
Lang, Larry H. P., and Rene M. Stulz, 1994, Tobin’s-Q, Corporate diversification, and firm perfor-mance, Journal of Finance 49, 1079–1080.
Lang, Mark H., Karl V. Lins, and Darius P. Miller, 2003, ADRs, analysts, and accuracy: Doescross listing in the U.S. improve a firm’s information environment and increase market value?Journal of Accounting Research 41, 317–345.
Loughran, Tim, and Bill McDonald, 2010, Plain English, readability, and 10-K filings, Workingpaper, University of Notre Dame.
Loughran, Tim, and Bill McDonald, 2011, When is a liability not a liability? Textual analysis,dictionaries, and 10-Ks, Journal of Finance 66, 35–65.
McChesney, Robert, 2003, The problem of journalism: A political economic contribution to anexplanation of the crisis in contemporary U.S. journalism, Journalism Studies 4, 299–329.
Merton, Robert C., 1987, A simple model of capital market equilibrium with incomplete informa-tion, Journal of Finance 42, 483–510.
Miller, Edward M., 1977, Risk, uncertainty, and divergence of opinion, Journal of Finance 32,1151–1168.
Miller, Gregory S., 2006, The press as a watchdog for accounting fraud, Journal of AccountingResearch 44, 1001–1033.
Mullainathan, Sendhil, and Andrei Shleifer, 2005, The market for news, American EconomicReview 95, 1031–1053.
Myers, Stewart C., 1977, Determinants of corporate borrowing, Journal of Financial Economics 5,147–175.
Pastor, Lubos, and Robert F. Stambaugh, 2003, Liquidity risk and expected stock returns, Journalof Political Economy 111, 642–685.
Reuter, Jonathan, and Eric Zitzewitz, 2006, Do ads influence editors? Advertising and bias in thefinancial media, Quarterly Journal of Economics 121, 197–227.
Roll, Richard, Eduardo Schwartz, and Avanidhar Subrahmanyam, 2007, Liquidity and the law ofone price: The case of the futures/cash basis, Journal of Finance 62, 2201–2234.
Rountree, Brian, James P. Weston, and George Allayanis, 2008, Do investors value smooth perfor-mance?, Journal of Financial Economics 90, 237–251.
Rozin, Paul, and Edward B. Royzman, 2001, Negativity bias, negativity dominance, and contagion,Personality and Social Psychology Review 5, 296–320.
Shleifer, Andrei, and Robert W. Vishny, 1997, The limits of arbitrage, Journal of Finance 52, 35–55.Skinner, Douglas J., 1994, Why firms voluntarily disclose bad news, Journal of Accounting Re-
search 32, 38–60.Smith, Clifford. W., and Ross L. Watts, 1992, The investment opportunity set and corporate financ-
ing, dividend, and compensation policies, Journal of Financial Economics 32, 263–292.Srinivasan, Shuba, and Dominique M. Hanssens, 2009, Marketing and firm value: Metrics, meth-
ods, findings, and future directions, Journal of Marketing Research 46, 293–312.Tetlock, Paul C., 2007, Giving content to investor sentiment: The role of media in the stock market,
Journal of Finance 62, 1139–1168.Tetlock, Paul C., Maytal Saar-Tsechansky, and Sofus Macskassy, 2008, More than words: Quanti-
fying language to measure firms’ fundamentals, Journal of Finance 63, 1437–1467.Van Nieuwerburgh, Stijn, and Laura Veldkamp, 2009, Information immobility and the home bias
puzzle, Journal of Finance 64, 1187–1215.Verrecchia, Robert E., 2001, Essays on disclosure, Journal of Accounting & Economics 32, 97–180.Yermack, David, 1997, Good timing: CEO stock option awards and company news announcements,
Journal of Finance 52, 449–476.

本文献由“学霸图书馆-文献云下载”收集自网络,仅供学习交流使用。
学霸图书馆(www.xuebalib.com)是一个“整合众多图书馆数据库资源,
提供一站式文献检索和下载服务”的24 小时在线不限IP
图书馆。
图书馆致力于便利、促进学习与科研,提供最强文献下载服务。
图书馆导航:
图书馆首页 文献云下载 图书馆入口 外文数据库大全 疑难文献辅助工具