donation & transplantation interprovincial · canadian blood services is committed to providing...
TRANSCRIPT

DONATION & TRANSPLANTATION
Interprovincial Programs Report
2009-2016
Donation & Transplantation Interprovincial Programs Report Donation & Transplantation Interprovincial Programs Report 2
A glossary of terms can be found in Appendix 1.
Extracts of the information in this report may be reviewed, reproduced or translated for educational purposes, research or private study but not for sale or for use in conjunction with commercial purposes. Any use of the information should be accompanied by an acknowledgement of Canadian Blood Services as the source. Any other use of this publication is strictly prohibited without prior permission from Canadian Blood Services.
Canadian Blood Services assumes no responsibility or liability for any consequences, losses or injuries, foreseen or unforeseen, whatsoever or howsoever occurring, which might result from the implementation, use or misuse of any information or recommendations in this report. This report contains recommendations that must be assessed in the context of a full review of applicable medical, legal and ethical requirements in any individual case.
Production of this report has been made possible through a financial contribution from Health Canada, and the Provincial and Territorial governments. The views expressed herein do not necessarily represent the views of the Federal, Provincial or Territorial governments.
Canadian Blood Services 1800 Alta Vista Drive Ottawa, Ontario K1G 4J5 Canada 613-739-2300 Email: [email protected]
Comments or Questions?Questions or comments are welcome and can be sent to [email protected]. All suggestions will be considered for inclusion in future reports.
TERMINOLOGY AND USE OF DATA

Donation & Transplantation Interprovincial Programs Report Donation & Transplantation Interprovincial Programs Report 3
Canadian Blood Services is committed to providing timely and accurate reporting on its organ listing and allocation programs, and has initiated a yearly cycle of reporting beginning with the KPD Program Data Report 2009 – 2013 and the subsequent 2014 and 2015 Donation and Transplantation Interprovincial Programs Reports. Canadian Blood Services is now releasing the 2016 Donation and Transplantation Interprovincial Programs Report. This report serves to celebrate program success and to identify targets for system improvement.
The results contained in this report are intended to provide a comprehensive overview for the Canadian Organ Donation and Transplantation Network (CODTN) in service to transplant candidates and donors participating in the Kidney Paired Donation (KPD) program, the Highly Sensitized Patient (HSP) program and the National Organ Waitlist (NOW) toward the goal of maximizing transplant access for those patients most in need.
The KPD Program, which facilitates living donor transplants by matching compatible donors and recipients, is beginning to see a leveling off of both participation and number of transplants achieved each year. With living donation in Canada being static, participation in KPD has similarly plateaued. Renewed efforts to optimize living donor transplantation will positively impact KPD performance. Additionally new strategies to increase transplant opportunities further for difficult to match patients are underway for 2017-2018 which will positively impact performance.
Although the profile of KPD participants relating to demographic and compatibility factors remains fairly consistent, 2016 showed improvements in the efficiency with which chains of matches are transplanted and an increasing focus on completing chains in which one or more matches is not able to proceed, which is a testament to program facilitators’ ongoing efforts to monitor and support completion the work done at transplant centres throughout the life of proposed transplant chains. The importance of strategies that promote new and continued participation from candidate-donor pairs and non-directed anonymous donors cannot be overstated, but results also suggest that improving the efficiency of time from matching to transplant continues to be an important area in which to realize continued program successes.
The HSP program provides access to a national donor pool for those kidney patients with immunologically reduced access to transplant to a significant degree. It has facilitated 293 transplants since its inception in November of 2013; approximately one-third of these transplants occurred in 2016, with transplants occurring at a stable rate over time. With 57% of these transplants being interprovincial donations, interprovincial cooperation continues to be crucial to the continued success of this program. Despite
program successes in finding transplant opportunities for patients with moderately high levels of sensitization, the national community continues to explore strategies to address the most extremely difficult-to-match patients, those with less than a 2% chance of matching any given donor. The program has undergone several salient changes in 2016, including prioritization for those patients with the lowest access to transplant among eligible transplant candidates; in addition, limitations purposed at maintaining fair interprovincial balancing were modified to eliminate import thresholds while maintaining export thresholds as a safeguard for transplant activity in net exporting provinces. This is also the first year in which post-transplant outcomes have been available for the program.
Finally, since June of 2012 the NOW for heart, lung, liver, and pancreas, small bowel, and multi-organ patients has represented the only real-time Canadian organ waitlist that operates on a national scale. In addition to heart, lung, and liver results, the presents report also includes results for pancreas candidates and transplants. NOW waiting lists have remained relatively stable into 2016, with 2016 seeing a continuation of the decreases in patient pool for lung and liver transplants relative to previous years. As development of the Canadian Transplant Registry (CTR) progresses in addressing the utility needs of organ communities, it is hoped that the NOW will develop into a unified resource for a comprehensive suite of services, including listing, matching, allocation, offering, and outcome monitoring.
1 See Canadian Blood Services (2016) Organ Donation and Transplantation in Canada: System Progress Report, 2006 2015.
Available online at profedu.blood.ca/en/organs-and-tissues/living-donation/reports
EXECUTIVE SUMMARY

Donation & Transplantation Interprovincial Programs Report Donation & Transplantation Interprovincial Programs Report 4
TABLE OF CONTENTS
TERMINOLOGY & USE OF DATA .................................................2
EXECUTIVE SUMMARY ................................................................3
TABLE OF CONTENTS .................................................................4
1.0 INTRODUCTION .....................................................................51.1 DATA SOURCES ......................................................................51.2 ACKNOWLEDGEMENTS ...............................................................5
2.0 KPD PROGRAM .....................................................................62.1 KPD PROGRAM SUMMARY ...........................................................62.2 KPD TRANSPLANT CANDIDATES, TRANSPLANT
RECIPIENTS AND DONORS ...........................................................92.3 MATCH CYCLE STATISTICS ...........................................................142.4 TRAVEL ....................................................................................182.5 OUTCOMES ..............................................................................19
3.0 HIGHLY SENSITIZED PATIENT PROGRAM ............................213.1 HSP PROGRAM SUMMARY ........................................................................ 213.2 HSP TRANSPLANT CANDIDATES AND RECIPIENTS .................................... 233.3 HSP RECIPIENT OUTCOMES ...................................................................... 333.4 DECEASED DONORS FOR HSP RECIPIENTS .............................................. 363.5 HSP MATCHING AND ALLOCATION ............................................................ 38
4.0 NATIONAL ORGAN WAITLIST (NOW) .....................................494.1 HEART ....................................................................................................... 494.2 LUNG ......................................................................................................... 524.3 LIVER ......................................................................................................... 554.4 PANCREAS................................................................................................. 57
5.0 APPENDIX 1: GLOSSARY .......................................................50
6.0 APPENDIX 2: MATCHING ALGORITHM FOR KPD .....................62
7.0 APPENDIX 3: ADDITIONAL DATA FOR KPD PROGRAM ............637.1 KPD PROGRAM SUMMARY ........................................................................ 637.2 KPD CANDIDATES, RECIPIENTS AND DONORS .......................................... 657.3 MATCH CYCLE STATISTICS ........................................................................ 70
8.0 APPENDIX 4: HSP MATCHING ALGORITHM ............................75
9.0 APPENDIX 5: ADDITIONAL DATA FOR HSP PROGRAM ...............................................................78
10 APPENDIX 6: ADDITIONAL INFORMATION FOR NOW SUMMARY .......................................79

Donation & Transplantation Interprovincial Programs Report Donation & Transplantation Interprovincial Programs Report 5
Data for program activities has been extracted from the Canadian Transplant Registry. This is the information technology (IT) system developed and maintained by Canadian Blood Services in which patient data is stored and the matching algorithms are run. Additional data has also been provided directly by the provincial Living Kidney Donation and Transplant Programs. Unless otherwise stated, data is presented for the period of 2009-2016. For programs that were initiated within this period, including the Highly Sensitized Patients (HSP) program (started in November of 2013) and the National Organ Waitlist (NOW) initiated in (June of 2012), results are presented from program start date to the present.
In the case of the Kidney Paired Donation (KPD) program, the results presented are for all Match Cycles initiated up to the end of 2016 (up to and including Match Cycle 26). Transplant outcomes for pairs proposed as part of Match Cycle 26 are included in the results presented, although the actual surgeries took place in early 2017. Unless specified otherwise, transplant results reported by year are based on the year in which each transplanted pair’s Match Cycle began rather than the actual transplant date.
Canadian Blood Services acknowledges, with gratitude, the commitment of the Kidney Transplant Advisory Committee, the Living Donation Advisory Committee, the National HLA Advisory Committee, the Heart Transplant Advisory Committee, the Liver Transplant Advisory Committee, the Organ Donation and Transplantation Executive Advisory Committee, and those whose advice supports the continued growth and achievements of the KPD, HSP and NOW Programs. The KPD, HSP and NOW programs remain indebted to the administrators, physicians, surgeons, transplant coordinators and allied health professionals of the Organ Donation
Organizations and Transplant Programs, for their efforts and collaboration. Their commitment to success and excellence has driven these accomplishments for transplant recipients in Canada.
2 Transplants from Match Cycle 26 that were placed on indefinite hold due to medical issues have not been included in the results presented in this report. See KPD Program Summary for details.
1.1 DATA SOURCES
1.0 INTRODUCTION
1.2 ACKNOWLEDGEMENTS

Consultation version – Confidential and not for distribution (2017-11-23)
Donation & Transplantation Interprovincial Programs Report Donation & Transplantation Interprovincial Programs Report 6
All provinces have been participating in the Kidney Paired Donation (KPD) Program since November 2010. The goal of the KPD program is to identify and facilitate kidney transplant opportunities for end stage renal disease (ESRD) patients who have a willing but incompatible living donor. Matches between candidate and donor records in the Canadian Transplant Registry (CTR) are generated as groups of donor exchanges and each grouping of exchanges is called a chain. Match Cycles are currently run three times a year to identify groups of mutually exclusive chains. Additional reruns and repair runs are done monthly within Match Cycles, or as needed.
The first transplants facilitated through the KPD program were performed in June of 2009 as part of the program’s second Match Cycle; since the start of the program until the end of 2016, 26 Match Cycles have been run, with the last transplants completed as part of Match Cycle 26 performed in April of 2017. These Match Cycles have collectively resulted in 417 transplants of candidates registered with the program, as well as 88 transplants to patients who were on local kidney waitlists for a total of 505 transplants. On average, 9.4 chains are proposed per Match Cycle, with 5.9 chains proceeding to completed transplants per match cycle.
3 An additional two transplants were identified and included in completed chains as part of Match Cycle 26, but were put on indefinite hold due to medical issues. These transplants are expected to proceed in 2017, and have not been included in the results presented in this report.
2.0 KPD PROGRAM
Kidney Paired Donation
2.1 KPD PROGRAM SUMMARY
505Transplantssince 2008
The KPD Program is led and managed by Canadian Blood Services in collaboration with the provincial Living Donation and Transplant Programs across the county under shared operating guidelines, policies, processes and procedures.
KPD PROGRAM
R D
Consultation version – Confidential and not for distribution (2017-11-23)
Donation & Transplantation Interprovincial Programs Report Donation & Transplantation Interprovincial Programs Report 7
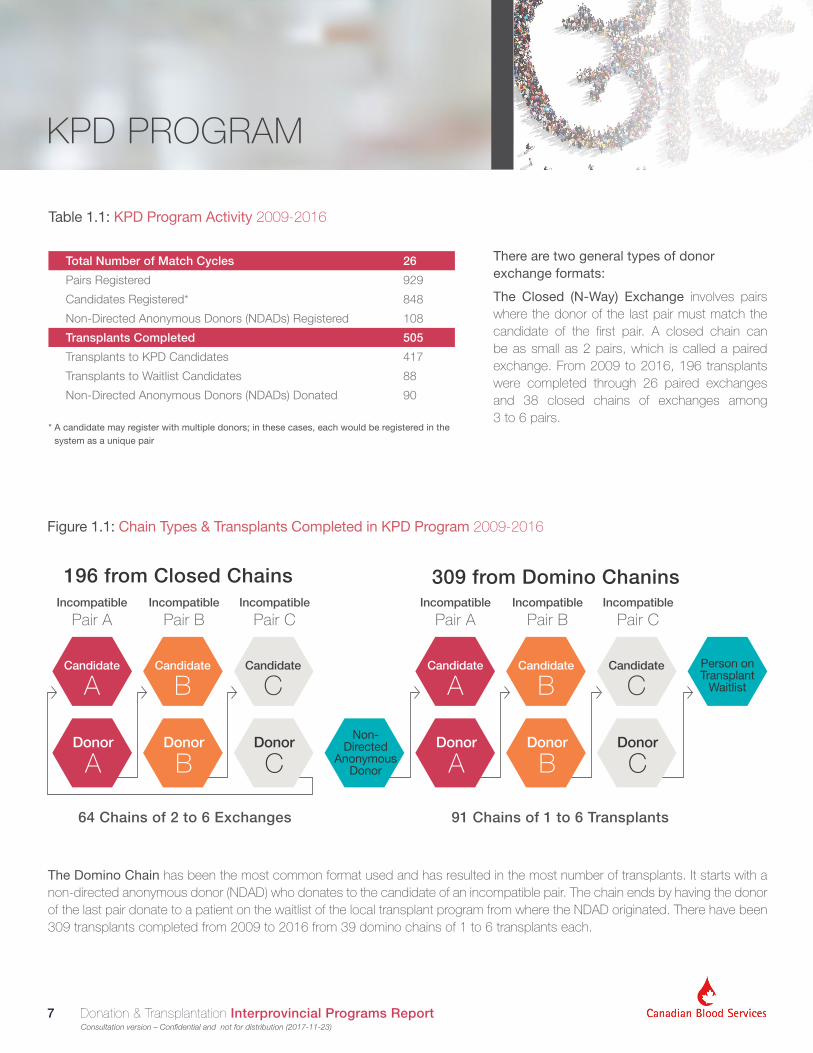
Table 1.1: KPD Program Activity 2009-2016
Total Number of Match Cycles 26
Pairs Registered 929
Candidates Registered* 848
Non-Directed Anonymous Donors (NDADs) Registered 108
Transplants Completed 505
Transplants to KPD Candidates 417
Transplants to Waitlist Candidates 88
Non-Directed Anonymous Donors (NDADs) Donated 90
* A candidate may register with multiple donors; in these cases, each would be registered in the system as a unique pair
There are two general types of donor exchange formats:
The Closed (N-Way) Exchange involves pairs where the donor of the last pair must match the candidate of the first pair. A closed chain can be as small as 2 pairs, which is called a paired exchange. From 2009 to 2016, 196 transplants were completed through 26 paired exchanges and 38 closed chains of exchanges among 3 to 6 pairs.
The Domino Chain has been the most common format used and has resulted in the most number of transplants. It starts with a non-directed anonymous donor (NDAD) who donates to the candidate of an incompatible pair. The chain ends by having the donor of the last pair donate to a patient on the waitlist of the local transplant program from where the NDAD originated. There have been 309 transplants completed from 2009 to 2016 from 39 domino chains of 1 to 6 transplants each.
Figure 1.1: Chain Types & Transplants Completed in KPD Program 2009-2016
64 Chains of 2 to 6 Exchanges
196 from Closed Chains 309 from Domino Chanins
Donor
ADonor
ADonor
BDonor
BDonor
CDonor
CNon-
DirectedAnonymous
Donor
Person on Transplant
Waitlist
Candidate
A
Incompatible
Pair AIncompatible
Pair AIncompatible
Pair BIncompatible
Pair BIncompatible
Pair CIncompatible
Pair C
Candidate
ACandidate
BCandidate
BCandidate
CCandidate
C
91 Chains of 1 to 6 Transplants
KPD PROGRAM

Consultation version – Confidential and not for distribution (2017-11-23)
Donation & Transplantation Interprovincial Programs Report Donation & Transplantation Interprovincial Programs Report 8
Figure 1.2: Transplants by Chain Type by Year of Match Cycle in which Transplant was Proposed, 2009-2016
The program saw a steady increase of registered candidate-donor pairs from 2009 to 2015, mainly because of the carry-over of pairs that could not be matched in a previous year; however, 2016 represents the first year that there have been fewer active pairs than a previous year. A salient factor that
contributed to this situation is the decrease in the number of new pairs registering, with 117 pairs registered for the first time in 2016, while 2014 and 2015 averaged 147 new pairs per year.
100
90
80
70
60
50
40
30
20
10
02009
Domino
Year of Match Cylce
Closed
2010 2011 2012 2013 2014 2015 2016
21 31 38 41 55 43 48 32
416
20 20
25
23 40 48
KPD PROGRAM
350
50
100
150
200
250
300
02009 2010 2011 20012 2013 2014 2015 2016
Year of Match Cylce
Registered Pairs Active in Year
Transplants from MCs in Year Non-Directed Anonymous Donors in Year
Figure 1.3: Registered Pairs, NDADs and Transplants by Year of Match Cycle, 2009-2016
Counts reflect all pairs/NDADs active for at least one match cycle in year and all transplants completed as a results of match cycles in year.

Consultation version – Confidential and not for distribution (2017-11-23)
Donation & Transplantation Interprovincial Programs Report Donation & Transplantation Interprovincial Programs Report 9
Transplant candidates registered in the program have ranged in age from 1 to 77; the median age of candidates across Match Cycles remains fairly constant with the mean age of candidates at the time of their first Match Cycle being 48 years of age. Donors enrolling in the program as part of a registered pair have a mean age of 47 at time of first active Match Cycle, while the mean age among NDADs at the time of their first active Match Cycle is 50 years of age.
Adults aged 40 to 69 at their first Match Cycle make up 71% of the registered candidate population, and this age group received 62% of the transplants among registered recipients. Similarly, 71% of donors were between 40 and 69 at their first Match Cycle; however, donors in this age group accounted for 75% of donations (excluding NDAD donations). Donors are most commonly between the ages of 50 and 59, with this age group accounting for 30% of donors participating in the program and 31% of program donations. Only 9% of donors
registered and 6% of those making a donation have been younger than 30.
There have been 21 candidates who first participated in the program while in the pediatric age range (≤19 years old), 14 (67%) of whom received a transplant while still within this age range, with 10 transplanted in their first active Match Cycle and the remaining 4 transplanted within 2 Match Cycles. Pediatric candidates comprise approximately 3% of registered recipients transplanted through the KPD program.
KPD PROGRAM
2.2 Transplant Candidates, Transplant Recipients and DonorsAge & Sex
Over all age ranges, 48% of transplant candidates have been male (52% have been female), which is consistent with the ratio between sexes represented among those who received a transplant. Similarly, donors who donated through the KPD program (including NDADs) have been 59% female and 41% male, which is also consistent with the proportions represented among all potential donors participating in the program (60% and 40% respectively). Of the NDADs who have participated in at least one Match Cycle, 56% were female and 44% were male, with the same proportions represented among NDADs who made a donation.
180
20
40
60
80
140
120
100
160
0≤19 20-29 30-39 40-49 50-59 60-69 70+
Age Group
Donors (Including NDADs)Transplant Recipients (Registered Recipients Only)
Figure 1.4: Age of Registered Recipients and Donors, 2009-2016

Consultation version – Confidential and not for distribution (2017-11-23)
Donation & Transplantation Interprovincial Programs Report Donation & Transplantation Interprovincial Programs Report 10
Blood Group
ABO blood group is a significant factor in identifying compatible matches between donors and candidates. ABO O candidates are over represented in the registry compared to their representation in the general population, due to their current absolute requirement for an ABO O donor in the program. Despite preferential matching of O donors to O recipients (which is resulting in a majority of O donors transplants being received by O recipients as would be expected), type O candidates continue to accumulate in program because of a combination of restrictive factors (type O and their HLA profile).
KPD PROGRAM
Table 1.2: Transplant Recipients by Age and Sex, 2009-2016: Count (Proportion of Recipients by Type), n (%)
Registered Recipients Waitlist Recipients
Total Female Male Total Female Male
Not specified
All Ages 417 (100) 216 (100) 201 (100) 88 (100) 25 (100) 37 (100) 26 (100)
≤19 14 (3) 4 (2) 10 (5) 6 (7) 2 (8) 2 (5) 2 (8)
20-29 27 (6) 8 (4) 19 (9) 3 (3) - 2 (5) 1 (4)
30-39 53 (13) 24 (11) 29 (14) 5 (6) - 3 (8) 2 (8)
40-49 98 (24) 61 (28) 37 (18) 24 (27) 7 (28) 9 (24) 8 (31)
50-59 118 (28) 60 (28) 58 (29) 27 (31) 9 (36) 12 (32) 6 (23)
60-69 96 (23) 56 (26) 40 (20) 16 (18) 5 (20) 9 (24) 2 (8)
70+ 11 (3) 3 (1) 8 (4) 3 (3) 2 (8) - 1 (4)
Unknown - - - 4 (5) - - 4 (15)
Please see Table A3.3 in Appendix 3 for the equivalent results relating to KPD donors.

Consultation version – Confidential and not for distribution (2017-11-23)
Donation & Transplantation Interprovincial Programs Report Donation & Transplantation Interprovincial Programs Report 11
Blood group O candidates comprise 57% of all registered candidates. Despite preferential blood group O donor to blood group O candidate matching, blood group O candidates still received only 44% of the transplants facilitated through KPD to registered recipients. Only 38% of blood group O candidates received a transplant, compared with 64% of candidates in other blood groups.
34% of donors registered in KPD (including paired donors and NDADs) are in blood group O, and 56% of donors in blood group O made a donation.
KPD PROGRAM
Figure 1.5: Proportion among Registered Candidates Active in KPD Program at the Time of Each Match Cycle by Blood Group, 2009 to 2016
A AB B O
100%
90%
80%
70%
60%
50%
40%
30%
20%
10%
0%
2009 2011 2012 2013 2014 2015 20162010
3
1
4 5
15
217
64
218
78
1
23
95
124
91
215
114
613
106 46 %30
10 35 32 37 32 56 33 42%
3%9%
1 2 3 4 5 6 7 8 9 10 11 12 13 14 15 16 17 18 19 20 21 22 23 24 25 26
Cdn Pop

Consultation version – Confidential and not for distribution (2017-11-23)
Donation & Transplantation Interprovincial Programs Report Donation & Transplantation Interprovincial Programs Report 12
KPD PROGRAM
Table 1.3: Transplants to Registered Recipients by Donor and Recipient Blood Groups for Years 2009 to 2016
Donor Blood GroupTotal
A AB B O
A 140 (34%) - - 3 (1%) 143 (34%)
AB 7 (2%) 2 (0.5%) 1 (0.2%) - 10 (2%)
B 1 (0.2%) - 70 (17%) 9 (2%) 80 (19%)
O 1 (0.2%) - - 183 (44%) 184 (44%)
Total 149 (36%) 2 (0.5%) 71 (17%) 195 (47%) 417 (100%)
Rec
ipie
nt B
loo
d
Gro
up
Calculated Panel Reactive Antibody (cPRA) Levels
Some candidates are incompatible with their registered donors (and other donors) due to donor specific HLA antibodies (DSA), which can form after sensitization or exposure to foreign HLA antigens from prior transfusions, transplantations or pregnancies. The percentage of the general population to which a candidate has HLA antibodies is estimated as calculated panel reactive antibodies (cPRA). A candidate with a higher cPRA level will be incompatible with more donors. Transplants with HLA DSA present are associated with higher rates of kidney rejection and shortened survival of the transplanted organ.
Candidates with a cPRA of greater than or equal to 97% are the most biologically difficult-to-match population in the Registry. These candidates comprise 29% of all candidates since registry inception, but receive only 10% of transplants facilitated by KPD to registered candidates. Therefore accumulating in the registry over time; more than half of the active candidates in 2016 had cPRA ratings of 97% or higher. Conversely, those with a cPRA of 95-96% were transplanted at rates comparable to their prevalence in the candidate population, making up 3.4% of candidates and 3.8% of registered transplant recipients

Consultation version – Confidential and not for distribution (2017-11-23)
Donation & Transplantation Interprovincial Programs Report Donation & Transplantation Interprovincial Programs Report 13
KPD PROGRAM
Figure 1.6: Proportion among Registered Candidates Active in KPD Program at the Time of Each Match Cycle by cPRA Group, 2009 to 2016
Table 1.4: Percentage of Unexpected Positive Crossmatches/DSA by Year
100%
90%
80%
70%
60%
50%
40%
30%
20%
10%
0%
2009 2011 2012 2013 2014 2015 2016
99%-100%
97%-98%
95%-96%
80%-94%
1%-79%
0%
cPRA
2010
22% 22%
12% 12% 11% 11%
23%
13%
24%
7%
6%
49%
2%
11%
23%
9%1%4%
52%
4%1%4%
57%
22%
10%
1%
6%
50%
24%
7%
4%
7%
46%
24%
8%
5%
11%
40%
27%
11%
9%
4%
27%
35%
22%
9%
13%
MC
1
MC
2
MC
3
MC
4
MC
5
MC
6
MC
7
MC
8
MC
9
MC
10
MC
11
MC
12
MC
13
MC
14
MC15
MC
16
MC
17
MC
18
MC
19
MC
20
MC
21
MC
22
MC
23
MC
24
MC
25
MC
26
Category 2010 2011 2012 2013 2014 2015 2016
Number of actual crossmatches performed
71 80 73 95 91 153 137
Number of unexpected actual positive FCXM and/or new DSA
6 5 1 2 5 8* 5
Percent of unexpected positive FCXM and/or new DSA
8% 6% 1% 2% 4% 5% 4%
FCXM: Flow Cytometry Crossmatch
* Note: In one case in which an unexpected positive crossmatch was detected, the chain was primarily declined due to a medical condition unrelated to the crossmatch. An additional chain had two unexpected positive crossmatches identified in the same chain. HLA antibody testing of transplant candidates is repeated several times per year as antibody formation is a
dynamic process; the candidate antibody profile may change over time. In rare cases, a new donor-specific antibody (DSA) can form between the time a Match Cycle is run and the subsequent confirmatory testing. Overall however, once a match has been approved by the HLA laboratory, the percentage of subsequently unexpected positive confirmatory crossmatches or newly discovered DSA remains rare and is not a major contributor to chain breakdown.

Consultation version – Confidential and not for distribution (2017-11-23)
Donation & Transplantation Interprovincial Programs Report Donation & Transplantation Interprovincial Programs Report 14
KPD PROGRAM
Chain Length and Time to Completion
The KPD program’s target is to complete a chain of transplants within 120 days from the time of chain proposal. Up to the end of 2016, the median time to completion for all chains was 118 days. For the 3 Match Cycles run in 2016, 70% of completed chains were completed within the target time frame, which represents a substantial improvement over past years in which only 52% of chains were completed within 120 days. The chains completed in 2016 were also longer in general, averaging 3.6 pairs transplanted per chain as opposed to 3.2 pairs on average historically for the program (a 13% increase in average chain length).
Repaired chains tend to require more time to complete compared with chains that proceed as originally proposed, with repaired chains requiring 30 days longer to complete on average. Prior to 2016, approximately one in seven chains
Chains are scored based on match points attributes representing priorities for access (refer to Appendix 2) and the group of chains with the highest total points, which by definition represents the most optimal transplant combination possible, is proposed to move forward. Incompatible pairs who are not matched in a given Match Cycle and agree to remain in the Registry are carried forward into the next Match Cycle. Pairs may be included in a Match Cycle after the initial set of chains is proposed under certain circumstances; for instance, a
2.3 MATCH CYCLE STATISTICSpair may be added as a replacement for a proposed pair that could not proceed as part of the process to repair a chain, and in some cases the matching algorithm may be rerun with additional pairs included.
(14%) has been repaired; however, 41% of chains completed in 2016 required one or more repairs, representing almost triple the rate for repairs in previous years.
Despite the higher repair rate, chains requiring repairs in 2016 were still completed more quickly on average than repaired chains in previous years, as were chains not requiring repairs. As a result, 2016 Match Cycles evidenced lower chain completion times on average than the average among chains from previous years.
4 Chain completion time is the time from the date the chain was first proposed to the time the last transplant is completed. The final completed chain may contain some pairs that differ from the initial proposal if the chain was repaired using new pairs to respect the time already invested by the pairs and the donation programs.
Irene Mills, a member of the Haida First Nation, donated one of her kidneys to a complete stranger. Mills was motivated to become an anonymous donor after a family friend was in need of a transplant. She’s encouraging others to learn more about living organ donation, as well as becoming blood and stem cell donors.

Consultation version – Confidential and not for distribution (2017-11-23)
Donation & Transplantation Interprovincial Programs Report Donation & Transplantation Interprovincial Programs Report 15
KPD PROGRAM
Closed Chains
2 (Paired Exchange) 6 107 (88-133) 3.0 117 (56-124)
3 2 120 (104-135) 2.0 125 (84-159)
4 2 74 (71-76) 1.0 133 (113-153)
5 2 141 (130-151) 0.9 129 (119-169)
6 2 93 (90-97) 0.1 128 (128-128)
All Closed 14 96 (86-133) 7.0 119 (87-145)
Domino Chains
1-2 3 133 (101-165) 3.3 125 (85-145)
3 0 - - 3.3 101 (88-138)
4 1 117 - 3.3 110 (95-139)
5 2 133 (123-144) 1.7 137 (116-166)
6 2 93 (83-104) 0.3 210 (162-259)
All Domino 8 116 (102-138) 11.9 118 (93-145)
All Chains 22 113 (86-135) 18.9 119 (92-145)
In some cases, fewer transplants are actually completed in a given chain than the number of matches that were included in the final version of that chain; these chains are categorized as completed, and are represented in the table above based on the actual number of transplants that were completed as part of the chain.
* Time to chain completion refers to the time from the initial chain proposal date to the date of the final transplant that occurred as part of the chain.
In some cases, fewer transplants are actually completed in a given chain than the number of matches that were included in the final version of that chain; these chains are categorized as completed, and are represented in the figure above based on the actual number of transplants that were completed as part of the chain.
Figure 1.7: Median Time from Chain Proposal to Completion by Year and Chain Length
180
150
120
90
60
30
0
2009 2011 2012 2013 2014 2015 2016
5-6 Pairs4 Pairs3 Pairs1-2 Pairs
2010
Med
ian
Day
s to
Com
plet
ion
120 day Target
2016 2009 to 2015
Number of Candidates in Chains
Number of Chains Completed
Median Time to Completion in Days (Interquartile Range)
Average # of Chains Completed per Year
Median Time to Completion in Days (Interquartile Range)
Table 1.5: Chain Length and Median Time to Completion*
Since 2015, the KPD team has been tracking and encouraging completion of chain tasks by participating transplant centres, and improvements in efficiency can be seen in the results for chain completion in 2016, particularly in chains of 4 or more pairs, which decreased in mean completion time from 131 days from 2009-2015 (11 days over the target) to 108 days in 2016 (12 days under the target). Nevertheless, in light of the year-to-year variation in chain completion times, it would be premature to conclude that this represents a sustainable change in program performance.

Consultation version – Confidential and not for distribution (2017-11-23)
Donation & Transplantation Interprovincial Programs Report Donation & Transplantation Interprovincial Programs Report 16
KPD PROGRAM
Chain Collapses
A chain is collapsed and does not proceed to transplant if there is one or more matched pair declines before a significant amount of the chain evaluation work is completed. Approximately 44% of chains collapsed because of medical issues of a donor and/or a candidate, making medical issues the leading cause of chain collapses.
Relatively few chains collapsed in 2016 as compared with previous years. HLA collapses accounted for 14% of proposed chains in 2016, which is comparable to the approximately 11% of chains that collapsed due to HLA issues each previous year on average.
In an attempt to reduce the amount of medical declines of donors, the Living Donation Advisory Committee has established the Kidney Paired Donation Protocol for Participating Donors which has been used as of October 2015 by Living Donation Programs to assess all donors wishing to enroll in the Program. For Programs seeking to enroll a donor they feel is clinically acceptable but does not completely meet the assessment Protocol parameters, a process exists to submit a Living Donor Query to the Living Donor Advisory Committee and/or the Kidney Transplant Advisory Committee. The committee(s) will return a decision as to whether or not the donor can still be enrolled and under what restrictions or conditions, if any.
5 Richardson R, Connelly M, Dipchand C, Garg AX, Ghanekar A, Houde I, Johnston O, Mainra R, McCarrell R, Mueller T, Nickerson P, Pippy C, Storsley L, Tinckam K, Wright L, Yilmaz S, Landsberg D & Protocols Working Group of the Canadian Blood Services’ Living Donation Advisory Committee. 2015. Kidney Paired Donation Protocol for Participating Donors 2014. Transplantation. Oct;99(10 Suppl 1):S1-S88.
Year of match decline is based on year of the Match Cycle in which the match was proposed. One 2013 chain declined for both medical and non-medical reasons.
Table 1.6: Reasons for Chain Collapses by Year
Reason Category
Year Medical Non-Medical HLA Surgical/
Anatomical Total
2009Count 0 2 0 0 2
% 0% 100% 0% 0% 100%
2010Count 2 1 5 0 8
% 25% 13% 63% 0% 100%
2011Count 4 2 4 0 10
% 40% 20% 40% 0% 100%
2012Count 4 2 1 2 9
% 44% 22% 11% 22% 100%
2013Count 9 4 2 2 16
% 56% 25% 13% 13% 100%
2014Count 10 5 6 3 24
% 42% 21% 25% 13% 100%
2015Count 10 1 3 0 14
% 71% 7% 21% 0% 100%
2016Count 1 2 4 0 7
% 14% 29% 57% 0% 100%
TotalCount 40 19 25 7 90
% 44% 21% 28% 8% 100%
Avg. 2009-15
Count 5.6 2.4 3.0 1.0 11.9
47% 20% 25% 8% 100%

Consultation version – Confidential and not for distribution (2017-11-23)
Donation & Transplantation Interprovincial Programs Report Donation & Transplantation Interprovincial Programs Report 17
KPD PROGRAM
Match and Chain completions
Of the 29 chains that were proposed in 2016, 22 (76%) were completed. Approximately one-quarter of the chains proposed in 2016 could not be repaired and so were collapsed. Nine of the 22 completed chains were completed after being repaired by replacement or reconfiguration of one or more pairs. For reference, just over half (52%) of all chains proposed since the program began have been completed without a repair, and an additional 11% were completed after being repaired.
Prior to 2016, 19% of the chains that could not be completed as originally proposed were completed following a repair; however, 56% of chains that could not be completed as originally proposed in 2016 were repaired and completed, for a repair
rate that is three times the rate among previous years. The low number of chains collapsed in 2016 (lower than six of the seven prior years of the program’s operation) is consistent with 2016 having more repair opportunities than any previous year.
* Chains resulting in fewer transplants than the total proposed as part of the final version of the chain have been included under completed chains. ^Includes matches between a given donor and a waitlist recipient †Number of cancelled matches is based on unique matches that were proposed but did not proceed to transplant. Matches that were proposed multiple times as part of different chains in the same year are counted once for that year. Matches that were cancelled in one chain but later completed as part of a different chain are only counted among successful transplants.
Table 1.7: Match and Chain Completion Rates, 2009-2016
KPD Matches^ KPD Chains
Year Completed n (%) Cancelled† n (%)
Total Proposed
n (%)
Completed*n (%)
Collapsedn (%)
Total Proposed
n (%)
2009 25 (69%) 11 (31%) 36 8 (80%) 3 (30%) 10
2010 47 (58%) 34 (42%) 81 17 (68%) 8 (32%) 25
2011 58 (62%) 36 (38%) 94 15 (60%) 10 (40%) 25
2012 61 (66%) 31 (34%) 92 20 (69%) 9 (31%) 29
2013 80 (64%) 45 (36%) 125 23 (59%) 16 (41%) 39
2014 66 (51%) 64 (49%) 130 20 (45%) 24 (55%) 44
2015 88 (58%) 64 (42%) 152 29 (67%) 14 (33%) 43
2016 80 (59%) 56 (41%) 136 22 (76%) 7 (24%) 29
Total 505 (60%) 341 (40%) 846 154 (63%) 91 (37%) 244
Average 2009-15 61 (60%) 41 (40%) 101 19 (61%) 12 (39%) 31

Consultation version – Confidential and not for distribution (2017-11-23)
Donation & Transplantation Interprovincial Programs Report Donation & Transplantation Interprovincial Programs Report 18
KPD PROGRAM
The KPD matching algorithm assigns points to matches between donors and candidates in the same city in an attempt to reduce the number of donors needing to travel. Donor travel continues to be a significant part of facilitating KPD transplants. Work has begun to establish protocols for shipping donor kidneys more regularly in the future. For transplants conducted in Match Cycles initiated prior to 2016, just over half (52%) required inter-provincial travel; however, in 2016 this proportion increased slightly to 58% of transplants requiring the donor to travel interprovincially and no interprovincial recipient travel. Transplants in 2016 also differed from previous years in that none required the recipient to travel interprovincially for transplant.
2.4 TRAVELHistorically 7% of KPD transplants required intraprovincial travel for either the donor or the recipient and 41% did not require travel, and 2016 results show 5% of transplants involved intraprovincial travel and 38% did not require either the recipient or the donor to travel.
Figure 1.8: Proportion of KPD Participants Travelling for Transplantation
100
90
80
70
60
50
40
30
20
10
02009 2010 2011 2012 2013 2014 2015 Avg
09-152016
Year of Match Cylce
Interprovincial Travel: Donor
Interprovincial Travel: Recipient
Travel Not Required
Interprovincial Travel: Donor and Recipient
IntraprovincialTravel Only (Donor/Recipient)
Travel between Atlantic provinces is not counted as interprovincial or intraprovincial travel because all Atlantic province residents must go to Halifax as their surgical transplant centre.

Consultation version – Confidential and not for distribution (2017-11-23)
Donation & Transplantation Interprovincial Programs Report Donation & Transplantation Interprovincial Programs Report 19
KPD PROGRAM
Program Performance
There have been 417 transplants to 415 registered recipients, with an additional 88 waitlist candidates transplanted through the KPD program. Two patients came back into the KPD program after their first transplant failed and received a second transplant.
Just under half (49%) of candidates who registered in KPD Match Cycles to the end of 2016 received a transplant through the program, with 11% of candidates remaining active for the first Match Cycle in 2017, comprising two-thirds of the candidates active in that match cycle (MC27). A total of 343 registered candidates have been inactivated; 79 of these candidates were inactivated in 2016. Reasons for inactivation are not routinely provided to the program but may include transplant from local waitlist or a local living donor, or withdrawal for medical reasons.
2.5 OUTCOMES
Table 1.8: Candidate Activity for KPD Program 2009 – 2016
Transplant recipients stratified by year of match cycle in which they received a transplant. *Does not include candidates whose first Match Cycle was 27.
2009 2010 2011 2012 2013 2014 2015 2016 All Years
Registered candidates transplanted through KPD program
19 37 49 48 65 54 73 72 417
Inactivated candidates by year of most recent Match Cycle
11 26 24 38 48 53 64 79 343
Candidates active at end of 2016 by year of first Match Cycle*
1 7 4 10 8 14 18 29 91

Consultation version – Confidential and not for distribution (2017-11-23)
Donation & Transplantation Interprovincial Programs Report Donation & Transplantation Interprovincial Programs Report 20
KPD PROGRAM
Recipient Outcomes
One month and one year post-surgery minimum outcome data has been collected for both donors and recipients.
For transplant recipients from Match Cycles in 2009-2016 for whom outcome information is available, 99.8% of recipients were alive one month after the date of the transplant, as were 99.5% at one year post-transplant. Please see Appendix 3: Table A3.10 for additional results relating to recipient outcomes.
Table 1.9: One Month Recipient and Graft Outcomes, 2009 – 2016
Table 1.10: One Year Recipient and Graft Outcomes, 2009 – 2016
Data available for 459 recipients (rejection information available for 443 recipients).
6 One-month outcome results are available for 459 (91%) of the 505 recipients transplanted through the KPD program, and one-year outcome results are available for 374 recipients (373 for graft survival).
Patient survival data available for 373 recipients and graft survival data available for 374 recipients (rejection information available for 366 recipients). Rejection episode results include rejection episodes occurring within the first month after receiving the transplant.
Recipients Waitlist Recipients Total
Patient Survival 374 99.7% 84 100% 458 99.8%
Graft Survival 371 98.9% 84 100% 455 99.1%
Patients Experiencing Rejection Episodes
26 7.2% 7 9.1% 33 7.4%
Recipients Waitlist Recipients Total
Patient Survival 304 99.3% 67 100% 371 99.5%
Graft Survival 300 97.7% 67 100% 367 98.1%
Patients Experiencing Rejection Episodes
45 15.2% 10 14.7% 55 15.0%

Donation & Transplantation Interprovincial Programs Report Donation & Transplantation Interprovincial Programs Report 21
HIGHLY SENSITIZED PATIENT PROGRAM
The Highly Sensitized Patient (HSP) program represents the first completely national deceased donor kidney sharing agreement in Canada, and has begun to correct, along with newer provincial allocation policies, historical imbalances between the number of highly sensitized patients and the proportion of this group receiving transplants.
Under the HSP program national agreement, donor organs from anywhere in the country will be first offered nationally to a suitably matched transplant candidate with a cPRA ≥ 95%. From inception to end of 2016, the program has facilitated 293 kidney transplants
Policy ChangesSince the establishment of the HSP program, the Kidney Transplant Advisory Committee (KTAC) and the National HLA Advisory Committee (NHLAAC) have been tracking HSP program activity on a monthly basis. In April 2015 as part of an ongoing system performance review the KTAC began evaluating the HSP program policies using data analysis and simulation models provided by Canadian Blood Services.
During the evaluation, KTAC observed that Highly Sensitized Patients (HSPs) with cPRA >98% are transplanted at a proportion significantly lower than their prevalence on the national HSP wait list and comprise a majority of HSPs still waiting for transplant. Conversely HSPs with cPRA 95-98% are transplanted more readily and few remain on the HSP wait list. Therefore, KTAC recommended the prioritization of HSPs with cPRA >98% in the HSP allocation as a tie-breaker in order to improve transplant opportunities for these hardest to match patients.
The second observation made by KTAC during the evaluation related to the interprovincial import and export thresholds designed to ensure import and export balance between provinces. The data analysis and simulation models showed smaller provinces were “on hold for HSP” due to import threshold restrictions for a combined 705 days. In this case, KTAC recommended the removal of all import thresholds but agreed to maintain export thresholds as a safeguard for transplant activity in net exporting provinces.
The data analysis and simulation models showed smaller provinces were “on hold for HSP” due to import threshold restrictions for a combined 705 days. In this case, KTAC recommended the removal of all import thresholds but agreed to maintain export thresholds as a safeguard for transplant activity in net exporting provinces.
Since the establishment of the HSP program, the Kidney Transplant Advisory Committee (KTAC) and the National HLA Advisory Committee (NHLAAC) have been tracking HSP program activity on a monthly basis.
In April 2015, as part of ongoing system performance review, KTAC observed that Highly Sensitized Patients (HSPs) with cPRA >98% are transplanted at a proportion significantly lower than their prevalence on the national HSP wait list, and now comprise the majority of HSPs still waiting for transplant. Conversely HSPs with cPRA 95-98% are transplanted more readily and few remain on the HSP wait list. Therefore, following a review of simulations that model and predict program impact, KTAC recommended the prioritization of HSPs with cPRA >98% in the HSP allocation when required to adjudicate between allocation to multiple recipients, in order to ensure transplant opportunities for these hardest to match
3.0 HIGHLY SENSITIZED PATIENT PROGRAM
3.1 HSP PROGRAM SUMMARY
as a result of collaboration between Transplant Programs, ODOs, HLA Laboratories, Canadian Blood Services and Provincial Governments in
Canada.
patients. See section 3.3 for an analysis of factors used in allocation decisions in cases in which there are multiple matches per donor (outlined in section 8.0 of Appendix 4).
The second observation made by KTAC during the evaluation related to the interprovincial import and export thresholds designed to ensure import and export balance between provinces. The data analysis and simulation models showed smaller provinces were “on hold for HSP” due to import threshold restrictions for a combined 705 days. In this case, KTAC recommended the removal of all import thresholds but agreed to maintain export thresholds as a safeguard for transplant activity in net exporting provinces.
Recommendations from KTAC were endorsed by the Donation and Transplant Administrators Advisory Committee (DTAAC) and the Organ Donation & Transplantation Expert Advisory Committee (ODTEAC) prior to implementation. A summary of HSP Program policy changes are presented in Table 2.1.
7 Highly-sensitized patients comprise up to 25% of waitlists in Canada, but historically (within local allocation algorithms) received <5% of the transplants through local allocation programs. See Call to Action: A strategic plan to improve organ and tissue donation and transplantation performance for Canadians (2011).
Available at blood.ca/sites/default/files/otdt-indx-final-c2a.pdf

Donation & Transplantation Interprovincial Programs Report Donation & Transplantation Interprovincial Programs Report 22
HIGHLY SENSITIZED PATIENT PROGRAM
Table 2.1: Summary of HSP Program Policy Changes, 2009
Table 2.2: HSP Candidates and Transplants
Program Activity
PolicyCTR 50 001:
Recipient Eligibility Criteria
CTR 50 002: Requirements to
Offer
CTR 50 003: Matching
and Ranking Methodology
CTR 50 004:Inter-provincial
Balancing
Status Version 1.3 effective on 2014-06-06
Version 1.3 effective on 2013-04-01
Version 3.0 effective on 2016-06-20
Version 2.0 effective on 2016-12-01
Policy ChangeRecommendation
2014-05-23: Remove the minimum age
eligibility
No change recommendation
2015-09-23: Include high cPRA as a ranking attribute
2015-08-24: Remove import thresholds and revise export
thresholds
End
ors
emen
ts
KTAC 2014-05-23 NA 2015-09-23 2016-03-30
DTAAC 2014-06-23 NA 2016-03-23 2016-09-02
ODTEAC 2014-06-20 NA 2015-11-27 2015-11-27
ProvincialSign-Off 2016-11-01 NA 2016-06-20 2016-12-01
CTRImplementation
No change required in CTR NA 2016-07-15 2016-12-16
Candidates Active on Waitlist (>98%) 465
Candidates Active on Waitlist (≥95 and ≤ 98%) 30
Total Candidates Active on Waitlist 495
Total Transplants 293
Interprovincial 167
Intraprovincial 126
Total Donors with HSP Allocation Run 1,980

Donation & Transplantation Interprovincial Programs Report Donation & Transplantation Interprovincial Programs Report 23
3.2 HSP TRANSPLANT CANDIDATES AND RECIPIENTS
HIGHLY SENSITIZED PATIENT PROGRAM
Figure 2.1: HSP Candidate Pool since Inception by cPRA
Oct
No
vD
ec
Sk
& M
B, A
tl
AB
: E
dm
.
AB
: C
al
ON
BC
QC
Jan
Feb
Mar
Ap
r
May
Jun
Jul
Aug
Sep Oct
No
v
Dec Jan
Feb
Mar
Ap
r
May
Jun
Jul
Aug
Sep Oct
No
v
Dec Jan
Feb
Mar
Ap
r
May
Jun
Jul
Aug
Sep Oct
No
v
Dec
2013 2014 2015 2016
0
100
200
300
400
500
600100 99 98
97 96 95
cPRA
Values shown represent count of active HSP patients at end of month. Dashed Lines indicate program participation start dated by province (SK & MB: October 21, 2013; Atlantic Provinces: November 4, 2013; AB: January 6 [Edmonton] and April 7 [Calgary], 2014; ON: May 27, 2014; BC: June 12, 2014; QC: October 27, 2014). cPRA values as calculated as of 2017 Q1. Please see table A5.4 in Appendix 5 for values.
Given the staggered implementation of provinces joining the HSP program, transplant numbers were relatively slow to start. Monthly activity increased dramatically starting in June 2014, as the larger provincial programs joined.

Donation & Transplantation Interprovincial Programs Report Donation & Transplantation Interprovincial Programs Report 24
HIGHLY SENSITIZED PATIENT PROGRAM
Figure 2.2: HSP Candidate Pool by cPRA, 2015-2016
Values shown represent count of active HSP patients at end of month. Dashed Lines indicate program participation start dated by province (SK & MB: October 21, 2013; Atlantic Provinces: November 4, 2013; AB: January 6 [Edmonton] and April 7 [Calgary], 2014; ON: May 27, 2014; BC: June 12, 2014; QC: October 27, 2014). cPRA values as calculated as of 2017 Q1. Please see table A5.4 in Appendix 5 for values.
Jan
Feb
Mar
Ap
rM
ayJu
nJu
lA
ugS
ep Oct
No
vD
ecJa
n F
ebM
arA
pr
May
Jun
Jul
Aug
Sep Oct
No
vD
ec
Jan
Feb
Mar
Ap
rM
ayJu
nJu
lA
ugS
ep Oct
No
vD
ecJa
n F
ebM
arA
pr
May
Jun
Jul
Aug
Sep Oct
No
vD
ec
2015
0
100
0
10
20
30
40
50
60
200
300
400
500
600
2016
20162015
100 99 98
97 96 95
cPRA

Donation & Transplantation Interprovincial Programs Report Donation & Transplantation Interprovincial Programs Report 25
HIGHLY SENSITIZED PATIENT PROGRAM
Figure 2.3: New HSP Candidates over Time by PHN/Home Province, with Population by Province
100%90%80%70%60%50%40%30%20%10%
0%Oct-Dec Jul-AugJan-Mar Apr-Jun Oct-Dec Oct-DecJul-AugJan-Mar Apr-Jun Oct-DecJul-AugJan-Mar Apr-Jun
2013 2014 2015 2016
BC 22 13 20 18 11 6 18 13 6 9 11
AB 41 27 4 2 3 4 5 7 2 4 3 4
SK 17 5 1 2 5 2 1 1 1
MB 30 4 6 3 2 4 3 1 3 4 4 1 1
ON 232 35 25 23 12 35 20 14 19 35 23
QC 120 17 11 11 13 12 5 8 11
ATL 65 4 6 3 8 4 1 1 3 1 1
Prov.Pop.
13%
12%
3%
4%
39%
23%
75
The composition of the HSP candidates on the national waiting list as of December 31st, 2016 is illustrated in Figure 2.4. The number of HSP patients listed by province is generally proportional to the provincial population size, with some variation between provinces.

Donation & Transplantation Interprovincial Programs Report Donation & Transplantation Interprovincial Programs Report 26
HIGHLY SENSITIZED PATIENT PROGRAM
Figure 2.4: HSP Candidate Participation by PHN/Home Province (pmp)
25
20
15
10
5
0
N =
PMP
BC AB SK MB ON QC NB NS PE NS
75 52 11 23 205 96 11 16 0 6
15.6 12.1 9.5 17.4 14.5 11.5 14.5 16.8 0 11.3
Les valeurs exprimées par million d’habitants (pmh) sont fondées sur les données populationnelles provinciales de 2016 de Statistique Canada. Voir le tableau 051-0005 : Estimations de la population, Canada, provinces et territoires, présenté en ligne à : http://www5.statcan.gc.ca/cansim/a26?lang=fra&id=510005&retrLang=fra.

Donation & Transplantation Interprovincial Programs Report Donation & Transplantation Interprovincial Programs Report 27
HIGHLY SENSITIZED PATIENT PROGRAM
Figure 2.5: New HSP Candidates over Time by cPRA
Figure 2.6: Active HSP Transplant Candidates over Time by cPRA
100%90%80%70%60%50%40%30%20%10%0%
Oct-Dec Jul-AugJan-Mar Apr-Jun Oct-Dec Oct-DecJul-AugJan-Mar Apr-Jun Oct-DecJul-AugJan-Mar Apr-Jun
100%90%80%70%60%50%40%30%20%10%0%
Oct-Dec Jul-AugJan-Mar Apr-Jun Oct-Dec Oct-DecJul-AugJan-Mar Apr-Jun Oct-DecJul-AugJan-Mar Apr-Jun
cPRA 2013 2014 2015 2016
100% 42 36 195 41 125 41 24 43 36 26 19 30 2299% 9 6 38 7 27 14 11 7 12 7 2 10 1198% 5 4 25 6 8 5 3 5 5 8 4 6 397% 3 0 12 3 8 4 2 4 2 1 8 4 496% 1 1 8 0 4 2 0 3 4 1 2 5 295% 2 0 12 1 5 5 2 2 5 4 3 1 7
cPRA 2013 2014 2015 2016
100% 59 89 250 280 371 375 368 414 419 415 419 419 41699% 17 19 50 49 56 66 65 63 62 59 50 53 4998% 7 11 32 31 28 25 19 18 18 17 17 16 1697% 5 6 13 12 10 12 8 7 3 4 4 5 996% 2 2 9 7 5 5 3 4 4 3 4 4 395% 2 2 9 4 6 9 5 5 4 5 4 2 5
Results based on cPRA as calculated at the end of FY 2016-2017; candidates whose cPRA was modified to be outside of the eligible range for the HSP program (approximately 1% of total) are not included.
Results based on cPRA as calculated at the end of FY 2016-2017; candidates whose cPRA was modified to be outside of the eligible range for the HSP program (approximately 1% of total) are not included.
La plupart des nouveaux candidats hyperimmunisés ont un PRAc > 98 %.

Donation & Transplantation Interprovincial Programs Report Donation & Transplantation Interprovincial Programs Report 28
Overall, 26% of eligible patients have been transplanted through the HSP program, with transplant rates among patients with cPRA scores of 95-97% being more than double this overall rate at 63%. Almost two-thirds (63%) of patients eligible for the program have a cPRA of 100%, but patients with this cPRA rating have received only 24% of HSP program transplants. For patients that are biologically difficult to match, a national program contributes towards, but cannot completely solve, the issue of
equitable access. Ongoing improvement in total deceased donor cases is critically important in order to improve access for this most difficult to match group.
800
cPRA 95%
11
3
5
35
8
3
3
22
13
2
9
37
15
6
13
57
29
24
49
70
115
110
416
67
cPRA 96% cPRA 97% cPRA 98% cPRA 99% cPRA 100%
600
400
200
0
HSP Tansplants
HSP Candidates On Hold
HSP Candidates Waiting (Active)
Off List
21
Figure 2.7: HSP Candidate Participation by cPRA
See Canadian Institute for Health Information (2017) "Treatment of End-Stage Organ Failure in Canada, Canadian Organ Replacement Register, 2006 to 2015” Available online at www.cihi.ca/en/corr-annual-statistics-2017
HIGHLY SENSITIZED PATIENT PROGRAM

Donation & Transplantation Interprovincial Programs Report Donation & Transplantation Interprovincial Programs Report 29
Figure 2.8: HSP Transplants and Candidates
Results based on cPRA as calculated at year-end 2016. Transplant recipients (1) and candidates (14) whose current cPRA is below 95% are not shown.Relative ratio = (transplant recipients in cPRA category / total candidates in cPRA category) /(total transplants / total recipients)
HIGHLY SENSITIZED PATIENT PROGRAM
The difficulty of finding a potential match for highly sensitized patients increases as their cPRA value increases. Even within the eligible group of cPRA of 95 or greater, the vast majority of patients remaining listed have a cPRA of 99 or 100%. At 99%, patients have only a 1 in 100 chance that any given ABO compatible donor in Canada would be an acceptable match for them. At 100%, their chances of finding a donor can range from 1 in 200 donors to less than 1 in 10,000. In Canada, in which there
have been fewer than 600 deceased donors available per year, national sharing to ensure potential opportunities to find donor organs for these patients are not missed is clearly essential to maximize transplant access.
8 See Canadian Institute for Health Information (2017) "Treatment of End-Stage Organ Failure in Canada, Canadian Organ Replacement Register, 2006 to 2015”, Available online at: www.cihi.ca/en/corr-annual-statistics-2017
700
600
500
400
300
200
100
0
6.0
5.0
4.0
3.0
2.0
1.0
0
19HSP Candidates
HSP Transplants
14 23 34 101 639
35 22 38 57 71 69
cPRA 95% cPRA 96% cPRA 97% cPRA 98% cPRA 99% cPRA 100%
5.2
Relative Ratio of Transplant Ratefor cPRA Group to Overall TransplantRate (35%)
4.5 4.7 4.8 2.0 0.3

Donation & Transplantation Interprovincial Programs Report Donation & Transplantation Interprovincial Programs Report 30
Figure 2.9: HSP Transplantation Activity over Time
HIGHLY SENSITIZED PATIENT PROGRAM
201816141210
86420
Total HSP Transplants: 293Intraprovincial: 126Interprovincial: 167
M A M J J A S O N D J F M A M J J A S O N D J F M A M J J A S O N D
2014 2015 2016
1 2 1 9 7 6 7 8 15 7 8 11 11 19 8 8 8 11 5 9 11 11 6 5 10 10 14 9 9 8 10 10 9 10
0 2 0 6 2 5 4 5 8 3 4 6 5 6 4 4 5 3 3 2 3 4 1 2 3 4 4 7 4 2 4 4 2 5
1 0 1 3 5 1 3 3 7 4 4 5 6 13 4 4 3 8 2 7 8 7 5 3 7 6 10 2 5 6 6 6 7 5
Total HSP TransplantsIntraprovincialInterprovincial
HSP Transplants: Number of transplants to highly sensitized kidney patients as a results of the HSP program (Non-Intended recipient transplants are excluded), by recipient’s PHN/Home province; Interprovincial: Number of interprovincial transplants to highly sensitized kidney patients as a result of the HSP program, by recipient’s PHN/Home province; Intraprovincial: Number of intraprovincial transplants to highly sensitized kidney patients as a result of the HSP program, by recipient’s PHN/Home province.
There were 126 intraprovincial transplants and 167 interprovincial transplants providing transplant opportunities for Highly Sensitized Patients that would not be realized without a national collaborative program.

Donation & Transplantation Interprovincial Programs Report Donation & Transplantation Interprovincial Programs Report 31
Figure 2.10: HSP Transplantation Activity by PHN/Home Province per Million Population (PMP)
Figure 2.11: Proportion of Total HSP Program Candidates in cPRA Group Transplanted, with Count
HIGHLY SENSITIZED PATIENT PROGRAM
PMP values based on Statistics Canada 2016 Q4 population estimates by province (CANSIM 051-005 Estimates of population, Canada, provinces and territories). Atlantic recipients are registered in a shared transplant program based in Nova Scotia.
Transplant counts do not include patients who were re-listed or whose cPRA changed to be outside HSP-eligible range following transplant
15
BC AB SK MB ON QC NB NS PE NL Total
6.7 5.8 4.3 11.3 9.7 6.7 6.6 13.7 13.4 5.7 8.0
2.3 1.6 0.9 2.3 5.9 2.4 N/A 1.1 N/A N/A 3.5
4.4 4.2 3.5 9.1 3.8 4.3 6.6 12.6 13.4 5.7 4.6
12
9
6
3
0
Total HSP Transplants
Intraprovincial
Interprovincial
21
cPRA 95%
65% 66% 63% 63% 42% 10%
35 22 37 57
70
67
0%
10%
20%
30%
40%
50%
60%
70%
80%
90%
100%
cPRA 96% cPRA 97% cPRA 98% cPRA 99% cPRA 100%
Pro
port
ion
of C
andi
date
s Tr
ansp
lant
ed (w
ith c
ount
)

Donation & Transplantation Interprovincial Programs Report Donation & Transplantation Interprovincial Programs Report 32
Figure 2.12 Proportion of Total HSP Program Candidates in Blood Group Transplanted, with Count
Figure 2.13: HSP Transplant Recipients’ Time on Dialysis (with Interquartile Range)
Time on Dialysis
HIGHLY SENSITIZED PATIENT PROGRAM
A
26%
127
AB
31%
21
B
23%
51
O
14%
94
0%
10%
20%
30%
40%
50%
Pro
port
ion
of C
andi
date
s Tr
ansp
lant
ed (w
ith c
ount
)
20
24
16
12
8
4
095 96 97 98 99 100 AllcPRA (%)
35 23 38 57 71 69 293Patients (n)
3.5 4.3 6.6 7.9 10.5 13.6 8.9Mean
1.7 2.9 4.7 5.6 9.0 11.2 6.3Median (with IQR)
Time is measured from most recent dialysis start date prior to transplant to recipient’s transplant date.

Donation & Transplantation Interprovincial Programs Report Donation & Transplantation Interprovincial Programs Report 33
Figure 2.14: Time on Dialysis for Active HSP Candidates as of Year-End 2016 (with Interquartile Range)
HIGHLY SENSITIZED PATIENT PROGRAM
12
8
4
095 96 97 98 99 100 AllcPRA (%)
5 3 9 13 49 416 495Patients (n)
1.5 4.6 4.0 4.5 6.7 7.4 7.1Mean
1.2 5.3 4.2 4.4 5.4 6.6 6.0Median (with IQR)
Time is measured from most recent dialysis start date prior to transplant to recipient’s transplant date.
3.3 HSP RECIPIENT OUTCOMESThe following is based on the sub-sample of available results for 275 patients who received HSP program transplants between March 2014 and March 2017. These patients account for 86% of the 320 HSP patients who received an HSP program transplant over that time period.
Post-Operative Dialysis
Post-operative dialysis for HSP program transplant recipients was required in 27% of known cases, with 17% requiring more than one post-operative dialysis session. Those who received transplants from DCD (Donation after Cardiac Death) donors required post-operative dialysis more frequently as compared those who received transplants from NDD (Neurologically Determined Death) donors, with 49% of DCD donation recipients requiring one post-operative dialysis session while only 22% of NDD donation recipients required one or more sessions.

Donation & Transplantation Interprovincial Programs Report Donation & Transplantation Interprovincial Programs Report 34
HIGHLY SENSITIZED PATIENT PROGRAM
Table 2.3: Summary of Patient Death and Graft Failure Cases
Figure 2.15: Kaplan-Meier Survival Curves for Patient Survival and Graft Survival Probability over Time (N = 275)
Count Mean Time to Graft Failure
Mean Time to Patient Death
Patients Experiencing Rejection Episodes
Patients Experiencing Graft Failure without Patient Death 11 181 days 4 (36%)
Patients Experiencing Patient Death without Graft Failure 7 266 days 1 (14%)
Patients Experiencing Graft Failure and Patient Death 5 113 days 254 days 2 (40%)
Total Patients Experiencing Graft Failure and/or Death 23 159 days 261 days 7 (30%)
Overall, 91.6% of HSP program transplant recipients (n = 252) for whom transplant results are available remained alive with functional grafts as of data collection. 16 HSP program transplant recipients (5.8%) are known to have experienced graft failure, of whom 5 (1.8%) are deceased, with an additional 7 (2.5%) who died without experiencing graft failure. Among these 23 recipients, 30% experienced one or more rejection episodes, with 32 (12%) of patients
overall experiencing rejection episodes. The most common type of rejection was cellular, with 66% experiencing cellular rejection episodes only, 28% experiencing antibody-mediated rejections only, and 6% experiencing both rejection types.
100%
95%
90%
85%
80%
0 100 200 300 400 500 600 700 800
Days from Transplant
Pro
babi
lity
of S
urvi
val (
%)
Patient Survival
Graft Survival

Donation & Transplantation Interprovincial Programs Report Donation & Transplantation Interprovincial Programs Report 35
HIGHLY SENSITIZED PATIENT PROGRAM
Figure 2.16: Patient and Graft Survival Rates for Recipients with One Year from Transplant to Data Collection by Donor Type (N = 173)
100%
98%
96%
94%
92%
90%
88%
86%
84%
82%
80%
Days from Transplant
NDD (147) DCD (26) ECD (31)
Pro
babi
lity
of S
urvi
val (
%) 100%
98%
96%
94%
92%
90%
88%
86%
84%
82%
80%
Days from Transplant
Gra
ft S
urvi
val (
%)
ECD includes donors 60+ years of age only (i.e. excludes donations from younger donors who are ECD due to medical complexities). NDD and DCD survival presented includes ECD donor cases. NDD: Neurologically Determined Death; DCD: Donation after Cardiac Death; ECD: Extended Criteria Donor
Donation & Transplantation Interprovincial Programs Report Donation & Transplantation Interprovincial Programs Report 36
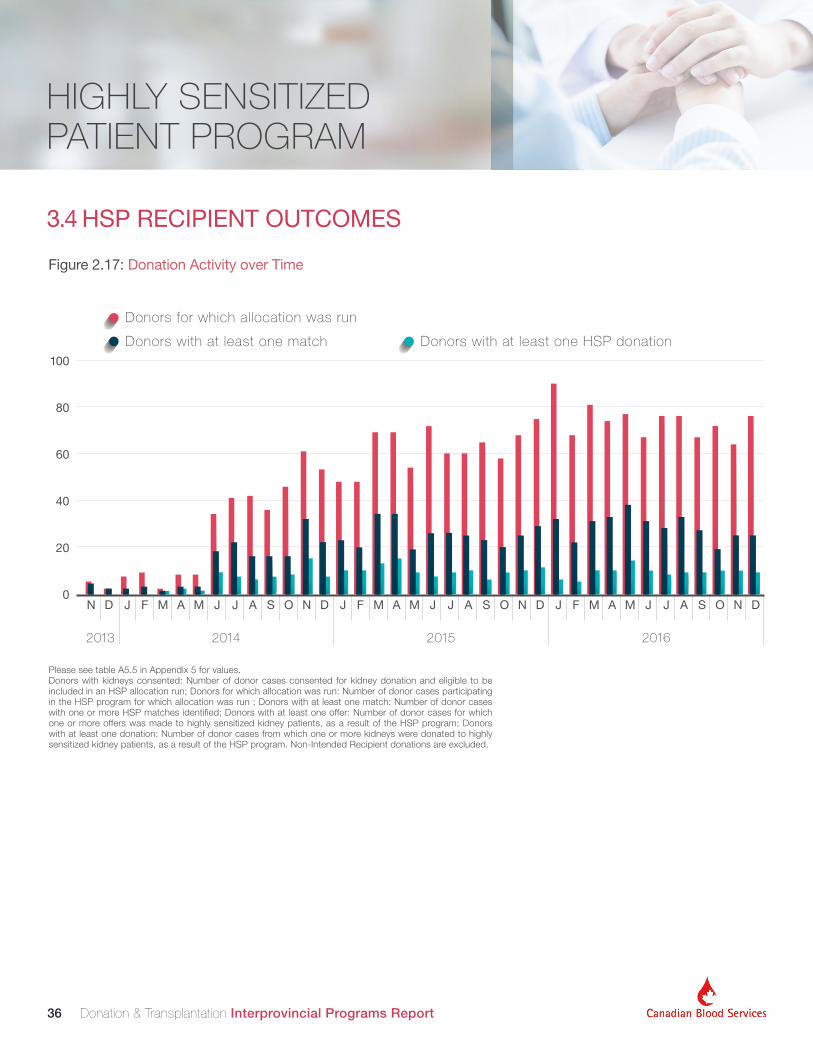
Figure 2.17: Donation Activity over Time
0
20
40
60
80
100
2013 2014 2015 2016
Donors with at least one HSP donation
Donors for which allocation was run
Donors with at least one match
HIGHLY SENSITIZED PATIENT PROGRAM
Please see table A5.5 in Appendix 5 for values. Donors with kidneys consented: Number of donor cases consented for kidney donation and eligible to be included in an HSP allocation run; Donors for which allocation was run: Number of donor cases participating in the HSP program for which allocation was run ; Donors with at least one match: Number of donor cases with one or more HSP matches identified; Donors with at least one offer: Number of donor cases for which one or more offers was made to highly sensitized kidney patients, as a result of the HSP program; Donors with at least one donation: Number of donor cases from which one or more kidneys were donated to highly sensitized kidney patients, as a result of the HSP program. Non-Intended Recipient donations are excluded.
3.4 HSP RECIPIENT OUTCOMES

Donation & Transplantation Interprovincial Programs Report Donation & Transplantation Interprovincial Programs Report 37
Figure 2.18: Donation Activity by PHN/Home Province per Million Population (PMP)
Table 2.4: HSP Transplants by Blood Group of Donor and Recipient
Table 2.5: HSP Transplants by Age of Donor and Recipient
HIGHLY SENSITIZED PATIENT PROGRAM
Donors with kidneys consented: Number of donor cases consented for kidney donation and eligible to be included in an HSP allocation run; Donors for which allocation was run: Number of donor cases participating in the HSP program for which allocation was run ; Donors with at least one match: Number of donor cases with one or more HSP matches identified; Donors with at least one offer: Number of donor cases for which one or more offers was made to highly sensitized kidney patients, as a result of the HSP program; Donors
with at least one donation: Number of donor cases from which one or more kidneys were donated to highly sensitized kidney patients, as a result of the HSP program. Non-Intended Recipient donations are excluded.
0
20
40
60
80
100
BC
51.1
21.4
6.4
Donors for which allocation was run
Donors with at least on match
Donors with at least one HSP donation
AB
39.0
19.5
4.9
SK
26.8
15.6
5.2
MB
37.8
22.7
10.6
ON
66.8
41.1
9.9
QC
51.5
20.0
7.3
NB
30.3
21.1
7.9
NS
73.5
31.5
10.5
PE NL
41.5
35.8
7.5
Total
54.4
28.7
8.0
9 PMP values based on Statistics Canada 2016 Q4 population estimates by province (CANSIM 051-005 Estimates of population, Canada, provinces and territories)
Recipient Blood Group
Don
or B
lood
Gro
up
A AB B O Total
A 70 8 -- -- 78
AB -- 0 -- -- 0
B -- 4 17 -- 21
O 57 9 34 94 194
Total 127 21 51 94 293
<19 19-29 30-39 40-49 50-59 60-69 70+ Total
<19 1 3 1 6 3 9 1 24
19-29 2 6 2 10 13 11 2 46
30-39 - 3 4 11 8 6 3 35
40-49 1 7 6 12 16 13 4 59
50-59 - 2 9 14 17 21 5 68
60-69 - 1 4 10 17 15 3 50
70+ - - - 2 4 5 - 11
Total 4 22 26 65 78 80 18 293
Recipient Age
Don
or A
ge

Donation & Transplantation Interprovincial Programs Report Donation & Transplantation Interprovincial Programs Report 38
3.5 HSP MATCHING AND ALLOCATION
HSP Allocation
There are 4 tiers of matching and ranking that the HSP algorithm performs to develop a final listing of potential HSP recipients who are compatible with an available deceased donor organ (refer to details in Appendix 4).
• Step One: Matching for compatible blood group, using the same compatibility rules as any patient requiring a blood transfusion.
• Step Two: Then HLA compatibility to avoid donor specific antibodies for patients identified as blood group compatible.
• Step Three: Further screening of donor suitability based on individual attributes of the potential recipient/donor or the clinical direction of potential receiving local programs.
• Step Four: At this point if more than one potential recipient is identified, the HSP algorithm uses agreed-upon policies to transparently prioritize recipients based on key medically and logistically relevant factors (see figure 2.23).
HIGHLY SENSITIZED PATIENT PROGRAM
Figure 2.19 illustrates how many allocations required the use of step 4. Figures 2.20 and 2.21 detail the frequency with which medically and logistically relevant factors were the deciding factor in a ranked allocation.
0
200
0 1 2 3 4 5
Number of Matches Found
6 7 8 9 10 11+
1171
420
14891 61 29 19 7 9 9 5 12
400
600
800
1000
1200
1400
Figure 2.19: HSP Matches Found per Donor for which Allocation was Run
Results for Donors entered into CTR on or before December 31, 2016 (N = 1,980)

Donation & Transplantation Interprovincial Programs Report Donation & Transplantation Interprovincial Programs Report 39
HIGHLY SENSITIZED PATIENT PROGRAM
Figure 2.20: Ranking Factor Used to Determine Allocation Decisions in HSP Program: Program Totals
Figure 2.21: Ranking Factor Used to Determine Allocation Decisions in HSP Program: Pre/Post Implementation of Policy Changes Prioritizing High cPRA candidates
Days on Dialysis
Same Region
0 4020 60 80 100 120 140
Same Province
Kidney-Pancreas Patient
ABDR Mismatch (0/6)
Paediatric Recipient
CPRA 99%
CPRA 100%
Medical Urgency
123
24
62
26
18
29
14
20
2
As of July 16, 2016, candidates with the highest cPRA ratings (99% and 100%) have been prioritized in cases in which multiple eligible candidates matched with a given donor (see Section 3.1 for details concerning this policy change). Of the donor cases entered after the implementation of this policy with multiple eligible
matches, 57% of allocation decisions in multiple-match cases were made on the basis of the candidates’ cPRA ratings.
As would be expected, since the cPRA-based prioritization criteria were implemented, patients with cPRA ratings of 99%-100% have been transplanted at a higher rate, with 64% of transplants in July to December of 2016 being to recipients with cPRA ratings of 99% or 100% compared with 44% of transplants prior to the new policy implementation.
Medical Urgency
cPRA 99%/100%
Paedoatroc Recipient
ABDR Mismatch (0/60)
Kindney-Pancreas Patient
Same Region/Province
Days on Dialysis
100%
90%
80%
70%
60%
50%
40%
30%
20%
10%
0%
Before cPRAPriortization
After cPRAPriortization

Donation & Transplantation Interprovincial Programs Report Donation & Transplantation Interprovincial Programs Report 40
HIGHLY SENSITIZED PATIENT PROGRAM
Figure 2.22: Transplant Recipients by cPRA Over Time by Quarter
100%
90%
80%
70%
50%
30%
60%
40%
20%
10%
0%
2015 2014 2016
Apr
-Jun
*
Jun-
Sep
Oct
-Dec
Jan-
Mar
Apr
-Jun
Jun-
Sep
Oct
-Dec
Jan-
Mar
Apr
-Jun
Jun-
Sep
Oct
-Dec
95
97
96
98
99
100
cPRA prioritization
as of July 16 2016
*Includes 1 transplant from March 2014
1
2
2
3
1
4
3
3
4
4
2
4
3
4
9
7
3
4
3
4
9
7
3
4
6
9
4
3
5
5
3
7
4
3
2
12
5
3
3
32
3
7
4
31
2
10
9
5
4
1
4
5
8
6
3
1
1 1
11
5
6
1
4
3
Results based on date of transplant and cPRA calculated at end 2016, with the exception of one case in which the recipient’s cPRA changed to be outside of the HSP-eligible range. Transplants to non-intended recipients are excluded.

Donation & Transplantation Interprovincial Programs Report Donation & Transplantation Interprovincial Programs Report 41
HIGHLY SENSITIZED PATIENT PROGRAM
Figure 2.23: Reasons offer was declined by transplant team
System Correction
Unknown
Preservation
DCD Time of Death
Ischemic Time
Logistics
Thresholds
HLA
Recipient Suitability
Donor Medical
10
26
2
11
18
47
72
65
174
204
Offer Declines
Donor offers may be declined for many different reasons. The most common reasons recorded for decline are donor’s or recipient’s health at the time of the offer. The information presented in this section relates to offers that were created up to and including December 31, 2016 that were declined, including those that were initially accepted and later had that acceptance cancelled.
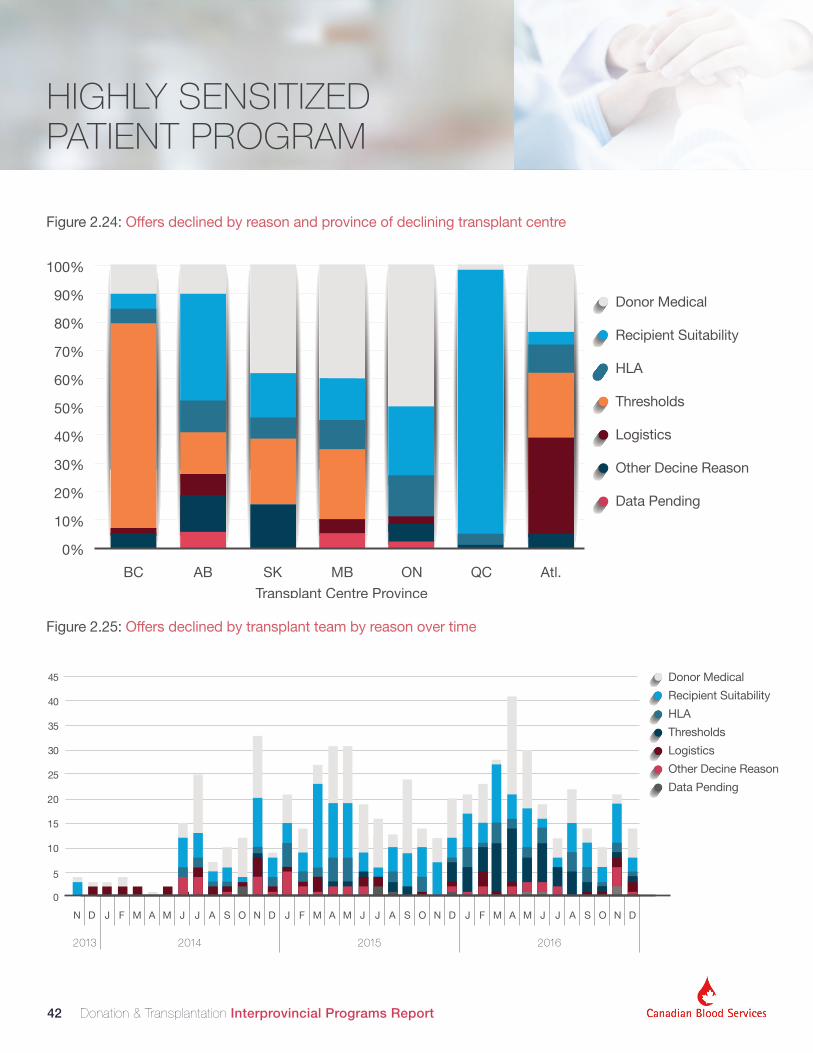
Donation & Transplantation Interprovincial Programs Report Donation & Transplantation Interprovincial Programs Report 42
HIGHLY SENSITIZED PATIENT PROGRAM
Figure 2.24: Offers declined by reason and province of declining transplant centre
Figure 2.25: Offers declined by transplant team by reason over time
100%
90%
80%
70%
60%
50%
40%
30%
20%
10%
0%
BC AB SK MBTransplant Centre Province
ON QC Atl.
Logistics
Data Pending
Donor Medical
Recipient Suitability
HLA
Thresholds
Other Decine Reason
Logistics
Data Pending
Donor Medical
Recipient Suitability
HLA
Thresholds
Other Decine Reason
0
5
10
15
20
25
30
35
40
45
2013 2014 2015 2016

Donation & Transplantation Interprovincial Programs Report Donation & Transplantation Interprovincial Programs Report 43
HIGHLY SENSITIZED PATIENT PROGRAM
Table 2.6: Candidates Declining for Donor Medical Issues
Final Kidney Disposition
Transplanted Locally
Not Transplanted
Not Recovered
Data Pending
Total
Donor quality (general)* 62 13 42 1 106
ABO identical donor preferred 1 1 2
Donor age 14 5 22 41
Donor size 9 9
Organ declined on visualization in OR
1 2 3
Organ not as described 7 2 9
Organ test results unavailable 2 1 3
Positive serology 2 2
Total Candidates Declining for Donor Medical Issues
86 20 66 1 138
Candidates may decline different donors for different donor medical reasons, and may decline multiple donors (regardless of final kidney disposition) for the same reason.
*Includes Abnormal test results, Donor medical history, Donor quality, High medical risk, Donor social history, Unstable donor, Organ test results unacceptable, and Organ anatomical damage or defect.
In 2015, KTAC began tracking the final disposition of the kidney offered to a highly sensitized patient but declined for donor medical reasons. 15% of cases were declined for donor medical reasons and nearly half (7%) of these resulted in a local kidney transplant.
10 Results reported here reflect decline reasons as entered by provincial organ donation organizations into the Canadian Transplant Registry. Although believed to be accurate, Canadian Blood Services does not systematically validate these results. Only one reason is entered for each declined offer, although more than one reason may contribute to an offer being declined.

Donation & Transplantation Interprovincial Programs Report Donation & Transplantation Interprovincial Programs Report 44
HIGHLY SENSITIZED PATIENT PROGRAM
Figure 2.26: Final Disposition of HSP Kidneys Offered
HLA Prior to Acceptance (Director Review)
Declined for Reasons other that Medical & HLA
Transplanted to Intended HSP Recipient
HLA After Acceptance (+XM)
Transplanted to Backup HSP Recipient
Donors with One or More HSP Offers by Outcome of Offer(s)
Donors Declined for Donor Medical Reasons
Not Transplanted
Declined for Donor Medical Reasons%
33%
44% 6%
7%
14%
5%
1%
2% 1%
Transplanted Locally
Not recovered Data Pending
Not Transplanted
1%
0%
N = 661 N = 95Figure 2.26 presents the final disposition of all donors with at least one kidney offer to a Highly Sensitized Patient
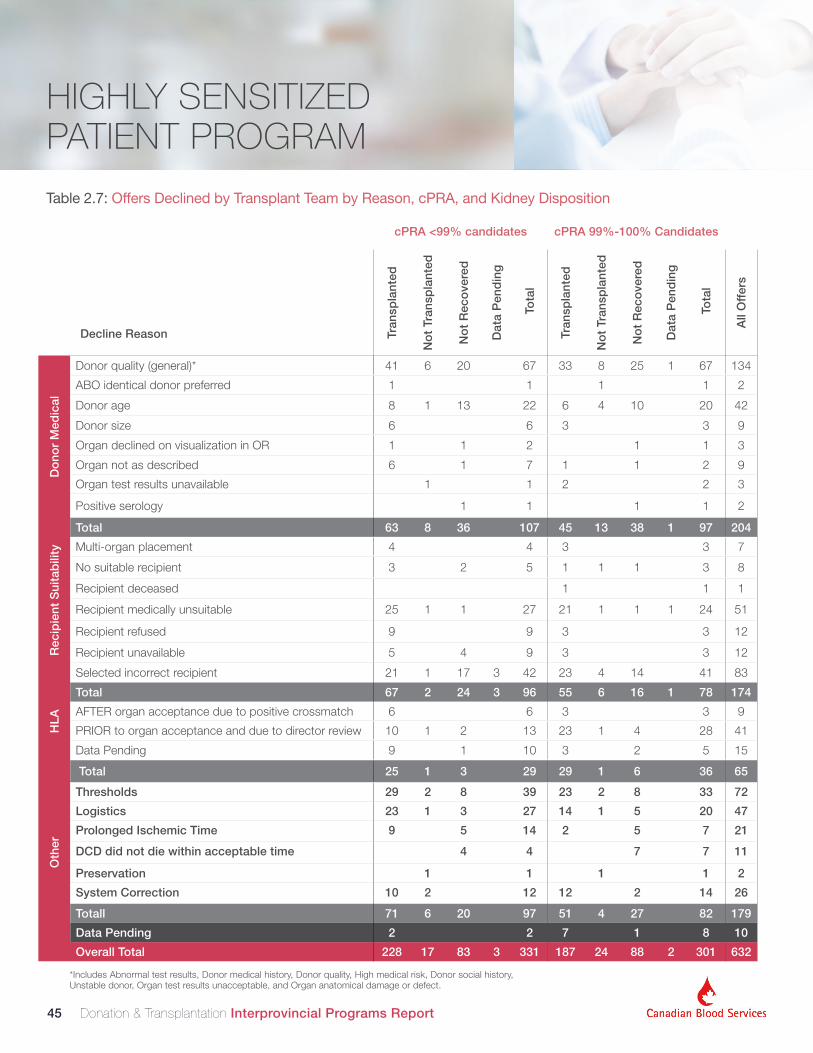
Donation & Transplantation Interprovincial Programs Report Donation & Transplantation Interprovincial Programs Report 45
HIGHLY SENSITIZED PATIENT PROGRAM
Table 2.7: Offers Declined by Transplant Team by Reason, cPRA, and Kidney Disposition
Organ DispositioncPRA <99% candidates cPRA 99%-100% Candidates
Decline Reason Tran
spla
nted
No
t Tr
ansp
lant
ed
No
t R
eco
vere
d
Dat
a P
end
ing
To
tal
Tran
spla
nted
No
t Tr
ansp
lant
ed
No
t R
eco
vere
d
Dat
a P
end
ing
To
tal
All
Off
ers
Do
nor
Med
ical
Donor quality (general)* 41 6 20 67 33 8 25 1 67 134
ABO identical donor preferred 1 1 1 1 2
Donor age 8 1 13 22 6 4 10 20 42
Donor size 6 6 3 3 9
Organ declined on visualization in OR 1 1 2 1 1 3
Organ not as described 6 1 7 1 1 2 9
Organ test results unavailable 1 1 2 2 3
Positive serology 1 1 1 1 2
Rec
ipie
nt S
uita
bili
ty
Total 63 8 36 107 45 13 38 1 97 204
Multi-organ placement 4 4 3 3 7
No suitable recipient 3 2 5 1 1 1 3 8
Recipient deceased 1 1 1
Recipient medically unsuitable 25 1 1 27 21 1 1 1 24 51
Recipient refused 9 9 3 3 12
Recipient unavailable 5 4 9 3 3 12
Selected incorrect recipient 21 1 17 3 42 23 4 14 41 83
HLA
Total 67 2 24 3 96 55 6 16 1 78 174
AFTER organ acceptance due to positive crossmatch 6 6 3 3 9
PRIOR to organ acceptance and due to director review 10 1 2 13 23 1 4 28 41
Data Pending 9 1 10 3 2 5 15
Total 25 1 3 29 29 1 6 36 65
Oth
er
Thresholds 29 2 8 39 23 2 8 33 72
Logistics 23 1 3 27 14 1 5 20 47
Prolonged Ischemic Time 9 5 14 2 5 7 21
DCD did not die within acceptable time 4 4 7 7 11
Preservation 1 1 1 1 2
System Correction 10 2 12 12 2 14 26
Totall 71 6 20 97 51 4 27 82 179
Data Pending 2 2 7 1 8 10
Overall Total 228 17 83 3 331 187 24 88 2 301 632
*Includes Abnormal test results, Donor medical history, Donor quality, High medical risk, Donor social history, Unstable donor, Organ test results unacceptable, and Organ anatomical damage or defect.

Donation & Transplantation Interprovincial Programs Report Donation & Transplantation Interprovincial Programs Report 46
HLA Declines and Unexpected Positive Crossmatch
A major achievement for the HSP program is the low number of unexpected positive actual crossmatches. HLA Laboratories review each kidney offer to a Highly Sensitized Patient in order to appropriately adjudicate antibodies that cannot be identified by the automated virtual crossmatch in the CTR. Currently there have only been 7 donor-recipient pairings (9 offers in total) in which there were unexpected positive actual crossmatches out of 661 donors.
HIGHLY SENSITIZED PATIENT PROGRAM
Figure 2.27: Reason Offer Declined for Known HLA Decline Cases
Allele specific
70%
5%
10%
5%
10%
Allele specific DSA and could not resolve typing to allele
VXM positive due to new antibody
Other
Indeterminate
0
5
10
15
20
25
30
35
40
45
PRIOR to organ acceptance dueto director review
Reason HSP offer declined by HLA lab director prior to organ acceptance
41 7
AFTER to organ acceptance dueto positive crossmatch*
*In two cases (Q1 and Q3 of 2016), there were multiple HLA declined offers between the same recipient-donor matches; as such the total number of unique offers declined after organ acceptance due to HLA is 7.

Donation & Transplantation Interprovincial Programs Report Donation & Transplantation Interprovincial Programs Report 47
HIGHLY SENSITIZED PATIENT PROGRAM
Table 2.8: Reason Offer Declined Over Time for Known HLA Decline Cases
*In two cases (Q1 and Q3 of 2016), there were multiple HLA declined offers between the same recipient-donor matches; as such the total number of unique offers declined after organ acceptance due to HLA is 7. Results are based on date of offer.
2014 2015 2016
Ap
r-Ju
n
Jul-
Sep
Oct
-Dec
Jan-
Mar
Ap
r-Ju
n
Jul-
Sep
Oct
-Dec
Jan-
Mar
Ap
r-Ju
n
Jul-
Sep
Oct
-Dec
Tota
l
AFTER organ acceptance due to positive crossmatch*
1 2 1 3 2 9
PRIOR to organ
acceptance due to
director review
Allele specific 1 2 8 10 1 1 2 1 2 1 29
Allele specific DSA and could not resolve typing to allele
1 1 2
Indeterminate 1 2 1 4
VXM positive due to new antibody
1 1 2
Other 1 1 1 1 4
Total 1 4 3 9 10 2 3 2 3 2 2 41

Donation & Transplantation Interprovincial Programs Report Donation & Transplantation Interprovincial Programs Report 48
HSP Thresholds and General Ledger
Provincial import/export thresholds, which are based upon 5% of the provincial deceased donation activity in 2010, are used to ensure protection of provincial local transplant activity. When at export threshold, a province is not required to offer a kidney to an HSP recipient in another province (but may choose to). Similarly, when at import threshold, they could not receive offers from out of province through the HSP program. Table 2.9 shows the threshold levels and the import/export
Although the thresholds were purposed at protecting provinces from importing or exporting organs above a certain value, they do not prevent making or receiving offers through the CTR. Several provinces have exceeded their import/export thresholds, often based on discussion between offering/receiving programs in the context of patient need. Programs may offer organs when a rare opportunity exists for certain very difficult to match patients. KTAC reviewed data and models on import and export thresholds during their 2015 annual meeting. KTAC recommended the
activity for each province or region (Atlantic Canada operates as a single importing region, as they share a single waitlist managed by the transplant program in Halifax).
removal of import thresholds and revisions to export thresholds based on data models and analysis provided by Canadian Blood Services. The implementation of KTAC’s recommendation took place in December 2016, following committee endorsements and provincial policy sign-off.
HIGHLY SENSITIZED PATIENT PROGRAM
Table 2.9: General Ledger by Province as of December 31, 2016
Figure 2.28: Net Balance Over Time by Province, (March 1, 2014 – December 31, 2016)
BC AB SK MB ON QC ATL
Export Threshold -3 -2 -1 -1 -12 -7 -2
Net Balance 3 0 -1 -1 -4 -5 1
Imports 24 20 4 12 57 39 18
Exports 21 20 5 13 61 44 17
In Province 11 8 1 3 85 20 5
The graphs in Figure 2.28 further illustrate this activity from March of 2014 to December of 2016.
Positive values indicate a greater number of import credits than export credits
Dotted lines show provincial threshold limits
-62014
BC
2015 2016
-2
0
2
4
-4
6
-62014
AB
2015 2016
-2
0
2
4
-4
6
-62014
SK
2015 2016
-2
0
2
4
-4
6
-62014
MB
2015 2016
-2
0
2
4
-4
6
2014
Atlantic
2015 2016
-2
0
2
4
-4
6
-6
2014
ON
2015 2016
-20
-4
-10-8
-12
8
1210
46
2
-6
2014
QC
2015 2016
-20
-4
-10-8
-12
8
1210
46
2

Donation & Transplantation Interprovincial Programs Report Donation & Transplantation Interprovincial Programs Report 49
NATIONAL ORGAN WAITLIST (NOW)
The National Organ Waitlist (NOW) is a real-time, on-line national waitlist for heart, lung, liver, pancreas, small bowel and multi-organ transplants. It replaced the paper-based London Health Sciences waitlist issued weekly. As of December 31, 2016, a total of 6749 heart, lung, and liver transplant patients have been listed on the NOW since its initiation in June of 2012, 703 of whom were active on that date.
The detailed results for heart, lung, and liver candidates are provided below based on Canadian Transplant Registry (CTR) records. These data are
provided by transplant coordinators, transplant program data clerks or provincial ODO programs using data feeds. All results are as of December 31, 2016. Definitions of the various candidate statuses are provided in Appendix 6. Transplant results are based on a patient’s status being changed to off list due to transplant.
4.0 NATIONAL ORGAN WAITLIST (NOW)
4.1 HEART
Figure 3.1: Active Heart Candidate Participation by Status
Status 3
Status 1
Status 4S
Status 4
Status 3.5
37%
32%13%
10%
Status 24%
4% 16%High status (4+4S) heart
candidates waiting
11 This includes 1,301 Heart patients, 3,705 Liver patients, and 1,804 Lung patients, with some patients waiting for multiple organs.

Donation & Transplantation Interprovincial Programs Report Donation & Transplantation Interprovincial Programs Report 50
NATIONAL ORGAN WAITLIST (NOW)
Figure 3.2: Active Heart Candidates by PHN/Home Province and Status
Figure 3.3: Active Heart Candidates Listed by Status Over Time
Status 2
Status 1
Status 4
Status 3
Status 3.5
Status 4S
0%
10%
20%
30%
40%
50%
60%
BC AB SK MB ON QC NB NS NL
0
20
40
60
80
100
120
140
160
180
2012 2013 2014 2015 2016
Status 2Status 1 Status 4Status 3 Status 3.5 Status 4S

Donation & Transplantation Interprovincial Programs Report Donation & Transplantation Interprovincial Programs Report 51
NATIONAL ORGAN WAITLIST (NOW)
Figure 3.4: Total Heart Transplants by Transplant Centre and Status, 2012-2016
Figure 3.5: Total Heart Candidates Off-listed from Canadian Transplant Registry by Reason, 2012-2016
One status 1 transplant recipient registered at St. Joseph’s Hospital (ON) not shown. Ottawa Heart Institute counts nclude one status 4 patient and one status 1 patient registered at the Ottawa General Hospital (ON).
Include one status 4 patient and one status 1 patient registered at the Ottawa General Hospital (ON).
*”Other”: Duplicate (3), Created in Error (1), and Other (11)
200
Institu
te
180160140120100806040200
BC AB QC NSON
Status 2Status 1 Status 4Status 3 Status 3.5 Status 4S
100
200
300
400
500
600
700
800
834
11758
26 3 35 10 5 1 15
900
Transplanted Deceased Cancelled UnsuitableMedical
UnsuitablePsychosocial
Improved Too Sick PatientChoice
WithdrewConsent
Other*

Donation & Transplantation Interprovincial Programs Report Donation & Transplantation Interprovincial Programs Report 52
4.2 LUNG
NATIONAL ORGAN WAITLIST (NOW)
Figure 3.6: Active Lung Candidate Participation by Status
Figure 3.7: Active Lung Candidates by PHN/Home Province and Status
Note: there were no active Status 1T lung candidates as of year-end 2016
66%
34%
Status 2
Status 1
Status 2Status 1
80
70
60
50
40
30
20
10
0BC AB SK MB ON QC NS

Donation & Transplantation Interprovincial Programs Report Donation & Transplantation Interprovincial Programs Report 53
NATIONAL ORGAN WAITLIST (NOW)
Figure 3.8: Active Lung Candidates Listed by Status Over Time
Figure 3.9: Total Lung Transplants by Transplant Centre and Status, 2012-2016
0
50
100
150
200
250
300
2012 2013 2014 2015 2016
Status 2Status 1
Status 2Status 1
600
500
400
300
200
100
VancouverGeneral Hospital
BC
University ofAlberta Hospital
AB
Health ScienceCentre
MB
Hospital for SickChildren
ON
Toronto GeneralHospital
ON
TransplantQuebec
QC
0
Not shown: One status 2 transplant recipient registered at St. Joseph’s Hospital (ON), three status 2 transplant recipients registered at University Hospital Lewisham (ON), and one status 1 transplant recipient registered at the Ottawa General Hospital (ON).

Donation & Transplantation Interprovincial Programs Report Donation & Transplantation Interprovincial Programs Report 54
NATIONAL ORGAN WAITLIST (NOW)
Figure 3.10: Total Lung Candidates Off-listed from Canadian Transplant Registry by Reason, 2012-2016
1133
292
19 18 0 18 15 12 1 17
1200
1000
800
600
400
200
0Transplanted Deceased Cancelled Unsuitable
MedicalUnsuitable
PsychosocialImproved Too Sick Patient
ChoiceWithdrewConsent
Other*
*”Other”: Duplicate (2) and Other (15)

Donation & Transplantation Interprovincial Programs Report Donation & Transplantation Interprovincial Programs Report 55
4.3 LIVERFigure 3.11: Active Liver Candidates by PHN/Home Province
Figure 3.12: Active Liver Candidates by Status Over Time
Note: There were no active Status 3F, 4, or 4F patients as of year-end 2016.
0
BC AB SK MB ON QC NB NS PE NL
20
40
60
80
100
120
140
160
180
NATIONAL ORGAN WAITLIST (NOW)
0
250
200
150
100
50
300
350
200
450
500
2012 2013 2014 2015 2016
3F/4FOther

Donation & Transplantation Interprovincial Programs Report Donation & Transplantation Interprovincial Programs Report 56
Figure 3.13: Total Liver Transplants by Transplant Centre, 2012-2016
Figure 3.14: Total Liver Candidates Off-listed from Canadian Transplant Registry by Reason, 2012-2016
NATIONAL ORGAN WAITLIST (NOW)
VancouverGeneralHospital
0
100
200
300
400
500
600
700
800
BC AB ON NS
University of Alberta Hospital
Hospital for Sick Children
UniversityHospital
Lewisham
Toronto General Hospital
TransplantQuebec
Queen Elizabeth II
3FOther 4F
Status is based on recipient’s most recent status recorded in the Canadian Transplant Registry (CTR). Not shown: Seven non-urgent transplant recipients from the Ottawa General hospital (ON) and an additional three transplant recipients [one from a Quebec transplant centre and the remaining two from Toronto General Hospital (ON)] whose statuses prior to transplant could not be determined from CTR records.
*”Other”: Duplicate (11), Created in Error (2), and Other (41)
0
500
1000
1500
2000
2266
428
232128 31 63 30 13 54
2500
Transplanted Deceased Cancelled UnsuitableMedical
UnsuitablePsychosocial
Improved Too Sick PatientChoice
WithdrewConsent
Other*

Donation & Transplantation Interprovincial Programs Report Donation & Transplantation Interprovincial Programs Report 57
Figure 3.15: Active Pancreas Candidates by PHN/Home Province
Figure 3.16: Active Pancreas Candidates Over Time
NATIONAL ORGAN WAITLIST (NOW)
Alberta Saskatchewan Ontario Quebec
60
50
40
30
50
10
0
4.4 PANCREAS
0
60
40
20
80
100
120
140
2012 2013 2014 2015 2016
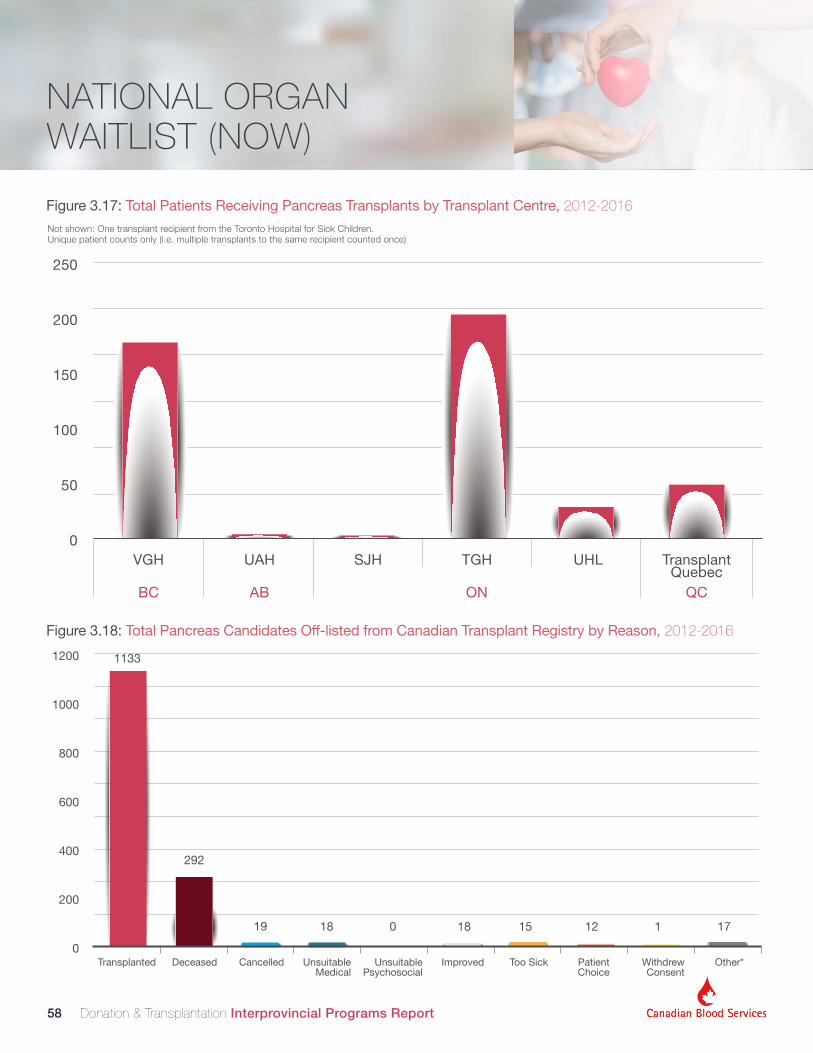
Donation & Transplantation Interprovincial Programs Report Donation & Transplantation Interprovincial Programs Report 58
NATIONAL ORGAN WAITLIST (NOW)
Figure 3.17: Total Patients Receiving Pancreas Transplants by Transplant Centre, 2012-2016
Figure 3.18: Total Pancreas Candidates Off-listed from Canadian Transplant Registry by Reason, 2012-2016
UAH
AB QCON
SJH TGH UHL TransplantQuebec
250
200
150
100
50
0
BC
VGH
1133
292
19 18 0 18 15 12 1 17
1200
1000
800
600
400
200
0Transplanted Deceased Cancelled Unsuitable
MedicalUnsuitable
PsychosocialImproved Too Sick Patient
ChoiceWithdrewConsent
Other*
Not shown: One transplant recipient from the Toronto Hospital for Sick Children. Unique patient counts only (i.e. multiple transplants to the same recipient counted once)
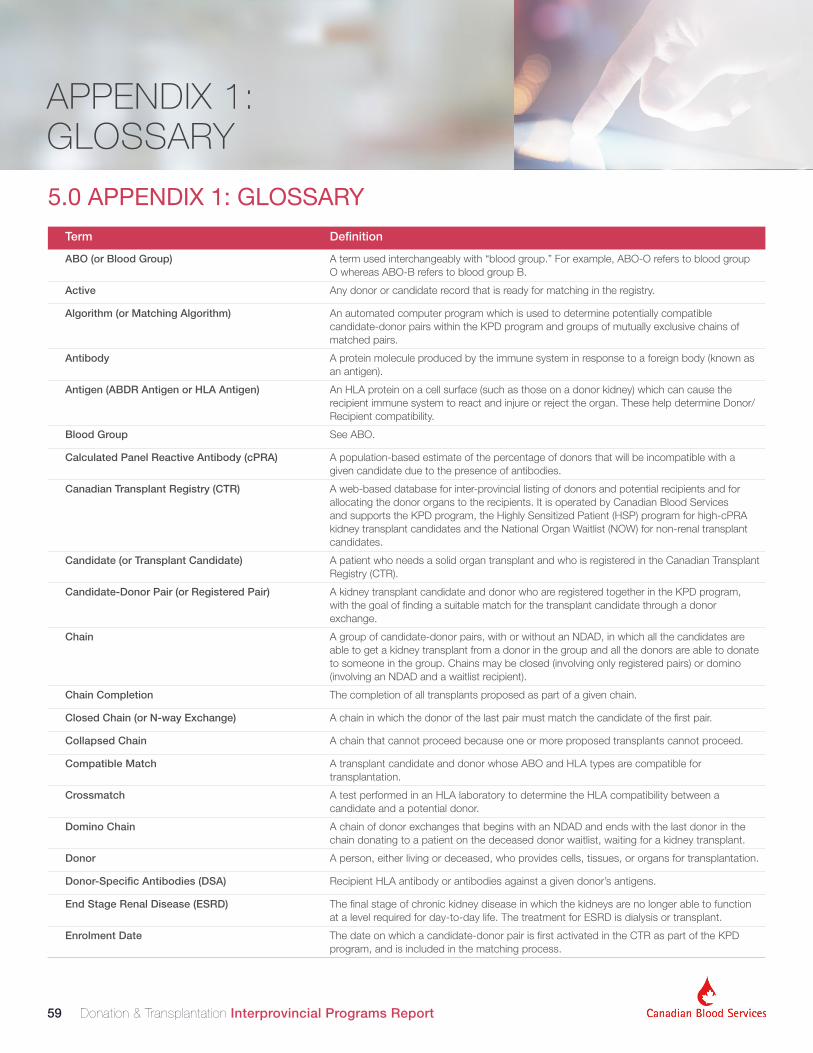
Donation & Transplantation Interprovincial Programs Report Donation & Transplantation Interprovincial Programs Report 59
APPENDIX 1: GLOSSARY
Term Definition
ABO (or Blood Group) A term used interchangeably with “blood group.” For example, ABO-O refers to blood group O whereas ABO-B refers to blood group B.
Active Any donor or candidate record that is ready for matching in the registry.
Algorithm (or Matching Algorithm) An automated computer program which is used to determine potentially compatible candidate-donor pairs within the KPD program and groups of mutually exclusive chains of matched pairs.
Antibody A protein molecule produced by the immune system in response to a foreign body (known as an antigen).
Antigen (ABDR Antigen or HLA Antigen) An HLA protein on a cell surface (such as those on a donor kidney) which can cause the recipient immune system to react and injure or reject the organ. These help determine Donor/Recipient compatibility.
Blood Group See ABO.
Calculated Panel Reactive Antibody (cPRA) A population-based estimate of the percentage of donors that will be incompatible with a given candidate due to the presence of antibodies.
Canadian Transplant Registry (CTR) A web-based database for inter-provincial listing of donors and potential recipients and for allocating the donor organs to the recipients. It is operated by Canadian Blood Services and supports the KPD program, the Highly Sensitized Patient (HSP) program for high-cPRA kidney transplant candidates and the National Organ Waitlist (NOW) for non-renal transplant candidates.
Candidate (or Transplant Candidate) A patient who needs a solid organ transplant and who is registered in the Canadian Transplant Registry (CTR).
Candidate-Donor Pair (or Registered Pair) A kidney transplant candidate and donor who are registered together in the KPD program, with the goal of finding a suitable match for the transplant candidate through a donor exchange.
Chain A group of candidate-donor pairs, with or without an NDAD, in which all the candidates are able to get a kidney transplant from a donor in the group and all the donors are able to donate to someone in the group. Chains may be closed (involving only registered pairs) or domino (involving an NDAD and a waitlist recipient).
Chain Completion The completion of all transplants proposed as part of a given chain.
Closed Chain (or N-way Exchange) A chain in which the donor of the last pair must match the candidate of the first pair.
Collapsed Chain A chain that cannot proceed because one or more proposed transplants cannot proceed.
Compatible Match A transplant candidate and donor whose ABO and HLA types are compatible for transplantation.
Crossmatch A test performed in an HLA laboratory to determine the HLA compatibility between a candidate and a potential donor.
Domino Chain A chain of donor exchanges that begins with an NDAD and ends with the last donor in the chain donating to a patient on the deceased donor waitlist, waiting for a kidney transplant.
Donor A person, either living or deceased, who provides cells, tissues, or organs for transplantation.
Donor-Specific Antibodies (DSA) Recipient HLA antibody or antibodies against a given donor’s antigens.
End Stage Renal Disease (ESRD) The final stage of chronic kidney disease in which the kidneys are no longer able to function at a level required for day-to-day life. The treatment for ESRD is dialysis or transplant.
Enrolment Date The date on which a candidate-donor pair is first activated in the CTR as part of the KPD program, and is included in the matching process.
5.0 APPENDIX 1: GLOSSARY

Donation & Transplantation Interprovincial Programs Report Donation & Transplantation Interprovincial Programs Report 60
Graft A transplanted organ, tissue, or cells. In the case of KPD and HSP, a transplanted kidney.
Interquartile Range (IQR) A statistical measure of dispersion (variability) based on dividing a data set into quartiles.
Incompatible Pair A transplant candidate and a donor whose blood types and/or HLA tissue types are not compatible for transplant. A kidney transplant from the donor would be rejected by the candidate’s antibodies.
Human Leucocyte Antigen (HLA) The antigens on the donor’s cell surface that may cause the recipient’s immune system to react and reject a transplanted organ. See also antigen, above. HLA antigens are named in groups, or loci, and identified as: A, B, Cw, DR, DRw, DQA, DQ, DPA, and DP.
HLA Crossmatch A test performed in an HLA laboratory to determine the HLA compatibility between a candidate and a potential donor.
Kidney Paired Donation (KPD) Program A program operated and managed by Canadian Blood Services in collaboration with the provincial Living Kidney Donation and Transplantation programs. The KPD program matches candidate-donor pairs and NDADs into chains of donor exchanges and works with their Living Kidney Donation and Transplant programs to facilitate the completion of all the donations and transplants in the chain.
KTAC Kidney Transplant Advisory Committee
Matching Algorithm See Algorithm.
Match Cycle (MC) A period of time beginning on the date the matching algorithm is run to identify a group of mutually exclusive chains from a set group of donor-candidate pairs and NDADs, and ending on the date the last transplant in the last chain is completed. Match Cycles can overlap one another in time.
Match Run The running of the KPD matching algorithm to identify chains of proposed exchanges. Each Match Cycle will have a main run and may have additional runs (re-runs) using the same group of pairs and NDADs, if required.
N-way Exchange See Closed Chain.
Non-Directed Anonymous Donor (NDAD) A donor who wishes to donate a kidney to anyone in need and is registered in the KPD program without a paired registered candidate. NDADs allow for domino chains to be proposed.
Paired Exchange (PE) A KPD donor exchange between two registered pairs wherein each recipient receives a kidney from the donor in the other pair. This is equivalent to a 2-way exchange or a closed chain involving only two pairs.
Proposed Pair/Match A potentially compatible donor and candidate who are matched for transplant by the matching algorithm.
Rejection An immunological response to the transplanted organ in which the recipient’s immune system (antibodies) attempts to destroy the graft, resulting in decreased function. A rejection episode does not necessarily result in graft loss.
Registered Pair See Candidate-Donor Pair.
Repaired Chain When a matched donor-candidate pair in a chain can no longer proceed to transplant, the KPD Program attempts to repair the chain to allow the rest of the matches to continue to transplantation. Repairs are generally done by substituting in one or more pairs for the pair that cannot proceed or by shortening the domino chain to allow at least some of the transplants to proceed.
Terminal Donor The last donor in a domino chain whose kidney is transplanted to a recipient from a provincial or local waitlist. The terminal donor surgery is not necessarily the last surgery to occur, as chains may not be done in chronological order.
APPENDIX 1: GLOSSARY continuedTerm Definition
APPENDIX 1: GLOSSARY

Donation & Transplantation Interprovincial Programs Report Donation & Transplantation Interprovincial Programs Report 61
APPENDIX 1: GLOSSARY continued
APPENDIX 1: GLOSSARY
Term Definition
Virtual Crossmatch (VXM) A comparison between candidate antibodies and donor antigens. A positive VXM means that the candidate has antibody(ies) to the donor’s antigen(s) and could result in injury or rejection of the transplanted organ. A negative VXM means that the candidate’s antigens match the donor’s antigens with a corresponding lower risk of organ injury and rejection.
Waitlist A list of patients who are qualified and registered by a transplant program and who are waiting to receive an organ transplant.

Donation & Transplantation Interprovincial Programs Report Donation & Transplantation Interprovincial Programs Report 62
6.0 APPENDIX 2: MATCHING ALGORITHM FOR KPD
APPENDIX 2: MATCHING ALGORITHM FOR KPD
Table A2.1: Matching Points
Match points are assigned to matches between donor and candidate records with the following characteristics:
Attribute Points
Compatible Donor-Candidate match (using ABO, HLA, filters) 100
Highly Sensitized (cPRA > 95%) 125
ABO Match: O to O 75
Pediatric Candidate (≤19 years of age) 75
Candidate is a Prior Living Donor 75
ABDR 0/6 Mismatch 75
Dialysis Wait Time (starting at initiation of dialysis) Days/30
Geography: Same City 25
Donor/Candidate Age difference of ≤30 years 5
ABO Match: A to A, B to B, AB to AB 5
EBV Negative to Negative Match 5
Guiding Principles for Kidney Paired Donation Program
1. Maximize Transplants – primary goal should be to find the greatest number of high quality matches between living donors and candidates.
2. Maximize Logistics – to the extent possible, the need for donors or recipients to travel should be minimized.
3. Equity for High Need Patient Groups – any candidates who are disadvantaged due to medical or demographic factors should receive additional priority (e.g., highly sensitized, blood group O, pediatrics, lengthy time on dialysis, etc.).
4. Priority for Higher Quality Matches – transplants that are zero mismatch HLA-A, B, DR or other clinical criteria considered to be “more ideal” should receive special priority.
5. Evidence-Based Decision Making – all principles adopted and algorithm decisions made should be based on the most current and best quality peer–reviewed evidence available.

Donation & Transplantation Interprovincial Programs Report Donation & Transplantation Interprovincial Programs Report 63
7.1 KPD PROGRAM SUMMARY
7.0 APPENDIX 3: ADDITIONAL DATA FOR KPD PROGRAM
Registered Candidates only
Tran
spla
nts
fro
m M
Cs
in Y
ear
Tran
spla
nts
by
Sur
ger
y D
ate
Year
Mo
nth
(MC
)
Reg
iste
red
Pai
rs
in M
C
ND
AD
s in
MC
New
Pai
rs in
MC
Tran
spla
nts
in M
C
Pro
po
sed
Cha
ins
Co
mp
lete
d C
hain
s
Co
mp
lete
d C
hain
s%
of
Cha
ins
Co
mp
lete
d *
Pro
po
sed
Mat
ches
Tr
ansp
lant
ed
Uni
que
Pro
po
sed
M
atch
es
% o
f P
rop
ose
d
Mat
ches
Tr
ansp
lant
ed
2009
Jan (1) 21 0 21 0 N/A N/A N/A N/A
26 73% 25 17Feb (2) 25 2 5 4 2 1 50% 3
May (3) 33 2 14 13 4 4 100% 11
Oct (4) 36 4 19 8 4 3 75% 5
2010
Feb (5) 45 4 19 14 5 5 100% 10
67 55% 47 48May (6) 63 2 29 6 5 2 40% 5
Aug (7) 83 5 34 24 13 9 69% 19
Nov (8) 100 0 45 3 2 1 50% 3
2011
Mar (9) 118 2 33 23 8 6 75% 21
82 60% 58 44Jun (10) 110 3 27 14 9 4 44% 12
Oct (11) 125 7 34 21 8 5 63% 16
2012
Feb (12) 129 2 36 11 7 4 57% 10
75 64% 61 50Jun (13) 141 3 44 17 6 5 83% 15
Oct (14) 145 11 31 33 16 11 69% 23
2013
Feb (15) 155 9 50 16 10 4 40% 12
109 60% 80 85May (16) 143 4 23 33 12 9 75% 29
Oct (17) 154 8 55 31 17 10 59% 24
2014
Feb (18) 147 8 42 22 11 7 64% 17
121 45% 66 77Jun (19) 170 4 54 28 15 8 53% 24
Oct (20) 179 6 51 16 18 5 28% 13
2015
Feb (21) 181 4 49 29 11 7 64% 27
131 55% 88 70Jun (22) 189 8 57 35 20 13 65% 27
Oct (23) 173 12 40 24 12 9 75% 19
2016
Feb (24) 158 7 28 26 10 8 80% 22
123 59% 80 83Jun (25) 150 2 44 21 8 4 50% 19
Oct (26) 157 3 45 33 11 10 91% 31
Total 848 108 929 505 244 154 63% 417 721 59% 505 474
*Chains in which one or more proposed transplants was completed.
Table A3.1: KPD Program Activity Over Time, 2009 - 2016

Donation & Transplantation Interprovincial Programs Report Donation & Transplantation Interprovincial Programs Report 64
Table A3.2: KPD Program Activity by Province and Year (Registered Recipients Only)
Province of Candidate/Recipient (by Personal Health Number)
BC AB SK MB ON QC NB NS PE NL Can.
Res
ults
to
End
of
2016
Transplants 133 45 10 18 154 35 6 8 1 7 417
Transplants PMP 44.9 23.1 19.0 32.4 22.8 11.0 19.8 24.2 13.4 24.5 23.2
Candidates 216 100 22 43 322 92 15 23 2 13 848
Candidates PMP 45.3 23.4 19.2 32.8 23.1 11.1 19.8 24.3 13.5 24.5 23.5
% Transplanted 62% 45% 45% 42% 48% 38% 40% 35% 50% 54% 49%
Act
ive
Can
did
ates
PM
P
2016 11.6 5.3 3.5 9.8 6.7 4.5 5.3 6.3 0 5.7 6.6
2015 10.1 7.5 7.9 13.8 7.5 4.2 6.6 6.3 6.8 9.4 7.3
2014 11.0 7.4 10.6 9.3 6.2 3.8 9.3 7.4 6.8 11.3 6.9
2013 12.3 8.3 8.1 11.0 4.4 3.8 7.9 9.5 6.9 9.5 6.4
2012 11.5 5.8 6.4 10.3 3.7 4.3 6.6 4.2 0 13.3 5.6
Tran
spla
nts
PM
P
2016 4.2 1.6 0 1.5 2.3 1.0 1.3 1.1 0 0 2.0
2015 2.9 2.3 1.8 3.8 2.4 0.7 1.3 1.1 0 1.9 2.0
2014 4.0 1.0 0.9 0.8 1.7 0.6 1.3 0 0 0 1.5
2013 4.9 3.4 0.9 0.8 1.4 0.4 1.3 2.1 0 1.9 1.8
2012 4.1 1.3 0.9 4.0 0.8 0.6 1.3 0 0 1.9 1.4
These data represent registered recipients only and do not include waitlist recipients. Candidate totals represent the “per million population” (PMP) counts of registered candidates active in each year (i.e., an active candidate in 2012 that was still active in 2013 would be counted in both years). Transplant totals are based on year of the Match Cycle in which the match was proposed. Provincial populations used to derive PMP values based on year-end estimates from Statistics Canada Table 051-0005: Estimates of population, available online at http://www5.statcan.gc.ca/cansim/a26?lang=en&id=510005. Yukon, Northwest Territories, and Nunavut populations are included in British Columbia, Alberta, and Ontario, respectively.
7.0 APPENDIX 3: ADDITIONAL DATA FOR KPD PROGRAM
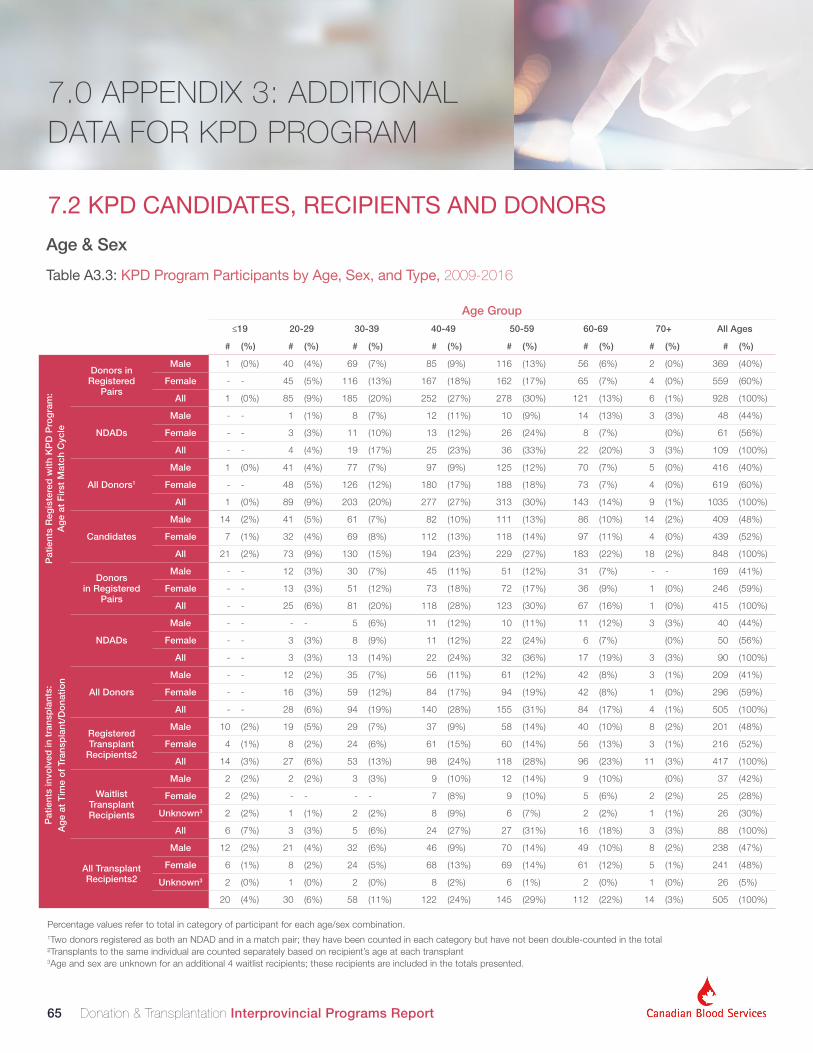
Donation & Transplantation Interprovincial Programs Report Donation & Transplantation Interprovincial Programs Report 65
Age Group≤19 20-29 30-39 40-49 50-59 60-69 70+ All Ages
# (%) # (%) # (%) # (%) # (%) # (%) # (%) # (%)
Pat
ient
s R
egis
tere
d w
ith K
PD
Pro
gra
m:
A
ge
at F
irst
Mat
ch C
ycle
Donors in Registered
Pairs
Male 1 (0%) 40 (4%) 69 (7%) 85 (9%) 116 (13%) 56 (6%) 2 (0%) 369 (40%)
Female - - 45 (5%) 116 (13%) 167 (18%) 162 (17%) 65 (7%) 4 (0%) 559 (60%)
All 1 (0%) 85 (9%) 185 (20%) 252 (27%) 278 (30%) 121 (13%) 6 (1%) 928 (100%)
NDADs
Male - - 1 (1%) 8 (7%) 12 (11%) 10 (9%) 14 (13%) 3 (3%) 48 (44%)
Female - - 3 (3%) 11 (10%) 13 (12%) 26 (24%) 8 (7%) (0%) 61 (56%)
All - - 4 (4%) 19 (17%) 25 (23%) 36 (33%) 22 (20%) 3 (3%) 109 (100%)
All Donors1
Male 1 (0%) 41 (4%) 77 (7%) 97 (9%) 125 (12%) 70 (7%) 5 (0%) 416 (40%)
Female - - 48 (5%) 126 (12%) 180 (17%) 188 (18%) 73 (7%) 4 (0%) 619 (60%)
All 1 (0%) 89 (9%) 203 (20%) 277 (27%) 313 (30%) 143 (14%) 9 (1%) 1035 (100%)
Candidates
Male 14 (2%) 41 (5%) 61 (7%) 82 (10%) 111 (13%) 86 (10%) 14 (2%) 409 (48%)
Female 7 (1%) 32 (4%) 69 (8%) 112 (13%) 118 (14%) 97 (11%) 4 (0%) 439 (52%)
All 21 (2%) 73 (9%) 130 (15%) 194 (23%) 229 (27%) 183 (22%) 18 (2%) 848 (100%)
Donors in Registered
Pairs
Male - - 12 (3%) 30 (7%) 45 (11%) 51 (12%) 31 (7%) - - 169 (41%)
Female - - 13 (3%) 51 (12%) 73 (18%) 72 (17%) 36 (9%) 1 (0%) 246 (59%)
All - - 25 (6%) 81 (20%) 118 (28%) 123 (30%) 67 (16%) 1 (0%) 415 (100%)
Pat
ient
s in
volv
ed in
tra
nsp
lant
s:
Ag
e at
Tim
e o
f Tr
ansp
lant
/Do
natio
n
NDADs
Male - - - - 5 (6%) 11 (12%) 10 (11%) 11 (12%) 3 (3%) 40 (44%)
Female - - 3 (3%) 8 (9%) 11 (12%) 22 (24%) 6 (7%) (0%) 50 (56%)
All - - 3 (3%) 13 (14%) 22 (24%) 32 (36%) 17 (19%) 3 (3%) 90 (100%)
All Donors
Male - - 12 (2%) 35 (7%) 56 (11%) 61 (12%) 42 (8%) 3 (1%) 209 (41%)
Female - - 16 (3%) 59 (12%) 84 (17%) 94 (19%) 42 (8%) 1 (0%) 296 (59%)
All - - 28 (6%) 94 (19%) 140 (28%) 155 (31%) 84 (17%) 4 (1%) 505 (100%)
Registered Transplant
Recipients2
Male 10 (2%) 19 (5%) 29 (7%) 37 (9%) 58 (14%) 40 (10%) 8 (2%) 201 (48%)
Female 4 (1%) 8 (2%) 24 (6%) 61 (15%) 60 (14%) 56 (13%) 3 (1%) 216 (52%)
All 14 (3%) 27 (6%) 53 (13%) 98 (24%) 118 (28%) 96 (23%) 11 (3%) 417 (100%)
Waitlist Transplant Recipients
Male 2 (2%) 2 (2%) 3 (3%) 9 (10%) 12 (14%) 9 (10%) (0%) 37 (42%)
Female 2 (2%) - - - - 7 (8%) 9 (10%) 5 (6%) 2 (2%) 25 (28%)
Unknown3 2 (2%) 1 (1%) 2 (2%) 8 (9%) 6 (7%) 2 (2%) 1 (1%) 26 (30%)
All 6 (7%) 3 (3%) 5 (6%) 24 (27%) 27 (31%) 16 (18%) 3 (3%) 88 (100%)
All Transplant Recipients2
Male 12 (2%) 21 (4%) 32 (6%) 46 (9%) 70 (14%) 49 (10%) 8 (2%) 238 (47%)
Female 6 (1%) 8 (2%) 24 (5%) 68 (13%) 69 (14%) 61 (12%) 5 (1%) 241 (48%)
Unknown3 2 (0%) 1 (0%) 2 (0%) 8 (2%) 6 (1%) 2 (0%) 1 (0%) 26 (5%)
20 (4%) 30 (6%) 58 (11%) 122 (24%) 145 (29%) 112 (22%) 14 (3%) 505 (100%)
7.2 KPD CANDIDATES, RECIPIENTS AND DONORS
Table A3.3: KPD Program Participants by Age, Sex, and Type, 2009-2016
Age & Sex
7.0 APPENDIX 3: ADDITIONAL DATA FOR KPD PROGRAM
Percentage values refer to total in category of participant for each age/sex combination.1Two donors registered as both an NDAD and in a match pair; they have been counted in each category but have not been double-counted in the total²Transplants to the same individual are counted separately based on recipient’s age at each transplant3Age and sex are unknown for an additional 4 waitlist recipients; these recipients are included in the totals presented.

Donation & Transplantation Interprovincial Programs Report Donation & Transplantation Interprovincial Programs Report 66
Table A3.4: KPD Program Participants by Blood Group, 2009-2016 Blood Group
7.0 APPENDIX 3: ADDITIONAL DATA FOR KPD PROGRAM
Year Month (MC)
Blood Group1Total
(100%)A AB B O
n (%) n (%) n (%) n (%) n
2009
Jan (1) 3 (13%) 1 (4%) 4 (17%) 15 (65%) 23
Feb (2) 3 (12%) 1 (4%) 4 (16%) 17 (68%) 25
May (3) 7 (21%) (0%) 6 (18%) 20 (61%) 33
Oct (4) 6 (18%) (0%) 3 (9%) 25 (74%) 34
2010
Feb (5) 9 (20%) (0%) 5 (11%) 30 (68%) 44
May (6) 11 (18%) 1 (2%) 9 (15%) 39 (65%) 60
Aug (7) 17 (22%) 2 (3%) 13 (17%) 45 (58%) 77
Nov (8) 22 (23%) 1 (1%) 13 (14%) 60 (63%) 96
2011
Mar (9) 34 (30%) 2 (2%) 15 (13%) 63 (55%) 114
Jun (10) 28 (26%) 2 (2%) 14 (13%) 62 (58%) 106
Oct (11) 31 (26%) 1 (1%) 14 (12%) 72 (61%) 118
2012
Feb (12) 31 (26%) 2 (2%) 13 (11%) 75 (62%) 121
Jun (13) 31 (23%) (0%) 18 (13%) 85 (63%) 134
Oct (14) 27 (20%) 1 (1%) 12 (9%) 93 (70%) 133
2013
Feb (15) 35 (24%) 1 (1%) 17 (12%) 91 (63%) 144
May (16) 32 (24%) (0%) 14 (10%) 90 (66%) 136
Oct (17) 37 (26%) 1 (1%) 18 (13%) 86 (61%) 142
2014
Feb (18) 30 (22%) 1 (1%) 18 (13%) 85 (63%) 134
Jun (19) 42 (27%) 1 (1%) 17 (11%) 97 (62%) 157
Oct (20) 45 (27%) 1 (1%) 13 (8%) 105 (64%) 164
2015
Feb (21) 48 (29%) 2 (1%) 14 (8%) 103 (62%) 167
Jun (22) 39 (23%) 3 (2%) 16 (9%) 112 (66%) 170
Oct (23) 31 (20%) 3 (2%) 16 (10%) 106 (68%) 156
2016
Feb (24) 28 (20%) 5 (4%) 12 (9%) 96 (68%) 141
Jun (25) 29 (21%) 2 (1%) 14 (10%) 93 (67%) 138
Oct (26) 33 (23%) 5 (3%) 16 (11%) 92 (63%) 146
Total 223 (26%) 16 (2%) 124 (15%) 485 (57%) 848
Donor Blood Group for Transplants to Registered
Recipients2
A 140 (94%) 7 (5%) 1 (1%) 1 (1%) 149
AB 2 (100%) 2
B 1 (1%) 70 (99%) 71
O 3 (2%) - - 9 (5%) 183 (94%) 195
Transplants to Registered Recipients2 143 (34%) 10 (2%) 80 (19%) 184 (44%) 417
Waitlist Transplants (known)3 46 (52%) 21 (24%) 15 (17%) 2 (2%) 88
Donor Position in Domino Chain4
Terminal 50 (57%) 22 (25%) 13 (15%) 3 (3%) 88
Non-Terminal 76 (34%) - - 44 (20%) 101 (46%) 221
% of ABO group Transplanted 64% 63% 65% 38% 49%
Canadian Population 42% 3% 9% 46% 100%
Days from First MC Start Date to Transplant for Registered
Recipients
Median 147 123 161 224 164
IQR 114-217 84-154 108-221 135-456 121-334
1 Results are categorized based on the blood group of the candidate for all measures except in relation to “Donor Position in Domino Chain”; for this measure, results are categorized based on the blood group of the donor.
2 Two type O recipients each received two KPD transplants, for a total of 417 KPD transplants.
3 Blood group is unknown for 4 waitlist KPD transplant recipients.
4 In cases in which a chain was only partially completed, donor position is based on original order in chain.

Donation & Transplantation Interprovincial Programs Report Donation & Transplantation Interprovincial Programs Report 67
Table A3.5: KPD Transplant Recipients by Months on Dialysis, cPRA, Year, and Type, 2009-2016
HLA Antibody Levels
7.0 APPENDIX 3: ADDITIONAL DATA FOR KPD PROGRAM
MC Year Type Months on
Dialysis
cPRA
Total (100%)0% 1%-79% 80%-94% 95%-96% 97%-98% 99%-100% Unknown
n (%) n (%) n (%) n (%) n (%) n (%) n (%)
2009
-201
5
Reg
iste
red
Rec
ipie
nts 0 19 (19%) 55 (54%) 12 (12%) 4 (4%) 5 (5%) 7 (7%) - - 102
1 to 12 13 (23%) 29 (52%) 9 (16%) 2 (4%) 1 (2%) 2 (4%) - - 56
13 to 24 11 (17%) 32 (50%) 15 (23%) 3 (5%) 2 (3%) 1 (2%) - - 64
25 to 36 11 (26%) 14 (33%) 12 (28%) - - 3 (7%) 3 (7%) - - 43
37+ 18 (23%) 31 (39%) 12 (15%) 6 (8%) 3 (4%) 10 (13%) - - 80
Total 72 (21%) 161 (47%) 60 (17%) 15 (4%) 14 (4%) 23 (7%) - - 345
Wai
tlist
Rec
ipie
nts
0 2 (67%) 1 (33%) - - - - - - - - - - 3
1 to 12 1 (25%) 3 (75%) - - - - - - - - - - 4
13 to 24 10 (71%) 3 (21%) - - - - - - 1 (7%) - - 14
25 to 36 5 (71%) 1 (14%) - - - - - - 1 (14%) - - 7
37+ 26 (58%) 14 (31%) 2 (4%) 1 (2%) 1 (2%) 1 (2%) - - 45
Unknown 1 (14%) 2 (29%) - - - - - - - - 4 (57%) 7
Total 45 (56%) 24 (30%) 2 (3%) 1 (1%) 1 (1%) 3 (4%) 4 (5%) 80
2016
Reg
iste
red
Rec
ipie
nts 0 5 (21%) 13 (54%) 5 (21%) - - 1 (4%) - - - - 24
1 to 12 7 (37%) 6 (32%) 4 (21%) 1 (5%) 1 (5%) - - - - 19
13 to 24 2 (14%) 8 (57%) 3 (21%) - - 1 (7%) - - - - 14
25 to 36 - - 8 (89%) - - - - - - 1 (11%) - - 9
37+ 1 (17%) 3 (50%) 1 (17%) - - - - 1 (17%) - - 6
Total 15 (21%) 38 (53%) 13 (18%) 1 (1%) 3 (4%) 2 (3%) - - 72
Wai
tlist
Rec
ipie
nts
0 - - - - - - - - - - - - - - -
1 to 12 1 (50%) 1 (50%) - - - - - - - - - - 2
13 to 24 - - 1 (100%) - - - - - - - - - - 1
25 to 36 - - - - - - - - - - - - - - -
37+ 1 (50%) 1 (50%) - - - - - - - - - - 2
Unknown 1 (33%) 1 (33%) - - - - - - - - 1 (33%) 3
Total 3 (38%) 4 (50%) - - - - - - - - 1 (13%) 8
All
Year
s Reg
iste
red
Rec
ipie
nts 0 24 (19%) 68 (54%) 17 (13%) 4 (3%) 6 (5%) 7 (6%) - - 126
1 to 12 20 (27%) 35 (47%) 13 (17%) 3 (4%) 2 (3%) 2 (3%) - - 75
13 to 24 13 (17%) 40 (51%) 18 (23%) 3 (4%) 3 (4%) 1 (1%) - - 78
25 to 36 11 (21%) 22 (42%) 12 (23%) - - 3 (6%) 4 (8%) - - 52
37+ 19 (22%) 34 (40%) 13 (15%) 6 (7%) 3 (3%) 11 (13%) - - 86
Total 87 (21%) 199 (48%) 73 (18%) 16 (4%) 17 (4%) 25 (6%) - - 417
Wai
tlist
Rec
ipie
nts
0 2 (67%) 1 (33%) - - - - - - - - - - 3
1 to 12 2 (33%) 4 (67%) - - - - - - - - - - 6
13 to 24 10 (67%) 4 (27%) - - - - - - 1 (7%) - - 15
25 to 36 5 (71%) 1 (14%) - - - - - - 1 (14%) - - 7
37+ 26 (62%) 12 (29%) 1 (2%) 1 (2%) 1 (2%) 1 (2%) - - 42
Unknown 3 (20%) 6 (40%) 1 (7%) - - - - - - 5 (33%) 15
Total 48 (55%) 28 (32%) 2 (2%) 1 (1%) 1 (1%) 3 (3%) 5 (6%) 88
Total 135 (27%) 227 (45%) 75 (15%) 17 (3%) 18 (4%) 28 (6%) 5 (1%) 505

Donation & Transplantation Interprovincial Programs Report Donation & Transplantation Interprovincial Programs Report 68
Table A3.6a: KPD Registered Pairs and New Candidates by cPRA and Match Cycle, 2009-2016
7.0 APPENDIX 3: ADDITIONAL DATA FOR KPD PROGRAM
YearcPRA 0% 1%-79% 80%-94% 95%-96% 97%-98% 99%-100% Total
(100%)MC n % n % n % n % n % n %
2009
1 5 (22%) 8 (35%) 5 (22%) - - 2 (9%) 3 (13%) 23
2 6 (24%) 9 (36%) 4 (16%) - - 2 (8%) 4 (16%) 25
3 11 (33%) 11 (33%) 5 (15%) - - 1 (3%) 5 (15%) 33
4 8 (22%) 13 (36%) 5 (14%) 1 (3%) 1 (3%) 8 (22%) 36
2010
5 10 (22%) 12 (27%) 5 (11%) 4 (9%) 2 (4%) 12 (27%) 45
6 9 (14%) 15 (24%) 13 (21%) 2 (3%) 2 (3%) 22 (35%) 63
7 8 (10%) 20 (24%) 10 (12%) 4 (5%) 7 (8%) 34 (41%) 83
8 11 (11%) 24 (24%) 11 (11%) 5 (5%) 9 (9%) 40 (40%) 100
2011
9 14 (12%) 28 (24%) 10 (8%) 6 (5%) 13 (11%) 47 (40%) 118
10 9 (8%) 28 (25%) 11 (10%) 6 (5%) 10 (9%) 46 (42%) 110
11 13 (10%) 29 (23%) 9 (7%) 7 (6%) 10 (8%) 57 (46%) 125
2012
12 16 (12%) 31 (24%) 9 (7%) 5 (4%) 9 (7%) 60 (46%) 130
13 14 (10%) 32 (23%) 15 (11%) 4 (3%) 9 (6%) 67 (48%) 141
14 18 (12%) 33 (23%) 13 (9%) 4 (3%) 10 (7%) 67 (46%) 145
2013
15 17 (11%) 34 (22%) 15 (10%) 2 (1%) 10 (6%) 78 (50%) 156
16 17 (11%) 27 (18%) 14 (9%) 4 (3%) 9 (6%) 77 (52%) 148
17 20 (13%) 36 (23%) 8 (5%) 3 (2%) 9 (6%) 78 (51%) 154
2014
18 16 (11%) 34 (23%) 6 (4%) 2 (1%) 6 (4%) 84 (57%) 148
19 21 (12%) 38 (22%) 12 (7%) 3 (2%) 10 (6%) 88 (51%) 172
20 17 (9%) 38 (21%) 17 (9%) 2 (1%) 12 (6%) 99 (54%) 185
2015
21 24 (13%) 45 (24%) 13 (7%) 3 (2%) 11 (6%) 91 (49%) 187
22 28 (15%) 44 (23%) 16 (8%) 3 (2%) 10 (5%) 91 (47%) 192
23 22 (13%) 31 (18%) 19 (11%) 1 (1%) 9 (5%) 91 (53%) 173
2016
24 18 (11%) 37 (23%) 14 (9%) 1 (1%) 6 (4%) 82 (52%) 158
25 19 (13%) 38 (25%) 9 (6%) 3 (2%) 8 (5%) 73 (49%) 150
26 14 (9%) 43 (27%) 15 (10%) 1 (1%) 8 (5%) 76 (48%) 157
Registered Pairs 158 (17%) 333 (36%) 108 (12%) 31 (3%) 60 (6%) 239 (26%) 929
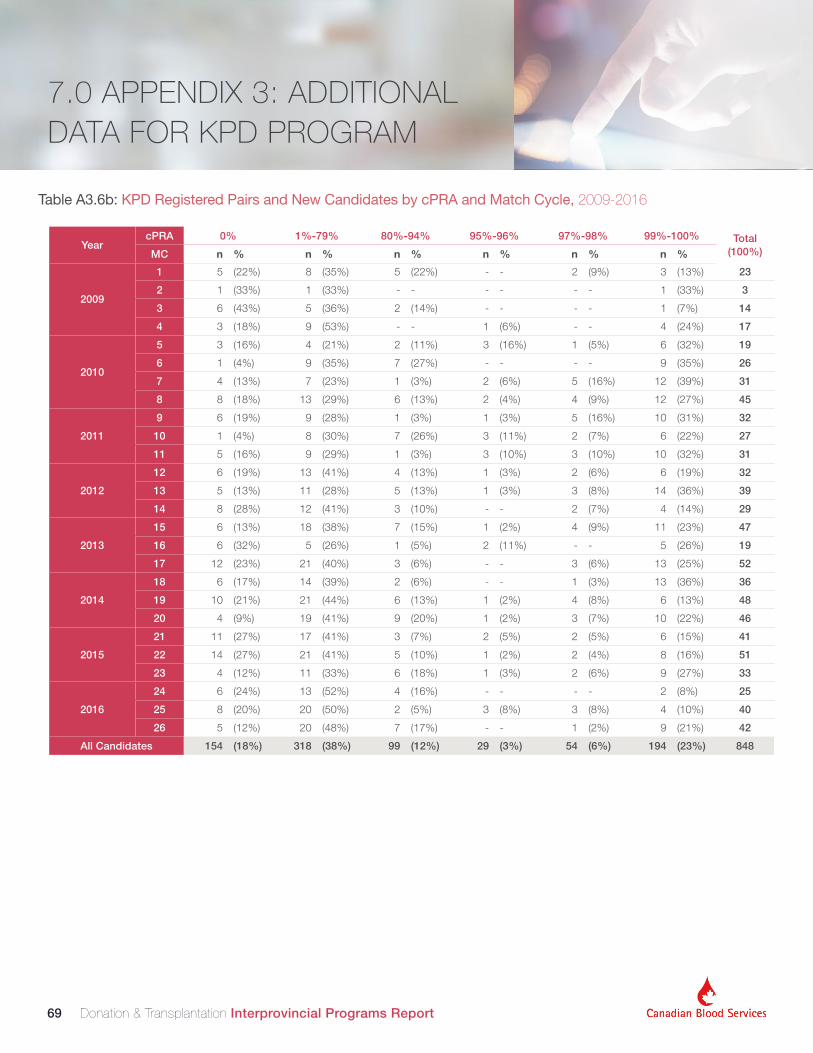
Donation & Transplantation Interprovincial Programs Report Donation & Transplantation Interprovincial Programs Report 69
Table A3.6b: KPD Registered Pairs and New Candidates by cPRA and Match Cycle, 2009-2016
7.0 APPENDIX 3: ADDITIONAL DATA FOR KPD PROGRAM
2009
1 5 (22%) 8 (35%) 5 (22%) - - 2 (9%) 3 (13%) 23
2 1 (33%) 1 (33%) - - - - - - 1 (33%) 3
3 6 (43%) 5 (36%) 2 (14%) - - - - 1 (7%) 14
4 3 (18%) 9 (53%) - - 1 (6%) - - 4 (24%) 17
2010
5 3 (16%) 4 (21%) 2 (11%) 3 (16%) 1 (5%) 6 (32%) 19
6 1 (4%) 9 (35%) 7 (27%) - - - - 9 (35%) 26
7 4 (13%) 7 (23%) 1 (3%) 2 (6%) 5 (16%) 12 (39%) 31
8 8 (18%) 13 (29%) 6 (13%) 2 (4%) 4 (9%) 12 (27%) 45
2011
9 6 (19%) 9 (28%) 1 (3%) 1 (3%) 5 (16%) 10 (31%) 32
10 1 (4%) 8 (30%) 7 (26%) 3 (11%) 2 (7%) 6 (22%) 27
11 5 (16%) 9 (29%) 1 (3%) 3 (10%) 3 (10%) 10 (32%) 31
2012
12 6 (19%) 13 (41%) 4 (13%) 1 (3%) 2 (6%) 6 (19%) 32
13 5 (13%) 11 (28%) 5 (13%) 1 (3%) 3 (8%) 14 (36%) 39
14 8 (28%) 12 (41%) 3 (10%) - - 2 (7%) 4 (14%) 29
2013
15 6 (13%) 18 (38%) 7 (15%) 1 (2%) 4 (9%) 11 (23%) 47
16 6 (32%) 5 (26%) 1 (5%) 2 (11%) - - 5 (26%) 19
17 12 (23%) 21 (40%) 3 (6%) - - 3 (6%) 13 (25%) 52
2014
18 6 (17%) 14 (39%) 2 (6%) - - 1 (3%) 13 (36%) 36
19 10 (21%) 21 (44%) 6 (13%) 1 (2%) 4 (8%) 6 (13%) 48
20 4 (9%) 19 (41%) 9 (20%) 1 (2%) 3 (7%) 10 (22%) 46
2015
21 11 (27%) 17 (41%) 3 (7%) 2 (5%) 2 (5%) 6 (15%) 41
22 14 (27%) 21 (41%) 5 (10%) 1 (2%) 2 (4%) 8 (16%) 51
23 4 (12%) 11 (33%) 6 (18%) 1 (3%) 2 (6%) 9 (27%) 33
2016
24 6 (24%) 13 (52%) 4 (16%) - - - - 2 (8%) 25
25 8 (20%) 20 (50%) 2 (5%) 3 (8%) 3 (8%) 4 (10%) 40
26 5 (12%) 20 (48%) 7 (17%) - - 1 (2%) 9 (21%) 42
All Candidates 154 (18%) 318 (38%) 99 (12%) 29 (3%) 54 (6%) 194 (23%) 848
YearcPRA 0% 1%-79% 80%-94% 95%-96% 97%-98% 99%-100% Total
(100%)MC n % n % n % n % n % n %

Donation & Transplantation Interprovincial Programs Report Donation & Transplantation Interprovincial Programs Report 70
7.3 MATCH CYCLE STATISTICS
7.0 APPENDIX 3: ADDITIONAL DATA FOR KPD PROGRAM
Table A3.7: Donors by Level of Participation and Number of Match Cycles in which Donor Participated, 2009-2016
Donor Outcomes
Number of Match Cycles in which
Donor was Active
Donors who were Active at the end of Match Cycle 26 (count)
Donors who were Inactive at the end of Match Cycle 26 (count)
Never Included in Any Proposed Chain
Never Included in Any Proposed Chain
Never Included in Any Proposed Chain
Included in a Proposed Chain One or More Times
No Donation in KPD Donated in KPD
1 46 - 75 47 315
2 14 - 48 22 99
3 16 1 43 8 27
4 2 - 46 8 19
5 10 - 22 4 19
6 9 4 25 6 6
7 1 - 16 4 14
8 10 2 17 2 3
9 4 1 2 4 1
10 3 - 4 2 1
11 5 - 5 2 -
12 2 - 7 - -
13 1 - 3 1 -
14 1 - 3 - -
15 or more 11 2 4 1 1

Donation & Transplantation Interprovincial Programs Report Donation & Transplantation Interprovincial Programs Report 71
7.0 APPENDIX 3: ADDITIONAL DATA FOR KPD PROGRAM
Table A3.8: Days from Enrolment and Date of Proposal to Date of Surgery for NDADs versus Registered Donors, 2009-2016
Chain Length and Time to Completion
Donor Type Time Interval Mean Median Interquartile Range Total Range
Non-Directed Anonymous DonorsFinal Chain Proposal to Transplantb 115 111 91-140 18-229
Enrolment to Transplanta 166 132 989-173 41-684
Donors in Registered PairsFinal Chain Proposal to Transplantb 120 118 92-145 29-307
Enrolment to Transplanta 261 164 120-327 47-1980
All Donors
Final Chain Proposal to Transplantb 119 117 92-145 18-307
Enrolment to Transplanta 244 157 113-278 41-1980
Enrolment to End of Match Cycle 26c 614 249 0-980 0-2934
Time is measured (a) from the start date of the donor’s first active Match Cycle to their donation date; (b) from the proposal date of the chain in which the donation is made to the donation date; and (c) from the start date of the donor’s first active Match Cycle to the start of Match Cycle 27 for donors who remain active.

Donation & Transplantation Interprovincial Programs Report Donation & Transplantation Interprovincial Programs Report 72
7.0 APPENDIX 3: ADDITIONAL DATA FOR KPD PROGRAM
Table A3.9a: Counts of All Travelers in Transplanted Matched Pairs by Province, 2009-2016
Travel
Province of Transplant CentreProvince of Surgical Centre
All Donors Travelling
Donor/Recipient Out: InterprovincialBC AB SK MB ON QC Atl.
Do
nors
Tra
velli
ng In
terp
rovi
ncia
lly o
r In
trap
rovi
ncia
lly*
BC
All - 10 1 2 31 9 3 56 56
Paired - 8 1 2 27 9 3 50 50
NDAD - 2 - - 4 - - 6 6
AB
All 10 3 2 5 13 4 3 40 37
Paired 8 3 1 5 11 4 3 35 32
NDAD 2 - 1 - 2 - - 5 5
SK
All 2 2 - 2 6 1 1 14 14
Paired - 2 - 2 4 1 - 9 9
NDAD 2 - - - 2 - 1 5 5
MB
All 5 1 1 - 7 1 2 17 17
Paired 4 1 1 - 4 1 1 12 12
NDAD 1 - - - 3 - 1 5 5
ON
All 33 18 2 5 22 16 5 101 79
Paired 30 15 2 4 18 14 4 87 69
NDAD 3 3 - 1 4 2 1 14 10
QC
All 9 5 1 1 14 2 2 34 32
Paired 7 5 - 1 12 1 2 28 27
NDAD 2 - 1 - 2 1 - 6 5
Atl.
All 2 3 - 1 8 - - 14 14
Paired 2 2 - 1 7 - - 12 12
NDAD - 1 - - 1 - - 2 2
All Donors Travelling
All 61 42 7 16 101 33 16 276
Paired 51 36 5 15 83 30 13 233
NDAD 10 6 2 1 18 3 3 43
Donor In: Interprovincial
All Donors 61 39 7 16 79 31 16 249
Paired 51 33 5 15 65 29 13 211
10 6 2 1 14 2 3 38

Donation & Transplantation Interprovincial Programs Report Donation & Transplantation Interprovincial Programs Report 73
7.0 APPENDIX 3: ADDITIONAL DATA FOR KPD PROGRAM
Table A3.9a: Counts of All Travelers in Transplanted Matched Pairs by Province, 2009-2016
Rec
ipie
nts
Trav
ellin
g In
terp
rovi
ncia
lly o
r In
traP
rovi
ncia
lly*
BCAll - - - - 2 - 1 3 3
Paired - - - - 2 - 1 3 3
ABAll 1 - - 1 - - - 2 2
Paired 1 - - 1 - - - 2 2
SK
All 1 - - 1 4 1 - 7 7
Paired 1 - - - 4 - - 5 5
WL - - - 1 - 1 - 2 2
MBAll - - - - 2 1 - 3 3
Paired - - - - 2 1 - 3 3
ON
All 1 1 - - 3 - 1 6 3
Paired 1 1 - - 2 - 1 5 3
WL - - - - 1 - - 1 0
QC
All - - - - - 5 - 5 0
Paired - - - - - 4 - 4 0
WL - - - - - 1 - 1 0
Atl.All - - - - 1 - - 1 1
Paired - - - - 1 - - 1 1
All Recipients Travelling
All 3 1 0 2 12 7 2 27
Paired 3 1 0 1 11 5 2 23
WL 0 0 0 1 1 2 0 4
Recipient In: Interprovincial
All 3 1 0 2 9 2 2 19
Paired 3 1 0 1 9 1 2 17
WL 0 0 0 1 0 1 0 2
*Intraprovincial travel is shown where transplant centre and surgical centre are in the same province (highlighted).
Province of Transplant CentreProvince of Surgical Centre
All Donors Travelling
Donor/Recipient Out: InterprovincialBC AB SK MB ON QC Atl.

Donation & Transplantation Interprovincial Programs Report Donation & Transplantation Interprovincial Programs Report 74
7.0 APPENDIX 3: ADDITIONAL DATA FOR KPD PROGRAM
Table A3.10: Outcome Results for KPD Recipients Reaching One Month and One Year Post-Transplant
Outcomes
Pat
ient
Sur
viva
l
Kno
wn
Cas
es
(Pat
ient
Sur
viva
l)
Gra
ft s
urvi
val
Kno
wn
Cas
es
(Pat
ient
Sur
viva
l)
Pat
ient
s ex
per
ienc
ing
re
ject
ion
epis
od
es*
Kno
wn
Cas
es
(Rej
ectio
n)
Serum Creatinine (sCr) Level†
< 1
00
100-
149
150-
174
175-
199
>19
9
Kno
wn
case
s
Tran
spla
nt
Registered Recipients# 374 375 371 375 26 359 156 160 31 9 12 356
% 99.7% 98.9% 7.2% 44% 45% 9% 3% 3% 100%
WL Recipients# 84 84 84 84 7 84 24 44 9 5 2 82
% 100% 100% 9.1% 29% 54% 11% 6% 2% 100%
All Recipients# 458 459 455 459 33 443 180 204 40 14 14 438
% 99.8% 99.1% 7.4% 41% 47% 9% 3% 3% 100%
Tran
spla
nt
Registered Recipients# 304 306 300 307 45 297 136 129 20 7 9 292
% 99.3% 97.7% 15.2% 47% 44% 7% 2% 3% 100%
WL Recipients# 67 67 67 67 10 68 16 40 7 2 2 65
% 100% 100% 14.7% 25% 62% 11% 3% 3% 100%
All Recipients# 371 373 367 374 55 366 152 169 27 9 11 357
% 99.5% 98.1% 15.0% 43% 47% 8% 3% 3% 100%
“Known cases” refers to the number of transplants for which outcome data is available.
†At the one-month point, recorded creatinine levels ranged from 18 to 683, with a mean of 115 μmol/L and a median of 109 μmol/L. At the one-year point, recorded creatinine levels ranged from 22 (pediatric) to 580, with a mean of 113 μmol/L and a median of 108 μmol/L.
*Results include borderline rejections. Deceased patients are excluded from total known cases at the one-year point. One-year rejection episode results include rejection episodes occurring within the first month after receiving the transplant.

Donation & Transplantation Interprovincial Programs Report Donation & Transplantation Interprovincial Programs Report 75
8.0 APPENDIX 4: HSP MATCHING ALGORITHM
There are 4 tiers of matching and ranking that the HSP algorithm performs to develop a final listing of potential HSP recipients who are compatible with an available deceased donor organ.
Step One: Matching is first done on blood group, using the same compatibility rules as any patient requiring a blood transfusion.
Step Two: The second step checks HLA compatibility for patients identified as blood group compatible. Recipient’s “unacceptable HLA antigens” are compared to a donor’s HLA antigens to identify recipients that are unlikely to have a positive crossmatch to the donor (“virtual crossmatch”). In this step, potential donor-recipient matches are excluded when the donor has HLA antigens that have been listed in the recipient’s record as being incompatible.
Step Three: Further screening of donors based on individual attributes of the patient or the clinical direction of a local program occurs at this step. This involves filters based on donor age, donor infectious disease status, and whether or not the proposed donor was declared dead using donation after cardio-circulatory death (DCD).
Step Four: At this point, it is quite common for a donor to have only one or sometimes no matches. However, for cases with two or more potential candidates that are blood group, HLA, and patient-filter matches, the HSP algorithm uses agreed upon policies to rank order the remaining matches based on key medically and logistically relevant factors. See Section 3.1 for a summary of recent policy changes impacting these criteria.
Blood Group (ABO) Compatibility
If donor blood group is:
Then recipient blood group can be:
O O,A,B,AB
A A, AB
B B, AB
AB AB
Table A4.2: Step Three: Patient and Transplant Program-Specific Filters
Table A4.3: Step Three: Patient and Transplant Program-Specific Filters
Table A4.1: Step One: Blood group Matching
Filter Attribute
Accept a donor to specified maximum age (<45, <55, <65, no restrictions)
Accept a donor above a specified minimum age (>10, <11, >12, >13, >14, >15, >16, >17, >18, no restriction)
Accept a donor who has tested positive for Hepatitis B core antibody
Accept a donor who has tested positive for Hepatitis C
Accept a DCD (donation after cardio-circulatory death) donor
Matching/Ranking Attribute Rank
Medical urgency (requires prior approval of KTAC sub-committee) 1
Recipient cPRA is 100% 2
Recipient cPRA is 99% 3
Paediatric recipient (≤19 years of age) 4
Recipient is a prior living donor 5
HLA match: The HLA trying for the donor and recipient indicates a zero out of six (0/6) mismatch for ABDR antigens
6
Kidney-pancreas patients 7
The donor and recipients are in the same province 8
The donor and recipient are in the same region:• West region: BC,AB,SK, MB• East region: ON, QC,ATL
9
Time on Dialysis (number of days starting at the most recent initiation of dialysis)
10
All four of the tiers are examined annually by clinical experts advising Canadian Blood Services on the operations and policies of the HSP program. As policy changes are proposed and endorsed by the national community (including physicians, donation professionals, laboratory professionals, and administrators), these matching and ranking rules used by the Canadian Transplant Registry are updated accordingly.

Donation & Transplantation Interprovincial Programs Report Donation & Transplantation Interprovincial Programs Report 76
9.0 APPENDIX 5: ADDITIONAL DATA FOR HSP PROGRAM
Table A5.1: Transplanted Recipients by cPRA, Age, and Sex
Table A5.2: Transplanted Recipients by cPRA, Age, and Sex
Table A5.3: HSP Candidate Participation by Blood Group
Male Female All RecipientscPRA (%) 95 96 97 98 99 100 All 95 96 97 98 99 100 All
Ag
e G
roup
<19 1 1 2 1 3 4
19-29 1 1 3 6 11 1 3 5 2 11 22
30-39 3 1 3 5 5 17 1 2 1 5 9 26
40-49 3 1 1 7 9 8 29 4 5 7 3 11 6 36 65
50-59 5 2 2 4 8 8 30 4 2 13 7 13 10 49 79
60-69 3 4 4 6 4 7 28 7 3 3 16 16 7 52 80
70+ 2 1 1 2 6 3 1 3 2 3 12 18
All Ages 14 11 9 24 27 36 121 21 12 29 33 44 33 172 293
% of cPRA 40% 48% 24% 42% 38% 52% 41% 60% 52% 76% 58% 62% 48% 59%
DCD NDD
Blood Group A AB B O DCD A AB B O NDD All
Ag
e G
roup
<19 7 5 7 19 42 4 11 39 96 115
19-29 17 3 6 19 45 69 10 23 96 198 243
30-39 21 4 2 28 55 50 8 26 65 149 204
40-49 41 3 16 48 108 82 11 18 91 202 310
50-59 91 11 17 88 207 126 13 46 130 315 522
60-69 51 1 16 75 143 106 13 27 119 265 408
70+ 10 5 7 22 64 6 16 53 139 161
All Ages 238 22 67 272 599 539 65 167 593 1364 1963
Mean age 50 45 49 51 50 48 47 47 47 47 48
Note: The results presented here include donors registered in CTR for whom an HSP allocation was run. The type of donor was unknown in 17 cases out of the 1980 total donors for whom an allocation was run; these cases are excluded from the table to the left.
Patient StatusBlood Group
TotalA AB B O
Active 143 20 64(2) 264(2) 491(4)
Transplanted 127 21 49(2) 92(2) 289(4)
Offlist 58 5 28 100 191
On Hold 47 9 20 75 148
Total 375 55 163 530 1123

Donation & Transplantation Interprovincial Programs Report Donation & Transplantation Interprovincial Programs Report 77
9.0 APPENDIX 5: ADDITIONAL DATA FOR HSP PROGRAM
Table A5.4: Active HSP Candidates over Time: Counts at Month End by cPRA
cPRA
95% 96% 97% 98% 99% 100%
2013
Oct 4 2 6 7 13 54
Nov 2 2 5 7 16 56
Dec 2 2 5 7 17 59
2014
Jan 1 2 6 7 22 81
Feb 1 3 6 11 21 80
Mar 2 2 6 11 19 84
Apr 3 4 6 15 18 97
May 13 9 14 31 48 245
Jun 9 9 13 32 50 250
Jul 6 10 11 32 48 263
Aug 2 10 13 34 50 266
Sep 4 7 12 31 49 280
Oct 5 8 13 35 64 374
Nov 8 7 10 28 62 386
Dec 6 5 10 28 56 371
2015
Jan 10 7 9 27 66 386
Feb 10 6 8 22 67 387
Mar 9 5 12 25 66 375
Apr 7 4 9 22 60 359
May 5 4 7 17 63 364
Jun 5 3 8 19 65 368
Jul 3 4 7 20 65 401
Aug 4 4 8 19 61 392
Sep 5 4 7 18 63 414
Oct 3 4 6 19 60 413
Nov 2 5 5 19 65 427
Dec 4 4 3 18 62 419
cPRA
95% 96% 97% 98% 99% 100%
2016
Jan 4 4 3 21 60 414
Feb 6 3 2 20 62 415
Mar 5 3 4 17 59 415
Apr 4 3 2 19 58 408
May 4 3 5 15 55 414
Jun 4 4 4 17 50 419
Jul 4 5 3 14 49 426
Aug 4 4 7 14 51 436
Sep 2 4 5 16 53 419
Oct 1 5 4 12 53 407
Nov 1 3 4 12 52 412
Dec 5 3 9 13 49 416

Donation & Transplantation Interprovincial Programs Report Donation & Transplantation Interprovincial Programs Report 78
9.0 APPENDIX 5: ADDITIONAL DATA FOR HSP PROGRAM
Table A5.4: Active HSP Candidates over Time: Counts at Month End by cPRA
Donors ws consentedith
kidney
Donors for whom allocation was run
Donors with at least one
match
Donors with at least one
offer
Donors with at least one HSP
donation
2013Nov 6 5 5 4
Dec 2 2 2 2
2014
Jan 9 7 4 2
Feb 11 9 5 3
Mar 3 2 2 1 1
Apr 9 8 4 3 2
May 10 8 5 2 1
Jun 40 34 24 17 9
Jul 47 41 28 20 7
Aug 48 42 22 13 6
Sep 42 36 22 14 7
Oct 51 46 21 11 8
Nov 83 61 54 29 15
Dec 69 53 38 15 7
2015
Jan 54 48 29 17 10
Feb 52 48 24 17 10
Mar 74 69 39 30 13
Apr 67 62 39 30 15
May 59 54 24 17 9
Jun 78 72 32 23 7
Jul 66 60 32 19 9
Aug 65 59 31 18 10
Sep 71 65 29 15 6
Oct 65 58 27 19 9
Nov 73 68 30 22 10
Dec 81 75 35 27 11
2016
Jan 99 90 41 23 6
Feb 73 68 27 21 5
Mar 88 81 38 22 10
Apr 83 74 42 27 10
May 82 77 43 32 14
Jun 78 67 42 25 10
Jul 88 76 40 21 8
Aug 86 76 43 25 9
Sep 75 67 35 22 9
Oct 79 72 26 16 10
Nov 69 64 30 19 10
Dec 85 76 34 18 9
Total 2220 1980 808 661 292

Donation & Transplantation Interprovincial Programs Report Donation & Transplantation Interprovincial Programs Report 79
10.0 APPENDIX 6: ADDITIONAL INFORMATION
10.0 APPENDIX 6: ADDITIONAL INFORMATION FOR NOW SUMMARY
Status Criteria: HeartAdult Cardiac Transplantation (Canadian Cardiac Transplant Network 2012)
Status 4
1) Mechanically ventilated patient on high-dose single or multiple inotropes ± mechanical support (eg. Intra-aortic balloon pump, extra-corporeal membrane oxygenation (ECMO), abiomed BVS5000, or biomedicus), excluding long-term ventricular assist devices (VAD).
2) Patient with VAD malfunction or complication, such as thromboembolism, systemic device-related infection, mechanical failure, or life-threatening arrhythmia.
3) Patient should be recertified every 7 days as a Status 4 by a qualified physician, if still medically appropriate.
Status 4S 1) High PRA (>80%)
Status 3.5 1) High-dose or multiple inotropes in hospital, and patients not candidates for VAD therapy
or no VAD available.
2) Acute refractory ventricular arrhythmias.
Status 3 1) VAD not meeting Status 4 criteria.
2) Patients on inotropes in hospital, not meeting above criteria.
3) Heart/Lung recipient candidates.
4) Cyanotic congenital heart disease with resting saturation <65%.
5) Congenital heart disease – arterial-shunt-dependent.
6) Adult-sized complex congenital heart disease with increasing dys-rhythmic or systemic ventricular decline.
Status 2 1) I n-hospital patient, or patient on outpatient inotropic therapy not meeting the above
criteria.
2) Adult with cyanotic CHD: resting 02 saturation 65–75% or prolonged desaturation to less than 60% with modest activity (i.e., walking).
3) Adult with Fontan palliation with protein-losing enteropathy.
4) Patients listed for multiple organ transplantation (other than heart-lung).
Status 1. All other out-of-hospital patients.
Status Criteria: Liver2008 Listing and Allocation Practices for Liver Transplantation in Canada (Canadian Council for Donation and Transplantation Working Document)
Status 4FPatient in an ICU and intubated due to FHF (includes primary graft non-function).
Status 3FPatient in an ICU or equivalent care facility due to FHF, but not requiring intubation, and fulfills the King’s College criteria for high mortality without transplantation.
Status Criteria: Lung A Review of Listing and Allocation Criteria for Lung Transplantation – 2008 (Canadian Council for Donation and Transplantation Working Document)
Status 0 - accepted for transplant; not actively listed
Status 1 - actively listed and clinically stable
Status 2 - actively listed and clinically deteriorating