domestic resource mobilization in sub-saharan africa: the
TRANSCRIPT
research for a fairer world
Domestic Resource Mobilization in Sub-Saharan Africa:The Case of Ugandaby John Mary Matovu
The views expressed in this research paper are the author’s alone and are not necessarily the views of The North South Institute or the funders of this research project.
Summer 2010

This paper is produced in collaboration with The North-South Institute (NSI), Ottawa, Canada. It is part of NSI’s larger research project, Domestic Resource Mobilization in Sub-Saharan Africa. The project was made possible through the generous financial support of the African Development Bank (AfDB), the Canadian Interna-tional Development Agency (CIDA), Canada’s International Develop-ment Research Centre (IDRC), and UKaid from the Department for International Development (DFID).
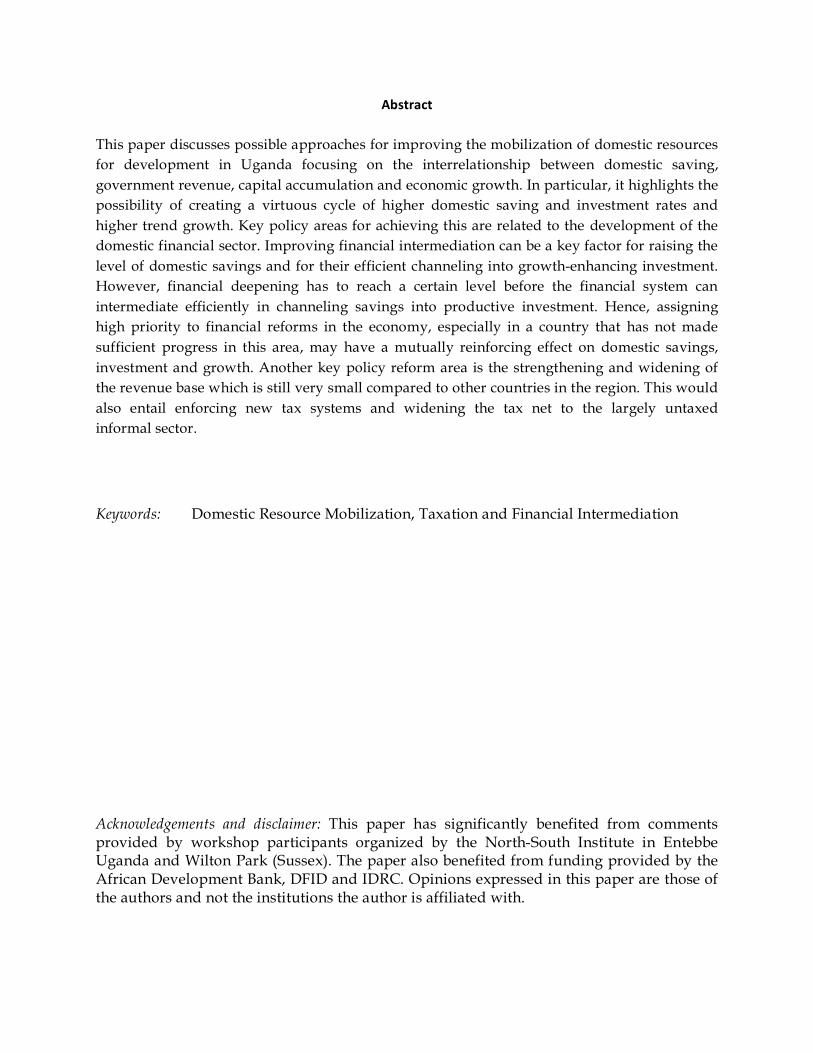
This paper discusses possible approaches for improving the mobilization of domestic resources
for development in Uganda focusing on the interrelationship between domestic saving,
government revenue, capital accumulation and economic growth. In particular, it highlights the
possibility of creating a virtuous cycle of higher domestic saving and investment rates and
higher trend growth. Key policy areas for achieving this are related to the development of the
domestic financial sector. Improving financial intermediation can be a key factor for raising the
level of domestic savings and for their efficient channeling into growth-enhancing investment.
However, financial deepening has to reach a certain level before the financial system can
intermediate efficiently in channeling savings into productive investment. Hence, assigning
high priority to financial reforms in the economy, especially in a country that has not made
sufficient progress in this area, may have a mutually reinforcing effect on domestic savings,
investment and growth. Another key policy reform area is the strengthening and widening of
the revenue base which is still very small compared to other countries in the region. This would
also entail enforcing new tax systems and widening the tax net to the largely untaxed
informal sector.
Keywords: Domestic Resource Mobilization, Taxation and Financial Intermediation
Acknowledgements and disclaimer: This paper has significantly benefited from comments provided by workshop participants organized by the North-South Institute in Entebbe Uganda and Wilton Park (Sussex). The paper also benefited from funding provided by the African Development Bank, DFID and IDRC. Opinions expressed in this paper are those of the authors and not the institutions the author is affiliated with.
1 Introduction ...............................................................................................................3
2 Background to the Ugandan Economy ...................................................................7
2.1 Growth Performance .........................................................................................7
2.2 Government and/or non-financial public sector accounts ............................9
2.3 Domestic borrowing and debt ........................................................................ 11
2.4 External borrowing and debt .......................................................................... 12
2.5 Current account and the external debt........................................................... 13
3 Savings Performance .............................................................................................. 15
3.1 Household Savings .......................................................................................... 18
3.2 Non-financial Savings...................................................................................... 18
3.3 Informal financial savings .............................................................................. 19
3.4 Formal financial savings................................................................................. 20
3.5 Semi-formal financial savings ........................................................................ 20
4 Financial Markets and Intermediation .................................................................. 21
Source: BoU...................................................................Error! Bookmark not defined.
4.1 Formal Financial Intermediaries..................................................................... 23
4.2 Informal financial sector ................................................................................. 29
5 Public Sector Revenue Mobilization and Taxation Policy in Uganda ................ 31
5.1 Policy Reforms to Increase Tax Revenues...................................................... 31
5.2 Performance of Tax Revenues......................................................................... 32
6 Constraints in Domestic savings Mobilization in Uganda .................................. 35
6.1 Revenue Mobilization...................................................................................... 35
6.2 Savings Mobilization and Financial Intermediation ..................................... 37
7 Opportunities to Enhance Savings Mobilization.................................................. 39
7.1 Revenue Policies............................................................................................... 39
7.2 Financial Intermediation ................................................................................. 42
8 Conclusion ............................................................................................................... 45

1 Introduction
Both the theoretical and the empirical economic literature emphasize the role of national
savings in influencing the pace of fixed investment in an economy and its overall
economic growth rate. The concept of saving plays an important role in economic
analysis. Saving is defined as the difference between income and consumption. The
relationship between savings, investment and growth has been thoroughly analyzed in
the theoretical and empirical literature. From the neoclassical Solow-Swan growth
models and as suggested by endogenous growth theory by Romer (1986) and Lucas
(1988), high savings and investment rates are important in view of their strong and
positive association with the GDP growth rate. The empirical evidence (see, for
example, Levine and Renelt, 1992) also indicates that there exists a robust positive
correlation between the investment rates and GDP growth. The conventional wisdom
about these links is that thrift is a major determinant of long-term economic growth,
which in turn is related to the conjecture that in the long run there must exist an
expected positive return on the invested capital, regarded as the reward for parsimony.
The extent to which the level of savings can affect capital accumulation, and hence growth,
largely depends on the capacity of the economy to channel the savings into productive
activities. It also depends on the efficiency of this process. The system of financial
intermediation can affect economic performance and growth directly through the role it plays in
resource allocation. In particular, the financial system can affect saving and investment
decisions by reducing information and transaction costs, creating mechanisms of risk-sharing,
facilitating trade and payments among economic agents and providing various supporting
services. Efficient financial intermediation channels savings into the most productive
investment projects, and thus contribute to higher rates of aggregate growth. Conversely,
inefficient intermediation may reduce the allocative efficiency of resources, which ultimately

could result in lower rates of aggregate growth. However, a well-functioning system of
financial intermediation can also affect economic growth indirectly through its positive impact
on the level of national savings, by allowing the mobilization and channelling of larger amounts
of resources into productive use given the conventional wisdom, that capital accumulation
drives growth. Under these assumptions, an initial rise in the level of national savings may
drive the economy to a more stable equilibrium of higher growth.
In the period 2000/01 to 2008/09, Uganda continued to enjoy notable improvements in social
and economic well-being. The Ugandan economy experienced robust 7.0percent growth in
2008/09, rebounding from the slowdown in 2005/06. Economic growth was driven mainly by
good performance in the services sector, which registered a 9.5 percent growth rate compared to
5.8 percent growth for industry and 2.6percent for agriculture (Table 1). Albeit this impressive
growth rate, Uganda’s savings rates remain very low compared to its investment needs. The
Savings to GDP ratio has staggered between 5 and 15 percent.
There are various reasons to make a case for enhancing domestic resource mobilization
in Uganda:
• Domestic resources help the country to mitigate the adverse impact of volatility
and uncertainty in aid flows. Volatility and uncertainty in aid flows make budget
management difficult (Bul r and Hamann, 2007). Domestic revenue, on the other
hand, is more stable and predictable which facilitates medium-term fiscal
planning, and can help ensure that resources are allocated to priority sectors as
well as helping to ensure that the allocations are effectively translated into
outcomes;
• Increasing domestic resources creates additional fiscal space for supporting high-
priority spending which allows a country to maintain spending consistent with its
policy priorities when aid is reduced or phased out. Projects financed by aid give rise to
additional spending, such as on operations and maintenance. More often than not, aid

donors require that these additional expenditure be covered at least partly, if not wholly,
from domestic resources;
• Dependency on trade taxes will continue to reduce with globalization (and the
associated liberalization of trade regimes), formation of free trade areas and customs
unions, and agreements with other regional blocks like the European Union. This means
that strengthening the domestic revenue base is required to cover the losses from trade
taxes. This is particularly the case where the East African Customs Union comprising of
five countries has now been implemented;
• Similarly, as countries compete more aggressively to attract foreign investment, there
are forced to reduce corporate income tax rates to remain competitive. This implies that
the tax base needs to be broadened to minimize impact on tax revenue. This is
particularly so with the generous tax incentives often provided to attract
foreign investors;
• High dependency on scaled-up external inflows presents a challenge in that it can result
in real exchange rate appreciation which can negatively impact on exports and
competitiveness. More domestic revenue presents less risk of Dutch disease effects; and
• Finally, taxation increases incentives for public participation in the political process and
creates pressure for more accountability, better governance, and improved efficiency of
government spending. It fosters awareness to limit rent seeking (that is, lobbying for tax
breaks or protection from foreign competition) in public policy by interest groups.
Taxation also creates incentives for governments to upgrade their institutions for tax
collection and administration and to provide more public services (Moore, 2007);
This paper attempts to highlight the key binding constraints for the public and private sector to
mobilize resources in Uganda. For the public sector, the main constraints identified include: (i)
low incomes and widespread poverty; (ii) large informal sector which is difficult to tax; (iii)
large agricultural sector which is untaxed; (iv) corruption amongst tax collecting agencies; and
(v) generous investment incentive structures. On the other hand, the financial sector remains
constrained as a conduit for financial intermediation owing to the following factors: (i)
undeveloped financial markets with limited financial products; (ii) uncompetitive banking
system with limited penetration in rural areas; (iii) short maturity structure of most financial
products; and (iv) high interest rate spreads.
The key recommendations of the paper include, first, a series of measures to improve the
taxation system and enlarge the tax base by: (i) tapping on the informal sector to widen the tax
base; (ii) complete rationalization of tax incentives; (iii) implementation of the National Identity
Card; (iv) implementation of the presumptive taxes; (v) introduction of a property tax; and (v)
further simplification of the tax system. Second, for the financial sector to be an efficient conduit
of financial intermediation, the following measures could be implemented: (i) strengthening
and expanding financial institutions and markets especially in rural areas; (ii) increase
availability of development finance for investors in priority sectors of the economy; (iii)
encourage opening of alternative sources of long term capital; (iv) develop mortgage financing
to encourage collateralization of loans and mobilization of savings, strengthen the Credit
Reference Bureau (CRB); (v) modernize the land and company registries as a means of
hastening the process of extending credit; and (vi) implementing the pension reform act which
would entail making the sector more competitive and provide long-term financing for the
financial sector.
The rest of the paper is structured as follows. Section 2 provides an overall background of the
Ugandan economy. Section 3 provides a historical perspective of how Uganda has performed in
mobilizing savings. Section 4 gives a summary of the status of the financial sector. Section 5
focuses on public sector revenue mobilization and taxation policy in Uganda. Sections 6 and 7
provide the binding constraints to savings mobilization and the available opportunities to
generate higher savings respectively. Section 8 concludes the paper.

2 Background to the Ugandan Economy
2.1 Growth Performance
The period 1990-2008 can be divided into two distinctive growth episodes. :one from
1990-1999 and the other 2000-2008. The 1990 to 1999 phase was characterized by
sustained positive growth rates far above the sub-Saharan average. At an average
growth rate of 3.6 per cent, Uganda’s per capita income (measured in 1985 international
prices) recovered from US $ 504 in 1986 and had reached US $ 697 by 1997. The Uganda
Bureau of Statistics (UBOS) estimates trend growth over this period at about 6.8 percent
per year with all sectors of the economy growing relatively fast during the period
1990-1999.
Similarly, the period 2000-2008 was very impressive. For example, estimates by UBOS show that average
GDP growth rate (at factor prices) for the five years( 2003/04-2007/08) was as high as 7.9 per cent, with
the economy posting a growth rate of 8.9 per cent in 2007/08. But the economy grew only at 6 percent in
real terms in 2008 due to the turmoil in the world economy and regional instability. The global recession
had a marginal impact on the economy mainly through (i) reduction in foreign financial inflows
including aid, grants, foreign direct investment and remittances; (ii) depreciation of the exchange rate (as
a result of (i)); (iii) changes in exports to the region, and; (iv) changes in exports of goods that are
exported beyond the region. Consequently, growth slowed in 2009/10 to about 5.8 per cent given this
combination of internal and external shocks.
Fig.1: Uganda’s Recent Economic Trends
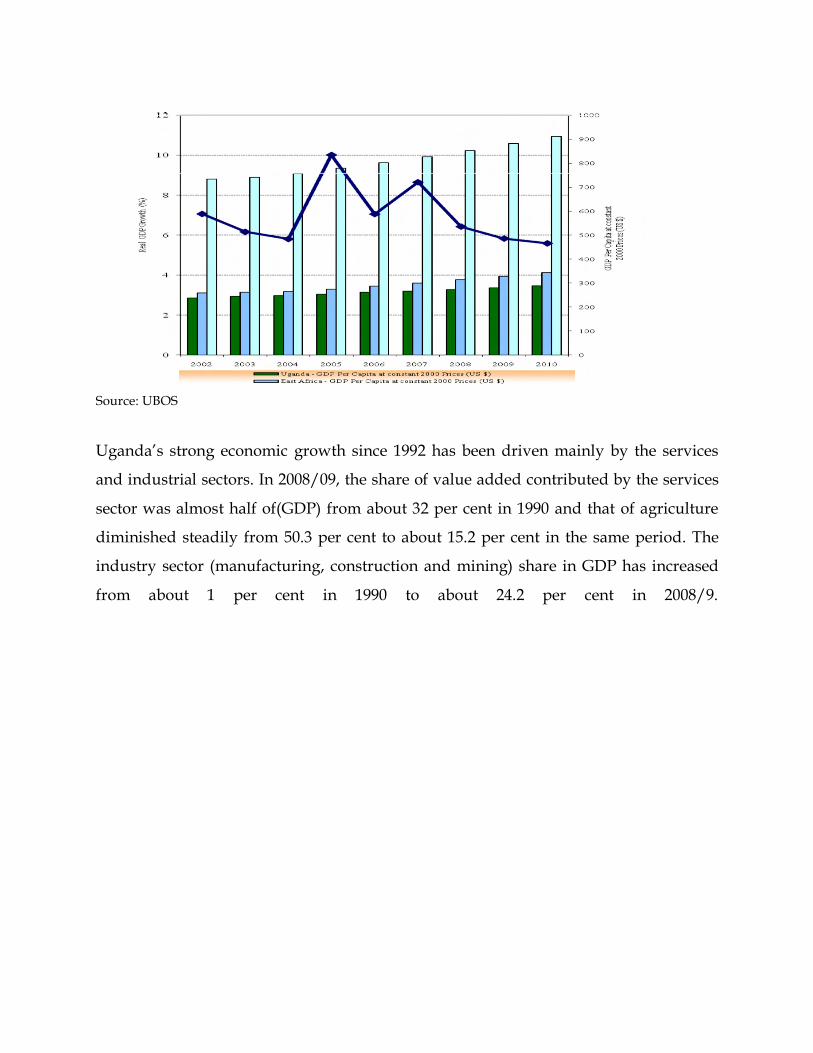
Source: UBOS
Uganda’s strong economic growth since 1992 has been driven mainly by the services
and industrial sectors. In 2008/09, the share of value added contributed by the services
sector was almost half of(GDP) from about 32 per cent in 1990 and that of agriculture
diminished steadily from 50.3 per cent to about 15.2 per cent in the same period. The
industry sector (manufacturing, construction and mining) share in GDP has increased
from about 1 per cent in 1990 to about 24.2 per cent in 2008/9.

Table 1: Sectoral contributions to growth (percent)
Source: UBOS
This was mainly as a result of the slowdown in the construction sector due to the drop
in remittances that had hitherto fuelled a construction boom in the country. This
slowdown was also due to the increase in imported inputs arising from the depreciation
of the Uganda shilling. With the high growth rates, the proportion of Ugandans living
below the absolute poverty line declined from 56 per cent in 1992/93 to 31 per cent in
2005/06 (Ssewanyana and Okidi, 2007). On the contrary inequality of income increased
by 11.8 per cent during the same period.
2.2 Government and/or non-financial public sector accounts
Due to the turbulences that characterized most of post-independence Uganda, tax
collections have historically been low. For example, the tax to GDP ratio that stood at
12.6 per cent in 1970-71, had declined to a dismal 6.5 per cent by 1989/90, leading to
large deficits and a budget mainly funded by external financing (Ayoki et.al. 2004).
Revenue performance has since improved, peaking at a tax/GDP ratio of 15.8 per cent
in 2006/07 before declining slightly to 13.1 per cent in 2008/09 (UBOS). This is still
below the Sub-Saharan Africa average of about 20 per cent and is lower than that of its
neighbours. In Tanzania, tax revenue was about 17 per cent of GDP and about 27 per
cent in Kenya in 2008/09.
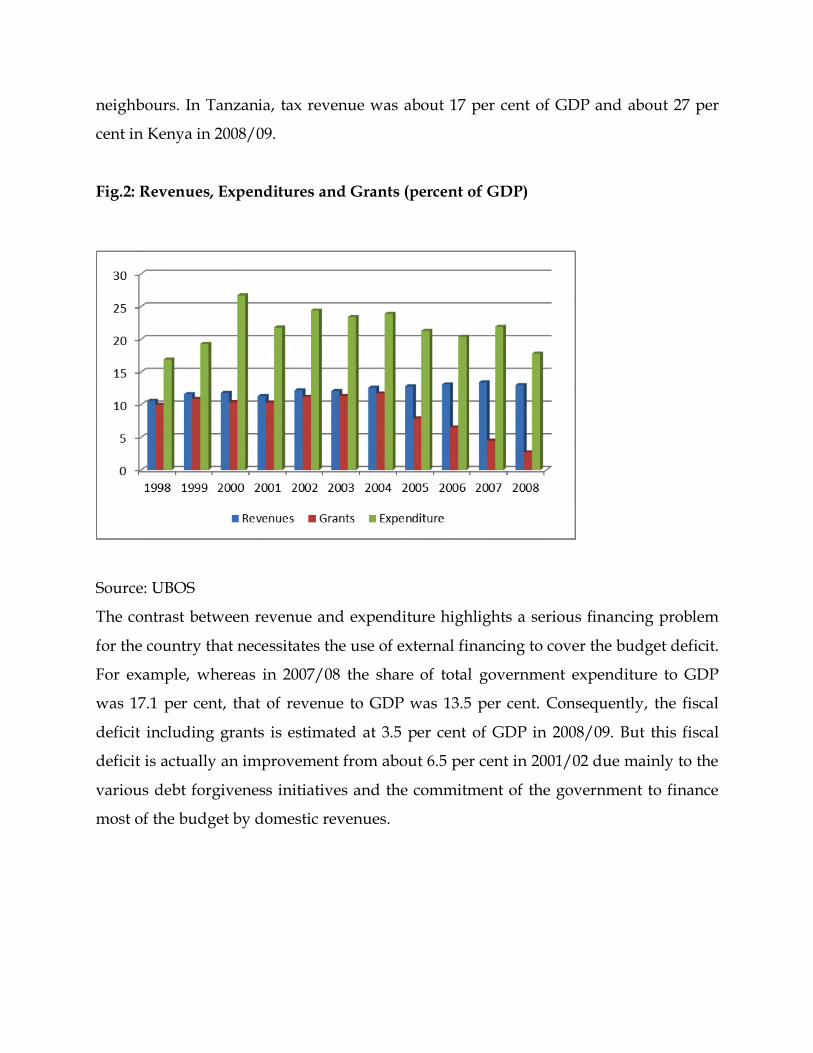
Fig.2: Revenues, Expenditures and Grants (percent of GDP)
Source: UBOS
The contrast between revenue and expenditure highlights a serious financing problem
for the country that necessitates the use of external financing to cover the budget deficit.
For example, whereas in 2007/08 the share of total government expenditure to GDP
was 17.1 per cent, that of revenue to GDP was 13.5 per cent. Consequently, the fiscal
deficit including grants is estimated at 3.5 per cent of GDP in 2008/09. But this fiscal
deficit is actually an improvement from about 6.5 per cent in 2001/02 due mainly to the
various debt forgiveness initiatives and the commitment of the government to finance
most of the budget by domestic revenues.

Fig. 3: Budget deficit including and excluding grants (per cent of GDP)
Source: UBOS
2.3 Domestic borrowing and debt
After the diminishing concerns over external debt due to the various debt forgiveness
initiatives including Highly Indebted Poor Countries (HIPC) initiative and Multilateral
Debt Relief Initiative (MDRI), concern has been rising about the level of domestic debt
which according to the Bank of Uganda, had increased to US$ 1.1 billion by June 2007
from about US$ 177 million in June 2000. The main reason for this high domestic debt is
its use as an instrument for providing resources for monetary policy management to
maintain macroeconomic stability, but which has put a high fiscal cost on the treasury.
In response, the government has come up with specific debt sustainability benchmarks
that will guide its undertaking domestic borrowing. These include limiting both
domestic debt stock to GDP and domestic interest cost to total domestic revenue
(excluding grants) ratios to less than 15 per cent, domestic debt stock to total private
credit at less than 100 per cent, and to make sure the borrowing does not jeopardise the
country’s efforts at improving its sovereign rating to above the B+ that the country is
now enjoying.
2.4 External borrowing and debt
On external financing, the government has been trying to limit the share of the budget financed by
donors, either through grants or procurement of more debt. Consequently in spite of the increase in the
overall budget, the percentage of the budget, financed by external resources has decreased from about 72
per cent in 1999 to 33 per cent in 2008. The percentage of debt to GDP has consistently declined from a
high of about 63.7 per cent in 2003 to an estimated 12.5 per cent in 2008. The government at the end of the
year 2007 put in place a new debt strategy that broadens the one that had been in operation since 1995, by
including domestic arrears and public domestic borrowing. Under the external debt strategy, the
government has decided to give grants priority over loans, and to strictly adhere to concessional terms,
limit borrowing to only five priority areas especially in infrastructure, and to set a 5-year borrowing cap.
In addition the government decided that debt should be aligned with absorptive capacity and availability
of government counter-funding. Since the government has a Medium Term Expenditure Framework
(MTEF), the intention is to make sure that all the borrowing is within the MTEF limits and that there is
enough absorption capacity for the resources. But as noted above, due to a number of debt forgiveness
initiatives, the country’s debt obligations have recently gone down. Consequently, the percentage of debt
to GDP has decreased from about 61 per cent in 2002 to about 12 per cent in 2008 (Fig. 5)
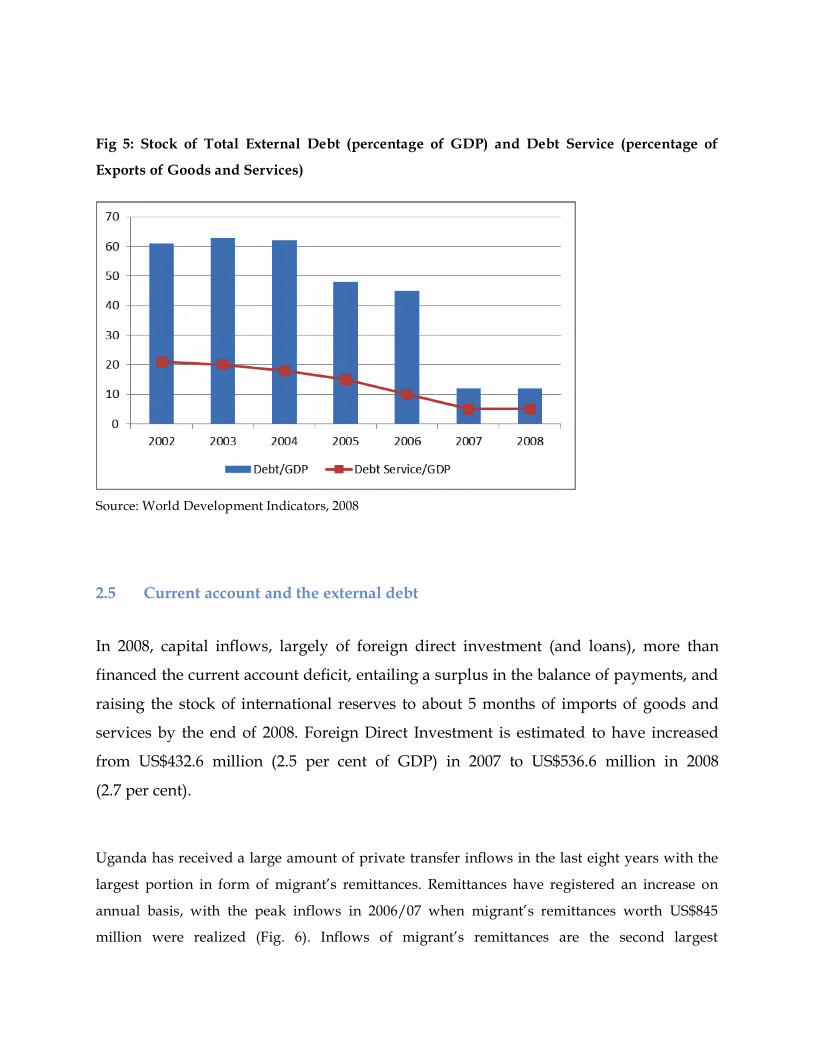
Fig 5: Stock of Total External Debt (percentage of GDP) and Debt Service (percentage of
Exports of Goods and Services)
Source: World Development Indicators, 2008
2.5 Current account and the external debt
In 2008, capital inflows, largely of foreign direct investment (and loans), more than
financed the current account deficit, entailing a surplus in the balance of payments, and
raising the stock of international reserves to about 5 months of imports of goods and
services by the end of 2008. Foreign Direct Investment is estimated to have increased
from US$432.6 million (2.5 per cent of GDP) in 2007 to US$536.6 million in 2008
(2.7 per cent).
Uganda has received a large amount of private transfer inflows in the last eight years with the
largest portion in form of migrant’s remittances. Remittances have registered an increase on
annual basis, with the peak inflows in 2006/07 when migrant’s remittances worth US$845
million were realized (Fig. 6). Inflows of migrant’s remittances are the second largest

contributor of the country’s foreign exchange inflows after exports of goods and have
contributed significantly towards offsetting the large deficit on the trade balance. The large
inflows of migrants remittances have made up for the large growth in private sector imports of
general merchandise which has grown in leaps and bounds over the same period by providing
the much needed foreign exchange to meet some of the countries import requirements.
Fig. 6: Remittances Received (US$ Millions)
Source: Bank of Uganda
2.6 Uganda and Foreign aid
Uganda receives most of its Official Development Assistance (ODA) from multilateral
organisations (80.4 per cent of total debt owed in 2006/07) with the three main donors
owed being the International Development Agency (IDA) of the World Bank (50.4 per
cent of total debt), the African Development Bank (8.4 per cent), and the European
Investment Bank (7.6 per cent), in that order. “Non-traditional Donors” that are
becoming important as sources of ODA for Uganda include India (1.7 per cent of total
debt in 2006/07) and China (1.3 per cent), although the country still owes some other
countries long overdue debt obligations, like Tanzania, Libya and Kuwait. Debt
obligations to the Paris Club have sharply declined since the country was forgiven most
of the debt owed to the club in 2000 under the extended HIPC. In addition to the
traditional donors, the country receives a large amount of transfers from other donors
like the NGOs, and other project funds that often are hard for the Bank of Uganda
(BOU) to follow and quantify. To go around this, the country recently established the
Basket Fund in which all the donors channel their donations in order to be sure that
they are covered by MTEF..
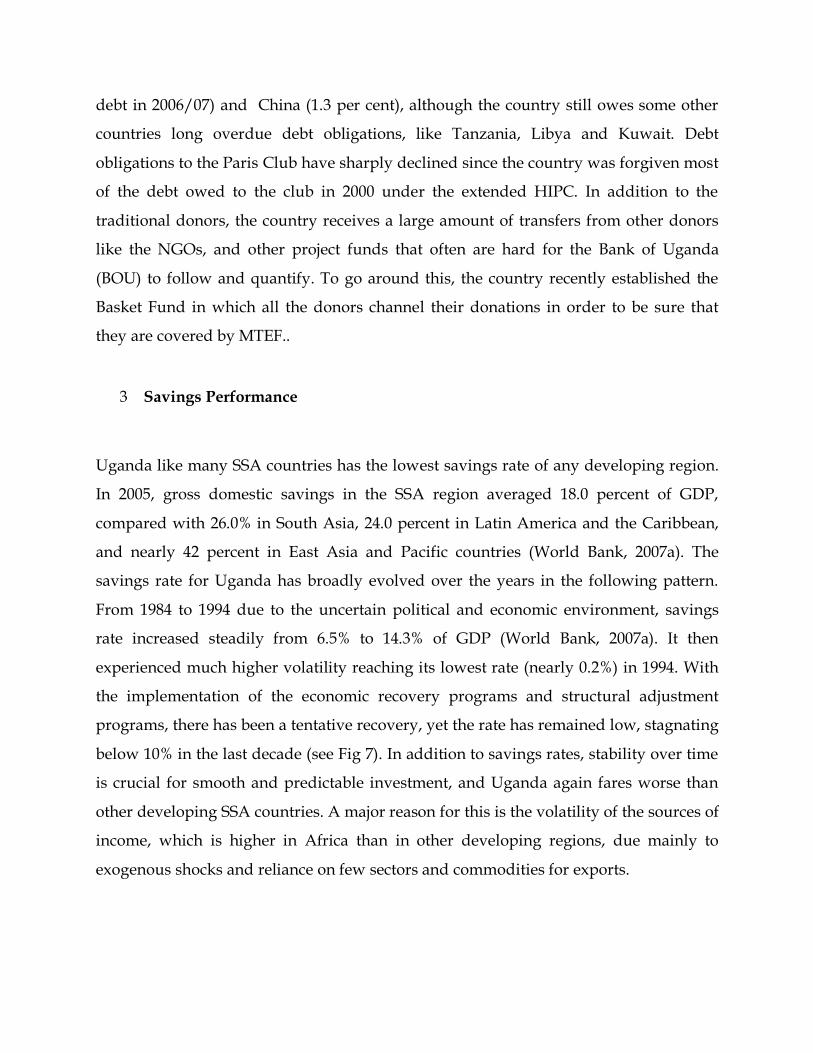
3 Savings Performance
Uganda like many SSA countries has the lowest savings rate of any developing region.
In 2005, gross domestic savings in the SSA region averaged 18.0 percent of GDP,
compared with 26.0% in South Asia, 24.0 percent in Latin America and the Caribbean,
and nearly 42 percent in East Asia and Pacific countries (World Bank, 2007a). The
savings rate for Uganda has broadly evolved over the years in the following pattern.
From 1984 to 1994 due to the uncertain political and economic environment, savings
rate increased steadily from 6.5% to 14.3% of GDP (World Bank, 2007a). It then
experienced much higher volatility reaching its lowest rate (nearly 0.2%) in 1994. With
the implementation of the economic recovery programs and structural adjustment
programs, there has been a tentative recovery, yet the rate has remained low, stagnating
below 10% in the last decade (see Fig 7). In addition to savings rates, stability over time
is crucial for smooth and predictable investment, and Uganda again fares worse than
other developing SSA countries. A major reason for this is the volatility of the sources of
income, which is higher in Africa than in other developing regions, due mainly to
exogenous shocks and reliance on few sectors and commodities for exports.

Fig. 7: Total Savings, Investments and the Current Account
Source: UBOS
The capacity to save is mainly determined by income level, rate of income growth and the
dependency ratio, i.e. the ratio of population under 16 or above 60 years old to that of the
working-age population (Loayza et al., 2000). Willingness to save, meanwhile, is believed to
depend on the ease of access to savings instruments, the attractiveness of such instruments and
the prevailing economic conditions (Wright, 1999). Gross savings rates provide a useful insight
into the general picture of savings in a national economy. Fig. (8a and 8b) provides a glimpse of
the composition of private and public savings and the corresponding investment levels. While
private savings have been on the increase, they are way below the required investments. This is
also coupled with the fiscal deficits run by the country.
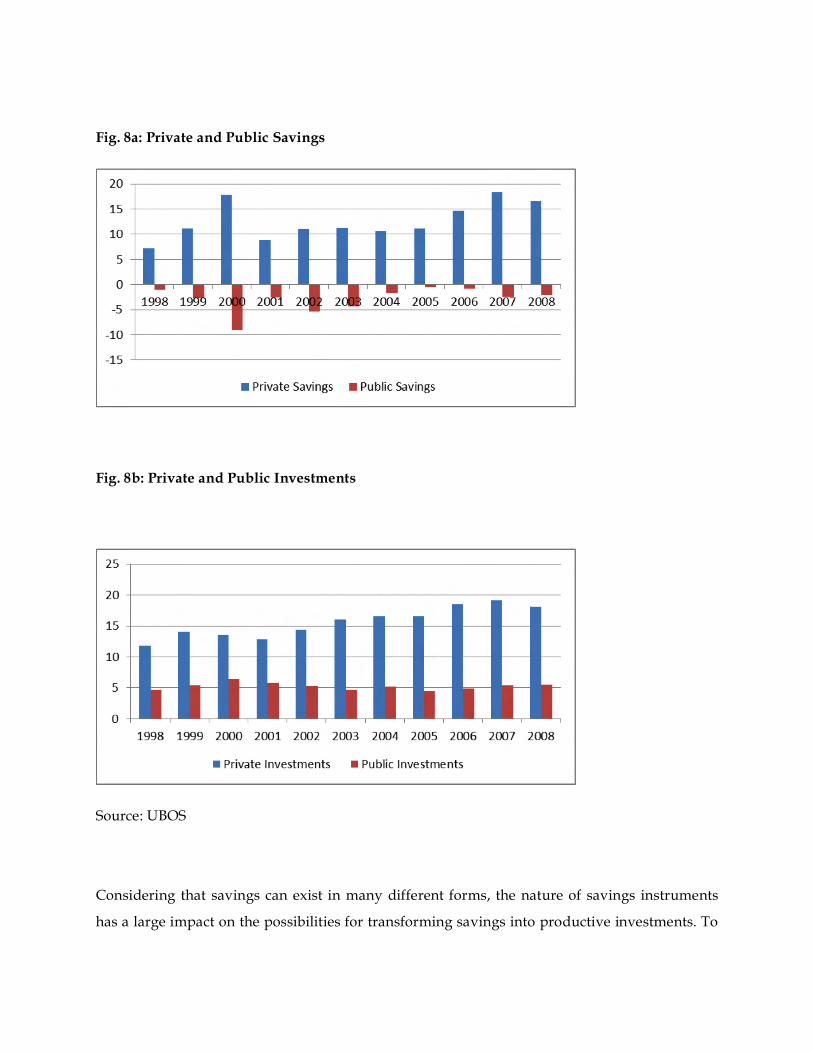
Fig. 8a: Private and Public Savings
Fig. 8b: Private and Public Investments
Source: UBOS
Considering that savings can exist in many different forms, the nature of savings instruments
has a large impact on the possibilities for transforming savings into productive investments. To

understand the nature of savings and their relation to investment, it is necessary to look into the
details of saving options and choices at the household and firm levels.
3.1 Household Savings
Saving as a precaution implies that even at low disposable income levels and in the
absence of attractive savings instruments, poor households need to save a substantial
part of their income. This kind of precautionary saving is the main motivation for
household saving in Uganda. Savings instruments for households fall into non-financial
savings, informal financial savings, formal financial savings and semi-formal financial
savings. The composition of the household savings portfolio determines the availability
of funds for investment, and is therefore relevant to a country’s development.
Generally, household savings consist mainly of physical assets and some financial
savings held in the informal financial sector. Thus, only a small part is available for
productive investment. Understanding why and how households save, especially
poorer households, can help to identify policies that increase the amount of resources
available for development. Households, especially in rural areas, rely on volatile income
sources. In the absence of accessible credit and insurance services, drawing on saved
assets is a necessary strategy for households to smooth their consumption patterns
(Deaton, 1990; Dercon, 2002).
3.2 Non-financial Savings
Generally, households often hold considerable diverse portfolios of non-financial assets,
such as livestock, stocks of goods for trading, grain and construction materials that are
acquired as stores of wealth, and are often bought or sold in such a way as to smooth
consumption patterns. While the evidence is limited, studies suggest that non-financial
assets represent around 80 per cent of all household assets in rural areas (Aryeetey and
Udry, 2000). The accumulation of non-financial assets as saving instruments, however,

can reflect rational portfolio decision in a context of high risk, uncertain financial
environment and lack of access to adequate financial instruments. In this way, an
improvement in access, adequacy and reliability on the part of the financial sector could
trigger an increase in savings held in a financial form through substitution from non-
financial to financial saving instruments.
3.3 Informal financial savings
This is another form of savings that can be undertaken through a wide range of saving
instruments, from simple deposit collection to large, self-organized saving groups and
saving pools. Mostly, savings tend to be made in small but frequent deposits that
correspond to the needs of households and small businesses. Problems of access and
reliability are limited in comparison to the formal financial sector as informal financial
institutions operate in geographically and socially confined community settings
(Nissanke and Aryeetey, 2006). In contrast to the formal financial sector, it is rare for
informal sector savings to accrue interest. In Uganda, there is a recent drive to
encourage people joining Savings and Credit Organisations commonly referred to as
SACCOS. Resources mobilized through saving in the informal sector are generally not
used for further investment and therefore tend not to generate any income. In most
cases therefore, depositors are required to pay for the saving service. The fact that
poorer households save despite receiving what are in effect negative interests is
testimony to the importance of saving services for poorer households and to the
willingness of such households to save. Households in Africa tend to combine a number
of saving instruments with different institutions, offering different deposit and
withdrawal conditions. This helps them spread default risk and meet their changing
need for financial resources (Wright, 1999).

3.4 Formal financial savings
The savings held in Uganda's formal financial sector generally represent a small
proportion of household assets. This reflects the difficulties in access to formal saving
instruments and, more importantly, the lack of trust in formal financial institutions, as
well as the inadequacy of formal saving instruments to fulfill the savings needs of
poorer households. In practice, banks are the principal type of formal financial
institutions engaging in savings mobilization under the supervision of the BOU.
Physical distance from banking institutions is not the only limiting factor to the growth
of formal financial savings. High minimum deposit and balance requirements, the time
that it takes to make transactions and the administrative work involved also discourage
depositors. Furthermore, the reluctance of banks to provide credit to poorer households
and small businesses lessens the incentive to save in the formal sector (Wright, 1999). A
study by Okurut et.al (2004) suggests providing incentives to Micro Finance Institutions
so that they can extend services to the rural population.
In addition, with increased access to mobile phones, technology may be able to overcome some
of the remoteness and processing-cost barriers to providing services to poor and rural areas.
The mobile phone penetration is currently estimated at 40 percent and expected to be more than
70 percent in 2014. Mobile phone banking enables banks to provide basic financial services to
poor people, including in rural areas. Though it is only a recent development, mobile phone
banking is already reaching thousands of customers in Uganda.
3.5 Semi-formal financial savings
The semi-formal financial sector specializes in providing financial services to
households and small businesses that do not have access to formal financial institutions.
This sector is made up of institutions that, while legally registered, are not regulated as
banks. These institutions mainly provide loans at very high interest rates and
sometimes keep deposit for clients illegally. While this semi-formal sector could become
an important factor in savings mobilization for households, its coverage is at present
too limited to respond effectively to the financial needs of many households in Uganda.
The semi-formal sector, however, holds great potential in terms of improved savings
mobilization. Indeed, if semi-formal institutions succeed in offering safe and reasonably
liquid savings instruments that generate positive returns for many households, there
could be a substantial increase in financial savings available for profitable investments
due to reallocation from both nonfinancial assets and financial assets currently held in
the informal sector.
In sum, the choice of saving instrument reflects issues of access, reliability and relevance of
available saving instruments to meeting households saving needs. The financial requirements of
households therefore call for safe saving instruments that allow small transactions at frequent
intervals. The very high proportion of non-financial assets in household savings portfolios
suggests that the financial sector is currently not adequately fulfilling these needs.
4 Financial Markets and Intermediation
Financial intermediation provides the crucial link between savings and investment. A
well-functioning financial system should be able to mobilize resources effectively and
allocate them to the most productive investment opportunities. Without effective
financial intermediation, the incentive to hold financial savings is depressed and
investment tends to concentrate in the sectors in which the savings take place, which
may not be the most productive. As a result, there are fewer resources mobilized and
these are allocated to less productive investments.
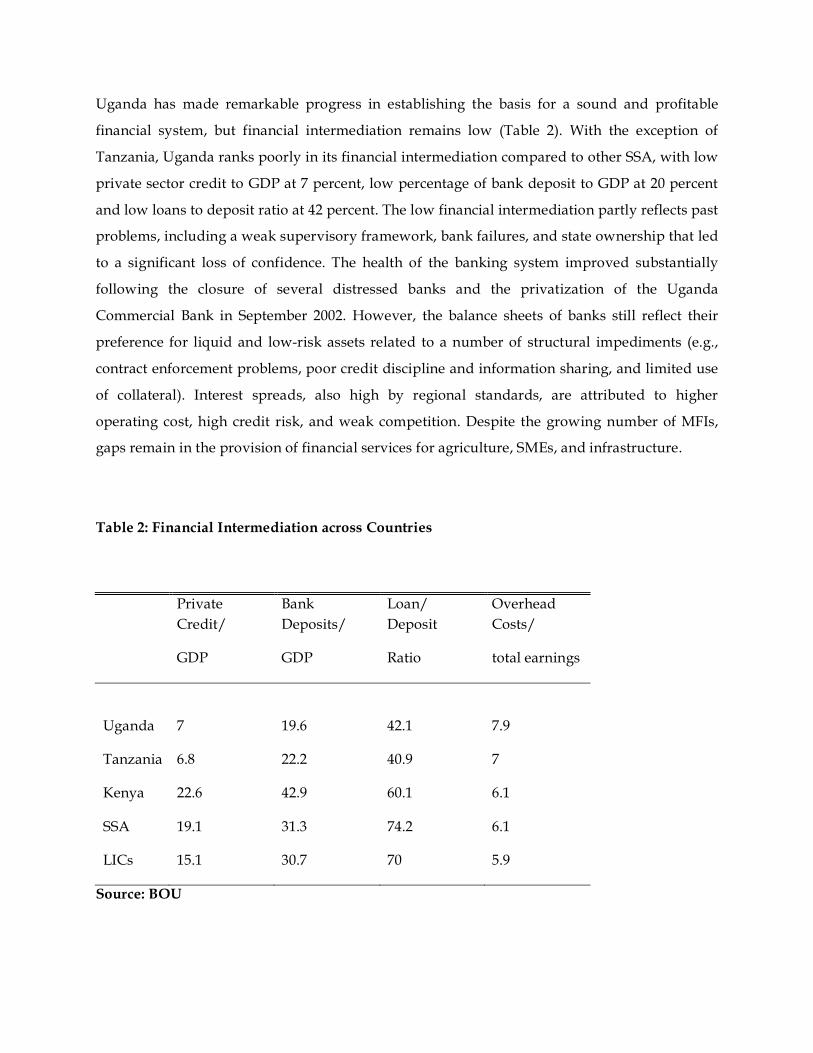
Uganda has made remarkable progress in establishing the basis for a sound and profitable
financial system, but financial intermediation remains low (Table 2). With the exception of
Tanzania, Uganda ranks poorly in its financial intermediation compared to other SSA, with low
private sector credit to GDP at 7 percent, low percentage of bank deposit to GDP at 20 percent
and low loans to deposit ratio at 42 percent. The low financial intermediation partly reflects past
problems, including a weak supervisory framework, bank failures, and state ownership that led
to a significant loss of confidence. The health of the banking system improved substantially
following the closure of several distressed banks and the privatization of the Uganda
Commercial Bank in September 2002. However, the balance sheets of banks still reflect their
preference for liquid and low-risk assets related to a number of structural impediments (e.g.,
contract enforcement problems, poor credit discipline and information sharing, and limited use
of collateral). Interest spreads, also high by regional standards, are attributed to higher
operating cost, high credit risk, and weak competition. Despite the growing number of MFIs,
gaps remain in the provision of financial services for agriculture, SMEs, and infrastructure.
Table 2: Financial Intermediation across Countries
Private
Credit/
Bank
Deposits/
Loan/
Deposit
Overhead
Costs/
GDP GDP Ratio total earnings
Uganda 7 19.6 42.1 7.9
Tanzania 6.8 22.2 40.9 7
Kenya 22.6 42.9 60.1 6.1
SSA 19.1 31.3 74.2 6.1
LICs 15.1 30.7 70 5.9
Source: BOU
4.1 Formal Financial Intermediaries
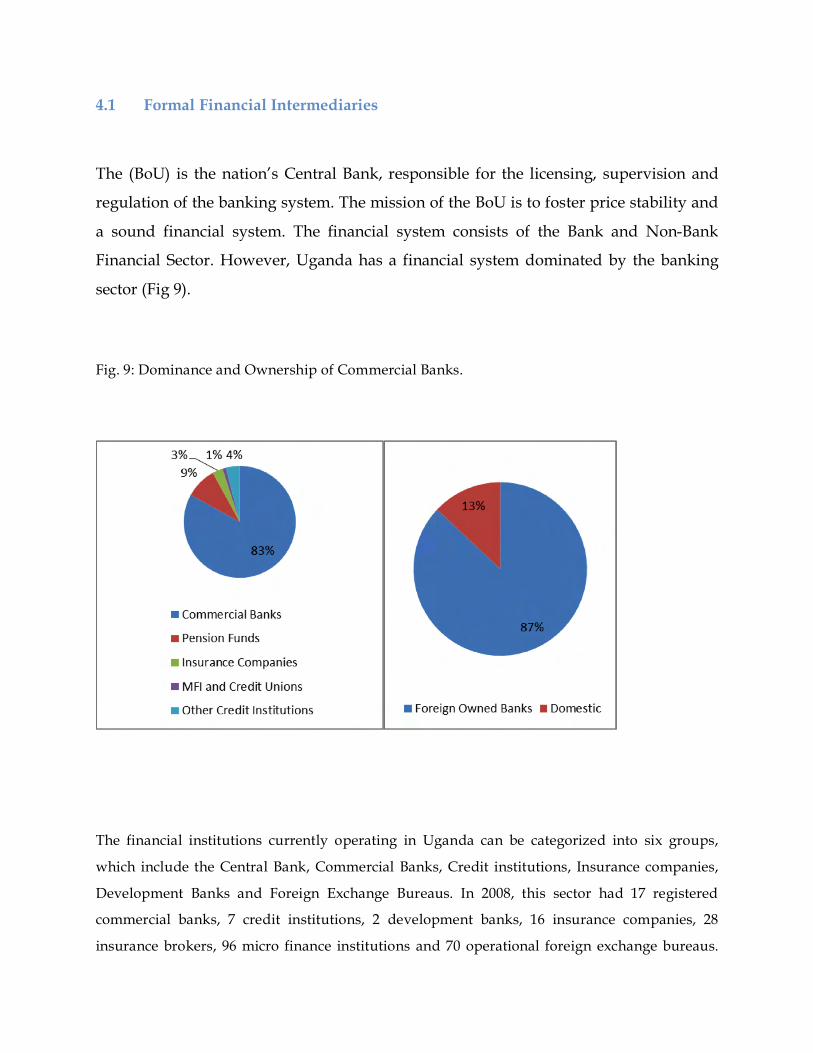
The (BoU) is the nation’s Central Bank, responsible for the licensing, supervision and
regulation of the banking system. The mission of the BoU is to foster price stability and
a sound financial system. The financial system consists of the Bank and Non-Bank
Financial Sector. However, Uganda has a financial system dominated by the banking
sector (Fig 9).
Fig. 9: Dominance and Ownership of Commercial Banks.
The financial institutions currently operating in Uganda can be categorized into six groups,
which include the Central Bank, Commercial Banks, Credit institutions, Insurance companies,
Development Banks and Foreign Exchange Bureaus. In 2008, this sector had 17 registered
commercial banks, 7 credit institutions, 2 development banks, 16 insurance companies, 28
insurance brokers, 96 micro finance institutions and 70 operational foreign exchange bureaus.
The banking sector is also characterized by a high degree of foreign ownership. The largest
bank, the successor to the state-owned Uganda Commercial Bank, was purchased by a South
African bank in 2002. Three other foreign banks account for approximately 75 percent of
Uganda’s banking sector assets. A deposit insurance fund with contributions from the central
bank and commercial banks has recently been created, though its soundness is largely untested
to date.
In 2005, there were also 7 savings and loan institutions and over 100 micro-finance institutions.
Despite their large number, micro-finance institutions accounted for only 1% of the financial
sector, while other nonbank financial institutions accounted for 7% (2005). The insurance sector
remains a small part of the financial system. There were 15 licensed insurance companies in
2006, all under the supervision of the Uganda Insurance Commission (UIC), a regulatory and
supervisory authority for the insurance industry in Uganda. Some recent developments include
the planned privatization of the National Insurance Company and the creation by the Uganda
Insurers Association of a reinsurance company.
With lack of definite policy directions and regime change, Uganda's financial system had for a
long time been characterized by several distortions in terms of statutory interest rate ceilings,
directed credit, accommodation of government borrowing, exchange controls and informal
modes of intermediation. The formal financial sector was also concentrated by two domestic
commercial banks with excessively large branch networks and high overhead costs. In addition,
securities, equities and inter-bank markets were either non-existent or operating inefficiently.
Other constraints included deficiencies in the management, regulation and supervision of
financial institutions and a low level of central bank autonomy. The economy also suffered
political and social upheavals, as well as high inflation rates. The combination of these factors
created an uncompetitive and inefficient financial system, and impeded monetary control and
policy conducive for profitable trade and economic growth.
The limitations of the financial sector in mobilizing and efficiently allocating domestic savings
to most profitable investment opportunities in Uganda is a major concern. During the
adjustment period, monetary policy has been successful in containing inflation. Reforms in the
financial system to enhance financial intermediation, however, have been one of the key
weaknesses in the adjustment period. Uganda's economy is significantly un-monetized, with a
large ratio of currency in circulation to deposits. Rural financial markets remain effectively
undeveloped and because of the high costs of intermediation, interest rate spreads are high.
Moreover, term lending continues to be difficult and inadequate to finance investment in
agriculture.
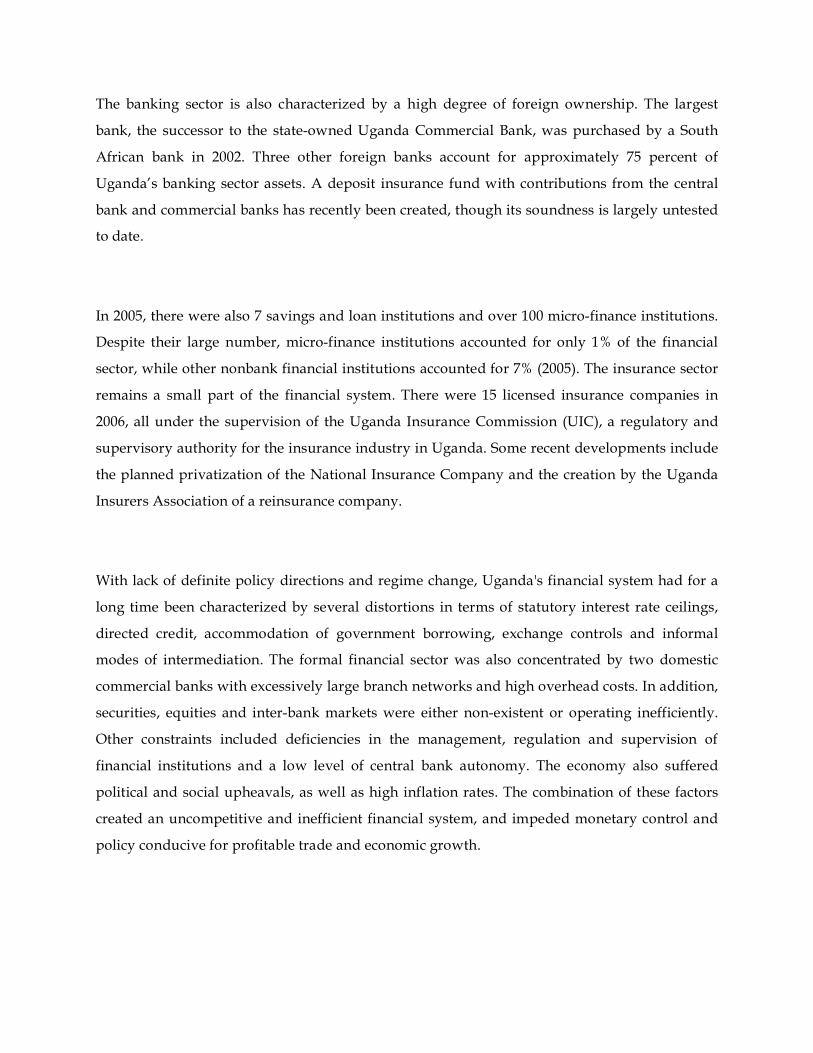
Fig 10 demonstrates that financial intermediation in Uganda is still weak with 70 percent of
financial assets only concentrated in the largest four banks which are mainly concentrated in the
urban areas. The four largest banks also take a share of 71 percent of the total deposits.
Fig. 10: Concentration of Assets and Share of Deposits
Source: Bank of Uganda
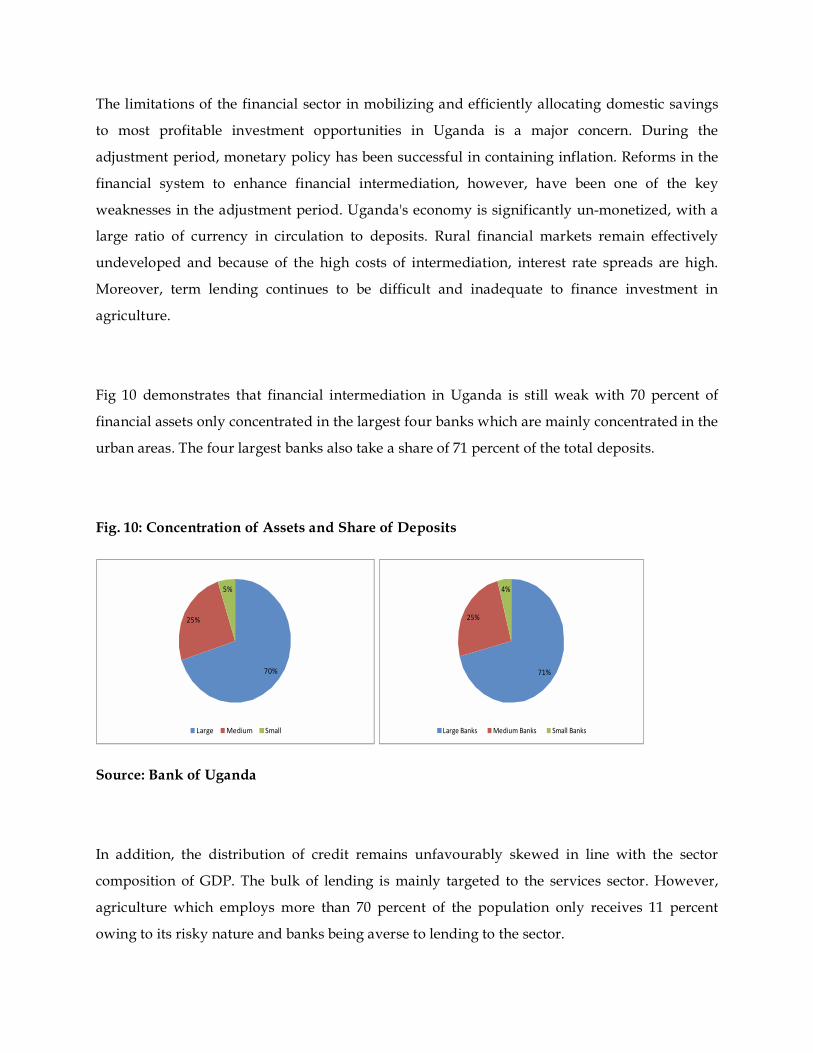
In addition, the distribution of credit remains unfavourably skewed in line with the sector
composition of GDP. The bulk of lending is mainly targeted to the services sector. However,
agriculture which employs more than 70 percent of the population only receives 11 percent
owing to its risky nature and banks being averse to lending to the sector.
Fig. 11: Distribution of Credit by Sectors
Source: Bank of Uganda
Most of the banks are also largely involved in short-term lending due to the lack of long-term
financing. This is partly related to the underdeveloped and not well regulated pension sector
which can partly provide long-term financing. Partly due to the high interest rates offered on T-
bills, Banks have resorted to buying treasury bills which are considered to be risk free. This to
an extent also has tended to crowd out the available financing for the private sector.
Fig. 12: Maturity of Bank Assets Income Distribution of Banks

Source: Bank of Uganda
Interest rate spreads are high by regional standards and are mainly explained by overhead
costs, credit risk, and weak competition. Interest rate spreads represent the difference between
the weighted average lending rate and the weighted average deposit rates are about 20
percentage points at present. Operating costs explain about 50 percent of the spread, and profits
are the second largest component with 30 percent of the overall spread. Ugandan banks have
higher overhead costs than comparable banks in Kenya, partly because they do more outreach
and have recently invested in physical infrastructure, such as branches and ATMs.
Cross-country comparisons show that smaller banks have higher overhead costs because they
find it difficult to exploit economies of scale and scope. This is confirmed by a significant
positive correlation between the share of deposits and loans below US$ 1,500in total deposits
and loans and overhead costs, as well as the relatively low ratio of loan and deposit volume per
branch in Uganda. While the 2% points in the spread explained by loan loss provisions can be
directly attributed to this high credit risk, the high overhead costs and the high profit margin
can also be partly explained by high credit risk, as banks incur high evaluation, monitoring, and
enforcement costs. The high interest spread and profit margin may also reflect weak
competition. A lack of sharing of credit information on borrowers increases credit risks for
banks and reduce competitive pressures.
Uganda has made some progress in expanding outreach and access to financial services to its
population. Branches of financial institutions of tiers 1 to 3 exist in 51 districts in the country,
with a population per branch of about 87 thousand.1 The FSAP update estimated the total
number of deposit accounts held in financial institutions (tiers 1 through 4) to be just over 1.7
million, or about 35 percent of households. The inclusion of 80 entities from tier 4 (together
accounting for a large majority of the tier 4 markets) adds only about 150 thousand deposit
accounts and 85 thousand loans. The new Micro-Finance Deposit-Taking Institutions Act, 2003
and nurturing the transformation of MFIs into tier 3 institutions should further encourage rural
financial intermediation.
Gaps remain, however, in the provision of financial services to rural areas, and in financing
SMEs, agriculture and infrastructure. Although the coverage of deposit accounts as a
proportion of the total number of households is relatively large as reported above, the use of
deposit and payment services could be substantially expanded. Moreover, only about 11
percent of bank credit is reported as being allocated to agriculture, a more acute level of credit
1 Tier 1 includes all commercial banks; Tier 2 are credit institutions; Tier 3 are regulated microfinance institutions
and; Tier 4 are unregulated financial institutions.

rationing to the sector than in most other countries, given the large contribution of agriculture
to GDP.
The development of stock markets is necessary to achieve full efficiency of capital allocation if
the government is to liberalize the financial system. This is because if the financial market is
composed of banks only, the market will fail to achieve efficient allocation of capital because of
the shortcoming of debt finance in the presence of asymmetric information (Guglielmo et al.,
2004). Banks finance only well-established and safe borrowers but, stock markets can finance
risky, productive and innovative investment projects. Thus, the primary benefit of a stock
market is that it constitutes a liquid trading and price determining mechanism for a diverse
range of financial instruments. This allows risk spreading by capital raisers and investors and
matching of the maturity preferences of capital raisers and investors both in the short-term and
long term. This in turn stimulates investment and lowers the cost of capital, contributing in the
long term to economic growth.
The Uganda Stock Exchange (USE) has served a useful purpose for the privatization strategy of
the government, but has not yet raised equity finance for domestic enterprises or provided a
viable trading platform. Trading in the listed companies is sporadic and negligible measured
both in real terms and relative to market capitalization. The costs of issuance on the USE are too
high in light of the small number of investors reached. The Capital Markets Authority (CMA),
the securities regulator, does not distinguish between types of securities market investors. The
USE may be more effective if it is focused on a lower disclosure standard for new issues
combined with a greater reliance on collective investment schemes to reach the broader public
while targeting the regional market of sophisticated and international investors.
4.2 Informal financial sector
The informal financial sector refers to all institutions and transactions occurring outside
the country’s official financial services system. Studies suggest that, in Africa, it is larger
than the formal financial sector in terms of influence, coverage and even value of
transactions (Nissanke and Aryeetey, 2006). It is estimated that at most only 20 per cent
of African households have access to formal finance (Honohan and Beck, 2007) and the
rest are largely served by the informal sector.
Institutions offering financial services in the informal sector range from large savings groups to
individual moneylenders. The range of services offered is similarly vast, with a large array of
different savings collection instruments and lending arrangements, including non-commercial
financial transactions between friends and relatives. Some of the most prevalent institutions in
this sector are deposit collectors, moneylenders and credit associations. There are also micro-
insurance groups that pool small contributions from members and make funds available for
particular events such as weddings or funerals (Wright, 1999; Dercon, 2002). Institutions in the
informal financial sector typically focus either on deposit collection or on loan extension. The
few institutions that offer both services are generally open only to members. Financial
transactions in the informal financial sector are typically small and frequent, reflecting the low
level of disposable income and the high liquidity preference of poor households and small
businesses. The sector is dynamic, varied and responsive to the needs of the population in terms
of financial services. It does not, however, play a significant role in financial intermediation,
despite its strong capacity for savings mobilization. It appears that the risk management
strategies employed by informal financial institutions, which allow them to operate in the lower
end of the financial market, also constrain their expansion.
Informal financial institutions rely on personal relations and repeated transactions as principal
risk-reducing strategies. The social pressure exerted by the community in which transactions take
place is also of key importance in reducing the likelihood of fraud or default (Nissanke and
Aryeetey, 2006). This reliance on personal relations and social pressure constrains the expansion
of informal financial institutions beyond the community level.
The majority of Ugandans still rely on the informal financial sector. Only 18% percent (2.4m) of
the Ugandan adult population use any type of formal financial service (tier 1-3 in the diagram
overleaf), while another 3 percent (0.4m) use semi-formal financial services (tier 4 below), 17
percent (2.2m) use informal financial services only, while 62 percent (8.2m) do not use any type
of financial service (Finscope: Uganda, 2006). These statistics suggest that the population is
actively engaged by the informal financial sector.
5 Public Sector Revenue Mobilization and Taxation Policy in Uganda
The amount and efficiency of government spending is an essential part of making domestic
resources the engine for economic development. Public sector resources have a distinct and
complementary role to play vis-a-vis private savings. While a distinction can be made between
public expenditure, which covers recurrent costs, and public savings, which fund longer-term
investments, the needs that both address are immense in economic development. Public
expenditure is essential to human capital development through its funding of essential public
services such as education and health care. Public investment, on the other hand, can provide
the resources for infrastructure that is indispensable for the private sector to thrive. To finance
public investments, government raises revenues through taxation. The level of taxes to GDP
remains very low which is largely a result of a narrow tax base and inefficient tax system. In an
attempt to improve tax collection, several tax reforms have been undertaken.
5.1 Policy Reforms to Increase Tax Revenues
The tax reforms that have been undertaken in Uganda are frequently distinguished as
direct and indirect. Uganda relies on both direct and indirect taxes. Direct taxes include
Pay As You Earn (PAYE), withholding tax and corporate tax and indirect taxes include
excise duties and Value Added Tax (VAT). Non-tax revenues comprise collections like
dividends from BOU, collections by ministries and foreign missions, and collections
from fees and licenses.
Uganda heavily relies on indirect taxes but the share of direct taxes has been growing. Uganda’s
tax reform goals have been fourfold: broaden the tax base; increase efficiency of collection;
create incentives for the private sector; and ensure equity of taxation. The tax reforms

undertaken were comprehensive and intended to encompass most of the important revenue
sources and involved the adoption of new tax codes. The reforms were directed at rationalizing
the tax structure and tax rates, widening the tax base, reducing exemptions, and simplifying
procedures. A semi-autonomous Uganda Revenue Authority (URA) headed by a Commissioner
General was established in 1991 with the view of improving tax administration. The
Commissioner General’s independence and powers were enhanced in the URA Amendment
Act, 2007.
/5.2 Performance of Tax Revenues
Albeit all these reforms (Box 1), the taxes collected by Uganda Revenue Authority (URA) have
stagnated at 12 percent of GDP. Uganda still relies mostly on indirect taxes for its revenue,
particularly those inclined to international trade. This dependence on indirect taxes is mainly
due to the fact that income taxes are limited by administrative and because its easier to tax at
the border. Part of the reason why Uganda’s tax base is low is because a large section of the
economy is untaxed, especially the informal and the commercial agricultural sectors, which
complicates efforts to widen the tax base and increase domestic revenue.

Table 3: Tax Collection and Tax Base Derived from the Social Accounting Matrix
/
Source: Uganda Bureau of Statistics and authors calculations.
Using the information from the social accounting matrix, it is revealed that tax collection is still
way below relative to its tax base. Focusing on the indirect taxes or consumption taxes which
include VAT, Table 3 shows that for most of the commodities, the effective tax rates computed
are below the statutory rates. For instance, the statutory VAT is at 18 percent. However, for
most commodities the ratio of taxes collected is very low. For all the commodities, it is shown
that less than 5 percent of the tax base is collected. This could be a reflection of two problems:
first, there could be rampant tax evasion within the tax system. Second, it might be the case that
the URA is still too weak to effectively capture the statutory taxes in the economy. For the case
of imports, a different pattern is portrayed where most of the commodities imported indeed
meet their statutory tax payments. This background clearly indicated that there is more work to
do for the URA to improve on its domestic tax collections. In addition, some imports including
fuel are overtaxed and given the importance of this commodity for other sectors like
manufacturing and services especially transport, this could impact the economy negatively.
Therefore, by improving domestic tax collection this would create room for reduction of taxes
on commodities like fuel.
Consequently, the tax burden has for long been falling on only a small section of the population
that is either in formal employment or own businesses for which tax assessment is easier. It is
estimated that the top 35 highest tax payers in the country alone account for about 50 per cent of
all the tax revenue, an indication of how narrow the tax base is in the country. This narrow tax
base is also aggravated by the high levels of tax evasion and corruption in the tax
administration system. The aggregate outcome of these shortcomings is a low growth in
domestic revenue compared to the expenditure needs of the growing Ugandan economy.
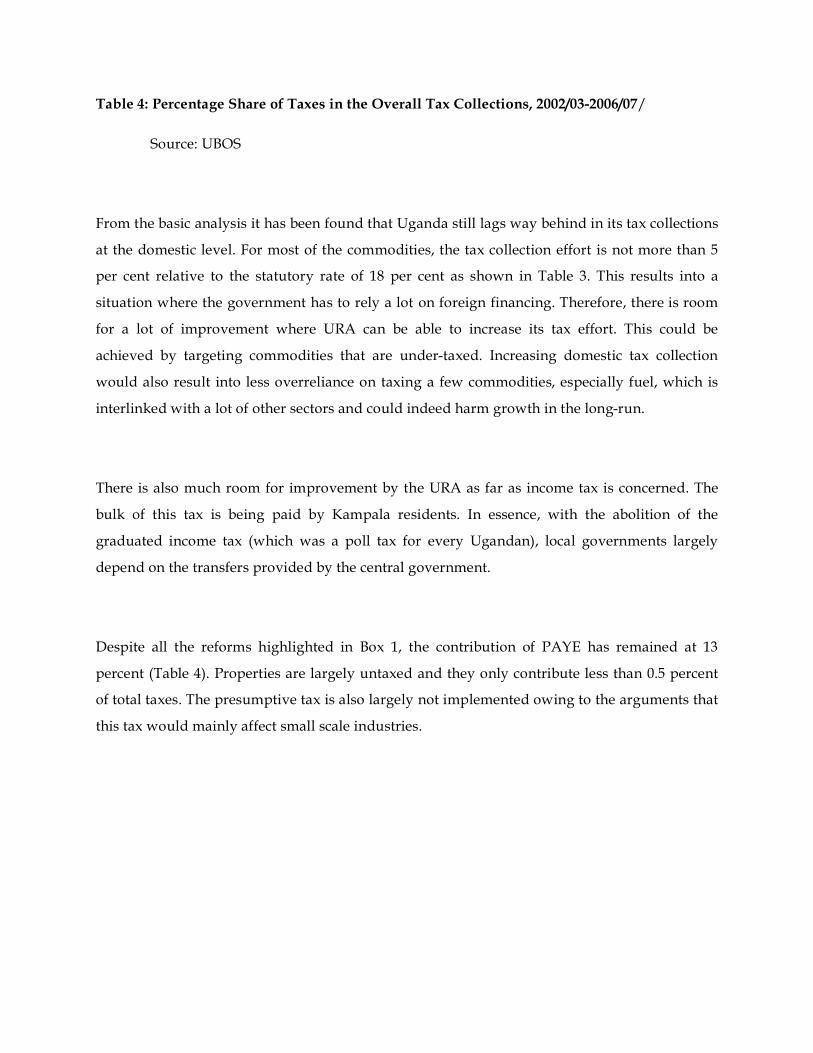
Table 4: Percentage Share of Taxes in the Overall Tax Collections, 2002/03-2006/07/
Source: UBOS
From the basic analysis it has been found that Uganda still lags way behind in its tax collections
at the domestic level. For most of the commodities, the tax collection effort is not more than 5
per cent relative to the statutory rate of 18 per cent as shown in Table 3. This results into a
situation where the government has to rely a lot on foreign financing. Therefore, there is room
for a lot of improvement where URA can be able to increase its tax effort. This could be
achieved by targeting commodities that are under-taxed. Increasing domestic tax collection
would also result into less overreliance on taxing a few commodities, especially fuel, which is
interlinked with a lot of other sectors and could indeed harm growth in the long-run.
There is also much room for improvement by the URA as far as income tax is concerned. The
bulk of this tax is being paid by Kampala residents. In essence, with the abolition of the
graduated income tax (which was a poll tax for every Ugandan), local governments largely
depend on the transfers provided by the central government.
Despite all the reforms highlighted in Box 1, the contribution of PAYE has remained at 13
percent (Table 4). Properties are largely untaxed and they only contribute less than 0.5 percent
of total taxes. The presumptive tax is also largely not implemented owing to the arguments that
this tax would mainly affect small scale industries.
Constraints in Domestic Savings Mobilization in Uganda
6.1 Revenue Mobilization
Low income levels, high unemployment and widespread poverty: Uganda like most other
developing countries has a challenge to widen its tax base largely because of the low income
levels of its citizens and high unemployment level. The head count level of poverty is currently
estimated at 31 percent in 2006 (UBOS). The level of unemployment and underemployment is
currently estimated at 25 percent. With these statistics, the basis for taxing the citizens does not
exist given their limited disposable income. Hence, the modern means of raising revenue, such
as income taxes and consumer taxes, play a diminished role in economies like Uganda.
Corruption: The level of corruption is still considered as a serious problem within the URA. In a
household survey covering the period 1995-97, the URA was rated comparatively corrupt,
though less corrupt than the courts and the police, but worse than the health services and local
government (Cockcroft and Legoretta 1998). Also, a business survey conducted in 1998, which
covered 243 firms, as many as 43 per cent said they were paying bribes to tax officers
occasionally or always (Gauthier and Reinikka 2001, p. 22).2 Revenue corruption manifests itself
in the form of smuggling, undervaluation and under-declaration of income and taxable goods
and misclassification of goods. The Customs Department, in particular, has most consistently
had difficulties in meeting its targets (Obwona and Muwonge 2002, p. 27). Hence, various forms
of revenue fraud could partly be an explanation for the tax share stagnation in recent years.
Structure of Uganda’s economy: Uganda’s low revenue performance has been attributed to the
structure of the economy. Uganda has a significantly large agriculture sector, accounting for
15% of GDP in 2008/09. The services and industry sector contributed 51% and 24% to GDP in
2008/09 respectively. In addition, there has been no shift in the sectoral composition of
employment as agriculture remained the major sector with employment in the sector increasing
2 No recent data available to confirm whether this has changed.
from 66% in 2002/03 to 73% in 2005/06. About 70% of the working population is self-employed
in agriculture (UBOS, 2006). The outputs and inputs in the agricultural sector do not
attract taxes.
Large informal sector and inadequate tax education: The Uganda National Household Survey
(UNHS) 2002/03 showed that Uganda’s labor force stood at 9.8 million persons, of whom 2.6
million were in non-agriculture informal sector. Of the 9.8 million persons in the labor force, 3.5
million persons were the working poor. Uganda has a large informal sector although declining;
the sector declined from around 15.1% in 2001/02 to 13.5% of GDP in 2006/07. The informal
sector is hard to tax.
Unregulated Small to Medium Enterprises (SMEs) constitutes 75% of all companies in
Uganda. The direct tax these enterprises can appropriately pay is presumptive tax which
amounted to only Shs 3.6 billion in 2005/6. Enforcement of this tax has been a challenge due to
limited registration of these companies.
Tax evasion and avoidance remains a serious constraint to Uganda’s ability to raise resources.
While the URA has made significant improvement in administration, this has not particularly
been reflected in the improvement in tax collection.
Tax incentives and holidays: In an effort to attract investors, Uganda instituted several tax
incentives and holidays. However, although some effort has been done to streamline and in
some cases abolish them, these incentives still remain. They are largely arbitrarily given with no
clear expiration and coverage. The most recent examples of generous incentives were provided
to several hotel proprietors in preparation for the Commonwealth Heads of Government
Meeting State Summit which are being queried by the public accounts
parliamentary committee.

Regional Integration: Uganda and five other East African Countries are in the process of
implementing the East African Customs Union. The key objective for this Union is to widen the
market for goods produced within the region. However, this also comes with challenges since
all tariffs between the countries in the Union have been abolished. This would require the
country to immediately replace the revenues lost through the abolition of tariffs.
Social and Cultural Norms: The low domestic resource mobilization among the private sector
can also be attributed to the social and cultural norms of the population. There are considerable
resources being mobilized for social functions like weddings and funerals. These functions tend
to be large and extravagant. The wedding receptions are usually as large and requiring
resources amounting to what would probably never be mobilized by the couple to start
a business.
Concentration of Banks: Most banks still remain a preserve of the urban areas. In addition, they
are largely dominated by a few banks, few large depositors and loans largely concentrated
among the few borrowers. Without spreading banking to the rural areas, the ability to mobilize
savings would still remain very limited. This can also be achieved by promoting MFIs to
concentrate their activities in rural areas.
Risk sharing of Banks across sectors: Banks still mainly focus on lending to specific sectors due
to their low risk tolerance. Agriculture which is a major sector in Uganda has had problems
attracting bank financing given its risky nature. Entrenching the role of development banks
could circumvent this problem.
The maturity structure and range of products is a constraint. Only 12 percent of total loans, 35
percent of loan volume, 17 percent of total deposits, and less than 0.4 percent of time deposits
have a maturity of more than one year. Moreover, long-term lending is limited to on-lending of
a European Investment Bank (EIB) line of credit, channelled through the Development Finance
Department (DFD) of the BOU.
Undeveloped Financial Markets: The market for long-term bonds in Uganda is very shallow,
meaning that the supply curve for long-term funds is inelastic; hence no bond interest rate is
independent of the demand for funds from bond issuers. In other words, bond issuers are not
price-takers and a reliable yield curve is difficult to establish; a yield of 15 percent on a 5-year
government bond does not mean private issuers can assume a similar yield. Bond market
development requires financial institutions that hold long-term liabilities, because only by
holding long-term liabilities can a financial institution invest in long-term assets. Uganda has no
such institution except for National Social Security Fund (NSSF) (pension monopoly), which
invests its long-term assets in short-term assets or real estate.
High Interest rate spreads explained by overhead costs, credit risk, and weak competition
remains a major constraint. Interest rate spread, which is the difference between the weighted
average lending rate and the weighted average deposit rate—is about 20 percentage points at
present. Operating costs explain about 50 percent of the spread, and profits are the second
largest component with 30 percent of the overall spread. Low bank interest rates on deposits are
4% whereas the bank lending rate is on average 24% (Source: BOU). With an inflation rate of
8%, this means that the real rate on bank deposits is negative. This does not only discourage
saving mobilization but greatly discourage the savers, leaving the bank in liquidity stress.
7 Opportunities to Enhance Savings Mobilization
7.1 Revenue Policies
Tapping into the informal sector. The URA should make an effort of targeting businesses and
commodities that are under-taxed and excluding food items for equity purposes. Increasing
domestic tax collection would also result into less overreliance on taxing a few commodities
especially fuel which is interlinked with a lot of other sectors and could indeed harm growth in
the long-run. For instance, the VAT system has not been fully implemented at the retail stage.
The bulk of this tax is collected on imports and large whole sellers and manufacturers.
By registering all informal traders for VAT on the commodities they trade in, this would expand
its coverage.
Streamlining of tax incentives: Tax incentives are politically much more difficult to
completely remove. Given the cost of tax incentives to the ability to collect taxes, the
government should make an effort to streamline these incentives in its quest for attracting
investors. This should be done by undertaking due diligence on the benefits and costs of the
investments vis-à-vis the revenue foregone.
Implementation of the National Identity Card: To identify the small informal businesses, it
would require implementation of the National Identity Card where an individual or business
(small or big) can easily be tracked. In addition, URA would need to undertake a special survey
to establish the potential revenue that is not currently paid by small enterprises.
Implementation of the presumptive taxes: While this tax already exists, its implementation has
been weak. Presumptive taxes would largely address the weaknesses associated with small
enterprises not keeping financial records. The tax mainly relies on turnover.
Introduction of a Property Tax: This tax should mainly be levied on residential and commercial
properties. It is highly progressive and can be used to finance especially the local government
development programs.
Simplification of the Tax System: It is generally accepted that Uganda’s taxpayers do not
understand the tax system. The number of tax disputes between URA and taxpayers handled by
the Tax Administration Unit are large. These problems leave no doubt that despite the quite
comprehensive changes in the tax structure in recent years; the tax system is still complicated
and non-transparent. There should be more renewed efforts aimed at simplifying the tax system
and educating the taxpayers. URA should produce a citizen’s revenue guide to broaden
understanding of the country’s tax systems and to inform tax debates.
Simplification of tax administration: Occasionally, various security agencies have been used in
the verification of imports. However, the revenue authority should be further strengthened to
undertake professionally all its revenue collection activities. Simplifying taxation approaches
should include markedly reducing tax exemptions, deductions and privileges that cause losses
to the treasury as well as corruption tendencies. Assessors should not have wide discretionary
powers to interpret tax laws, for instance, to allow or disallow expenses or charges, or to exempt
items from import duties.
Other Potential Sources of Revenues: While non-tax revenues are currently contributing about
1 percent of total domestic revenue, the government has identified this area as one other
potential source of revenue that can be improved.

Key Issues and Recommendations for Increasing Taxes
1. Short-term Measures
Problem Recommendations
• Ineffective 1 % turnover tax
for businesses with turnover less
than 50 million
• Over-reliance on import taxes
which leads to under declaration
at customs points.
• Overly cumbersome procedures
to register as VAT tax payer.
• Tax incentives and credits given
to new investors which largely
benefit the large firms.
• Reduce turnover tax rate to less
than 1 % to encourage more
small firms into tax net.
• Broaden the tax base by
introducing new tax handles and
to reduce overreliance on import
duties.
• Simplify the registration
procedures for registering as
VAT tax payer especially for
small businesses. URA is
introducing an Electronic Tax
System which will partly
simplify the registration process.
• Rationalization of tax incentives
and credits
2. Medium-term Measures
• Ineffective property tax law.
• Large unregistered businesses
• Implement a national identity
card system.
• Large informal commercial
farmers.
• Poor record keeping especially for
• Reduce the size of the informal
sector as well as increase the size
of the monetized economy.
• Fully implementing a property
tax and harmonizing it with the
rental tax. This would require a
well-functioning land
small businesses.
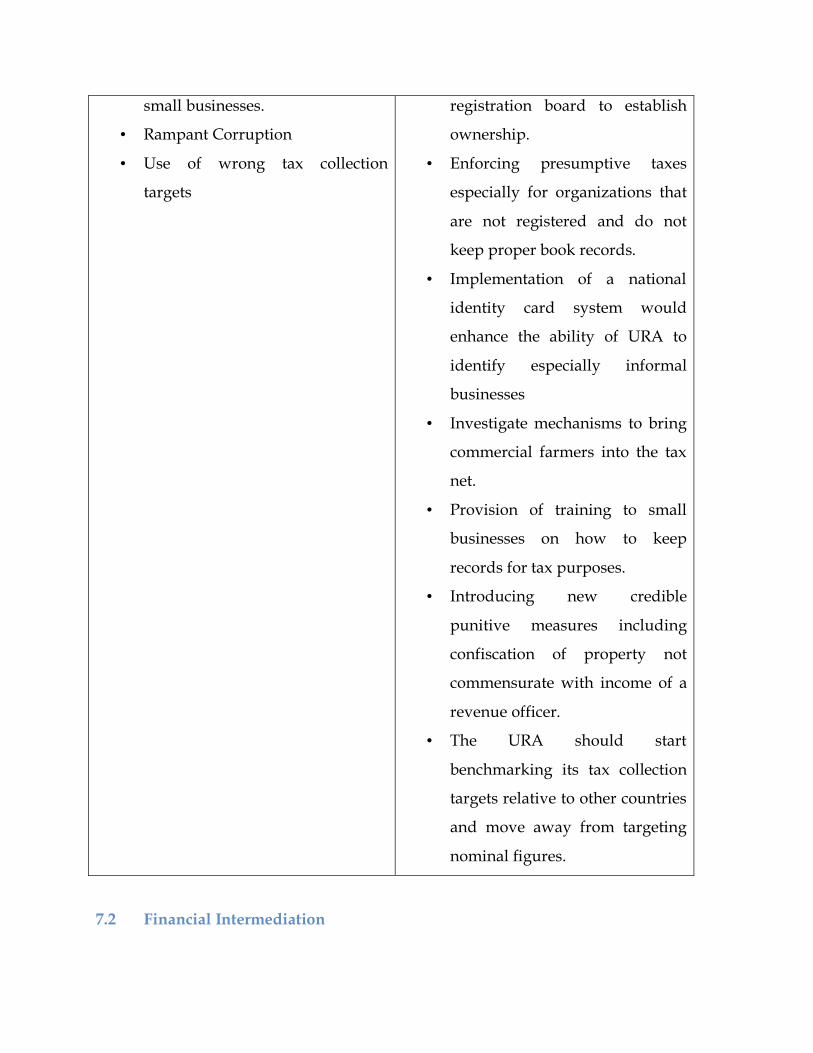
• Rampant Corruption
• Use of wrong tax collection
targets
registration board to establish
ownership.
• Enforcing presumptive taxes
especially for organizations that
are not registered and do not
keep proper book records.
• Implementation of a national
identity card system would
enhance the ability of URA to
identify especially informal
businesses
• Investigate mechanisms to bring
commercial farmers into the tax
net.
• Provision of training to small
businesses on how to keep
records for tax purposes.
• Introducing new credible
punitive measures including
confiscation of property not
commensurate with income of a
revenue officer.
• The URA should start
benchmarking its tax collection
targets relative to other countries
and move away from targeting
nominal figures.
7.2 Financial Intermediation
Strengthening and expanding financial institutions and markets. This should involve
supporting and/or encouraging banks to extend financial services to rural areas. The
government should also continue to mobilise private savings through creation of SACCOs.
They key impediment for the financial institutions to settle in rural areas is mainly the poor
infrastructure especially lack of access to electricity and poor roads infrastructure. The
government should therefore focus on providing a conducive environment where financial
institutions would find it easier to do business in rural areas.
Increase availability of development finance for investors in priority sectors of the economy.
This would entail recapitalization of Uganda Development Bank (UDB), as well as ensuring that
systems and procedures are in place for proper functioning of these institutions.
Encourage opening of alternative sources of long term capital. This would entail liberalizing of
the pension sector and working on governance problems with the NSSF which currently is the
largest pension fund for individuals working with private sector.
Development of an agricultural nank to provide financing to the agricultural sector. Agriculture
being a risky sector, the government could consider opening a bank largely targeted to the sector.
Mortgage financing to encourage collateralization of loans and mobilization of savings. The
current mortgage market is still very shallow and limited with the availability of long-term
financing. Banks should venture into accessing long-term financing as a way of diversifying
their products.
Strengthen the Credit Reference Bureau (CRB). This will provide timely and accurate
information on borrower’s debt profile and repayment history to enable lenders to make
informed decisions on the allocation of credit. Better information would enhance competition for
sound borrowers, while giving borrowers an incentive to service their loans in order to maintain
good credit records.
Modernize the land and company registries as a means of hastening the process of extending
credit. The process of computerizing the land registry started in 2007 with Kampala, Wakiso,
and Mpigi districts, before it is rolled out to the entire country.
Update the insolvency legislation. Effective insolvency systems play an important role in
fostering financial stability, financial sector development, and efficient allocation of resources,
thus contributing to economic growth.
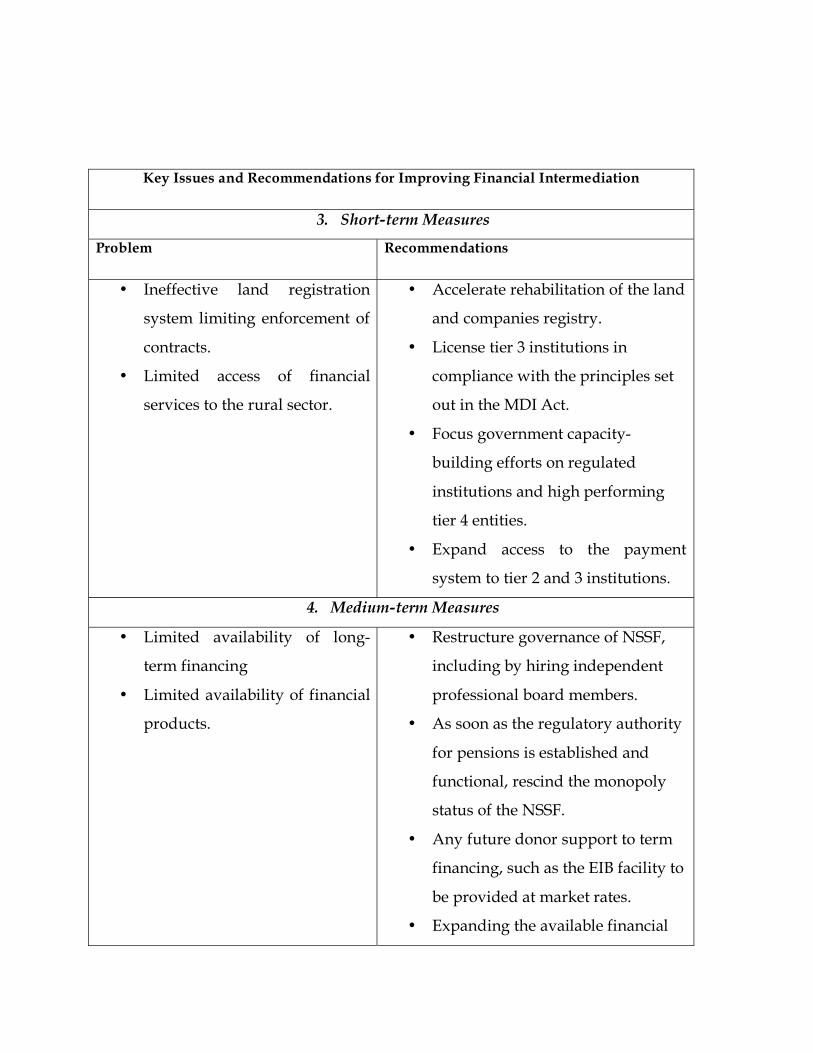
Key Issues and Recommendations for Improving Financial Intermediation
3. Short-term Measures
Problem Recommendations
• Ineffective land registration
system limiting enforcement of
contracts.
• Limited access of financial
services to the rural sector.
• Accelerate rehabilitation of the land
and companies registry.
• License tier 3 institutions in
compliance with the principles set
out in the MDI Act.
• Focus government capacity-
building efforts on regulated
institutions and high performing
tier 4 entities.
• Expand access to the payment
system to tier 2 and 3 institutions.
4. Medium-term Measures
• Limited availability of long-
term financing
• Limited availability of financial
products.
• Restructure governance of NSSF,
including by hiring independent
professional board members.
• As soon as the regulatory authority
for pensions is established and
functional, rescind the monopoly
status of the NSSF.
• Any future donor support to term
financing, such as the EIB facility to
be provided at market rates.
• Expanding the available financial

products including wider use of
mortgage financing for the housing
market and use of sovereign and
municipal bonds to finance
development expenditures.
8 Conclusion
This paper discusses possible approaches for improving the mobilization of domestic resources
for development in Uganda focusing on the interrelationship between domestic saving,
government revenue, capital accumulation and economic growth. In particular, it highlights the
possibility of creating a virtuous cycle of higher domestic saving and investment rates, and
higher trend growth.
The paper highlights the weaknesses in mobilizing resources emanating from the public sector.
It is found that the ability for the government to raise revenues is partly hampered by several
factors including: (i) large informal sector; (ii) dominance of the agriculture sector; (iii) tax
evasion and avoidance; and (iv) weak tax administration. However, the paper also identifies
opportunities which the government can pursue to increase its revenue base including the
abolition of tax incentives, introducing and enforcing new taxes, and simplifying the tax system
On financial intermediation, Uganda still lags behind other countries and more should be done
for this sector to be a conduit of savings and investments. The key constraints identified include:
(i) concentration of banks in urban areas; (ii) low risk sharing of banks across sectors; (iii) short
maturity structure of bank assets; and (iv) limited range of financial instruments, and high
interest rate spreads explained by overhead costs, credit risk, and weak competition. The key
opportunities in this sector include: (i) strengthening and expanding financial institutions to the

rural area; (ii) increasing availability of development finance for investors in priority sectors of
the economy; (iii) encourage opening of alternative sources of long term capital and (iv)
strengthening the Credit Reference Bureau.

References
Aryeetey, E. (1994), Financial Integration and Development in Sub -Saharan Africa: A Study of
Informal Finance in Ghana, Mimeo. (Processed), Overseas Development Institute, London.
Aryeetey, E. and Nissanke M. (2006), Financial Integration and Development: Liberalization
and Reform in Sub-Saharan Africa. Routledge Studies in Development Economics.
Augus Deaton 1991, Savings and Liquidity Constraints, Econometrica, Vol 59, No. 5, 1221-1248.
Background to the Budget (2008), Ministry of Finance and Economic Planning and
development. Republic of Uganda, Various issues.
Bulir, A. and Hamann, A.J., 2007, “Volatitlity of Development Aid: An Update,” IMF Staff
Papers, Vol.45, No.3, September.
Cockcroft, A. and L. Legoretta (1998), ‘National Integrity Survey 1998 Baseline. Uganda’,
unpublished document, Kampala: CIET International.
Dercon, S. 2002, Income risk, coping strategies and safety nets. World Bank Research
Observer 17 (2): 141-166.
Gauthier, B. and R. Reinikka (2001), ‘Shifting Tax Burdens Through Exemptions and Evasion:
An Empirical Investigation of Uganda’, Policy Research Working Paper no. 2735 (December),
Washington DC: World Bank.
Kasekende L.A. and G. Ssemogerere (1994), Constraint to Development and Diversification of
traditional Exports in Uganda, 1981-1990 "AERC Research Paper No 28.
Loayza, N., Lopez, H., Schmidt-Hebbel, K., Serven, L., 1998. World Saving Database. The World
Bank, Mimeo.
Obwona,M. and A. Muwonge (2002), ‘The Efficiency and Effectiveness of the Revenue
Administration in Uganda’, paper prepared for the Taxation, Aid and Democracy’ Research
Programme, Bergen and Copenhagen: Chr. Michelsen Institute and Centre for Development
Studies.
Okurut, F.N., Banga M., and Mukungu A. (2004), ‘Microfinance and Poverty Reduction in
Uganda: Achievements and Challenges, Economic Policy Research Center.
Uganda Investment Authority (2006), The Uganda Investment and Business Envi-
ronment Report 2006, website: http://www.ugandainvest.com/
Uganda Bureau of Statistics (2007), Statistical Abstract, Uganda Bureau of Statistics, Republic of
Uganda, (UBOS)

Uganda Bureau of Statistics (2008), Statistical Abstract, Uganda Bureau of Statistics, Republic of
Uganda, (UBOS).
Uganda Bureau of Statistics (2002), Statistical Abstract, Uganda Bureau of Statistics, Republic of
Uganda, (UBOS).