revenue mobilization in sub-saharan africa: challenges from
TRANSCRIPT

Revenue Mobilization in Sub-Saharan Africa:
Challenges from Globalization
Michael Keen and Mario Mansour
WP/09/157

© 2009 International Monetary Fund WP/09/157 IMF Working Paper Fiscal Affairs Department
Revenue Mobilization in Sub-Saharan Africa: Challenges from Globalization
Prepared by Michael Keen and Mario Mansour1
July 2009
Abstract
This Working Paper should not be reported as representing the views of the IMF. The views expressed in this Working Paper are those of the author(s) and do not necessarily represent those of the IMF or IMF policy. Working Papers describe research in progress by the author(s) and are published to elicit comments and to further debate.
This paper evaluates the nature and extent of, and possible responses to, two of the central challenges that globalization poses for revenue mobilization in Sub-Saharan Africa (SSA): from corporate tax competition, and from trade liberalization. It does so using a new dataset with features needed to meaningfully address these issues: a distinction between resource-related and other revenues, and a disentangling of tariff from commodity tax revenue. Countries' experiences vary quite widely, nonresource revenues have been essentially stagnant. Corporate tax revenues have held up, despite a reduction in rates and evidence of substantial base-narrowing—something of a puzzle—and trade tax revenue reductions have been largely offset by other measures. Options for dealing with the continuation and intensification of the challenges, which the present crisis is likely to accelerate—including through regional cooperation—are discussed. JEL Classification Numbers: F13, H20, O10 Keywords: Trade Reform; Tax Reform; Tax Competition
Author’s E-Mail Address: [email protected]; [email protected]
1 We thank Sanjeev Gupta for helpful suggestions, and Asegedech WoldeMariam for painstaking research assistance. Views and errors are ours alone, and should not be attributed to the International Monetary Fund, its Executive Board, or its management.

2
Contents Page
I. Introduction ............................................................................................................................3
II. Tax Revenues in Sub-Saharan Africa ...................................................................................6
III. Corporate Taxation and Tax Competition .........................................................................10 A. Principles of Corporate Taxation in Developing Countries....................................10 B. Trends in CIT Rates and Revenues .........................................................................16 C. Tax Incentives .........................................................................................................18 D. Policy Implications .................................................................................................24
IV. Trade Liberalization and Revenue Replacement...............................................................29 A. Principles for Revenue Replacement ......................................................................29 B. Trends in Trade Taxation ........................................................................................30 C. Replacing Tariffs by Domestic Indirect Taxes .......................................................34
V. Conclusions.........................................................................................................................37 Tables 1. CIT Rates and Nonresource CIT Revenues in SSA, by Income Level and Resource
Status ...................................................................................................................................18 2. The Changing Face of Tax Incentives in SSA.....................................................................19 3. Increasing Vs. Decreasing Trade Tax Revenues in SSA .....................................................32 4. Tariff Structure of Existing and Prospective Customs Unions in SSA ...............................33 5. Trade Taxes and Collected Tariff Rates by Trading Bloc in SSA.......................................34 Figures 1. Tax Revenue Trends in SSA, 1980–2005 (Simple Averages)...............................................6 2. Tax Revenue Trends in SSA, 1980–2005 (Weighted Averages) ..........................................7 3. Tax Revenue Trends in SSA by Income Level, 1980–2005..................................................8 4. Composition of the Tax/GDP Ratio in SSA, 1980–2005 ......................................................9 5. CIT Rates and Nonresource CIT Revenues in SSA, 1980–2005.........................................17 6. Statutory CIT Rates and FDI in SSA, by Income Level and Resource Status ....................23 7. Trade Tax Revenues and Collected Tariff Rates in SSA, 1980–2005.................................31 8. The Replacement Role of Indirect Taxes in Individual SSA Countries ..............................36 Boxes 1. A New Revenue Dataset for Sub-Saharan Africa..................................................................5 2. Corporation Tax: Which Tax Rate Matters?........................................................................13 3. The Dangers of Tax Holidays ..............................................................................................14 4. Scaling Back Tax Incentives—Some Examples..................................................................25 5. Principles for Coordinating Corporate Taxation..................................................................28 Appendixes I. Data Notes and Definitions...................................................................................................40 II. Countries by Income Level and Resource Status................................................................42 III. Membership of Trade Groups............................................................................................43 References................................................................................................................................44

3
I. INTRODUCTION
As in other parts of the world, the effects of ‘globalization’—at the heart of which is increased international mobility of goods, services, and capital—have already been felt in Sub-Saharan Africa (SSA) and are likely to become still more marked in the coming years. Between 1980–02 and 2003–05, trade in goods (exports plus imports) increased from 49 to 62 percent of regional GDP, while inflows of foreign direct investment (FDI) increased from 1 to about 3.3 percent of GDP, with most of this increase taking place since the early 1990s. But such developments have been even more marked elsewhere: the share of SSA in global trade fell from around 4 to 2 percent over the same period (Carey, Gupta and Jacob, 2007). There is, it seems, both scope and need for further integration of SSA into the wider global economy. Prominent amongst the many challenges that arise in seeking to secure the maximum advantage from globalization—in both facilitating it, and dealing with its consequences—are those for revenue mobilization. Increased mobility of goods and factors means, to a large degree, increased mobility of tax bases, and hence, potentially, downward pressure on tax rates and revenues. With levels of domestic resource mobilization already low relative to spending needs, this is liable to be an especially significant concern in SSA. The 2007 Millennium Development Goals Report notes, for instance, that many SSA countries are not on track to meet the MDGs in 2015, particularly in the area of poverty reduction. Lack of domestic resources has proved a central difficulty.2 A wide range of taxes may be directly affected by increased mobility of their underlying bases, including those taxes on investment and capital income (from greater capital mobility), tariffs and export taxes (from further measures of trade liberalization), excises on petrols, tobacco and drinks (from cross-border shopping and smuggling), and, perhaps, labor taxes (from increased mobility of people, especially higher skilled). Indirect effects may then be felt by taxes with less mobile bases—such as domestic consumption or immobile properties—that become the natural recourse for revenue recovery. This paper does not attempt a full review of the revenue challenges that globalization poses for SSA, but focuses on what seem likely to be the two most immediately pressing: those in relation to corporate taxation, and those from trade liberalization:
2 Downward pressure on revenue may in some circumstances be desirable as a way to limit wasteful spending by self-interested policy-makers (see, for example, Edwards and Keen (1996) and Besley and Smart (2007)). Though such concerns may not be absent from SSA, it is assumed throughout this paper—for the reasons just given—that increasing tax revenue, or at least maintaining it, is an accepted policy objective for the region.

4
The key issue in relation to the corporate income tax (CIT) is whether revenue from this source has—or, especially, will—come under significantly increased pressure, as countries, both within the region and more widely, compete more aggressively to attract investment. The risk is that this will ultimately be to their mutual harm, with each country ignoring the adverse impact that its own tax-cutting has on others—and creating the possibility of mutual benefit from limiting such tax competition.
The central fiscal challenge from trade liberalization is that of coping with the likely reduction of revenue from taxes on trade. These pressures come from the formation of free trade areas and customs unions both within the region and, perhaps more importantly, between SSA countries and their major trading partners in developed countries, notably the Economic Partnership Agreements (EPAs) with the EU. Trade diversion—imports from countries bearing relatively low tariffs displacing those from countries bearing higher, for example from China to EU members—will reinforce these pressures on tariff revenues.
These two sets of pressures, it should be noted, are closely linked. As trade liberalization makes it easier to serve national markets from locations abroad, so firms’ decisions as to where to invest are more likely to be affected by tax considerations. Such linked pressures have been experienced in other parts of the world. They have been especially evident in the development of the EU—which has long been concerned with issues of CIT competition between its members—and are currently strongly felt, for instance, with the formation of the Central Americas Free Trade Agreement (CAFTA). There are, as will be seen, lessons to be drawn for SSA from the failures and successes elsewhere. The purpose of this paper is to assess the significance of these challenges, and to outline possible responses. Is there a case, for instance, for some degree of cooperation to avoid mutually damaging tax competition? How can reductions in trade tax revenue be replaced from other sources? The first step in addressing these issues is to describe and understand current trends. Here, as in other areas of tax analysis for SSA, progress has been hampered by the absence of revenue data that are consistent, reliable, and have extensive coverage (over both time and countries). This paper draws on a unique dataset, which, though it has many shortcomings, in important respects improves over those previously available. Covering 40 SSA countries, it enables, in particular, a distinction to be drawn between countries that do and do not have extensive revenue from natural resources, and is capable of addressing issues of trade liberalization. Details are provided in Box 1 and Appendix I. The dataset, and hence much of the discussion, predates the crisis and fall in commodity prices that intensified in late 2008. Amongst the effects in SSA are likely further pressures on corporate tax revenues (not least through the impact on the financial and resource sectors), as

5
already felt elsewhere, and on tariff revenues too (from reduced trade flows). The crisis is thus likely only to intensify and accelerate the challenges with which this paper is concerned. Section II uses this dataset to explore trends in the level and composition of tax revenue in SSA over this period. Sections III and IV then consider in turn the challenges in corporate taxation and from trade reform described above, in each case identifying trends, discussing the issues they raise, and considering policy responses. Section V concludes.
Box 1. A New Revenue Dataset for Sub-Saharan Africa The revenue data used here are taken from IMF Staff reports, and so generally reflect extensive discussion between IMF staff and authorities as to their accuracy. This enables, in particular: A reliable distinction between tariffs and domestic commodity taxes (ensuring, for instance, that VAT
and excises collected on imports are classified as domestic sales and excise revenues rather than international trade tax revenue)—which is central to evaluating responses to trade liberalization.
A distinction between revenues from upstream activities in natural resources (mainly royalties and CIT paid by oil and gas, and mining companies) and other corporate tax receipts—needed to understand the role of resource revenues in shaping wider tax trends.
The sample is of 40 SSA countries over the period 1980-2005. These are those covered in the IMF’s SSA Regional Economic Outlook (April 2007), except that data constraints (particularly in the separation of resource and nonresource revenues) lead to the exclusion of the Democratic Republic of Congo, Liberia, Angola, and Eritrea. Countries are for some purposes divided into low, lower-middle and upper-middle-income (LIC, LMIC, UMIC). The classification is based on 2005 income levels following the 2006 World Bank country classification (see Data and Research at www.worldbank.org), the latter two groups (5 and 6 members respectively) being relatively small. The sample is also for some purposes divided between (13) ‘resource’ and (27) ‘nonresource’ countries. The former are those whose central government reported some resource revenue for at least one year in the sample period: Botswana, Cameroon, Cape Verde, Chad, Congo, Côte d’Ivoire, Equatorial Guinea, Gabon, Guinea, Namibia, Nigeria, South Africa, and Togo. This omits some countries for which resources are important (such as Niger, Zambia and Zimbabwe), but should not affect the results significantly—World Bank estimates suggest that of the 40 countries covered in the present study, those classified as resource countries represent over 95 percent of subsoil wealth.1 Appendix II lists the sample countries by income group and resource revenue status. ______________________________ 1 World Bank (2006).

6
II. TAX REVENUES IN SUB-SAHARAN AFRICA
The two panels of Figure 1 show developments in total and nonresource related tax revenues from 1980 to 2005, the first relating to all countries and the second to the subset of countries reporting resource-related revenues. There has clearly been an increase in the (simple) average tax ratio (total taxes as a share of GDP) since the late 1990s. But the figure also shows that this is very largely due to a marked increase in revenue from natural resources—resource countries experiencing an average increase in revenue from such sources of around 7.7 points of GDP3 over the period—in turn largely arising in the main oil-exporting countries of the region (Equatorial Guinea, Gabon, Cameroon, Nigeria, and the Republic of Congo). For nonresource related revenues, in contrast, there has been almost no change over the sample period—from an average of around 13 percent of GDP at the start of the period to closer to 14 percent 25 years later. In the resource countries themselves, nonresource related revenue has been essentially stagnant over the full period, and has declined from a peak of 14.7 percent of GDP in 1990 to 12.8 percent in 2005.
Figure 1. Tax Revenue Trends in SSA, 1980-2005 (Simple Averages)
All SSA Countries (%)
10
14
18
22
26
30
1980
1982
1984
1986
1988
1990
1992
1994
1996
1998
2000
2002
2004
Total tax revenue / GDP
Non-resource tax revenue / GDP
Resource countries (%)
10
14
18
22
26
30
1980
1982
1984
1986
1988
1990
1992
1994
1996
1998
2000
2002
2004
Total tax revenue / GDP
Non-resource tax revenue / GDP
Source: Author's compilation based on IMF staff reports and other documents. Note: Simple averages across the same groups of countries (40 of which 13 are resource countries).
The cross-country averages in Figures 1 are simple ones, so attach the same significance to smaller countries as to large. Figure 2 instead shows revenue developments when countries are weighted by their contemporaneous GDP. Two considerations come into play in moving
3 On a weighted average basis, and excluding South Africa, a large country with relatively little resource revenue, the contribution of resource revenue to the budgets of SSA resource countries increased from 11.7 percent of GDP in 1980 to 24 percent in 2005. The most notable increases occurred in Botswana (from 2.5 to 16.5 percent of GDP), Republic of Congo (from 8 to 32.4 percent), Equatorial Guinea (from nothing to 36.6 percent), Gabon (from 11 to 20 percent), and Nigeria (from 16.8 to 36.8 percent).

7
from simple to weighted averages, The first is the general observation, from the work of Rodrik (1988) and others, that smaller countries tend to have larger governments (perhaps because they tend to be more open, hence more vulnerable to shocks and so find a role for more interventionist government). This would point to weighted average tax ratios below the simple averages. The second consideration, however, is that some resource economies—notably Nigeria—are large; since such economies also tend to have larger governments, this points in the opposite direction, and of course also puts more stress on the performance of resource revenues. The latter effect is more evident in the data for the region as a whole than is the former, with the increase in the weighted average tax ratio, for instance, much more marked than is that in the simple, reflecting in no small part the greater weight attached to resource-rich Nigeria, whose tax ratio increased from about 30 percent in the early 1990s to over 42 percent at the end of the period.
Figure 2. Tax Revenue Trends in SSA, 1980–2005 (Weighted Averages)
All SSA Countries (%)
10
14
18
22
26
30
1980
1982
1984
1986
1988
1990
1992
1994
1996
1998
2000
2002
2004
Total tax revenue / GDP
Non-resource tax revenue / GDP
Resource countries (%)
10
14
18
22
26
30
1980
1982
1984
1986
1988
1990
1992
1994
1996
1998
2000
2002
2004
Total tax revenue / GDP
Non-resource tax revenue / GDP
Source: Author's compilation based on IMF staff reports and other documents. Note: Averages are weighted by contemporaneous GDP (40 of which 13 are resource countries).
Figure 3 reports revenue trends by income group (simple averages). Tax ratios have tended to increase in middle income countries—consistent with the observations above, since they are disproportionately resource rich (half of them being ‘resource’ countries, compared to only 20 percent of the low income countries). Experience in relation to nonresource related revenues has varied (second panel): these have been essentially flat in LICs, increased in LMICs, and are now noticeably lower in upper-middle income countries UMICs than they were in the 1980s. The weighted averages equivalent to Figure 3 (not reported here) reflect more clearly the two considerations noted above. For LICs, the weighted average tax ratio is consistently higher than the simple, and varies substantially more over time, primarily due to Nigeria. However,

8
for both LMICs and UMICs, weighted average tax ratios are generally lower than simple ratios since, for example, the higher weight of Cameroon in the LMIC group is offset by significantly higher tax ratios of small Lesotho, Swaziland and Namibia. These effects show more clearly in the nonresource tax ratios, particularly for LMICs. When nonresource tax ratios are considered, LICs also show lower weighted ratios—since the Nigeria effect is eliminated. Towards the end of the period, however, the weighted ratios for the UMIC group are higher than simple ratios, reflecting increases in both the size and the tax ratio of South Africa.
Figure 3. Tax Revenue Trends in SSA by Income Level, 1980–2005 (Simple Averages)
Total tax revenue / GDP (%)
8
12
16
20
24
28
32
1980
1982
1984
1986
1988
1990
1992
1994
1996
1998
2000
2002
2004
LICs LMICs UMICs
Non-resource tax revenue / GDP (%)
8
12
16
20
24
28
32
1980
1982
1984
1986
1988
1990
1992
1994
1996
1998
2000
2002
2004
LICs LMICs UMICs
Source: Author's compilation based on IMF staff reports and other documents. Note: Simple averages across countries grouped by 2005 income level according to the 2006 World Bank classification (see Appendix 2).

9
Figure 4. Composition of the Tax/GDP Ratio in SSA, 1980–2005 (Simple Averages)
0
1
2
3
4
5
6
7
1980
1982
1984
1986
1988
1990
1992
1994
1996
1998
2000
2002
2004
Trade tax revenue / GDP Indirect tax revenue / GDP
Income tax revenue / GDP Resource tax revenue / GDP
Source: Author's compilation based on IMF staff reports and other documents. Note: Simple averages across countries.
Developments in the revenue yields of the main tax categories are shown in Figure 4. The marked increase in resource revenues is again apparent. Also evident is the downward trend in trade taxes, from 6 to about 4 percent of GDP. Indirect taxes increased by broadly the same magnitude, while income taxes (mainly personal and nonresource corporate) remained at around 4 percent of GDP.4 These trends point to clear challenges ahead. For SSA countries without natural resources, enhancing revenue mobilization has evidently proved a considerable challenge, which pressures from globalization can only intensify in the coming years. Revenue performance in resource-rich countries, in contrast, has clearly been strong in recent years. The potential fiscal challenge for them is in dealing with the volatility of commodity prices and with the downturn, perhaps lengthy, that began in the latter part of 2008.
4 Social security contributions are excluded from income tax revenues due to incompleteness and unreliability of data. However, other payroll taxes not earmarked, which tend to be insignificant in SSA countries, are included in individual income tax revenues.

10
III. CORPORATE TAXATION AND TAX COMPETITION
Analyses of corporate tax competition and its consequences (including on government revenues) abound for OECD countries.5 Far less attention has been paid to the same issues in developing countries—despite the fact that they are actually more reliant on CIT revenue (though less so in SSA than elsewhere).6
A. Principles of Corporate Taxation in Developing Countries
The role of the CIT A first question to be faced in considering the future of the corporation tax in SSA is simply: What role should it be playing? A core result in the theory of tax design is that a small open economy—that is, one facing a fixed required after-tax return on investment determined in international markets—should have a zero source-based tax on the marginal return to capital. For with the net return required by investors fixed on world capital markets, any attempt by a single country to tax the capital income arising in its borders will simply cause capital to move elsewhere until the pre-tax return it earns rise enough to leave the after-tax return unchanged. In the process, the reduced capital intensity of production lowers the real return to less mobile factors, so that they—labor being a prime candidate—bear the real burden of the tax, not capital-providers. And the point is not simply one of how the tax burden is distributed: the reduced capital-labor ratio causes larger real income losses than would be sustained by instead taxing the immobile factors directly. And there is evidence that this point is not simply theoretical, with much of the real burden of the CIT indeed borne by labor.7 Given this basic result, why should SSA countries—mostly small and increasingly open to capital movements—tax corporate income at all? There are several possible reasons: When a country hosting an investment offers a lower CIT rate than does that in which
the investor (personal or corporate) resides, the benefit may flow not to the investor but to the treasury of the residence country. This is because countries that have residence-based income tax systems (such as the UK8 and US) tax income on a
5 See, for example, Devereux and Sørensen (2006), and Stewart and Webb (2006). 6 CIT revenue accounts for an average of around 17 percent of tax revenue in developing countries (Norregaard and Khan, 2007) compared to around 10 percent in OECD countries. For the dataset used in this paper, CIT revenues in SSA (excluding resource revenues) account for 8 percent of total revenues, and 10 percent of nonresource revenues. 7 Hassett and Mathur (2006), for example, find a strong and negative correlation between wages and corporate (statutory and effective) tax rates in a large sample of countries, including some in SSA. 8 The UK has announced that it intends to move to an essentially territorial system.

11
worldwide basis, providing a foreign tax credit for taxes paid in the host country: the total tax ultimately paid by the investor is thus determined by the residence country, not the source country. Indeed in such cases it is in the interest of the source country to set its tax no lower than that of the residence country, since otherwise it simply foregoes revenue that then accrues to the residence country—with no impact on the total tax paid by the investor. This consideration can be overstated, however. Some major residence countries, such as France, exempt active income arising abroad from their own taxation. And even when worldwide taxation is in place, residence country taxation can generally be deferred—and hence reduced in present value—by delaying the repatriation of profits.
Location-specific rents—that is, pure profits that are tied to some geographical location—such as those deriving from natural resources or access to a common internal market, can, in principle, be taxed at up to 100 percent without causing investors to look elsewhere. The taxation of such rents can be especially attractive: it is in principle nondistortionary, and the rents may otherwise accrue largely to foreigners (whose welfare, presumably, is of less concern than is that of national citizens). How important such rents are in practice, however, is unclear. Countries appear to compete, for instance, even in the taxation of natural resources, perhaps because of scarcity in the managerial and technical skills needed for resource extraction (Osmundsen, 2005).
The corporate tax also provides a back-up to the personal income tax: if corporations were not taxed (and in the absence, as in most developing countries, of fully effective taxation of capital gains), capital and to some extent labor income might go largely untaxed as rewards would be taken in the form of undistributed corporate earnings.
Perhaps most important for developing countries, with limited administrative capacity, is that corporations provide a relatively easy tax handle. Since investment is typically strongly concentrated in a relatively small number of large corporations, the CIT is relatively easy to collect (with the spread of large taxpayer units in recent years intended to facilitate this still further). Some have even suggested that developing countries may have an incentive to increase barriers to market entry by smaller firms—through, for example, a complex and costly regulatory system—so as to keep a high concentration of profits in large corporations, from which they can easily collect taxes (Auriol and Warlters, 2005).
All this leaves a more important role for the CIT in SSA, as elsewhere, than the core theoretical result cited above might suggest. Any prospect of its erosion through international tax competition would be significant cause for concern.

12
The nature of corporate tax competition Corporate tax competition—meaning broadly the design of tax regimes with a view to national rather than some wider collective interest9—commonly takes two main forms. First, countries may offer a low statutory rate of CIT, available to all firms. This has a number of attractions: (1) it lowers the average effective tax rate, which (as explained in Box 2) is an important factor in investors’ decisions as to where to locate their investments; (2) it reduces the incentive for tax-planning—through transfer pricing and financial arrangements—to shift taxable profits from high- to low-tax countries, which depends mainly on the statutory tax rate; and, (3) it reduces the wide range of distortions (across types of investment, for instance, and financing methods (such as the choice between debt and equity) commonly created by nonneutralities in the base of the CIT. The second main instrument of tax competition is the provision of selective preferential tax treatment, targeted on particular categories of investments and/or particular taxpayers. Such devices include: tax holidays, including through Free Zone (FZ) laws; investment tax credits restricted to particular activities (such as R&D, or investment located in particular regions) and reduced tax rates for particular sectors. Do these instruments actually affect investment decisions, both in general and, in particular, for FDI? Available evidence for SSA will be reviewed below, but wider experience and analyses also suggests important lessons. The large body of empirical evidence on the sensitivity of the location of investment to tax considerations—which is mainly for OECD countries—does suggest that taxation can influence investment decisions, both domestic and in terms of FDI: on the latter, see for instance the meta-study in de Mooij and Ederveen (2003). Importantly, there is strong evidence that other considerations—such as good infrastructure, quality and cost of labor, and good governance—matter more than taxation. This is a repeated finding in surveys and analyses of business opinion, a recent example being McKinsey (2003). The International Finance Corporation (IFC), in its much cited publication Doing Business, stresses nine non-tax factors that affect the decision to invest, including registering and protecting property, trading across borders, enforcing contracts, and accessing labor. And the results of Dharmapala and Hines (2007) stress that without good governance tax advantages may have little impact on FDI.
9 Wilson (1999) reviews the literature on tax competition, and Keen (2007) provides a nontechnical account.

13
Box 2. Corporation Tax: Which Tax Rate Matters?
Three tax rate measures are frequently used in analyzing the effect of taxes on investment decisions. They are interconnected, but impact different aspects of business decisions. The statutory tax rate: The headline CIT rate is visible, readily understood, and easy to compare across countries. But since the final tax liability on an investment is determined by the product of this rate and the tax base (reflecting, inter alia, the tax treatment of deprecation and financing costs) and since other taxes could also apply to investments (tariffs, cascading sales taxes, stamp duties, and so on), the statutory rate is of limited use in assessing the impact of the tax system on investment decisions. It is the statutory rate, however, that is most relevant for tax planning through shifting income across tax jurisdictions—since the values of the deductions and liabilities involved depend simply on the statutory rate. The marginal effective tax rate: This measure, which combines the effect of the statutory tax rate and key features of the CIT base, indicates by how much the corporate tax increases the rate of return that an investment must earn before tax in order to yield the minimum required after tax return. It thus summarizes the impact of the CIT on how much to invest in any given country. The average effective tax rate: This measures the present value of taxes on a project relative to the present value of the pre-tax revenue stream it generates. All else equal, a project will be located in whichever country offers the lowest average effective rate. That is, it shapes where to invest. It can be shown that this average effective rate is a weighted average of the statutory and marginal effective rates (Devereux and Griffith, 2003).
There is little firm evidence on the relative merits of alternative forms of preferential tax treatment, though the same observations on the primacy of other considerations naturally apply to all. There are good reasons to suppose, however, that measures which directly reduce the cost of investing are more effective than tax holidays, which are generally regarded by practitioners as the least attractive form of incentive, for reasons spelt out in Box 3. Such investment-related incentive measures include: investment allowances, which are deductions for investment in addition to depreciation allowances (so that more than 100 percent of an asset’s value is written off for tax purposes over its lifetime); investment tax credits, typically a percentage of the cost of the investment that directly reduces the CIT liability; and accelerated depreciation, which allows for a more rapid deduction from the CIT base of capital consumption, relative to its true economic depreciation—that is, wear and tear and obsolescence. All of these measures have the effect of directly reducing the after tax cost of making an investment.

14
Box 3. The Dangers of Tax Holidays
Tax holidays are time-limited exemptions from the CIT, which may or may not be renewable. They are widely regarded as a particularly ill-designed form of investment incentive, and one that poses considerable dangers to the wider tax system: Unless offered for periods so long that investors are likely to doubt their credibility, they are most
attractive to the most footloose firms, which are those likely to bring the least benefit to the wider economy (such as textile and assembly of light manufacturing goods).
They are open to abuse, undermining tax revenue by providing entrepreneurs with an incentive to use transfer pricing and financial arrangements—by arranging, for example, for taxpaying companies (able to deduct the interest payments) to borrow from holiday companies (not taxable on interest received)—that shift taxable income to where it is not taxed. Such devices can operate across national borders, and also between domestic firms. However clever the legal provisions crafted to address this risk, experience suggests that companies will prove adept in finding ways to avoid them. Even the most developed tax administrations have great difficulty dealing with such abuse. Weaker tax administrations are likely to do better allocating their scarce capacity to strengthening the basic tax system.
For foreign investors resident in countries operating a foreign tax credit system, the benefits of the holiday will be undone when profits are repatriated (as discussed in the text above). All the holiday then achieves (unless a double tax agreement with the residence country provides for tax sparing—which is now rarely the case) is a transfer of tax revenues to the residence country. It may well be, however, that multinationals have enough ways of deferring repatriation that this is not a major consideration in practice.
Unless depreciation allowances can be carried forward out of the holiday period, the incentive to invest towards the end of a holiday may actually be lower than it would be under the regular corporate tax system, as investors defer investment in order to take full advantage of such allowances.
By offering tax holidays, a government is in effect, to some degree, signaling its own untrustworthiness in tax matters: otherwise a firm that intends to stay beyond the holiday period (which is presumably the type that it is the object of policy to attract) would find even more attractive the promise of a low, constant rate of tax implying a present value of payments below that implied by the holiday.
Many companies apparently find holidays attractive because they spare them the necessity of dealing with corrupt or inefficient tax administrations. Thus offering a holiday can itself signal a corrupt or inefficient tax administration, and distract from the need to address such underlying problems.
The impact of tax competition on CIT revenues has been much studied for the developed countries, but not for developing. In the OECD, CIT revenue has generally held up despite significant reductions in the statutory rate of CIT since the mid-1980s (Stewart and Webb, 2006, Norregaard and Khan, 2007, and Devereux and Sørensen, 2006). A number of explanations have been given:

15
CIT bases have been broadened. For example, Devereux and Sørensen (2006) document a decrease in depreciation allowances in the EU over the past two decades. Corporate tax reforms in the U.S. and Canada in the mid 1980s were also aimed at lowering the top CIT rate and scaling back incentives. Internationally-concerted efforts, notably the EU Code of Conduct on business taxation, underpinned by the EU rules on state aid, have been made to curb tax incentives that are believed to be collectively damaging (though their direct impact on revenues is likely to have been slight).
The share of corporate profits in GDP has increased. Ellis and Smith (2007) document a significant increase in profits (including of unincorporated business) in most OECD countries since the mid-1980s. Quite why the profit share has increased is unclear. The same study cites technological developments and the relative bargaining powers of companies in regulated product markets. Azmat, Manning and Van Reenen (2007) find that privatization played a significant role in the EU in reducing the share of labor in GDP.
Corporate profits have become more volatile. Coupled with the asymmetric treatment of losses, this has increased average tax rates and CIT revenues (tax being due when profits are positive, but no rebate being paid when they are negative). Auerbach (2007) shows that this is precisely what happened in the U.S. in recent years, where corporate losses have been important even in years of increasing profitability such as before the 2000 dotcom collapse.
Reduced CIT rates may have had Laffer-type effects, leading to such a large increase in investment that CIT revenues actually increased. Marginal effective tax rates, however, have generally not fallen greatly (Devereux, Griffith and Klemm, 2002), so that the impact on investment levels might not be expected to be great.
Other possible factors include an increase in incorporation as a form of doing business—perhaps itself a tax-induced phenomenon (as CIT rates have fallen more dramatically than personal tax rates)10—and (somewhat related to privatization, technological development, and financial market deregulation) the increase in the profitability of certain sectors, namely financial intermediation and telecommunications.
The relative force of these potential explanations remains unclear. And the buoyancy of CIT revenues has not eliminated concerns that they could ultimately decline. There is little sign that the downward trend in statutory CIT rates is ending—Germany, for example, having recently cut its rate again—and, as Devereux and Sørensen (2006) suggest, the scope for such further cuts in the EU without loss of revenue may be very limited. Current financial market
10 Mooij and Nicodeme (2006).

16
turbulence is likely to reveal deeper vulnerabilities in CIT performance, as it is in developed economies. These issues have attracted almost no attention for developing countries. The only exception of which we are aware is Keen and Simone (2004), who find that both statutory CIT rates and revenues declined in LICs during the 1990s, and provide evidence that an increase in the use of tax incentives may have contributed to this result. The next section reviews more specifically, and over a longer period, the experience of SSA.
B. Trends in CIT Rates and Revenues
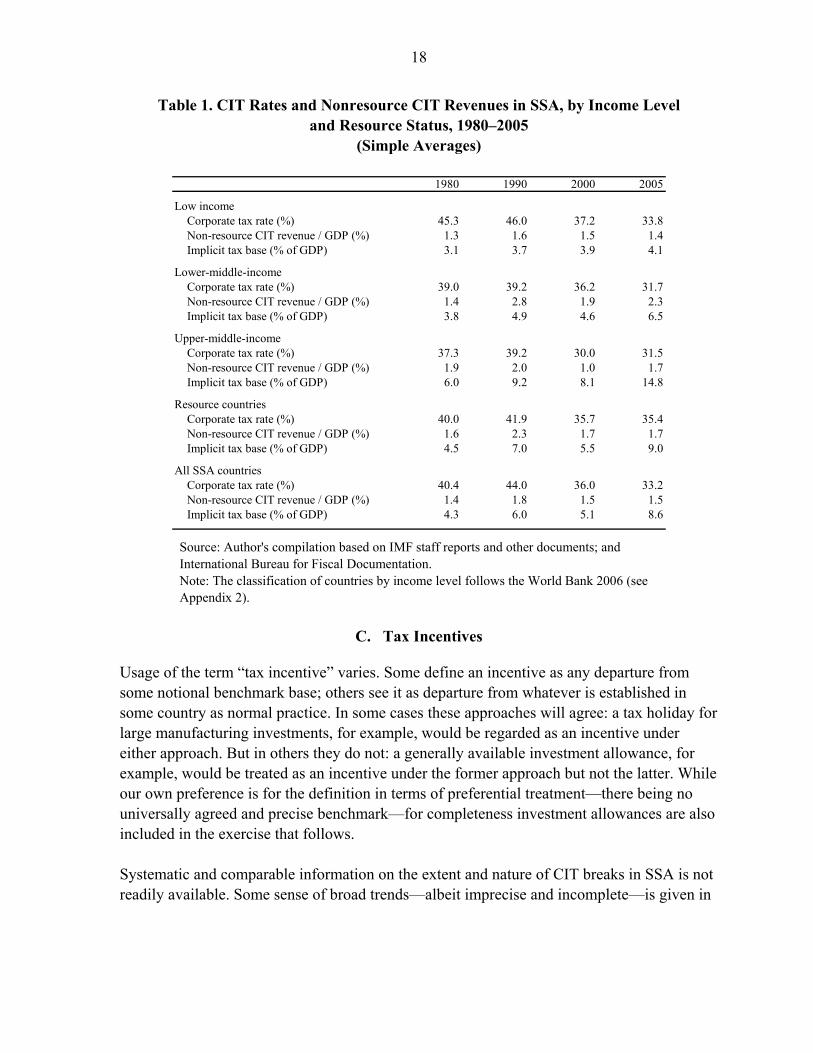
Figure 5 reports developments in the statutory rate of CIT and in nonresource CIT revenues between 1980 and 2005.11 This can be separated into two distinct subperiods. In the 1980s, the average statutory CIT rate increased slightly, while the ratio of nonresource CIT to GDP and the implicit tax base—defined as revenue, relative to GDP, divided by the (highest) statutory rate12—both fluctuated fairly modestly. Developments since 1990 have been very different: the average statutory CIT rate has fallen markedly (from about 44 to 33 percent), yet revenue has remained broadly unchanged, reflecting an increase in the implicit tax base (from 5.1 percent of GDP in 2000 to 8.6 percent in 2005). These general trends hide differences across countries grouped by income level (Table 1). The reduction in the average statutory CIT rate has been most marked in low-income countries, where, after remaining broadly constant, it has dropped by 0.8 percentage points per year since 1990. Rates nevertheless remain high in these countries, relative both to other countries in SSA and wider international norms. In the middle-income countries, statutory CIT rates are both lower and have fallen less. The table also shows that, as one would expect, statutory rates are relatively high in resource countries, reflecting the potential for extracting location-specific resource rents through the CIT; more puzzling is that they have fallen markedly, though this would be consistent with competition for limited specialist resources along the lines mentioned above. Revenues evidently fluctuate quite markedly in some cases, but the broad picture over the full period is that the average nonresource CIT yield remained relatively constant in LICs and resource countries, increased in LMICs but fell in UMICs.
11 The sample size varies slightly over the period: it covers all 40 countries in 2000 and 2005, 38 in 1990, and 35 in 1980. Data for a small number of countries are missing for some years between these four years, which may underestimate slightly the speed of the decline in the average CIT rate. 12 This abstracts from the application of multiple CIT rates in some countries.

17
Figure 5. CIT Rates and Nonresource CIT Revenues in SSA, 1980–2005 (Simple Averages)
0
1
2
3
4
5
6
7
8
9
10
1980
1982
1984
1986
1988
1990
1992
1994
1996
1998
2000
2002
2004
0
5
10
15
20
25
30
35
40
45
50
CIT Revenue / GDP (%) CIT Base (% of GDP) Statutory CIT rate (right axis) (%)
Source: Author's compilation based on IMF staff reports and other documents; and International Bureau for Fiscal Documentation. Note: Recall that CIT revenue in this paper exclude oil and gas, and mining companies.
The impression of the revenue performance of the nonresource CIT that emerges here is less pessimistic than that of Keen and Simone (2005). This reflects their focus on the period from the early 1990s to around 2000, over which, Table 1 confirms, revenues did indeed fall in all country groupings. Viewed over the full period from 1980 to 2005, however, nonresource revenues have been constant or increased in all but UMICs. It remains the case, nevertheless, that they are in all cases lower than in 1990. Clearly the volatility of CIT revenues, in SSA and elsewhere, makes the detection of trends difficult. What does seem clear, however, is that the revenue impact of reductions in the statutory rate has been substantially cushioned, or even offset, by a broadening of the nonresource CIT base. What explains this broadening, however, remains unclear, and has been much less studied than has the same question for OECD economies. For SSAs, deliberate base-broadening measures seem to have been fairly modest—indeed, as will be seen, there are strong signs of base-narrowing. The explanation thus seems to lie in an increase in the share of corporate profits in GDP, though the reasons for that in turn remain, as yet, unexplored.
18
Table 1. CIT Rates and Nonresource CIT Revenues in SSA, by Income Level and Resource Status, 1980–2005
(Simple Averages)
1980 1990 2000 2005
Low incomeCorporate tax rate (%) 45.3 46.0 37.2 33.8Non-resource CIT revenue / GDP (%) 1.3 1.6 1.5 1.4Implicit tax base (% of GDP) 3.1 3.7 3.9 4.1
Lower-middle-incomeCorporate tax rate (%) 39.0 39.2 36.2 31.7Non-resource CIT revenue / GDP (%) 1.4 2.8 1.9 2.3Implicit tax base (% of GDP) 3.8 4.9 4.6 6.5
Upper-middle-incomeCorporate tax rate (%) 37.3 39.2 30.0 31.5Non-resource CIT revenue / GDP (%) 1.9 2.0 1.0 1.7Implicit tax base (% of GDP) 6.0 9.2 8.1 14.8
Resource countriesCorporate tax rate (%) 40.0 41.9 35.7 35.4Non-resource CIT revenue / GDP (%) 1.6 2.3 1.7 1.7Implicit tax base (% of GDP) 4.5 7.0 5.5 9.0
All SSA countriesCorporate tax rate (%) 40.4 44.0 36.0 33.2Non-resource CIT revenue / GDP (%) 1.4 1.8 1.5 1.5Implicit tax base (% of GDP) 4.3 6.0 5.1 8.6
Source: Author's compilation based on IMF staff reports and other documents; and International Bureau for Fiscal Documentation. Note: The classification of countries by income level follows the World Bank 2006 (see Appendix 2).
C. Tax Incentives
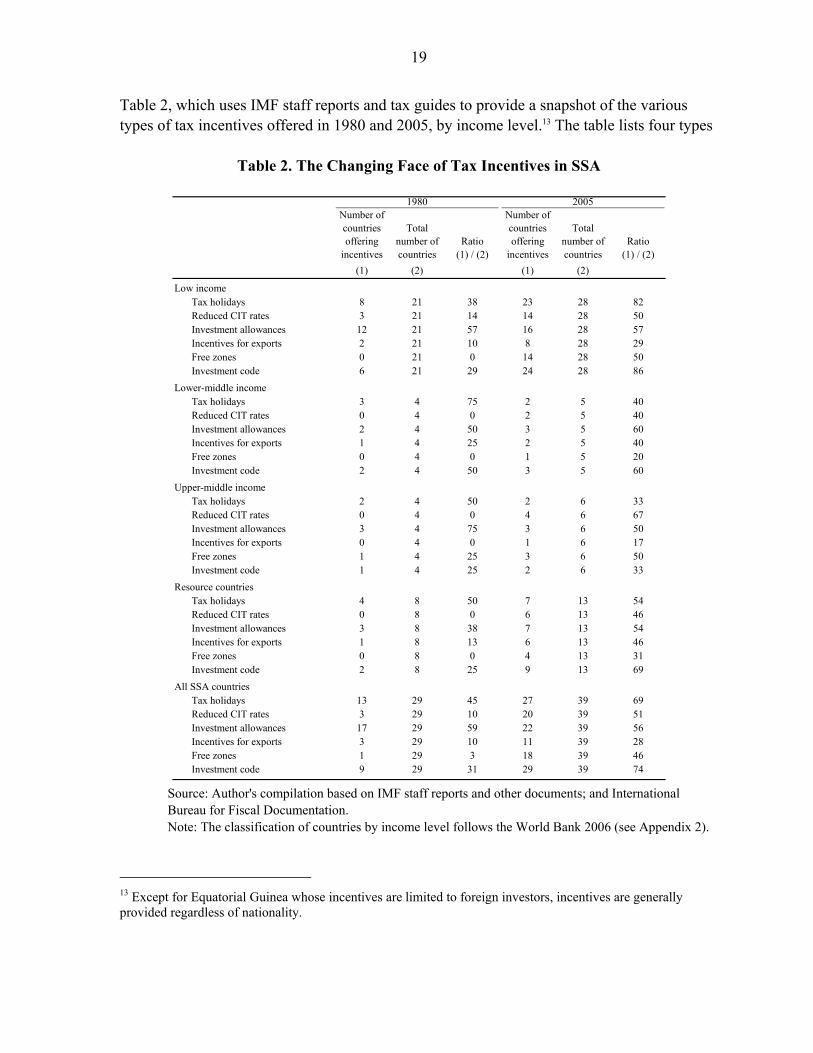
Usage of the term “tax incentive” varies. Some define an incentive as any departure from some notional benchmark base; others see it as departure from whatever is established in some country as normal practice. In some cases these approaches will agree: a tax holiday for large manufacturing investments, for example, would be regarded as an incentive under either approach. But in others they do not: a generally available investment allowance, for example, would be treated as an incentive under the former approach but not the latter. While our own preference is for the definition in terms of preferential treatment—there being no universally agreed and precise benchmark—for completeness investment allowances are also included in the exercise that follows. Systematic and comparable information on the extent and nature of CIT breaks in SSA is not readily available. Some sense of broad trends—albeit imprecise and incomplete—is given in
19
Table 2, which uses IMF staff reports and tax guides to provide a snapshot of the various types of tax incentives offered in 1980 and 2005, by income level.13 The table lists four types
Table 2. The Changing Face of Tax Incentives in SSA
Number of countries offering
incentives
Total number of countries
Ratio (1) / (2)
Number of countries offering
incentives
Total number of countries
Ratio (1) / (2)
(1) (2) (1) (2)
Low incomeTax holidays 8 21 38 23 28 82Reduced CIT rates 3 21 14 14 28 50Investment allowances 12 21 57 16 28 57Incentives for exports 2 21 10 8 28 29Free zones 0 21 0 14 28 50Investment code 6 21 29 24 28 86
Lower-middle incomeTax holidays 3 4 75 2 5 40Reduced CIT rates 0 4 0 2 5 40Investment allowances 2 4 50 3 5 60Incentives for exports 1 4 25 2 5 40Free zones 0 4 0 1 5 20Investment code 2 4 50 3 5 60
Upper-middle incomeTax holidays 2 4 50 2 6 33Reduced CIT rates 0 4 0 4 6 67Investment allowances 3 4 75 3 6 50Incentives for exports 0 4 0 1 6 17Free zones 1 4 25 3 6 50Investment code 1 4 25 2 6 33
Resource countriesTax holidays 4 8 50 7 13 54Reduced CIT rates 0 8 0 6 13 46Investment allowances 3 8 38 7 13 54Incentives for exports 1 8 13 6 13 46Free zones 0 8 0 4 13 31Investment code 2 8 25 9 13 69
All SSA countriesTax holidays 13 29 45 27 39 69Reduced CIT rates 3 29 10 20 39 51Investment allowances 17 29 59 22 39 56Incentives for exports 3 29 10 11 39 28Free zones 1 29 3 18 39 46Investment code 9 29 31 29 39 74
20051980
Source: Author's compilation based on IMF staff reports and other documents; and International Bureau for Fiscal Documentation. Note: The classification of countries by income level follows the World Bank 2006 (see Appendix 2).
13 Except for Equatorial Guinea whose incentives are limited to foreign investors, incentives are generally provided regardless of nationality.

20
of incentives (tax holidays, reduced CIT rates, investment allowances, and CIT breaks for exports),14 and two laws (investment code (IC) and free zone (FZ))15 that provide for either one or a combination of these incentives. These laws were included in Table 2 since in SSA they invariably (except for the FZ law in South Africa) offer tax incentives, particularly tax holidays, and are widely used to signal the existence of tax incentives (though countries may of course also provide incentives under the general tax code or by ministerial decree). Thus some given type of incentive, such as tax holidays, could be provided in the IC, the general tax code, and/or the FZ law. (This also means, it should be noted, that the categories in the table are not mutually exclusive: a holiday available in an FZ, for example, gives a positive entry under both ‘tax holidays’ and ‘FZ.’) A number of observations stand out from the table.16 First, and most important, tax incentives are much more widely provided in SSA today than they were in the early 1980s. It should be noted, however, that a casual reading of SSA countries’ tax laws in the early 1980s reveals that several provided incentives on an ad hoc basis, subject only to the authorities’ judgment that the investment was beneficial for economic development. These types of incentives are hard to document, however, and are not included in Table 2: it may thus overstate the increase in the use of incentives. But it can be argued that these (negotiated) incentives are of lesser value to investors (particularly foreign ones) to the extent that they are not transparent and could be withdrawn at anytime and without notice at the authorities’ discretion(which is doubtless one reason why incentives today are provided mainly through ICs and FZs).17 Second, CIT holidays have replaced investment allowances as the most common form of incentive. Over two-third of the countries provide tax holidays today; less than 50 percent did
14 CIT incentives for exports include CIT rate reductions (or exemption) for export-related profits (with the profit share eligible for the incentive typically calculated as the ratio of export to total sales). 15 “Investment code” is the generic name given to laws regulating real investment, including FDI. These are known by different names in different countries: Investment Promotion Act, Development Ordinance, Pioneer Industries Encouragement Act, Industrial Development Act, etc. “Free Zone” is the generic name used for zones in which established firms benefit from a range of non-tax and tax benefits. These are also called in some countries Export Processing Zones, Free Trade Zones, International Trade Zones, Economic Development Zones, etc. Generally, FZs are associated with exemptions from various taxes on business, such as business license fees, and tariff and other indirect taxes. The main focus of this paper is the CIT-related incentives. 16 The data for the early 1980s were taken from IMF staff reports and reflect the tax system in one year in the period 1978-83. Although generally comprehensive, these data may not cover all codes with tax provisions in a given country. The data for 2005 were taken mainly from the country chapters of the International Bureau for Fiscal Documentation, and typically reflect the tax system in one year in the period 2000-2007. Among the difficulties in interpreting these data are those from their discrete nature; the existence of a tax holiday may be discerned from a tax summary, for instance, but not the potential importance of the activities to which it applies. 17 An exception perhaps is investment in the oil sector, which is often regulated by production sharing agreements that may be subject to international arbitration.

21
so in 1980. This runs strongly counter, of course, to the standard tax policy advice, which, as discussed above, favors incentives targeting the cost of investment rather than its result.18 Third, there is a dramatic increase in the number of countries using FZ laws—and here, recall, we refer only to zones offering special corporate tax treatment—to attract footloose FDI: only one country in the sample had a free zone in 1980, while 17 did in 2005. The proliferation of FZs offering CIT incentives is a significant potential risk to the revenue base. This risk is not only to CIT revenues, but more generally to income tax and indirect tax revenues too: in some countries, FZ companies succeed in securing lower personal income tax and social security contributions for their FZ employees (as in Djibouti, for example, until it was eliminated in 2009); and VAT and excise taxes enforcement issues on trade between FZ companies—not subject typically to VAT—and the taxed economy are well known in SSA. Consistent with the possibility of revenue leakage through transfer pricing and other tax planning mechanisms between related companies in the zone and the taxed-economy, FZ companies have been found—though it is not always possible to investigate this—to declare noticeably higher profit rates than those outside the zone. Anecdotal evidence also suggests that tax incentives for firms in FZs put pressure on policymakers to provide similar incentives to firms outside the zones, through either the general tax code or investment codes. Free zones, it is important to note, can serve a useful purpose. They can provide high quality infrastructure and services for export companies and foreign investment, and may also be used to ease problems exporters might otherwise have in obtaining remission of import duties and refund of VAT (though the ultimate solution for that is of course to improve procedures more generally). The more fundamental difficulties with which we are concerned here arises when FZ companies receive other tax advantages too, such as the tax holidays they generally enjoy in SSA. In some cases, moreover (as in Madagascar, for example), companies are given FZ status even if not located in a secured area, so obtaining no particular infrastructure benefit and posing considerable control problems in relation to customs and VAT. Fourth, 74 percent of SSA countries had an IC in 2005, compared to only 31 percent in 1980. Typically, tax incentives provided under ICs in SSA countries include tax holidays, and tariff and VAT exemptions. These incentives are often conditional on one or a combination of: the size of the investment and its location (with the aim to develop the regions); industry classification; and, employment and value added creation. In practice, these conditions are relatively easy to meet ex-ante but notoriously difficult to monitor and verify ex-post, even for experienced and well staffed administrations.19
18 See, for example, Zee, Stotsky and Ley (2002), and Nov (2005). 19 As in the case of FZs, it should be stressed that ICs can be useful for a number of non-tax reasons, including in providing government assurances for investors to undertake foreign exchange transactions without
(continued…)
22
Fifth, low-income countries use tax incentives more extensively than do middle-income countries. They also tend to favor the use of tax holidays (relative to other types of incentives)—Senegal, for example, introduced Free Zone provisions including a 50-year tax holiday—while MICs tend to favor reduced CIT rates and investment allowances. Finally, there has been a marked increase in tax incentives for exporters (typically a reduction in the CIT rate or exemption from tax on income earned from export activities), mainly in LICs and resource countries. Such incentives constitute prohibited export subsidies under the WTO rules,20 except for the very poorest countries,21 (although complaints from other WTO members, which are required if enforcement action is to be taken, have rarely if ever been filed). Since a primary purpose of tax incentives of various kinds is often to attract foreign direct investment, it is natural to ask how much FDI has increased in SSA over the period. Some broad indication is provided in Figure 6. This plots CIT rates and inward FDI for SSA countries as a whole, grouped by income level, and by resource category. Overall, there is a clear positive correlation between CIT rate reductions and FDI. But correlation is not causation. Differences among the country groups are telling, and again suggest that more than tax effects have been at work. First, the increase in FDI is clearly most noticeable in resource and upper-middle-income countries (the latter containing two major oil producers, Equatorial Guinea and Gabon), to which distinct effects from commodity price movements evidently apply. Second, while as noted above, the decline in the average CIT rate was most pronounced in low-income countries (excluding natural resource countries)—from about 45 percent in 1980 to 34 percent in 2005—FDI there increased only from less than 1 percent of GDP to about 2.5 percent, broadly the same as for all nonresource countries. In summary, tax competition in SSA has largely taken the form of tax holidays for certain types of investments. CIT rates, although on a downward trend since 1990, are not low by international standards, and remain particularly high in LICs. It is possible that the revenue imperative prevented policymakers from making across-the-board CIT rate cuts, or that policymakers believed that targeted holidays work best to attract mobile investment while keeping rates higher on immobile ones. If so, it is hard to detect net gains from this strategy.
restrictions, safeguards against asset appropriations, and recourse to international arbitration in case governments do not fulfill their obligations. The concern here is solely with the tax aspects. 20 GATT Article XVI:4 and Agreement on Subsidies and Countervailing Measures. The latter specifically prohibits the “full or partial remission, or deferral specifically related to exports, of direct taxes or social welfare charges paid or payable by industrial or commercial enterprises.” 21 These “Annex VII” countries comprise those designated by the United Nations as least-developed countries, with a number of named countries to be excluded from this exemption when their per capita GNP exceeds $1,000 per annum.

23
Figure 6. Statutory CIT Rates and FDI in SSA, by Income Level and Resource Status, 1980–2005 (Simple Averages)
All SSA countries (%)
0
10
20
30
40
50
1980
1984
1988
1992
1996
2000
2004
-5
0
5
10
15
20
CIT rates FDI inward / GDP (right axis)
Resource Countries (%)
0
10
20
30
40
50
1980
1984
1988
1992
1996
2000
2004
-5
0
5
10
15
20
CIT rates FDI inward / GDP (right axis)
Low-income countries (%)
0
10
20
30
40
50
1980
1984
1988
1992
1996
2000
2004
-5
0
5
10
15
20
CIT rates FDI inward / GDP (right axis)
Low-income excluding resource coutries (%)
0
10
20
30
40
50
1980
1984
1988
1992
1996
2000
2004
-5
0
5
10
15
20
CIT rates FDI inward / GDP (right axis)
Lower-middle-income countries (%)
0
10
20
30
40
50
1980
1984
1988
1992
1996
2000
2004
-5
0
5
10
15
20
CIT rates FDI inward / GDP (right axis)
Upper-middle-income countries (%)
0
10
20
30
40
50
1980
1984
1988
1992
1996
2000
2004
-5
0
5
10
15
20
CIT rates FDI inward / GDP (right axis)
Source: Author's compilation based on IMF staff reports and other documents; and International Bureau for Fiscal Documentation. Note: The variability in the CIT rate for upper middle-income countries in the 1980s is due to missing data for three out of five countries.

24
D. Policy Implications
The core CIT challenge that SSA faces is in stemming, and reversing, the proliferation of incentives whose effectiveness is, at best, unclear. This is important both in itself, in avoiding unnecessary distortions, and in protecting revenues that are likely to come under continued and perhaps increasing pressure from the worldwide trend towards lower statutory rates. Scaling back incentives unilaterally can be daunting, given the knowledge that other countries continue to offer them. There are, however, many examples of countries that have done so successfully, or are in the process of doing so (see Box 4). A coordinated response, nevertheless, clearly has particular appeal as a response to the possibility of uncoordinated corporate tax design leading to mutually harmful outcomes. Achieving such cooperation raises both institutional and substantive issues. The first question concerns the set of countries amongst which some degree of cooperation might be achieved. Evidently, coordination is generally most effective when all countries participate; otherwise there remains the risk of adverse effects from tax–setting in nonparticipating countries. The potential benefits from measures of tax coordination among SSA countries, or any subset, will be reduced, for instance, if capital instead moves to countries outside the agreement, whether elsewhere in SSA or in the wider world. But while incomplete participation may reduce the benefits of cooperation, it seems unlikely to eliminate them (Konrad and Schjelderup, 1999). What is most important is to achieve cooperation amongst those countries likely to be in the most direct competition for mobile capital, which are likely to be those joined in free trade area arrangements (so that the internal market can be served from any of them): there is evidence, for example, that taxes have little impact on U.S. multinationals’ decisions as to whether to open a plant in the EU, but, conditional on such a decision being made, taxes do affect where it is located (Devereux and Griffith, 1998). A second institutional question for SSA countries is whether coordination should take a loose form, such as a code of conduct, or something more binding, such as an international treaty commitment. The EU experience is helpful in this regard. Many believe that the state aid rules, which are legally binding, accomplished more than the nonbinding code of conduct. In Central America too, there has been a sense that treaty commitments are needed. One other institutional lesson might be drawn from the experience, and arguably the mistakes, of the EU: difficult as it is, cooperation in CIT matters may be best established early in the integration process rather than later.

25
Box 4. Scaling Back Tax Incentives—Some Examples Egypt passed a new income tax law in mid-2005 that reduced the top marginal tax rates on income and profits from 32 to 20 percent for individuals and from 40 to 20 percent for corporations and partnerships (rates for petroleum, the Suez Canal authority, and the central bank were left at 40 percent). This reform also increased the exemption threshold, liberalized normal depreciation (equipment and machinery are now eligible for a 30 percent deduction in the first year of use; normal depreciation rates apply afterwards to the remaining balance), and provided for the phasing out of tax holidays while grandfathering current beneficiaries. Importantly, these reforms have been accompanied by extensive and continuing reforms of tax administration, including the successful introduction of self-assessment and a reform of the tax treatment of small- and medium-size enterprises. Between 2005 and 2006, FDI into Egypt doubled. In its 2006 budget, Mauritius normalized the taxation of its EPZ (export processing zone companies and others) with non-EPZ sectors, and removed all provisions relating to tax credits and tax holidays (except for a four-year income tax holiday for small business). At the same time, the corporate tax rate was reduced from 25 to 22.5 percent, effective July 1, 2007, and a further reduction to 15 percent, effective July 1, 2008, was introduced in 2007 (the personal income tax rate structure was also changed to a single rate of 15 percent). Depreciation was shifted from straight line to declining balance for all assets, except for non-hotel buildings, and the ceiling for equipment or machinery to be fully expensed in the first year was raised from Rs 10,000 to Rs 30,000. China announced in December 2007 that it is reforming its foreign income tax regime to end a five-year break (two years at zero percent, then three at half the standard rate of 33 percent), in favor of a single rate of 25 percent.1 Reduced CIT rates (of 15 percent and 24 percent) are also to be eliminated in favor of the single 25 percent rate. The Slovak Republic adopted in 2004 a single rate of 19 percent applied to both corporate and personal income. The reduction in the corporation tax, previously at 25 percent, was combined with more rapid depreciation, more generous carry forward rules, the elimination of tax holidays for new enterprises and tighter rules in respect of provisioning and reserves. ________________________ 1 Under the proposed policy change, current holidays are grandfathered, and the low CIT rates are phased out gradually over 2008–12.
With respect to the form that cooperation might take, there are two elements to consider: the rate of the CIT and its base.22 The most obvious form of rate coordination might appear to be agreement on a minimum statutory rate, something that already exists in some subregions in the excise tax area. A minimum could maintain rates at a level above the level they would reach under uncoordinated tax competition. But since effective tax rates depend on both the rate and the base, coordinating through minimum statutory rates alone may not have the intended effect—countries could still compete, for example, by narrowing their CIT bases so
22 We do not discuss here—though they would need to be considered if steps were to be taken towards cooperation in this area—other forms of coordination, such as formula apportionment of the kind now under discussion in the EU.

26
as to lower their average effective tax rates. Some form of base coordination is thus likely to be needed for any effective form of cooperation. A sensible first step would be to focus on limiting the most damaging CIT incentives, notably tax holidays and export incentives. Countries might commit to eliminating, prospectively, all CIT incentives to exports and tax holidays available, including in FZ laws and ICs—while grandfathering, so far as is reasonable, tax benefits already granted. This base broadening would allow statutory rates to be brought closer to international levels (say in upper 20s) without jeopardizing revenues. As noted earlier, this does not mean that FZs and ICs should be eliminated, since other aspects of these laws could be useful tools of development in their own rights. Beyond this, a case can also be made for restricting the ability to offer differentially low CIT rates for particular sectors. In principle such differentiation could serve a useful purpose: this is because it may, in principle, be better to allow countries to compete especially aggressively over particularly mobile activities: preventing them from offering preferential treatment to such activities could worsen matters by leading to tax competition that is less aggressive but covers a wider range of activities (Keen, 1999).23 For example, there is a strong case for taxing resource activities (immobile) at a higher rate than nonresource activities (with varying degrees of mobility)—as some countries in SSA, such as Cameroon, do.24 But the practical force of these considerations is unclear. Beyond the resource case, delineating the mobile portion of the corporate tax base from the nonmobile one could be problematic, and have administration and compliance costs implications. Moreover, preferential treatment involves all the difficulties of potential profit-shifting discussed above; and it is difficult, from a political economy point of view, to tax some sectors at lower rates then others.25 Offering moderate tax treatment for all, rather than preferential treatment for some, seems the surer guide to policy. With the possibilities for mutually damaging competition through base eroding and preferential measures limited by agreement on these points, a minimum rate of CIT (perhaps limited to nonresource activities) may serve to limit downward rate pressures not only from profit-shifting activities but also from attempts to reduce effective tax rates on domestic investment. At the same time, being only a minimum, it would preserve national autonomy to set higher rates if so desired. To preserve the integrity of the tax base while ensuring
23 See also Janeba and Smart (2000), who explore this result in more general circumstances. 24 Others, however, do the opposite: the DRC, for example, taxes mining profits at 30 percent, below the general rate of 40 percent. 25 Panagariya and Rodrik (1996) develop this argument in the area of trade policy, arguing that a uniform tariff is likely to generate less lobbying activity for a lower tariff than is a regime under which tariffs can differ by sector. The argument here is also similar to that often made for a single positive rate of VAT: though not in theory ideal, difficulties of identifying what is ideal, combined with administrative and lobbying concerns, make uniform treatment the safest benchmark.

27
reasonable incentives to invest, however, agreement on a minimum rate may ultimately be less important than agreement to scale back the more questionable forms of incentive. By way of illustration, Box 5 lists a number of guiding principles that could form the basis of a code of conduct or treaty agreement, enforced by moral obligation or through the courts. These principles cover competition through both the tax base and a minimum rate. Negotiating and implementing any such agreement would be a substantial undertaking, being demanding both politically and technically. It requires, for instance, a monitoring framework and system for exchange of information (on tax rules and changes), which have proven difficult to accomplish effectively in SSA (for instance, in enforcing the common external tariffs and excise directives in WAEMU and CEMAC).26
26 See, for example, Doe (2005) on the application of the CEMAC and WAEMU VAT directives.

28
Box 5. Principles for Coordinating Corporate Taxation
1. Freedom to Invest: All investors, domestic and foreign, can invest in all sectors, subject to investment registration, and with the following exceptions: [A short negative list].
2. National Treatment: Domestic and foreign investors shall be entitled to make investments in participating countries on the same terms.
3. Nondiscrimination: There will be no discrimination between foreign investors relative to domestic.
4. Repatriation: Each country will permit prompt transfer of funds related to foreign investment—such as profits, dividends, royalties, loan payments and from liquidations—in freely convertible currency.
5. Expropriation: Investments will not be expropriated except for a public purpose and on a nondiscriminatory basis. If property is expropriated, there will be prompt payment of adequate compensation.
6. Transparency: The investment incentive system of each country including its laws, regulations, guidelines, and administrative procedures should be transparent and readily available.
7. Investment incentives:
Any incentives must be in the law and available to all investors on the same terms and not subject to administrative discretion.
Countries agree not to compete by offering tax holidays or profit tax rates below the standard rate in each country.
Any investment tax incentives that are provided must be directly related to the amount of investment (such accelerated depreciation, investment allowances, or tax credits) and cannot favor particular economic sectors or activities.
8. Standard Tax Rate: Each country commits not to reduce the standard corporate tax rate below [rate].
9. New Investment Tax Incentives: Countries agree not to introduce new investment tax incentives or extend the scope of or increase existing incentives, that are inconsistent with the guidelines on investment incentives (paragraph 7 above).
10. Rollback of Existing Investment Tax Incentives. Countries commit to amend their existing laws and established practices to eliminate investment tax incentives inconsistent with paragraph 7 by [date]. Companies that, prior to [date] have been awarded incentives counter to paragraph 7 should be “grandfathered” that is, continue to enjoy the incentives during the period the incentives were promised, assuming they continue to meet the conditions for them.
11. Tax Expenditure Budget: Each country will develop and publish a tax expenditure budget that will cover, at a minimum, all tax incentives inconsistent with paragraph 7.
12. Monitoring and Enforcement: A committee will be established to monitor compliance, including identifying tax measures in each country that are not in accordance with paragraph 7. Each country would be allowed to lodge a complaint against the practice of another country. The latter should be given a chance to respond, and the committee would issue a nonbinding opinion at the end of the process.

29
IV. TRADE LIBERALIZATION AND REVENUE REPLACEMENT
A. Principles for Revenue Replacement
Not all measures of trade liberalization necessarily reduce trade tax revenue. The tariffication of quotas, for example, can reduce trade distortions while at the same time increasing rather than reducing revenue.27 But since free trade implies zero trade taxes, there must come a point at which further liberalization will reduce trade tax receipts. The question then is whether and how this revenue loss can be recovered from domestic taxes. Conventional wisdom points to consumption taxation as having a key role to play. The basic argument is simple. For a small economy—one, that is, which has no impact on world prices—cutting the tariff on some import by $1 while at the same time increasing the consumption tax by $1 has no effect on the price faced by consumer, eliminates the protective effect of the tariff (since imports are treated in exactly the same way as domestic production), and increases government revenue (because the consumption tax is collected not only on imports but also on domestic production). Or, if preferred, the consumption tax could be increased by less than $1, to ensure that consumers also benefit from the reform. Such a shift towards consumption taxation thus appears to provide a simple strategy for recovering revenue without jeopardizing the welfare gain from trade liberalization itself.28 There are of course many important considerations not captured in this simple result: the import of intermediate goods, for instance, and imperfect competition in product markets complicate the analysis, and nuance the proper policy conclusions.29 Three further factors merit particular consideration. The first is the typical existence in most developing countries of a large informal sector, less than fully tax compliant. With some final consumption being produced informally, the simple argument above ceases to apply, since then not all consumption can be taxed: switching to a consumption tax in the way described could lead revenue to fall. Here, however, the precise form of the consumption tax becomes important. The VAT, in particular (as opposed, for example, to a tax simply on final retail sales), is fully charged on imports: this import VAT is then available to formal sector businesses as a credit (or refund) against the output VAT due on their own sales. But for informal operators not registered for VAT, the tax will be unrecovered: the VAT acts, for them, exactly like a tariff. This may seem to reestablish the theoretical case for revenue replacement along the lines above, emphasizing that the replacement tax be a VAT. But that is not quite correct: while the VAT will reach the
27 Ebrill, Stotsky, and Gropp (1999) discuss these and other potentially revenue-increasing measures of trade liberalization, which include reducing quotas and the number and dispersion of tariffs. 28 This argument is spelt out in Keen and Ligthart (2002). 29 See Haque, Emranul and Mukherjee (2005), and Keen and Ligthart (2005).

30
imported inputs of informal operators, since it taxes formal sector operators on their full value added, its net effect is to favor informality—and the consequent increase in the size of the informal sector is a source of welfare loss to the extent that informal operators tend to be relatively inefficient (and perhaps impose other social costs). This does not mean that shifting away from tariffs to the VAT is necessarily unwise—but it makes the case for doing so less than clear-cut. Instruments that bear differentially on informal operators (such as withholding taxes on imports, which formal operators can credit against their income tax liability) can in principle usefully supplement the VAT, though also raises further practical difficulties.30 A second important set of considerations relate to the administrative and compliance costs associated with tariffs and the value added tax. It is widely supposed that tariffs are significantly easier to administer and comply with than a VAT. But there is almost no hard evidence on the comparative costs of the two. There is evidence, however, that the collection costs of the VAT are strongly affected by key aspects of design, in particular by the number of rates31 and by the level of the threshold below which registration is optional. Moreover, the strengthening of VAT administration is often seen as having strong benefits to the wider tax administration, both in developing methods of self-assessment and in providing information useful for the business and personal income tax. Thus it is by no means clear that administration and compliance concerns strongly favor the use of customs duties. Third, there may be distributional consequences from a shift towards the VAT that does not preserve consumer prices unchanged. But these may well be best handled on the spending side of the budget (rather than by, for example, rate differentiation under the VAT). Even in the absence of an effective personal income tax-benefit system—as is commonly the case, of course, in developing countries—it may be possible to alleviate the impact on the poor through higher spending on infrastructure, education and training: Muñoz and Cho (2004), for example, show how the distributional effects of introducing the VAT in Ethiopia could be largely neutralized by broad spending measures.
B. Trends in Trade Taxation
There have been few systematic studies of the revenue impact of trade reform in developing countries. Exceptions are Khattry and Rao (2002) and Baunsgaard and Keen (2005), both of which find evidence that replacing lost trade tax revenue has proved problematic in low income countries, and IMF (2005), which stresses the diversity of country experience. This section reviews the evidence for SSA. Figure 7 shows that the average collected tariff rate (tariff revenues divided by the value of imports) declined in SSA from over 20 percent in the
30 The relative merits of the VAT and tariffs in the presence of informality are analyzed by Emran and Stiglitz (2005), Keen (2008) and Boadway and Sato (2007). See also Glenday (2006). 31 There is, it should be noted, a tension here with the theoretical case for shifting towards the VAT set out above, in that a multiple rate VAT may in principle be required to replicate a complex tariff structure.
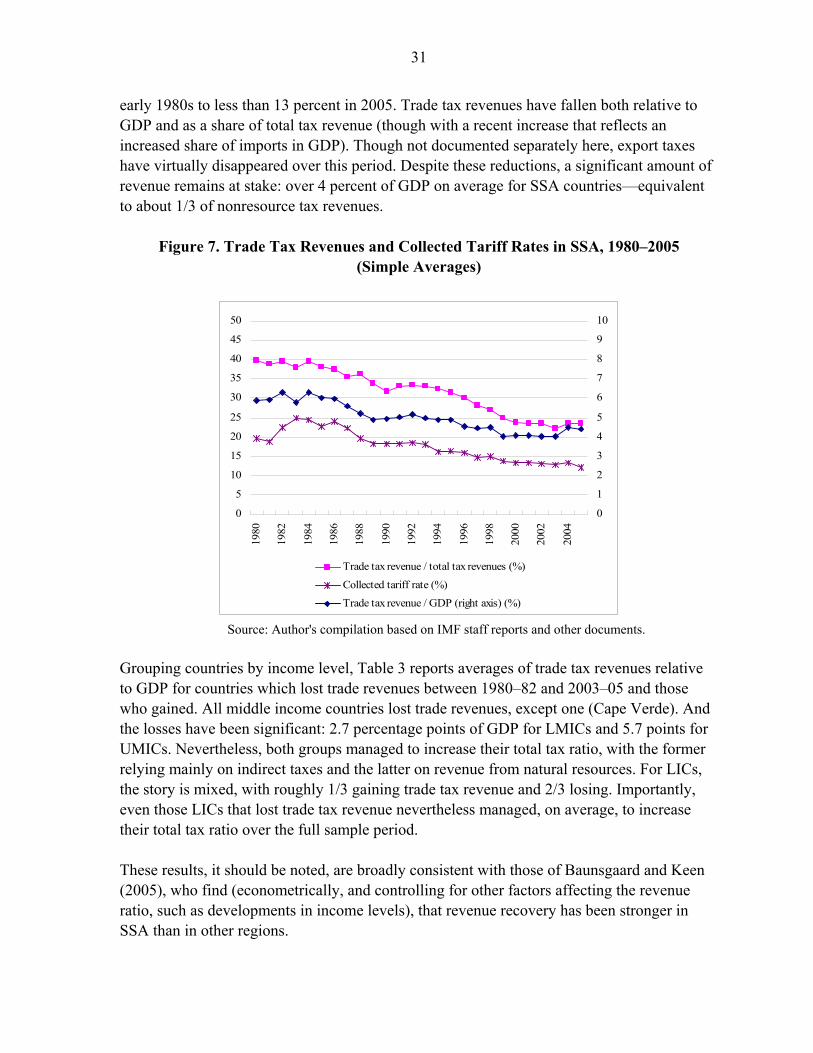
31
early 1980s to less than 13 percent in 2005. Trade tax revenues have fallen both relative to GDP and as a share of total tax revenue (though with a recent increase that reflects an increased share of imports in GDP). Though not documented separately here, export taxes have virtually disappeared over this period. Despite these reductions, a significant amount of revenue remains at stake: over 4 percent of GDP on average for SSA countries—equivalent to about 1/3 of nonresource tax revenues.
Figure 7. Trade Tax Revenues and Collected Tariff Rates in SSA, 1980–2005 (Simple Averages)
0
5
10
15
20
25
30
35
40
45
50
1980
1982
1984
1986
1988
1990
1992
1994
1996
1998
2000
2002
2004
0
1
2
3
4
5
6
7
8
9
10
Trade tax revenue / total tax revenues (%)
Collected tariff rate (%)
Trade tax revenue / GDP (right axis) (%)
Source: Author's compilation based on IMF staff reports and other documents.
Grouping countries by income level, Table 3 reports averages of trade tax revenues relative to GDP for countries which lost trade revenues between 1980–82 and 2003–05 and those who gained. All middle income countries lost trade revenues, except one (Cape Verde). And the losses have been significant: 2.7 percentage points of GDP for LMICs and 5.7 points for UMICs. Nevertheless, both groups managed to increase their total tax ratio, with the former relying mainly on indirect taxes and the latter on revenue from natural resources. For LICs, the story is mixed, with roughly 1/3 gaining trade tax revenue and 2/3 losing. Importantly, even those LICs that lost trade tax revenue nevertheless managed, on average, to increase their total tax ratio over the full sample period. These results, it should be noted, are broadly consistent with those of Baunsgaard and Keen (2005), who find (econometrically, and controlling for other factors affecting the revenue ratio, such as developments in income levels), that revenue recovery has been stronger in SSA than in other regions.

32
Table 3. Increasing Vs. Decreasing Trade Tax Revenues in SSA (In percent of GDP)
Number of
countriesTotal tax revenue
Non-resource tax
revenueTrade tax revenue
Total tax revenue
Non-resource tax
revenueTrade tax revenue
Low-income countriesLost trade tax revenue 20 14.2 12.6 5.5 15.4 12.5 3.0Gained trade tax revenue 9 12.1 12.1 2.8 17.7 17.2 4.4
Low-income (excl. resource countries)Lost trade tax revenue 16 11.7 11.7 5.1 12.7 12.7 2.7Gained trade tax revenue 7 14.4 14.4 3.2 20.2 20.2 5.1
Lower-middle-income countriesLost trade tax revenue 4 20.3 19.8 13.5 25.2 23.6 10.8Gained trade tax revenue 1 13.4 11.9 7.3 20.4 20.4 8.6
Upper-middle income countriesLost trade tax revenue 6 23.1 19.0 9.8 28.9 17.9 4.0Gained trade tax revenue 0 0.0 0.0 0.0 0.0 0.0 0.0
Resource countriesLost trade tax revenue 10 21.5 15.6 8.2 26.2 13.2 3.7Gained trade tax revenue 3 7.3 6.8 3.2 12.7 11.4 4.0
All countries Lost trade tax revenue 30 16.8 14.8 7.4 19.4 15.0 4.2Gained trade tax revenue 10 12.3 12.1 3.2 17.9 17.5 4.8
1980-82 2003-05
Source: Author's compilation based on IMF staff reports and other documents. Note: Figures are simple averages across countries and time.
Trading blocs: past and future Trade liberalization in SSA since the early 1980s has taken two main forms: free trade areas, and customs unions.32 The CEMAC and WAEMU areas have applied a common external tariff (CET) for some time (Table 4). The EAC became a customs union in January 2005; Burundi and Rwanda expect to apply the CET in the near future. COMESA was set to introduce a two-band CET at the end of 2008. SADC formed a free trade area at the end of 2008 (with Angola, Democratic Republic of Congo and Malawi planning to join in the near future), and intends to form a customs union by 2018. As Table 4 shows, COMESA and EAC, a subgroup of COMESA that excludes Tanzania, will have similar three-rate CETs. The neutrality and trade facilitation that this would generate between member countries and the rest of the world hinge primarily on the classification of goods that COMESA will eventually decide: a long list of so-called “social goods”, which account for a significant share of tariff revenues, and on which higher tariffs would apply under the CET, remain to be agreed; and agreement on whether some key imports (such as sugar) are intermediate or
32 Membership of various trading groups in SSA is shown in Appendix 3.
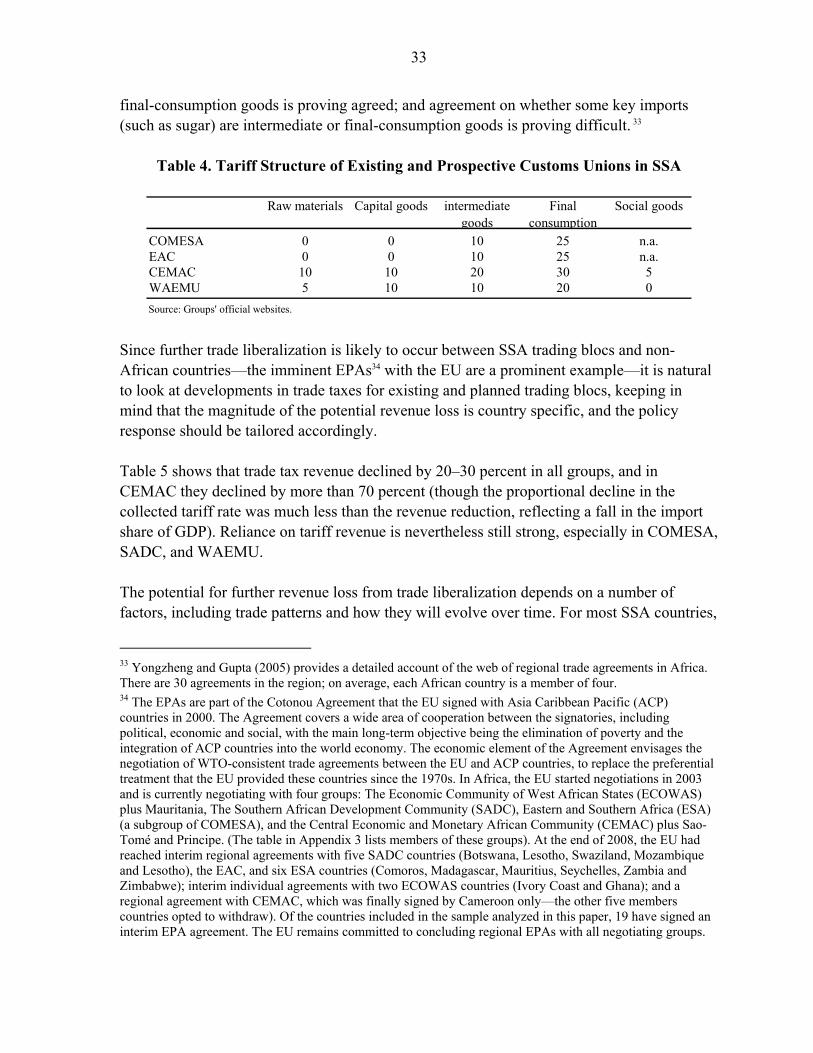
33
final-consumption goods is proving agreed; and agreement on whether some key imports (such as sugar) are intermediate or final-consumption goods is proving difficult. 33
Table 4. Tariff Structure of Existing and Prospective Customs Unions in SSA
Raw materials Capital goods intermediate goods
Final consumption
Social goods
COMESA 0 0 10 25 n.a.EAC 0 0 10 25 n.a.CEMAC 10 10 20 30 5WAEMU 5 10 10 20 0
Source: Groups' official websites. Since further trade liberalization is likely to occur between SSA trading blocs and non-African countries—the imminent EPAs34 with the EU are a prominent example—it is natural to look at developments in trade taxes for existing and planned trading blocs, keeping in mind that the magnitude of the potential revenue loss is country specific, and the policy response should be tailored accordingly. Table 5 shows that trade tax revenue declined by 20–30 percent in all groups, and in CEMAC they declined by more than 70 percent (though the proportional decline in the collected tariff rate was much less than the revenue reduction, reflecting a fall in the import share of GDP). Reliance on tariff revenue is nevertheless still strong, especially in COMESA, SADC, and WAEMU. The potential for further revenue loss from trade liberalization depends on a number of factors, including trade patterns and how they will evolve over time. For most SSA countries,
33 Yongzheng and Gupta (2005) provides a detailed account of the web of regional trade agreements in Africa. There are 30 agreements in the region; on average, each African country is a member of four. 34 The EPAs are part of the Cotonou Agreement that the EU signed with Asia Caribbean Pacific (ACP) countries in 2000. The Agreement covers a wide area of cooperation between the signatories, including political, economic and social, with the main long-term objective being the elimination of poverty and the integration of ACP countries into the world economy. The economic element of the Agreement envisages the negotiation of WTO-consistent trade agreements between the EU and ACP countries, to replace the preferential treatment that the EU provided these countries since the 1970s. In Africa, the EU started negotiations in 2003 and is currently negotiating with four groups: The Economic Community of West African States (ECOWAS) plus Mauritania, The Southern African Development Community (SADC), Eastern and Southern Africa (ESA) (a subgroup of COMESA), and the Central Economic and Monetary African Community (CEMAC) plus Sao-Tomé and Principe. (The table in Appendix 3 lists members of these groups). At the end of 2008, the EU had reached interim regional agreements with five SADC countries (Botswana, Lesotho, Swaziland, Mozambique and Lesotho), the EAC, and six ESA countries (Comoros, Madagascar, Mauritius, Seychelles, Zambia and Zimbabwe); interim individual agreements with two ECOWAS countries (Ivory Coast and Ghana); and a regional agreement with CEMAC, which was finally signed by Cameroon only—the other five members countries opted to withdraw). Of the countries included in the sample analyzed in this paper, 19 have signed an interim EPA agreement. The EU remains committed to concluding regional EPAs with all negotiating groups.

34
the EPAs with the EU will be a key issue for several years. The short-term revenue impact is in most cases likely to be modest, as rate reductions on the items yielding most revenue are generally backloaded. The longer-run effects, however—with phasing-in over 12–15 years—will be substantial, as revenues from EU dwindle and more heavily tariffed imports from outside the EU are displaced. In 2005, around 32 percent of SSA imports came from the EU, suggesting that—in the long-term—about 1/3 of current tariff revenues (or about 10 percent of nonresource revenues) would be lost from full trade liberalization with the EU. This could be much higher with potential trade diversion effects. More refined estimates, taking into account second round effects, would need to be developed in order to understand the extent of the loss, and the policy response needed for each affected country. 35
Table 5. Trade Taxes and Collected Tariff Rates by Trading Bloc in SSA (In percent of GDP)
Number of countries
Total tax revenue
Non-resource tax
revenue
Trade tax revenue
Collected tariff rate
(%)
Indirect tax
revenues
Income tax revenue
1980-82COMESA 14 16.7 15.7 5.8 25.7 3.9 4.8EAC 5 10.7 10.7 3.1 22.8 4.1 3.0SADC 12 19.9 19.0 7.9 17.1 4.1 5.9CEMAC 6 17.6 12.3 6.7 31.3 2.0 2.9WAEMU 8 14.5 14.1 6.3 20.1 3.3 3.6
2003-05COMESA 14 19.6 17.8 4.2 12.0 6.9 5.5EAC 5 14.0 14.0 2.0 9.9 7.1 4.2SADC 12 23.5 21.8 6.1 12.3 6.9 7.4CEMAC 6 21.1 7.8 1.8 10.5 3.0 2.4WAEMU 8 13.6 13.6 3.9 15.0 5.9 3.2
Source: Author's compilation based on IMF staff reports and other documents. Note: Figures are simple averages across countries and time. See Appendix 3 for countries of COMESA and SADC included in the sample.
C. Replacing Tariffs by Domestic Indirect Taxes
Standard advice, as noted earlier, attaches considerable importance to indirect taxation in recovering revenue losses from trade reform. Indirect taxes have indeed played a significant role in mobilizing revenues in SSA countries over the past 25 years,36 and this role has not been confined to replacing revenue losses from trade liberalization. There is some evidence,
35 Indeed, this is an exercise that a number of SSA countries have already started, primarily with the technical and financial support of the EU. 36 The same has been true in other parts of the world see, for example, Keen and Simone (2004), and OECD (2001).

35
however, that the efficiency gains often expected of the VAT have not been realized as clearly in Sub-Saharan Africa as elsewhere: Keen and Lockwood (2009). It remains the case, nevertheless, that on average, the increase in indirect taxes in SSA has broadly matched the decline in trade revenues in the 1980s (as can be seen from Figure 4 above). Among indirect taxes, the VAT has played an increasingly prominent role in revenue mobilization in SSA. Of the 31 countries in the sample that had a VAT in 2005, 27 introduced it after 1990. Today, the VAT accounts, on average, for over 25 percent of nonresource taxes in SSA—and in some countries (such as Benin and Senegal) more than 40 percent. To explore further country experiences in the use of indirect taxes to offset trade tax losses, Figure 8 shows for individual SSA countries the change in revenues (relative to GDP) from trade taxes, indirect taxes, and other taxes (boxes above the horizontal line at zero representing gains, and boxes below representing losses), with the bold figure indicating the change in total revenues. In Togo, for example, indirect tax revenue relative to GDP increased by 1 percentage point, while trade taxes declined by 3.1 points and other tax revenues declined by a further 7.5 points, combining to give a reduction of 9.6 points in the total tax revenue/GDP ratio. It emerges from the figure that: Indirect tax revenue increased in most countries (exceptions are Côte d’Ivoire,
Central African Republic, and Tanzania) regardless of whether they lost or gained trade tax revenue. On average, the increase was twice the loss in trade tax revenue. However, in MICs the gain in indirect tax revenue roughly offset the loss in trade tax revenue (except in Botswana and Equatorial Guinea—both resource countries, and showing a substantial increase in other revenues). Domestic revenue mobilization, it seems, has proved less challenging in MICs than in many LICs—and, indeed, with the exception of Cameroon and Cape Verde, all MICs had a tax/GDP ratio above 15 percent in the early 1980s.
In a small number of LICs, the loss in trade tax revenue was accompanied by a reduction in total tax revenue. Typically, however, such reductions in total revenue reflected losses from other sources too: the loss in trade tax revenue accounted for 32 percent of the decline in the total tax ratio in Togo, 70 percent in Côte d’Ivoire, and 84 percent in Central African Republic.
Most countries that lost trade tax revenue were able to recover the loss, and many were able to increase their total tax revenue. For those LICs that increased their tax ratio, indirect taxes (VAT and excises) played a major role, accounting on average for 66 percent of the increase in the total tax effort (32 percent for resource LICs, and 92 percent for nonresource LICs).

36
Figure 8. The Replacement Role of Indirect Taxes in Individual SSA Countries, by Income Level
(in percent of GDP)
Low-income countries (% of GDP)
-9.6-6.8
-4.8-4.8
-3.7-3.3
-1.2-0.9
-0.50.3
1.21.5
2.62.9
3.13.1
3.33.6
3.63.8
4.14.3
4.55.9
6.16.4
8.39.2
15.021.1
-15
-10
-5
0
5
10
15
20
25
Tog
o
Côt
e d'
Ivoi
re
CA
R
Zam
bia
Tan
zani
a
Mad
agas
car
Gui
nea-
Bis
sau
Nig
er
Sier
ra L
eone
Gam
bia
Ben
in
Moz
ambi
que
Ken
ya
Bur
kina
Fas
o
Sene
gal
Mal
awi
Rw
anda
Con
go, R
ep
Gui
nea
Eth
iopi
a
Com
oros
Sout
h A
fric
a
Mal
i
Cha
d
Bur
undi
Sâo
Tom
é &
P
Uga
nda
Zim
babw
e
Gha
na
Nig
eria
Change in trade tax revenue Change in indirect tax revenue Change in other tax revenue
Middle-income countries (% of GDP)
-1.6 -0.8 1.4 3.2 4.3 6.8 6.9 9.1 9.3 10.6 11.9-25
-20
-15
-10
-5
0
5
10
15
20
25
30
35
Swaz
iland
Mau
ritiu
s
Cam
eroo
n
Gab
on
Sout
h A
fric
a
Seyc
helle
s
Cap
e V
erde
Nam
ibia
Bot
swan
a
Les
otho
Equ
ator
ial
Gui
nea
Change in trade tax revenue Change in indirect tax revenue Change in other tax revenue
Source: Author's compilation based on IMF staff reports and other documents. Note: The stacked columns show the difference, in percentage points of GDP, between the 1980–82 average and the 2003–05 average. The total sum of the stacked columns is equal to the change, in percentage points of GDP, in the total tax revenue ratio (numbers in bold at the bottom of the graph).
37
V. CONCLUSIONS
Globalization has already had marked effects on tax revenues and tax policy in SSA, with significant reductions in receipts from trade taxation, and—although CIT revenue has broadly held up—substantial reductions in statutory CIT rates and a proliferation of incentives. Both trade taxes and corporate tax rates remain high by global standards, however, suggesting that pressures are likely to intensify still further. The analysis here has for the most part focused on developments averaged over various groups. While this is useful for detecting general trends, it risks obscuring substantial variation in country experiences. Countries have indeed responded differently to the revenue challenges from CIT reform and trade liberalization. Resource countries have generally responded passively (as in Cameroon, for instance); some have even used the increased resource revenues, reflecting, until recently, high international commodity prices, to reduce revenue from other sources (the extreme case being Equatorial Guinea, which reduced its nonresource tax ratio from 17 to 2 percent of GDP between 1980 and 2005). Some nonresource middle income countries successfully mobilized additional domestic revenue sources (as in Cape Verde), while others still rely on relatively high trade taxes (such as Namibia and Swaziland). The experience of low income countries has been mixed: some have been able to stabilize or increase their total tax revenue/GDP ratio, mainly by using indirect taxes (Benin, for example), while others lost trade and CIT revenues (as in Madagascar). The number of countries with ratios of tax revenue to GDP of less than 15 percent has fallen since the early 1980s only from 16 to 12. Institutional considerations are important in formulating policy responses to these challenges. One key aim must be to avoid fragmented decision making. Trade policy decisions, in particular, need to be taken with an eye to their fiscal implications—and combined with a plan for dealing with them. This needs to be done, moreover, at an early stage of the process, since the response is likely to involve significant tax policy changes, for which taxpayers and tax authorities need time to prepare, and further strengthening of the domestic tax administration. The multiplication of Free Zones in SSA over the past decade has created yet another pole for tax policy-making: Free Zone Administrations often have authority to propose tax policy changes directly to parliament, without always undergoing a rigorous cost-benefit test (as, for instance, in Gambia and Nigeria). It will be important too to inform public debate on the difficult policy choices that will arise in coming years. Tax expenditure analysis, in particular, by setting out the revenue foregone as a consequence of tax incentives, can be useful in informing and inviting discussion of whether these are likely to have been offset by potential benefits. The proper response to these challenges will naturally be country-specific. What is needed is to address the revenue consequences of globalization within a medium-term tax policy strategy (for scaling back incentives, for instance) that reflects macro-fiscal priorities.

38
As implicit CIT bases are fairly narrow in the region (except in upper-middle-income countries), base broadening is still a potentially significant source of revenue, particularly for low-income countries—and experience shows that it may well be possible to secure these benefits unilaterally. There may though be potential benefits from some degree of cross-country cooperation, focused on at least preventing the further proliferation of mutually damaging tax incentives and preferably going further to seek their progressive elimination (while honoring commitments that have already been made). Statutory corporate tax rates in the region remain relatively high, with only five SSA countries having a rate lower than 30 percent in 2005. Arguably, this is precisely the time to set a modest minimum rate (with Mauritius’ recent announcement of a reduction to less than 20 percent perhaps an indication of what may lie ahead). There are models within the region to build on in contemplating such measures of cooperation. SSA has experience with coordination of VAT and excise structures under the CEMAC and WAEMU directives. These set minimum rates, define the broad contour of the tax base, and list permissible exemptions. Cooperation in corporate taxation will not be easy, but arguably is more necessary. Experience elsewhere and economic principle suggest a number of guidelines for CIT cooperation: The larger the number of countries participating and, more important, the greater is
capital mobility between them, the larger is their potential gain from cooperation.
Coordination on rates alone is likely to achieve relatively little: action on tax bases is core. One natural element of a common package would be the termination of tax holidays (with grandfathering, to the degree reasonable, of benefits already granted); another would be the similar removal of direct tax advantages given in free zones. Whether the credibility of such agreements requires commitments stronger than a code of conduct remains an open question.
Cooperation is likely to be less urgent in relation to (upstream) natural resource activities, which enjoy location-specific rents and so may not be affected by competition as strongly as other activities.
On trade liberalization, most SSA countries have so far managed to recoup the revenue losses of the 1980s and the 1990s, mainly through VAT implementation in the 1990s. Indeed the region in this respect appears to have performed better than other parts of the world. A number of factors, however, may limit the exclusive use of such a strategy in the future:

39
The remaining potential revenue losses are generally larger than those already realized, and it is likely that such losses will become progressively harder to recover from other sources.37
VAT rates in many countries have reached levels such that significant further increases may be problematic, in terms of the impact on compliance, enforceability and informality: in a number of countries the standard rate is already at the maximum prescribed under WAEMU and CEMAC directives. Base broadening and the taxation of the informal sectors—both difficult—are potentially more appropriate revenue generators.
For most SSA countries, difficult challenges for revenue mobilization—which the recent crisis will only exacerbate—lie ahead. Continued improvement in revenue administration, though not addressed here, remains a priority. But strengthened tax design, supported perhaps by enhanced regional cooperation, will be needed to deal with the continuing fiscal challenges from globalization.
37 Baunsgaard and Keen (2005), for instance, find signs of such nonlinearity in the ease of revenue replacement.

40
Appendix I. Data Notes and Definitions Data notes Revenue data used in this paper are taken from IMF staff reports. These have the advantage of showing indirect taxes by the nature of the tax rather than by the point of collection. For example, taxes collected at customs administrations are separated between sales taxes (often VAT), excises, import and export taxes, and other levies on trade such as statistical taxes. This level of detail is crucial for the analysis of indirect tax reforms. Despite their quality, one problem with these data is the consistency of revenue classification over time. Although IMF staff follow closely GFS classification of revenues, it is sometimes difficult to keep consistency over time, particularly where tax systems are reformed and revenue classification changes in the accounting systems of treasury departments. For these and other reasons, some simplifying assumptions had to be made in order to have complete series for most variables used in this paper. The following adjustments, which are not expected to substantially affect the main conclusions, were made: The shares of corporate and individual tax revenues were not available for the whole
period for all countries. It was assumed that these shares remained constant at the level of the last year for which data were available; no adjustments were made for earlier years. Data for the following countries were adjusted in this way: Republic of Congo (1996–2005), Equatorial Guinea (2002), Guinea (2002–05), Mozambique (2005), Nigeria (2005), Rwanda (2004–05), Tanzania (2005), Zambia (2005), and South Africa for resource revenue (2001–05).
Côte d’Ivoire: oil revenues were assumed to be constant, as a percent of total revenue, over 2002–05.
Car registration fees, which are often included in indirect taxes in IMF staff reports, were excluded if reported separately. This should not have any significant impact on results as they tend to be a small share of indirect tax revenue.
Definition of variables Tax revenue Taxes paid to the budget, including natural resource revenues. Tax revenue excludes revenue from non-oil public enterprises.

41
Resource revenues Revenues from upstream oil and mining activities. These include income from production sharing, royalties and corporate income tax on resource companies, but exclude revenue not paid to the budget. Income taxes Individual and company taxes (excluding resource companies), income taxes on self-employed and other taxes on income that are not allocated to individuals or companies (such as withholding taxes on payments to nonresidents and taxes on capital gains). This category also includes payroll taxes paid to the budget, except social security contributions, which in SSA are generally paid to the agency in charge of managing the spending programs to which such revenues are earmarked (pension and health funds, for instance). Corporate tax revenue Income taxes paid by nonresource companies. Individual tax revenue Income taxes paid by individuals to the budget. Social security contributions earmarked for specific use are excluded, due to data quality and availability. Other general payroll taxes, which tend to be insignificant in SSA, are included. Indirect taxes Turnover and other sales taxes, VAT, excises taxes, and stamp duties. Trade tax revenue Import and export taxes and other levies on international trade (such as “statistical fees”, which are prevalent in SSA).

42
Appendix II. Countries by Income Level and Resource Status
Low-income countries Lower-middle-countries Upper-middle-income countries
Benin Cameroon BotswanaBurkina Faso Cape Verde Equatorial GuineaBurundi Lesotho GabonCentral African Republic Namibia MauritiusChad Swaziland SeychellesComoros South AfricaCongo, Republic ofCôte d'IvoireEthiopiaGambiaGhanaGuineaGuinea-BissauKenyaMadagascarMalawiMaliMozambiqueNigerNigeriaRwandaSâo Tomé and PrincipeSenegalSierra LeoneTanzaniaTogoUgandaZambiaZimbabwe
29 countries 5 countries 6 countries
Notes:
Countries in shaded grey are classified as resource countries.
Income classification follows the World Bank 2006 country classification according to 2005 incomes (see Data
and Research at www.worldbank.org).

43
Appendix III. Membership of Trade Groups
All SSA countries Included in the Sample
CEMAC WAEMU SADC COMESA EAC ECOWAS SACU
Angola No X Benin Yes X X Botswana Yes X X Burkina Faso Yes X X Burundi Yes X X Cameroon Yes X Cape Verde Yes X Central African Republic Yes X Chad Yes X Comoros Yes X Congo, Democratic Republic of No X X Congo, Republic of Yes X Côte d'Ivoire Yes X X Equatorial Guinea Yes X Eritrea No X Ethiopia Yes X Gabon Yes X Gambia Yes X Ghana Yes X Guinea Yes X Guinea-Bissau Yes X X Kenya Yes X X Lesotho Yes X X Liberia No X Madagascar Yes X X Malawi Yes X X Mali Yes X X Mauritius Yes X X Mozambique Yes X Namibia Yes X X Niger Yes X X Nigeria Yes X Rwanda Yes X X Sâo Tomé and Principe Yes Senegal Yes X X Seychelles Yes X X Sierra Leone Yes X South Africa Yes X Swaziland Yes X X X Tanzania Yes X X Togo Yes X X Uganda Yes X X Zambia Yes X X Zimbabwe Yes X X X

44
References Auriol, Emmanuelle and Michael Warlters, 2005, “Taxation Base in Developing Countries,”
Journal of Public Economics, 89:625–46. Azmat, Ghazala, Alan Manning, and John Van Reenen, 2007, “Privatization, Entry
Regulation and the Decline of Labor’s Share of GDP: A Cross-Country Analysis of the Network Industries,” Discussion Paper 806 (London: Centre for Economic Performance, London School of Economics).
Auerbach, Alan J., 2007, “Why Have Corporate Tax Revenues Declined? Another Look,”
CESifo Economic Studies (Munich: CESifo). Baunsgaard, Thomas and Michael Keen, 2005, “Tax Revenue and (or?) Trade
Liberalization,” IMF Working Paper 05/112 (Washington: International Monetary Fund).
Besley, Timothy and Michael Smart, 2007, “Fiscal Restraints and Voter Welfare,” Journal of
Public Economics, 91:755–73. Boadway, Robin and Motohiro Sato (2009), “Optimal Tax Design and Enforcement with an
Informal Sector,” American Economic Journal: Economic Policy, 1:1–27. Carey, Kevin, Sanjeev Gupta, and Ulrich Jacob, 2007, “Sub-Saharan Africa: Forging New
Trade with Asia” (Washington: International Monetary Fund). Devereux, Michael and Peter Birch Sørensen, 2006, “The Corporate Income Tax:
International Trends and Options for Fundamental Reforms,” Economic Paper 264, (Brussels: European Commission).
——— and Rachel Griffith, 2003, “Evaluating Tax Policy for Location Decision,”
International Tax and Public Finance, 10:367–88. ———, and ———, 1998, “Taxes and the Location of Production: Evidence from a Panel of
U.S. Multinationals,” Journal of Public Economics, 68(3):335–67. ———, ———, and Alexander Klemm, 2002, “Corporate Income Tax Reform and
International Tax Competition,” Economic Policy, Vol.17(35), pp.451–95. Dharmapala, Dhammika and James R. Hines Jr., 2006, “Which Countries Become Tax
Havens,” NBER Working Paper 12802.

45
Doe, Lubin, 2005, “Harmonization of Domestic Consumption Taxes in Central and Western African Countries,” IMF Working Paper 06/08 (Washington: International Monetary Fund).
Ebrill, Liam, Janet G. Stotsky, and Reint Gropp, 1999, Revenue Implications of Trade
Liberalization, IMF Occasional Paper 180 (Washington: International Monetary Fund).
Edwards, Jeremy, and Michael Keen, 1996, “Tax Competition and Leviathan,” European
Economic Review, 40:113–34. Ellis, Luci and Kathryn Smith, 2007, “The Global Upward Trend in the Profit Share,”
Working Paper 231 (Basel: Bank for International Settlement). Emran, M. Shahe and Joseph E. Stiglitz, 2005, “On Selective Indirect Tax Reform in
Developing Countries,” Journal of Public Economics, 89: 599–623. Haque, M., Emranul and Arijit Mukherjee, 2005, “On the Revenue Implications of Trade
Liberalization under Imperfect Competition,” Economics Letters, Vol.88, pp.27–31. Hassett, Kevin A. and Aparna Mathur, 2006, “Taxes and Wages,” Working Paper 128
(Washington: American Enterprise Institute). Glenday, Graham, 2006, “Towards Fiscally Feasible and Efficient Trade Liberalization,”
(Durham: Duke University, Duke Center for International Development). Hines, James R. Jr., 2007, “Corporate Taxation and International Competition,” in
Alan J. Auerbach, James R. Hines, and Joel Slemrod, Taxing Corporate Income in the 21st Century (Cambridge: Cambridge University Press).
IMF, 2005, “Dealing with the Revenue Consequences of Trade Reform,” (Washington:
International Monetary Fund). www.imf.org/external/np/pp/eng/2005/021505.pdf. Janeba, Eckhard and Michael Smart, 2003, “Is Targeted Tax Competition Less Harmful than
its Remedies?” International Tax and Public Finance, 10:259–80. Khattry, Barsha and J. Mohan Rao, 2002, “Fiscal Faux Pas?: An Analysis of the Revenue
Implications of Trade Liberalization,” World Development 30 (8):1431–44. Keen, Michael, 2008, “VAT, Tariffs and Withholding: Border Taxes and Informality in
Developing Countries,” Journal of Public Economics, 92:1892–1906.

46
Keen, Michael, 2007, “Tax Competition,” in Steven Durlauf and Lawrence Blume (eds), The New Palgrave Dictionary of Economics (second edition) (Basingstoke: Macmillan).
———, 2005, “Preferential Regimes Can Make Tax Competition Less Harmful,” National
Tax Journal, 54:757–62. ——— and Jenny E. Ligthart, 2002, “Coordinating Tariff Reduction and Domestic Tax
Reform,” Journal of International Economics, 56:490–507. ——— and ———, 2005, “Coordinating Tariff Reduction and Domestic Tax Reform under
Imperfect Competition,” Review of International Economics, 13:385–90. ———and Ben Lockwood, 2009, “The value-added tax: its causes and consequences,”
forthcoming in the Journal of Development Economics. ——— and Alejandro Simone, 2004, “Tax Policy in Developing Countries: Some Lessons
from the 1990s and Some Challenges Ahead,” in Sanjeev Gupta, Ben Clements, and Gabriela Inchauste (eds), Helping Countries Develop: The Role of Fiscal Policy (Washington: International Monetary Fund).
Konrad, Kai and Guttorm Schjelderup, 1999, “Fortress Building in Global Tax Competition,”
Journal of Urban Economics 46:156–67. Mckinsey & Company, 2003, New Horizons: Multinational Company Investment in
Developing Countries (San Francisco). Mooij, Ruud de and S. Ederveen, 2003, “Taxation and Foreign Direct Investment: A
Synthesis of Empirical Research,” International Tax and Public Finance 10:673–93. ——— and Gaetan Nicodeme, 2006, “Corporate Tax Policy, Entrepreneurship and
Incorporation in the EU,” CESifo Working Paper 1883 Muñoz, Sonia and Stanley Sang-Wook Cho, 2004. “Social Impact of a Tax Reform: The
Case of Ethiopia,” pp.353–84 in Sanjeev Gupta, Benedict Clements and Gabriela Inchauste (eds), Helping Countries Develop: The Role of Fiscal Policy (Washington: International Monetary Fund).
Norregaard, John and Tehmina Khan, 2007, “Tax Policy: Recent Trends and Coming
Challenges,” IMF Working Paper 07/274 (Washington: International Monetary Fund).

47
Nov, Avi (2005), “Tax Incentives for Foreign Direct Investment: The Drawbacks,” Tax Notes International, 263–71.
Osmundsen, Petter (2005), “Optimal Petroleum Taxation Subject to Mobility and
Information Constraints,” pp.12-25 in Solveig Glomsrød and Petter Osmundsen (eds), Petroleum Industry Regulation within Stable States (Aldershot: Ashgate).
Panagariya, Arvind and Dani Rodrik (1996), “Political-Economy Arguments for a Uniform
Tariff,” International Economic Review, 34:685–703. Rodrik, Dani, 1998, “Why Do More Open Economies have Bigger Governments?” Journal
of Political Economy, Vol. 106, pp. 997–1032. Stewart, Kenneth and Michael Webb, 2006, “International Competition in Corporate
Taxation: Evidence from the OECD Time Series,” Economic Policy, 153–201. World Bank, 2006, Where is the Wealth of Nations (Washington: World Bank). Yongzeng, Yang and Sanjeev Gupta, 2005, “Regional Trade Agreements in Africa,”
(Washington: International Monetary Fund). Zee, Howell, Janet G. Stotsky and Eduardo Ley, 2002, “Tax Incentives for Business
Investment: A Primer for Policy Makers in Developing Countries,” World Development, 30(2):1497–1516.