doktor der gesamten heilkunde (dr.med.univ.) · 2019-02-21 · period between blood withdrawal,...
TRANSCRIPT

0
Diplomarbeit
Effects of Blood Sample Handling Procedures on Measured
Cytokine and Chemokine Concentrations
in Human Serum and Plasma
zur Erlangung des akademischen Grades
Doktor der gesamten Heilkunde
(Dr.med.univ.)
an der
Medizinischen Universität Wien
ausgeführt an der
Universitätsklinik für Chirurgie
unter der Anleitung von
Ass.-Prof. Univ.-Doz. Dr. Hendrik Jan Ankersmit
eingereicht von
Lucian Beer
Mat.Nr.: 0842107 Stranzendorf, am 25.3.2012 ……………………........... (Unterschrift)
1
Danksagung
Ich möchte mich bei all jenen bedanken, die mich bei der Verfassung dieser Arbeit
durch ihren fachlichen Rat oder ihre persönlichen Worte unterstützt und motiviert
haben.
Besonderer Dank gilt Ass.-Prof. Univ.-Doz. Dr. Hendrik Jan Ankersmit, der mir die
Möglichkeit gab Einblicke in die Welt der Wissenschaft zu gewinnen und mich im
Rahmen dieser Arbeit mit großer Sorgfalt betreut hat. Weiters möchte ich mich bei
meinem LaborkollegenInnen bedanken, im Besonderen bei Dr. Michael Lichtenauer
PhD und Michael Mildner die mich bei der Ausführung dieses Projekts unterstützt
haben.
Ganz besonderer Dank gilt meinen Eltern Gabriele und Rudolf, die mir dieses
Studium ermöglicht haben und sowohl in persönlicher als auch beruflicher Beziehung
als Vorbilder meiner Entwicklung dienten. Auch meiner Schwester Patricia und
meinen Großeltern danke ich für die ermunternden und erhellenden Worten in den
unzähligen Gesprächen nach langen Forschungstagen.

2
Table of Contents
1.1 Abstract ......................................................................................................... 5
1.2 Zusammenfassung ........................................................................................ 6
2 Introduction .......................................................................................................... 8
2.1 Cytokine ........................................................................................................ 8
2.2 Cytokine metabolism ..................................................................................... 8
2.3 Cytokines in human disease .......................................................................... 9
2.4 Chemokines .................................................................................................. 9
2.4.1 Structure ................................................................................................. 9
2.4.2 Chemokine receptors ............................................................................ 11
2.4.3 Chemokine nomenclature ..................................................................... 12
2.4.4 Withdrawal of blood .............................................................................. 14
2.4.5 Preparation of serum ............................................................................ 16
2.4.6 Serum separators ................................................................................. 16
2.4.7 Preparation of plasma ........................................................................... 17
2.5 Cytokine and chemokine measurement ...................................................... 17
2.5.1 Enzyme linked immunosorbent assays ................................................. 18
2.5.2 Multiplex arrays ..................................................................................... 19
2.5.3 Bioassays.............................................................................................. 23
2.5.4 Single cell assays ................................................................................. 23
2.6 Measurement of cytokines and chemokines in clinical and basic research . 24
2.7 Factors of influence ..................................................................................... 25
2.7.1 Age / sex / BMI ...................................................................................... 25

3
2.7.2 Circadian rhythms ................................................................................. 25
2.7.3 Correlation of cytokine levels in serum and plasma .............................. 26
2.7.4 Sample storage and stability considerations ......................................... 26
2.7.5 Sample preparation in clinical settings .................................................. 27
3 Methods ............................................................................................................. 29
3.1 Whole blood incubation experiment ............................................................. 29
3.2 Separation of human peripheral blood mononuclear cells ........................... 30
3.3 Cell Culture of human PBMC with autologous serum supplement .............. 31
3.4 Stimulation of chemokine secretion by fibrin ............................................... 32
3.5 Proteome Profiler™ Array for determination of human angiogenesis-related
proteins ................................................................................................................. 33
3.6 Statistical analysis ....................................................................................... 33
3.7 Figures and illustrations ............................................................................... 34
4 Results ............................................................................................................... 35
4.1 Measurement of chemokine levels in serum, heparinized plasma and EDTA
plasma ................................................................................................................... 35
4.1.1 Analysis of serum tubes ........................................................................ 35
4.1.2 Analysis of heparinized plasma tubes ................................................... 37
4.1.3 Analysis of EDTA plasma tubes ............................................................ 39
4.2 Angiogenesis array ...................................................................................... 41
4.3 Induction of chemokine secretion of human peripheral blood mononuclear
cells by autologous serum ..................................................................................... 43
4.3.1 Dose dependency of serum induced chemokines secretion ................. 46
4.4 Cytokine secretion triggered by fibrin .......................................................... 47

4
5 Discussion .......................................................................................................... 50
5.1 Limitations ................................................................................................... 53
5.2 Clinical implications ..................................................................................... 54
6 References ......................................................................................................... 55
7 Abbreviations ..................................................................................................... 61

5
1.1 Abstract
Cytokines are small protein molecules that are secreted by different cell types. Over
the last decades the analysis of cytokine concentrations in serum and plasma has
become an important research issue in several disease conditions. However,
cytokine concentrations are usually not considered to be very stable after blood
collection, which might therefore alter test results. A known source of error is the time
period between blood withdrawal, arrival in the laboratory and processing of the
sample.
This study was intended to evaluate the influence of handling and storage conditions
on detectable cytokines in human serum and plasma tubes. Furthermore, triggers for
cytokine release from peripheral blood mononuclear cells (PBMC) were analyzed.
Venous blood was taken from healthy subject using different blood tubes (serum,
heparin plasma, and EDTA plasma). Blood tubes were either centrifuged initially
within 30 minutes after venipuncture and kept frozen at -80°C until further testing or
were stored at 4°C, at room temperature and at 37°C for 4 and to 24 hours prior to
centrifugation. Cytokine stimulatory potential of serum and plasma was evaluated by
incubation of PBMC with increasing concentration of autologous serum, autologous
plasma or fibrin. Samples were evaluated for different cytokines using commercially
available enzyme-linked immunosorbent assay (ELISA) kits.
All examined mediators rose when samples were stored above room temperature for
more than 4 hours in serum tubes. This rise of serum cytokine levels culminated in a
334-fold increase for IL-8, a 79-fold increase for IL-6, a 22-fold increase for ENA-78,
and 17-fold increase for GCP-2 compared to basic values. A similar increase of
cytokine concentrations could not be examined in plasma tubes. Cytokine
concentrations rose in a dose dependent manner in supernatants of PBMC incubated
with autologous serum.
These data indicate that most cytokine concentrations remain stable when analyzed
within a short interval after venipuncture. When tubes were exposed to temperatures
higher than room temperature, levels of all measured cytokines increased.

6
1.2 Zusammenfassung
Zytokine sind kleine Proteine welche von einer Vielzahl verschiedener Zellarten
produziert werden. In den letzten Jahrzehnten gewann die Messung von
Zytokinkonzentrationen in Serum- und Plasmaproben bei verschiedenen
Krankheitsbildern zunehmend an Bedeutung. Zytokinkonzentrationen gelten jedoch
als äußerst variabel in Blutproben, wodurch die Messergebnisse verfälscht werden.
Eine bekannte Fehlerquelle ist die Zeitspanne zwischen Blutabnehme, dem
Eintreffen im Laboratorium und der Weiterverarbeitung der Blutprobe.
Ziel dieser Studie war es den Einfluss von Lagerungsdauer und Lagerungszeit von
Blutproben, auf die in diesen Blutproben gemessenen Zytokinkonzentrationen zu
untersuchen. Weiters wurde die Zytokinfreisetzung von peripheral blood
mononuclear cells (PBMC) durch bestimmte Triggerfakoren untersucht.
StudienteilnehmerInnen wurde venöses Blut in Serum- und Plasmaröhrchen
(Heparin, EDTA) abgenommen. Diese Blutröhrchen wurden innerhalb 30 Minuten
nach der Blutabnahme zentrifugiert und Serum/Plasma bei -80°C bis zu weiteren
Tests tiefgefroren. Die verbleibenden Blutröhrchen wurden bei 4°C, Raumtemperatur
und 37°C für 4 bzw. 24 Stunden gelagert, anschließend zentrifugiert und Serum/
Plasma abgehoben. Um den stimulatorischen Effekt von Serum- und Plasmaproben
zu untersuchen wurden PBMCs mit ansteigenden Dosen von autologem Serum,
Plasma oder Fibrin inkubiert. Die Proben wurden mittels Enyme-linked
Immunosorbent Assay (ELISA) Kits ausgewertet.
Es zeigte sich ein Anstieg aller untersuchter Mediatoren bei Lagerung der Proben bei
37°C für mehr als 4 Stunden im Serumröhrchen. Es kam zu einem 334-fachen
Anstieg von IL-8, einem 79-fachen Anstieg von IL-6, einem 22-fachen Anstieg von
ENA-78, einem 17-fachen Anstieg von GCP-2 verglichen mit den Ausgangswerten.
In Plasmaröhrchen konnte kein ähnlicher Anstieg der Zytokinkonzentrationen
gemessen werden. Zytokinkonzentrationen im Zellüberstand von PBMCs, welche mit
ansteigenden Dosen autologen Serums inkubiert wurden, stiegen dosisabhängig an.
Diese Daten zeigen, dass Zytokinkonzentration stabil erscheinen, wenn die Proben
innerhalb kurzer Zeit nach Blutabnahme verarbeitet werden. Wenn Proben jedoch

7
über Raumtemperatur gelagert werden, kommt es zu einem Anstieg aller
gemessener Zytokine.

8
2 Introduction
2.1 Cytokine
The term cytokine was introduced by Stanley Cohen in 1974. Until then the term
lymphokine, had been used to describe protein mediators mainly produced by
lymphocytes1. By definition, cytokines are peptide mediators which modulate aspects
of immunity and inflammation. The cytokine family consists of a large number of
secreted factors involved in intercellular communication, which regulate essential
function such as wound healing, host defense, homeostasis and hematopoiesis.
They exert multiple biological activities depending on cell type, timing and context 2.
Cytokines share similarities with hormones since both regulate homeostasis and are
synthesized in one organ/cell. A difference between cytokines and hormones is that
hormones have higher circulation levels compared to cytokines. Circulating levels of
many cytokines are below the detection limit of the assay2.
2.2 Cytokine metabolism
A wide range of different stimuli are described that induce cytokine release in vivo
and in vitro using both animal and human models. The cytokine network consists of
complex inter-relationships between different type of cytokines, indicating that a
simple cascade model where one cytokine can induce the secretion of another
cytokine does not describe the mechanism accurately2.
The in vivo half-life of cytokines injected intravenously is usually stated in minutes,
whereas the half-life of cytokines in tissue culture condition is generally greater due
to the lack of hepatic or renal clearance3.
A general characteristic of cytokines is their molecular weight of less than 30
kilodaltons.
Due to special structures and function cytokines can be clustered into several
classes1:
• interleukins
• tumor necrosis factors

9
• interferons
• colony stimulation factors
• transforming growth factors
• chemokines
2.3 Cytokines in human disease
Methods to evaluate cytokine concentration in different sample types improved during
the last decades. Due to user-optimized assays the role of cytokines was
investigated in a wide range of different diseases. Cytokine alterations are observed
after acute injury4-6, sepsis5, 7, 8, chronic diseases1, 9, autoimmune disease10-12 and
cancer12.
2.4 Chemokines
The chemokine system plays a pivotal role in the regulation leukocyte movement to
sites of infection and tissue damage. During the last decades it had been shown that
chemokines are involved in gene transcription, homeostasis, angiogenesis,
fibroproliverative disorders, wound repair, atherosclerosis and malignancy13-15.
In 1977 platelet factor 4 (PF-4, CXCL4) was the first classified chemokine. The
second chemokine, Interferon gamma-induced protein 10 (IP-10, CXCL10), was
identified in 1985, following by several other chemokines isolated from tissues or cell
culture supernatants16.
2.4.1 Structure
More than 47 chemokines have now been identified in humans. Chemokines are a
superfamily of homologous 8- to 10-kDa heparin-binding cytokines molecules. They
are small proteins, usually 70-120 residues long that contain 1-3 disulfides. The
structure consists of a short N-terminal region, an extended N-loop region, followed
by three β-sheets and an α- helix (Fig. 1)17.

10
Figure 2.1 3D or tertiary structure imagine of chemokine structure with one alpha-helix and 3 antiparallel beta-sheets18.
Chemokines feature very similar secondary and tertiary structures with 20-40%
homology across the whole superfamily, whereas the sequence homology is highly
variable.
Depending on their different structure (on the basis of the presence of variation on a
conserved cysteine motif in the mature sequence of proteins) chemokines can be
divided in four subfamilies.
The CC chemokine family (so called because of the juxtaposition of two cysteine
residues) is composed of 28 members.
Members of the CXC family are characterized by a pair of cysteine, which are
separated by one amino acid, represented by the letter X. It includes 16 ligands and
8 receptors in humans. It is suspected that this redundancy may allow chemokine /
receptor pairs to play an exceptional fine-tuning role for the immune system19. The
CXC chemokine structure consists of a disordered N-terminus of 6-10 amino acids
followed by a long N-loop, with a three-stranded anti parallel β-sheet that ends in a 3-
10 C-terminal helix. The N-loop possesses important binding function, while the N-
terminus functions as a key signaling domain17. This family can be further subdivided
on the basis of presence or absence of another three aminoacid sequence of the so
called ‘ELR’ motif (the amino acid sequence glutmic acid-leucine-argenine), located
directly proximal to the CXC sequence. It has been shown that the ELR motif is

11
essential for chemotactic and angiogenic activity20. Depending on the presence or
absence of the ELR motif in their amino terminal end, CXC chemokines are potent
inhibitors or promoters of angiogenesis 21.
The third group of chemokines is called the C chemokine group with only 1 member
named lymphotactin (XCL1). It has two cysteines (one N-terminal and one cysteine
downstream).
The CX3C family consists only of one chemokine called fractalkine (CX3CL1).
Fractalkine is a large protein of 373 amino acids containing multiple domains which
are structurally distinct from other chemokines. Compared to other chemokines
fractalkine has a long mucine-like stalk (residues 77 to 317) with predicted O-
glycosylated serine and threonine and transmembrane domain (residues 337 to 373).
The membrane-bound form functions as an adhesion molecule and promotes shear-
resistant adhesion of CX3C-Receptor 1 leukocytes, while the soluble form consist of
the chemokine domain and the extracellular mucine like stalk22, 23.
2.4.2 Chemokine receptors
Chemokine receptors are known to be G-protein-coupled receptors (GPCRs)24. The
first chemokine receptors were cloned in 1991. They consisted of two heptahelical
proteins with a high attraction to interleukin 8 (IL-8, CXCL8)25. To date seven
receptors for the CXC chemokines and ten receptors for the CC chemokines are
described. Furthermore, there is a single receptor for fractalkine and the two
receptors the C chemokines26.
As mentioned before most chemokine receptors are able to bind more than one
chemokine. However, a distinct specificity exists, as CC receptors can only bind
chemokines with a CC motive and CXC receptors can only tag to CXC chemokines.
This so called “ligand-receptor restriction” may be related to structural differences
between CC and CXC chemokines, which have similar secondary and tertiary
structures (see Figure 2.1) but different quaternary structures15, 18.

12
Figure 2.2 Chemokine receptors and their ligands26.
2.4.3 Chemokine nomenclature
In the last century chemokines were named randomly with no clear system being
used. The same proteins were often reported under different names. Some groups
named chemokines after the function of the protein, while others were named
according to the cell type that secretes the chemokine, e.g. platelet factor 4. This
caused confusion, even among scientists working in the field.
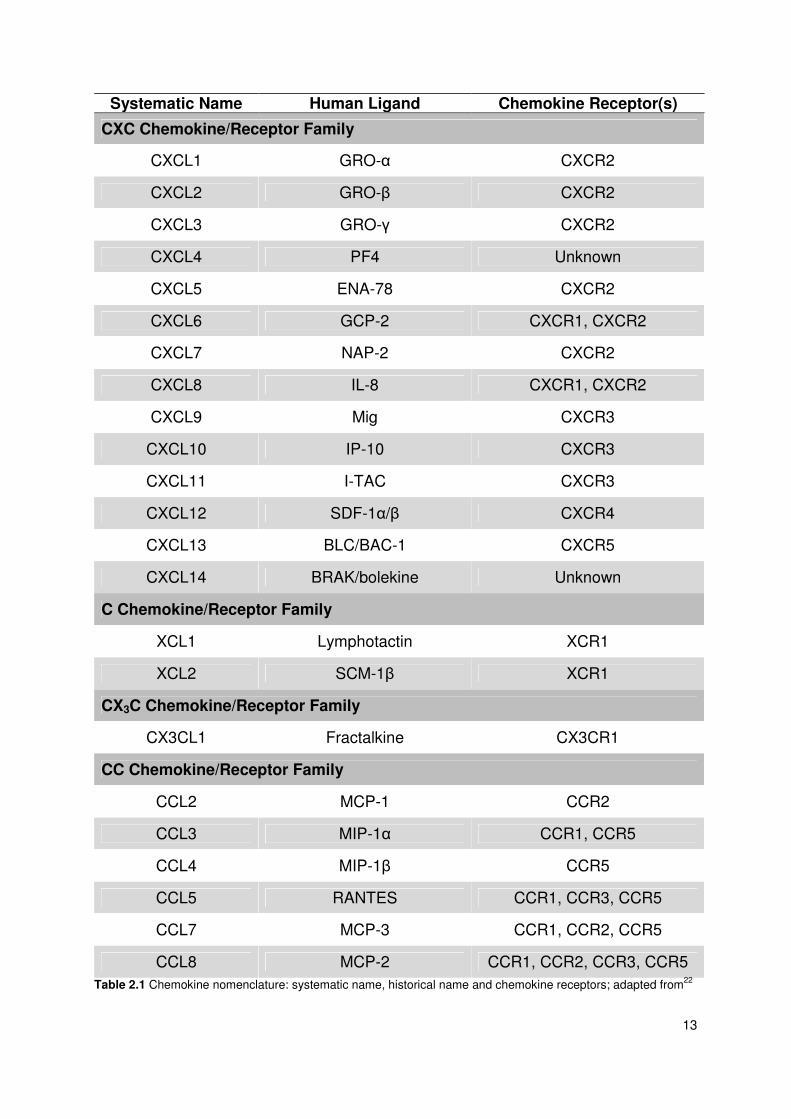
In 2000 a systematic nomenclature of chemokines and chemokine receptors was
published to solve the confused nomenclature associated with chemokines. The
nomenclature is outlined in the following table. Beside the new systemic names, the
historical nomenclature and the receptors for each chemokine are given in the table.
13
Systematic Name Human Ligand Chemokine Receptor(s)
CXC Chemokine/Receptor Family
CXCL1 GRO-α CXCR2
CXCL2 GRO-β CXCR2
CXCL3 GRO-γ CXCR2
CXCL4 PF4 Unknown
CXCL5 ENA-78 CXCR2
CXCL6 GCP-2 CXCR1, CXCR2
CXCL7 NAP-2 CXCR2
CXCL8 IL-8 CXCR1, CXCR2
CXCL9 Mig CXCR3
CXCL10 IP-10 CXCR3
CXCL11 I-TAC CXCR3
CXCL12 SDF-1α/β CXCR4
CXCL13 BLC/BAC-1 CXCR5
CXCL14 BRAK/bolekine Unknown
C Chemokine/Receptor Family
XCL1 Lymphotactin XCR1
XCL2 SCM-1β XCR1
CX3C Chemokine/Receptor Family
CX3CL1 Fractalkine CX3CR1
CC Chemokine/Receptor Family
CCL2 MCP-1 CCR2
CCL3 MIP-1α CCR1, CCR5
CCL4 MIP-1β CCR5
CCL5 RANTES CCR1, CCR3, CCR5
CCL7 MCP-3 CCR1, CCR2, CCR5
CCL8 MCP-2 CCR1, CCR2, CCR3, CCR5 Table 2.1 Chemokine nomenclature: systematic name, historical name and chemokine receptors; adapted from22

14
2.4.4 Withdrawal of blood
During the last century improvements were achieved in the development of new
blood withdrawal systems. In the 19th century most syringes had been made of metal,
glass or hard rubber. A disadvantage of these syringes was that the span of life of
such products was very short, due to the weak resistance of the material during
sterilization process.
At the beginning of the 20th century the first hypodermic syringes made of glass were
produced by the Becton Dickinson Company. A big step forward was made in 1920
by the design of the first interchangeable syringes. However, there was still the
problem to sterilize the syringes.
It took another 30 years to solve this problem. After Wald War II the Becton Dickinson
Company developed replaceable, property fitting syringes.
At the same time Joseph J. Kleiner developed the Vacutainer blood collection tube.
The innovation of this product was that the needle could be left in the vein while
vacuum tubes were exchanged. In brief, the system consisted of a double-pointed
needle, an evacuated tube and a holder for fitting the two together. While the long
needle causes the venipuncture the short needle is pressed against the stopper. The
blood pressure and the vacuum in the tube aspirate the blood once the tube is
transfixed27.
Beside the Vacutainer system, the syringe-needle technique is generally used. This
technique offers the opportunity to control the intake of blood into the tube manually.

15
Additive Inversion at Blood Collection Laboratory Use
clot activator and gel for serum separation
5
clinical chemistry testing of serum for infectious disease
blood clotting time: 30 minutes
lithium heparin and gel for plasma separation
8 clinical chemistry
silicone coated (glass) clot activator, silicone coated (plastic)
0 5
clinical chemistry blood clotting time: 60 minutes
thrombin-based clot activator 8 for stat serum determination in chemistry
blood clotting time: 5 minutes
sodium heparin lithium heparin
8 8
clinical chemistry
liquid K3 EDTA (glass) spray-coated K2 EDTA (plastic)
8 8
K2 EDTA and K3 EDTA for whole blood hematology determination. K2 EDTA may be used for routine immunohematology testing, and blood
donor screening
buffered sodium citrate 0.109 M (3,2%) plastic
3-4 for coagulation determinations. CATD for selected
platelet function assays and coagulation determination, requires full draw
Table 2.2 Blood collecting tubes in clinics. Adapted from28, 29

16
Independent of the method used, there are rules to follow to generate valid results.
The Clinical And Laboratory Standards Institute is an organization with the aim to
generate good manufacture principles in laboratory work. In 2006, the sixth edition of
a blood collecting and blood sample handling manual was published describing the
procedure of a venipuncture as well as venipuncture supplies and sources of error
during the venipuncture30.
Firstly, tubes containing anticoagulant must be filled to the marked level to achieve
the right proportion. Otherwise, the anticoagulation will be high and falsify the results.
Secondly, blood tubes should be collected in the following sequence: blood culture
bottle – non-additive tube – sodium citrate – heparin – EDTA and at last oxalate
fluoride. It is important to follow this order and to avoid cross contamination between
additive tubes30.
2.4.5 Preparation of serum
Blood serum develops after clotting of blood. It neither contains any cellular nor
clotting factor components. To obtain serum, blood must be collected in a plain tube.
After the coagulation process, which takes up to one hour, blood must be centrifuged
to separate cellular components and serum.
To accelerate the clotting process to 10-15 minutes, many tubes contain clot-
activating-devices. The most established clot-activating-devices are glass or silica
particles. However, thromboplastin has also been used to achieve fast clotting. At
benefit of these consumables is a lesser contamination of late forming fibrin.
Furthermore, haemolysis is less likely when clotting activators are used.
2.4.6 Serum separators
To achieve a more accurate and faster separation of serum, special silicon gels or
polyester formulations can be used. These gels exhibit a special density that is
intermediate between the density of cells and the one of serum. The semi fluid gel
changes its stiffness during centrifugation. The cell-clot accumulates at the bottom
while the serum stays at the top of the tube. The best temperature for centrifugation
is at 20-25°C because cooling may impair the flow characteristics while too high
temperatures may cause a breakdown of the gel.

17
2.4.7 Preparation of plasma
Plasma contains clotting factors, but no cellular components.
To obtain plasma, anticoagulants have to be added to tubes that inhibit the clotting
process. The clotting process can either reversibly or irreversibly be stopped.
Commonly used anticoagulants in tubes are EDTA and heparin salts and sodium
citrate. To achieve a consistent concentration of the anticoagulant, immediate mild
mixing of the anticoagulant with the blood after venipuncture is necessary.
Depending on the platelet count three different types of plasma can be produced31
Plasma Relative centrifugal force (g) Centrifugation time
(minutes)
Platelet rich 150-200 5
Platelet poor 1000-2000 10
Platelet free 2000-3000 15-30
Table 2.3 Platelet count in Plasma depends on centrifugal force and centrifugation time31.
Too high temperatures or centrifugation for a long time will lead to haemolysis and
falsification of plasma components.
Anticoagulants can interfere with some antibody-antigen reactions. Especially
heparin reduces the reaction rate of some antibodies. Furthermore, it should not be
used to determine cryoprotein levels. EDTA is known to inhibit the enzyme activity by
chelating of calcium ions32.
2.5 Cytokine and chemokine measurement
Over the last decades many different methods in analyzing cytokine concentrations
or cytokine function in biological fluids have arisen due to the growing importance of
these mediators in scientific life. The choice which test fits best depends on the
expected cytokine concentration in the sample, the type of sample (fluid vs. tissue),
the amount of the sample and financial aspects. In the following paragraphs
frequently used techniques are described, without raising claim to completeness in
the wide field of cytokine measurement33.

18
2.5.1 Enzyme linked immunosorbent assays
Measurement of soluble cytokine or cytokine receptors in body fluids and cell
supernatants are commonly based on enzyme linked immunosorbent assays (ELISA)
or radioimmuno assays (RIA). ELISA was established in the 1970s and displays the
most common method of cytokine measurement 34. Usually double antibody
sandwich ELISAs are used. A detection antibody linked to the bottom binds to its
typical antigen, while another antibody linked to an enzyme provides detection and
enhancement of the signal.
Figure 2.3 1: wells coated with capture antibody; 2: incubation with antigen (cytokine); 3: incubation with detection antibody; 4: incubation with enzyme (E); 5: addition of substrate and color reaction; ®Lucian Beer
Many manufacturers provide ELISA kits for a wide range of different cytokines. The
sensitivity of an ELISA kit ranges between pictogram per milliliter to nanogram per
milliliter over a 2 log working range32, 35, 36.
However, a limitation of ELISA-based assays is that the read out is strongly
dependent on antibody quality, kit manufacturer and experience of the operator.
Furthermore, samples with cytokine concentrations above the dynamic range have to
be diluted for the assay. This is eminently important when specimen above the
dynamic range (need to be diluted) and samples within the dynamic range (do not
require dilution) were measured in the same assay. It is well known that dilution
reduces the concentration of the target cytokine as well as levels of cytokine
inhibitors or binding proteins. Therefore, different dilution of samples may cause a
measurement bias32.

19
A few steps of the ELISA procedure can be semi-automated with robotics to reduce
manual pipetting steps and avoid sources of random error. Assay automation is only
cost-effective in larger studies or in clinical laboratories36 and not commonly used in a
clinical research setting.
Another disadvantage is that kits from different manufactures provide various results.
Direct comparison between cytokine levels measured by different ELISA kits is
therefore limited37.
2.5.2 Multiplex arrays
Multiplex assays were produced for faster and more comprehensive cytokine
profiling. The ratio of these assays is the purpose of measuring different cytokines in
the same sample at one time point. The most established techniques are flow
cytometric multiplex arrays, also known as bead-based multiplex assays (Figure 2.4).
2.5.2.1 Bead based assays
Multiplex assays contain a mixture of different bead labeled capture antibodies. After
incubation samples with the capture-antibody beads, a further incubation step with
florescence labeled detection antibodies is required to allow the detection of
cytokines in fluorescence light. The amount of fluorescence is proportional to the
concentration of the linked cytokine32, 38.

20
Figure 2.4 Principle of multiplex bead based arrays39
Up to 100 different proteins can be measured by this technique simultaneously.
Based on this capacity the amount of sample (25-50 microliter) is clearly lower
compared to ELISA techniques, where up to 100 microliters for one cytokine
measurement are needed.

21
A further benefit of multiplex assays is the ability to detect different proteins across a
wide dynamic range of concentration without the necessity to dilute samples32, 33, 38.
However, there are some drawbacks that have to be mentioned:
• side-by side comparisons between ELISA results and multiplex assays are
rare and therefore direct comparison between two different results might be
difficult40
• cross reaction between different capture and detection antibodies as well as
antigens in the test can influence the results
• type of sample (serum vs. plasma) influences results at multiplex assays
whereas ELISA assays provide rather comparable results32, 38.
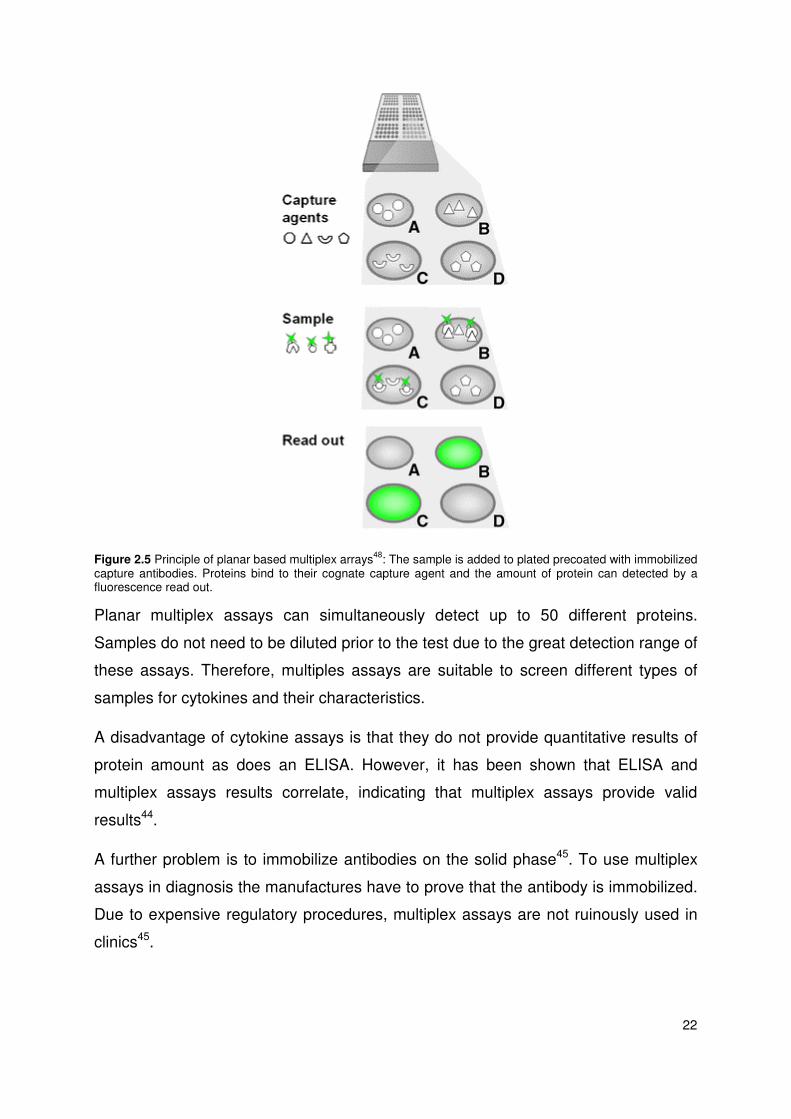
2.5.2.2 Planar multiplex assays
An alternative to bead-based assays, planar based assays can be used to quantify
protein concentration in samples. Multiplex planar array technologies are used in
tumor research41, immunology research42, 43, and in scanning different body fluids for
cytokine content44.
Capture antibodies are immobilized on the solid support. Typically, sandwich assays
are used. Samples containing proteins are incubated onto the array. Unbounded
proteins are washed away. A labeled second antibody, not necessarily highly
specific, is added for detection. After a further washing step the signal can be
detected45-47 (see figure 2.5).
22
Figure 2.5 Principle of planar based multiplex arrays48: The sample is added to plated precoated with immobilized capture antibodies. Proteins bind to their cognate capture agent and the amount of protein can detected by a fluorescence read out.
Planar multiplex assays can simultaneously detect up to 50 different proteins.
Samples do not need to be diluted prior to the test due to the great detection range of
these assays. Therefore, multiples assays are suitable to screen different types of
samples for cytokines and their characteristics.
A disadvantage of cytokine assays is that they do not provide quantitative results of
protein amount as does an ELISA. However, it has been shown that ELISA and
multiplex assays results correlate, indicating that multiplex assays provide valid
results44.
A further problem is to immobilize antibodies on the solid phase45. To use multiplex
assays in diagnosis the manufactures have to prove that the antibody is immobilized.
Due to expensive regulatory procedures, multiplex assays are not ruinously used in
clinics45.

23
2.5.3 Bioassays
Bioassays are a method to detect functional proteins and cytokine activity by adding
cytokine samples to cells, tissue or animals33. These living materials act as an
indicator system for the cytokine presence in the reviewed sample. Due to the type of
assay the advantages are the high sensitivity (picogram per milliliter or less) and the
ability to discover the effect of a cytokine on viable cells (e.g. stimulation of migration;
induction of inflammatory function (interleukin-6) and inhibition of function
(interleukin-1))49.
Drawbacks of bioassays are the low specify, the requirement of cell cultures and the
interference with unknown factors50.
2.5.4 Single cell assays
Intra-cytoplasmatic cytokine staining and enzyme-linked immunospot (ELISpot) have
been used to assess the in vitro cytokine production by different cells types. The
technique of ELISpot assays is similar to ELISA assays. Cells are seeded on wells
pre-coated with monoclonal antibodies specific for the cytokine of interest. During an
incubation time the cells produce cytokines which are linked to the immobilized
antibodies. After a washing step, an enzyme labeled antibody specific for the
cytokine is added to the wells. By adding a substrate solution to the wells the color
reaction appears and the area of cytokine expression can be measured33, 51.
ELISpot assays are commonly used in the diagnosis of tuberculosis and in vaccine
studies to monitor cellular responses51, 52.

24
Figure 2.6 ELISpot: wells coated with capture antibody; stimulated cells secrete cytokines; incubation with detection antibody with enzyme (E); addition of substrate and color reaction; ®Lucian Beer
Beside the named methods, there are other methods for detection of cytokines in
tissues (immunostaining and mRNA based assays) as well as DNA and protein
microarrays, which are a promising technique of cytokine measurement in the future.
Nevertheless, new technologies need to be used cautiously and further data are
needed to be able to compare results generated by different methods among each
other32.
2.6 Measurement of cytokines and chemokines in clinical and basic research
Over the last decades the analysis of cytokine and chemokine levels in serum or
plasma of patients has become an important research issue in several disease
stimulated cell non-stimulated cells

25
conditions. A “PubMed” search done in November 2011 with the term “cytokine” and
date of publication “2010” listed 35298 publications indicating the importance of
cytokines in clinical research.
With the increasing measurement of cytokines in clinical studies an increasing
variation of cytokine concentrations appeared in different publications. This
phenomenon can be discussed exemplified by TNF-α concentrations examined in
healthy subjects. TNF-α concentrations in healthy subjects range from low pg/mL to
multiple ng/mL53. Therefore, attempts have been done to determine the average
concentrations of cytokines in population based studies.
Multiplex assays enabled researchers to measure a high number of cytokines
simultaneously in volumes of 25 to 50 µL. In 2011 a study assessed the
concentration of three cytokines and C-reactive protein in 2884 healthy men and
3201 healthy women. The aim of this study was to establish a reference value and to
determine influencing factors of cytokine concentrations in healthy subjects54.
2.7 Factors of influence
2.7.1 Age / sex / BMI
Several studies indicate that the pro-inflammatory cytokines IL-655, 56, TNF-α and
IL-1β56 are impaired in immune cells taken from elderly people57. Men have greater
IL-6 concentrations than women58. Postmenopausal women have significantly
greater IL-6 levels compared with premenopausal women59, 60
These finding differs from those that have not shown any correlation between age
and IL-6 concentrations54, 61
Higher BMI is associated with increased inflammatory cytokines62, 63, whereas
physical activity can have both, a positive or negative effect on IL-6 concentration 54.
2.7.2 Circadian rhythms
IFN-gamma, TNF-α, IL-1 and IL-12 production of stimulated whole blood cultures
exhibit distinct circadian rhythms that peak in the morning and are inversely related to
plasma cortisol concentration64. In patients with metastatic colorectal cancer a

26
significant daily rhythm of TNF-α concentration was found with a peak at 2 am and
the nadir at 2 pm64.
2.7.3 Correlation of cytokine levels in serum and plasma
Several reports in the literature examine the influence of serum and plasma samples
of measurable cytokine concentrations65, 66. Furthermore, the anticoagulant used for
collection of blood can affect the cytokine concentrations65-69.
The platelet associated chemokines CCL3 (Macrophage inflammatory protein-1α –
MIP-1α), CCL5 (RANTES), CXCL-8 (IL-8) CXCL4 (PF-4) and the cytokine
transforming-growth factor β (TGF-β) can be elevated in serum levels by ex vivo
degranulation of platelets70, 71. Serum samples contain higher concentrations of IL-
1β, which is secreted from white blood cells during the clotting process72. Wong et al.
examined that IL-8 concentrations are greater in serum samples than in acid citrate
dextrose samples67. Levels of IL-2, IL-4, IL-5, IL-7, IL-10, IL-12p70, IL-13, IFN-
gamma, G-CSF, HEP were lower in serum compared to plasma values67. These
findings differ from those reported regarding that overall levels of cytokines were
quite similar between different blood sample types66.
2.7.4 Sample storage and stability considerations
The short half-life of cytokines, the secretion of cytokines by cells during blood
storage and preparation, as well as the potential degradation of cytokines make the
stability, treatment and storage of samples important factors in cytokine
measurement and interpretation73.
The period between blood withdrawal and centrifugation and between centrifugation
and freezing as well as the time the samples are stored in a freezer can alter cytokine
concentration.
A delayed processing of plasma levels is associated with the increase of IL-8,
interleukin 1 Receptor antibody (IL-1Ra), matrix-metallopeptidase-9 (MMP9),
whereas IL-12, CXCL10 (interferon gamma-induced protein 10 – IP-10), CCL2
(monocyte chemotactic protein-1 – MCP-1) and MIP-1α is reduced dependent on
time 74. Storage of plasma tubes at 37°C for 2 hours results in a significant increase
of TNF-α 75. Storage of plasma at 24°C for 20 days results in up to 55% lower TNF-α
27
concentrations compared to samples kept at 4°C or -70°C 76 indicating cytokine
degradation .
The recommended long term storage temperature of samples for cytokine
measurement is -80°C77. A current study showed that most cytokines stored at -80°C
are stable up to two years77. Different patterns were seen for different groups of
cytokines. IL-13, IL-15, IL-17 ad IL-8 are significantly reduced after one year storage
at -80°C, whereas IL-2, IL-4, IL-12 and IL-18 are stable for up to 4 years77.
During a five-year storage, a five-fold increase as well as a decrease of different
cytokine was found78 indicating that, depending on the cytokine measurement cross
reactivity between different protein epitopes can occur. These results indicate that
storage stability differs in the measured cytokines and every cytokine needs to be
considered on its own merits76, 77.
Repeated freeze-thaw cycles can influence cytokine concentration. In a study
published in the year 2000, TNF-α levels increased significantly after 3 freeze-thaw
cycles79, whereas other studies did not detect this effect80. Different results of these
studies might be explained by the fact that the pathology of the patient from whom
the sample has been obtained affects the result53.
2.7.5 Sample preparation in clinical settings
Based on the multiple influence factors of cytokine concentrations a standard
procedure should be adhered when blood samples are collected. These standards
should include detailed patient instruction on preparing for the blood withdrawal,
including diet and exercise restriction. Time of blood withdrawal as well as sample
handling should be standardized to improve laboratory dependent procedures32.
In the following paragraph general guidelines for handling blood samples are listed.
Adapted from32, 81:
• The procedure is governed by the stability of the constituents of the sample.
The most important causes for alterations to the quality of specimen are:
o Metabolism of blood cells
o chemical reactions
28
o effect of light
• Short storage time improves the reliability of test results
• Cool storage conditions preserve reliability of laboratory results
• Cooled tubes should be used for blood collection
• Closed tubes should be used to store samples
• Separating agents improve the borderline between serum / plasma and
cellular components
• Anticoagulants should be appropriately selected based on the desired assay
and standardized
• Cross contamination between tubes containing different anticoagulants should
be avoided
• Whole blood samples should be separated into serum or plasma after blood
withdrawal
• Avoid repeated freeze-thaw cycles
• Thawing of samples should take place at room temperature
• Physical activity should be avoided prior to blood sampling
• New pipette tips should be used for aliquoting each sample to prevent
contamination
29
3 Methods
3.1 Whole blood incubation experiment
This study was conducted in accordance with the local ethics committee and
according to the principles of the Helsinki Declaration and Good Clinical Practice (EK:
2010/034). Informed consent was obtained from all participants in this study. Major
inclusion criteria were body mass index 18-28 kg/m², no intake of anti-inflammatory
drugs during the last two weeks, no acute infection during the last month, no chronic
inflammatory disease and no physical activity over the last hours prior to participation
in this study.
Venous blood was obtained from seven young healthy volunteers by venipuncture
using blood collection tubes for serum, heparinized (lithium) plasma and EDTA
plasma used in clinical setting (Greiner BioOne, Austria, sterile 9mL). To determine
basic serum and plasma levels, selected tubes were centrifuged at 2330g for 15
minutes within 30 minutes after blood withdrawal. The obtained serum and plasma
samples were stored at -80°. The remaining tubes were either kept in a refrigerator at
4°, at room temperature (24°) or in an incubator at 37° for time intervals of four and
24 hours before they were separated into serum or plasma and frozen.
After the stated periods the tubes were centrifuged and the obtained samples of
serum and plasma were stored at -80° until evaluation by enzyme-linked
immunosorbent assay (ELISA).
30
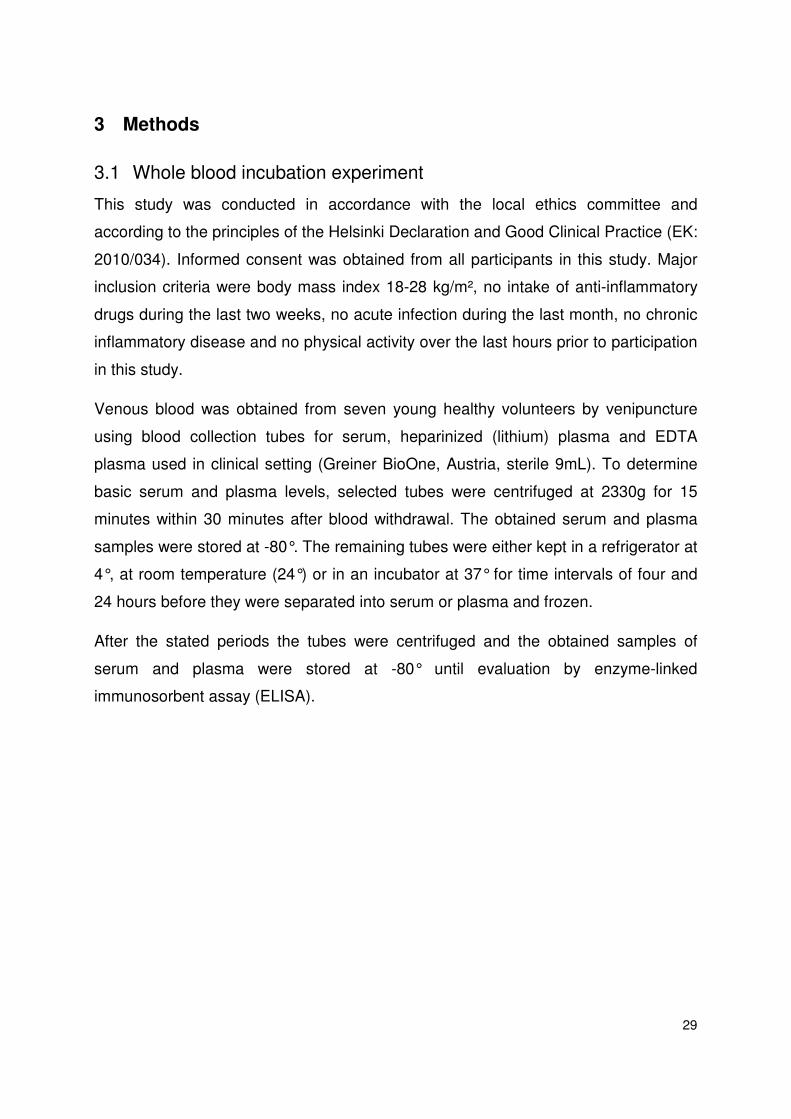
Figure 3.1 Whole Blood Experiment: Flow chart of study design and time points of Evaluation by ELISA: Venous blood was obtained by venipuncture using blood collection tubes for serum, heparinized plasma and EDTA plasma. To determine basic serum and plasma levels, selected tubes were centrifuged within 30 minutes after blood withdrawal and the obtained serum and plasma samples was be stored at -80°. The remaining tubes were placed at 4°C, at room temperature and at 37°C. After 4 and 24 hours one serum tube, one EDTA-plasma tube and one Heparin-plasma tube from 4°C, RT and 37°C, respectively was centrifuged and the aspirated serum and plasma sample was be stored at -80°C. Cytokines were measured by ELISA.
3.2 Separation of human peripheral blood mononuclear cells
Human peripheral blood mononuclear cells (PBMC) were obtained from young
healthy volunteers (n=12). Cells were separated by Ficoll-Paque (GE Healthcare Bio-
Sciences AB, Sweden) density gradient centrifugation. In short, anticoagulated blood
specimens were processed immediately after venipuncture, diluted 1:2 in Hanks
balanced salt solution (HBBS, Lonza, Basel, Switzerland) and shifted carefully into 50
milliliter (ml) tubes containing Ficoll‐Paque solution (GE Healthcare Bio‐Sciences
AB, Sweden). Tubes were centrifuged for 15 minutes at 800g at room temperature
without brake and buffy coats with mononuclear cells were obtained. Cells were
washed in HBSS and resuspended in fresh serum-free UltraCulture medium (Lonza,

31
Switzerland). Cell concentrations were determined on a Sysmex automated cell
counter (Sysmex Inc., USA).
3.3 Cell Culture of human PBMC with autologous serum supplement
PBMC were seeded on 24 well plates (Corning Costar, USA) at a density of 1*10^6
cells per milliliter in UltraCulture Medium (Lonza, Switzerland). Initially thereafter,
200µl autologous serum was added to each well. The cell culture plates were
incubated for 24 hours in an incubator with a humidified atmosphere. The addition of
heparinized autologous plasma and fetal calf serum (PAA, Austria) served as
additional entities in this experimental setting. For a second experiment, 1*10^6 cells
per milliliter were incubated with increasing levels of autologous serum supplement
(2.5%, 5%, 10% and 20%) in order to define dose dependency. After the incubation
period, PBMC were separated from the cell culture supernatant by centrifugation at
400g for 9 minutes. The obtained specimens were kept frozen at -80°.
Figure 3.2 Stimulation assay: Flow chart of study design: Peripheral blood mononuclear cells were separated from EDTA tubes. They were seeded on 24 well plates and incubated with medium containing either 20% serum, or 20% plasma, or 20% FCS (fetal calf serum), or HI-serum (heat inactivated serum). After 24 hours at 37°C cell culture supernatant was separated and used for cytokine measurement by ELISA.

32
3.4 Stimulation of chemokine secretion by fibrin
Human PBMC were obtained as described above. Freeze-dried human fibrin (Sigma
Aldrich, Austria) was resuspened in fresh UltraCulture Medium (Lonza, Switzerland)
and aliquots were added in increasing concentrations (0.25µg, 0.5µg, 10µg, 50µg,
200µg and 500µg) to cell cultures of PBMC (cell density 1*10^6 per milliliter). PBMC
cultured in medium without fibrin served as negative controls and cells incubated with
increasing doses of autologous serum served as positive controls. After 24 hours of
incubation supernatants were harvested and were stored until ELISA assays were
conducted.
Figure 3.3 Fibrin stimulation assay: Flow chart of study design: Peripheral blood mononuclear cells were separated from EDTA tubes. They were seeded on 24 well plates and incubated with medium containing either increasing amount of fibrin, or increasing concentrations of serum . After 24 hours at 37°C cell culture supernatant was separated and used for cytokine measurement.
Evaluation of serum, plasma and supernatant levels of selected cytokines by ELISA
Serum, plasma and cell culture supernatant levels of chemokines were measured
using commercially available enzyme-linked immunosorbent assay (ELISA) kits for
the quantification of IL-1β, IL-6, IL-8, GRO-α, ENA-78, GCP-2, MCP-1, RANTES,
SDF-1, TNF-α, VEGF, TGF-β and IP-10 (Duoset; R&D Systems, USA) according to
the manufacturer’s protocol. In short, ninety-six–well microtiter plates were coated
overnight at room temperature with the appropriate capture antibody. After blocking
of plates, samples of serum, plasma, supernatants and standard protein were added

33
to the wells. After an incubation and a washing step, a biotin-labelled antibody was
added to each well and incubated for 2 hours. Plates were washed and streptavidin-
horseradishperoxidase was added for 30 minutes. Colour reaction was achieved
using tetramethylbenzidine (TMB; Sigma Aldrich, USA) and was stopped by a
sulphuric acid stop solution (Merck, Germany). Optical density values were measured
at 450 nanometer on an ELISA plate reader (Victor3 Multilabel plate reader,
PerkinElmer).
3.5 Proteome Profiler™ Array for determination of human angiogenesis-related proteins
Pooled samples (n=7) of baseline serum tubes and serum/ heparinized plasma/
EDTA plasma stored at 37°C for 24 hours were used to determine 55 angiogenesis
related proteins with a Proteome Profiler™ Array (R&D System, USA). In short,
samples were mixed with a cocktail of biotinylated detection antibody and then
incubated with the array membranes pre-coated with capture antibodies. After a
washing step, Streptavidin-HRP and chemiluminescent detection reagents were
added sequentially. Positive signals seen after the exposure to an X-ray film for 1-10
minutes were identified by scanning the film on a transmission-mode scanner.
3.6 Statistical analysis
Statistical analysis was performed using GraphPad Prism software (GraphPad
Software, La Jolla, USA). All data are given as mean ± standard error of the mean
(SEM). Based on high variability of cytokine levels in healthy subjects and our small
sample size of ~7-12 participants we supposed that results are not normally
distributed. The Friedman test, a non-parametric statistical test, was used to detect
differences in serum or plasma tubes across multiple time points. Differences in the
means of continuous measurements were tested by the Wilcoxon-signed-rank test.
Due to the explorative character of this study no correction for multiple testing was
performed82. A p value of <0.05 was considered to indicate statistical significance; all
tests were two tailed.
34
3.7 Figures and illustrations
GraphPad Prism software (GraphPad Software, La Jolla, USA) was used to generate
figures. For further processing, figures were converted into PowerPoint (Microsoft
Corp., USA).
35
4 Results
4.1 Measurement of chemokine levels in serum, heparinized plasma and EDTA plasma
Samples of serum, heparinised plasma and EDTA plasma were obtained from seven
healthy young volunteers by venipuncture using blood collection tubes routinely used
in clinics (Vacuette®, Greiner BioOne, Austria). Some of the tubes were centrifuged
shortly after blood withdrawal (30 minutes) in order to obtain basic values for
cytokines. The remaining tubes were stored at three different temperature levels, at
+4°C in a refrigerator, at room temperature (+24°C) and in an incubator at +37°C for
four to 24 hours. The historical chemokine nomenclature is used in the following
paragraphs. See table 2.1 for systematic nomenclature of chemokines.
4.1.1 Analysis of serum tubes
Serum concentrations of different cytokines are shown in table 4.1. Cytokine
concentration seemed to be most stable when tubes were stored at 4°C, although
GCP-2 levels were significantly elevated after an incubation period for four hours at
4°C.
A massive secretion of all chemokines and partially of cytokines (IL-8, GRO-α, MCP-
1, IL-6, ENA-78, GCP-2, IL-1β, TNF-α, VEGF) was found in serum tubes when
incubated at 37°C. A significant increase was measured for IL-8 and GCP-2 after
only four hours. After 24 hours this resulted in a 44-fold increase for MCP-1, a 17-fold
increase for GCP-2, a 22-fold increase for ENA-78, an 80-fold increase for GRO-α
and even a 335-fold increase for IL-8 compared to basic levels.
A similar effect was seen for pro-inflammatory cytokines (IL-6, IL-1β) and growth
factors (VEGF). Only TGF-β concentrations remained stable for all measured time
points in serum tubes.

36
Serum (pg/ml) 4°C 24°C 37°C
0h 4h 24h 4h 24h 4h 24h
IL-8 66.3 ±11.9 71.9 ±11.0 290.8 ±215.1 68.5 ±11.0 356.2 ±122.9 594.0 ±192.7 * 22163.2 ±5343.4 **
GRO- α 64.4 ±24.9 11.4 ±6.3 * 28.5 ±9.8 10.0 ±4.6* 27.9 ±6.6 63.2 ±25.6 5180.2 ±849.3 *
ENA-78 3614.4 ±1402.8 3118.0 ±844.9 3507.4 ±1027.9 1881.2 ±845.1 2384.3 ±757.4 2359.4 ±1108.7 79789.8 ±10284.3 ***
GCP-2 517.1 ±38.2 766.5 ±57.1 ** 879.8 ±87.6 ** 711.3 ±64.4 * 706.5 ±92.9 689.8 ±57.1 ** 8782.3 ±1653.9 **
MCP-1 43.7 ±41.8 1.9 ±1.9 20.9 ±19.7 8.3 ±6.1 11.6 ±6.4 18.1 ±6.3 1898.5 ±371.8 **
IL-6 88.0 ±20.2 84.9 ±27.8 64,9 ±32.2 56.2 ±24.6 48.18 ±26.6 54.4 ±31.7 6917.5 ±1743.9*
IL-1β 0.0 ±0.0 0.0 ±0.0 0.0 ±0.0 0.0 ±0.0 0.0 ±0.0 0.0 ±0.0 1156.5 ±415.7*
TNF- α 0.0 ±0.0 3.2 ±2.9 26.6 ±14.7 1.1 ±1.1 9.8 ±9.8 0.9 ±0.7 487.7 ±173.7*
TGF-β 643.2 ±19.4 756.4 ±204.6 967.0 ±249.5 1164.4 ±247.0 818.7 ±228.5 999.6 ±234.8 742.3 ±252.8
VEGF 733.5 ±523.8 177.1 ±78.9 80.5 ±80.5 755.3 ±376.2 395.2 ±209.3 257.8 ±95.8 436.1 ±136.0*
Table 4.1 Cytokine concentrations in serum tubes stored at different temperatures (4°C, 24°C, 37°C) for three different periods (0 hours, 4 hours, 24 hours). Basic serum levels are stated in column “0h”. Data are given as mean (± standard error of the mean). n=7
37
4.1.2 Analysis of heparinized plasma tubes
Minor to moderate difference of chemokines levels were seen between serum and
plasma tubes that were process immediately. The increase in concentrations of
detectable anylates in heparinized plasma was generally lower than in serum.
Keeping blood samples at 4°C before centrifugation and separation into plasma was
effective to prevent an increase of measurable concentration of most anylates.
Thus, after four hours at 4°C GCP-2 concentrations were significantly elevated and
after 24 hours at 4°C a 2 fold-increase was observed. Higher storage temperature
and longer storage time leed to increased cytokine concentrations. Especially the
measurable concentrations of IL-8, GRO-α, ENA-78 and MCP-1 increased notably
after 24 hours at a storage temperature of 37°C. TNF-α, IL-1β and TGF-β were not
detectable in most plasma samples.

38
Plasma Heparin (pg/ml)
4°C 24°C 37°C
0h 4h 24h 4h 24h 4h 24h
IL-8 65.4 ±12.9 65.8 ±10.9 77.4 ±18.8 68.8 ±12.8 165.1 ±32.0 * 357.2 ±183.9* 1973.9 ±562.9 *
GRO- α 28.5 ±18.4 2.8 ±1.4 23.1 ±10.2 21.3 ±6.4 22.8 ±9.4 11.5 ±8.4 222.1 ±85.4
ENA-78 448.1 ±346.5 2247.1 ±809.4 5171.1 ±1419.5 * 244.1 ±182.9 2100.8 ±977.9 665.5 ±581.2 9758.0 ±2717.8 *
GCP-2 324.7 ±45.3 500.6 ±65.3 ** 736.9 ±67.6 *** 393.8 ±39.4 293.1 ±30.9 372.5 ±74.9 499.8 ±107.7
MCP-1 14.5 ±12.6 0.0 ±0.0 21.9 ±21.5 11.6 ±5.6 69.6 ±48.3 0.0 ±0.0 68.9 ±26.0 *
IL-6 59.4 ±25.5 41.6 ±28.7 27.0 ±8.9 33.9 ±13.0 56.4 ±20.7 86.3 ±46.0 142.0 ±71.3
IL-1β 0.0 ±0.0 0.0 ±0.0 0.0 ±0.0 0.0 ±0.0 0.0 ±0.0 0.0 ±0.0 7.1 ±4.6
TNF- α 0.0 ±0.0 17.9 ±8.7 14.8 ±13.9 0.0 ±0.0 0.0 ±0.0 37.5 ±37.5 0.6 ±0.6
TGF-β 0.0 ±0.0 37.4 ±18.0 366.0 ±131.6* 0.0 ±0.0 142.4 ±137.7 0.0 ±0.0 1.5 ±1.5
VEGF 701.1 ±578.9 460.9 ±376.5 284.5 ±162.7 210.0 ±143.0 251.3 ±221.2 320.8 ±118.5 165.8 ±128.1
Table 4.2 Cytokine concentrations in heparin tubes stored at different temperatures (4°C, 24°C, 37°C) for three different periods (0 hours, 4 hours, 24 hours). Basic plasma levels are stated in column “0h”. Data are given as mean (± standard error of the mean). n=7

39
4.1.3 Analysis of EDTA plasma tubes
Although the concentrations of anylates measured in EDTA plasma differed more
from those in serum and heparinized plasma when being analyzed initially, EDTA
plasma levels showed the least divergence after 24 hours, even at temperatures
above 24°C. IL-8, GRO-α, ENA-78, MCP-1 and all cytokine concentrations were
stable in EDTA plasma for all test samples. GCP-2 was the only protein showing
significant alterations. TNF-α, IL-1β and TGF-β were not detectable in most plasma
samples.
Baseline levels of TGF-β were not detectable in heparinized plasma samples,
whereas baseline levels of TGF-β in serum tubes were 6-times higher than in EDTA
plasma (serum: 643.2 ±19.4 vs. EDTA plasma 92.1 ±82.5). A similar or greater
difference between the serum and plasma levels was observed at all other time
points.

40
Plasma EDTA (pg/ml)
4°C 24°C 37°C
0h 4h 24h 4h 24h 4h 24h
IL-8 97.7 ±21.4 233.4 ±144.6 74.1 ±17.8 110.9 ±27.8 82.1 ±22.3 67.8 ±12.7 118.9 ±22.7
GRO- α 32.6 ±23.3 7.4 ±2.7 11.9 ±3.7 17.6 ±9.4 15.9 ±8.3 13.5 ±13.3 31.9 ±9.5
ENA-78 963.9 ±771.7 343.6 ±301.1 954.5 ±413.5 685.6 ±350.3 1620.9 ±594.5 58.5 ±58.5 1421.0 ±578.5
GCP-2 315.9 ±54.2 248.9 ±38.3 * 368.7 ±54.5 119.7 ±21.2 ** 200.3 ±26.4 ** 156.0 ±23.0 * 306.5 ±19.2
MCP-1 23.7 ±20.6 0.4 ±0.4 59.4 ±30.5 35.2 ±14.5 24.1 ±10.2 9.7 ±4.6 18.3 ±4.3
IL-6 93.8 ±48.3 37.9 ±11.5 68.1 ±35.2 78.0 ±25.4 48.5 ±23.6 56.5 ±28.7 81.5 ±32.4
IL-1β 0.0 ±0.0 0.0 ±0.0 0.0 ±0.0 0.0 ±0.0 0.0 ±0.0 0.0 ±0.0 7.6 ±6.9
TNF- α 8.5 ±7.7 0.0 ±0.0 17.4 ±11.6 7.7 ±4.0 0.0 ±0.0 13.9 ±13.9 5.1 ±4.9
TGF-β 92.1 ±82.5 39.5 ±37.5 83.0 ±60.0 0.0 ±0.0 40.9 ±30.0 0.0 ±0.0 100.5 ±52.6
VEGF 619.9 ±318.5 53.2 ±29.4 143.0 ±81.2 320.5 ±203.1 131.8 ±66.3 111.6 ±102.2 219.4 ±108.6
Table 4.3 Cytokine concentrations in EDTA tubes stored at different temperatures (4°C, 24°C, 37°C) for three different periods (0 hours, 4 hours, 24 hours). Basic plasma levels are stated in column “0h”. Data are given as mean (± standard error of the mean). n=7

41
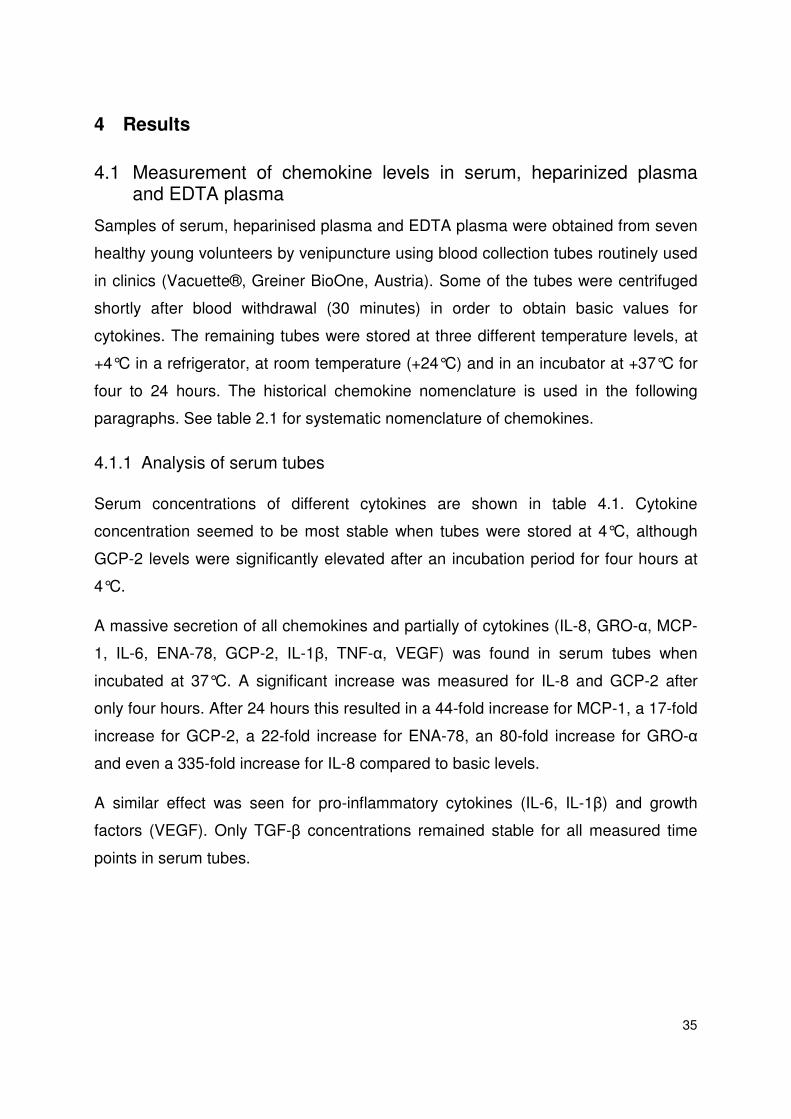
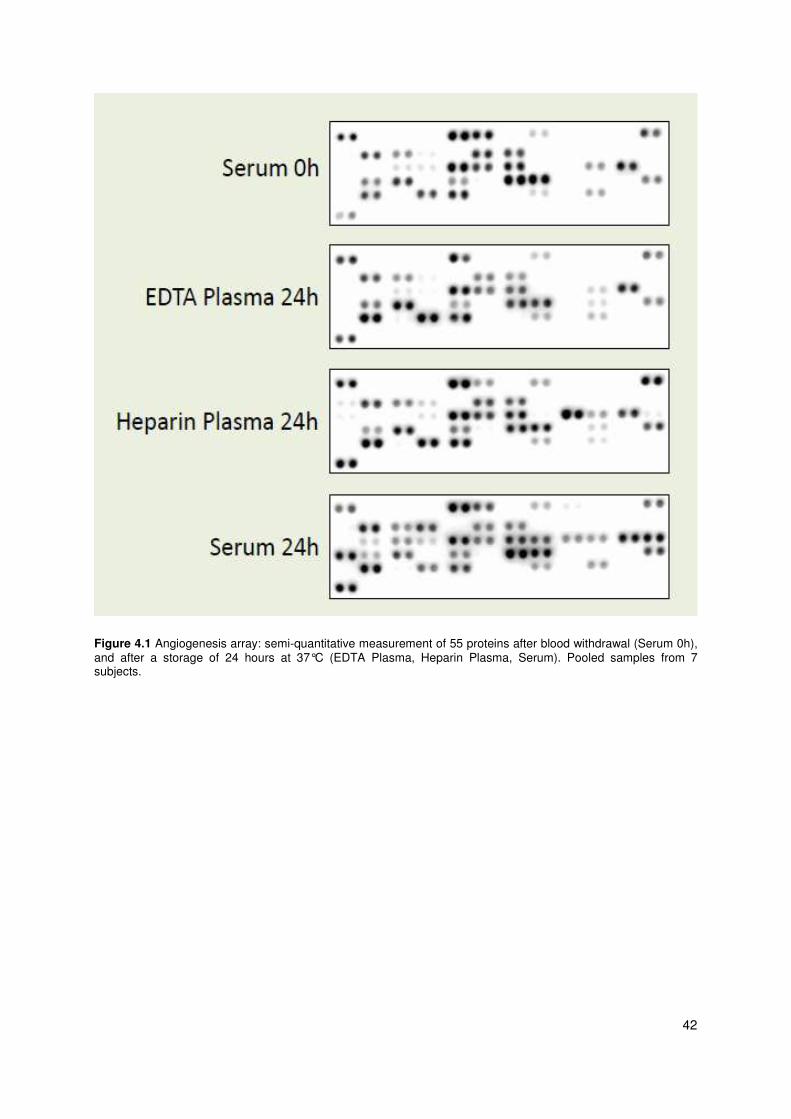
4.2 Angiogenesis array
55 proteins associated with neo-angiogenesis were determined by a membrane
array. Results are shown in figure 4.1 and 4.2. After incubation of blood samples at
37°C for 24 hours prior to centrifugation (n=7), several proteins are increased in
serum, heparinized plasma and EDTA plasma. In EDTA plasma higher amounts of
Serpin E1, MMP-9, TIMP-1and PDGF-AA Angiogenin-1 were detected compared to
serum processed immediately after venipuncture.
In heparinized plasma Serpin E1, TIMP-1 and PDGF-AA were elevated compared to
control serum. IL-8 concentrations, which were not detectable in control serum, were
massively detectable in heparinized plasma.
The following cytokines were only detectable in serum samples stored 24 hours at
37°C: MIP-1α, epidermal growth factor (EGF), IL-1β and MCP-1.
42
Figure 4.1 Angiogenesis array: semi-quantitative measurement of 55 proteins after blood withdrawal (Serum 0h), and after a storage of 24 hours at 37°C (EDTA Plasma, Heparin Plasma, Serum). Pooled samples from 7 subjects.

43
Figure 4.2 Angiogenesis array: Proteins which were detected in higher concentration than in serum at 0h were highlighted in blue. Red highlighted proteins were not detectable at basic serum samples.
4.3 Induction of chemokine secretion of human peripheral blood mononuclear cells by autologous serum
Based on the observation that especially chemokines were massively secreted in
serum tubes when being incubated we sought to investigate the nature of serum
induced release of chemokines and other factors from human white blood cells.
A high increase of IL-8, GRO-α, ENA-78, GCP-2, MCP-1 and MIP-1β was observed
when human PBMCs were incubated of with 20% autologous serum. This increment
of chemokine secretion was weaker or less detectable when 20% autologous
heparinized plasma was added. The incubation with 20% fetal calf serum (FCS)

44
resulted in a comparable induction of chemokine secretion compared with
heparinized plasma. As FCS is often routinely heat-inactivated (by being incubated in
a water bath at 56°C in order to inactivate complement and coagulation factors) and
filtered through 0,1µm membranes we sought to investigate commercially available
FCS with freshly prepared autologous serum that underwent a heat-inactivation
protocol.
Supernatants obtained from PBMC incubated with FCS showed only a marginal
increase of chemokine secretion compared to base line values. Heat inactivated
serum from humans evidenced a comparable potential to serum to induce chemokine
secretion. This secretion pattern was evident for all tested CXCR2 (IL-8, GRO-α,
ENA-78, GCP-2) and CCR2 (MCP-1) associated chemokines but not for CXCR3 and
4 related chemokines (SDF-1 and IP-10) (see table 4.4).
The pro-inflammatory chemokines IL-6 and TNF-α were also found in higher
concentrations after incubation human PMBCs with autologous serum compared to
incubation with heparinized plasma. TGF-β and VEGF did not show an increment
when cells were incubated together with 20% autologous serum or with 20%
heparinized plasma.

45
(pg/ml) Medium plus 20% Serum plus 20% Plasma plus 20% FCS plus 20% HI-Serum
IL-8 373.4 ±81.4 12065.5 ±1295.9 *** 833.7 ±369.8 616.2 ±136.1 4448.5 ±795.4 ***
GRO-α 61.9 ±21.9 4988.9 ±241.9 *** 394.1 ±221.7 136.9 ±44.4 3675.2 ±722.1 ***
ENA-78 438.2 ±210.2 23546.8 ±1585.3 *** 1851.2 ±1067.2 1099.7 ±297.6 10767.5 ±2118.2 ***
GCP-2 59.1 ±18.5 1204.4 ±226.6 *** 149.6 ±78.9 46.9 ±20.4 688.1 ±157.4 ***
MCP-1 682.1 ±190.8 23457.6 ±980.2 *** 6215.6 ±2335.5 ** 2116.3 ±564.7 * 15141.5 ±3040.5 ***
MIP-1β 30.5 ±13.9 936.6 ±140.9 *** 130.6 ±44.9 * 23.9 ±5.6 224.5 ±77.0 **
RANTES 4764.8 ±634.4 9116.3 ±715.6 *** 3161.7 ±178.0 6381.0 ±1304.0 10033.9 ±983.7 ***
SDF-1 37.0 ±9.8 0.0 ±0.0 ** 0.0 ±0.0 ** 9.9 ±6.1 59.9 ±19.4
IP-10 19.6 ±10.5 7.8 ±6.6 931.1 ±347.5 ** 185.3 ±135.4 144.9 ±97.1
IL-6 0.0 ±0.0 613.1 ±108.1*** 3.6 ±2.2 0.2 ±0.2 155.9 ±127.7*
TNF-α 1.2 ±0.8 83.3 ±33.0* 0.0 ±0.0 0.0 ±0.0 1.2 ±0.9
VEGF 61.5 ±9.4 21.6 ±5.9* 0.0 ±0.0* 31.7 ±5.1* 41.1 ±9.9*
TGF-β 17.4 ± 2.9 41.4 ± 4.6*** 10.9 ± 1.9 17.9 ±3.0*** 44.4 ±5.4
Table 4.4 Cytokine concentrations measured in cell culture supernatant from 1*10^6 PBMCs per milliliter. PBMCs were seeded with medium, or medium containing 20% autologous serum, or 20% autologous plasma, or 20% FCS (fetal calf serum), or 20% HI-serum (heat inactivated serum). Data are given as mean (± standard error of the mean). n=8-12

46
4.3.1 Dose dependency of serum induced chemokines secretion
When autologous serum was added in increasing doses, a significant induction of IL-
8 secretion was measured, even at concentrations as low as 2,5% (1620.1 ±472.1
pg/mL) compared to baseline concentrations (368.5 ±170.9pg/mL). IL-8 secretion
was induced in a dose depending fashion to 4777.8 ±1243.1 pg/mL when 5% serum
were addend, to 6635.46 ±1886.8 pg/mL when 10% serum were added and slightly
decreased again to 4134.3 ±1288.6 with 20% serum supplement (n=8) (see figure
4.3). A similar dose dependency was measured for the CXC2R binding chemokines
ENA-78 and GRO-α.
Medium
+ 2.5% + 5%
+ 10%
+ 20%
0
2500
5000
7500
10000
12500
15000
p=0.016
p=0.016
p=0.016
p=0.016
IL-8
(p
g/m
l)
Figure 4.3 Incubation of PBMC with increasing concentrations of autologous serum induct an increase of IL-8 secretion (mean±SEM) n=8.
Medium
+ 2.5% + 5%
+ 10%
+ 20%
0
2500
5000
7500
10000
12500
15000
17500
20000
p=0.0078
p=0.0078
p=0.0078
p=0.0078
EN
A-7
8 (
pg
/ml)
Figure 4.4 Incubation of PBMC with increasing concentrations of autologous serum induct an increase of ENA-78 secretion (mean±SEM) n=8.

47
Medium
+ 2.5% + 5%
+ 10%
+ 20%
0
2000
4000
6000
8000
p=0.023
ns.
ns.
p=0.016
GR
O-a
lph
a (
pg
/ml)
Figure 4.5 Incubation of PBMC with increasing concentrations of autologous serum induct an increase of IL-8 secretion (mean±SEM) n=8.
Autologous serum supplement did not influence IL-1β nor IL-1RA levels (see figure
4.6).
Medium
+ 2.5% + 5%
+ 10%
+ 20%
0
200
400
600
800
1000
IL-1
RA
(p
g/m
l)
Figure 4.6 Incubation of PBMC with increasing concentrations of autologous serum do not induct an increase of IL-1RA secretion (mean±SEM) n=8.
4.4 Cytokine secretion triggered by fibrin
Fibrin was observed to induce a massive cytokine release in a dose dependent
manner (see figure 4.7-10). Low amounts of fibrin (0.25 µg – up to 0.5 µg fibrin) that
were added to PBMCs leed to a weak increase. A highly significant induction of all
measured cytokines in this experiment was examined when 50 µg or more of fibrin
were cell culture wells (p<0.001).

48
Medium
+ 0.25 µg Fibrin
+ 0.5 µg Fibrin
+ 10 µg Fibrin
+ 50 µg Fibrin
+ 250 µg Fibrin
+ 500 µg Fibrin
0
5000
10000
15000
20000
p=0.0002
p<0.0001
p=0.0002
p<0.0001
IL-8
(p
g/m
l)
Figure 4.7 Fibrin triggers IL-8 secretion of PBMC dose dependent. (mean±SEM) n=8.
Medium
+ 0.25 µg Fibrin
+ 0.5 µg Fibrin
+ 10 µg Fibrin
+ 50 µg Fibrin
+ 250 µg Fibrin
+ 500 µg Fibrin
0
2000
4000
6000
8000
10000
p=0.0063
p=0.0018
p=0.0017
p=0.0070
GR
O-a
lph
a (
pg
/ml)
Figure 4.8 Fibrin triggers GRO-α secretion of PBMC dose dependent. (mean±SEM) n=8.

49
Medium
+ 0.25 µg Fibrin
+ 0.5 µg Fibrin
+ 10 µg Fibrin
+ 50 µg Fibrin
+ 250 µg Fibrin
+ 500 µg Fibrin
0
10000
20000
30000
40000
50000
p=0.0074
p=0.0004
p=0.0045
p=0.0055
EN
A-7
8 (
pg
/ml)
Figure 4.9 Fibrin triggers ENA-78 secretion of PBMC dose dependent. (mean±SEM) n=8.
Medium
+ 0.25 µg Fibrin
+ 0.5 µg Fibrin
+ 10 µg Fibrin
+ 50 µg Fibrin
+ 250 µg Fibrin
+ 500 µg Fibrin
0
5000
10000
15000
p=0.0078
p=0.0078
p=0.0078
p=0.0078
IL-6
(p
g/m
l)
Figure 4.10 Fibrin triggers IL-6secretion of PBMC dose dependent. (mean±SEM) n=8.

50
5 Discussion
In the present study we evaluated the stability of cytokines and chemokines in blood
samples of healthy subjects. In order to prove our data obtained from whole blood
experiments, we demonstrated in an in vitro experiment that serum components
induce an enhanced secretion of cytokines and chemokines of PBMCs. Based on
this finding we assumed that coagulation products trigger the protein release. In a
further in vitro assay we demonstrated that fibrin had the ability to enhance cytokine
and chemokine secretion.
Since the analysis of cytokine concentrations in serum or plasma of patients has
become an important research issue in several diseases, work has to be undertaken
to evaluate the stability of these mediators in blood samples. Hence, we sought to
investigate the effect of sample storage period and storage temperature on anylates
concentration in serum and plasma.
We measured the concentration of cytokines in serum and plasma, after exposure of
blood to different conditions before centrifugation (time periods varying from 30
minutes to 24 hours). Furthermore, we evaluated the influence of different storage
temperatures (4°C, RT, 37°C) hypothesizing that the storage temperature serves as
an important influence factor for many cellular reactions such as paracrine
response65, 68.
We were able to show that both activation of coagulation cascade in serum tubes
and temperature above 24°C (room temperature) massively triggers chemokine
release from cellular compartments. Therefore, rapid separation of serum and
plasma from cellular components and freezing of samples is essential to preserve
reliability of markers in samples for later analysis. If it is not possible to separate
cellular components in samples immediately after blood draw, as might be expected,
blood storage at 4°C seems to be the best way to achieve baseline chemokine
concentrations.
However, it has to be noted that even a storage at 4°C for four hours can significantly
alter cytokine concentrations. After 24 hours of storage most chemokine
concentrations were significantly higher compared to baseline concentrations.
51
This study shows that cytokine concentrations measured in EDTA plasma remain the
most stable and seems to be suitable for stability reasons. This could be explained by
the fact EDTA is a chelating agent which binds metal ions such as Ca²+ and F³+. Ca²+
is a vital co-factor for cytokine release, known to effect cellular functions, including
secretion of IL-6, chemo attraction and apoptosis83, 84. However, in base line
specimens EDTA plasma evidenced the highest variability between samples. This
might be caused by interferences of EDTA with ELISA systems.
In agreement with some studies65, but not with others68, a significant relationship
between IL-6 and storage time and storage temperature was found. We claim that IL-
6 is rather produced de novo than released from stored cellular pools, because of its
time dependent increase.
Previous studies compared cytokine values in blood spiked with cytokines prior to
separation into serum or plasma and stored this samples for up to 20 days at
different temperatures76, 79, 80. The latter examined decreased TNF-α concentrations
in samples kept at room temperature compared to samples stored at 4°C and 70°C.
Thavasu et al. performed a study on whole blood spiked with TNF-α, IL-6, IL-1β, IL-
1α, Interferon α, and Interferon gamma stored at 4°C or room temperature. The
recovery of all anylates except IL-1α was lower after a storage at room temperature
compared to 4°C. Furthermore, the measurable concentrations of serum samples
spiked with cytokines were by trend lower than concentration recovered for plasma
samples, which is in contrast to the increase of cytokines in whole blood samples, as
we found.
It appears that exogen added cytokines to whole blood samples are absorbed by
blood cells or are bound to cellular components and therefore are not accessible for
measurement with immunoassays. Marie et al. examined that up 96% of exogenous
added IL-8 is associated with blood cells and became measureable after cell lysis85.
Recovery of IL-8 added to whole EDTA plasma samples was discovered by
Reinsberg et al. This group reported that <35% of added IL-8 to EDTA whole blood
samples could be recovered, whereas the recovery from plasma lysate was 104%
indicating that cells are responsible for IL-8 sequestration86.

52
In order to prove our results seen in whole blood samples, we tried to reproduce the
results in cell cultures of human PBMC which were supplemented with serum,
plasma, FCS or heat inactivated serum. Similarly as in the whole blood incubation
experiment, PBMC cell cultures supplemented with autologous serum evidenced a
significant induction of chemokine secretion. This magnitude of cytokine induction
was not apparent when plasma or FCS was added.
Heat inactivated serum exposed to be a comparable trigger to serum for chemokine
secretion. We evaluated the influence of heat inactivated serum in order to determine
the influence of immunological factors on chemokine secretion. Heat inactivated
serum is used to inactivate immune factors, particularly serum complement to
preserve integrity of immunoassays87. Complement factors are known to stimulate
cytokine release in humans88-90. We were able to show that heat activated serum had
almost the same potential to induce cytokine production of human PBMC as non heat
inactivated serum. Therefore, we conclude that complement factors were not
responsible for the massive secretion of proteins in serum tubes in our study.
Based on these results we speculated that a high molecular coagulation product
such as fibrin might be accountable for induction of chemokine secretion. As FCS
undergoes many filtration steps, proteins of higher molecular structures are removed,
therefore it seems likely that FCS failed to produce a comparable cytokine secretion
pattern.
Fibrin induces synthesis of chemokines and pro-inflammatory cytokines in human
PBMC.
To further verify our hypothesis, we incubated human PBMC with increasing doses of
fibrin. In order to reproduce an in vivo situation we used Fibrin concentration found in
serum91 respectively higher fibrin concentrations used in in vitro experiments92.
According to previous studies on PBMCs92, macrophages93, human synovial
fibroblasts94 and human vascular endothelial cells95, 96 the supplement of fibrin
induces a highly significant IL-8 induction.
During the coagulation process, thrombin cleaves fibrinogen releasing the
fibrinopeptides A and B and fibrin. The fibrin monomers further polymerize and are

53
finally stabilized by coagulation factor XIIIa catalyzing the formation of isopeptide
bonds between the gamma chains of two fibrin molecules 97.
The exact mechanism of the cross-talk between coagulation and inflammation is still
not elucidated. Several reports in the literature describe the linkage between
inflammation and coagulation products91, 98, 99, whereas fibrinogen as well as fibrin
have a pro-inflammatory capacity92, 97.
Pro-angiogenic capacity of serum tube
Based on previous reports, indicating that 20% serum supplement in cell based
therapies has positive effects on cell viability100, neovascularization capacity and
migration capacity of bone marrow cells100, we measured 55 pro-angiogenic proteins
in 4 pooled (n=7) samples. Therefore a commercially available membrane array
(R&D Systems) for detection of pro-angiogenic proteins was used.
We detected elevated amounts of pro-angiogenic proteins in serum samples as well
as in heparin plasma and EDTA plasma samples when tubes were stored at 37°C for
24 hours compared to tubes centrifuged immediately after blood withdrawal. The
most pro-angiogenic proteins were detected in samples from serum tubes.
These proteins might be responsible for the enhanced migratory capacity seen of
bone marrow cells after a 12 hour incubation with 20% serum compared to the
incubation with 20% heparinized plasma100.
5.1 Limitations
This study has some limitations worth pointing out. The sample size was low (4 to 8
participants per assay), and does not reflect hospitalized patient in age and illness.
Due to our limited PBMC purification process, a contamination of PBMC cultures with
erythrocytes and platelets has to be assumed. Platelets store high amounts of
chemokines such as IL-8, TGF-β, which are released after platelet activation70, 101.
However, the time dependent increase and the high amount of measured anylates
suggest rather a de novo production than only a release of pre-assembled cytokines.

54
5.2 Clinical implications
Based on our findings, we suggest following instruction in handling blood samples for
chemokine analysis
• immediate processing of plasma and serum is essential
• non-centrifuged samples should be stored at 4°C
• comparison between serum and plasma concentrations have to be interpreted
critically
• EDTA plasma seems to be most suitable for stability reasons, whereas EDTA
can interfere with the test system.
In conclusion, we were able to show in this study that cytokine levels are highly
susceptible to sample handling and processing prior to separation into serum or
plasma. Cytokine levels remain more stable in plasma than in serum and the
accumulation of cytokines in serum samples in part is regulated by coagulation
products.
55
6 References
1. Tedgui A, Mallat Z. Cytokines in atherosclerosis: pathogenic and regulatory pathways. Physiol Rev 2006; 86(2):515-81.
2. Kronfol Z. Cytokines And Mental Health. In Kronfol Z, ed., Vol. 1. Berlin: Kluwer Academic Publishers, 2003.
3. Beutler BA, Milsark IW, Cerami A. Cachectin/tumor necrosis factor: production, distribution, and metabolic fate in vivo. J Immunol 1985; 135(6):3972-7.
4. Roumen RM, Hendriks T, van der Ven-Jongekrijg J, et al. Cytokine patterns in patients after major vascular surgery, hemorrhagic shock, and severe blunt trauma. Relation with subsequent adult respiratory distress syndrome and multiple organ failure. Ann Surg 1993; 218(6):769-76.
5. Biffl WL, Moore EE, Moore FA, et al. Interleukin-6 in the injured patient. Marker of injury or mediator of inflammation? Ann Surg 1996; 224(5):647-64.
6. Roth GA, Zimmermann M, Lubsczyk BA, et al. Up-regulation of interleukin 33 and soluble ST2 serum levels in liver failure. J Surg Res 2010; 163(2):e79-83.
7. Brunner M, Krenn C, Roth G, et al. Increased levels of soluble ST2 protein and IgG1 production in patients with sepsis and trauma. Intensive Care Med 2004; 30(7):1468-73.
8. Ploder M, Pelinka L, Schmuckenschlager C, et al. Lipopolysaccharide-induced tumor necrosis factor alpha production and not monocyte human leukocyte antigen-DR expression is correlated with survival in septic trauma patients. Shock 2006; 25(2):129-34.
9. Hacker S, Lambers C, Pollreisz A, et al. Increased soluble serum markers caspase-cleaved cytokeratin-18, histones, and ST2 indicate apoptotic turnover and chronic immune response in COPD. J Clin Lab Anal 2009; 23(6):372-9.
10. McInnes IB, Schett G. Cytokines in the pathogenesis of rheumatoid arthritis. Nat Rev Immunol 2007; 7(6):429-42.
11. Rahman A, Isenberg DA. Systemic lupus erythematosus. N Engl J Med 2008; 358(9):929-39.
12. Mantovani A, Allavena P, Sica A, et al. Cancer-related inflammation. Nature 2008; 454(7203):436-44.
13. Belperio JA, Keane MP, Arenberg DA, et al. CXC chemokines in angiogenesis. J Leukoc Biol 2000; 68(1):1-8.
14. Strieter RM, Polverini PJ, Kunkel SL, et al. The functional role of the ELR motif in CXC chemokine-mediated angiogenesis. J Biol Chem 1995; 270(45):27348-57.
15. Luster AD. Chemokines--chemotactic cytokines that mediate inflammation. N Engl J Med 1998; 338(7):436-45.
16. Ponath PD, Qin S, Ringler DJ, et al. Cloning of the human eosinophil chemoattractant, eotaxin. Expression, receptor binding, and functional properties suggest a mechanism for the selective recruitment of eosinophils. J Clin Invest 1996; 97(3):604-12.
17. Balestrieri ML, Balestrieri A, Mancini FP, et al. Understanding the immunoangiostatic CXC chemokine network. Cardiovasc Res 2008; 78(2):250-6.
56
18. Rajagopalan L, Rajarathnam K. Structural basis of chemokine receptor function--a model for binding affinity and ligand selectivity. Biosci Rep 2006; 26(5):325-39.
19. Colobran R, Pujol-Borrell R, Armengol MP, et al. The chemokine network. I. How the genomic organization of chemokines contains clues for deciphering their functional complexity. Clin Exp Immunol 2007; 148(2):208-17.
20. Bernardini G, Hedrick J, Sozzani S, et al. Identification of the CC chemokines TARC and macrophage inflammatory protein-1 beta as novel functional ligands for the CCR8 receptor. Eur J Immunol 1998; 28(2):582-8.
21. Le Y, Zhou Y, Iribarren P, et al. Chemokines and chemokine receptors: their manifold roles in homeostasis and disease. Cell Mol Immunol 2004; 1(2):95-104.
22. Zlotnik A, Yoshie O. Chemokines: a new classification system and their role in immunity. Immunity 2000; 12(2):121-7.
23. Umehara H, Bloom ET, Okazaki T, et al. Fractalkine in vascular biology: from basic research to clinical disease. Arterioscler Thromb Vasc Biol 2004; 24(1):34-40.
24. Premack BA, Schall TJ. Chemokine receptors: gateways to inflammation and infection. Nat Med 1996; 2(11):1174-8.
25. Murphy PM, Tiffany HL. Cloning of complementary DNA encoding a functional human interleukin-8 receptor. Science. 1991. 253: 1280-1283. J Immunol 2009; 183(5):2898-901.
26. Lazennec G, Richmond A. Chemokines and chemokine receptors: new insights into cancer-related inflammation. Trends Mol Med 2010; 16(3):133-44.
27. Rosenfeld L. A golden age of clinical chemistry: 1948-1960. Clin Chem 2000; 46(10):1705-14.
28. Diagnostics B. Tube Guide 2010. Available at: http://www.bd.com/vacutainer/pdfs/plus_plastic_tubes_wallchart_tubeguide_VS5229.pdf.
29. Wilde C. Labatory Management. In Wild D, ed. The Immunoassy Handbook, Vol. Third Edition. Netherlands: Elsevier L.td, 2005. pp. 443 to 455.
30. D.J. E. Procedures for the Collection of Diagnostic Blood Specimens by Venipuncture; Approved Standard - Sixth Edition. Vol. 27. Wayne, Pennsylvania USA: Clinical Laboratory Standards Institue, 2003.
31. Westwood FCHOMR. Practical Immunology. In Sons JW, ed. Oxford: Blackwell Publishing Company, 2002.
32. Zhou X, Fragala MS, McElhaney JE, et al. Conceptual and methodological issues relevant to cytokine and inflammatory marker measurements in clinical research. Curr Opin Clin Nutr Metab Care 2010; 13(5):541-7.
33. Jacques HRVD. Cytokines im Human Health. In A. T, ed. Immunotoxicology, Pathology and Therapeutic Applications. Totowa: Humana Press Inc., 2007.
34. Leng SX, McElhaney JE, Walston JD, et al. ELISA and multiplex technologies for cytokine measurement in inflammation and aging research. J Gerontol A Biol Sci Med Sci 2008; 63(8):879-84.
35. Stefura WP, Campbell JD, Douville R, et al. Ultrasensitive ELISA for measurement of human cytokine responses in primary culture. Methods Mol Med 2008; 138:107-19.
36. Tarrant JM. Blood cytokines as biomarkers of in vivo toxicity in preclinical safety assessment: considerations for their use. Toxicol Sci 2010; 117(1):4-16.
57
37. Ledur A, Fitting C, David B, et al. Variable estimates of cytokine levels produced by commercial ELISA kits: results using international cytokine standards. J Immunol Methods 1995; 186(2):171-9.
38. Vignali DA. Multiplexed particle-based flow cytometric assays. J Immunol Methods 2000; 243(1-2):243-55.
39. Multimetrix. Luminex-Analyzer 2011. Available at: http://www.multimetrix.com/technologie/testprinzip.html. 2011.
40. Elshal MF, McCoy JP. Multiplex bead array assays: performance evaluation and comparison of sensitivity to ELISA. Methods 2006; 38(4):317-23.
41. Vazquez-Martin A, Colomer R, Menendez JA. Protein array technology to detect HER2 (erbB-2)-induced 'cytokine signature' in breast cancer. Eur J Cancer 2007; 43(7):1117-24.
42. Pohl D, Andrys C, Borska L, et al. CC and CXC chemokines patterns in psoriasis determined by protein array method were influenced by Goeckerman's therapy. Acta Medica (Hradec Kralove) 2009; 52(1):9-13.
43. Middleton RK, Lloyd GM, Bown MJ, et al. The pro-inflammatory and chemotactic cytokine microenvironment of the abdominal aortic aneurysm wall: a protein array study. J Vasc Surg 2007; 45(3):574-80.
44. Kverka M, Burianova J, Lodinova-Zadnikova R, et al. Cytokine profiling in human colostrum and milk by protein array. Clin Chem 2007; 53(5):955-62.
45. Joos TO, Berger H. The long and difficult road to the diagnostic market: protein microarrays. Drug Discov Today 2006; 11(21-22):959-61.
46. Joos TO, Stoll D, Templin MF. Miniaturised multiplexed immunoassays. Curr Opin Chem Biol 2002; 6(1):76-80.
47. Templin MF, Stoll D, Schrenk M, et al. Protein microarray technology. Trends Biotechnol 2002; 20(4):160-6.
48. Hartmann M, Roeraade J, Stoll D, et al. Protein microarrays for diagnostic assays. Anal Bioanal Chem 2009; 393(5):1407-16.
49. Sachdeva N, Asthana D. Cytokine quantitation: technologies and applications. Front Biosci 2007; 12:4682-95.
50. House RV. Cytokine measurement techniques for assessing hypersensitivity. Toxicology 2001; 158(1-2):51-8.
51. van Assen S, de Haan A, Holvast A, et al. Cell-mediated immune responses to inactivated trivalent influenza-vaccination are decreased in patients with common variable immunodeficiency. Clin Immunol 2011; 141(2):161-8.
52. Lalvani A. Diagnosing tuberculosis infection in the 21st century: new tools to tackle an old enemy. Chest 2007; 131(6):1898-906.
53. Banks RE. Measurement of cytokines in clinical samples using immunoassays: problems and pitfalls. Crit Rev Clin Lab Sci 2000; 37(2):131-82.
54. Marques-Vidal P, Bochud M, Bastardot F, et al. Levels and determinants of inflammatory biomarkers in a Swiss population-based sample (CoLaus study). PLoS One 2011; 6(6):e21002.
55. Sindermann J, Kruse A, Frercks HJ, et al. Investigations of the lymphokine system in elderly individuals. Mech Ageing Dev 1993; 70(1-2):149-59.
56. Fagiolo U, Cossarizza A, Scala E, et al. Increased cytokine production in mononuclear cells of healthy elderly people. Eur J Immunol 1993; 23(9):2375-8.
57. Pahlavani MA, Richardson A. The effect of age on the expression of interleukin-2. Mech Ageing Dev 1996; 89(3):125-54.
58
58. Hager K, Machein U, Krieger S, et al. Interleukin-6 and selected plasma proteins in healthy persons of different ages. Neurobiol Aging 1994; 15(6):771-2.
59. Lakatos P, Foldes J, Horvath C, et al. Serum interleukin-6 and bone metabolism in patients with thyroid function disorders. J Clin Endocrinol Metab 1997; 82(1):78-81.
60. McKane WR, Khosla S, Peterson JM, et al. Circulating levels of cytokines that modulate bone resorption: effects of age and menopause in women. J Bone Miner Res 1994; 9(8):1313-8.
61. Cartier A, Cote M, Lemieux I, et al. Age-related differences in inflammatory markers in men: contribution of visceral adiposity. Metabolism 2009; 58(10):1452-8.
62. Fischer CP, Berntsen A, Perstrup LB, et al. Plasma levels of interleukin-6 and C-reactive protein are associated with physical inactivity independent of obesity. Scand J Med Sci Sports 2007; 17(5):580-7.
63. Colbert LH, Visser M, Simonsick EM, et al. Physical activity, exercise, and inflammatory markers in older adults: findings from the Health, Aging and Body Composition Study. J Am Geriatr Soc 2004; 52(7):1098-104.
64. Petrovsky N, McNair P, Harrison LC. Diurnal rhythms of pro-inflammatory cytokines: regulation by plasma cortisol and therapeutic implications. Cytokine 1998; 10(4):307-12.
65. Skogstrand K, Ekelund CK, Thorsen P, et al. Effects of blood sample handling procedures on measurable inflammatory markers in plasma, serum and dried blood spot samples. J Immunol Methods 2008; 336(1):78-84.
66. Hosnijeh FS, Krop EJ, Portengen L, et al. Stability and reproducibility of simultaneously detected plasma and serum cytokine levels in asymptomatic subjects. Biomarkers 2010; 15(2):140-8.
67. Wong HL, Pfeiffer RM, Fears TR, et al. Reproducibility and correlations of multiplex cytokine levels in asymptomatic persons. Cancer Epidemiol Biomarkers Prev 2008; 17(12):3450-6.
68. Friebe A, Volk HD. Stability of tumor necrosis factor alpha, interleukin 6, and interleukin 8 in blood samples of patients with systemic immune activation. Arch Pathol Lab Med 2008; 132(11):1802-6.
69. Clendenen TV, Arslan AA, Lokshin AE, et al. Temporal reliability of cytokines and growth factors in EDTA plasma. BMC Res Notes 2010; 3:302.
70. Picker SM, Steisel A, Gathof BS. Evaluation of White Blood Cell- and Platelet-Derived Cytokine Accumulation in MIRASOL-PRT-Treated Platelets. Transfus Med Hemother 2009; 36(2):114-120.
71. Apelseth TO, Hervig TA, Wentzel-Larsen T, et al. Cytokine accumulation in photochemically treated and gamma-irradiated platelet concentrates during storage. Transfusion 2006; 46(5):800-10.
72. Cannon JG, van der Meer JW, Kwiatkowski D, et al. Interleukin-1 beta in human plasma: optimization of blood collection, plasma extraction, and radioimmunoassay methods. Lymphokine Res 1988; 7(4):457-67.
73. Panicker G, Meadows KS, Lee DR, et al. Effect of storage temperatures on the stability of cytokines in cervical mucous. Cytokine 2007; 37(2):176-9.
74. Jackman RP, Utter GH, Heitman JW, et al. Effects of blood sample age at time of separation on measured cytokine concentrations in human plasma. Clin Vaccine Immunol 2011; 18(2):318-26.

59
75. Leroux-Roels G, Offner F, Philippe J, et al. Influence of blood-collecting systems on concentrations of tumor necrosis factor in serum and plasma. Clin Chem 1988; 34(11):2373-4.
76. Aziz N, Nishanian P, Mitsuyasu R, et al. Variables that affect assays for plasma cytokines and soluble activation markers. Clin Diagn Lab Immunol 1999; 6(1):89-95.
77. de Jager W, Bourcier K, Rijkers GT, et al. Prerequisites for cytokine measurements in clinical trials with multiplex immunoassays. BMC Immunol 2009; 10:52.
78. Butterfield LH, Potter DM, Kirkwood JM. Multiplex serum biomarker assessments: technical and biostatistical issues. J Transl Med 2011; 9:173.
79. Flower L, Ahuja RH, Humphries SE, et al. Effects of sample handling on the stability of interleukin 6, tumour necrosis factor-alpha and leptin. Cytokine 2000; 12(11):1712-6.
80. Thavasu PW, Longhurst S, Joel SP, et al. Measuring cytokine levels in blood. Importance of anticoagulants, processing, and storage conditions. J Immunol Methods 1992; 153(1-2):115-24.
81. Pawliszyn J. Sampling And Sample Preparation For Field And Laboratory In Science E, ed. Amsterdam: Elsevier Science, 2002.
82. Bortz J. Forschungsmethoden und Evaluation. 3 ed. Berlin: Springer-Verlag, 2002.
83. Bornefalk E, Ljunghall S, Lindh E, et al. Regulation of interleukin-6 secretion from mononuclear blood cells by extracellular calcium. J Bone Miner Res 1997; 12(2):228-33.
84. Hampton MB, Vanags DM, Porn-Ares MI, et al. Involvement of extracellular calcium in phosphatidylserine exposure during apoptosis. FEBS Lett 1996; 399(3):277-82.
85. Marie C, Muret J, Fitting C, et al. Reduced ex vivo interleukin-8 production by neutrophils in septic and nonseptic systemic inflammatory response syndrome. Blood 1998; 91(9):3439-46.
86. Reinsberg J, Dembinski J, Dorn C, et al. Determination of total interleukin-8 in whole blood after cell lysis. Clin Chem 2000; 46(9):1387-94.
87. Tejde A, Mathsson L, Ekdahl KN, et al. Immune complex-stimulated production of interleukin-12 in peripheral blood mononuclear cells is regulated by the complement system. Clin Exp Immunol 2004; 137(3):521-8.
88. van Deventer SJ, Buller HR, ten Cate JW, et al. Experimental endotoxemia in humans: analysis of cytokine release and coagulation, fibrinolytic, and complement pathways. Blood 1990; 76(12):2520-6.
89. Sikkeland LI, Thorgersen EB, Haug T, et al. Complement activation and cytokine response by BioProtein, a bacterial single cell protein. Clin Exp Immunol 2007; 148(1):146-52.
90. Carroll MC. The complement system in regulation of adaptive immunity. Nat Immunol 2004; 5(10):981-6.
91. Iba T, Kidokoro A, Fukunaga M, et al. Association between the severity of sepsis and the changes in hemostatic molecular markers and vascular endothelial damage markers. Shock 2005; 23(1):25-9.
92. Jensen T, Kierulf P, Sandset PM, et al. Fibrinogen and fibrin induce synthesis of proinflammatory cytokines from isolated peripheral blood mononuclear cells. Thromb Haemost 2007; 97(5):822-9.

60
93. Smiley ST, King JA, Hancock WW. Fibrinogen stimulates macrophage chemokine secretion through toll-like receptor 4. J Immunol 2001; 167(5):2887-94.
94. Liu X, Piela-Smith TH. Fibrin(ogen)-induced expression of ICAM-1 and chemokines in human synovial fibroblasts. J Immunol 2000; 165(9):5255-61.
95. Qi J, Goralnick S, Kreutzer DL. Fibrin regulation of interleukin-8 gene expression in human vascular endothelial cells. Blood 1997; 90(9):3595-602.
96. Qi J, Kreutzer DL. Fibrin activation of vascular endothelial cells. Induction of IL-8 expression. J Immunol 1995; 155(2):867-76.
97. Jennewein C, Tran N, Paulus P, et al. Novel aspects of fibrin(ogen) fragments during inflammation. Mol Med 2011; 17(5-6):568-73.
98. Levi M. The coagulant response in sepsis and inflammation. Hamostaseologie 2010; 30(1):10-2, 14-6.
99. Paul J, Strickland S, Melchor JP. Fibrin deposition accelerates neurovascular damage and neuroinflammation in mouse models of Alzheimer's disease. J Exp Med 2007; 204(8):1999-2008.
100. Seeger FH, Tonn T, Krzossok N, et al. Cell isolation procedures matter: a comparison of different isolation protocols of bone marrow mononuclear cells used for cell therapy in patients with acute myocardial infarction. Eur Heart J 2007; 28(6):766-72.
101. Gleissner CA, von Hundelshausen P, Ley K. Platelet chemokines in vascular disease. Arterioscler Thromb Vasc Biol 2008; 28(11):1920-7.

61
7 Abbreviations
EDTA ethylenediaminetetraacetic
EGF epidermal growth factor
ELISA Enzyme-linked immunosorbent assay
ENA-78 Epithelial cell-derived neutrophil-activating peptide-78
FCS fetal calf serum
GCP-2 granulocyte chemotactic protein
IL-8 interleukin-8
IL-1RA interleukin 1 receptor antagonist
GRO-α Growth-related Oncogene alpha
HBBS Hanks balanced salt solution
HI-serum heat inactivated serum
MIP-1α monocyte chemotactic protein-1alpha
MIP-1β macrophage inflammatory protein 1beta
MMP-9 matrix metalloproteinase 9
PBMC peripheral blood mononuclear cell
PDGF platelet-derived growth factor
SEM standard error of the mean
TGF-β transforming growth factor beta
TIMP-1 tissue inhibitor of metalloproteinases
TNF-α tumor necrosis factor-alpha
VEGF vascular endothelial growth factor

62

63
Curriculum Vitae Lucian Beer PERSONAL BACKGROUND Nationality: Austrian Family Status: Single
Date and Place of Birth: May 16th, 1989, Vienna, Austria
EDUCATION 1995 – 1999 Primary School 1999 – 2007 Erzbischöfliches Real und Aufbaugymnasium Hollabrunn, Austria (High
School) 2007/06 Matura (high school graduation) with Distinction 2007 – 2008 Zivildienst 2008/10 – Present Medical Student at the Medical University of Vienna, Austria 2009/11 – Present Student Research Fellow at the Department of Cardio-Thoracic
Surgery, General Hospital Vienna, Medical University of Vienna, Austria
CLINICAL TRAINING 2010/09 Clinical Clerkship at the Department of Internal Medicine, LKH
Hollabrunn, Austria (4 weeks) 2010/08 Clinical Clerkship at the Department of Surgery, LKH Hollabrunn,
Austria (2 weeks) 2011/02 Clinical Clerkship at Surgery of Dr. Michael Putz; Göstling an der Ybbs,
Austria (2 weeks) 2011/08 Clinical Clerkship at the Department of Gynaecology, LKH Tulln (2
weeks) 2011/09 Clinical Clerkship at the Department of Paediatrics, LKH Tulln (2
weeks) 2011/09 Clinical Clerkship at the Department of Ambulance Station; LKH
Korneuburg (2 weeks) 2012/02 Clinical Clerkship at the Department of Cardiac Surgery; AKH Vienna
(2 weeks) CONTINUING EDUCATION 2011/11 Methodenseminar “Statistik” – Methods Seminar “Statistics” MMag. Dr.
Alexandra Graf 2012/02 Biometrie I: Beschreibung und Visualisierung medizinischer Daten –
Biometry I: Description and Visualization of Medical Data, Vienna, Austria
2012/02 Biometrie II: Statistische Tests und Lebensdaueranalyse bei medizinischen Fragestellungen – Biometrie II: Statistical Tests and Analysis of Survival in Medical Research, Vienna, Austria

64
2012/05 Methodenseminar: “Fluoreszenzbasierte Methoden in der zellbiologischen Forschung“– Methods Seminar „Fluoreszenz Based Methods in cell-biological science“
RESEARCH ACTIVITY AND PUBLICATIONS Lichtenauer M, Mildner M, Baumgartner A, Hasun M, Werba G, Beer L, Altmann P, Roth G, Gyöngyösi M, Podesser BK, Ankersmit HJ.: Intravenous and intramyocardial injection of apoptotic white blood cell suspensions prevents ventricular remodelling by increasing elastin expression in cardiac scar tissue after myocardial infarction. Basic Res Cardiol. 2011 Mar 17 ABSCTRACTS AND POSTER PRESENTATIONS L. Beer, K. Hoetzenecker, M. Hasun, A. Baumgartner, S. Hacker, M. Wolfsberger, A. Mangold, S. Nickl, M. Zimmerman, A. Mitterbauer, B. K. Podesser, H. J. Ankersmit, M. Lichtenauer.: Serum-free Cell Culture Medium Reduces Myocardial Damage After Ischemia in an Experimental Model of Myocardial Infarction: Importance for Cell Therapeutic Methods. Austrian Journal of Cardiology 2010; 17 (5-6), 165-233.
K. Hoetzenecker, S. Hacker, A. Mitterbauer, L. Beer, M. Rauch, W. Hotzenecker, E. Guenova, M. Lichtenauer, W. Kleptko, H. K. Ankersmit,: Expansion of a unique, lung-specific autoreactive T helpe cell polpulation in COPD. European Surgery, Acta Chirurgica Austriaca, Volume 42, Suppl 236, 2010.
K. Hotzenecker, M. Töpker, M. Rauch, L. Beer, S. Hacker, M. Zimmermann, W. Klepetko, H. J. Ankersmit.: Seldom referral to the thoracic surgeon: spontanously ruptured left inferior thyroid artery. European Surgery, Acta Chirurgica Austriaca, Volume 42, Suppl 236, 2010.
L. Beer, G. Werba, S. Nickl, M. Zimmerman, A. Mitterbauer, H. J. Ankersmit, M. Lichtenauer: Secretion of cytokines and chemokines by peripheral blood mononuclear cells is triggered by coagulation products. ÖKG 2011, Salzburg – Congress, Salzburg
L. Beer, G. Werba, S. Nickl, M. Zimmerman, A. Mitterbauer, H. J. Ankersmit, M. Lichtenauer: Secretion of cytokines and chemokines by peripheral blood mononuclear cells is triggered by coagulation products. ÖGIM 2011, Wien Klein Wochenschr (2011) 123/17-18;
G. Werba, M. Mildner, A. Baumgartner, L. Beer, M. Gyöngyösi, B. K. Podesser, H. J. Ankersmit, M. Lichtenauer.: Anti-thymocyte globulin (ATG) reduces damage caused by ischemia and preserves cardiac function after experimental myocardial infarction. European Surgery, Acta Chirurgica Austriaca; Volume 43, Suppl 242/11, 2011.
L. Beer, G. Werba, S. Nickl, M. Zimmerman, A. Mitterbauer, H. J. Ankersmit, M. Lichtenauer: Secretion of cytokines and chemokines by peripheral blood mononuclear cells is triggered by coagulation products. European Surgery, Acta Chirurgica Austriaca; Volume 43, Suppl 242/11, 2011.

65
Michael Lichtenauer, Lucian Beer1, Michael Mildner, Matthias Zimmermann, Bruno Karl Podesser, Wolfgang Sipos, Erwin Tschachler, Mariann Gyöngyösi, Hendrik Jan Ankersmit: Secretome of apoptotic peripheral blood cells (APOSEC) confers cytoprotection to cardiomyocytes and inhibits tissue remodelling after acute myocardial infarction. European Surgery, Acta Chirurgica Austriaca; Volume 43, Suppl 243/11, 2011 1presenting author
L. Beer, T. Szerafin, A. Mitterbauer, T. Haider, G.A. Roth, M. Dworschak, H. J. Ankersmit.: Continued lung ventilation during open heart surgery attenuates systemic heat-shock protein 70 release. European Surgery, Acta Chirurgica Austriaca. 2012, in press
L. Beer, T. Szerafin, A. Mitterbauer, T. Haider, G.A. Roth, M. Dworschak, H. J. Ankersmit.: Continued ventilation during open heart surgery reduces systemic secretion of soluble ST2. European Surgery, Acta Chirurgica Austriaca. 2012, in press
A. Mitterbauer, T. Szerafin, L. Beer, T. Haider, G.A. Roth, M. Dworschak, H. J. Ankersmit.: Can continued ventilation during open heart surgery inhibit polymorphonuclear cell activation? European Surgery, Acta Chirurgica Austriaca. 2012, in press L. Beer, G. Werba, S. Nickl, M. Zimmerman, A. Mitterbauer, H. J. Ankersmit, M. Lichtenauer: Stability of cytokines and chemokines in serum and plasma samples. European Surgery, Acta Chirurgica Austriaca. 2012, in press CONGRESSES AND MEETINGS 2010/12 2nd EACTS Meeting on Cardiac and Pulmonary Regeneration, Vienna 2011/5 Jahrestagung der Österreichischen Kardiologischen Gesellschaft;
Salzburg 2011/10 Jahrestagung der Österreichischen Gesellschaft für Innere Medizin;
Innsbruck 2011/10 Jahrestagung der Österreichischen Gesellschaft für Transplantation,
Transfusion und Genetik; Graz 2011/10 35. Seminar der Österreichischen Gesellschaft für Chirurgische
Forschung, Wagrain; Salzburg 2012/5 Jahrestagung der Österreichischen Kardiologischen Gesellschaft;
Salzburg 2012/6 53. Kongress Österreichische Gesellschaft für Chirurgie, Salzburg AWARDS AND GRANTS 2009/12 Leistungsstipendium – Medical University Vienna 2010/12 Leistungsstipendium – Medical University Vienna 2011/12 Leistungsstipendium – Medical University Vienna 2007/06 Matura (High School Graduation) with Distinction

66
TEACHING ACTIVITY 2011/12 – Present Teaching Assistant at the Department of Physiology, General Hospital
Vienna, Medical University of Vienna, Univ. Prof. Ivo Volf MEMBERSHIPS 2011/12 Austrian Society of Transplantation, Transfusion and Genetics EXCURSIONS 2011/4/28-29 Kaposvar; APOSEC study CURRENT STUDIES
Diploma thesis on triggers of chemokine release of peripher blood mononuclear cells Collagen induces Arthritis – Mice model Mechanical lung ventilation during cardiopulmonary bypass – immunological effects
METHODS Cultivation of human cell lines ELISA Flow Cytometry