does the river continuum concept apply on a tropical ... · pdf filedoes the river continuum...
TRANSCRIPT

Does the river continuum concept apply on atropical island? Longitudinal variation in a PuertoRican stream
Effie A. Greathouse and Catherine M. Pringle
Abstract: We examined whether a tropical stream in Puerto Rico matched predictions of the river continuum concept(RCC) for macroinvertebrate functional feeding groups (FFGs). Sampling sites for macroinvertebrates, basal resources,and fishes ranged from headwaters to within 2.5 km of the fourth-order estuary. In a comparison with a model temper-ate system in which RCC predictions generally held, we used catchment area as a measure of stream size to examinetruncated RCC predictions (i.e., cut off to correspond to the largest stream size sampled in Puerto Rico). Despite domi-nance of generalist freshwater shrimps, which use more than one feeding mode, RCC predictions held for scrapers,shredders, and predators. Collector–filterers showed a trend opposite to that predicted by the RCC, but patterns in basalresources suggest that this is consistent with the central RCC theme: longitudinal distributions of FFGs follow longitu-dinal patterns in basal resources. Alternatively, the filterer pattern may be explained by fish predation affecting distribu-tions of filter-feeding shrimp. Our results indicate that the RCC generally applies to running waters on tropical islands.However, additional theoretical and field studies across a broad array of stream types should examine whether the RCCneeds to be refined to reflect the potential influence of top-down trophic controls on FFG distributions.
Résumé : Nous examinons si un cours d’eau tropical à Porto Rico s’accorde aux prédictions du concept du continuumfluvial (« river continuum concept (RCC) ») en ce qui a trait aux groupes alimentaires fonctionnels (FFG) de macro-invertébrés. Les points d’échantillonnage des invertébrés, des ressources de base et des poissons s’échelonnent des eauxde tête du bassin jusqu’à 2,5 km de l’estuaire, un cours de quatrième ordre. Lors de notre comparaison avec un sys-tème modèle des régions tempérées dans lequel les prédictions du RCC se réalisent généralement bien, nous utilisonsla surface du bassin versant comme mesure de la taille du cours d’eau afin d’évaluer les prédictions du RCC tronqué(c’est-à-dire amputé de manière à correspondre à la taille maximale de rivière échantillonnée à Porto Rico). Malgré ladominance des crevettes d’eau douce généralistes, qui utilisent plus d’un mode alimentaire, les prédictions du RCCs’appliquent aux râcleurs, aux déchiqueteurs et aux prédateurs. Les collecteurs–filtreurs affichent une tendance inverse àcelle prédite par le RCC, mais la répartition des ressources de base indique que cela est compatible avec le thème cen-tral du RCC qui veut que la répartition longitudinale des FFG suive les patrons longitudinaux des ressources de base.La répartition des filtreurs pourrait aussi s’expliquer par la prédation par les poissons qui affecte les répartitions descrevettes qui se nourrissent par filtration. Nos résultats indiquent que le RCC s’applique généralement bien aux eauxcourantes des îles tropicales. Il faudra, cependant, des études théoriques et des travaux de terrain dans une gammeélargie de types de cours d’eau afin de savoir si le RCC doit être raffiné de manière à refléter l’influence potentielledes contrôles trophiques descendants sur les répartitions des FFG.
[Traduit par la Rédaction] Greathouse and Pringle 152
Introduction
Research on tropical streams and rivers has been criticalto the development of stream ecosystem theory (sensuMinshall 1988). For example, Junk et al. (1989) based muchof the flood-pulse concept on undisturbed conditions of theAmazon River. Tropical stream ecology can also contributeto clarification and refinement of the river continuum con-cept (RCC); for example, features of tropical streams and
rivers have been used to make key points in several theoreti-cal RCC papers (e.g., Minshall et al. 1985; Statzner andHigler 1985). The RCC (Vannote et al. 1980) is a widelyused model for interpreting longitudinal patterns in loticfood webs. The concept examines longitudinal changes inthe relative importance of autochthonous and allochthonousbasal resources, as well as distributions of macroinvertebratefunctional feeding groups (FFGs). For example, the RCCpredicts that in forested regions, the proportion of totalmacroinvertebrate biomass attributable to shredders decreasesdownstream because of a decline in availability of coarseparticulate organic matter.
Despite its wide use, the global applicability and utilityof the RCC is uncertain because the development of RCCpredictions was largely based on river systems drainingforested basins of high relief in North America whereriver–floodplain connections are severely disrupted by hu-
Can. J. Fish. Aquat. Sci. 63: 134–152 (2006) doi: 10.1139/F05-201 © 2005 NRC Canada
134
Received 5 February 2005. Accepted 22 July 2005. Publishedon the NRC Research Press Web site at http://cjfas.nrc.ca on7 December 2005.J18545
E.A. Greathouse1 and C.M. Pringle. Institute of Ecology,University of Georgia, Athens, GA 30602, USA.
1Corresponding author (e-mail: [email protected]).

man activities (e.g., Winterbourn et al. 1981; Minshall etal. 1985; Junk et al. 1989). Alternatively, the RCC maysimply need to be further refined and developed to reflectthe diversity of river systems in different biomes(Minshall et al. 1985, 1992; de la Rosa 1995). Very littleRCC-related or other longitudinal work has been done inthe tropics. Tropical data on longitudinal patterns andFFGs are rare (Nair et al. 1989; Dudgeon and Bretschko1996; Melo and Froehlich 2001). The data that do existare inadequate for testing the RCC because they (i) arebased on FFG abundances not biomass, (ii) are from a sin-gle habitat type such as riffles, and (iii) exclude decapodmacroinvertebrates and (or) are from highly impacted sys-tems. Whether the RCC is viewed as a narrow construct oftemperate North American research or as a broadly usefulbut not yet fully refined concept for understanding longi-tudinal biotic patterns, it is clear that more tropical sys-tems need to be examined for comparison to the RCC andits specific predictions.
Tropical island streams and rivers have several uniquecharacteristics that may affect whether they conform to RCCpredictions. First, tropical island drainages are often short,entering the ocean as low- or mid-order streams (Smith et al.2003). As in other regions dominated by small streams thatflow directly into oceans (Petersen et al. 1995; Dodds 2002),longitudinal patterns on tropical islands could differ fromRCC predictions by being truncated. Second, lotic assem-blages of macroinvertebrates on tropical islands are gener-ally dominated by diadromous freshwater shrimps, fishes,and snails (Smith et al. 2003). Because diadromous organ-isms require a migration between freshwater and salt waterto complete their life cycles, waterfalls, which are also com-mon on tropical islands, can cause dramatic longitudinalvariation in faunal abundances. Additional characteristics of-ten observed in all types of tropical river systems are poorretention of organic matter because of frequent and unpre-dictable flash floods (Covich and McDowell 1996; Smith etal. 2003) and an abundance of leaves of poor food quality(e.g., with high concentrations of secondary compounds;Stout 1989). Poor retention and quality of organic matter arethought to cause nonconformance to classic RCC predictions(Winterbourn et al. 1981).
In this study, we describe longitudinal variation in benthiccommunity structure of a tropical stream draining theLuquillo Experimental Forest / Caribbean National Forest(LEF/CNF) on the island of Puerto Rico. Our main objectivewas to examine whether longitudinal patterns in biomass ofmacroinvertebrate FFGs follow RCC predictions. We alsoexamined longitudinal patterns in presence or absence ofpredatory fishes, abundance of algivorous fishes, and stand-ing stocks of algal biomass (chlorophyll a), coarse and finebenthic organic matter, and fine benthic inorganic matter.Based on previous qualitative observations of freshwatershrimp and predatory fish distributions in relation to LEFwaterfalls (e.g., above waterfall barriers to predatory fish mi-gration, shrimps are at extremely high abundances), we hy-pothesized that collector–filterers, scrapers, and predatorswould not conform to classic RCC predictions, whethertruncated or not. We reasoned that high abundances ofshrimps above waterfalls should result in skewed patterns of
macroinvertebrate FFGs because shrimps feed by filtering,gathering, scraping, and predation.
Materials and methods
Study areaThe study was conducted at nine sites along a continuous,
13 km stream from its headwaters in an unnamed tributaryof Río de la Mina to within 2.5 km of the Río Mameyes es-tuary (Fig. 1). Río Mameyes enters the ocean as a fourth-order stream, and at mid- and high elevations, the drainagebasin contains numerous small and large waterfalls. The fiveupstream study sites occur in the LEF. The Río Mameyesdrainage within the LEF includes the largest tracts of undis-turbed primary forest left in the Caribbean (Weaver 1994).The remainder of the drainage occurring within LEF bordersis dominated by forest affected by past human activity (i.e.,secondary forest that has regrown after agricultural activityearly in the 20th century and forest affected by selective har-vest; Foster et al. 1999; Clark and Wilcock 2000). The lowerfour sites occur in surrounding lowlands dominated by sec-ondary forest, pasture and residential areas, and a predomi-nantly forested riparian zone. Río Mameyes is the only riversystem draining the LEF with no dam on its main stem;however, the lowest elevation site is located at a municipalwater intake, which was designed to minimize impact andappears to have no major physical, chemical, or biotic effecton the stream (March et al. 2003). The study region showsonly slight seasonal variation in rainfall and allochthonousinputs (Reagan and Waide 1996; Larsen 2000). Unpredict-able flash flood events, in which discharge increases up to10-fold in less than 1 h, occur throughout the year (Covichand McDowell 1996).
Study sites were categorized as being either high elevationand high gradient or low elevation and low gradient (Ta-ble 1). High-elevation – high-gradient sites occur above awaterfall or gradient break. High gradients block upstreammigration by fishes that prey on freshwater shrimps; how-ever, shrimps can climb waterfalls and maintain large abun-dances upstream (Covich 1988a). Low-elevation sites havelower gradients, and predatory fishes are present. In terms ofabundance and biomass, macroinvertebrate assemblages inPuerto Rico are dominated by snails (native Neritinidae andexotic Thiara granifera) and three families of migratoryshrimps (Xiphocarididae (Xiphocaris elongata), Atyidae(Atya lanipes, A. innocous, A. scabra, and Micratya poeyi),and Palaemonidae (Macrobrachium carcinus, M. crenulatum,M. heterochirus, M. faustinum, and M. acanthurus)) (Covichand McDowell 1996). Atyid shrimps often dominate macro-invertebrate communities of headwater streams in PuertoRico (Pringle 1996), but in mid- to low-elevation streamsbelow waterfalls, adult atyids occur only at low densities(Covich and McDowell 1996). Neritinid and thiarid snailsare similarly known to vary in abundance with elevation:they are at high densities in mid- and low-elevation sites andabsent at higher elevations (March et al. 2002; Pyron andCovich 2003).
Freshwater shrimps in Puerto Rico have been found tohave dramatic effects on algal biomass and species composi-tion, quantity and quality of benthic organic matter, quantity
© 2005 NRC Canada
Greathouse and Pringle 135

of epilithic fine sediments, leaf decomposition rates, andabundance and biomass of benthic invertebrates (e.g.,Pringle et al. 1999; Crowl et al. 2001; March et al. 2002).Sicydium plumieri, the algivorous green stream goby, is theonly fish species that occurs above waterfalls in LEF streams.In Costa Rica, algivorous gobies have been found to affectalgal biomass, quantity and quality of benthic organic mat-ter, and abundance of benthic insects (Barbee 2002). Preda-tory fishes in the Río Mameyes catchment (Agonostomusmonticola, Gobiomorus dormitor, Eleotris pisonis, Awaoustajasica, and Anguilla rostrata) feed primarily on shrimpsand other invertebrates (Nieves 1998). Except for the cata-dromous American eel (A. rostrata) and a diadromouseleotrid capable of forming landlocked populations(G. domitor), all native freshwater shrimps, neritinid snails,and fishes in Puerto Rico are thought to be amphidromous,with adult females releasing larvae that passively driftdownstream to the estuary before migrating back upstreamas juveniles (March et al. 1998; Nieves 1998; Bacheler et al.2004). Other aquatic fauna of the Río Mameyes catchmentare aquatic insects dominated by Baetidae, Leptophlebiidae,Chironomidae, Elmidae, Hydroptilidae, and Simuliidae, ben-thic invertebrates including Oligochaeta, Copepoda, andAcari, and the crab Epilobocera sinuatifrons (Covich andMcDowell 1996; Zimmerman and Covich 2003).
MethodsAt each site, we established a reach that was 10 times the
channel width and visually identified major habitats (Ta-
ble 1). Proportional availability of major habitats was deter-mined using occurrence frequency of mesohabitats (riffles,pools, and runs, based on measured lengths) combined withoccurrence frequency of substrates (based on 54 randommeasurements in each major mesohabitat type). All mea-surements and samples were taken during base flow fromJune through August 2001. Epilithic chlorophyll a was sam-pled using a suction device modified from Loeb (1981). Wecollected a pooled sample of four individual and randomlylocated Loeb samples in each of three pools and three rifflesat each site. Chlorophyll a samples were brought back to thelab on ice, filtered, frozen, and analyzed fluorometrically ac-cording to standard methods (American Public Health Asso-ciation 1985).
To measure non-shrimp benthic invertebrate densities andstanding stocks of very fine (VF, <250 µm) and medium fine(MF, 250 µm – 1 mm) benthic inorganic matter (BIM) andVF, MF, and coarse (C, >1 mm) benthic organic matter(BOM), three randomly located samples per major habitatwere collected and processed using methods modified fromLugthart and Wallace (1992) and Grubaugh et al. (1996).Macrophytes in runs, as well as sand habitats in pools, weresampled using a core of known area. Pools with bouldersand interstitial cobble and gravel were sampled using the“benthic block net” method described by Greathouse andPringle (2005); the benthic block net apparatus functionssimilarly to a core. Bedrock–boulder cascades were sampledby scrub-brushing invertebrates and benthic matter from aknown area into a hand net or into a Surber sampler withfoam rubber tied around the frame to create a seal with thesubstrate. Cobble–coarse gravel riffles were sampled with anunmodified Surber net. In cobble runs, a sample consisted ofa single cobble placed into a downstream D net, scrubbed onthe bank to remove invertebrates and benthic matter, andmeasured to determine surface area. Because hand, Surber,and D nets were 250 µm mesh, we further modified methodsof Lugthart and Wallace (1992) and Grubaugh et al. (1996)by using the Loeb sampler to collect VFBOM and VFBIMin Surber and hand-net samples, and we used the Loeb sam-pler on nearby cobbles to estimate VFBOM and VFBIM inD-net samples. An additional modification is that we did notseparate macrophytes from coarse detritus when measuringstanding stocks of CBOM; however, macrophytes only oc-curred in run and riffle samples at the lowest-elevation site(Hydrilla) and in a single riffle sample at site 3 (filamentousalgae). Invertebrate samples were preserved in the field inethanol.
Samples intended for estimating VFBOM/BIM (from Loeb,core, and benthic block net sampling) were sieved to removematerial >250 µm before filtration onto pre-ashed, pre-weighed glass fiber filters (Whatman GF/F, 0.7 µm). Non-decapod invertebrate samples were separated into MF and Cfractions using nested 1 mm and 250 µm sieves before sort-ing for macroinvertebrates. After sorting, we subsampled theMFBOM/BIM for filtration onto a pre-ashed, pre-weighedglass fiber filter. CBOM and filters of VFBOM/BIM andMFBOM/BIM were dried for 24 h at 50 °C, weighed, ashedfor 3 h at 500 °C, and reweighed to determine ash-free drymass (AFDM) for VFBOM, MFBOM, and CBOM and inor-ganic dry mass for VFBIM and MFBIM. Non-decapod in-vertebrates were identified to the lowest practicable level
© 2005 NRC Canada
136 Can. J. Fish. Aquat. Sci. Vol. 63, 2006
Fig. 1. The Río Mameyes drainage (�, study sites). The upperinset shows the location of the study drainage in Puerto Rico inrelation to the capital city, San Juan. The lower inset shows thelocation of Puerto Rico in relation to Florida, USA, and other is-lands of the Greater Antilles. Latitude and longitude coordinatesof sites are listed (also see Table 1 for site numbers).

(generally family or subfamily for insects and class or orderfor other non-decapod invertebrates; note that we considerpotential bias of FFG designation from this level of identifi-cation in the Discussion). Length–mass regressions, deter-mined from individuals preserved in ~10% formaldehyde,were used to determine snail biomass (Appendix A). Pub-lished (Benke et al. 1999) and unpublished (W. Cross, Insti-tute of Ecology, University of Georgia, Athens, GA 30602,USA, personal communication) length–mass regressionswere used to determine biomass of other non-decapod inver-tebrates. Functional feeding group designations of non-decapod invertebrates followed those of March (2000) andwere based on Buzby (1998) and Merritt and Cummins(1996).
We obtained quantitative estimates of shrimp and crabbiomass and fish abundance by electroshocking and snorkel-ing. A minimum of one pool or run habitat and one rifflehabitat per site were electroshocked using depletion or re-moval sampling methods (White et al. 1982; Fièvet et al.1996, 1999). Block and dip nets were 0.635 cm mesh. Cap-tured shrimps and crabs were identified to genus or speciesand measured to the nearest millimetre for postorbital cara-pace length (Hobbs 1991). Electroshocking was ineffectivefor capturing gobies (Sicydium and Awaous) and sleepers(Eleotridae) in pools, as has been observed by other re-searchers for Puerto Rico (E. García, US Department ofAgriculture Forest Service, Southern Region, Atlanta, GA30309, USA, and N. Hemphill, Trinity County ResourceConservation District, Weaverville, CA 96093, USA, per-sonal communication). Thus, in one pool or run per site, wesnorkeled a known area, counting all gobies and sleepers ob-
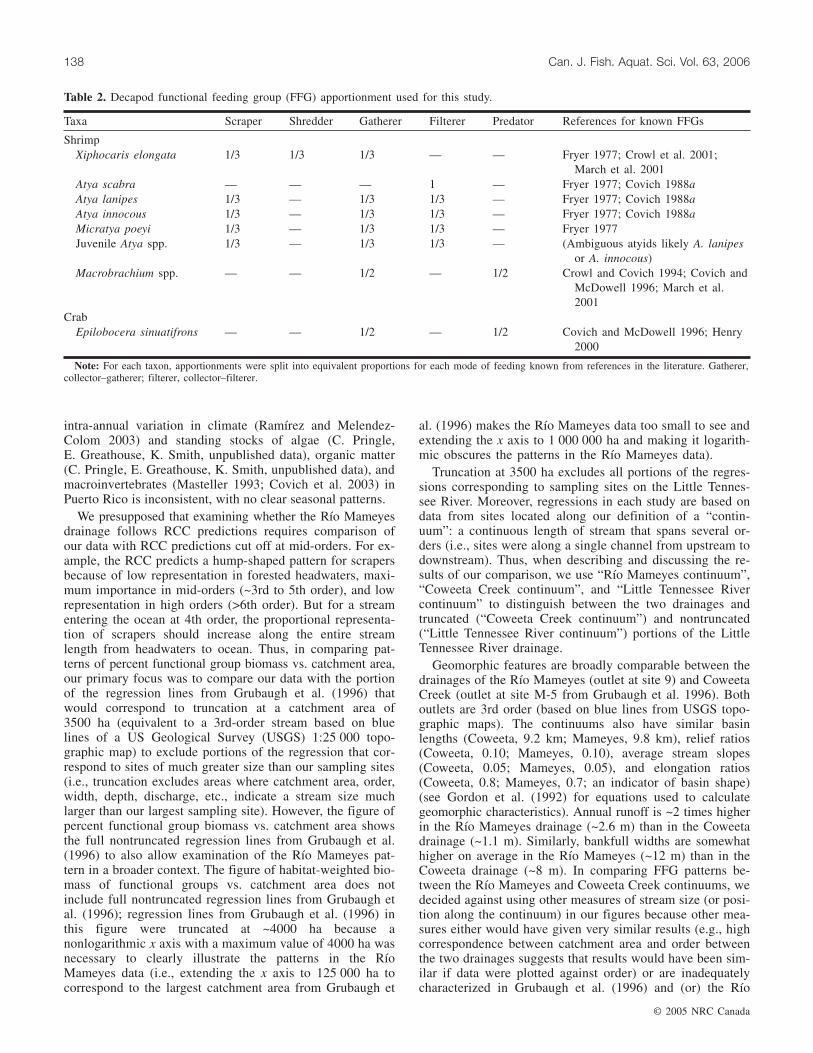
served. Visibility was similar across sites. Carapace length–mass regression equations for shrimps and crabs, determinedfrom individuals preserved in ~10% formaldehyde, were usedto determine shrimp and crab biomass (Appendix A). In de-termining biomass of macroinvertebrate functional feedinggroups, we apportioned biomass of shrimp taxa equivalentlyto each known functional feeding group membership (Ta-ble 2).
Data analysisFor both our analytical approach and our basis for com-
parison with RCC functional group predictions, we used amodel study demonstrating that the RCC generally applies tomacroinvertebrate communities along a continuous, 65 kmreach from the headwaters of Ball Creek to the Little Ten-nessee River (via Coweeta Creek) in North Carolina, USA(Grubaugh et al. 1996). The analytical approach consisted oflinear regressions of arcsine-transformed percentages ofhabitat-weighted functional group biomass against catch-ment area. We also used linear regression against catchmentarea to analyze other ecosystem and community structureparameters.
To compare results from the Little Tennessee River drain-age with results from the Río Mameyes drainage, regressionlines from Grubaugh et al. (1996) were included in plots ofhabitat-weighted biomass of functional groups vs. catchmentarea and percent functional group biomass vs. catchmentarea. Although our data are from sampling at only one timeof year, whereas regressions from Grubaugh et al. (1996) arebased on annual means from seasonal sampling, we considerours to be reasonable estimates of annual means because
© 2005 NRC Canada
Greathouse and Pringle 137
Site StreamStreamtypea
Streamorderb
Catchmentarea (ha)
Elevation(m asl)c
Slope(%)
Meanwidthd
(m)
Canopycovere
(%) Major habitats
1 Unnamed High 0 4 720 16.8 3.0 89.5 Sand pools, boulder–bedrock riffles
2 Unnamed High 1 32 660 14.8 4.5 83.2 Boulder pools, cobbleriffles
3 Río de la Mina High 2 136 590 12.7 8.3 43.3 Boulder pools, boulder–bedrock riffles
4 Río de la Mina High 2 506 250 7.8 11.0 40.3 Boulder pools, boulder–bedrock riffles
5 Río Mameyes Low 3 1574 105 4.0 21.0 15.5 Boulder pools, boulder–bedrock riffles
6 Río Mameyes Low 3 2025 65 1.6 14.5 29.7 Boulder pools, boulder–bedrock riffles
7 Río Mameyes Low 3 2225 42 1.8 16.6 33.9 Boulder pools, boulder–bedrock riffles
8 Río Mameyes Low 3 2422 16 0.8 15.0 22.2 Boulder pools, cobbleriffles
9 Río Mameyes Low 3 3455 5 0.7 13.0 22.7 Cobble runs,macrophytes,f cobbleriffles
aHigh, high elevation – high gradient; low, low elevation – low gradient.bBased on blue lines from US Geological Survey 1:20 000 topographic maps. Stream order 0 site is a headwater stream without a blue line.cUnits are metres above sea level (m asl).dBankfull measurements.eSpherical densiometer measurements.fMacrophytes were Hydrilla in runs.
Table 1. Study site physical characteristics.
intra-annual variation in climate (Ramírez and Melendez-Colom 2003) and standing stocks of algae (C. Pringle,E. Greathouse, K. Smith, unpublished data), organic matter(C. Pringle, E. Greathouse, K. Smith, unpublished data), andmacroinvertebrates (Masteller 1993; Covich et al. 2003) inPuerto Rico is inconsistent, with no clear seasonal patterns.
We presupposed that examining whether the Río Mameyesdrainage follows RCC predictions requires comparison ofour data with RCC predictions cut off at mid-orders. For ex-ample, the RCC predicts a hump-shaped pattern for scrapersbecause of low representation in forested headwaters, maxi-mum importance in mid-orders (~3rd to 5th order), and lowrepresentation in high orders (>6th order). But for a streamentering the ocean at 4th order, the proportional representa-tion of scrapers should increase along the entire streamlength from headwaters to ocean. Thus, in comparing pat-terns of percent functional group biomass vs. catchment area,our primary focus was to compare our data with the portionof the regression lines from Grubaugh et al. (1996) thatwould correspond to truncation at a catchment area of3500 ha (equivalent to a 3rd-order stream based on bluelines of a US Geological Survey (USGS) 1:25 000 topo-graphic map) to exclude portions of the regression that cor-respond to sites of much greater size than our sampling sites(i.e., truncation excludes areas where catchment area, order,width, depth, discharge, etc., indicate a stream size muchlarger than our largest sampling site). However, the figure ofpercent functional group biomass vs. catchment area showsthe full nontruncated regression lines from Grubaugh et al.(1996) to also allow examination of the Río Mameyes pat-tern in a broader context. The figure of habitat-weighted bio-mass of functional groups vs. catchment area does notinclude full nontruncated regression lines from Grubaugh etal. (1996); regression lines from Grubaugh et al. (1996) inthis figure were truncated at ~4000 ha because anonlogarithmic x axis with a maximum value of 4000 ha wasnecessary to clearly illustrate the patterns in the RíoMameyes data (i.e., extending the x axis to 125 000 ha tocorrespond to the largest catchment area from Grubaugh et
al. (1996) makes the Río Mameyes data too small to see andextending the x axis to 1 000 000 ha and making it logarith-mic obscures the patterns in the Río Mameyes data).
Truncation at 3500 ha excludes all portions of the regres-sions corresponding to sampling sites on the Little Tennes-see River. Moreover, regressions in each study are based ondata from sites located along our definition of a “contin-uum”: a continuous length of stream that spans several or-ders (i.e., sites were along a single channel from upstream todownstream). Thus, when describing and discussing the re-sults of our comparison, we use “Río Mameyes continuum”,“Coweeta Creek continuum”, and “Little Tennessee Rivercontinuum” to distinguish between the two drainages andtruncated (“Coweeta Creek continuum”) and nontruncated(“Little Tennessee River continuum”) portions of the LittleTennessee River drainage.
Geomorphic features are broadly comparable between thedrainages of the Río Mameyes (outlet at site 9) and CoweetaCreek (outlet at site M-5 from Grubaugh et al. 1996). Bothoutlets are 3rd order (based on blue lines from USGS topo-graphic maps). The continuums also have similar basinlengths (Coweeta, 9.2 km; Mameyes, 9.8 km), relief ratios(Coweeta, 0.10; Mameyes, 0.10), average stream slopes(Coweeta, 0.05; Mameyes, 0.05), and elongation ratios(Coweeta, 0.8; Mameyes, 0.7; an indicator of basin shape)(see Gordon et al. (1992) for equations used to calculategeomorphic characteristics). Annual runoff is ~2 times higherin the Río Mameyes drainage (~2.6 m) than in the Coweetadrainage (~1.1 m). Similarly, bankfull widths are somewhathigher on average in the Río Mameyes (~12 m) than in theCoweeta drainage (~8 m). In comparing FFG patterns be-tween the Río Mameyes and Coweeta Creek continuums, wedecided against using other measures of stream size (or posi-tion along the continuum) in our figures because other mea-sures either would have given very similar results (e.g., highcorrespondence between catchment area and order betweenthe two drainages suggests that results would have been sim-ilar if data were plotted against order) or are inadequatelycharacterized in Grubaugh et al. (1996) and (or) the Río
© 2005 NRC Canada
138 Can. J. Fish. Aquat. Sci. Vol. 63, 2006
Taxa Scraper Shredder Gatherer Filterer Predator References for known FFGs
ShrimpXiphocaris elongata 1/3 1/3 1/3 — — Fryer 1977; Crowl et al. 2001;
March et al. 2001Atya scabra — — — 1 — Fryer 1977; Covich 1988aAtya lanipes 1/3 — 1/3 1/3 — Fryer 1977; Covich 1988aAtya innocous 1/3 — 1/3 1/3 — Fryer 1977; Covich 1988aMicratya poeyi 1/3 — 1/3 1/3 — Fryer 1977Juvenile Atya spp. 1/3 — 1/3 1/3 — (Ambiguous atyids likely A. lanipes
or A. innocous)Macrobrachium spp. — — 1/2 — 1/2 Crowl and Covich 1994; Covich and
McDowell 1996; March et al.2001
CrabEpilobocera sinuatifrons — — 1/2 — 1/2 Covich and McDowell 1996; Henry
2000
Note: For each taxon, apportionments were split into equivalent proportions for each mode of feeding known from references in the literature. Gatherer,collector–gatherer; filterer, collector–filterer.
Table 2. Decapod functional feeding group (FFG) apportionment used for this study.

Mameyes basin. For example, there are only two gaugesalong the Río Mameyes continuum, and thus, to computemean annual runoff or discharge, we would have had tohave used a linear regression between catchment area andflow. Grubaugh et al. (1996) also had to use such a regres-sion to estimate mean annual discharge at several of theirsites. Thus, if we had plotted figures against runoff,Mameyes data points would simply have been shifted to theright relative to Grubaugh et al. (1996) regression lines.
We used linear regressions among shrimps and ecosystemand community properties (standing stocks of chlorophyll a,BOM, BIM, macroinvertebrates) to examine whether thereare negative correlations between shrimps and ecosystemand community properties that are consistent with previousshrimp exclusion experiments (e.g., Pringle et al. 1999;March et al. 2002). Because these past shrimp exclusionswere conducted in pools, we conducted separate regressionsfor pools (and runs) and for riffles. We also examined linearregressions between total non-decapod invertebrate biomassand BOM. For simplicity of data presentation, VF and MFsize fractions were generally combined into a single “fine”size fraction. For statistical analyses, we used JMP 3.2.6(SAS Institute Inc. 1999) and a significance level of 0.05.All percentages were arcsine-transformed before statisticalanalyses. For nonpercentage data, the Shapiro–Wilk test wasused to test for normality, and when appropriate, log10(x + 1)transformations were conducted.
Results
Standing stocks of chlorophyll a in periphyton decreasedalong the Río Mameyes continuum (Fig. 2a), as did the ratioof habitat-weighted FBOM to CBOM (Fig. 2d). Absolutestanding stocks of FBOM and CBOM showed no longitudi-nal trend but were highest at the extremes of the continuum(Figs. 2b and 2c). Habitat-weighted atyid shrimp biomasswas dramatically higher in high-elevation sites (Fig. 3). In
contrast, habitat-weighted biomass of gastropods was dra-matically higher at the two lowest-elevation sites, whereashabitat-weighted biomass of other macroinvertebrates wasmore even across the continuum (Fig. 3). Predatory fisheswere not present in electroshocking samples and duringsnorkeling observations at sites with catchments smallerthan approximately 1000 ha (Fig. 3; Appendix B, Table B1).Highest densities of the green stream goby occurred in mid-elevation sites, and no Sicydium were found at the highest-and lowest-elevation sites (Table 3). Macroinvertebratebiomass, standing stocks of basal resources, and proportionalrepresentation of habitats used in habitat weighting are listedby habitat unit and site (Appendix B, Tables B2–B5).
For habitat-specific analyses, macroinvertebrate functionalfeeding groups showed variable trends in dominance alongthe continuum (Fig. 4). Relative dominance of scrapers in-creased and shredders decreased along the continuum inboulder–bedrock pools, but both functional groups showed notrend in boulder–bedrock riffles. Percentages of collector–gatherers decreased with catchment area in boulder–bedrockpools but increased in boulder–bedrock riffles. Percentages
© 2005 NRC Canada
Greathouse and Pringle 139
Fig. 2. Patterns in standing stocks of basal resources along theRío Mameyes continuum: (a) epilithic chlorophyll a, data pointsare means from three pools and three riffles at each site;(b) habitat-weighted coarse (C, >1 mm) benthic organic matter(BOM); (c) habitat-weighted fine (F, <1 mm) BOM; (d) ratio ofF to C habitat-weighted BOM.
Fig. 3. Habitat-weighted biomass of atyid decapods (�), gastro-pods (�), and other macroinvertebrates (� and broken line)along the Río Mameyes continuum. Solid black bar on x axis in-dicates region containing waterfall barrier to upstream migrationof predatory fishes. AFDM, ash-free dry mass.
SiteSicydium in poolsa
(no.·m–2)Sicydium in rifflesb
(no.·m–2)
1 0.00 0.002 0.00 0.213 2.93 0.444 1.65 1.445 0.60 0.216 0.52 0.207 0.50 0.108 0.00 0.019 0.00 0.00
aSnorkeling data.bElectroshocking data.
Table 3. Habitat-specific densities of the greenstream goby, Sicydium plumieri, along the RíoMameyes continuum.

of collector–filterers in both boulder–bedrock pools andboulder–bedrock riffles decreased with catchment area.Predators showed no trend in boulder–bedrock pools and amarginally significant trend of increasing with stream size inboulder–bedrock riffles. Cobble riffle data are presented butnot analyzed for statistical trends because cobble riffles oc-curred at only three sites (Fig. 4, third column). Cobble–macrophyte runs at the lowest-elevation site were dominatedby scrapers (scrapers were 97% of total invertebrate biomassin runs). Sand pools at the highest-elevation site were domi-nated by collector–gatherers, collector–filterers, and scrapers
(33%, 29%, and 32% of total invertebrate biomass, respec-tively). Total macroinvertebrate biomass was highest incobble–macrophyte runs at the lowest-elevation site wheremean total biomass was 24.9 g AFDM·m–2. Among the threeother habitat types, total macroinvertebrate biomass wasfairly equivalent (mean total biomass: boulder–bedrockpools, 4.2 g AFDM·m–2; boulder–bedrock riffles, 3.9 gAFDM·m–2; cobble riffles, 5.8 g AFDM·m–2; sand pools athighest-elevation site, 3.3 g AFDM·m–2).
Longitudinal patterns in absolute values of habitat-weighted biomass in the Río Mameyes continuum generally
© 2005 NRC Canada
140 Can. J. Fish. Aquat. Sci. Vol. 63, 2006
Fig. 4. Relative dominance of macroinvertebrate functional feeding groups in bedrock–boulder pools, bedrock–boulder riffles, and cob-ble riffles along the Río Mameyes continuum. Data are arcsine-transformed percentages of total habitat-specific biomass at each sam-pling site. Note that gatherers denotes collector–gatherers and filterers denotes collector–filterers. AFDM, ash-free dry mass.

did not match patterns in the Coweeta Creek continuum,which usually showed little to no variation over the spatialscale of comparison (Fig. 5). Predators were the only func-tional feeding group in the Río Mameyes continuum to closelymatch the Coweeta Creek pattern. Mean habitat-weightedbiomass of predators in the Río Mameyes continuum was0.2 g AFDM·m–2 compared with ~0.3 g AFDM·m–2 in theCoweeta Creek continuum (Fig. 5). Total habitat-weightedbiomass in the Río Mameyes continuum showed a polyno-mial trend with catchment area, and the mean across all siteswas 6.0 g AFDM·m–2, a much higher value than the ~1.4 gAFDM·m–2 in the Coweeta Creek continuum. In the RíoMameyes continuum, a polynomial function fit the patternfor habitat-weighted biomass of scrapers, which reachedmuch higher values compared with the Coweeta Creek re-gression line (Fig. 5). Habitat-weighted biomass of both
collector–gatherers and collector–filterers decreased alongthe Río Mameyes continuum, from values much above theCoweeta Creek regression at high-elevation sites to valuescomparable to the Coweeta Creek continuum at low-elevation sites. For shredders, habitat-weighted biomassshowed a marginally significant trend of decreasing alongthe Río Mameyes continuum and was generally much lowerthan shredder biomass in the Coweeta Creek continuum(Fig. 5).
No regressions between percent functional group biomassand catchment area in the Río Mameyes continuum closelymatched regressions in the Coweeta Creek continuum, butthe directions of some trends did match (Fig. 6). Along boththe Río Mameyes and Coweeta Creek continuums, percentfunctional group biomass increased for scrapers and decreasedfor shredders (note that the entire Little Tennessee River
© 2005 NRC Canada
Greathouse and Pringle 141
Fig. 5. Habitat-weighted biomass of macroinvertebrate functional feeding groups along the Río Mameyes continuum (� and solid re-gression lines) and the Coweeta Creek continuum (broken regression lines, from Grubaugh et al. 1996; regression lines are truncated at~4000 ha). Total biomass of (a) macroinvertebrates, (b) scrapers, (c) collector–gatherers, (d) collector–filterers, (e) predators, and(f) shredders. AFDM, ash-free dry mass.

continuum showed a hump-shaped pattern) (Fig. 6; Table 4).Percent contribution of shredders in the Río Mameyes con-tinuum was less than 7% at all sites (Table 4) and was muchlower than the percent contribution of shredders in theCoweeta Creek continuum (Fig. 6). Relative dominance ofcollector–gatherers and collector–filterers decreased alongthe Río Mameyes continuum, whereas collector–gatherersand collector–filterers showed little to no change along theCoweeta Creek continuum and collector–filterers showed alarge increase along the entire Little Tennessee River contin-uum (Fig. 6; Table 4). Percent contribution of macro-invertebrate predators showed no trend along the Río
Mameyes continuum but decreased along the Coweeta Creekcontinuum (Fig. 6; Table 4).
In pools–runs, the only correlations between any of theshrimp genera and ecosystem properties were marginallysignificant and positive. In riffles, biomass of atyids andXiphocaris were positively correlated with chlorophyll a(atyids, F[1,7] = 23.0, P = 0.002; Xiphocaris, F[1,7] = 6.5, P =0.036). Biomass of riffle atyids was also positively corre-lated with VFBOM (F[1,7] = 28.8, P = 0.001), and biomassof Xiphocaris shrimp was positively correlated with FBOM(F[1,7] = 8.8, P = 0.021) and VFBIM (F[1,7] = 11.8, P =0.011). Total biomass of non-decapod invertebrates was pos-
© 2005 NRC Canada
142 Can. J. Fish. Aquat. Sci. Vol. 63, 2006
Fig. 6. Relative dominance of macroinvertebrate functional feeding groups along the Río Mameyes continuum (� and solid regressionlines) and the Little Tennessee River continuum (broken regression lines, from Grubaugh et al. 1996). Vertical lines indicate the catch-ment area where truncating the Little Tennessee River continuum allows comparison of the Río Mameyes continuum with the CoweetaCreek continuum. Plots are arcsine-transformed percentages of habitat-weighted biomasses at each sampling site: (a) scrapers,(b) shredders, (c) collector–gatherers, (d) collector–filterers, and (e) predators. Note that significant regression lines for Mameyes dataappear curved because of the log scale of the x axis. AFDM, ash-free dry mass.

itively correlated with CBOM in pools and runs (F1,7 = 77.6,P < 0.0001). Total biomass of non-decapod invertebrates inriffles showed no correlations with BOM, regardless of sizefraction. Chlorophyll a was negatively correlated withhabitat-weighted biomass of snails (F[1,7] = 9.91, P = 0.016).Habitat-weighted biomass of atyid shrimp was also dramati-cally higher where habitat-weighted snail biomass was zero(F[1,7] = 57.81, P < 0.0001). Sampled snail biomass was zeroat all high-elevation sites (sites with catchment areas smallerthan ~1000 ha); however, we did observe that snails werepresent during fieldwork at high-elevation site 4.
Discussion
Do macroinvertebrate FFGs match RCC predictions?Functional groups in the Río Mameyes continuum con-
form broadly to truncated RCC predictions for some FFGsbut not others. Relative contributions of shredders and scrap-ers clearly fit RCC predictions and match the Coweeta Creektrends (Grubaugh et al. 1996) by decreasing and increasing,respectively, from headwaters to mid-orders. We expectedthe shredder pattern because the dominant shredder inPuerto Rico, X. elongata, is known to have high abundancesabove waterfalls (March et al. 2001). We did not expect thescraper pattern because we did not anticipate snail biomassat low elevations overwhelming contributions from high den-sities of shrimp scrapers at high elevations.
Relative contributions of predators, gatherers, and filterersdo not match trends in the Coweeta Creek continuum. Preda-tors were the only FFG for which the Coweeta Creek contin-uum did not conform to the RCC prediction (Grubaugh et al.1996). Our findings do conform to the RCC prediction thatrelative contributions of predators do not change with streamsize (Vannote et al. 1980). However, we hypothesized thatpredators would decrease downstream (as observed in theCoweeta Creek continuum), because in both systems,there are downstream increases in densities of predatoryfishes, which have the potential to competitively excludeinvertebrate predators. For gatherers, it is difficult to makeconclusions regarding whether the decrease in relative con-tributions along the Río Mameyes continuum conforms tothe RCC or not because the exact RCC prediction is unclear.Grubaugh et al. (1996) found no change in percent gathererbiomass with stream size. The original RCC (Vannote et al.
1980) did not make a separate and clear prediction forgatherers: gatherers were grouped with filterers in a singlecollector category, and collector representation was pre-dicted to remain constant from headwaters to mid-orders. Intheir revision of the RCC, Minshall et al. (1985) characterizegatherers as decreasing slightly from headwaters to mid-orders. Filterers are the one FFG in the Río Mameyes con-tinuum that clearly does not conform to RCC predictions.We found that filterers decrease in relative dominancedownstream, but the RCC prediction is that contributions offilterers either do not change substantially (Vannote et al.1980; Grubaugh et al. 1996) or increase (Minshall et al.1985) from headwaters to mid-orders. The filterer patternmatches our hypothesis that dominance of atyid shrimps inheadwaters would cause a downstream decrease in filterers.
The direction of regression slopes for relative contribu-tions in the Río Mameyes continuum match those of theCoweeta Creek continuum and RCC predictions for severalFFGs. However, actual percent representation and standingstocks of FFG biomass are strikingly different from patternsobserved by Grubaugh et al. (1996). The Río Mameyes con-tinuum has low representation of shredders, which is thoughtto be typical of many tropical regions including Asia (Burtonand Sivaramakrishnan 1993; Yule 1996b; Dudgeon 1999), thePacific islands (Resh and de Szalay 1995), Africa (Minshallet al. 1985), and the neotropics (Wootton and Oemke 1992;Mathuriau and Chauvet 2002). Shredders appear to be largelyreplaced by scrapers, gatherers, and filterers.
Our findings do not support the hypothesis that low repre-sentation of shredders in tropical streams is an artifact ofmacroinvertebrate-focused FFG analyses that only considerinsect shredders and exclude other biota, such as crustaceansand fishes, that may be important leaf feeders in the tropics(Ramírez and Pringle 1998; Dudgeon and Wu 1999; Moss2005). We found that shredder biomass is poorly representeddespite the fact that we included all potential shredders andleaf feeders (calamoceratid caddisflies, the elmid beetlePhanocerus (Buzby 1998), and leaf-mining chironomids(E. Greathouse, personal observation); X. elongata; no streamfishes are CPOM detritivores in Puerto Rico).
Ours is the first tropical study to our knowledge that eval-uates FFG predictions of the RCC using appropriate meth-ods. Regional reviews of stream ecology have noted the lackof adequate longitudinal and functional group data for tropi-cal Asia (Dudgeon 1999), the Pacific islands (Resh and deSzalay 1995), the Caribbean and Central America (de laRosa 1995), South America (Lewis et al. 1995), and Africa(Cooper 1996). Valid evaluation of RCC predictions and useof the RCC as a comparative tool require methods of sam-pling and analysis similar to those used in the developmentof the RCC (Barmuta and Lake 1982). Tropical FFG datathat do exist are from Asia (e.g., Dudgeon 1984; Burton andSivaramakrishnan 1993), the Pacific islands (Dudgeon 1994;Yule 1996b), Africa (Cooper 1996; Tumwesigye et al. 2000),and Central America (Ramírez and Pringle 1998). However,existing data are problematic for evaluating RCC predictionsbecause, similar to most FFG studies in the temperate zone,these tropical studies have (i) been based on macro-invertebrate abundances, (ii) excluded decapods, (iii) beenconducted in systems highly modified by humans, and (or)(iv) limited sampling to a single type of habitat (e.g., riffles).
© 2005 NRC Canada
Greathouse and Pringle 143
Site Scrapers Shredders Gatherers Filterers Predators
1 29.8 2.0 34.8 27.6 5.82 32.7 6.7 33.7 25.9 1.03 26.3 2.2 31.0 36.4 4.14 30.4 1.3 31.9 35.0 1.45 53.9 0.2 25.8 0.2 19.96 71.8 0.1 14.3 0.2 13.67 67.9 0.2 16.2 <0.1 15.78 89.2 0.5 5.0 2.0 3.39 96.2 0.1 2.6 0.3 0.7
Note: Gatherers, collector–gatherers; filterers, collector–filterers.
Table 4. Percent of habitat-weighted biomass in each macro-invertebrate functional feeding group at sites along the RíoMameyes continuum.

Conclusions from functional group analyses can vary sub-stantially with the metric used (Fisher 1995). Biomass andproduction are appropriate metrics to use for evaluating theRCC and indicating ecosystem attributes (Barmuta and Lake1982; Cummins and Merritt 2001). Abundance and taxo-nomic diversity can be misleading (Grubaugh et al. 1996).Excluding shrimps and crabs from analyses, or not samplingthem with appropriate methods, is especially problematic inthe tropics because these decapods often represent importantprimary consumers and detritivores. Analyses of highly im-pacted tropical systems confound biome and human impactand are problematic because the RCC attempted to describeunperturbed longitudinal patterns.
Functional group RCC analyses also must examine aver-age or characteristic fauna at each site; this requires sam-pling of all major habitats (Minshall et al. 1985; Grubaughet al. 1996). Our data support this contention. Río Mameyestrends in relative contributions of habitat-weighted FFGsmatch habitat-specific trends for pools but not for boulder–bedrock riffles. Macroinvertebrate sampling is often limitedto riffles, but if we had limited our sampling to boulder–bedrock riffles, we would have erroneously concluded thatthe Río Mameyes continuum does not match any RCC pre-dictions for FFGs.
Why does the Río Mameyes continuum not follow theRCC prediction for filterers?
Our finding that filterers do not conform to RCC predic-tions may be due to several challenges in our application ofthe FFG approach. First, we generally identified non-decapodinvertebrates to the family or subfamily level. Several re-searchers have argued that genus- or species-level identifica-tions are necessary to assess FFGs (Plague et al. 1998; Lenatand Resh 2001). However, greater resolution of identifica-tions would be unlikely to alter our results because biomassof decapods and snails outweighed other invertebrate bio-mass by two orders of magnitude.
A second and more important challenge is the high abun-dance of shrimps, which are capable of more than one modeof feeding. Applying FFGs to these generalists is problem-atic because solid data on which to base apportionment ofFFG membership are lacking (c.f., Hawkins and MacMahon1989). We apportioned shrimp biomass equivalently amongeach feeding mode known for adults; however, our analysiscould be improved with detailed studies on shrimp FFGapportionments. Our feeding mode apportionment also as-sumes that the proportion of time spent by shrimps in eachfeeding mode does not vary between juveniles and adults orlongitudinally. However, feeding mode is known to vary withage for many macroinvertebrates (Cummins 1973; Davies etal. 1995; Ladle and Westlake 1995), and shrimp diets maychange with elevation because of longitudinal variation inpredators or food resources (Cushing and Allan 2001; Marchet al. 2001).
We found broad agreement with many RCC predictions,despite high abundances of generalist shrimps. These find-ings contrast with current thinking about generalist feeders.Facultative relationships with food categories are thought tomake generalist macroinvertebrates less reliable indicators ofecosystem conditions (e.g., autotrophy vs. heterotrophy,
CPOM vs. FPOM; Mihuc and Minshall 1995; Cummins andMerritt 2001), indicative of shifting availability of differenttypes of food resources (Dodds et al. 2004), and problematicin efforts to evaluate the RCC (Cooper 1996; Plague et al.1998; Cushing and Allan 2001). In fact, dominance by gen-eralists is a major feature of regions such as New Zealand(Winterbourn 1995) and Australia (Lake 1995), which arethe focus of classic debates about the applicability of theRCC to non-northern-temperate streams.
A third consideration in our application of FFGs is thatwe excluded fishes from our analysis. Excluding fishes inFFG- and RCC-related studies may be particularly problem-atic in the tropics where fishes are often important herbi-vores and detritivores (Lowe-McConnell 1987; Wootton andOemke 1992; Lévêque 1995). The algivorous goby,Sicydium plumieri, is abundant in the middle of the RíoMameyes continuum and including it in the scraper categorycould alter our findings. However, a preliminary analysis,based on (i) visual estimates of Sicydium lengths from snor-keling, (ii) measured Sicydium lengths from electroshocking,and (iii) a Sicydium length – wet mass regression (Nieves1998), indicates that including algivorous gobies as scraperswould not alter our overall longitudinal patterns in propor-tional representation of FFGs.
A fourth challenge in our analysis is the relative degree ofhuman disturbance of the Río Mameyes drainage. It is oneof the least human-modified drainages in the Caribbean andthus one of the closest indicators of unperturbed longitudinalpatterns possible for running waters in the Caribbean. How-ever, the drainage is affected by human activities (e.g., pastagricultural land use at low and mid-elevations and presenturban–suburban land use in the lowlands (Thomlinson et al.1996; Clark and Wilcock 2000; Grau et al. 2003), the exoticsnail, T. granifera, introduced in the 1950s (Pyron andCovich 2003), and freshwater shrimp harvest (Greathouse etal. 2005)). Thus, it may be problematic to use the RíoMameyes continuum to evaluate the RCC, which is gener-ally regarded as a theory applying to pristine rivers, but thischallenge is inherent in many RCC studies, including the useof human-modified systems of North America in the devel-opment of the RCC (Statzner and Higler 1985) and the useof human-modified systems of New Zealand in criticisms ofthe RCC (Davies et al. 1995).
Despite the aforementioned challenges, we believe our re-sults are reliable and the decrease in filterers downstream isnot due to a problem in our methods or analysis. This leadsto the question of whether the pattern of filterers represents acontradiction of the RCC. We suggest that it is not a contra-diction but instead a potential refinement of the RCC (sensuMinshall et al. 1992). The pattern appears to fit the frame-work outlined by Minshall et al. (1985) for a biome-relatedvariation on the central RCC theme of longitudinal FFGpatterns following longitudinal patterns in basal resources,which in turn reflect the physical gradient. Based on ourdata, we cannot draw conclusions about overall organic mat-ter dynamics in light of RCC predictions on ratios of fine vs.coarse allochthonous resources because we did not measureorganic matter in transport. However, we found that the ratioof fine to coarse BOM decreases downstream, which is op-posite of the RCC prediction for the ratio of fine to coarse
© 2005 NRC Canada
144 Can. J. Fish. Aquat. Sci. Vol. 63, 2006

particulate organic matter (POM) in temperate forestedstreams. This suggests that low availability of coarse detritusrelative to availability of fine POM in headwaters may ex-plain the high representation of filterers in the Río Mameyesheadwaters.
Patterns in detrital resources (and thus FFGs) of RíoMameyes may differ from those in temperate systems be-cause tropical climates likely cause different patterns in or-ganic matter inputs, retention, and decay (de la Rosa 1995).Terrestrial inputs of FPOM vs. CPOM to other tropicalstreams are thought to be skewed towards fines. CPOM in-puts may be reduced because tropical temperatures and hu-midity and retention of CPOM in rainforest canopystructures (e.g., hyphae networks, bromeliads) cause highterrestrial decay rates of leaves (Minshall et al. 1985; Covich1988b; Yule 1996b). In fact, our results are similar to thoseof Yule (1996a, 1996b) who studied proportional abundancesof FFGs in a headwater vs. a lowland site in Papua NewGuinea. Filterers decreased downstream in New Guinea, andtheir dominance in the headwaters was attributed to terres-trial decomposition causing stream inputs to be dominatedby FPOM rather than CPOM. Puerto Rico’s tropical climatemay also affect the relative availability of fine vs. coarsePOM by affecting in-stream processes (e.g., poor retentionand high in-stream abrasion of CPOM and debris dams dueto flash floods and warm temperatures; Buzby 1998;Merriam et al. 2002). Alternatively, the food quality of leafinputs may be similar to those of other tropical streams,where high concentrations of secondary compounds arethought to limit shredder biomass (Stout 1989).
The truncated continuum patterns that we observed forscrapers and shredders match findings on longitudinal pat-terns in autotrophic vs. allochthonous resources in relationto canopy cover (Ortiz-Zayas et al. 2005). This is additionalevidence that Río Mameyes FFG patterns follow patterns inbasal resources. The drainage is heterotrophic along its en-tire length (ratios of primary production to community respi-ration (P/R) < 1; Ortiz-Zayas et al. 2005). However, there isa large increase in primary production and only a small in-crease in community respiration downstream. Thus, P/R in-creases along the gradient consistent with the downstreamdecrease in canopy cover and the RCC prediction for P/Rfrom headwaters to mid-orders.
For possible explanations of the filterer pattern, effects ofpredators are an alternative to filterers tracking basal re-sources. This alternative would represent a major and per-haps long overdue refinement of the RCC, which isessentially a “bottom-up” theory (i.e., food resources controlconsumer distributions) (Dettmers et al. 2001). Attributingthe filterer pattern to patterns in fine vs. coarse basal re-sources would imply that high atyid shrimp abundances athigh elevations are a consequence of these patterns. How-ever, there is a long-standing hypothesis that waterfalls block-ing upstream migration of predatory fishes cause observedatyid distributions. If high atyid abundance upstream fromwaterfalls is due to a release from fish predation, then theRío Mameyes drainage may be a system in which longitudi-nal patterns in FFGs are also controlled by top-down factors.Other systems in which a downstream increase in fish preda-tion is thought to affect longitudinal FFG patterns are the
headwaters of the Medway River (an acid stream system insoutheast England; Townsend and Hildrew 1984) and theLittle Tennessee River – Coweeta Creek continuum (Gru-baugh et al. 1996).
Do shrimps cause longitudinal variation in benthicresources?
In situ manipulative experiments (e.g., Pringle et al. 1999;Crowl et al. 2001; March et al. 2001) have demonstrateddramatic effects of atyid and Xiphocaris shrimps on leaf de-cay rates and standing stocks of epilithic chlorophyll a, FBOM,FBIM (i.e., fine sediments), and aquatic insects. Thus, weexamined whether chlorophyll a, FBOM, FBIM, CBOM,and aquatic insects are at low levels where atyid andXiphocaris biomass is high (above the waterfall) and are in-creased below the waterfall where these shrimps are at lowabundances and biomass. We found no negative correlationsbetween any benthic resources and biomass of atyids andXiphocaris, and we did not observe clear increases in anybenthic resources below the waterfall barrier to predatoryfish. In fact, epilithic chlorophyll a showed a significantdownstream decrease. Moreover, there were positive correla-tions between biomass of invertebrates, BOM, and chloro-phyll a similar to those observed by Grubaugh et al. (1996).These correlations indicate that invertebrates are trackingfood resources.
Along a longitudinal gradient encompassing a waterfall ina neighboring drainage, March et al. (2002) found that ef-fects of shrimp exclusion on algae, organic matter, and in-sects varied. There were no effects in a low-elevation sitewith abundant grazing snails (primarily native), whereas ef-fects at mid- and high-elevation sites were significant. Adownstream decrease in chlorophyll a was also observed.The negative correlation we observed between chlorophyll aand snail biomass (~95% native snails) suggests that grazingby abundant snails at low elevations is causing the chloro-phyll a pattern. Likewise, the negative correlation betweenatyid shrimps and snails is consistent with the hypothesis ofMarch et al. (2002) that high abundances of shrimps at highelevations may be due to a release from competition withsnails. This hypothesis and hypotheses about snail grazingmaintaining low standing stocks of algae, organic matter,and insects deserves detailed experimental study in the tropics.
We further hypothesize that grazing by the high abun-dance of algivorous gobies in the middle reaches of RíoMameyes is an important factor in maintaining low standingstocks of epilithic chlorophyll a, FBOM, and FBIM. In otherPuerto Rican streams where Sicydium are not prevalent, epi-lithic FBOM and FBIM show a dramatic pattern in relationto predatory fish barriers: thick layers of fines occur onrocks in pools with predatory fishes immediately below thewaterfall, and rocks in pools above the waterfall are clean(E. Greathouse, personal observation). In contrast, rocks ap-peared clean at all of our sites both above and below thepredatory fish barrier.
SignificanceOur findings on FFGs, FBOM, and CBOM combined with
those of Ortiz-Zayas et al. (2005) on P/R indicate that theRío Mameyes drainage conforms to the central theme of the
© 2005 NRC Canada
Greathouse and Pringle 145

RCC: changes in stream size determine changes in basal re-sources and consumers. However, our results also indicatethat longitudinal patterns in FFGs in the Río Mameyes areinfluenced by top-down control, a mechanism that is notcurrently considered in RCC literature. Findings for the RíoMameyes likely have wide application because the basicgeomorphology and longitudinal distributions of diadromousfauna (fishes, decapods, and snails) in the Río Mameyes arecharacteristic of tropical insular and coastal streams through-out the world (Smith et al. 2003). As in the Río Mameyes,tropical insular and coastal streams across the Caribbean,Latin America, the Pacific islands, and Asia have high abun-dances of snails and algivorous gobies at low and mid-elevations and high shrimp abundances above waterfalls thatblock upstream migration of predatory fishes (e.g., Hunte1978; Lyons and Schneider 1990; Craig 2003).
Comparing the Río Mameyes and Coweeta Creekcontinuums provides a more detailed understanding of how amodel tropical island stream differs from a model temperatecontinuum. However, the extent to which these findings canbe generalized, and applied to refining the RCC, is unclearbecause our study represents a comparison of only two casestudies, and we focused on using catchment area as a mea-sure of stream size in our comparisons. For example, it isunknown whether the FFG equations in the Coweeta Creek –Little Tennessee River continuum are representative of othertemperate systems. It is also unclear the extent to which re-sults would have differed had we made comparisons usingother possible measures of position along the continuums,such as stream order, runoff, distance, slope, etc.
Differences among the Río Mameyes, the Little TennesseeRiver, and the RCC may be due to the Río Mameyes beingan island stream or a tropical stream or they may be due toanother reason. Comparing a single tropical island streamwith a single temperate stream limits our ability to deter-mine which factors cause observed differences. This limita-tion is not only attributable to our study design, but alsoreflects a paradox in RCC research. On the one hand, theRCC is an important concept in research on the ecology ofstreams: the original paper introducing the concept (Vannoteet al. 1980) is the most-cited paper in benthic science (Reshand Kobzina 2003). On the other hand, the extent to whichthe RCC has made a difference in our understanding ofaquatic ecology has been greatly debated since its originalpublication (e.g., Winterbourn et al. 1981; Minshall et al.1985). Many have questioned whether the concept providespredictive power for making comparisons among sites orunderstanding system responses to disturbance at differentpoints in stream networks. Proponents argue that the mostpowerful idea from the RCC is simply its provision of an or-ganizing framework and a standard set of methods and mea-surements for conducting comparative longitudinal studiesacross biomes and stream types (e.g., Barmuta and Lake1982; Minshall et al. 1985; Ortiz-Zayas et al. 2005). How-ever, this potential power is unrealized because there areactually few longitudinal studies testing RCC predictions(especially on FFG biomass) in any biome, let alone com-parative longitudinal studies using similar methods across abroad array of biomes. Comparisons across multiple exam-ples of tropical, temperate, island, and continental streams,
using multiple types of measures of position along thecontinuum (e.g., order, runoff, distance, etc.), would be nec-essary to determine the causes of the differences betweenthe Río Mameyes and the Little Tennessee River, as well asthe true potential of the RCC as an organizing concept instream ecology. Such comparisons would also benefit con-servation and management because they would allow us toincorporate insular tropical systems into our general under-standing of lotic structure and function (Smith et al. 2003).Improved conservation and management of these systems iscritical because the biological integrity of many tropical is-land streams, including Río Mameyes and its headwaters, isthreatened by growing water demands (March et al. 2003),land use change (Brasher 2003), and our minimal understand-ing of insular tropical stream ecology (Smith et al. 2003).
Acknowledgments
We thank Casey Sanders, Elizabeth Stein, Jordan Macy,Lou Adams, Gregory Benison, and the 2001 interns of theUniversity of Puerto Rico Research Experience for Under-graduates Program for providing assistance in the field;Katherine Stepp, Sharilyn Meyers, Connie Franklin, LizzyMelda, and Daryl Breese for providing assistance in the lab;William McDowell and Revealing Rainforest Events for as-sistance with accessing study sites; and Alan Covich, MaryFreeman, Mark Hunter, Judy Meyer, Bruce Wallace, thePringle lab, and two anonymous reviewers for comments onmanuscript drafts. This research was supported by grantsBSR-8811902, DEB 9411973, DEB 0080538, and DEB0218039 from the National Science Foundation to the Insti-tute for Tropical Ecosystem Studies, University of PuertoRico, and to the International Institute of Tropical Forestry,US Department of Agriculture Forest Service, as part of theLong-Term Ecological Research Program in the LuquilloExperimental Forest; the US Department of Agriculture (10–21-RR551–141 to CMP); and the National Science Founda-tion Graduate Fellowship program (fellowship to EAG). TheUniversity of Puerto Rico provided additional support.
References
American Public Health Association. 1985. Standard methods forthe examination of water and wastewater. 16th ed. AmericanPublic Health Association, Washington, D.C.
Bacheler, N.M., Neal, J.W., and Noble, R.L. 2004. Reproduction ofa landlocked diadromous fish population: bigmouth sleepersGobiomorus dormitor in a reservoir in Puerto Rico. Caribb. J.Sci. 40: 223–231.
Barbee, N.C. 2002. Grazer–algae interactions in a tropical lowlandstream (Costa Rica). Ph.D. dissertation, University of California,Santa Barbara, California.
Barmuta, L.A., and Lake, P.S. 1982. On the value of the RiverContinuum Concept. N.Z. J. Mar. Freshw. Res. 16: 227–231.
Benke, A.C., Huryn, A.D., Smock, L.A., and Wallace, J.B. 1999.Length–mass relationships for freshwater macroinvertebrates inNorth America with particular reference to the southeasternUnited States. J. N. Am. Benthol. Soc. 18: 308–343.
Brasher, A.M.D. 2003. Impacts of human disturbances on bioticcommunities in Hawaiian streams. BioScience, 53: 1052–1060.
© 2005 NRC Canada
146 Can. J. Fish. Aquat. Sci. Vol. 63, 2006

Burton, T.M., and Sivaramakrishnan, K.G. 1993. Composition ofthe insect community in the streams of the Silent Valley Na-tional Park in Southern India. Trop. Ecol. 34: 1–16.
Buzby, K. 1998. The effect of disturbance on the ecological effi-ciency of a small tropical stream. Ph.D. dissertation, State Uni-versity of New York, Syracuse, New York.
Clark, J.J., and Wilcock, P.R. 2000. Effects of land-use change onchannel morphology in northeastern Puerto Rico. Geol. Soc.Am. Bull. 112: 1763–1777.
Cooper, S.D. 1996. Rivers and streams. In East African ecosystemsand their conservation. Edited by T.R. McClanahan and T.P.Young. Oxford University Press, New York. pp. 133–170.
Covich, A.P. 1988a. Atyid shrimp in the headwaters of the LuquilloMountains, Puerto Rico: filter feeding in natural and artificialstreams. Ver. Int. Ver. Theor. Angew. Limnol. 23: 2108–2113.
Covich, A.P. 1988b. Geographical and historical comparisons ofneotropical streams: biotic diversity and detrital processing inhighly variable habitats. J. North Am. Benthol. Soc. 7: 361–386.
Covich, A.P., and McDowell, W.H. 1996. The stream community.In The food web of a tropical rain forest. Edited by D.P. Reaganand R.B. Waide. University of Chicago Press, Chicago, Illinois.pp. 433–460.
Covich, A.P., Crowl, T.A., and Scatena, F.N. 2003. Effects of ex-treme low flows on freshwater shrimps in a perennial tropicalstream. Freshw. Biol. 48: 1199–1206.
Craig, D.A. 2003. Geomorphology, development of running waterhabitats, and evolution of black flies on Polynesian islands. Bio-Science, 53: 1079–1093.
Crowl, T.A., and Covich, A.P. 1994. Responses of a fresh-watershrimp to chemical and tactile stimuli from a large decapodpredator. J. North Am. Benthol. Soc. 13: 291–298.
Crowl, T.A., McDowell, W.H., Covich, A.P., and Johnson, S.L.2001. Freshwater shrimp effects on detrital processing and nutri-ents in a tropical headwater stream. Ecology, 82: 775–783.
Cummins, K.W. 1973. Trophic relations of aquatic insects. Annu.Rev. Entomol. 18: 183–206.
Cummins, K.W., and Merritt, R.W. 2001. Application of invertebratefunctional groups to wetland ecosystem function andbiomonitoring. In Bioassessment and management of NorthAmerican freshwater wetlands. Edited by R.B. Rader, D.P. Batzer,and S.A. Wissinger. John Wiley & Sons, Inc., Chichester, UK.pp. 85–111.
Cushing, C.E., and Allan, J.D. 2001. Streams: their ecology andlife. Academic Press, San Diego, California.
Davies, B.R., O’Keeffe, J.H., and Snaddon, C.D. 1995. River andstream ecosystems in southern Africa: predictably unpredictable. InRiver and stream ecosystems. Edited by C.E. Cushing, K.W.Cummins, and G.W. Minshall. Elsevier, Amsterdam. pp. 537–599.
de la Rosa, C. 1995. Middle American streams and rivers. In Riverand stream ecosystems. Edited by C.E. Cushing, K.W. Cummins,and G.W. Minshall. Elsevier, Amsterdam. pp. 189–218.
Dettmers, J.M., Wahl, D.H., Soluk, D.A., and Gutreuter, S. 2001.Life in the fast lane: fish and foodweb structure in the mainchannel of large rivers. J. North Am. Benthol. Soc. 20: 255–265.
Dodds, W.K. 2002. Freshwater ecology: concepts and environmen-tal applications. Academic Press, San Diego, California.
Dodds, W.K., Gido, K., Whiles, M.R., Fritz, K.M., and Matthews,W.J. 2004. Life on the edge: the ecology of Great Plains prairiestreams. BioScience, 54: 205–216.
Dudgeon, D. 1984. Longitudinal and temporal changes in func-tional organization of macroinvertebrate communities in theLam-Tsuen River, Hong Kong. Hydrobiologia, 111: 207–217.
Dudgeon, D. 1994. The influence of riparian vegetation on macro-invertebrate community structure and functional organization in6 New Guinea streams. Hydrobiologia, 294: 65–85.
Dudgeon, D. 1999. Tropical Asian streams: zoobenthos, ecologyand conservation. Hong Kong University Press, Hong Kong.
Dudgeon, D., and Bretschko, G. 1996. Allochthonous inputs andland–water interactions in seasonal streams: tropical Asia andtemperate Europe. In Perspectives in tropical limnology. Editedby F. Schiemer and K.T. Boland. SPB Academic, Amsterdam,Netherlands. pp. 161–179.
Dudgeon, D., and Wu, K.K.Y. 1999. Leaf litter in a tropical stream:food or substrate for macroinvertebrates? Arch. Hydrobiol. 146:65–82.
Fièvet, E., deMorais, L.T., and deMorais, A.T. 1996. Quantitativesampling of freshwater shrimps: comparison of two electrofishingprocedures in a Caribbean stream. Arch. Hydrobiol. 138: 273–287.
Fièvet, E., Bonnet-Arnaud, P., and Mallet, J.P. 1999. Efficiency andsampling bias of electrofishing for freshwater shrimp and fish intwo Caribbean streams, Guadeloupe Island. Fish. Res. 44: 149–166.
Fisher, S.G. 1995. Stream ecosystems of the western United States.In River and stream ecosystems. Edited by C.E. Cushing, K.W.Cummins, and G.W. Minshall. Elsevier, Amsterdam. pp. 61–87.
Foster, D.R., Fluet, M., and Boose, E.R. 1999. Human or naturaldisturbance: landscape-scale dynamics of the tropical forests ofPuerto Rico. Ecol. Appl. 9: 555–572.
Fryer, F.R.S.G. 1977. Studies on the functional morphology andecology of the atyid prawns of Dominica. Philos. Trans. R. Soc.Lond. 277: 57–128.
Gordon, N.D., McMahon, T.A., and Finlayson, B.L. 1992. Streamhydrology: an introduction for ecologists. John Wiley & Sons,Chichester, UK.
Grau, H.R., Aide, T.M., Zimmerman, J.K., Thomlinson, J.R., Helmer,E., and Zou, X.M. 2003. The ecological consequences of socioeco-nomic and land-use changes in postagriculture Puerto Rico. Bio-Science, 53: 1159–1168.
Greathouse, E.A., and Pringle, C.M. 2005. A sampler for streammacroinvertebrates and organic matter occurring on boulders andbedrock in pools. Ver. Int. Ver. Theor. Angew. Limnol. 29: 975–978.
Greathouse, E.A., March, J.G., and Pringle, C.M. 2005. Recoveryof a tropical stream after a harvest-related chlorine poisoningevent. Freshw. Biol. 50: 603–615.
Grubaugh, J.W., Wallace, J.B., and Houston, E.S. 1996. Longitudi-nal changes of macroinvertebrate communities along an Appala-chian stream continuum. Can. J. Fish. Aquat. Sci. 53: 896–909.
Hawkins, C.P., and MacMahon, J.A. 1989. Guilds: the multiplemeanings of a concept. Annu. Rev. Entomol. 34: 423–451.
Henry, J.K. 2000. Spatial and temporal variation of disturbance: ef-fects on riparian and aquatic communities along two headwaterstreams in Puerto Rico. M.S. thesis, Colorado State University,Fort Collins, Colorado.
Hobbs, H.H.I. 1991. Decapoda. In Ecology and classification ofNorth American freshwater invertebrates. Edited by J.H. Thorp andA.P. Covich. Academic Press, Inc., San Diego, Calif. pp. 823–858.
Hunte, W. 1978. The distribution of freshwater shrimps (Atyidaeand Palaemonidae) in Jamaica. Zool. J. Linn. Soc. 64: 135–150.
Junk, W.J., Bayley, P.B., and Sparks, R.E. 1989. The flood pulseconcept in river–floodplain systems. In Proceedings of the Inter-national Large River Symposium. Edited by D.P. Dodge. Can.Spec. Publ. Fish. Aquat. Sci. No. 106. pp. 110–127.
Ladle, M., and Westlake, D.F. 1995. River and stream ecosystemsof Great Britain. In River and stream ecosystems. Edited by C.E.
© 2005 NRC Canada
Greathouse and Pringle 147
Cushing, K.W. Cummins, and G.W. Minshall. Elsevier, Amster-dam. pp. 343–388.
Lake, P.S. 1995. Of floods and droughts: river and stream ecosys-tems of Australia. In River and stream ecosystems. Edited byC.E. Cushing, K.W. Cummins, and G.W. Minshall. Elsevier,Amsterdam. pp. 659–694.
Larsen, M.C. 2000. Analysis of 20th century rainfall and streamflowto characterize drought and water resources in Puerto Rico. Phys.Geogr. 21: 494–521.
Lenat, D.R., and Resh, V.H. 2001. Taxonomy and stream ecology:the benefits of genus- and species-level identifications. J. NorthAm. Benthol. Soc. 20: 287–298.
Lévêque, C. 1995. River and stream ecosystems of northwesternAfrica. In River and stream ecosystems. Edited by C.E. Cushing,K.W. Cummins, and G.W. Minshall. Elsevier, Amsterdam.pp. 519–536.
Lewis, W.M., Jr., Hamilton, S.K., and Saunders, J.F., III. 1995.Rivers of northern South America. In River and stream ecosys-tems. Edited by C.E. Cushing, K.W. Cummins, and G.W.Minshall. Elsevier, Amsterdam. pp. 219–256.
Loeb, S.L. 1981. An in situ method for measuring the primary pro-ductivity and standing crop of the epilithic periphyton commu-nity in lentic systems. Limnol. Oceanogr. 26: 394–399.
Lowe-McConnell, R.H. 1987. Ecological studies in tropical fishcommunities. Cambridge University Press, Cambridge, UK.
Lugthart, G.J., and Wallace, J.B. 1992. Effects of disturbance onbenthic functional structure and production in mountain streams.J. North Am. Benthol. Soc. 11: 138–164.
Lyons, J., and Schneider, D.W. 1990. Factors influencing fish dis-tribution and community structure in a small coastal river insouthwestern Costa Rica. Hydrobiologia, 203: 1–14.
March, J.G. 2000. The role of freshwater shrimps: patterns andprocesses along a tropical island stream continuum, Puerto Rico.Ph.D. dissertation, University of Georgia, Athens, Georgia.
March, J.G., Benstead, J.P., Pringle, C.M., and Scatena, F.N. 1998.Migratory drift of larval freshwater shrimps in two tropicalstreams, Puerto Rico. Freshw. Biol. 40: 1–14.
March, J.G., Benstead, J.P., Pringle, C.M., and Ruebel, M.W. 2001.Linking shrimp assemblages with rates of detrital processingalong an elevational gradient in a tropical stream. Can. J. Fish.Aquat. Sci. 58: 470–478.
March, J.G., Pringle, C.M., Townsend, M.J., and Wilson, A.I. 2002.Effects of freshwater shrimp assemblages on benthic communitiesalong an altitudinal gradient of a tropical island stream. Freshw.Biol. 47: 377–390.
March, J.G., Benstead, J.P., Pringle, C.M., and Scatena, F.N. 2003.Damming tropical island streams: problems, solutions, and alter-natives. BioScience, 53: 1069–1078.
Masteller, E.C. 1993. Comparison of tropical and temperate emer-gence phenology of aquatic insects from Puerto Rico and Penn-sylvania. J. Kans. Entomol. Soc. 66: 192–199.
Mathuriau, C., and Chauvet, E. 2002. Breakdown of leaf litter in aneotropical stream. J. North Am. Benthol. Soc. 21: 384–396.
Melo, A.S., and Froehlich, C.G. 2001. Macroinvertebrates in neo-tropical streams: richness patterns along a catchment and assem-blage structure between 2 seasons. J. North Am. Benthol. Soc.20: 1–16.
Merriam, J.L., McDowell, W.H., Tank, J.L., Wollheim, W.M.,Crenshaw, C.L., and Johnson, S.L. 2002. Characterizing nitro-gen dynamics, retention and transport in a tropical rainforeststream using an in situ 15N addition. Freshw. Biol. 47: 143–160.
Merritt, R.W., and Cummins, K.W. 1996. An introduction to theaquatic insects of North America. Kendall/Hunt, Dubuque, Iowa.
Mihuc, T.B., and Minshall, G.W. 1995. Trophic generalists vs. trophicspecialists: implications for food-web dynamics in postfire streams.Ecology, 76: 2361–2372.
Minshall, G.W. 1988. Stream ecosystem theory: a global perspec-tive. J. North Am. Benthol. Soc. 4: 263–288.
Minshall, G.W., Cummins, K.W., Petersen, R.C., Cushing, C.E.,Burns, D.A., Sedell, J.R., and Vannote, R.L. 1985. Develop-ments in stream ecosystem theory. Can. J. Fish. Aquat. Sci. 42:1045–1055.
Minshall, G.W., Petersen, R.C., Bott, T.L., Cushing, C.E., Cummins,K.W., Vannote, R.L., and Sedell, J.R. 1992. Stream ecosystemdynamics of the Salmon River, Idaho: an 8th-order system. J.North Am. Benthol. Soc. 11: 111–137.
Moss, B. 2005. Rapid shredding of leaves by crabs in a tropical Af-rican stream. Ver. Int. Ver. Theor. Angew. Limnol. 29: 147–150.
Nair, N.B., Arunachalam, M., Nair, K.C.M., and Suryanarayanan,H. 1989. A spatial study of the Neyyar River in light of theRiver-Continuum-Concept. Trop. Ecol. 30: 101–110.
Nieves, L.O. 1998. Ecological study of the freshwater stream fishesof the upper Mameyes River (Bisley) in the Luquillo Mountainsof Puerto Rico. Ph.D. dissertation, George Mason University,Fairfax, Virginia.
Ortiz-Zayas, J.R., Lewis, W.M., Jr., Saunders, J.F., III, andMcCutchan, J.H., Jr. 2005. Metabolism of a tropical rainforeststream. J. North Am. Benthol. Soc. 24(4). In press.
Petersen, R.C., Jr., Gíslason, G.M., and Vought, L.B.-M. 1995.Rivers of the Nordic countries. In River and stream ecosystems.Edited by C.E. Cushing, K.W. Cummins, and G.W. Minshall.Elsevier, Amsterdam. pp. 295–341.
Plague, G.R., Wallace, J.B., and Grubaugh, J.W. 1998. Linkages be-tween trophic variability and distribution of Pteronarcysspp. (Plecoptera: Pteronarcyidae) along a stream continuum. Am.Midl. Nat. 139: 224–234.
Pringle, C.M. 1996. Atyid shrimps (Decapoda: Atyidae) influencethe spatial heterogeneity of algal communities over differentscales in tropical montane streams, Puerto Rico. Freshw. Biol.35: 125–140.
Pringle, C.M., Hemphill, N., McDowell, W.H., Bednarek, A., andMarch, J.G. 1999. Linking species and ecosystems: different bi-otic assemblages cause interstream differences in organic matter.Ecology, 80: 1860–1872.
Pyron, M., and Covich, A.P. 2003. Migration patterns, densities,and growth of Neritina punctulata snails in Rio Espiritu Santoand Rio Mameyes, Northeastern Puerto Rico. Caribb. J. Sci. 39:338–347.
Ramírez, A., and Melendez-Colom, E. 2003. Meteorological sum-mary for El Verde Field Station: 1975–2003. Available athttp://luq.lternet.edu/data (accessed December 2004).
Ramírez, A., and Pringle, C.M. 1998. Structure and production of abenthic insect assemblage in a neotropical stream. J. North Am.Benthol. Soc. 17: 443–463.
Reagan, D.P., and Waide, R.B. 1996. The food web of a tropicalrainforest. The University of Chicago Press, Chicago, Illinois.
Resh, V.H., and de Szalay, F.A. 1995. Streams and rivers of Oceania.In River and stream ecosystems. Edited by C.E. Cushing, K.W.Cummins, and G.W. Minshall. Elsevier, Amsterdam. pp. 717–736.
Resh, V.H., and Kobzina, N.G. 2003. A perspective on the key cita-tions in freshwater benthic science, and the studies that influ-enced them. J. North Am. Benthol. Soc. 22: 341–351.
SAS Institute Inc. 1999. JMP 3.2.6 [computer software]. SAS In-stitute Inc., Cary, North Carolina.
Smith, G.C., Covich, A.P., and Brasher, A.M.D. 2003. An ecologi-cal perspective on the biodiversity of tropical island streams.BioScience, 53: 1048–1051.
© 2005 NRC Canada
148 Can. J. Fish. Aquat. Sci. Vol. 63, 2006

Statzner, B., and Higler, B. 1985. Questions and comments on theRiver Continuum Concept. Can. J. Fish. Aquat. Sci. 42: 1038–1043.
Stout, R.J. 1989. Effects of condensed tannins on leaf processing inmid-latitude and tropical streams: a theoretical approach. Can. J.Fish. Aquat. Sci. 46: 1097–1106.
Thomlinson, J.R., Serrano, M.I., López, T.M., Aide, T.M., andZimmerman, J.K. 1996. Land-use dynamics in a post-agriculturalPuerto Rican landscape (1936–1988). Biotropica, 28: 525–536.
Townsend, C.R., and Hildrew, A.G. 1984. Longitudinal pattern indetritivore communities of acid streams: a consideration of alter-native hypotheses. Ver. Int. Ver. Theor. Angew. Limnol. 22:1953–1958.
Tumwesigye, C., Yusuf, S.K., and Makanga, B. 2000. Structureand composition of benthic macroinvertebrates of a tropical for-est stream, River Nyamweru, western Uganda. Afr. J. Ecol. 38:72–77.
Vannote, R.L., Minshall, G.W., Cummins, K.W., Sedell, J.R., andCushing, C.E. 1980. The river continuum concept. Can. J. Fish.Aquat. Sci. 37: 130–137.
Weaver, P.L. 1994. Baño de Oro Natural Area Luquillo Mountains,Puerto Rico. US Department of Agriculture Forest Service,Southern Forest Experiment Station, General Technical ReportNo. SO-111.
White, G.C., Anderson, D.R., Burnham, K.P., and Otis, D.L. 1982.Capture–recapture and removal methods for sampling closed
populations. Los Alamos National Laboratory, Los Alamos,New Mexico. Rep. No. LA-8787-NERP.
Winterbourn, M.J. 1995. Rivers and streams of New Zealand. In Riverand stream ecosystems. Edited by C.E. Cushing, K.W. Cummins,and G.W. Minshall. Elsevier, Amsterdam. pp. 695–716.
Winterbourn, M.J., Rounick, J.S., and Cowie, B. 1981. Are NewZealand stream ecosystems really different? N.Z. J. Mar. Freshw.Res. 15: 321–328.
Wootton, J.T., and Oemke, M.P. 1992. Latitudinal differences infish community trophic structure, and the role of fish herbivoryin a Costa Rican stream. Environ. Biol. Fishes, 35: 311–319.
Yule, C.M. 1996a. The ecology of an aseasonal tropical river onBougainville Island, Papua New Guinea. In Perspectives in trop-ical limnology. Edited by F. Schiemer and K.T. Boland. SPBAcademic Publishing, Amsterdam, Netherlands. pp. 239–254.
Yule, C.M. 1996b. Trophic relationships and food webs of the ben-thic invertebrate fauna of two aseasonal tropical streams onBougainville Island, Papua, New Guinea. J. Trop. Ecol. 12: 517–534.
Zimmerman, J.K.H., and Covich, A.P. 2003. Distribution of juve-nile crabs (Epilobocera sinuatifrons) in two Puerto Rican head-water streams: effects of pool morphology and past land-uselegacies. Arch. Hydrobiol. 158: 343–357.
Appendix A
Appendix B. Predatory fishes, standing stocks of macroinvertebrates and basal resources,and proportional representation of habitats in sampled sites (1–9) along the Río Mameyescontinuum.
Tables B1–B6 appear on pages 150–152.
© 2005 NRC Canada
Greathouse and Pringle 149
Taxon L a b % ash R2 N
Xiphocaris elongata Carapace length 0.0001 3.042 9.1 0.97 64Atya lanipes Carapace length 0.0004 2.579 15.1 0.95 55Non-gravid Atya scabra Carapace length 0.0004 2.479 26.2 0.68 24Gravid Atya scabra Carapace length 0.0005 2.500 23.1 0.82 23Non-gravid Atya innocous Carapace length 0.0001 2.904 27.5 0.95 21Gravid Atya innocous Carapace length 0.0001 3.179 24.2 0.93 17Juvenile Atya spp. Carapace length 0.0012 1.450 19.0 0.47 12Micratya poeyi Carapace length 0.0006 1.881 13.8 0.74 57Non-gravid Macrobrachium Carapace length 0.0004 2.636 12.7 0.96 39Gravid Macrobrachium spp. Carapace length 0.0002 3.016 13.3 0.98 18Epilobocera sinuatifrons Carapace length 0.00005 3.324 47.6 0.98 35Thiara granifera Shell length 0.00002 2.618 87.6 0.95 78Neritina spp. Shell length 0.000008 3.532 83.2 0.94 73
Note: AFDM = aLb, where L is either carapace length or shell length in mm and AFDM is ash-free dry mass in grams; %ash, percent ash content (includes shells for snails); N, number of individuals used in determining regression. Carapace lengthwas the postorbital carapace length (Hobbs 1991).
Table A1. Carapace and shell length–mass regressions determined for decapods and snails preserved in ~10%formaldehyde.

© 2005 NRC Canada
150 Can. J. Fish. Aquat. Sci. Vol. 63, 2006
Rif
fle
Poo
lR
un
1a2
34
56
78
91
23
45
67
89
Ang
uill
aro
stra
ta×
××
××
××
Ago
nost
omou
sm
onti
cola
××
××
××
××
Ele
otri
dae
××
××
××
××
×
Not
e:×
,pr
esen
tin
elec
tros
hock
ing
sam
ples
orob
serv
atio
ns.
a Site
num
ber.
Tab
leB
1.P
reda
tory
fish
es.
Rif
fle
Poo
lR
un
1a2
34
56
78
91
23
45
67
89
Aty
idae
1.0
7.6
8.8
10.1
<0.
1<
0.1
<0.
1<
0.1
0.1
2.9
1.1
2.4
0.1
<0.
1<
0.1
Xip
hoca
ris
elon
gata
0.8
0.2
0.4
<0.
1<
0.1
<0.
1<
0.1
0.3
3.0
1.9
<0.
1<
0.1
<0.
1<
0.1
<0.
1<
0.1
Mac
robr
achi
umsp
p.<
0.1
0.2
<0.
10.
30.
30.
30.
3<
0.1
0.3
0.5
2.9
<0.
1<
0.1
<0.
10.
2E
pilo
boce
rasi
nuat
ifro
ns0.
3<
0.1
<0.
1<
0.1
<0.
1<
0.1
0.4
2.7
<0.
10.
6
Not
e:A
tyid
ae,
Aty
ala
nipe
s,A
.in
noco
us,
A.
scab
ra,
Mic
raty
apo
eyi,
and
juve
nile
Aty
asp
p.A
FDM
,as
h-fr
eedr
ym
ass.
a Site
num
ber.
Tab
leB
2.D
ecap
ods
(gA
FD
M·m
–2).
Rif
fle
Poo
lC
obbl
eH
ydri
lla
1a2
34
56
78
91
23
45
67
89
9
Pha
noce
rus
spp.
Elm
idae
(C)
<1
3<
11
<1
6<
1<
11
<1
<1
<1
<1
1O
ther
Elm
idae
(C)
5<
11
<1
<1
159
159
2<
1<
11
34
1169
Ble
phar
icer
idae
(D)
65<
1C
hiro
nom
idae
(D)
62
216
18
72
1713
15<
11
414
64
2<
180
Sim
ulii
dae
(D)
31<
11
3<
11
<1
<1
<1
Bae
tida
e(E
)<
15
<1
<1
<1
<1
<1
166
137
<1
1<
1<
12
741
Lep
toph
lebi
idae
(E)
<1
15<
161
12<
13
1<
11
66
71
Cra
mbi
dae
(L)
124
<1
426
21
<1
<1
<1
<1
<1
Lib
ellu
lida
e(O
)1
4<
179
<1
4<
1<
1<
1<
1H
ydro
psyc
hida
e(T
)<
149
<1
<1
Hyd
ropt
ilid
ae(T
)52
<1
666
585
29<
120
36<
1<
12
<1
<1
<1
94P
hilo
pota
mid
ae(T
)<
113
61
<1
235
299
<1
<1
<1
<1
Ner
itin
asp
p.(s
nail
)23
8845
0056
9417
5814
7638
9096
3124
922
Thi
ara
gran
ifer
a(s
nail
)2
4211
222
818
363
173
6O
ther
s17
91
37
16<
110
64
<1
12<
11
63
3<
14
Not
e:A
FDM
,as
h-fr
eedr
ym
ass;
cobb
le,
cobb
leha
bita
tin
runs
;H
ydri
lla,
Hyd
rill
am
acro
phyt
esin
runs
;C
,C
oleo
pter
a;D
,D
ipte
ra;
E,
Eph
emer
opte
ra;
H,
Hem
ipte
ra;
L,
Lep
idop
tera
;O
,O
dona
ta;
T,
Tri
chop
tera
.a Si
tenu
mbe
r.
Tab
leB
3.N
on-d
ecap
odin
vert
ebra
tes
(mg
AF
DM
·m–2
).

© 2005 NRC Canada
Greathouse and Pringle 151
Rif
fle
Poo
lR
un
1a2
34
56
78
91
23
45
67
89
Scr
aper
s,D
0.3
2.8
2.5
3.3
<0.
1<
0.1
<0.
1<
0.1
<0.
11.
11.
41.
4<
0.1
<0.
1<
0.1
<0.
1<
0.1
<0.
1S
crap
ers,
N37
1616
16
365
413
2512
4655
<1
310
558
0919
9116
6539
0017
.7S
hred
ders
,D
0.3
<0.
10.
1<
0.1
<0.
1<
0.1
<0.
10.
11.
00.
6<
0.1
<0.
1<
0.1
<0.
1<
0.1
<0.
1S
hred
ders
,N
<1
3<
11
<1
6<
1<
11
<1
<1
<1
<1
2C
olle
ctor
–gat
here
rs,
D0.
52.
82.
53.
4<
0.1
0.2
0.2
0.3
0.2
1.1
1.6
2.9
0.3
1.4
<0.
10.
3<
0.1
0.2
Col
lect
or–g
athe
rers
,N
3914
252
530
422
.33
145
128
184
208
169
1011
0.3
Col
lect
or–f
ilte
rers
,D
0.3
2.5
3.9
3.8
<0.
1<
0.1
<0.
1<
0.1
<0.
11.
00.
40.
8<
0.1
<0.
1<
0.1
Col
lect
or–f
ilte
rers
,N
32<
162
19
21
244
299
<1
<1
9<
1<
1<
1<
1<
1<
1
Pre
dato
rs,
D0.
2<
0.1
<0.
1<
0.1
<0.
10.
20.
20.
30.
20.
21.
50.
21.
4<
0.1
0.3
<0.
10.
1P
reda
tors
,N
36
<1
<1
115
.4<
12
181
<1
15
<1
43
4<
1
Not
e:A
FDM
,as
h-fr
eedr
ym
ass;
D,
deca
pods
(gA
FDM
·m–2
);N
,no
n-de
capo
din
vert
ebra
tes
(mg
AFD
M·m
–2).
a Site
num
ber.
Tab
leB
4.F
unct
iona
lfe
edin
ggr
oup
biom
ass.
Rif
fle
Poo
lC
obbl
eH
ydri
lla
1a2
34
56
78
91
23
45
67
89
9
Chl
orop
hyll
a(m
g·m
–2)
4.3
7.9
5.4
15.3
1.5
0.9
0.9
0.7
0.2
4.4
2.2
1.5
6.2
2.0
1.8
0.6
0.7
0.2
—
VF
BO
M(g
AF
DM
·m–2
)1.
02.
82.
22.
10.
70.
81.
31.
20.
873
.27.
120
.65.
811
.313
.49.
726
.20.
768
.7
MF
BO
M(g
AF
DM
·m–2
)5.
446
.22.
60.
20.
60.
2<
0.1
1.2
5.6
249
1.3
1.1
0.5
0.2
0.9
0.5
0.4
0.2
5.4
CB
OM
(gA
FD
M·m
–2)
88.6
9.3
0.4
<0.
11.
50.
30.
118
.812
.426
.93.
25.
79.
60.
49.
56.
95.
23.
255
8
VF
BIM
(g·m
–2)
1.9
11.5
2.2
0.6
0.4
0.6
0.1
0.3
0.8
255
11.9
18.9
9.4
3.3
20.2
11.1
19.2
0.8
381
MF
BIM
(g·m
–2)
203
599
0.7
<0.
10.
50.
20.
110
.725
.267
360.
41.
00.
80.
10.
20.
20.
10.
49.
6
Not
e:V
F,ve
ryfi
ne(<
250
µm
);M
F,m
ediu
mfi
ne(<
1m
m,
>25
0µ
m);
C,
coar
se(>
1m
m);
B,
bent
hic;
OM
,or
gani
cm
atte
r;IM
,in
orga
nic
mat
ter;
AFD
M,
ash-
free
dry
mas
s.a Si
tenu
mbe
r.
Tab
leB
5.B
asal
reso
urce
s.

© 2005 NRC Canada
152 Can. J. Fish. Aquat. Sci. Vol. 63, 2006
Rif
fle
Poo
lR
un
1a2
34
56
78
91
23
45
67
89
For
deca
pod
sam
plin
g0.
590.
700.
770.
780.
610.
610.
400.
270.
240.
410.
300.
230.
220.
390.
390.
600.
730.
76Fo
rno
n-de
capo
din
vert
ebra
tesa
mpl
ing
Cob
ble
Hyd
rill
aB
ould
er–b
edro
ck0.
320.
600.
760.
520.
530.
290.
170.
150.
140.
230.
300.
430.
46S
and
0.27
Cob
ble
0.53
0.21
0.19
0.13
Hyd
rill
am
acro
phyt
es0.
61
Not
e:C
obbl
e,co
bble
habi
tat
inru
ns;
Hyd
rill
a,H
ydri
lla
mac
roph
ytes
inru
ns.
a Site
num
ber.
Tab
leB
6.P
ropo
rtio
nal
repr
esen
tati
onof
habi
tats
.