does job support make workers happy?
TRANSCRIPT
TYÖPAPEREITA | WORKING PAPERS 310
Does Job Support Make Workers Happy?1
Petri Böckerman*Alex Bryson**
Antti Kauhanen***Mari Kangasniemi****

Palkansaajien tutkimuslaitos
Labour Institute for Economic Research
Pitkänsillanranta 3 A
00530 Helsinki
www.labour.fi
Työpapereita | Working Papers 310
ISBN 978-952-209-157-4 (pdf)
ISSN 1795-1801 (pdf)
Helsinki 2017
*Corresponding author. Turku School of Economics, Labour Institute for Economic Research (Helsinki) and IZA (Bonn).
Adress: Labour Institute for Ecoomic Research, Pitkänsillanranta 3 A, 00530 Helsinki, Finland. Phone: +358-9-2535-7330,
e-mail: [email protected].
** UCL (London), NIESR (London) and IZA (Bonn).
*** The Research Institute of the Finnish Economy (Helsinki).
**** Labour Institute for Economic Research.
1This paper is a part of the project (4112/31/2014) financed by TEKES (National Technology Agency of Finland).

1
TIIVISTELMÄ
Tutkimuksessa tarkastellaan työn vaatimusten, työntekijän vaikutusmahdollisuuksien ja
esimiehiltä saatavan tuen vaikutuksia erikseen ja yhdessä työssä koettuun hyvinvointiin.
Ns. Karasekin mallissa työn vaatimukset vähentävät työssä koettua hyvinvointia, mutta
vaikutusmahdollisuudet työssä vähentävät näitä negatiivisia vaikutuksia. Tämän yhteyden
lisäksi tutkimuksessa pyritään selvittämään sitä, onko esimieheltä, työtovereilta ja
sidosryhmiltä saadulla tuella merkittävä vaikutus työhyvinvointiin ja vaimentaako se
mahdollisesti muiden tekijöiden negatiivista vaikutusta.
Tutkimuksessa käytetään TEKES:in vuonna 2012 keräämää MEADOW-aineistoa, joka
sisältää suuren määrän työpaikan käytäntöihin ja työntekijän subjektiivisiin kokemuksiin
liittyviä muuttujia. Aineisto on yhdistetty Tilastokeskuksen FLEED-paneeliaineistoon
työllisyydestä, työttömyydestä ja työtuloista. Havaitsemattomien tekijöiden, ennen kaikkea
työntekijän kyvykkyyden, vaikutusta pyritään kontrolloimaan selittämällä hyvinvointia
tästä aineistosta muodostetuilla työmarkkinahistorian kuvaajilla kuten menneisyydessä
koetulla työttömyydellä ja työllisyydellä. Tällöin voidaan erottaa paremmin työn piirteiden
aito vaikutus työhyvinvointiin.
Tavanomaisesta poiketen työhyvinvointia mitataan tutkimuksessa useilla erilaisilla
mittareilla yleisen työtyytyväisyyden lisäksi. Nämä mittarit sisältävät mm. onnistumisen
elämykset, työn ilon, luottamuksen ja yhteistyön, osaamisen, johtamisen, huolenpidon
työntekijöistä, innovatiivisuuden ja oikeudenmukaisuuden.
Tulokset osoittavat, että vaikutusmahdollisuudet ja esimiehen tuki ovat merkittäviä
työhyvinvoinnin selittäjiä. Myös työtovereiden tuki on yhteydessä hyvinvointiin, joskin
vähemmässä määrin kuin esimiehen tuki, kun taas muiden sidosryhmien tuki ei
merkittävästi selitä hyvinvointimittareita, joskin sen sisällyttäminen malliin vahvistaa
vaikutusmahdollisuuksien merkitystä. Sen sijaan tulokset eivät suoranaisesti tue Karasekin
mallia: työn vaatimukset eivät ole merkittäviä selittäjiä, eikä työntekijän
vaikutusmahdollisuuksilla ole suurta vaikutusta havaittuun suhteeseen vaatimusten ja
hyvinvoinnin välillä. Menneisyydessä koettu työttömyys vähentää työhyvinvointia,
erityisesti luottamusta ja innostusta silloinkin, kun havaittuja työn ominaisuuksia
vakioidaan.

2
ABSTRACT
Using linked employer-employee data for Finland we examine associations between job
design and ten measures of worker wellbeing. In accordance with Karasek’s (1979) model
we find positive correlations between many aspects of worker wellbeing and job control.
However, contrary to the model, job demands have no adverse effects on worker wellbeing.
We find a strong positive correlation between job support and all aspects of worker
wellbeing that is independent of job controls and job demands, a finding that has not been
emphasized in the literature. The effects are most pronounced in relation to supervisor
support. We also find evidence of unemployment scarring effects: substantial experience of
unemployment has long-term consequences for the wellbeing workers experience in their
current jobs, even controlling for the quality of those jobs.
Key Words: worker wellbeing; job control; job demands; job support; job design; supervisors; job satisfaction; stress; HRM; unemployment; scarring effects.
JEL Classification: J28; J8; L23; M54.

3
1. INTRODUCTION
In the standard labour supply model there is a marginal disutility to additional work
because performing it eats into leisure time. Consequently, people are paid to work and will
respond to financial incentives with greater effort at the extensive and intensive margins.
Recent research on momentary wellbeing is consistent with this proposition: working is
second only to being sick in bed when individuals are randomly dinged on their smart-
phone and asked how happy they are during an activity (Bryson and MacKerron, 2016). At
the same time, paid work contributes to higher reported life satisfaction, even after
controlling for income, and individuals report being more fulfilled when their lives include
paid employment (Blanchflower and Oswald, 2011). Their life satisfaction is particularly
adversely affected by bouts of unemployment. Indeed, unemployment is one of the few
episodes in life that people struggle to recover from in happiness terms (Clark et al., 2008).
These findings on the adverse and positive associations between wellbeing and paid
employment are not necessarily contradictory. Rather they reflect the influence of paid
work on different aspects of wellbeing: when individuals reflect back on their lives paid
work contributes to satisfaction with that life but, at the margin, individuals would often
rather be doing something else.
When examining the relationship between wellbeing and paid work one should be mindful
not only of the different dimensions of wellbeing, but also that not all jobs are the same.
This literature began as far back as Adam Smith’s discussion of compensating wage
differentials in The Wealth of Nations (1776) in which he argued that workers were more
likely to undertake jobs with poor working conditions where they commanded a higher
wage to compensate them for those conditions. More recently a literature in psychology has

4
revisited the issue of non-pecuniary job attributes and their influence on worker wellbeing.
The seminal work in this field has been undertaken by Karasek (1979) and Karasek and
Theorell (1990). The original model focuses on two aspects of job design: the demands the
job makes on the individual and the degree of control the employee has over aspects of
their job (what Karasek termed “job decision latitude”). Under the model job demands
create job stress, thus having a negative impact on worker wellbeing, while job control has
a positive direct influence on wellbeing, as well as being able to mitigate the adverse effects
of job demands. It is the combination of low job control and high job demands that is
associated with mental strain and job dissatisfaction. As we shall see in Section Two, many
empirical studies confirm these propositions. Subsequent empirical studies have
incorporated forms of job support (supervisory, co-worker and non-work) and find these
can mitigate the effects of job demands on job stress.
We contribute to this literature in two ways using nationally representative survey data for
Finland. First, we seek to identify the association between job design and worker wellbeing
having taking account of worker selection into jobs that differ along the dimensions of job
control, job demands and job support. We do so by conditioning on workers’ labour market
histories prior to entering their current job. Therefore, we consider the sensitivity of the link
between job attributes and wellbeing to the inclusion of work histories. Second, we
examine links between job attributes and ten wellbeing outcomes, thus providing a much
more comprehensive assessment of the links between job demands, control and support and
wellbeing, as seems merited by the subjective wellbeing literature which emphasizes the
important differences between aspects of wellbeing and differences in their correlates.
The Finnish setting has broader interest for several reasons. First, Finland is known for its
high take-up of high involvement management practices which are characterized by high

5
levels of job control and job demands (Böckerman et al., 2012). Second, in contrast to
much of the literature which is conducted in Anglo-American countries with low
unionization rates, Finland has high unionization. Prior research suggests that the outcomes
for workers can be different in countries with high unionization (Godard, 2004). This may
be the case with regard to job design, for instance, where union membership rates of around
70 percent in Finland imply a substantial worker say in how jobs are designed. Third,
despite a potential role for worker voice in the design and implementation of job design,
Finland has the highest sickness absence rate in the European Union (Gimeno et al., 2004),
raising questions about the link between job design and worker wellbeing.
In accordance with Karasek’s (1979) model we find positive correlations between many
aspects of worker wellbeing and job control. However, contrary to the model, job demands
have no adverse effects on worker wellbeing. We find a strong positive correlation between
job support and all aspects of worker wellbeing that is independent of job controls and job
demands, a finding that has not been emphasized in the literature. The effects are most
pronounced in relation to supervisor support. We also find evidence of unemployment
scarring effects: substantial experience of unemployment has long-term consequences for
the wellbeing workers experience in their current jobs, even controlling for the quality of
those jobs.
2. LITERATURE
Karasek’s (1979) model of worker wellbeing as a function of job design has been labeled
“perhaps the most popular theory of the predictors of job wellbeing” (Wood, 2008: 156). It
maintains that, when entered separately into a worker wellbeing equation in an additive
fashion job demands adversely affect employee wellbeing, whereas job control is positively
associated with wellbeing. Furthermore, in a multiplicative model in which job control and

6
job demand are interacted with one another job control will mitigate the adverse effects of
job demands. A large empirical literature has emerged testing these propositions. Reviews
of the early empirical literature indicated substantial support for the additive model and
some, though less compelling evidence, for the multiplicative model (de Lange et al., 2003;
van der Doef and Maes, 1999).
More recently regression analyses of British linked employer-employee data indicated that
“the characteristics of the job are considerably more important in influencing wellbeing
than employee or workplace characteristics” (van Wanrooy et al., 2013: 130) and provided
strong support for Karasek’s additive model using three different measures of worker
wellbeing, namely job-related contentment, job-related enthusiasm and overall job
satisfaction (op. cit.: 129-134). The findings were broadly replicated in a subsequent
comparative analysis of job satisfaction for Britain and France using linked employer-
employee data (Bryson et al., 2016: 204-205).
Payne (1979) added support to the demand and control model arguing that various types of
support at the workplace, particularly social support from supervisors and colleagues, could
assist employees in dealing with high demands, thus lowering work strain and stress.
Karasek and Theorell (1990: 68-76) subsequently incorporated support into Karasek’s
original model. Wood (2008: 156) identifies three channels by which social support may
buffer the adverse effects of job demands: role clarity, helping people “manage” their
feelings better and, following Warr (2011), motivational support intended to reassure
workers that their extra efforts will eventually reap rewards.
Early empirical studies found some evidence to suggest that low social support among
those facing high job demands and low job control accentuated job strain (Landsberger et
al., 1992; Payne and Fletcher, 1983) and cardiac risk (Johnson and Hall, 1988). More recent

7
evidence only finds partial support for the buffering role of social support. Sargant and
Terry’s (2000) study of university clerical workers found clear evidence that, when
combined with high job control, high levels of supervisory support mitigated the adverse
effects of job demands on both job satisfaction and feelings of depersonalization, while co-
worker support and non-work support did not. Using nationally representative linked
employer-employee data for Britain Wood (2008) finds supportive management does not
buffer the effects of job demands in raising job-related anxiety.
Analysts’ desire to test the Karasek model has meant they have focused on the main effects
of job demands, job controls and the interaction between the two, as well as the buffering
role of social support. In doing so they have downplayed the independent effects of social
support in isolation, and the other multiplicative effects when combining support, demands
and control. This is somewhat surprising given the importance of social interactions to
human beings in a range of contexts. Kahneman et al.’s (2004) Day Reconstruction Method
study indicated that individuals prefer being with almost anybody compared to being on
their own. Bryson and MacKerron (2016) find “Talking, Chatting and Socialising” ranks
seventh out of forty activities in terms of its association with momentary happiness, and
that it is only when one is doing this that the underlying negative effect of working on
momentary happiness is wiped out (op. cit.: 16). It is possible that part of this “social”
effect at work is because being with others is a distraction from work activity, or is simply
pleasurable in its own right.
However, a number of the studies discussed above also find supportive management has a
direct effect on worker wellbeing. For instance, Wood (2008) finds that supportive
management, consultative management and informative management are all positively and
significantly associated with lower job-related anxiety and higher job satisfaction.

8
Similarly, van Wanrooy et al. (2013: 132-134) find that the main effect of their supportive
management scale is positive and statistically significant in models estimating job-related
contentment, job-related enthusiasm and overall job satisfaction. Bryson et al. (2016: 204-
205) also find this is the case for job satisfaction in their comparative analysis of British
and French employees in the private sector.
One complication is that there is an exception to Kahneman et al.’s (2004) general finding
that people are happier when they are with others. The exception is when they are with their
boss. It seems likely that the effects of supervisory “support” depend on the quality of the
relationship between a worker and his or her supervisor. Recent evidence from Denmark
finds that having an unsupportive boss leads to a large increase in the probability of
voluntary quits (Cottini et al., 2011). This might also explain why Sergant and Terry (2000)
find supervisory support has no direct independent association with job satisfaction
whereas the main effect of co-worker support on job satisfaction is positive and statistically
significant. Using both British and U.S. data Artz et al. (2016) focus on boss competence
and show that it is a very important determinant of employee job satisfaction.
There are two potentially important drawbacks to the literature examining links between
worker wellbeing and job design. The first is that the partial correlations presented in
regression analyses pay little attention to non-random sorting into jobs by workers. This is a
potentially important oversight since there is a substantial literature about workers and
firms seeking good worker-job matches (Jovanovich, 1979). Where workers are
heterogeneous in their tastes for hard work (job demands), and their desire for autonomy
(job control), or where heterogeneous risk preferences mean employees place various
amounts of weight on the support they will receive from their supervisor to perform a task,
workers will sort into different types of job according to the utility they think they will
9
derive from the job.1 At the same time, employers may signal their desire for certain types
of worker conditional on the jobs they have available, as in the case of Lazear’s (2000)
model in which firms seek more productive workers through the use of incentive schemes.
It seems very likely that worker sorting across firms arising from worker and employer
choices, will result in non-random exposure to job demands, job controls and job support,
imparting a bias to estimates of the links between job design and worker wellbeing if one
cannot account for that sorting. A priori it is unclear which way any bias may go. It
depends, in part, on how efficient the labour market is in allocating workers to the jobs they
would ideally like to perform. If certain types of jobs are rationed (in the sense that demand
for them exceeds their supply), effects of job demands, for example, may prove more
negative for worker wellbeing than in a scenario in which all workers sort into the types of
jobs that best suit their preferences.
We address sorting by conditioning on workers’ labour market and earnings histories in the
previous ten years, as detailed in Section Three. There are two reasons to condition on work
and earnings histories. The first is that employers seek out high ability workers to work in
demanding jobs – that is, those with high demands and high job autonomy. This explains
why the wage premium attached to “high involvement” jobs falls conditioning on
employees’ work histories (Böckerman et al., 2013). If there is a correlation between ability
and wellbeing that is not accounted for in our model, this may bias our estimates of the
links between job design and worker wellbeing.2 Conditioning on work histories therefore
1 This is a finding that crops up in a number of settings. For example, Plug et al. (2014) show that gays and lesbians behave in response to their perceptions regarding the incidence of prejudice by sorting themselves into occupations with more tolerant employers and co-workers – the sort of behaviour one might anticipate where workers are concerned about the amount of job support they might receive from supervisors and colleagues. 2 Such a correlation is plausible. There is a literature indicating that the job satisfaction of workers is negatively correlated with observable indicators of ability such as education and earnings (Clark and Oswald, 1996). If observable and unobservable indicators of ability are positively correlated this would suggest the incorporation of work histories may mitigate the bias.

10
helps identify potential misallocation of workers to jobs, giving us greater confidence that
the model accurately identifies the link between worker wellbeing and job design for “like”
employees. The second reason is that, as the programme evaluation literature makes clear,
matching on work histories helps soak up otherwise omitted variables that can bias
estimates of the effect of treatments on labour market outcomes (Barnow and Smith, 2015).
Thus, notwithstanding concerns about non-random worker-job sorting, it is likely that
conditioning on work histories will partial out otherwise unobserved worker heterogeneity
which could potentially bias our estimates.
The association between prior unemployment and subsequent worker wellbeing is of
particular interest. Previous studies confirm that past unemployment has a scarring effect
on individuals’ psychological wellbeing, even when conditioning on current employment
status (Clark et al., 2001). This could reflect the inhibiting effect of a poor work history in
obtaining a higher quality of job in the future. However, no studies condition on current job
quality when examining the links between past unemployment and current worker
wellbeing.
A second potential limitation to the existing literature is that studies examine the links
between job design and a wide array of wellbeing measures, but no one study carefully
examines the job design association with a number of wellbeing measures at the same time.
Most studies have focused on various measures of job satisfaction, sometimes in
conjunction with one or two other measures such as job-related anxiety and job-related
enthusiasm. Few examine more than three measures of wellbeing in the same paper.
Consequently, it is difficult to know whether the different associations between job design
and worker wellbeing reflect cross-study differences in methodology, the population of
interest, sampling design and data items, or whether the differences reflect genuinely

11
different associations between worker wellbeing and particular facets of job design. This
would not be a concern if wellbeing measures were really slightly different takes on the
same underlying construct but this is not the case. In fact, worker wellbeing is multi-
dimensional, with different measures capturing quite different aspects of affect (Bryson et
al., 2014). Furthermore, even when measures of worker wellbeing are quite highly
correlated, their correlations with job facets can differ quite markedly. For instance, in their
analyses of British linked employer-employee data, Bryson et al. (2012) show that worker
wages are positively correlated with job satisfaction, but negatively correlated with job-
related contentment, even though contentment and satisfaction are highly positively
correlated. For this reason, there is value in examining the links between job design and
various facets of worker wellbeing in the same paper, using identical measures of job
design, control variables and estimation techniques so that we can clearly establish the
nature of the job design effect across an array of wellbeing outcomes. As we show in the
next section, we run analyses for ten worker wellbeing measures.
3. DATA AND ESTIMATION
The analyses are based on the Finnish part of the European Meadow project Measuring the
Dynamics of Organisations and Work conducted by Statistics Finland (Meadow
Consortium, 2010; Alasoini et al., 2014). The aim was to gather comprehensive information
on the changes in work organisation and perceived working conditions. The survey covers
both Finnish private and public sector organisations excluding employers that had fewer
than 10 employees in 2010.
Although employer representatives and employees were interviewed our analysis is based
on the employees’ survey which contains information on multiple facets of employee

12
wellbeing.3 Respondents are confined to those who have worked at least one and half year
in their current employer before interview. The response rate to the employees’ survey was
approximately 50 per cent.
The dependent variables in the regression models describe different aspects of employee
wellbeing. We use both global measures of employee wellbeing and measures that capture
how workers feel about specific aspects of their jobs. The global satisfaction question is:
“All in all, how satisfied are you with this job?”, with responses measured on a four-point
Likert scale from “Very dissatisfied” (coded 1) to “Very satisfied” (coded 4). A second
global question asks: “In your current job, do you feel enthusiasm and joy from working?”
with responses coded “a lot”, “a fair amount”, “some”, “little” and “not at all”.
The Meadow survey contains a number of specific questions about employee wellbeing in
which respondents were asked to assess perceived working conditions at their workplace.4
The answers were given on a scale from 4 to 10 (higher values meaning better wellbeing).
We analyse the measures on the experience of achievement, joy of working, trust and co-
operation, expertise, management and supervisory work, taking care of employees’
interests, adoption of employees’ ideas and initiatives, boldness to propose fresh ideas that
improve work, and fostering fairness. We have rescaled all these variables so that they
range from 0 to 6.
To evaluate the empirical validity of the Karasek model we consider the association
between wellbeing and job control, job demands and organisational support. Job control is
measured in terms of employees’ influence over four aspects of their job, namely the tasks
3 Sampling was such that, in the vast majority of cases, there is only one respondent per employer. 4 The precise question is: “Please give a school grade (4-10) to your workplace on the following issues: Enthusiasm; Achievement; Joy of working; Trust and cooperation; Expertise; Management and supervisory work; Employee wellbeing; Employee care; Adoption of employees’ ideas and initiatives; Daring to develop operations; Fostering fairness”.

13
they perform, the pace of work, the order in which they carry out tasks, and the distribution
of tasks among workers. The answers to these questions are available on a four-point Likert
scale (“not at all” (coded 4), “some” (coded 3), “a fair amount” (coded 2) and “a lot”
(coded 1)). We reversed the original values so that higher values mean better control and
formed a standardized scale.5 The scale has satisfactory Cronbach’s alpha of 0.68.
Job demands are evaluated based on five separate questions. The first one asks “How often
does your job involve working to tight deadlines or at very high speed?”, measured as a
fraction of total working time with four pre-coded responses: less than 25%, 25-50%, 51-
74% and 75% or more. The second measure asks “How often do you carry out tasks related
to your main job at home?”, with alternatives “never”, “occasionally”, “frequently” and “I
only work at home”. The third measure asks “How often you carry out tasks related to your
main job outside your actual hours of work?”, with alternative responses “every day”, “at
least once a week”, “at least once a month” and “less often than once a month/never. The
fourth measure asks “How often are you contacted by phone or in person on work-related
matters outside your usual working hours” with alternatives “every day”, “at least once a
week”, “at least once a month” and “less often than once a month/never”. The fifth measure
is based on responses to the question “Over the past 12 months how many hours per month
have you worked overtime or done extra work during an average month?”. Responses are
given in terms of numbers of hours. We have capped the number of overtime hours at 40 to
reduce the impact of some very large values that are not consistent with the Finnish labour
law. This affects 31 observations. Using these five items on job demands we create a
standardized scale. The items are quite highly correlated. The scale has Cronbach’s alpha of
0.73.
5 See the Appendix for further details on how the standardised scales are created.
14
Organisational support is identified with a single question which asks: “In case of work
overload or a difficult situation, do you receive assistance from...Your supervisor or
manager; Your co-workers; Your clients or cooperation partners?” Pre-coded responses are
“always”, “sometimes” and “never”. We form three different measures for job support.
Supervisor support obtains the value of 1 if a worker obtains support from his/her
supervisor or manager (otherwise 0). The variables for co-worker support and client or
cooperation partner support are formed similarly.
The estimated models include the full set of interactions for job control, job demands and
organisational support. We run a series of Ordinary Least Squares (OLS) regression models
for each of the ten employee wellbeing measures described above in which we control for
the standard determinants of employee wellbeing based on the empirical literature. We
control for the income level using the residuals from a first-stage individual-level wage
equation in which annual earnings are estimated based on age, gender and work experience.
The controls also include age, gender, educational level (6 groups), occupation (10 groups),
tenure (i.e. work experience at the current employer) and industry (15 groups). We also
control for training during the past year. The aspects that are included cover employer-
provided training, supplementary training in the context of job tasks, and employee’s
independent training on work-related skills. To extrapolate the results to the population, we
use survey weights that are calibrated and provided by Statistics Finland in all estimations.
To account for the fact that there are a small number of workers who are employed in the
same firms, the standard errors are clustered at the firm level.
The Meadow survey data are a cross-sectional and include only very limited self-reported
information on labour market experience. To account for employee sorting into different

15
types of jobs we link the Meadow data to longitudinal register data from Statistics Finland.6
The register data are the Finnish Longitudinal Employer–Employee Data (FLEED). The
FLEED is constructed from a number of registers on individuals and firms that are
maintained by Statistics Finland. We link the Meadow data and the FLEED by using
unique personal identifiers (i.e. identification codes for individuals).
Using FLEED we have followed the employees that were included in the Meadow survey
in 2012 over the period 2001–2011. The work history variables are the average earnings,
the number of unemployment months and earnings growth during the past ten years. The
past earnings data are introduced as the log of annual earnings. Earnings include the base
wage, overtime pay, bonuses, and wage supplements.
4. RESULTS
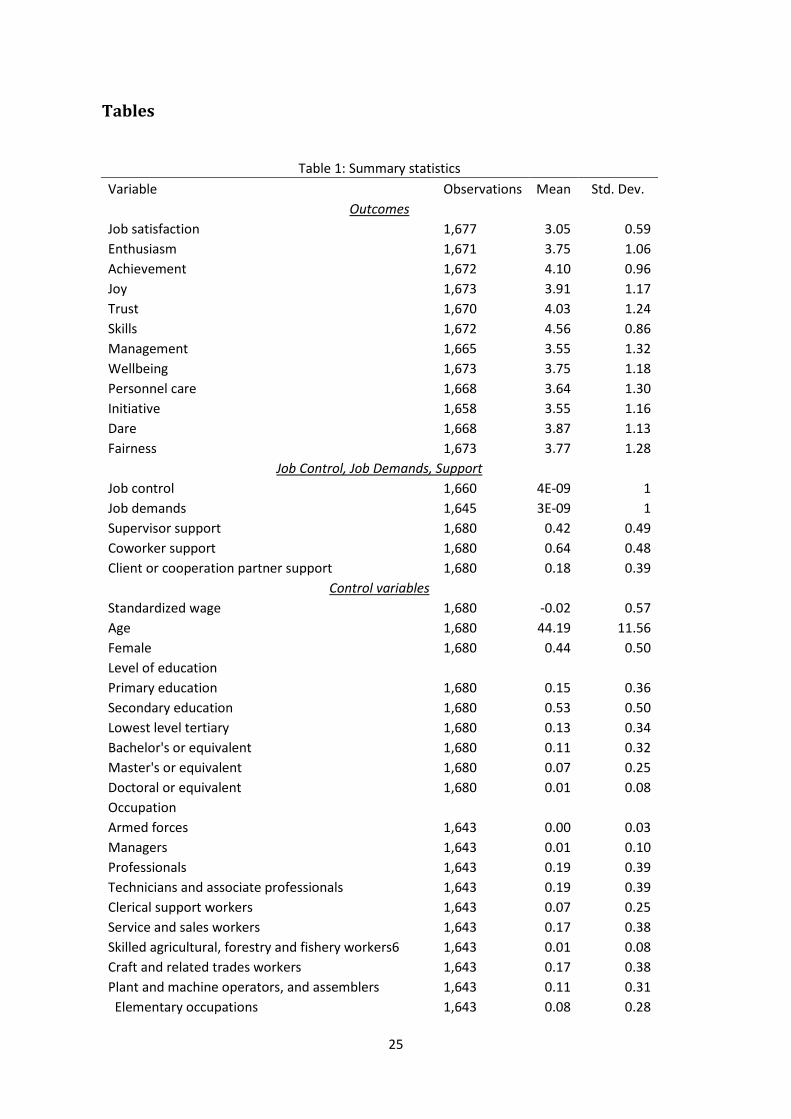
Table 1 reports means and standard deviations for key data items in the analysis for the
estimation sample. The ten outcome variables are all coded on a scale of zero to six. Job
demands, job control and job support are composed of the items discussed in Section Three.
For the purpose of analysis they are converted to standardized scores with a mean of zero
and standard deviation of 1.7 The table also shows means and standard deviations for
control variables taken from the survey and the three work history variables derived from
the administrative data.
[INSERT TABLE 1]
The raw correlations between these eight different job designs and worker wellbeing are
presented in Table 2 for all ten wellbeing measures. Supervisor support is positively and
significantly associated with all ten wellbeing measures. Job control is positively and
6 For an earlier application of the same idea in the Finnish context, see Böckerman et al. (2013). 7 Appendix Table A3 shows the incidence of jobs with all combinations of job support, control and demands in the data.

16
significantly associated with eight of them, and is on the borderline of statistical
significance in the case of job satisfaction. In all cases the associations with supervisor
support are stronger than they are with respect to job control. The raw correlations between
job demands and wellbeing are not significant in any of the ten models. Where job demands
are close to statistical significance – which is in the case of enthusiasm and initiative – the
coefficient is positively signed. Indeed, it is positive (albeit insignificant) for five of the ten
wellbeing measures. Of the forty interaction effects in Table 2, all but two are statistically
non-significant. One would expect to find two significant coefficients among forty simply
due to sampling variance.
[INSERT TABLE 2]
Table 3 shows what happens to these coefficients once we control for workers’
demographic traits, the industry, workers’ residual wages, and other characteristics of the
job such as tenure and occupation. The controls make a substantial difference to the amount
of variance in wellbeing accounted for by the model, as indicated by the increase in the
adjusted r-squared relative to the models in Table 2. In the case of achievement, for
example, the amount of variance accounted for almost doubles with the introduction of
controls. However, in the case of fairness the additional controls contribute virtually
nothing. The associations between supervisory support and wellbeing are robust to the
inclusion of the controls, with both the coefficients and statistical significance of
supervisory support of similar magnitude to the raw estimates. Similarly, associations
between job control and wellbeing are largely unaffected by the introduction of controls,
though the association with job satisfaction becomes statistically significant while the
association with trust becomes non-significant. Job demands remain statistically non-

17
significant throughout and only one of the interaction effects is significant (the association
between dare and the combination of supervisor support and job demands).
[INSERT TABLE 3]
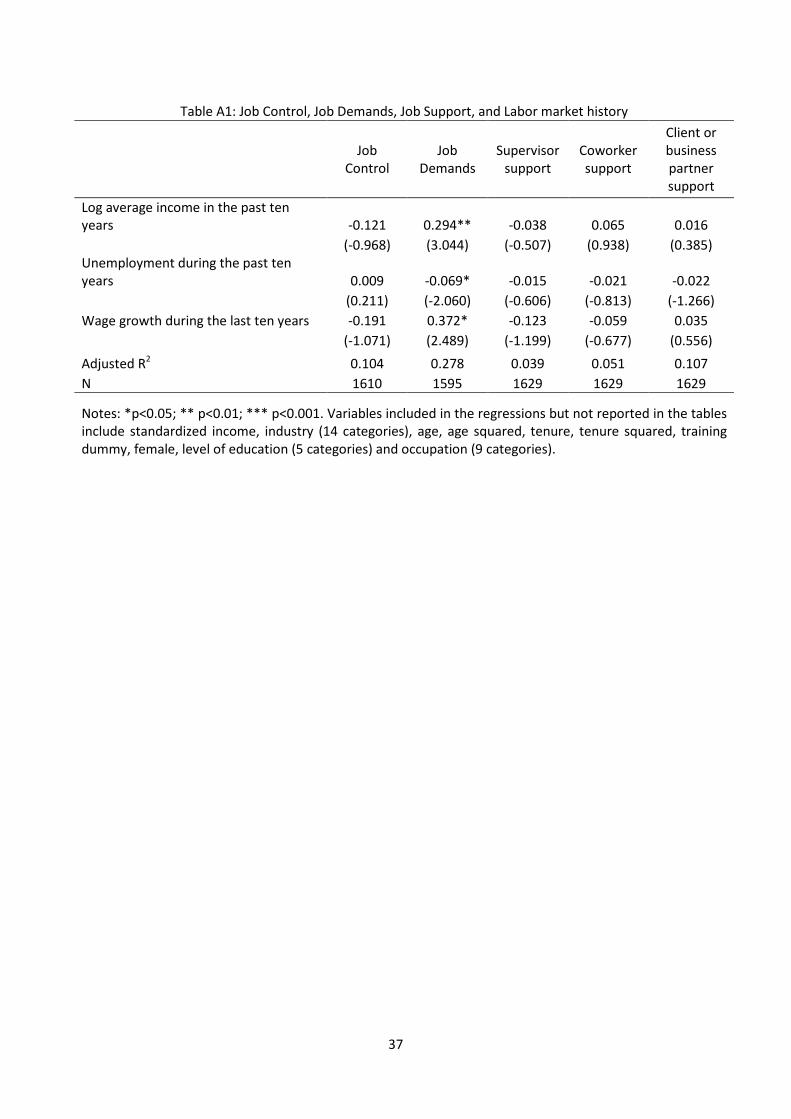
Table 4 adds the work and earnings histories variables to the models presented in Table 3.
There is a statistical justification for doing so since they contribute independently to the
amount of variance in worker wellbeing accounted for by the models, albeit marginally.8
Perhaps the most notable finding is the negative association between greater experience of
unemployment in the previous ten years and worker wellbeing. It is negatively and
statistically significantly associated with lower feelings of joy and trust and is on the
margins of statistical significance for job satisfaction, enthusiasm and dare, even having
accounted for job quality. This is clear evidence of the long-term scarring effects of
unemployment on worker wellbeing, an effect that persists even having accounted for the
potential impact such unemployment might have on the quality of job an individual can
achieve in the future.
[INSERT TABLE 4]
Once one conditions on work and earnings histories the job design effects are broadly
similar to those reported in Table 3, with supervisory support positive and statistically
significant across the board, job control positive and significant for all wellbeing measures
with the exception of achievement (which is nonetheless on the margins of significance)
and job demands not significant throughout. The only significant interaction effect is that
between supervisory support and job demands and dare.
8 They are also independently and jointly statistically significant in accounting for variance in job demands, as indicated in Appendix Table A1.

18
As a robustness check we incorporated additional job-related controls capturing job and
workplace features that have been emphasized as important for worker wellbeing in the
human resource management (HRM) literature. These include methods of communication,
incentive payments and team-working. The results reported above are not sensitive to the
addition of these controls (see Appendix Table A2).
Employees may receive job support from people other than their supervisors. To see how
that support is associated with worker wellbeing we replace supervisory support with
support from co-workers in Table 5 and clients/business partners in Table 6. Although co-
worker support is positive in all the wellbeing equations and statistically significant in six
of the ten, the replacement of supervisory support by co-worker support leads to a large
reduction in the explanatory power of the models compared to those containing supervisor
support in Table 4. Furthermore, the coefficients for co-worker support are always smaller
than those for supervisory support.
[INSERT TABLES 5-6]
The replacement of supervisor support by co-worker support also has implications for the
role of job control. The coefficients on job control in Table 5 are generally smaller than
they were in Table 4 and they are only statistically significant for four of the ten wellbeing
measures. None of the interaction effects are statistically significant.
The association between client/business partner support and worker wellbeing is very
different. It is never statistically significant alone (Table 6). However, its inclusion results
in a stronger, more persistent effect of job control on worker wellbeing: job control is now
positive and statistically significant across all ten wellbeing outcomes. Interaction effects
also become significant: most notably the combination of job demands, job control and
support from a client or business partner is significantly and negatively associated with

19
wellbeing on seven of the ten wellbeing outcomes and is on the verge of statistical
significance in two others’.
5. CONCLUSIONS
It is well-established in the psychology, labour economics and HRM literatures that job
design is strongly correlated with worker wellbeing. The literature has tended to focus on
those aspects of job design featuring in Karasek’s (1979) and Karasek and Theorell’s
(1990) models, with much less attention devoted to other aspects of job design.
Furthermore, the literature has paid little attention to non-random selection of workers into
jobs. We address both of these issues using linked employer-employee data for Finland.
Although results differ somewhat across different wellbeing outcomes we find broad
support for Karasek’s (1979) proposition that job control is positively correlated with
worker wellbeing. However, contrary to the Karasek model job demands have no adverse
effects on worker wellbeing and we find no evidence that job control mitigates any adverse
effects of job demands. Furthermore, we find a strong positive correlation between job
support and all aspects of worker wellbeing that is independent of job controls and job
demands, a finding that has not been emphasized in the literature. The effects are most
pronounced in relation to supervisor support, are still apparent in most cases with respect to
co-worker support, but are largely absent with respect to the support of clients and business
partners. We also find evidence of unemployment scarring effects: substantial experience of
unemployment has long-term consequences for the wellbeing workers experience in their
current jobs, even controlling for the quality of those jobs.
Our findings differ somewhat from the broad thrust of the empirical literature reviewed in
Section Two. Although we are the first to account for selection into different types of jobs
using work history variables the introduction of these controls does not account for these

20
differences. There are a number of reasons why they may differ. First, ours is the first paper
to present results for a country (Finland) where unionization rates are high – considerably
higher than in the Anglo-US countries which feature heavily in the empirical literature. It
may be that the influence of unions on the nature of job design, and the nature of social
support at work, could affect the associations between worker wellbeing and job design.
Second, our measures of job control, job demands and job support differ from other studies.
However, the definition of these concepts tends to differ across most studies and, in any
case, our survey measures are fairly complete compared to those featuring in other studies.
Furthermore, our results are relatively insensitive to the configuration of variables used to
construct these items.9 Third, we present results for ten wellbeing outcomes. Most studies
tend to concentrate on one or two, with job satisfaction featuring in most. Although our
results are fairly consistent across wellbeing measures, they do differ for specific wellbeing
measures in some specifications. Taking job satisfaction as an example, although support is
consistently positively and significantly associated with supervisor and co-worker support,
it is not associated with client or partner support. Job control is generally significantly and
positively associated with job satisfaction, but it is not significant in the models presented
in Tables 2 and 5. The implication is that results will vary, even within study, according to
model specification and the construction of variables used to capture key concepts. In
future, analysts would do well to test the Karasek model using very similar model
specifications and derived variables across a range of wellbeing measures in different
institutional contexts to see what more we can learn about the links between job design and
worker wellbeing.
9 Some of these sensitivity checks are reported in Appendix Tables A4 and A5. Others are available from the authors on request.
21
References
Alasoini, T., Lyly-Yrjänäinen, M., Ramstad, E. and Heikkilä, A. (2014) “Innovativeness in
Finnish workplaces. Renewing Working Life to Bring Finland to Bloom.” TEKES
Review No. 312, Helsinki.
Artz, B.M., Goodall, A.H. and Oswald, A.J. (2016) “Boss Competence and Worker Well-
being.” Industrial and Labor Relations Review, Forthcoming.
Barnow, B.S. and Smith, J. (2015) Employment and Training Programs. National Bureau of
Economic Research, Working Paper #21659.
Blanchflower, D. and Oswald, A. (2011) “International Happiness: A New View on the
Measure of Performance.” Academy of Management Perspectives, 25, 6–22.
Böckerman, P., Bryson, A. and Ilmakunnas, P. (2013) “Does High Involvement
Management Lead to Higher Pay?” Journal of the Royal Statistical Society: Series A
Statistics in Society, 176, 861–885.
Böckerman, P., Bryson, A. and Ilmakunnas, P. (2012) “Does High Involvement
Management Improve Worker Wellbeing?” Journal of Economic Behavior and
Organization, 84, 660–680.
Bryson, A., Barth, E. and Dale-Olsen, H. (2012) “Do Higher Wages Come at a Price?”
Journal of Economic Psychology, 33, 251–263.
Bryson, A., Erhel, C. and Salibekyan, Z. (2016) “Job Quality”, Chapter 6 in Amossé, T.,
Bryson, A., Forth, J. and Petit, H. (eds.) Comparative Workplace Employment Relations:
An Analysis of Britain and France. London: Palgrave Macmillan, pp. 179–210.
Bryson, A., Forth, J. and Stokes, L. (2014) Does Worker Wellbeing Affect Workplace
Performance? Department for Business, Innovation and Skills, BIS/14/1120, London.
Bryson, A. and MacKerron, G. (2016) “Are You Happy While You Work?” The Economic
Journal, DOI: 10.1111/ecoj.12269

22
Clark, A.E., Diener, E., Georgellis, Y. and Lucas, R.E. (2008) “Lags and Leads in Life
Satisfaction: A Test of the Baseline Hypothesis.” The Economic Journal, 118, F222–
243.
Clark, A.E. and Oswald, A.J. (1996) “Satisfaction and Comparison Income.” Journal of
Public Economics, 61, 359–81.
Clark, A.E., Georgellis, Y. and Sanfey, P. (2001) “Scarring: The Psychological Impact of
Past Unemployment.” Economica, 68, 221–241.
Cottini, E., Kato, T. and Westergaard-Nielsen, N. (2011) “Adverse Workplace Conditions,
High-involvement Work Practices and Labor Turnover: Evidence from Danish Linked
Employer-employee Data.” Labour Economics, 18, 872–80.
Gimeno, D., Benavides, F.G., Benach, J. and Amick, B.C. (2004) “Distribution of sickness
absence in the European Union countries.” Occupational and Environmental Medicine,
61, 211–227.
Godard, J. (2004) “A Critical Assessment of the High-performance Paradigm.” British
Journal of Industrial Relations, 42, 349–378.
de Lange, A.H., Taris, T.W., Kompier, A.J., Houtman, I.L.D. and Bongers, P.M. (2003)
“The Very Best of the Millennium: Longitudinal Research and the Demand Control
(Support) Model.” Journal of Occupational Health Psychology, 8, 282-305.
Johnson, J.V. and Hall, E.M. (1988) “Job Strain, Work Place Social Support and
Cardiovascular Disease: A Cross-section Study of a Random Sample of the Swedish
Working Population.” American Journal of Public Health, 78, 1336–1342.
Jovanovic, B. (1979) “Job Matching and the Theory of Turnover.” Journal of Political
Economy, 87, 972–990.

23
Kahneman, D., Krueger, A.B., Schkade, D.A., Schwarz, N. and Stone, A.A. (2004) “A
Survey Method for Characterizing Daily Life Experience: The Day Reconstruction
Method.” Science, 306, 1776–80.
Karasek, R. (1979) “Job Demands, Job Decision Latitude and Mental Strain: Implications
for Job Redesign.” Administrative Science Quarterly, 24, 285–308
Karasek, R. and Theorell, T. (1990) Healthy Work. New York: Basic Books
Landsberger, P., Schnall, P., Deitz, D., Friedman, R., and Pickering, T. (1992) “The
Patterning of Psychological Attributes and Distress by ‘Job Strain’ and Social Support in
a Sample of Working Men.” Journal of Behavioral Medicine, 15, 379–405.
Lazear, E.P. (2000) “Unresolved Issues in Personnel Economics: The Power of Incentives.”
American Economic Review: Papers and Proceedings, 90, 410–414.
Meadow Consortium (2010) “The MEADOW Guidelines, Project Funded within the 6th
Framework Programme of the European Commission’s DG Research”, Grigny, France.
Available at: http://www.meadow-
project.eu/doc/users/307/bib/meadowguidelinespdf_7701.pdf
Payne, R.L. (1979) “Demands, Supports, Constraints and Psychological Health”, in C.J.
Mackay and Cox, T. (eds.) In Response to Stress: Occupational Aspects. London: IPC
Business Press, pp. 85–105.
Payne, R.L. and Fletcher, B. (1983) “Job Demands, Supports and Constraints as Predictors
of Psychological Strain among School Teachers.” Journal of Vocational Behaviour, 22,
136–147.
Plug, E., Webbink, D. and Martin, N. (2014) “Sexual Orientation, Prejudice and
Segregation.” Journal of Labor Economics, 32, 123–159.
Sargent, L.D. and Terry, D.J. (2000) “The Moderating Role of Social Support in Karasek’s
Job Strain Model.” Work and Stress, 14, 245–261.

24
Smith, A. (1776) An Inquiry into the Nature and Causes of the Wealth of Nations. London.
van der Doef, M. and Maes, S. (1999) “The Job Demand-Control (Support) Model and
Psychological Wellbeing: A Review of 20 Years of Empirical Research.” Work and
Stress, 13, 87–114.
van Wanrooy, B., Bewley, H., Bryson, A., Forth, J., Stokes, L. and Wood, S. (2013)
Employment Relations in the Shadow of Recession: Findings from the 2011 Workplace
Employment Relations Study. London: Palgrave MacMillan.
Warr P. (2011) Work, Happiness and Unhappiness. London: Lawrence Erlbaum.
Wood, S. (2008) “Job characteristics, employee voice and wellbeing in Britain.” Industrial
Relations Journal, 39, 153–168.
25
Tables
Table 1: Summary statistics
Variable Observations Mean Std. Dev. Outcomes
Job satisfaction 1,677 3.05 0.59 Enthusiasm 1,671 3.75 1.06 Achievement 1,672 4.10 0.96 Joy 1,673 3.91 1.17 Trust 1,670 4.03 1.24 Skills 1,672 4.56 0.86 Management 1,665 3.55 1.32 Wellbeing 1,673 3.75 1.18 Personnel care 1,668 3.64 1.30 Initiative 1,658 3.55 1.16 Dare 1,668 3.87 1.13 Fairness 1,673 3.77 1.28
Job Control, Job Demands, Support Job control 1,660 4E-09 1 Job demands 1,645 3E-09 1 Supervisor support 1,680 0.42 0.49 Coworker support 1,680 0.64 0.48 Client or cooperation partner support 1,680 0.18 0.39
Control variables Standardized wage 1,680 -0.02 0.57 Age 1,680 44.19 11.56 Female 1,680 0.44 0.50 Level of education
Primary education 1,680 0.15 0.36 Secondary education 1,680 0.53 0.50 Lowest level tertiary 1,680 0.13 0.34 Bachelor's or equivalent 1,680 0.11 0.32 Master's or equivalent 1,680 0.07 0.25 Doctoral or equivalent 1,680 0.01 0.08 Occupation
Armed forces 1,643 0.00 0.03 Managers 1,643 0.01 0.10 Professionals 1,643 0.19 0.39 Technicians and associate professionals 1,643 0.19 0.39 Clerical support workers 1,643 0.07 0.25 Service and sales workers 1,643 0.17 0.38 Skilled agricultural, forestry and fishery workers6 1,643 0.01 0.08 Craft and related trades workers 1,643 0.17 0.38 Plant and machine operators, and assemblers 1,643 0.11 0.31 Elementary occupations 1,643 0.08 0.28

26
Tenure 1,669 10.02 8.35 Training 1,677 0.74 0.44
Job history Log average income in the past ten years 1,680 7.70 0.59 Unemployment during the past ten years 1,680 0.40 0.98 Average wage growth during the last ten years 1,680 0.17 0.35

27
Table 2: Job control, Job demands and supervisor support: No control variables
Variable Job
satisfaction Enthusiasm Achievement Joy Trust Skills Manage-ment
Personnel care Initiative Fairness
Job control 0.094 0.295*** 0.086 0.262*** 0.192* 0.061 0.273** 0.229** 0.262*** 0.289***
(1.954) (3.903) (1.396) (3.458) (2.308) (0.995) (2.769) (2.665) (3.704) (3.535)
Job demands -0.049 0.116 0.021 0.013 0.074 -0.006 -0.015 -0.050 0.097 -0.001
(-1.390) (1.777) (0.329) (0.160) (0.932) (-0.103) (-0.170) (-0.739) (1.585) (-0.010)
Job control*Job demands 0.028 -0.006 0.112 0.011 0.090 0.109 0.068 0.082 0.016 0.088
(0.770) (-0.088) (1.903) (0.145) (1.192) (1.516) (0.706) (1.188) (0.267) (1.051)
Supervisor support 0.269*** 0.533*** 0.391*** 0.621*** 0.762*** 0.399*** 0.913*** 0.964*** 0.647*** 0.920***
(5.555) (6.183) (4.426) (6.136) (7.301) (4.978) (8.281) (8.972) (7.006) (8.451)
Supervisor support*Job control 0.018 -0.168 -0.023 -0.032 -0.164 -0.081 -0.230 -0.067 -0.104 -0.259*
(0.314) (-1.551) (-0.243) (-0.292) (-1.443) (-0.963) (-1.907) (-0.596) (-1.061) (-2.464)
Supervisor support*Job demands 0.102* -0.063 -0.053 0.081 -0.123 0.034 -0.080 0.061 -0.095 -0.014
(2.117) (-0.646) (-0.613) (0.814) (-1.182) (0.457) (-0.721) (0.633) (-0.978) (-0.119)
Supervisor support*Job demands*Job control -0.052 0.051 -0.110 -0.099 -0.051 -0.048 0.002 -0.059 -0.046 -0.077
(-1.110) (0.493) (-1.383) (-0.991) (-0.485) (-0.588) (0.020) (-0.667) (-0.440) (-0.681)
Adjusted R2 0.102 0.146 0.055 0.134 0.126 0.061 0.160 0.180 0.134 0.172 N 1625 1623 1625 1623 1623 1623 1616 1622 1611 1623 Notes: *p<0.05; ** p<0.01; *** p<0.001

28
Table 3: Job control, Job demands and supervisor support: with control variables
Variable Job
satisfaction Enthusiasm Achievement Joy Trust Skills Manage-ment
Personnel care Initiative Fairness
Job control 0.094* 0.291*** 0.109 0.282*** 0.159 0.044 0.205* 0.196* 0.260*** 0.228**
(2.098) (4.075) (1.698) (3.897) (1.888) (0.795) (2.216) (2.306) (3.797) (2.744)
Job demands -0.027 0.125 0.074 0.032 0.048 0.001 0.057 -0.056 0.064 -0.023
(-0.726) (1.718) (1.064) (0.378) (0.571) (0.023) (0.656) (-0.793) (0.979) (-0.283)
Job control*Job demands 0.046 0.033 0.087 0.046 0.085 0.034 0.048 0.064 0.037 0.066
(1.255) (0.496) (1.600) (0.634) (1.169) (0.705) (0.595) (1.094) (0.639) (0.937)
Supervisor support 0.292*** 0.494*** 0.377*** 0.634*** 0.776*** 0.369*** 0.898*** 0.879*** 0.640*** 0.883***
(5.486) (5.518) (3.912) (5.865) (7.284) (4.497) (8.384) (8.350) (6.841) (8.176)
Supervisor support*Job control -0.013 -0.168 -0.084 -0.078 -0.120 -0.065 -0.198 -0.075 -0.120 -0.176
(-0.243) (-1.618) (-0.932) (-0.718) (-1.141) (-0.890) (-1.856) (-0.717) (-1.310) (-1.687)
Supervisor support*Job demands 0.086 -0.036 -0.050 0.081 -0.131 0.046 -0.102 0.073 -0.055 0.019
(1.676) (-0.362) (-0.533) (0.816) (-1.302) (0.655) (-0.959) (0.768) (-0.572) (0.171)
Supervisor support*Job demands*Job control -0.074 0.015 -0.089 -0.140 -0.066 -0.008 0.003 -0.029 -0.069 -0.088
(-1.561) (0.153) (-1.176) (-1.538) (-0.627) (-0.120) (0.033) (-0.372) (-0.692) (-0.828)
Adjusted R2 0.159 0.184 0.099 0.206 0.154 0.109 0.179 0.209 0.183 0.178 N 1577 1574 1576 1574 1574 1574 1568 1573 1562 1574
Notes: *p<0.05; ** p<0.01; *** p<0.001. Variables included in the regressions but not reported in the tables include standardized income, industry (14 categories), age, age squared, tenure, tenure squared, training dummy, female, level of education (5 categories) and occupation (9 categories).

29
Table 4: Job control, Job demands and supervisor support: Control variables and labor market history
Variable Job
satisfaction Enthusiasm Achievement Joy Trust Skills Manage-ment
Personnel care Initiative Fairness
Job control 0.095* 0.289*** 0.111 0.288*** 0.162* 0.045 0.200* 0.198* 0.255*** 0.224**
(2.185) (4.073) (1.720) (3.988) (1.971) (0.807) (2.151) (2.360) (3.761) (2.718)
Job demands -0.029 0.125 0.071 0.021 0.043 -0.001 0.064 -0.057 0.070 -0.018
(-0.775) (1.754) (1.046) (0.250) (0.526) (-0.026) (0.735) (-0.814) (1.110) (-0.215)
Job control*Job demands 0.045 0.023 0.086 0.040 0.074 0.033 0.042 0.062 0.029 0.061
(1.236) (0.356) (1.577) (0.547) (1.040) (0.691) (0.531) (1.057) (0.504) (0.873)
Supervisor support 0.290*** 0.495*** 0.377*** 0.632*** 0.773*** 0.369*** 0.900*** 0.874*** 0.642*** 0.883***
(5.422) (5.568) (3.878) (5.981) (7.360) (4.485) (8.379) (8.332) (6.903) (8.153)
Supervisor support*Job control -0.016 -0.162 -0.086 -0.080 -0.124 -0.065 -0.191 -0.082 -0.113 -0.174
(-0.311) (-1.593) (-0.951) (-0.746) (-1.188) (-0.870) (-1.779) (-0.785) (-1.279) (-1.659)
Supervisor support*Job demands 0.083 -0.039 -0.051 0.074 -0.142 0.046 -0.100 0.066 -0.057 0.018
(1.594) (-0.380) (-0.554) (0.761) (-1.411) (0.654) (-0.921) (0.697) (-0.586) (0.153)
Supervisor support*Job demands*Job control -0.070 0.018 -0.087 -0.130 -0.053 -0.007 -0.000 -0.022 -0.070 -0.089
(-1.463) (0.177) (-1.152) (-1.460) (-0.521) (-0.109) (-0.005) (-0.275) (-0.711) (-0.814)
Log average income in the past ten years -0.028 -0.206 0.014 -0.038 -0.224 0.018 -0.170 -0.082 -0.257 -0.176
(-0.443) (-1.420) (0.106) (-0.253) (-1.734) (0.162) (-0.968) (-0.624) (-1.601) (-1.296)
Unemployment during the past ten years -0.040 -0.076 -0.021 -0.100* -0.174** -0.001 -0.014 -0.088 -0.065 -0.047
(-1.615) (-1.653) (-0.474) (-2.024) (-2.603) (-0.025) (-0.208) (-1.445) (-1.121) (-0.794)
Wage growth during the last ten years -0.043 0.187 0.057 0.355* 0.119 0.113 -0.007 -0.148 -0.025 -0.124
(-0.519) (1.046) (0.294) (2.060) (0.535) (0.896) (-0.035) (-0.757) (-0.124) (-0.581)
Adjusted R2 0.161 0.194 0.098 0.216 0.171 0.109 0.180 0.211 0.188 0.179

30
N 1577 1574 1576 1574 1574 1574 1568 1573 1562 1574
Notes: *p<0.05; ** p<0.01; *** p<0.001. Variables included in the regressions but not reported in the tables include standardized income, industry (14 categories), age, age squared, tenure, tenure squared, training dummy, female, level of education (5 categories) and occupation (9 categories).

31
Table 5: Job control, Job demands and coworker support: Control variables and labor market history
Variable Job
satisfaction Enthusiasm Achievement Joy Trust Skills Manage-ment
Personnel care Initiative Fairness
Job control 0.091 0.244** 0.144 0.287** 0.101 0.017 0.171 0.272* 0.229** 0.170
(1.429) (2.659) (1.789) (2.955) (0.895) (0.221) (1.388) (2.339) (2.879) (1.312)
Job demands -0.004 0.138 0.092 0.075 0.101 0.038 0.073 0.001 0.054 0.051
(-0.089) (1.498) (1.276) (0.681) (0.935) (0.614) (0.647) (0.007) (0.653) (0.435)
Job control*Job demands 0.035 0.039 0.049 0.079 0.049 0.047 0.048 0.028 -0.090 0.022
(0.882) (0.456) (0.740) (0.815) (0.443) (0.723) (0.468) (0.371) (-1.020) (0.193)
Coworker support 0.115* 0.140 0.191* 0.308** 0.462*** 0.180* 0.216 0.255* 0.076 0.417**
(2.030) (1.528) (2.136) (2.641) (3.699) (2.188) (1.736) (2.024) (0.746) (3.197)
Coworker support*Job control 0.032 0.031 -0.054 0.019 0.101 0.043 0.054 -0.036 0.074 0.077
(0.467) (0.284) (-0.563) (0.167) (0.818) (0.507) (0.397) (-0.275) (0.733) (0.545)
Coworker support*Job demands -0.002 -0.049 -0.076 -0.052 -0.182 -0.032 -0.092 -0.063 -0.059 -0.113
(-0.036) (-0.457) (-0.836) (-0.417) (-1.531) (-0.461) (-0.719) (-0.624) (-0.592) (-0.866)
Coworker support*Job demands*Job control -0.024 -0.027 -0.029 -0.150 -0.034 -0.023 -0.041 0.023 0.112 -0.018
(-0.480) (-0.245) (-0.359) (-1.353) (-0.267) (-0.306) (-0.333) (0.241) (1.102) (-0.135)
Log average income in the past ten years -0.035 -0.230 -0.006 -0.063 -0.282 -0.003 -0.202 -0.104 -0.267 -0.220
(-0.502) (-1.596) (-0.045) (-0.433) (-1.948) (-0.032) (-1.266) (-0.761) (-1.813) (-1.501)
Unemployment during the past ten years -0.042 -0.072 -0.018 -0.100* -0.167* -0.000 -0.012 -0.091 -0.069 -0.044
(-1.650) (-1.525) (-0.426) (-2.020) (-2.353) (-0.009) (-0.161) (-1.352) (-1.089) (-0.692)
Wage growth during the last ten years -0.053 0.172 0.052 0.342 0.087 0.097 -0.022 -0.178 -0.046 -0.154
(-0.610) (0.846) (0.255) (1.840) (0.371) (0.716) (-0.096) (-0.798) (-0.235) (-0.628)
Adjusted R2 0.114 0.142 0.072 0.168 0.108 0.075 0.071 0.115 0.122 0.092

32
N 1577 1574 1576 1574 1574 1574 1568 1573 1562 1574
Notes: *p<0.05; ** p<0.01; *** p<0.001. Variables included in the regressions but not reported in the tables include standardized income, industry (14 categories), age, age squared, tenure, tenure squared, training dummy, female, level of education (5 categories) and occupation (9 categories).

33
Table 6: Job control, Job demands and client or business partner support: Control variables and labor market history
Variable Job
satisfaction Enthusiasm Achievement Joy Trust Skills Manage-ment
Personnel care Initiative Fairness
Job control 0.117*** 0.286*** 0.117* 0.347*** 0.205** 0.045 0.217** 0.230*** 0.266*** 0.228***
(3.963) (4.794) (2.189) (5.878) (3.043) (0.992) (2.973) (3.511) (4.828) (3.571)
Job demands -0.014 0.120 0.022 0.009 -0.043 0.026 -0.027 -0.046 0.017 -0.031
(-0.426) (1.863) (0.418) (0.137) (-0.642) (0.594) (-0.375) (-0.769) (0.283) (-0.427)
Job control*Job demands 0.036 0.076 0.042 0.031 0.092 0.047 0.093 0.114* 0.035 0.083
(1.338) (1.210) (0.921) (0.511) (1.465) (1.242) (1.464) (2.289) (0.604) (1.231)
Client or business partner support -0.005 0.055 0.017 0.133 -0.020 -0.022 -0.016 -0.046 0.149 -0.031
(-0.062) (0.460) (0.143) (1.164) (-0.123) (-0.198) (-0.095) (-0.265) (1.046) (-0.194)
Client or business partner support*Job control 0.056 0.006 0.016 -0.078 0.078 0.106 0.165 0.297 0.135 0.251
(0.585) (0.042) (0.112) (-0.662) (0.484) (0.824) (0.841) (1.482) (0.810) (1.439)
Client or business partner support*Job demands 0.020 -0.078 0.030 0.042 0.056 -0.077 0.189 0.006 0.034 -0.016
(0.294) (-0.579) (0.243) (0.330) (0.336) (-0.794) (1.123) (0.051) (0.282) (-0.107)
Client or business partner support*Job demands*Job control -0.093 -0.218 -0.043 -0.203* -0.321* -0.082 -0.397** -0.352** -0.262* -0.367**
(-1.675) (-1.958) (-0.426) (-2.043) (-2.455) (-0.905) (-2.780) (-3.151) (-2.417) (-2.854)
Log average income in the past ten years -0.016 -0.199 0.018 -0.016 -0.203 0.021 -0.153 -0.059 -0.243 -0.153
(-0.233) (-1.412) (0.135) (-0.104) (-1.269) (0.214) (-0.996) (-0.432) (-1.720) (-1.069)
Unemployment during the past ten years -0.045 -0.074 -0.022 -0.104* -0.176* -0.006 -0.017 -0.100 -0.068 -0.055
(-1.795) (-1.556) (-0.502) (-1.969) (-2.309) (-0.121) (-0.232) (-1.489) (-1.075) (-0.858)
Wage growth during the last ten years -0.044 0.202 0.054 0.371 0.136 0.103 0.011 -0.161 -0.027 -0.123

34
(-0.518) (0.994) (0.272) (1.851) (0.543) (0.773) (0.047) (-0.712) (-0.136) (-0.501)
Adjusted R2 0.109 0.148 0.062 0.159 0.085 0.070 0.080 0.120 0.127 0.083 N 1577 1574 1576 1574 1574 1574 1568 1573 1562 1574
Notes: *p<0.05; ** p<0.01; *** p<0.001. Variables included in the regressions but not reported in the tables include standardized income, industry (14 categories), age, age squared, tenure, tenure squared, training dummy, female, level of education (5 categories) and occupation (9 categories).

35
SUPPLEMENTARY ONLINE APPENDIX
Job control The measure of job control is based on the following questions
25. Do you have 1) a lot of, 2) a fair amount of, 3) some, 4) not at all influence on the following issues? a. which tasks your work consists of b. your working pace c. in which order you carry out tasks d. how tasks are distributed among employees at work
We form a standardized scale of questions Q25a Q25b Q25c Q25d (reversing the values so that higher values mean better control). The scale has Cronbach’s alpha of 0.68. Because the estimation use weights we further subtract the weighted mean and divide by the weighted standard deviation so that the scale has zero mean and standard deviation of 1 also in the estimations.
Job demands We use the following questions to form a standardized scale 16. How often does your job involve working to tight deadlines or at very high speed? 1. Less than 25% of the time 2. 25% up to 50% of the time 3. 50% up to 75% of the time 4. 75% or more of the time 17. How often you carry out tasks related to your main job at home? 1. Never 2. Occasionally 3. Frequently 4. I only work at home. 18. How often you carry out tasks related to your main outside your actual hours of work? 1. every day 2. at least once a week 3. at least once a month 4. less often than once a month/never 5. not applicable 19. How often are you contacted by phone or in person on work related matters outside your usual working hours? 1. Every day 2. At least once a week 3. At least once a month 4. Less often than once a month / never

36
42. Over the past 12 months how many hours per month have you worked overtime or done extra work during an average month?
The standardized scale is formed in the following way Q16+A17+Q18+Q19+Q42. In the overtime question the number of overtime hours has been capped at 40 reduce some very large values. This affects 31 observations. These items are quite highly correlated and the scale has Cronbach’s alpha (0.73). Because the estimation use weights we further subtract the weighted mean and divide by the weighted standard deviation so that the scale has zero mean and standard deviation of 1 also in the estimations.
Job Support Job support is measured with a single question
13. In case of work overload or a difficult situation, do you receive assistance from 1. Always; 2. Sometimes; 3. Never; 4. Not applicable
a. Your supervisor or manager b. Your coworkers c. Your clients or cooperation partners
We form three different measures of support. Supervisor support=1 if Q13a==1 and 0 otherwise Coworker support=1 if Q13b==1 and 0 otherwise
Client or cooperation partner support=1 if Q13c==1 and 0 otherwise
37
Table A1: Job Control, Job Demands, Job Support, and Labor market history
Job Control
Job Demands
Supervisor support
Coworker support
Client or business partner support
Log average income in the past ten years -0.121 0.294** -0.038 0.065 0.016
(-0.968) (3.044) (-0.507) (0.938) (0.385)
Unemployment during the past ten years 0.009 -0.069* -0.015 -0.021 -0.022
(0.211) (-2.060) (-0.606) (-0.813) (-1.266)
Wage growth during the last ten years -0.191 0.372* -0.123 -0.059 0.035
(-1.071) (2.489) (-1.199) (-0.677) (0.556)
Adjusted R2 0.104 0.278 0.039 0.051 0.107 N 1610 1595 1629 1629 1629
Notes: *p<0.05; ** p<0.01; *** p<0.001. Variables included in the regressions but not reported in the tables include standardized income, industry (14 categories), age, age squared, tenure, tenure squared, training dummy, female, level of education (5 categories) and occupation (9 categories).

38
Table A2: Job control, Job demands and supervisor support: Additional control variables and labor market history
Variable Job
satisfaction Enthusiasm Achievement Joy Trust Skills Manage-ment
Personnel care Initiative Fairness
Job control 0.100* 0.279*** 0.098 0.259*** 0.119 0.001 0.153 0.127 0.222*** 0.148
(2.394) (3.976) (1.499) (3.416) (1.434) (0.023) (1.691) (1.562) (3.371) (1.853)
Job demands -0.028 0.143* 0.068 0.025 0.057 0.009 0.064 -0.067 0.076 -0.013
(-0.749) (2.065) (0.942) (0.305) (0.709) (0.170) (0.722) (-0.962) (1.173) (-0.167)
Job control*Job demands 0.049 0.025 0.095 0.057 0.070 0.027 0.040 0.077 0.034 0.066
(1.315) (0.398) (1.719) (0.815) (0.996) (0.563) (0.517) (1.328) (0.578) (0.954)
Supervisor support 0.278*** 0.501*** 0.372*** 0.625*** 0.788*** 0.359*** 0.900*** 0.874*** 0.645*** 0.902***
(5.328) (5.643) (3.806) (5.712) (7.487) (4.372) (8.433) (8.472) (6.899) (8.454)
Supervisor support*Job control -0.015 -0.146 -0.078 -0.063 -0.085 -0.048 -0.166 -0.017 -0.062 -0.076
(-0.287) (-1.452) (-0.866) (-0.588) (-0.871) (-0.614) (-1.561) (-0.164) (-0.688) (-0.739)
Supervisor support*Job demands 0.076 -0.042 -0.051 0.092 -0.141 0.009 -0.117 0.059 -0.032 0.052
(1.492) (-0.419) (-0.527) (0.914) (-1.414) (0.125) (-1.080) (0.622) (-0.321) (0.468)
Supervisor support*Job demands*Job control -0.060 0.013 -0.111 -0.156 -0.048 -0.002 0.030 -0.032 -0.081 -0.107
(-1.211) (0.128) (-1.469) (-1.820) (-0.478) (-0.034) (0.311) (-0.403) (-0.787) (-1.038)
Log average income in the past ten years 0.002 -0.151 0.089 0.007 -0.189 0.040 -0.081 -0.016 -0.231 -0.098
(0.032) (-1.007) (0.678) (0.043) (-1.468) (0.349) (-0.446) (-0.111) (-1.322) (-0.703)
Unemployment during the past ten years -0.045 -0.060 0.000 -0.073 -0.172* -0.012 -0.022 -0.093 -0.079 -0.043
(-1.911) (-1.225) (0.002) (-1.575) (-2.468) (-0.230) (-0.315) (-1.430) (-1.364) (-0.739)
Wage growth during the last ten years -0.076 0.181 0.092 0.371* 0.074 0.103 -0.044 -0.235 -0.114 -0.212
(-0.878) (1.013) (0.487) (2.086) (0.331) (0.816) (-0.220) (-1.200) (-0.577) (-1.038)

39
Adjusted R2 0.184 0.222 0.130 0.230 0.190 0.115 0.197 0.231 0.201 0.212 N 1438 1435 1436 1435 1435 1434 1429 1435 1424 1434
Notes: *p<0.05; ** p<0.01; *** p<0.001. Variables included in the regressions but not reported in the tables include standardized income, industry (14 categories), age, age squared, tenure, tenure squared, training dummy, female, level of education (5 categories) and occupation(9 categories). The additional control variables are the shares of employees in the firm participating in i) self-managed teams, ii) regular meetings with supervisors, iii) flexible working time arrangements, iv) employer-provided training, v) performance evaluation schemes, vi) work development initiatives, and vii) telecommuting.

40
Table A3 :Prevalence of different combinations of Control Demand and Support Job Control #Job Demands# Supervisor support
001 0,23 010 0,06 011 0,10 100 0,11 101 0,05 110 0,05 111 0,03 N 1680

41
Table A4: Job control, Job demands and supervisor support as dichotomous variables: Control variables and labor market history
Variable Job
satisfaction Enthusiasm Achievement Joy Trust Skills Manage-ment
Personnel care Initiative Fairness
Job Control #Job Demands# Supervisor support 0 0 1 0.285*** 0.733*** 0.415*** 0.704*** 0.952*** 0.402*** 1.009*** 0.997*** 0.778*** 1.057***
(4.703) (6.934) (3.813) (5.708) (7.592) (4.259) (7.479) (8.455) (6.912) (8.373)
0 1 0 0.323*** 0.883*** 0.399* 0.778*** 0.523* 0.270* 0.700** 0.621* 0.817*** 0.809***
(3.370) (6.139) (2.495) (3.311) (1.967) (1.992) (3.014) (2.343) (4.874) (3.961)
0 1 1 0.403*** 0.853*** 0.526*** 0.969*** 0.948*** 0.281* 1.133*** 0.912*** 1.066*** 1.152***
(4.843) (5.048) (3.889) (6.408) (6.166) (2.157) (6.382) (4.062) (7.144) (7.201)
1 0 0 -0.091 0.225 0.056 -0.158 -0.118 -0.028 -0.088 -0.228 -0.020 -0.118
(-0.759) (1.257) (0.392) (-0.699) (-0.527) (-0.199) (-0.413) (-1.158) (-0.130) (-0.545)
1 0 1 0.403*** 0.720*** 0.396* 0.922*** 0.686*** 0.455*** 0.861*** 0.963*** 0.689** 0.683**
(3.596) (4.139) (2.234) (5.568) (4.145) (3.822) (4.422) (3.934) (2.995) (2.783)
1 1 0 -0.018 0.795*** 0.170 0.246 -0.051 -0.081 0.053 0.001 0.274 0.238
(-0.101) (4.434) (0.442) (1.048) (-0.151) (-0.336) (0.138) (0.003) (0.922) (0.808)
1 1 1 0.490*** 1.285*** 0.665** 0.906*** 0.694* 0.476** 1.180*** 1.190*** 0.792** 1.093***
(3.748) (5.105) (3.043) (4.084) (2.393) (3.042) (4.867) (5.190) (2.660) (4.048)
Log average income in the past ten years -0.071 -0.278* -0.027 -0.136 -0.347* 0.009 -0.258 -0.191 -0.283 -0.221
(-0.983) (-2.028) (-0.204) (-0.937) (-2.334) (0.089) (-1.595) (-1.466) (-1.836) (-1.614)
Unemployment during the past ten years -0.055* -0.101* -0.039 -0.129* -0.195** 0.001 -0.038 -0.108 -0.075 -0.056
(-2.149) (-2.249) (-0.903) (-2.472) (-2.757) (0.015) (-0.567) (-1.792) (-1.381) (-0.957)
Wage growth during the last ten years -0.091 0.148 0.027 0.276 0.012 0.155 -0.045 -0.217 0.007 -0.104
(-1.043) (0.833) (0.138) (1.548) (0.055) (1.300) (-0.218) (-1.109) (0.037) (-0.493)
Adjusted R2 0.152 0.212 0.104 0.208 0.181 0.116 0.188 0.217 0.189 0.196 N 1627 1620 1621 1622 1619 1621 1615 1617 1608 1622

42
Notes: *p<0.05; ** p<0.01; *** p<0.001. In the table Job Control and Job Demand are represented as dichotomous varibles, where they equal 1 if the standardized scale in Table 3 is greater than the 75th percentile of the variable in question. Variables included in the regressions but not reported in the tables include standardized income, industry (14 categories), age, age squared, tenure, tenure squared, training dummy, female, level of education (5 categories) and occupation (9 categories).

43
Table A5: Job control, Job demands and supervisor support: Control variables and labor market history
Variable Job
satisfaction Enthusiasm Achievement Joy Trust Skills Manage- ment
Personnel care Initiative Fairness
Job control -0.138 0.784* -0.327 0.229 0.080 -0.369 0.167 -0.040 -0.101 -0.043
(-1.153) (2.378) (-0.953) (1.010) (0.258) (-1.541) (0.507) (-0.242) (-0.421) (-0.288)
Job demands -0.035 -0.172 -0.381 -0.387** -0.517** -0.161 -0.533** -0.183 -0.158 -0.336
(-0.477) (-1.283) (-1.576) (-3.042) (-2.715) (-0.778) (-3.246) (-1.538) (-0.806) (-1.897)
Job control*Job demands 0.247** -0.024 0.094 -0.302* 0.068 0.053 -0.230 0.290** 0.351* 0.139
(2.900) (-0.124) (0.393) (-2.093) (0.351) (0.277) (-1.211) (3.096) (2.115) (1.021)
Supervisor support (sometimes) 0.199 0.330 0.935* 0.686* 0.947* 0.526 1.045** 1.122*** 1.072*** 0.931**
(1.201) (1.279) (2.471) (2.140) (2.337) (1.741) (2.948) (4.757) (3.532) (3.064)
Supervisor support (always) 0.490** 0.772** 1.259** 1.279*** 1.678*** 0.867** 1.867*** 1.928*** 1.650*** 1.764***
(3.026) (3.045) (3.291) (4.002) (4.147) (2.839) (5.282) (8.185) (5.415) (5.894)
Supervisor support (sometimes)*Job control 0.264* -0.540 0.481 0.039 0.079 0.476 0.013 0.232 0.373 0.271
(2.046) (-1.602) (1.392) (0.164) (0.247) (1.956) (0.038) (1.254) (1.505) (1.553)
Supervisor support (always)*Job control 0.215 -0.651 0.371 -0.005 -0.026 0.354 -0.133 0.171 0.252 0.108
(1.722) (-1.908) (1.075) (-0.021) (-0.081) (1.467) (-0.394) (0.947) (1.019) (0.646)
Supervisor support (sometimes)*Job demands 0.021 0.317* 0.500* 0.451** 0.623** 0.191 0.642*** 0.165 0.266 0.364
(0.246) (2.046) (1.986) (2.922) (2.999) (0.897) (3.515) (1.223) (1.309) (1.851)
Supervisor support (always)*Job demands 0.090 0.255 0.395 0.481*** 0.416* 0.196 0.491** 0.209 0.178 0.344
(1.123) (1.654) (1.579) (3.504) (2.086) (0.928) (2.755) (1.567) (0.854) (1.732)
Supervisor support (sometimes)*Job demands*Job control -0.216* 0.092 -0.019 0.420* 0.051 0.009 0.316 -0.203 -0.348 -0.052
(-2.277) (0.448) (-0.078) (2.552) (0.244) (0.043) (1.541) (-1.740) (-1.957) (-0.328)

44
Supervisor support (always)*Job demands*Job control -0.274** 0.067 -0.089 0.218 -0.042 -0.020 0.278 -0.252* -0.389* -0.164
(-2.944) (0.319) (-0.366) (1.389) (-0.203) (-0.099) (1.402) (-2.243) (-2.099) (-1.010)
Log average income in the past ten years -0.035 -0.187 0.006 -0.039 -0.231 0.023 -0.161 -0.085 -0.260 -0.183
(-0.535) (-1.286) (0.047) (-0.270) (-1.752) (0.206) (-0.924) (-0.657) (-1.557) (-1.327)
Unemployment during the past ten years -0.045 -0.066 -0.011 -0.092 -0.166* 0.007 0.001 -0.079 -0.055 -0.042
(-1.827) (-1.462) (-0.253) (-1.914) (-2.498) (0.154) (0.016) (-1.276) (-0.956) (-0.701)
Wage growth during the last ten years -0.031 0.175 0.044 0.308 0.096 0.115 -0.054 -0.194 -0.043 -0.159
(-0.363) (0.973) (0.236) (1.806) (0.435) (0.927) (-0.268) (-0.989) (-0.208) (-0.726)
Adjusted R2 0.178 0.218 0.145 0.250 0.210 0.136 0.224 0.239 0.213 0.201 N 1555 1552 1554 1553 1553 1553 1549 1554 1543 1554
Notes: *p<0.05; ** p<0.01; *** p<0.001. Variables included in the regressions but not reported in the tables include standardized income, industry (14 categories), age, age squared, tenure, tenure squared, training dummy, female, level of education (5 categories) and occupation (9 categories).