does democracy affect taxation and government spending? evidence from developing countries
TRANSCRIPT

Journal of Comparative Economics 41 (2013) 684–718
Contents lists available at SciVerse ScienceDirect
Journal of Comparative Economics
journal homepage: www.elsevier .com/ locate / jce
Does democracy affect taxation and government spending?Evidence from developing countries
0147-5967/$ - see front matter � 2012 Association for Comparative Economic Studies Published by Elsevier Inc. All rights reserved.http://dx.doi.org/10.1016/j.jce.2012.10.004
⇑ Corresponding author.E-mail addresses: [email protected] (P. Profeta), [email protected] (R. Puglisi), [email protected] (S. Scabrosetti).
1 Although it is difficult to establish the true direction of a causal relationship between democratic and economic transitions, several authemphasized the existence of positive feedback effects and their advantages for growth (see among the others, Giavazzi and Tabellini, 2005; PerTabellini, 2007; Papaioannou and Siourounis, 2008; Rodrik and Wacziarg, 2005; and the criticisms of Barro, 1996 and Fernandez and Rodrik, 1991)
Paola Profeta a,⇑, Riccardo Puglisi b, Simona Scabrosetti b
a Università Bocconi, Econpubblica and Dondena, Via Roentgen 1, 20136 Milan, Italyb Università di Pavia, Strada Nuova 65, 27100 Pavia, Italy
a r t i c l e i n f o
Article history:Received 11 May 2011Revised 8 October 2012Available online 25 October 2012
JEL classification:H20O53P16P35P50
Keywords:Comprehensive dataset on taxation andpublic expenditurePOLITY2 indexCivil libertiesTax structurePublic spending composition
a b s t r a c t
Profeta, Paola, Puglisi, Riccardo, and Scabrosetti, Simona—Does democracy affect taxa-tion and government spending? Evidence from developing countries
Focusing on developing countries in three geographical areas (South-East Asia, Latin Amer-ica and European Union), we explore the relation between political variables and tax rev-enue, public spending and their structure. We build a new dataset for the 1990–2005period with fiscal, political and socio-economic variables. Since democracy is a complexand multidimensional concept, we measure it using two variables, the political strengthof democratic institutions, and the protection of civil liberties. We perform three sets ofestimates: (i) cross-country pooled OLS regressions with region fixed effects, (ii) countryfixed effects regressions and (iii) region specific regressions with country fixed effects.While the first model delivers some significant correlations between political variablesand tax items, when controlling for country fixed effects we find that tax revenue andtax composition are in general not significantly correlated with the strength of democraticinstitutions and the protection of civil liberties. The only exceptions are indirect, trade andproperty taxes. A similar result applies to public spending, with the exception of defenseexpenditure. Overall, our findings cast some doubt on the exact public policy channelsthrough which political institutions affect economic development. Journal of ComparativeEconomics 41 (3) (2013) 684–718. Università Bocconi, Econpubblica and Dondena, ViaRoentgen 1, 20136 Milan, Italy; Università di Pavia, Strada Nuova 65, 27100 Pavia, Italy.� 2012 Association for Comparative Economic Studies Published by Elsevier Inc. All rights
reserved.
1. Introduction
In many areas of the world, the economic transition goes hand in hand with a political transition towards a modern con-cept and organization of democracy. On one hand a higher level of economic well-being – which entails higher rates of lit-eracy, education, urbanization, and also a larger middle class – would be necessary, though not sufficient, for democracy tobe widely supported and then introduced (Lipset, 1959; Boix, 2003; Acemoglu and Robinson, 2006). On the other hand,stable democracies are likely to promote economic liberalizations and reforms, which in turn would have a positive effecton overall economic performance (Persson and Tabellini, 2007). Democratization may thus deliver positive effects onsubsequent growth (see Papaioannou and Siourounis, 2008). However, the way in which democracy promotes economicdevelopment can depend on the details of the democratic reform process (Persson and Tabellini, 2006).1
ors havesson and.
P. Profeta et al. / Journal of Comparative Economics 41 (2013) 684–718 685
If successful democratic transitions are subsequently associated with a higher growth rate of real per capita income(Papaioannou and Siourounis, 2008), what is the channel through which democratic transitions affect economic outcomes?
The interplay between economic and political factors suggests a potential role for public policies and reforms, mainly onthe side of redistribution through taxation and public spending.
In this paper we empirically investigate the relation between redistributive public policies and indicators of democracy.Our goal is to understand whether taxation and public expenditures, their level, structure and composition, are associatedwith democratic indicators. Is a democracy associated with higher taxes and/or higher public spending? Which categoriesare mostly affected? The results will be informative about the impact, if any, of a democratic transition on economic out-comes, which goes through changes in public policies.
The relation between democracy and public policies has been largely investigated in the literature.2 Democratizationmight induce higher taxes and higher spending to satisfy the needs of redistribution of a large electorate, as explained by,among the others, Meltzer and Richard (1981), using a median voter framework and, more recently, by Acemoglu andRobinson (2006). However, probabilistic voting models, which are more suitable to incorporating a multidimensional policy(Hettich and Winer, 1999; Profeta, 2002) and the role played by the political influence (Tridimas and Winer, 2005), do notnecessarily predict a positive association between democracy and redistributive public policies. The link between democratiza-tion and the structure of taxation and public spending remains an empirical question.
Being aware of this lack of clear theoretical predictions, in this paper we turn to the data. Previous empirical studies havetried to test these relations by making use of different approaches. Again, the results are not uncontroversial. Many cross-country studies find support for the theoretical prediction of the median voter model: democratization is positively relatedto both the size of the public sector (Lindert, 1994, 2004) and the level of tax revenue (Boix, 2003), as well as the one of directtaxes (Kenny and Winer, 2006). Mulligan et al. (2004) however do not confirm these relations.
Cross-country studies are known to be subject to criticism, since any correlation may depend on unobservable country-specific characteristics. Moreover, the political economy analysis of taxation and public outlays should focus specifically onthe composition of taxes and expenditures, since different taxes and public expenditures tend to have a different impact onvarious economic and administrative outcomes, such as redistribution and tax compliance (see in this direction Aidt et al.,2006 and Aidt and Jensen, 2009a). Furthermore, taxes and public expenditure should be jointly investigated, in order tocheck whether the democratization process affects them differently.
For all these reasons, to contribute to the empirical analysis of the relation between redistributive public policies andindicators of democracy, this paper (i) adopts country fixed effects regressions, (ii) analyzes both taxes and public spendingand (iii) investigates their composition, in addition to their total amount.
We focus on a sample of developing and low-income countries of three geographical areas: South-East Asia, Latin Americaand European Union during the 1990–2005 period. These countries have recently experienced a democratic and economictransition and hence represent an ideal laboratory for the study of the relationship between political regimes and tax andexpenditure systems. We build a new dataset where we collect data on fiscal and spending variables from different sources.3
In addition to the main macroeconomic indicators and several socio-economic and demographic variables, we include data onpolitical indicators. In particular we refer to a measure of the strength of democratic institutions and to an index of civil libertiesprotection from the PolityIV dataset and Freedom House respectively, two well-known sources in political economy studies.These two aspects of the political landscape allow us to capture two different dimensions of the concept of a liberal democracy,which broadly correspond to the concepts of positive and negative liberty. According to Berlin (1969), positive freedom, in itspolitical form, is the liberty that can be achieved through participation in the political process. As a consequence, a democraticcountry is free to the extent that its citizens actively participate in the decision making. On the other hand, negative freedom isrelated to the degree to which individuals or groups suffer some kind of interference from external bodies. In other words, thisconcept of liberty refers to the absence of obstacles, barriers or constraints to individual actions. We explore whether these twoconcepts have a different relationship with public finances.
Our dataset is a first attempt at collecting in a comprehensive and homogeneous fashion all the essential data for thestudy of taxation and public expenditure in these geographical areas. In fact, especially fiscal data for these countries aretypically sparse across different sources, are not directly available for researchers, and are often not homogeneous, thus mak-ing it difficult to compare and analyze them jointly.
We investigate the link between political variables and the structure of taxation and public spending using three differentempirical models: (i) cross-country pooled OLS regressions with region fixed effects, (ii) country fixed effects regressions and(iii) region specific regressions with country fixed effects. To make our results comparable with previous studies, we beginwith OLS cross-country pooled regressions. Interestingly, this specification confirms some of the results obtained in previouscontributions. However, these findings do not typically survive to a more demanding fixed effects specification, with the onlyexceptions of indirect, trade and property taxes. Also, the two different aspects of the political landscape on which we focusturn out to be differentially correlated with tax and spending and their composition. This result may be driven by the factthat the civil liberties index is associated with factors, such as freedom of association or freedom of press, which may alsofacilitate the emergence of lobbies and interest groups which exert pressure for a specific public policy outcome. Finally, insome cases the relationship between redistributive instruments and political variables appears to be region-specific. This lastresult is particularly interesting, since it suggests that redistributive policies may reflect specific patterns of economic and
2 See next section for a detailed review of the relevant theoretical and empirical literature.3 See the Data Appendix for details.
686 P. Profeta et al. / Journal of Comparative Economics 41 (2013) 684–718
political development of each area of the world, and that it is thus difficult to draw general lessons. All in all, the results are inline with the lack of clear theoretical predictions on the relation between public policies and democracy, which emergeswhen taking into account the complex multidimensionality of the redistributive policies, together with the role played bypolitical influence.
Our analysis may suffer from the typical identification and causality problem arising in this type of cross-country ap-proaches. However, even if we are not able to identify a causal link between democracy and redistributive public policies(tax and public expenditure), we do provide evidence that this link is less obvious than what claimed so far, and show thatthe relations found in previous contributions are not as strong as expected.4
Our results complement the analysis by Papaioannou and Siourounis (2008), who, exploiting a similar country fixed ef-fects design, find that successful democratic transitions are subsequently associated with a higher growth rate of real percapita income. While our research focus is different, our findings cast some doubt on the exact public policy mechanismsthrough which political institutions at large might affect economic performance.
Papaioannou and Siourounis (2008) point out that the effects of democratic transitions on economic growth do not gothrough sound fiscal policies (see Table 3 in their paper and the corresponding discussion on page 1536). Notice howeverthat, if the link between democratization and redistributive taxation (which may have a negative impact on growth) is foundto be weak –as our empirical analysis appears to suggest–, the relation between democracy and growth might find additionalsupport.
The paper is organized as follows: the next section contains an overview of the related literature, Section 3 provides adescription of the data, while Section 4 presents our econometric results, with some robustness checks. Finally, Section 5concludes.
2. Related literature
Many studies have considered the relation between democratization and public policies.Theoretical contributions typically represent democracies as a setting whereas citizens are allowed to vote and express
their preferences about public policies. An increase in the number of low-income voters – as triggered for example by anextension of the franchise – would change the position and the preferences of the median voter and move public policiesaway from the preferences of the rich. Thus, it seems possible to explain the size of government by emphasizing voters’demand for redistribution. This redistribution can take place both through an enlarged welfare state and through are-organized tax system, that more heavily relies on direct than on indirect taxation. In fact, democratization allows low-income groups to take part in the political process and, as a consequence, should be conducive to policies that favor thesegroups – such as those for the unemployed, sick, poor and the elderly – and would thus tend to promote equality. Instead,under a non-democratic regime the size of the public sector and the amount of redistributive spending is predicted to besmall, since a substantial part of the electorate is excluded from the decision-making process.
This standard prediction based on the median voter theorem has been however challenged in richer, more appropriatetheoretical settings. To the extent that the relevant policy space is multidimensional – as it is more realistic to assume iftaxes and public outlays are simultaneously taken into account and if each of them includes several items –, it becomes prob-lematic to apply the traditional median voter’s framework, as it is well known that a Nash equilibrium of the majoritarianvoting may fail to exist.5 The theory has to rely on different political economy mechanisms, such as probabilistic voting andlobbying models (see Profeta, 2002). In a probabilistic voting model, the issues of taxation and public expenditure can attractand shift votes, in particular those of non-ideological citizens (possibly a large part of the electorate), who typically decidewhich party to vote for by computing the advantages – in some cases, mainly the fiscal ones – that they could enjoy from thisparty with respect to the opponents (Hettich and Winer, 1999; Profeta, 2007). As the swing voter rather than the median voterbecomes decisive, the strong association between democracy and the demand for redistribution predicted by the median votertheorem is no longer necessarily confirmed.
Moreover, in weak democracies the process underlying public policies decisions can be even much more difficult to ana-lyze and predict. Tridimas and Winer (2005) emphasize that, apart from the demand (and the supply) side on the ‘‘electoralmarket’’, political influence by itself is likely to be important.6 Economically and politically powerful interest groups tend toshape public policies outcomes in a more pervasive way than in consolidated democracies by acting as veto players. Generallyspeaking, the predictions of probabilistic voting models on the shape and size of redistributive public policies depend on thecorrelation between the income and political influence of the various subgroups within the population. The trade-off betweenthe existence of representative political institutions and the political influence exerted by specific pressure groups may generate
4 Our reduced form estimates treat political variables as exogenously given. However, citizens or elites might use democratic governance to induce somedesired fiscal policy outcomes. We do not have a clear-cut instrumental variables strategy to deal with this issue and thus the reverse causality problem is notsolved. Nevertheless in our specification reverse causality would imply that a specific tax (or public expenditure item) may change the political system of acountry, an argument not so intuitive. Of course, even if the inclusion of country fixed effects would absorb time-invariant factors at the country level, omittedvariable bias might still be an issue, to the extent that those unobserved factors vary across time within a given country.
5 Notice also that the empirical validity of the median voter’s model has been challenged in other contexts too. The relation between inequality andredistribution is for instance a very debated one and the empirical evidence is not always consistent with median voter’s hypotheses (see, among the others,Perotti, 1996 and Milanovic, 2000).
6 See also Gould and Baker (2002).

Table 1The empirical literature on democracy and redistribution.
Between countries Within country
Historical Lindert (1994, 2004) Aidt et al. (2006)Boix (2003) Kim (2007)Aidt and Jensen (2009b) Ferris et al. (2008)
Aidt and Jensen (2009a)Aidt and Eterovic (2011)Aidt et al. (2010)
Modern Hicks and Swank (1992) Husted and Kenny (1997)Habibi (1994)Boix (2001, 2003, chapter 5)Martin and Plümper (2003)Hausken et al. (2004)Mulligan et al. (2004)Kenny and Winer (2006)Profeta and Scabrosetti (2010)
P. Profeta et al. / Journal of Comparative Economics 41 (2013) 684–718 687
non unambiguous results in terms of the size of public policies (Becker, 1983). Moreover, the relevant role played by veto play-ers in weak democracies might further complicate the picture.
As the theory does not deliver clear predictions, we have already emphasized the importance of the empirical side of theanalysis.7 The empirical studies that have tested the link between democracy and redistributive public policies can be classifiedaccording to two main dimensions: the time period covered by the analysis and the chosen estimation approach (see Table 1).First, it is important to draw a distinction between modern studies, which refer to time periods post-World War II, and historicalones, which on the contrary focus on a longer time period and investigate what happened during the 19th and 20th century. Infact, early democratization experiences were generally gradual and piecemeal, while many of the later democratization epi-sodes are more abrupt and shift societies very quickly from autocracy to democracy.8 According to the second dimension wedistinguish between cross-country and within country analyses. Studies on within-country differences are used to help in iden-tifying the link between democracy and redistribution.9 No previous studies compare results across these two approaches.
Our empirical study, which refers to both taxes and public outlays, and which investigates not only the level, but also thecomposition of both sides of the public budget, can be classified in the category of modern within country studies.
Among the existent empirical analyses the consensus on the positive relation between democratization and redistribu-tion is not unanimous. Following Hicks and Swank (1992) and Husted and Kenny (1997), high voter turnout can help to ex-plain government welfare efforts. In particular, Habibi (1994) suggests that more democratic countries tend to spend moreon social programs and less on defense, while Boix (2001, 2003) finds that a significant share of the public sector actuallydepends on the political (democratic) regime in place, which also interacts with the distribution of income, citizens’ prefer-ences and economic conditions. Along these lines, Aidt et al. (2006) and Bertocchi (2010) underline a significant relation be-tween the extension of the voting franchise and the size of government.10 Aidt and Eterovic (2011) show instead that politicalcompetition appears to be negatively correlated with government size, while the opposite is true for political participation. Onthe same topic, Ferris et al. (2008) find that, by enhancing the ability of interest groups and politicians to extract rents, lesscompetition leads temporarily to a larger public sector. Moreover, Martin and Plümper (2003) and Hausken et al. (2004) finda U-shaped relationship between democracy and public spending. They argue that for low levels of democracy public spendingis high to meet the requests of rents by the elites, while for high levels of democracy the usual median voter’s model predictionapplies and public spending is high due to popular demand of public goods. For medium levels of democracy, however, none ofthese pressures is active and government spending is at its minimum.11 On a contrary note, Mulligan et al. (2004) show that
7 When addressing this issue from an empirical view point, the concept of democracy becomes problematic to define, as we will explain in Section 3. Morespecifically, one should distinguish between political rights and civil liberties. On theoretical grounds, to the best of our knowledge, previous contributionsabout the effects of broadly defined democratic rights on economic and political outcomes do not attempt at disentangling the potentially differentconsequences of democratic and civil liberties. This is probably due to the fact that the two concepts of democratic and civil liberties are intrinsicallyintertwined in people’s mind, in the sense that people talk about a ‘‘democracy’’, but they are really thinking about a ‘‘liberal democracy’’ , i.e. a democracywhich protects citizens’ liberties. These differences are only discussed in the political science and political philosophy literature (see Berlin, 1969 and Dahl,1971).
8 However, the lessons from historical studies and post-war studies concerning the relation between democracy and redistribution are generallyqualitatively similar.
9 In Table 1 we have listed previous studies that adopt a specification with country fixed effects. Within this set of papers, Kim (2007), Aidt and Jensen(2009a) and Aidt et al. (2010) are the ones that adopt an instrumental variable approach to try to identify the causal effects of democracy on redistribution.
10 Bertocchi (2010) argues that women disenfranchisement entails a social cost. At the same time, women enfranchisement leads to a higher tax rate becauseof the wage gap and women’s preferences on public goods. As a consequence, the impact of the extension of voting rights to women on the size of welfare statewill be higher in progressive than in conservative and catholic countries. Moreover, Lindert (1994, 2004) shows that extending the franchise to the poor is a keydriving force to open the door to politicians that care about redistributive policies, while Kim (2007) suggests the existence of a link between a threat ofrevolution, democratization and social insurance expansion.
11 A U-shaped relationship between spending on local public goods and the extension of the voting franchise in municipal boroughs in England and Wales isalso found by Aidt et al. (2010). According to the authors, franchise extension can be associated with smaller government. Local democracy can be a source ofretrenchment especially when taxes are not related to benefits of spending.
688 P. Profeta et al. / Journal of Comparative Economics 41 (2013) 684–718
none of the measures of public spending that they consider (government consumption, education spending and social spending,as a percentage of GDP) is statistically different in democracies and non democracies.12
The empirical literature that has specifically focused on the correlation between indicators of democracy and the struc-ture of taxation typically investigates whether more democratic countries rely more heavily on personal income taxation,rather than corporate or trade taxes. Even in this case results are not unanimous. From a theoretical point of view Wintrobe(1990, 1998) suggests that democratic countries, since they can rely less on repressive measures as governing instruments,have to design tax systems that induce more voluntary tax compliance.13 Mature democracies will thus be more heavily char-acterized by revenue sources such as self-assessed personal income taxation. On the other hand, more repressive governmentsthat cannot depend on tax sources requiring a certain level of voluntary cooperation move toward corporate taxes or tradetaxes. This is also in line with the classical prediction of Musgrave (1969) that more autocratic countries, which directly controlthe economy and in particular the wage level, rely more on corporate rather than on individual taxes, as compared to moredemocratic ones. By the same token, a recent work by Kenny and Winer (2006), explicitly devoted to the analysis of the struc-ture of taxation in a large sample of democratic and non-democratic countries, shows that a stronger protection of politicalrights and civil liberties leads to a more intensive use of personal income taxation. Profeta and Scabrosetti (2010) extend theanalysis of Kenny and Winer (2006) to a broader set of developing countries in the period 1990–2004 and, by using pooledOLS regressions, find that democracy and civil rights protection are positively correlated with the level of tax revenue andthe amount of direct taxes. At the same time, Aidt and Jensen (2009a) show that in a sample of western European countriesduring the 1860–1938 period political competition increased total revenue and the share of direct taxes, while it reducedthe share of market taxes. On the contrary, according to Mulligan et al. (2004) democracies have flatter personal income taxstructures and a generally lower tax revenue/GDP ratio than non-democracies, while Aidt and Jensen (2009b) find evidenceof a surprisingly negative (initial) relation between the extension of the franchise and the likelihood of the introduction of in-come taxation. Only when the franchise surpasses a specific threshold a further extension of the number of voters makes it morelikely that income tax will be levied.
Finally, the theoretical and empirical literatures have also emphasized that some fundamental economic variables, mainlyGDP, may play a crucial role in determining the level of taxation and public spending, as well as their composition (Hinrichs,1966; Tanzi, 1992). Musgrave (1969) argues that the lack of availability of ‘‘tax handles’’ might limit revenue collection atlow levels of income. Moreover, according to Wagner’s law (Wagner, 1883), economic development is associated with anincreased demand for public expenditure (Tanzi, 1987). Not only economic development widens the tax base, but it also im-proves administrative capacity to levy and collect taxes (Chelliah, 1971). Additional socio-economic variables that may havean impact on the level and the composition of both taxation and public outlays are: the level of government debt, the shareof agriculture on value added, trade openness, and the percentage of elderly people on the total population (Tanzi, 1992;Burgess and Stern, 1993; Ghura, 1998; Rodrik, 1998; Gupta et al., 2004).14 Moreover, as explained by Kenny and Winer(2006) female labor force participation is among the factors affecting the size of the potential tax bases: when a larger shareof the female population works, the tax base is larger and thus revenue may increase. Female labor force participation, in otherwords, enlarges the supply of taxable activities, which may contribute to explain the size of government (Tridimas and Winer,2005).
As a consequence, all these socio-economic variables must be taken into account when studying the relation betweenpolitical variables, the level of taxation and public spending, as well as their composition.
3. Data description
Since we are interested in the analysis of the relation between political variables, taxation and government spending, weshould first of all clarify how we can measure democracy. There is in fact a large debate among political scientists on theexact definition of what constitutes a democracy. The definition proposed by Schumpeter (1942) is generally accepted asa starting reference point: ‘‘[ . . . ] democracy is the institutional arrangement for arriving at political decisions in which indi-viduals acquire the power to decide by means of a competitive struggle for the people’s vote’’. This definition suggests thatdemocracy is identified by specific institutions, which guarantee free and fair elections, the accountability of politicians tothe electorate and free entry in politics. However, how to measure these institutional conditions is neither obvious nor clear.
There are at least two major issues to consider. First, as we emphasize in this paper, democracy is a multidimensionalconcept, so that it is difficult to measure it using a single variable. Already in the 1970s Dahl (1971) suggested that theconcept of democracy involves at least three dimensions: public contestation, right to participate and civil liberties. How-ever, most of the studies on the relation between public policies and democracy do not refer to this multidimensionalityand use a single variable to measure democracy. Second, political science scholars are divided between those who favor asimple dichotomous classification, i.e. a country is either democratic or not (Przeworski et al., 2000), and those who developa continuous measure of democracy that is based on a specific index. It is out of our scope to solve this controversy. While weconsider the dichotomous definition useful, especially when a transition should be analyzed, in this paper we will mainly
12 They also find that democracies are less likely to erect political entry barriers (such as torture, death penalty, press censorship, regulation of religion andmaintaining an army, see Tullock, 1987) than non democracies.
13 See also de Juan et al. (1994), Pommerehne and Weck-Hannemann (1996), Alm (1996) and Feld and Frey (2002).14 Again, these variables might work as a proxy for the availability of the various revenue sources.

Table 2Summary statistics.
Variable No of obs. Mean Median Std. dev. Min Max
Tax revenue variables (over GDP)Tax revenue 569 17.681 14.5 9.064 2.5 46Personal income tax 391 2.377 1.4 2.389 0 9.2Corporate income tax 424 2.536 2.1 1.987 0.01 18.22Direct taxes 563 4.727 3.88 3.019 0.42 23.08Indirect taxes 566 7.024 6.13 3.405 0.42 17.9Property taxes 420 0.379 0.16 0.486 0 2.05Trade taxes 554 1.886 1.545 1.628 0.01 15.3Social security contributions 444 4.506 1.92 4.900 0 18.6
Public spending variables (over GDP)Total government expenditure 427 22.010 20.13 8.378 6.3 56.08General public services 341 6.120 4.93 3.884 1.18 31.65Defense expenditure 346 1.608 1.35 1.155 0 5.57Health expenditure 346 1.996 1.37 1.929 0 7.67Education expenditure 346 2.691 2.905 1.454 0.01 5.54Social protection expenditure 341 5.279 3.08 5.494 0 21.07Public order expenditure 318 1.123 1.1 0.656 0 3.52
Political variablesPolity 2 index 569 16.200 18 4.618 3 20Civil liberties index 569 4.787 5 1.373 1 7Economic controlsGDP per worker 497 15.904 14.111 9.918 2.830 58.750Trade openness index 529 72.548 62.900 39.796 10.600 214.400Government debt/GDP 524 50.188 43.150 39.511 2.500 304.500Agriculture/GDP 519 11.974 9.800 7.413 0.100 34.800Female labor force participation 569 46.666 47.700 11.564 11.200 75.600Old age population 569 6.845448 5.2 3.71383 3.18 16.59
Notes: tax revenue and public expenditure variables are expressed as percentages with respect to GDP. The rescaled Polity 2 index takes on values on the[0,20] range, with higher values for stronger democratic institutions. The civil liberties index is taken from Freedom House and recoded on a [1,7] range,with larger values denoting stronger protection of civil liberties. See the text for additional details. GDP per worker is expressed in thousands of PPP dollars.
P. Profeta et al. / Journal of Comparative Economics 41 (2013) 684–718 689
refer to continuous measures of democracy, which allows us to capture more features of a political regime. Thus, we havedecided to focus on these two measures: the POLITY2 index, as found in the Polity IV dataset, and the civil liberties indicator,included in the Freedom House dataset.15
Differently from the political rights index, the civil liberties index is meant to measure the broader set of ‘‘liberties’’ guar-anteed to individuals within their polity. From this point of view, the concept of civil liberties does not necessarily overlapwith the one of democratic institutions, and could play an independent role as an explanatory variable for the composition ofboth tax revenue and government spending. In fact, the difference between positive and negative liberty has to be taken intoaccount (Berlin, 1969). The civil liberties index can thus be considered as a proxy for Berlin’s concept of negative freedom,while the POLITY2 indicator is associated with the one of positive freedom.16,17
We include countries in our sample if they satisfy all the following criteria:
1. the country is defined as developing by the IMF (2010);2. the country belongs to one of the following geographical areas: European Union, Latin America and South-East Asia18;3. the country has a GDP PPP higher than 10 billions of USD in 2010;4. data on public expenditure and taxation is available in our sources, as specified below and in the Data Appendix.
15 The POLITY2 indicator is not an ideal measure. Plümper and Neumayer (2010) show that it entails some problematic aspects, especially during transitions.Cheibub et al. (2010) suggest that parts of the middle range of the POLITY2 indicator is close to representing random noise and that a dichotomous measure ofdemocracy, such as the one originally provided by Alvarez et al. (1996) and then extended by Cheibub et al. (2010), should be preferred if one cannot clearlyunderstand how intermediate scores are calculated. Although we are aware of these limitations, we consider the POLITY2 index a reliable indicator to capturegradual variations in the political variables. In order to avoid negative values, which may be problematic in non-linear specifications, we transform the originalPOLITY2 variable so that our variable takes on values from 0 to 20.
16 Notice that in general the choice of the index of political regime is a complex one. Our two variables capture the two concepts of democracy identified byBerlin (1969), i.e. positive and negative freedom, which we consider a useful guide for identifying essential features of democracy that are relevant in ourcontext. Other indicators have been built in this area of research to capture other dimensions of democracy, such as the Vanhanen index of democracy (see Aidtand Eterovic, 2011). Yet the two measures that we draw from PolityIV dataset and Freedom House are available for a longer time span. For example, the lastyear available for the Vanhanen index is 2000, while the starting year varies country by country.
17 The concept of positive freedom seems to have two dimensions: contestability of power and electoral participation. The POLITY2 index is largely a measureof the former, while it does not capture the aspect of voting rights. For example, it does not code up major reforms concerning women’s suffrage. However,given the relative recent and short time period covered by our analysis, this is less of a concern, as any shifts in the index in the sample of new democracieswould come with the entire package of institutions (both contested elections and full suffrage). In other words, countries with a POLITY2 index equal to 20which exclude half the population from the voting process can only be found adopting a historical perspective, i.e. is a longer time span.
18 We do not consider developing African countries because of data availability problems.

690 P. Profeta et al. / Journal of Comparative Economics 41 (2013) 684–718
At the end our sample of countries includes: China, India, Indonesia, the Republic of Korea, Malaysia, Pakistan, Philippines,Singapore, Sri Lanka, Thailand and Vietnam for South-East Asia; Argentina, Bolivia, Brazil, Chile, Colombia, Costa Rica,Dominican Republic, Ecuador, El Salvador, Guatemala, Haiti, Honduras, Mexico, Nicaragua, Panama, Paraguay, Peru, Uruguayand Venezuela for Latin America; for the EU, all countries that joined it in 2004, with the exception of Malta, due to lack ofpolitical data.
Data on taxes are gathered from different sources: IMF for South-East Asia, CEPAL for Latin America and EUROSTAT for EU.We collect data on tax revenue/GDP, but also on its structure, that is personal and corporate income taxes, property andtrade taxes, social security contributions as a percentage of GDP. Moreover, by reclassifying specific tax items, we also at-tempt at homogenizing the aggregated categories of direct and indirect taxes across different data sources.
Data on public expenditure come from IMF. In this case too we collect data on total government outlays/GDP, but also onits composition, that is general public services, defense, health, education, social protection and public order expenditure as apercentage of GDP.19
In the Data Appendix we also describe the socio-economic and demographic control variables used in the analysis. Fol-lowing the literature (see Section 2) we include GDP per worker, the sum of imports and exports on GDP (trade openness),government debt on GDP, the share of agriculture on GDP, the female labor force participation rate, and the share of elderlypeople on total population. One could also argue that female labor force participation might be related with the relative sizeof the informal sector of the economy for each country in each year. Although the relation between female LFP and the size ofthe informal economy is difficult to prove, due to data availability, it may be the case that, especially in developing countries,women are employed more in the informal sector, and thus a lower female LFP in the formal sector might proxy for a largerrelative size of the informal sector. This argument helps mitigating the concerns about understating the actual size of eacheconomy by only focusing on official GDP figures.20
Table 2 presents the summary statistics of all relevant variables for the 1990–2005 period.
4. Results
We estimate three different empirical models: the first one is a pooled OLS regression described by the followingequation:
19 Dat20 We
Yit ¼ bt þ cPOLITY2it�1 þ dCIVit�1 þ controlsit�1 þ LatinAmericai þ Asiai þ �it ð1Þ
where Yit is the tax revenue or total expenditure (or a specific tax/expenditure source) over GDP collected in country i in yeart, POLITY2it�1 is the measure of democracy according to the Polity IV dataset (2007) in country i in year t � 1, CIVit�1 is thelevel of the (inverted) Freedom House Index of civil liberties protection in country i in year t � 1, bt is a year fixed effect,controlsit�1 are socio-economic control variables, LatinAmericai and Asiai are dummy variables for Latin American andSouth-East Asian countries respectively, and �it is the error term. European developing countries are our excluded categoryof countries. It seems reasonable to use a one-period lag for the political and socio-economic variables we include as regres-sors in our specifications. This is the case, since the effects of those variables on taxation and expenditure are likely not to beimmediate. This first model allows us to make comparisons with previous studies, and to understand whether in developingcountries we can observe some specific relations.
In the second model we include country fixed effects (ai), i.e. we estimate the following equation:
Yit ¼ ai þ bt þ cPOLITY2it�1 þ dCIVit�1 þ controlsit�1 þ �it ð2Þ
Since in this model we include country and year fixed effects, our estimates exploit the fact that different countries haveor have not experienced a change in the strength of democratic institutions or in the level of civil liberties protection. Here,our econometric approach is close to Papaioannou and Siourounis (2008), since we similarly exploit the within-country var-iation in measures of democracy and civil liberties and correlate it with the dependent variable of interest. Of course, thecrucial difference is that they aim at estimating the impact of democracy on economic growth, while we focus on interme-diate outcomes like tax revenue, public expenditure and their composition.
Finally, our third model corresponds to the previous one, but we estimate a separate regression for each of the threeworld areas under consideration, since we assume that the relation between political and redistributive variables may followdifferent paths area-by-area.
Notice that our dependent variables are defined as a share of tax and spending items with respect to GDP. Alternativelywe could use as dependent variables the share of each tax item on total tax revenue and the share of each public spendingitem on total government expenditure. Results of this alternative specification are available in the Appendix. In the followingwe remain with the specification of tax and spending items as percentage of GDP. This reduces the possibility that thedenominator of our dependent variables is influenced by the political variables of interest.
Our results on taxation are shown in Tables 3–5, while the ones on government spending are shown in Tables 7–9. In aparallel fashion, Tables 3 and 7 refer to our first empirical model (pooled OLS), Tables 4 and 8 to the second one (country
a availability induces us to refer to total government rather than central government.thank an anonymous referee for this suggestion.

P. Profeta et al. / Journal of Comparative Economics 41 (2013) 684–718 691
fixed effects regressions), while Tables 5 and 9 to the last one (region specific regressions with country fixed effects). Noticethat in each table we exclude Indonesia, which appears to be an influential outlier in the analysis. This is the country of oursample that experienced the largest (positive) change in the level of democracy, following the demise of the Suharto regime.
Tables 3,4,7 and 8 are organized in the following way: the different columns are devoted to different tax sources or publicspending items, with the first column respectively focusing on tax revenue over GDP and total government expenditure overGDP. In each column we stack the regression output by enlarging step by step the set of controls. In the first specification wesimply control for GDP per worker, while in the second one –following Habibi (1994), Martin and Plümper (2003) andHausken et al. (2004)– we add the square of the POLITY2 index. This is meant to identify a possible non-linear relationbetween the democracy and both taxation and public spending. Finally in the last and most demanding specification weadd as controls the trade openness index, government debt over GDP, the share of agriculture over GDP, female labor forceparticipation and the share of old population.21 On the other hand, the different columns of Tables 5 and 9 show for each tax orspending item the different findings for each of the three areas we investigate. Since the error term might be serially correlatedwithin countries (even after controlling for country fixed effects) and thus wrongly inflate the precision of our estimates, for allspecifications we cluster the standard errors at the country level (see Bertrand et al., 2004). The corresponding t-statistic isdisplayed below each coefficient.
4.1. Taxation
We start from our results on taxation. As shown in Table 3, we do not find any significant link between overall tax revenueand both civil liberties protection and democratic institutions. Looking at the structure of taxation, in the case of personalincome tax there is a positive and significant relation with civil liberties protection, only mildly so in the first specification.This result is in line with Wintrobe (1990, 1998) and Kenny and Winer (2006). Corporate taxation is negatively correlatedwith civil liberties, but significantly so only in the second specification. This first set of results appears to support the ideathat countries which guarantee more civil liberties (i.e. a higher degree of negative freedom) can require the taxpayers to payback higher personal income taxes. On the contrary, corporate taxes are typically more used in autocracies which tend not toprotect individual liberties.
Because of the opposite signs in the relationship between civil liberties and personal and corporate income taxationrespectively, not surprisingly the correlation between civil liberties and direct taxes is not statistically significant at ordinaryconfidence levels. Moreover, we find a positive and significant correlation between indirect taxes and the civil liberties indexin all specifications. This could be explained by the redistributive -although modest- nature of indirect taxes, due for instanceto higher tax rates for goods typically consumed by high income groups. Social security contributions are instead negativelyrelated to the civil liberties protection only in the third and more demanding specification.
Regarding the democracy index (i.e. the level of positive freedom), the results are not unambiguous. If we look at personalincome taxes, there are some signs of an inverted U-shaped relationship (second specification) with the POLITY2 index, whilewe find no statistically significant relationship for corporate income taxes. Finally, there is a positive and significant linearrelationship between social security contributions and the POLITY2 index in the first specification. Thus, the standard viewthat redistributive welfare states are more generous – through the pension system – in democracies than in autocracies isconfirmed only when we consider the strength of democratic institutions and we do not control for the main socio-economicvariables.
To gauge the magnitude of our most robust results, we proceed as follows. First, we calculate the standard deviation ofour political variables within regions or countries, depending on the specification. Then we compute the effect of a standarddeviation increase in the political variables on our dependent variables in relative terms, i.e. by dividing the estimated effectby the standard deviation of the former.22 In other words, we are measuring by what percentage of its standard deviation thedependent variable would change if there is a one-standard deviation increase in each significant political variable.23 More spe-cifically, we find that a one standard deviation increase in the civil liberties score is on average associated with an increase in theshare of personal income taxes over GDP which is between 30% and 40% of a standard deviation, depending on the exactspecification. A one standard deviation increase in civil liberties implies a similar relative increase (from 31% to 35% of a stan-dard deviation) in the level of indirect taxes over GDP. According to second specification, we find a significant, inverted U-shaped relationship between the democracy score and personal income taxation.24 When the democracy score is one standarddeviation below (above) its maximizing level, we find that a one standard deviation increase in the score is associated with a43% of a standard deviation increase (decrease) in the level of personal income taxes.
21 To avoid endogeneity problems, which may become particularly serious in the fixed effects specification, we have decided not to control for total revenueand total government expenditure. The cost of this exclusion is that we are not able to discuss the scale effect (Kenny and Winer, 2006).
22 For reasons of space, in Table 3 we report the standard deviations of our taxation and political variables only for the sample on which we run the first, moreparsimonious specification. Those standard deviations are very similar in magnitude for the second and third specifications subsamples. The same applies toTables 4, 7 and 8.
23 The calculation is slightly more complicated when the estimated effect of the democracy score is found to be non linear. In this case, we would first identifythe value of the POLITY2 score for which the dependent variable does reach its minimum or maximum. Second, we would compute the relative effect of a one-standard deviation increase in the democracy score when the score itself is one-standard deviation above or below its minimum or maximum. Of course, sincewe are using a quadratic specification, the estimated relationship is by definition symmetric around the minimum or maximum, and the marginal effects thatare calculated at the same distance from that point have the same absolute value.
24 According to our estimates, personal income taxes over GDP reach a conditional maximum when POLITY2 is around 11 and 12, on a [0, 20] range.
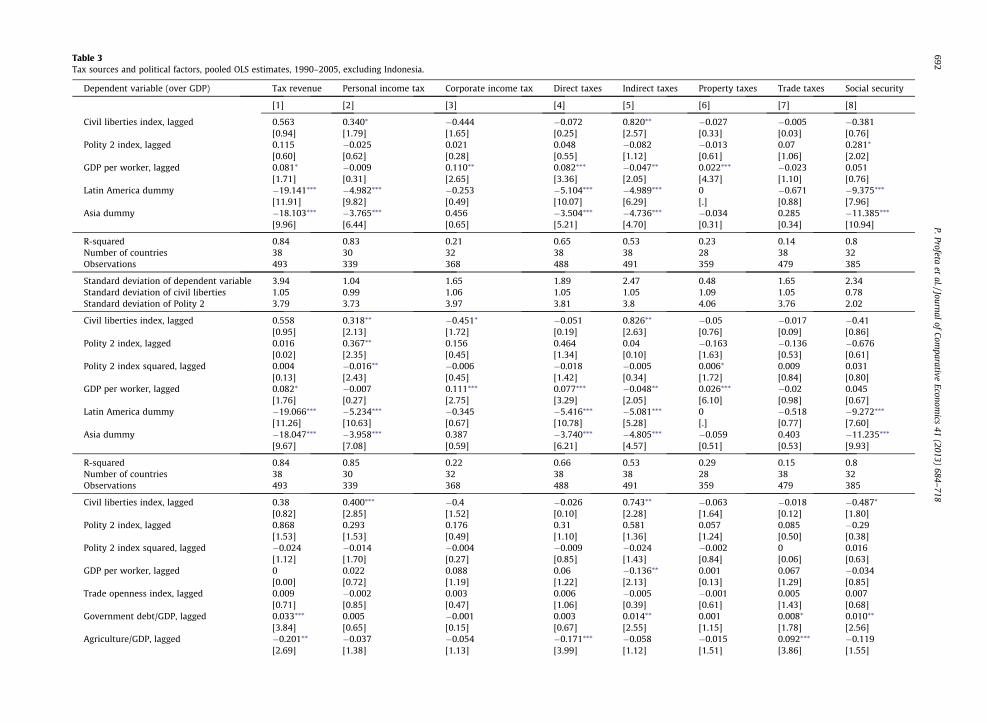
Table 3Tax sources and political factors, pooled OLS estimates, 1990–2005, excluding Indonesia.
Dependent variable (over GDP) Tax revenue Personal income tax Corporate income tax Direct taxes Indirect taxes Property taxes Trade taxes Social security
[1] [2] [3] [4] [5] [6] [7] [8]
Civil liberties index, lagged 0.563 0.340⁄ �0.444 �0.072 0.820⁄⁄ �0.027 �0.005 �0.381[0.94] [1.79] [1.65] [0.25] [2.57] [0.33] [0.03] [0.76]
Polity 2 index, lagged 0.115 �0.025 0.021 0.048 �0.082 �0.013 0.07 0.281⁄
[0.60] [0.62] [0.28] [0.55] [1.12] [0.61] [1.06] [2.02]GDP per worker, lagged 0.081⁄ �0.009 0.110⁄⁄ 0.082⁄⁄⁄ �0.047⁄⁄ 0.022⁄⁄⁄ �0.023 0.051
[1.71] [0.31] [2.65] [3.36] [2.05] [4.37] [1.10] [0.76]Latin America dummy �19.141⁄⁄⁄ �4.982⁄⁄⁄ �0.253 �5.104⁄⁄⁄ �4.989⁄⁄⁄ 0 �0.671 �9.375⁄⁄⁄
[11.91] [9.82] [0.49] [10.07] [6.29] [.] [0.88] [7.96]Asia dummy �18.103⁄⁄⁄ �3.765⁄⁄⁄ 0.456 �3.504⁄⁄⁄ �4.736⁄⁄⁄ �0.034 0.285 �11.385⁄⁄⁄
[9.96] [6.44] [0.65] [5.21] [4.70] [0.31] [0.34] [10.94]
R-squared 0.84 0.83 0.21 0.65 0.53 0.23 0.14 0.8Number of countries 38 30 32 38 38 28 38 32Observations 493 339 368 488 491 359 479 385
Standard deviation of dependent variable 3.94 1.04 1.65 1.89 2.47 0.48 1.65 2.34Standard deviation of civil liberties 1.05 0.99 1.06 1.05 1.05 1.09 1.05 0.78Standard deviation of Polity 2 3.79 3.73 3.97 3.81 3.8 4.06 3.76 2.02
Civil liberties index, lagged 0.558 0.318⁄⁄ �0.451⁄ �0.051 0.826⁄⁄ �0.05 �0.017 �0.41[0.95] [2.13] [1.72] [0.19] [2.63] [0.76] [0.09] [0.86]
Polity 2 index, lagged 0.016 0.367⁄⁄ 0.156 0.464 0.04 �0.163 �0.136 �0.676[0.02] [2.35] [0.45] [1.34] [0.10] [1.63] [0.53] [0.61]
Polity 2 index squared, lagged 0.004 �0.016⁄⁄ �0.006 �0.018 �0.005 0.006⁄ 0.009 0.031[0.13] [2.43] [0.45] [1.42] [0.34] [1.72] [0.84] [0.80]
GDP per worker, lagged 0.082⁄ �0.007 0.111⁄⁄⁄ 0.077⁄⁄⁄ �0.048⁄⁄ 0.026⁄⁄⁄ �0.02 0.045[1.76] [0.27] [2.75] [3.29] [2.05] [6.10] [0.98] [0.67]
Latin America dummy �19.066⁄⁄⁄ �5.234⁄⁄⁄ �0.345 �5.416⁄⁄⁄ �5.081⁄⁄⁄ 0 �0.518 �9.272⁄⁄⁄
[11.26] [10.63] [0.67] [10.78] [5.28] [.] [0.77] [7.60]Asia dummy �18.047⁄⁄⁄ �3.958⁄⁄⁄ 0.387 �3.740⁄⁄⁄ �4.805⁄⁄⁄ �0.059 0.403 �11.235⁄⁄⁄
[9.67] [7.08] [0.59] [6.21] [4.57] [0.51] [0.53] [9.93]
R-squared 0.84 0.85 0.22 0.66 0.53 0.29 0.15 0.8Number of countries 38 30 32 38 38 28 38 32Observations 493 339 368 488 491 359 479 385
Civil liberties index, lagged 0.38 0.400⁄⁄⁄ �0.4 �0.026 0.743⁄⁄ �0.063 �0.018 �0.487⁄
[0.82] [2.85] [1.52] [0.10] [2.28] [1.64] [0.12] [1.80]Polity 2 index, lagged 0.868 0.293 0.176 0.31 0.581 0.057 0.085 �0.29
[1.53] [1.53] [0.49] [1.10] [1.36] [1.24] [0.50] [0.38]Polity 2 index squared, lagged �0.024 �0.014 �0.004 �0.009 �0.024 �0.002 0 0.016
[1.12] [1.70] [0.27] [0.85] [1.43] [0.84] [0.06] [0.63]GDP per worker, lagged 0 0.022 0.088 0.06 �0.136⁄⁄ 0.001 0.067 �0.034
[0.00] [0.72] [1.19] [1.22] [2.13] [0.13] [1.29] [0.85]Trade openness index, lagged 0.009 �0.002 0.003 0.006 �0.005 �0.001 0.005 0.007
[0.71] [0.85] [0.47] [1.06] [0.39] [0.61] [1.43] [0.68]Government debt/GDP, lagged 0.033⁄⁄⁄ 0.005 �0.001 0.003 0.014⁄⁄ 0.001 0.008⁄ 0.010⁄⁄
[3.84] [0.65] [0.15] [0.67] [2.55] [1.15] [1.78] [2.56]Agriculture/GDP, lagged �0.201⁄⁄ �0.037 �0.054 �0.171⁄⁄⁄ �0.058 �0.015 0.092⁄⁄⁄ �0.119
[2.69] [1.38] [1.13] [3.99] [1.12] [1.51] [3.86] [1.55]
692P.Profeta
etal./Journal
ofCom
parativeEconom
ics41
(2013)684–
718

Female labor force participation, lagged 0.047 0.007 �0.004 0.003 0.031 �0.001 0.011 0.039[1.41] [0.60] [0.22] [0.21] [1.13] [0.16] [0.84] [1.56]
Old age population, lagged 0.552 �0.073 �0.201 �0.439⁄⁄ 0.541⁄⁄⁄ 0.126⁄⁄⁄ �0.072 0.589⁄⁄⁄
[1.31] [0.82] [1.17] [2.65] [2.89] [6.28] [0.68] [3.55]Latin America dummy �16.247⁄⁄⁄ �5.346⁄⁄⁄ �1.459 �7.326⁄⁄⁄ �1.83 0.058 �1.337 �5.979⁄⁄⁄
[5.08] [7.82] [1.14] [6.36] [1.18] [1.11] [1.15] [4.87]Asia dummy �14.972⁄⁄⁄ �3.746⁄⁄⁄ �0.628 �5.140⁄⁄⁄ �1.507 0 �0.702 �8.319⁄⁄⁄
[5.09] [4.98] [0.49] [4.34] [1.08] [.] [0.62] [6.78]R-squared 0.91 0.86 0.31 0.74 0.57 0.48 0.33 0.91Number of countries 32 25 27 32 32 25 32 28Observations 396 282 311 391 394 303 387 323
Country fixed effects No No No No No No No NoYear fixed effects Yes Yes Yes Yes Yes Yes Yes Yes
Notes: the table displays the output of fixed effects regressions with tax revenue and different categories thereof (as a fraction of GDP) as dependent variables. Each column is devoted to a different revenue source,with different specifications being stacked in the same column. With the purpose of calculating the magnitude of estimated effects, for the first specification we also report the standard deviations of thedependent variables and the political variables. The civil liberties index takes on values on the [1,7] range, with higher values denoting stronger protection of civil liberties. The Polity 2 index takes on values onthe [0, 20] range, with higher values for stronger democratic institutions. See the text for details. GDP per worker is expressed in thousands of PPP dollars. Region dummies are included, with New EU members asthe excluded category. Standard errors are clustered at the country level, and the corresponding t-statistics are reported in brackets below each coefficient.⁄ Significant at 10%.⁄⁄ Significant at 5%.⁄⁄⁄ Significant at 1%.
P.Profetaet
al./Journalof
Comparative
Economics
41(2013)
684–718
693
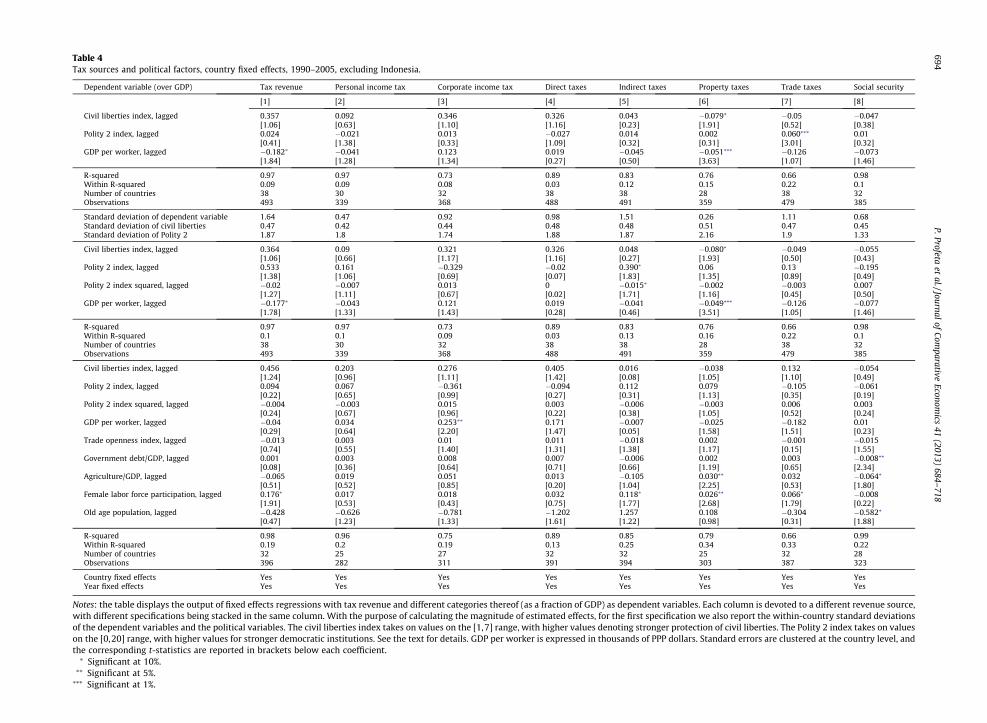
Table 4Tax sources and political factors, country fixed effects, 1990–2005, excluding Indonesia.
Dependent variable (over GDP) Tax revenue Personal income tax Corporate income tax Direct taxes Indirect taxes Property taxes Trade taxes Social security
[1] [2] [3] [4] [5] [6] [7] [8]
Civil liberties index, lagged 0.357 0.092 0.346 0.326 0.043 �0.079⁄ �0.05 �0.047[1.06] [0.63] [1.10] [1.16] [0.23] [1.91] [0.52] [0.38]
Polity 2 index, lagged 0.024 �0.021 0.013 �0.027 0.014 0.002 0.060⁄⁄⁄ 0.01[0.41] [1.38] [0.33] [1.09] [0.32] [0.31] [3.01] [0.32]
GDP per worker, lagged �0.182⁄ �0.041 0.123 0.019 �0.045 �0.051⁄⁄⁄ �0.126 �0.073[1.84] [1.28] [1.34] [0.27] [0.50] [3.63] [1.07] [1.46]
R-squared 0.97 0.97 0.73 0.89 0.83 0.76 0.66 0.98Within R-squared 0.09 0.09 0.08 0.03 0.12 0.15 0.22 0.1Number of countries 38 30 32 38 38 28 38 32Observations 493 339 368 488 491 359 479 385
Standard deviation of dependent variable 1.64 0.47 0.92 0.98 1.51 0.26 1.11 0.68Standard deviation of civil liberties 0.47 0.42 0.44 0.48 0.48 0.51 0.47 0.45Standard deviation of Polity 2 1.87 1.8 1.74 1.88 1.87 2.16 1.9 1.33
Civil liberties index, lagged 0.364 0.09 0.321 0.326 0.048 �0.080⁄ �0.049 �0.055[1.06] [0.66] [1.17] [1.16] [0.27] [1.93] [0.50] [0.43]
Polity 2 index, lagged 0.533 0.161 �0.329 �0.02 0.390⁄ 0.06 0.13 �0.195[1.38] [1.06] [0.69] [0.07] [1.83] [1.35] [0.89] [0.49]
Polity 2 index squared, lagged �0.02 �0.007 0.013 0 �0.015⁄ �0.002 �0.003 0.007[1.27] [1.11] [0.67] [0.02] [1.71] [1.16] [0.45] [0.50]
GDP per worker, lagged �0.177⁄ �0.043 0.121 0.019 �0.041 �0.049⁄⁄⁄ �0.126 �0.077[1.78] [1.33] [1.43] [0.28] [0.46] [3.51] [1.05] [1.46]
R-squared 0.97 0.97 0.73 0.89 0.83 0.76 0.66 0.98Within R-squared 0.1 0.1 0.09 0.03 0.13 0.16 0.22 0.1Number of countries 38 30 32 38 38 28 38 32Observations 493 339 368 488 491 359 479 385
Civil liberties index, lagged 0.456 0.203 0.276 0.405 0.016 �0.038 0.132 �0.054[1.24] [0.96] [1.11] [1.42] [0.08] [1.05] [1.10] [0.49]
Polity 2 index, lagged 0.094 0.067 �0.361 �0.094 0.112 0.079 �0.105 �0.061[0.22] [0.65] [0.99] [0.27] [0.31] [1.13] [0.35] [0.19]
Polity 2 index squared, lagged �0.004 �0.003 0.015 0.003 �0.006 �0.003 0.006 0.003[0.24] [0.67] [0.96] [0.22] [0.38] [1.05] [0.52] [0.24]
GDP per worker, lagged �0.04 0.034 0.253⁄⁄ 0.171 �0.007 �0.025 �0.182 0.01[0.29] [0.64] [2.20] [1.47] [0.05] [1.58] [1.51] [0.23]
Trade openness index, lagged �0.013 0.003 0.01 0.011 �0.018 0.002 �0.001 �0.015[0.74] [0.55] [1.40] [1.31] [1.38] [1.17] [0.15] [1.55]
Government debt/GDP, lagged 0.001 0.003 0.008 0.007 �0.006 0.002 0.003 �0.008⁄⁄
[0.08] [0.36] [0.64] [0.71] [0.66] [1.19] [0.65] [2.34]Agriculture/GDP, lagged �0.065 0.019 0.051 0.013 �0.105 0.030⁄⁄ 0.032 �0.064⁄
[0.51] [0.52] [0.85] [0.20] [1.04] [2.25] [0.53] [1.80]Female labor force participation, lagged 0.176⁄ 0.017 0.018 0.032 0.118⁄ 0.026⁄⁄ 0.066⁄ �0.008
[1.91] [0.53] [0.43] [0.75] [1.77] [2.68] [1.79] [0.22]Old age population, lagged �0.428 �0.626 �0.781 �1.202 1.257 0.108 �0.304 �0.582⁄
[0.47] [1.23] [1.33] [1.61] [1.22] [0.98] [0.31] [1.88]
R-squared 0.98 0.96 0.75 0.89 0.85 0.79 0.66 0.99Within R-squared 0.19 0.2 0.19 0.13 0.25 0.34 0.33 0.22Number of countries 32 25 27 32 32 25 32 28Observations 396 282 311 391 394 303 387 323
Country fixed effects Yes Yes Yes Yes Yes Yes Yes YesYear fixed effects Yes Yes Yes Yes Yes Yes Yes Yes
Notes: the table displays the output of fixed effects regressions with tax revenue and different categories thereof (as a fraction of GDP) as dependent variables. Each column is devoted to a different revenue source,with different specifications being stacked in the same column. With the purpose of calculating the magnitude of estimated effects, for the first specification we also report the within-country standard deviationsof the dependent variables and the political variables. The civil liberties index takes on values on the [1,7] range, with higher values denoting stronger protection of civil liberties. The Polity 2 index takes on valueson the [0,20] range, with higher values for stronger democratic institutions. See the text for details. GDP per worker is expressed in thousands of PPP dollars. Standard errors are clustered at the country level, andthe corresponding t-statistics are reported in brackets below each coefficient.⁄ Significant at 10%.⁄⁄ Significant at 5%.⁄⁄⁄ Significant at 1%.
694P.Profeta
etal./Journal
ofCom
parativeEconom
ics41
(2013)684–
718

Table 5Tax sources and political factors, country fixed effects, 1990–2005, excluding Indonesia. Separate regressions for each area.
Dependent variable (over GDP) Tax revenue Personal income tax Corporate income tax Direct taxes
New EU Latin Am Asia New EU Latin Am Asia New EU Latin Am Asia New EU Latin Am Asia
[1] [2] [3] [4] [5] [6] [7] [8] [9] [10] [11] [12]
Civil liberties index, lagged 0.991 0.463 0.538 0.547 0.107 0.025 0.087 0.604⁄⁄⁄ �0.3 0.585⁄ 0.468⁄⁄ �0.332[1.12] [1.48] [0.87] [1.51] [1.02] [0.29] [0.23] [3.16] [1.39] [1.87] [2.19] [1.38]
Polity 2 index, lagged �1.247 �0.006 �0.058⁄ �0.994⁄ �0.018⁄⁄ �0.007 �0.714 0.06 0.048⁄ �1.608⁄⁄⁄ �0.033 0.033[1.44] [0.06] [1.89] [2.23] [2.50] [0.98] [1.55] [0.73] [1.92] [3.77] [0.80] [1.58]
GDP per worker, lagged 0.556 �0.046 0.015 0.039 0.018 �0.023 0.235⁄ 0.326 0.048 0.317 0.187 �0.06[1.06] [0.38] [0.17] [0.36] [0.81] [0.89] [1.99] [1.75] [1.01] [1.65] [1.26] [1.48]
R-squared 0.88 0.89 0.91 0.84 0.94 0.96 0.83 0.63 0.91 0.67 0.74 0.93Within R-squared 0.56 0.29 0.18 0.41 0.2 0.23 0.39 0.25 0.36 0.52 0.16 0.24Number of countries 9 19 10 9 12 9 9 14 9 9 19 10Observations 99 263 131 99 135 105 99 155 114 99 258 131
Indirect taxes Property taxes Trade taxes Social security
Civil liberties index, lagged 0.944 �0.09 0.646 – �0.026 �0.061 �1.554 0.208⁄⁄ 0.188 �0.295 �0.14 0.139[0.86] [0.51] [1.59] [0.54] [0.93] [1.29] [2.48] [0.96] [0.41] [0.93] [1.70]
Polity 2 index, lagged �0.837 0.032 �0.085⁄⁄ – �0.01 �0.007 0.656 0.005 0.039⁄⁄ 0.739 �0.003 �0.042[0.75] [0.53] [3.16] [0.61] [1.04] [0.64] [0.28] [2.26] [1.13] [0.07] [1.71]
GDP per worker, lagged 0.689 �0.124 0.06 – �0.061⁄ �0.023 �0.808 �0.118⁄ 0.112⁄⁄⁄ �0.115 0.012 �0.125⁄
[1.73] [1.54] [1.13] [1.99] [0.94] [0.86] [1.97] [4.56] [0.70] [0.38] [2.14]
R-squared 0.47 0.9 0.83 0.75 0.87 0.67 0.69 0.93 0.93 0.95 0.82Within R-squared 0.33 0.5 0.2 0.24 0.37 0.35 0.26 0.73 0.38 0.03 0.73Number of countries 9 19 10 – 18 10 9 19 10 9 18 5Observations 99 261 131 – 239 120 90 261 128 99 248 38
Country fixed effects Yes Yes Yes – Yes Yes Yes Yes Yes Yes Yes YesYears fixed effects Yes Yes Yes – Yes Yes Yes Yes Yes Yes Yes Yes
Notes: the table displays the output of fixed effects regressions with tax revenue and different categories thereof (as a fraction of GDP) as dependent variables. Within each subgroup of columns, each column isdevoted to a different area of the world. The civil liberties index takes on values on the [1,7] range, with higher values denoting stronger protection of civil liberties. The Polity 2 index takes on values on the [0,20]range, with higher values for stronger democratic institutions. See the text for details. GDP per worker is expressed in thousands of PPP dollars. Standard errors are clustered at the country level, and thecorresponding t-statistics are reported in brackets below each coefficient.⁄ Significant at 10%.⁄⁄ Significant at 5%.⁄⁄⁄ Significant at 1%.
P.Profetaet
al./Journalof
Comparative
Economics
41(2013)
684–718
695

696 P. Profeta et al. / Journal of Comparative Economics 41 (2013) 684–718
The joint inspection of the region dummies allows us to conclude that overall tax revenue, personal income taxation, di-rect taxation and social security contributions are significantly larger in the excluded area of New EU Countries. This is con-sistent with previous findings by Profeta and Scabrosetti (2010). Focusing on the other controls, indirect taxation issignificantly lower when GDP per worker is higher. Moreover, the share of elderly people in the population is positivelyand significantly related with the level of social security contributions.
In Table 4, we move forward from a pooled OLS specification with region-specific fixed effects to a fully fledged specifi-cation with country fixed effects. Most of the significant results displayed in Table 3 do not survive this more demandingempirical test. In other words, our fixed effects analysis shows the lack of any significant and robust relationship betweenboth the level and structure of taxation and the degree of protection of civil and political rights.25 We argue that one reasonwhy it is hard to find any results might be the lack of sufficient within country variation in our political variables of interest. Infact, the time period covered by our analysis is short. Studies which find interesting results by using a fixed effects approach areusually based on data spanning a longer time period, but they typically focus on a smaller number of countries. The lack of asignificant correlation between democracy and taxation is in line with the predictions in Mulligan et al. (2004).
However, three exceptions are remarkable: (i) the positive and significant relationship between trade taxes and thedemocracy index (only in the first specification); (ii) a negative and robust correlation between civil liberties protectionand property taxation (in the first and second specification); and (iii) an inverted U-shaped relation between the strengthof democratic institutions and the level of indirect taxes (in the second specification).26
The first result may depend on the role played by interests groups in a democratic political context: conditionally on thedegree of economic openness, the political majority in democratic countries might need the support of national producers,and obtain it by increasing the share of import duties (Tanzi and Tsibouris, 2000).
Regarding the second result, following previous studies such as Wintrobe (1990, 1998) and Kenny and Winer (2006), onecould argue that property taxes do not need (or need less) tax compliance by taxpayers. This type of taxation does not re-quire individual’s considerations, such as tax allowances, deductions, exemptions, special cases, and is thus easier to be re-lied upon in a context where civil liberties and individual freedom are not a priority. Taxes on income are instead typicallymore costly to collect (see Aidt and Jensen, 2009a) and more complicated. Referring to the distinction between positive andnegative liberty discussed above, it thus seems that only negative freedom is related to the share of property taxes in thestructure of the tax system.
Finally, our third result suggests that only after the consolidation of democratic institutions the share of indirect taxesstarts to decrease. As a consequence, the redistributive – although modest – nature of indirect taxes seems to be relevantespecially at the beginning of the democratization process.
If we look at the economic significance of these estimated effects we find that a one standard deviation increase in civilliberties within a specific country is correlated with a decrease in the share of property taxes over GDP of about 15% of astandard deviation. Furthermore, in the case of indirect taxation, a one standard deviation increase in the level of the democ-racy score when it is one standard deviation below (above) its maximizing level leads to an increase (decrease) of 7 percentof a standard deviation in the dependent variable.27 Finally, a one standard deviation increase in the democracy score is asso-ciated with a 10% of a standard deviation increase in trade taxes over GDP.
One could argue that countries belonging to different regions, albeit displaying some common traits in their political andeconomic development paths, might be characterized by a substantial degree of heterogeneity in the relationship betweenpolitical variables and their tax structure. This justifies the idea of replicating our fixed effects design with region-specificregressions.28
The output of this exercise is displayed in Table 5, whereas we focus on the simplest specification of Table 4, i.e. we only con-trol for the civil liberties and the democracy indices and GDP per worker.29 In New EU Countries we find no significant correlationbetween total tax revenue and political variables, while the POLITY2 indicator is negatively and significantly related to personalincome and direct taxes. Civil liberties protection instead is positively related with direct taxes. In Latin America corporate incometaxes, direct taxes and trade taxes are positively and significantly correlated with civil liberties protection. On the other hand, asomewhat puzzling result is that personal income taxes are negatively and significantly correlated with the democracy score,i.e. when their political institutions become more democratic, Latin American countries appear to rely less on personal taxation.30
In the case of South-East Asian countries we only find a negative and significant correlation of the democracy index with overall taxrevenue especially driven by indirect taxes. To interpret these last results, notice that South-East Asia (especially China) is followinga ‘‘hard path’’ of development where a notable economic liberalization is not associated with democratization (see Giavazzi and
25 Further results show that this lack of a significant relationship holds when including the civil liberties or the democracy index alone.26 Notice that we do not have data on property taxes for New EU members countries.27 According to our estimates, indirect taxation over GDP reaches its maximum level when the POLITY2 score is around 13.28 More specifically, we have run fixed effects regressions allowing for area-specific slopes for our political variables. Results, available upon request, show
that in 14 out of 24 specifications the null hypothesis of common slopes across world areas – for at least one of the two political indicators – is rejected at the10% confidence level, i.e. in about 58% of all cases.
29 The first regression only includes the explanatory variables of our interest and the GDP, and thus can be used to compare unconditional with conditionalcorrelations.
30 A possible explanation for this finding is related to the quality of Latin American democracies, that generally suffer from low levels of politicalrepresentation (i.e. low level of positive freedom), given that vested interests, lobbying and interest groups still play a crucial role in determining publicpolicies. See Profeta and Scabrosetti (2008).

Table 6Snap-shot summary of results on taxation.
Cross-country pooled OLS regressions with region fixed effects(i) A positive correlation between civil liberties and both personal income tax and indirect taxes
(ii) An inverted U-shaped relation between democratic institutions and personal income taxes(iii) A negative correlation between civil liberties and corporate income taxation(iv) A positive correlation between the strength of democratic institutions and social security contributions(v) A negative correlation between civil liberties and social security contributions
Country fixed effects regressions(i) A positive correlation between trade taxes and the democracy index
(ii) A negative correlation between civil liberties protection and property taxation(iii) An inverted U-shaped relation between the strength of democratic institutions and the level of indirect taxes
Region specific regressions with country fixed effects(i) A positive correlation between civil liberties and direct taxes in Latin American countries especially driven by corporate income taxes
(ii) A positive correlation between civil liberties and trade taxes in Latin American countries(iii) A negative correlation between democratic institutions and personal income taxes in Latin American countries(iv) A negative correlation between democratic institutions and tax revenue in South-East Asian countries especially driven by indirect taxes(v) A positive correlation between civil liberties and direct taxes in New EU countries
(vi) A negative correlation between democratic institutions and direct taxes in New EU countries (driven by personal income taxes)
P. Profeta et al. / Journal of Comparative Economics 41 (2013) 684–718 697
Tabellini, 2005; Cacciatore et al., 2006). Still, the increase in taxes is not related to a parallel increase in civil liberties protection or inthe strength of democratic institutions (where the relation is even negative).
To summarize the results in a friendly manner Table 6 presents a snap-shot.
4.2. Expenditure
We now get onto our results on the expenditure side.In a parallel fashion with what done with taxation, we first investigate the link between political variables and public
expenditure within a pooled OLS framework, with region fixed effects (Table 7).Some interesting relationships emerge. First, there are some signs of an inverted U-shaped relationship between the
strength of democratic institutions and the amount of defense expenditure. Habibi (1994) finds a negative relation betweendefense and political liberties: in more democratic countries the civilians can exercise more control over the military budgetand, as a consequence, the share of defense expenditure reduces. Our results seem to suggest that this effect start operatingafter a certain democracy threshold. Second, we find a U-shaped relationship of health expenditure and the democracy scorein the third specification. Thus, starting from an autocratic regime, defense (health) spending initially increases (decreases)with democracy, but – when the country in question has reached some minimal level of democracy – further increases in thePOLITY2 index are correlated with a decrease (increase) in the overall amount of defense (health) spending.31 A U-shaped rela-tion is obtained in Martin and Plümper (2003), Hausken et al. (2004) who, however, refer to the general level of public spending.
In terms of magnitudes, we find that a one standard deviation increase in the civil liberties score within a specific area isassociated with a 23% of a standard deviation decrease in the share of defense expenditure over GDP. In the case of the in-verted U-shaped relationship between the POLITY2 score and defense spending, a standard deviation increase in that scorewhen it is one standard deviation below (above) its maximizing level leads to a 53% of a standard deviation increase (de-crease) in defense spending.32
Looking at region fixed effects, total government expenditure and several categories thereof are generally higher in NewEU Members than in Latin American and South-East Asian countries.
In Table 8, as before, we check our results on public spending with a more demanding specification featuring countryfixed effects. While our previous results regarding the positive link between education and public order expenditure anddemocracy no longer hold here, we still find an inverted U-shaped relationship between defense expenditure and thestrength of democratic institutions (i.e. the degree of positive freedom).33
Coming to magnitudes, a one standard deviation increase in civil liberties is associated with a 22% of a standard deviationincrease in the level of general public services outlays over GDP. In the case of defense spending, a one standard deviationincrease in POLITY2 when it is one standard deviation below (above) its maximizing level brings about a 11% of a standarddeviation increase (decrease) in defense spending.34 Moreover, a standard deviation increase in civil liberties leads on averageto a 16% of a standard deviation increase in health spending over GDP.
Finally, we investigate to what extent our previous findings are robust to distinguishing across the different regions in oursample.35 The output of this exercise is shown in Table 9, which exactly replicates the format of Table 5. In this case, political
31 Moreover, it is interesting to notice that in our most demanding specification a country that is more open to trade is on average spending significantly lesson defense.
32 The maximizing level of the democracy score is around 13.33 In the case of public spending as well the lack of sufficient within country variation in our political variables of interest might help explain why we only find
a small set of robustly significant results.34 The maximizing level of POLITY2 is estimated to be slightly above 12.35 Similarly to what done for taxation, we have run fixed effects regressions allowing for area-specific slopes for our political variables. Results, available upon
request, show that in 15 out of 21 different specifications the null hypothesis of common slopes across world areas for at least one of our political controls isrejected at the 10% confidence level, i.e. in about 71% of cases.

Table 7Public expenditure and political factors, pooled OLS estimates, 1990–2005, excluding Indonesia.
Dependent variable (over GDP) Total governmentexpenditure
General publicservices
Defenseexpenditure
Healthexpenditure
Educationexpenditure
Social protectionexpenditure
Public orderexpenditure
[1] [2] [3] [4] [5] [6] [7]
Civil liberties index, lagged �0.137 �0.603 �0.213⁄ �0.062 �0.141 0.339 0.041[0.14] [1.13] [1.71] [0.26] [0.80] [0.50] [0.63]
Polity 2 index, lagged 0.394 0.056 0.06 0.061 0.114⁄ 0.057 0.038⁄
[1.43] [0.33] [1.36] [1.44] [1.88] [0.39] [1.82]GDP per worker, lagged 0.062 �0.108⁄⁄⁄ 0.050⁄⁄⁄ 0.011 0.047⁄⁄⁄ 0.04 0.002
[1.04] [3.38] [2.83] [0.77] [2.95] [0.91] [0.29]Latin America dummy �15.135⁄⁄⁄ �2.704⁄⁄ �0.28 �2.363⁄⁄⁄ �0.048 �6.652⁄⁄⁄ �0.684⁄⁄⁄
[5.43] [2.23] [0.91] [3.18] [0.10] [3.30] [3.80]Asia dummy �14.133⁄⁄⁄ �1.146 1.327⁄⁄⁄ �3.412⁄⁄⁄ �0.14 �9.796⁄⁄⁄ �0.771⁄⁄⁄
[4.48] [0.78] [3.49] [4.81] [0.25] [6.04] [4.64]
R-squared 0.6 0.25 0.5 0.57 0.24 0.63 0.53Number of countries 35 33 33 33 33 33 33Observations 391 309 313 313 313 309 301
Standard deviation of dependentvariable
5.86 3.41 0.96 1.31 1.33 3.54 0.49
Standard deviation of civil liberties 1.05 1.06 1.08 1.08 1.08 1.07 1.05Standard deviation of Polity 2 3.95 3.99 4 4 4 4.06 3.95
Civil liberties index, lagged �0.249 �0.601 �0.203⁄ �0.067 �0.138 0.332 0.041[0.27] [1.13] [1.73] [0.29] [0.79] [0.51] [0.66]
Polity 2 index, lagged �0.661 �0.272 0.428⁄⁄⁄ �0.123 0.22 �1.125 0.098[0.51] [0.44] [2.94] [0.48] [1.04] [1.31] [1.51]
Polity 2 index squared, lagged 0.045 0.014 �0.016⁄⁄⁄ 0.008 �0.005 0.051 �0.003[0.95] [0.61] [2.76] [0.75] [0.55] [1.47] [0.78]
GDP per worker, lagged 0.085 �0.102⁄⁄⁄ 0.043⁄⁄⁄ 0.014 0.045⁄⁄⁄ 0.064 0.001[1.45] [3.51] [2.87] [0.88] [2.98] [1.39] [0.14]
Latin America dummy �14.358⁄⁄⁄ �2.489⁄⁄ �0.524 �2.240⁄⁄⁄ �0.118 �5.859⁄⁄⁄ �0.723⁄⁄⁄
[5.46] [2.36] [1.63] [2.81] [0.23] [2.80] [4.01]Asia dummy �13.442⁄⁄⁄ �0.878 1.056⁄⁄⁄ �3.277⁄⁄⁄ �0.218 �8.775⁄⁄⁄ �0.819⁄⁄⁄
[4.55] [0.64] [2.95] [4.26] [0.37] [5.02] [4.38]
R-squared 0.61 0.25 0.58 0.57 0.24 0.66 0.54Number of countries 35 33 33 33 33 33 33Observations 391 309 313 313 313 309 301
Civil liberties index, lagged 0.122 �0.477 �0.033 0.043 0.04 0.456 0.087[0.16] [0.96] [0.27] [0.23] [0.24] [0.91] [1.44]
Polity 2 index, lagged 0.382 �0.634 0.352⁄⁄ �0.444⁄ 0.185 �0.562 0.031[0.48] [1.36] [2.46] [1.95] [0.97] [1.36] [0.58]
Polity 2 index squared, lagged 0.003 0.029 �0.014⁄⁄ 0.020⁄⁄ �0.004 0.028 0[0.08] [1.42] [2.43] [2.24] [0.45] [1.48] [0.07]
GDP per worker, lagged �0.097 �0.184⁄ �0.009 0.005 0.059⁄ �0.034 0[0.67] [1.91] [0.53] [0.19] [2.05] [0.31] [0.01]
Trade openness index, lagged 0.032⁄ �0.013 �0.005⁄ 0.022⁄⁄⁄ 0.013⁄⁄ �0.017 0.007⁄⁄⁄
[1.77] [1.22] [1.92] [6.28] [2.45] [1.46] [6.91]Government debt/GDP, lagged 0.055⁄⁄ 0.027 0.004⁄ 0.005 0.009⁄⁄ 0.033⁄⁄ 0.005⁄⁄⁄
[2.60] [1.57] [1.78] [1.59] [2.53] [2.24] [3.63]
698P.Profeta
etal./Journal
ofCom
parativeEconom
ics41
(2013)684–
718
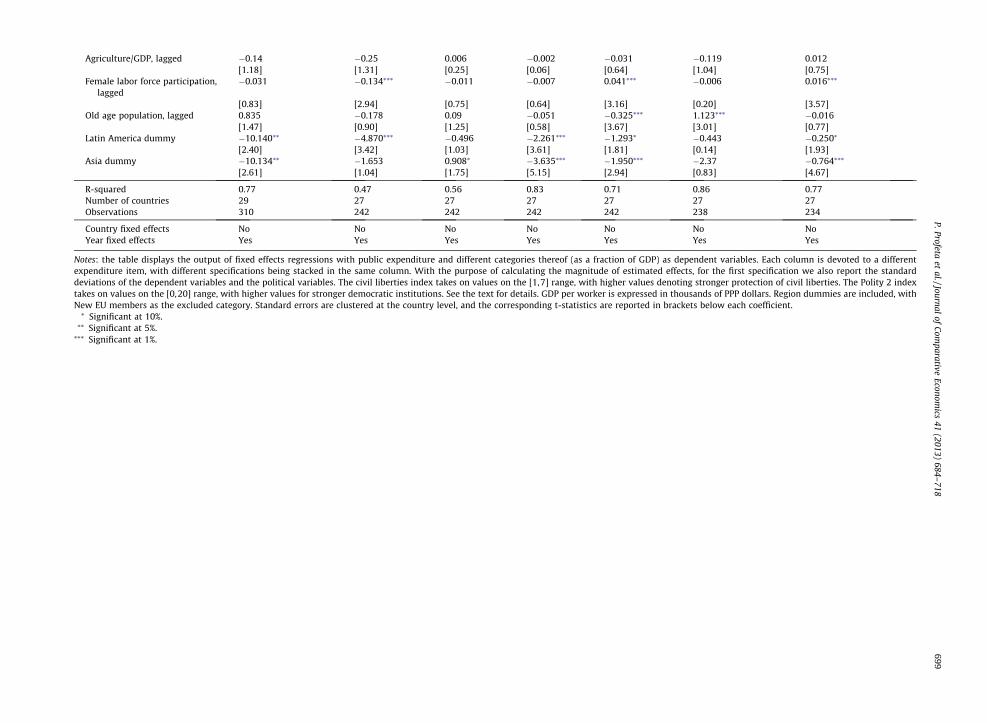
Agriculture/GDP, lagged �0.14 �0.25 0.006 �0.002 �0.031 �0.119 0.012[1.18] [1.31] [0.25] [0.06] [0.64] [1.04] [0.75]
Female labor force participation,lagged
�0.031 �0.134⁄⁄⁄ �0.011 �0.007 0.041⁄⁄⁄ �0.006 0.016⁄⁄⁄
[0.83] [2.94] [0.75] [0.64] [3.16] [0.20] [3.57]Old age population, lagged 0.835 �0.178 0.09 �0.051 �0.325⁄⁄⁄ 1.123⁄⁄⁄ �0.016
[1.47] [0.90] [1.25] [0.58] [3.67] [3.01] [0.77]Latin America dummy �10.140⁄⁄ �4.870⁄⁄⁄ �0.496 �2.261⁄⁄⁄ �1.293⁄ �0.443 �0.250⁄
[2.40] [3.42] [1.03] [3.61] [1.81] [0.14] [1.93]Asia dummy �10.134⁄⁄ �1.653 0.908⁄ �3.635⁄⁄⁄ �1.950⁄⁄⁄ �2.37 �0.764⁄⁄⁄
[2.61] [1.04] [1.75] [5.15] [2.94] [0.83] [4.67]
R-squared 0.77 0.47 0.56 0.83 0.71 0.86 0.77Number of countries 29 27 27 27 27 27 27Observations 310 242 242 242 242 238 234
Country fixed effects No No No No No No NoYear fixed effects Yes Yes Yes Yes Yes Yes Yes
Notes: the table displays the output of fixed effects regressions with public expenditure and different categories thereof (as a fraction of GDP) as dependent variables. Each column is devoted to a differentexpenditure item, with different specifications being stacked in the same column. With the purpose of calculating the magnitude of estimated effects, for the first specification we also report the standarddeviations of the dependent variables and the political variables. The civil liberties index takes on values on the [1,7] range, with higher values denoting stronger protection of civil liberties. The Polity 2 indextakes on values on the [0,20] range, with higher values for stronger democratic institutions. See the text for details. GDP per worker is expressed in thousands of PPP dollars. Region dummies are included, withNew EU members as the excluded category. Standard errors are clustered at the country level, and the corresponding t-statistics are reported in brackets below each coefficient.⁄ Significant at 10%.⁄⁄ Significant at 5%.⁄⁄⁄ Significant at 1%.
P.Profetaet
al./Journalof
Comparative
Economics
41(2013)
684–718
699

Table 8Public expenditure and political factors, country fixed effects, 1990–2005, excluding Indonesia.
Dependent variable (over GDP) Total governmentexpenditure
General publicservices
Defenseexpenditure
Healthexpenditure
Educationexpenditure
Social protectionexpenditure
Public orderexpenditure
[1] [2] [3] [4] [5] [6] [7]
Civil liberties index, lagged 0.314 0.745⁄ 0.008 0.161⁄ 0.06 0.106 �0.043[0.47] [1.76] [0.12] [1.91] [0.49] [0.49] [0.59]
Polity 2 index, lagged 0.107 0.046 �0.014 0.008 0.022 �0.002 0.008[1.08] [1.12] [0.51] [0.50] [1.07] [0.04] [0.91]
GDP per worker, lagged �0.017 �0.127⁄ 0.045⁄⁄ 0.015 �0.018 0.083 0.003[0.13] [1.88] [2.19] [0.92] [0.54] [1.22] [0.23]
R-squared 0.93 0.88 0.92 0.96 0.91 0.97 0.91Within R-squared 0.15 0.15 0.07 0.05 0.09 0.08 0.05Number of countries 35 33 33 33 33 33 33Observations 391 309 313 313 313 309 301
Standard deviation of dependentvariable
2.49 1.36 0.35 0.42 0.43 0.97 0.2
Standard deviation of civil liberties 0.46 0.41 0.42 0.42 0.42 0.42 0.4Standard deviation of Polity 2 1.75 1.25 1.32 1.32 1.32 1.25 1.26
Civil liberties index, lagged 0.406 0.739⁄ 0.018 0.164⁄ 0.06 0.106 �0.042[0.65] [1.75] [0.26] [1.97] [0.50] [0.50] [0.59]
Polity 2 index, lagged 1.179⁄ �0.137 0.266⁄⁄⁄ 0.108 0.025 0.017 0.033[1.96] [0.46] [3.21] [0.90] [0.16] [0.09] [0.47]
Polity 2 index squared, lagged �0.042 0.007 �0.011⁄⁄⁄ �0.004 0 �0.001 �0.001[1.66] [0.57] [3.02] [0.80] [0.02] [0.08] [0.32]
GDP per worker, lagged �0.025 �0.127⁄ 0.041⁄⁄ 0.014 �0.018 0.082 0.003[0.21] [1.85] [2.06] [0.83] [0.53] [1.21] [0.21]
R-squared 0.93 0.88 0.92 0.96 0.91 0.97 0.91Within R-squared 0.16 0.16 0.12 0.05 0.09 0.08 0.05Number of countries 35 33 33 33 33 33 33Observations 391 309 313 313 313 309 301
Civil liberties index, lagged 0.24 0.535 �0.01 0.182 0.075 0.074 �0.025[0.42] [1.53] [0.13] [1.51] [0.60] [0.46] [0.30]
Polity 2 index, lagged 0.779 �0.102 0.279⁄⁄⁄ 0.101 0.159 �0.001 0.009[1.43] [0.31] [2.86] [0.65] [0.83] [0.00] [0.10]
Polity 2 index squared, lagged �0.029 0.007 �0.011⁄⁄ �0.003 �0.006 0.002 0[1.24] [0.46] [2.40] [0.46] [0.74] [0.13] [0.00]
GDP per worker, lagged �0.005 0.037 �0.027 0 �0.012 0.176⁄ 0.005[0.03] [0.16] [0.71] [0.00] [0.20] [1.98] [0.16]
Trade openness index, lagged �0.007 0 �0.007⁄⁄ �0.002 0 0.002 0.004[0.30] [0.03] [2.72] [0.41] [0.06] [0.17] [1.18]
Government debt/GDP, lagged 0.006 0.041⁄ �0.007⁄⁄ �0.001 �0.005 0.01 0.004⁄
[0.36] [1.86] [2.07] [0.16] [0.84] [0.60] [1.93]Agriculture/GDP, lagged �0.239 �0.221 �0.045 0.012 0.04 0.066 0.012
[1.34] [1.27] [1.45] [0.29] [1.05] [0.59] [0.60]Female labor force participation,
lagged0.400⁄⁄⁄ 0.007 0.009 0.034 0.039 0.211⁄⁄ 0.022
[2.97] [0.11] [0.35] [1.44] [1.37] [2.48] [1.56]
700P.Profeta
etal./Journal
ofCom
parativeEconom
ics41
(2013)684–
718

Old age population, lagged 2.215⁄⁄ �0.03 0.184 0.022 0.119 0.086 �0.025[2.17] [0.03] [0.73] [0.08] [0.40] [0.22] [0.14]
R-squared 0.94 0.87 0.89 0.97 0.94 0.98 0.9Within R-squared 0.32 0.23 0.19 0.11 0.19 0.34 0.14Number of countries 29 27 27 27 27 27 27Observations 310 242 242 242 242 238 234
Country fixed effects Yes Yes Yes Yes Yes Yes YesYear fixed effects Yes Yes Yes Yes Yes Yes Yes
Notes: the table displays the output of fixed effects regressions with public expenditure and different categories thereof (as a fraction of GDP) as dependent variables. Each column is devoted to a differentexpenditure item, with different specifications being stacked in the same column. With the purpose of calculating the magnitude of estimated effects, for the first specification we also report the within-countrystandard deviations of the dependent variables and the political variables. The civil liberties index takes on values on the [1,7] range, with higher values denoting stronger protection of civil liberties. The Polity 2index takes on values on the [0, 20] range, with higher values for stronger democratic institutions. See the text for details. GDP per worker is expressed in thousands of PPP dollars. Standard errors are clustered atthe country level, and the corresponding t-statistics are reported in brackets below each coefficient.⁄ Significant at 10%.⁄⁄ Significant at 5%.⁄⁄⁄ Significant at 1%.
P.Profetaet
al./Journalof
Comparative
Economics
41(2013)
684–718
701
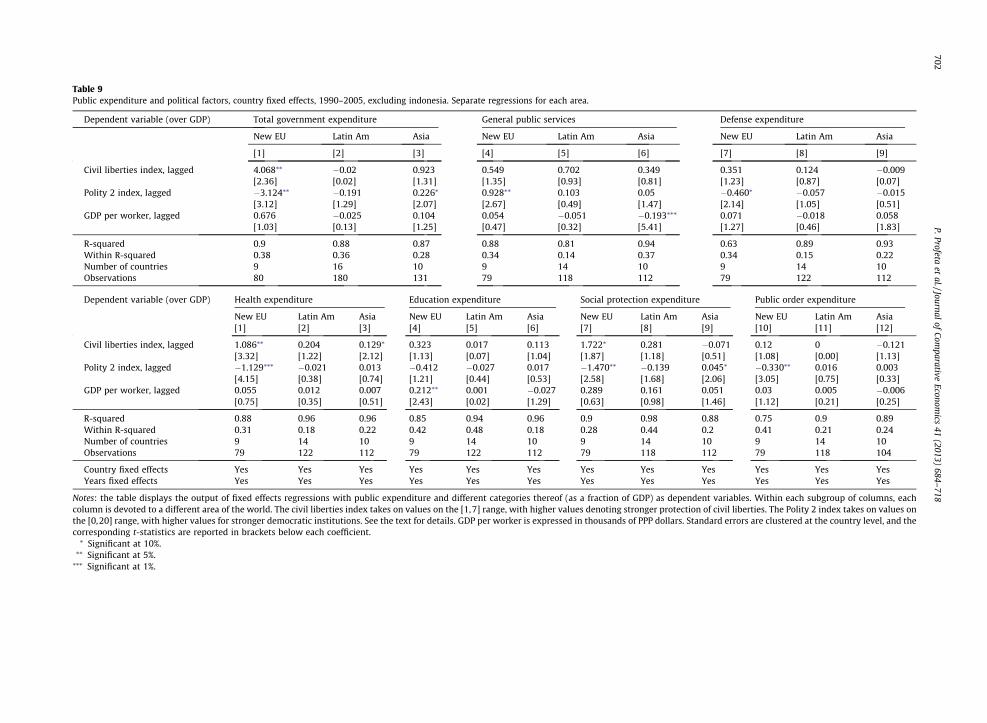
Table 9Public expenditure and political factors, country fixed effects, 1990–2005, excluding indonesia. Separate regressions for each area.
Dependent variable (over GDP) Total government expenditure General public services Defense expenditure
New EU Latin Am Asia New EU Latin Am Asia New EU Latin Am Asia
[1] [2] [3] [4] [5] [6] [7] [8] [9]
Civil liberties index, lagged 4.068⁄⁄ �0.02 0.923 0.549 0.702 0.349 0.351 0.124 �0.009[2.36] [0.02] [1.31] [1.35] [0.93] [0.81] [1.23] [0.87] [0.07]
Polity 2 index, lagged �3.124⁄⁄ �0.191 0.226⁄ 0.928⁄⁄ 0.103 0.05 �0.460⁄ �0.057 �0.015[3.12] [1.29] [2.07] [2.67] [0.49] [1.47] [2.14] [1.05] [0.51]
GDP per worker, lagged 0.676 �0.025 0.104 0.054 �0.051 �0.193⁄⁄⁄ 0.071 �0.018 0.058[1.03] [0.13] [1.25] [0.47] [0.32] [5.41] [1.27] [0.46] [1.83]
R-squared 0.9 0.88 0.87 0.88 0.81 0.94 0.63 0.89 0.93Within R-squared 0.38 0.36 0.28 0.34 0.14 0.37 0.34 0.15 0.22Number of countries 9 16 10 9 14 10 9 14 10Observations 80 180 131 79 118 112 79 122 112
Dependent variable (over GDP) Health expenditure Education expenditure Social protection expenditure Public order expenditure
New EU Latin Am Asia New EU Latin Am Asia New EU Latin Am Asia New EU Latin Am Asia[1] [2] [3] [4] [5] [6] [7] [8] [9] [10] [11] [12]
Civil liberties index, lagged 1.086⁄⁄ 0.204 0.129⁄ 0.323 0.017 0.113 1.722⁄ 0.281 �0.071 0.12 0 �0.121[3.32] [1.22] [2.12] [1.13] [0.07] [1.04] [1.87] [1.18] [0.51] [1.08] [0.00] [1.13]
Polity 2 index, lagged �1.129⁄⁄⁄ �0.021 0.013 �0.412 �0.027 0.017 �1.470⁄⁄ �0.139 0.045⁄ �0.330⁄⁄ 0.016 0.003[4.15] [0.38] [0.74] [1.21] [0.44] [0.53] [2.58] [1.68] [2.06] [3.05] [0.75] [0.33]
GDP per worker, lagged 0.055 0.012 0.007 0.212⁄⁄ 0.001 �0.027 0.289 0.161 0.051 0.03 0.005 �0.006[0.75] [0.35] [0.51] [2.43] [0.02] [1.29] [0.63] [0.98] [1.46] [1.12] [0.21] [0.25]
R-squared 0.88 0.96 0.96 0.85 0.94 0.96 0.9 0.98 0.88 0.75 0.9 0.89Within R-squared 0.31 0.18 0.22 0.42 0.48 0.18 0.28 0.44 0.2 0.41 0.21 0.24Number of countries 9 14 10 9 14 10 9 14 10 9 14 10Observations 79 122 112 79 122 112 79 118 112 79 118 104
Country fixed effects Yes Yes Yes Yes Yes Yes Yes Yes Yes Yes Yes YesYears fixed effects Yes Yes Yes Yes Yes Yes Yes Yes Yes Yes Yes Yes
Notes: the table displays the output of fixed effects regressions with public expenditure and different categories thereof (as a fraction of GDP) as dependent variables. Within each subgroup of columns, eachcolumn is devoted to a different area of the world. The civil liberties index takes on values on the [1,7] range, with higher values denoting stronger protection of civil liberties. The Polity 2 index takes on values onthe [0,20] range, with higher values for stronger democratic institutions. See the text for details. GDP per worker is expressed in thousands of PPP dollars. Standard errors are clustered at the country level, and thecorresponding t-statistics are reported in brackets below each coefficient.⁄ Significant at 10%.⁄⁄ Significant at 5%.⁄⁄⁄ Significant at 1%.
702P.Profeta
etal./Journal
ofCom
parativeEconom
ics41
(2013)684–
718

Table 10Snap-shot summary of results on public spending.
Cross-country pooled OLS regressions with region fixed effects(i) An inverted U-shaped relation between the strength of democratic institutions and the share of defense expenditure
(ii) A U-shaped relation between the strength of democratic institutions and the share of health public outlay(iii) A negative correlation between civil liberties and defense spending(iv) A positive correlation between democratic institutions and education and public order expenditure
Country fixed effects regressions(i) An inverted U-shaped relationship between defence expenditure and the strength of democratic institutions
(ii) A positive correlation between democratic institutions and the total amount of government expenditure(iii) A positive link between civil liberties and both general public services and health expenditure
Region specific regressions with country fixed effects(i) A positive correlation between civil liberties and total government spending in New EU countries especially driven by health and social pro-
tection expenditure(ii) A negative correlation between democratic institutions and government spending in New EU countries (driven by health, defense, social pro-
tection and public order spending)(iii) A positive correlation between democratic institutions and general public services outlays in New EU countries(iv) A positive correlation between civil liberties and health spending in South-East Asian countries(v) A positive correlation between democratic institutions and total spending in South-East Asian countries especially driven by social protection
expenditure
P. Profeta et al. / Journal of Comparative Economics 41 (2013) 684–718 703
variables are especially significant in New EU Countries. Comparing these results with what we find on the taxation side, wenotice that in both cases the POLITY2 indicator and the civil liberties index may have opposite correlations with our dependentvariables. Also, when focusing on New EU Members, the explanatory power of political variables is much stronger for the expen-diture than the revenue side of the public budget. To explain this, notice that, although socialist countries have reacted differ-ently to the transition, a common feature of many New EU Members has been the dramatic decrease of government size duringthis period. As Tanzi and Tsibouris (2000) emphasize, public expenditures have generally dropped by a large amount – with aparallel continuous increase of the private sector –, while fiscal policies and a broad reorganization of tax revenue were, in manycases, less sharp.
On the other hand, and differently from what found regarding taxation, in Latin America there is no significant rela-tion between political variables and the different expenditure items. Finally, in the case of South-East Asian countrieswe only find a mildly significant and positive relation between democracy and total government expenditure and so-cial protection outlays, and between civil liberties and health spending. This suggests that political variables do matterfor the composition of public expenditure especially when democracy reaches stability, maturity and a better qualitylevel.
To summarize the results in a friendly manner Table 10 presents a snap-shot.
4.3. Robustness checks
We have performed three main robustness checks. The outcome of those exercises are available in the Appendix (see Ta-bles A1–A12). First, we replicate our baseline specifications by using as dependent variable the share of each tax item overtotal tax revenue, and of each spending item over total government expenditure.36
Second, we include voter turnout as a third dimension of democracy, together with POLITY2 and civil liberties indices.Political participation, as captured by voter turnout, is indeed an important feature of a democracy (Dahl, 1971). To do thiswe have collected data on parliamentary voter turnout from IDEA (http://www.idea.int), as in Mueller and Stratmann (2003),and we have included this variable in the regressions. Notice that the data on voter turnout cover only a very limited share ofour sample. The number of observations dramatically decreases and thus it is difficult to compare the results of our baselineregressions with these new ones. For this reason when we control for voter turnout we decided not to run separate regres-sions for area.
Third, one might be concerned with the high degree of persistence of our dependent variables, which might not be effi-ciently taken care of by our fixed effects regressions. Thus, we apply the ‘‘system’’ GMM estimator (Blundell and Bond, 1998)to our data, whereas lagged values of the explanatory variables are used as instruments of the differences, and lagged dif-ferences are used as instruments of the levels.37 When doing so, we find a positive and statistically significant relationship
36 Notice that we consider separately each tax and expenditure item, and that the shares do not sum up to one, since we have residual taxation andexpenditure categories on which we do not focus. However, since regressors are the same for each tax and expenditure item, the preferred SUR specificationwould boil down to an OLS one (Bartels and Fiebig, 1991).
37 We prefer to use the system GMM estimator since a simple Arellano-Bond ‘‘difference’’ GMM technique is likely to suffer from finite sample bias, especiallyif the number of considered periods is short and the absolute value of the autoregressive parameter is close to one. The exclusion restriction justifying the use ofthis system GMM is that the initial values of the dependent variables are generated by the same statistical process that generates the fixed effects.

704 P. Profeta et al. / Journal of Comparative Economics 41 (2013) 684–718
between civil liberties index and overall tax revenue, and – at least with the third specification – a positive and statistically sig-nificant relationship between civil liberties trade taxes. We also find an inverted U-shaped relationship of the POLITY2 indexwith overall tax revenue and property taxes. Finally, we find an inverted U-shaped relationship of the democracy score withtrade taxes (only with the second specification) and with indirect taxes (but only in the third specification). Looking at publicoutlays, our results show a positive and statistically significant relationship between civil liberties protection and the share ofhealth expenditure over GDP. Moreover, we find a positive (negative) and statistically significant relationship between the civilliberties index and total government expenditure (general public services expenditure), at least in the first two specifications.We also find a U-shaped relationship between the POLITY2 index and both defense and social protection expenditure. Finally,there is an inverted U-shaped relationship of the democracy index with education spending.
5. Conclusions
Our analysis is a first attempt to explore whether – in developing countries – political regimes may contribute to explainwithin country changes in tax revenue, government spending and their composition. For this purpose, we have gathered anew dataset for developing countries of three areas of the world – South-East Asia, Latin America and European Union –,where many of them have recently experienced a democratic and economic transition.
We have enriched previous analyses in several ways: (i) we focused on different political variables and emphasize themultidimensionality of the concept of democracy; (ii) we detailed the structure of both sides of the public budget and(iii) we run different econometric models.
Several relationships between political variables and tax/expenditure sources are only significant when we run pooledOLS regressions, while they are no longer significant when adopting a more demanding specification with country fixed ef-fects, with few exceptions. We argue that this general lack of significant correlations within a country fixed effects specifi-cation might be due to the presence of heterogeneity across world areas which we investigate.
Our analysis considers the two sides of the public budget and their components in a separate way. Obviously it would beinteresting to investigate their interdependencies. For example some of our results on the taxation side, especially thosewhich differ from previous empirical studies and from specific theoretical predictions, may receive a different interpretationif the interdependencies with the expenditure side are taken into account. This would require to build and estimate a sen-sible structural model, a task which is left for future research.
To conclude, our analysis shows that in different areas of the world the link between political variables and the design ofthe tax/expenditure system may be driven either by an increase in the strength of democratic institutions or by an increasein the protection of civil liberties, with effects which may go in opposite directions. This confirms that the strength ofpolitical institutions and the civil liberties indicator may indeed capture two different dimensions of a democracy, i.e. what– following Isaiah Berlin – we refer to as positive and negative liberties. In particular, the civil liberties indicator, differentlyfrom the POLITY2 index, reflects freedom of association and press, which may activate lobbying groups using campaign con-tributions, pamphlets, contacts with bureaucrats and politicians to gain support for a specific public policy. Interestingly, wesuggest that the two sides of the public budget may react differently (or with a different timing) to the democratization pro-cess, and that the quality and the maturity of democracy might be relevant to understand the relation between the politicalvariables and the composition of both taxes and expenditures. Finally, our within-country results cast some reasonabledoubt on the exact public policy channels through which political institutions at large – in the shape of negative and positiveliberties – might affect economic development. Given the findings by Papaioannou and Siourounis (2008) on the positiveconnection between successful democratic transitions and subsequent economic growth, future research should delve fur-ther into the exact public policy channels at play. In fact, to the extent that we find a feeble – if not inexistent – link betweendemocratization and redistributive taxation (which may have a negative impact on growth), the relation between democracyand growth is somewhat reinforced, at least in the countries under consideration.
Acknowledgments
We thank Micael Castanheira, Vincenzo Galasso, Peter Sandholt Jensen, Giorgia Maffini, Thomas Plümper, Stanley Winer,two anonymous referees, and participants to SIEP 2009, CESifo Workshop in Dresden 2009, EPCS in Izmir 2010, IIPF inUppsala 2010.
Appendix A
Tables A1–A12.
Appendix B. Supplementary material
Supplementary data associated with this article can be found, in the online version, at http://dx.doi.org/10.1016/j.jce.2012.10.004.
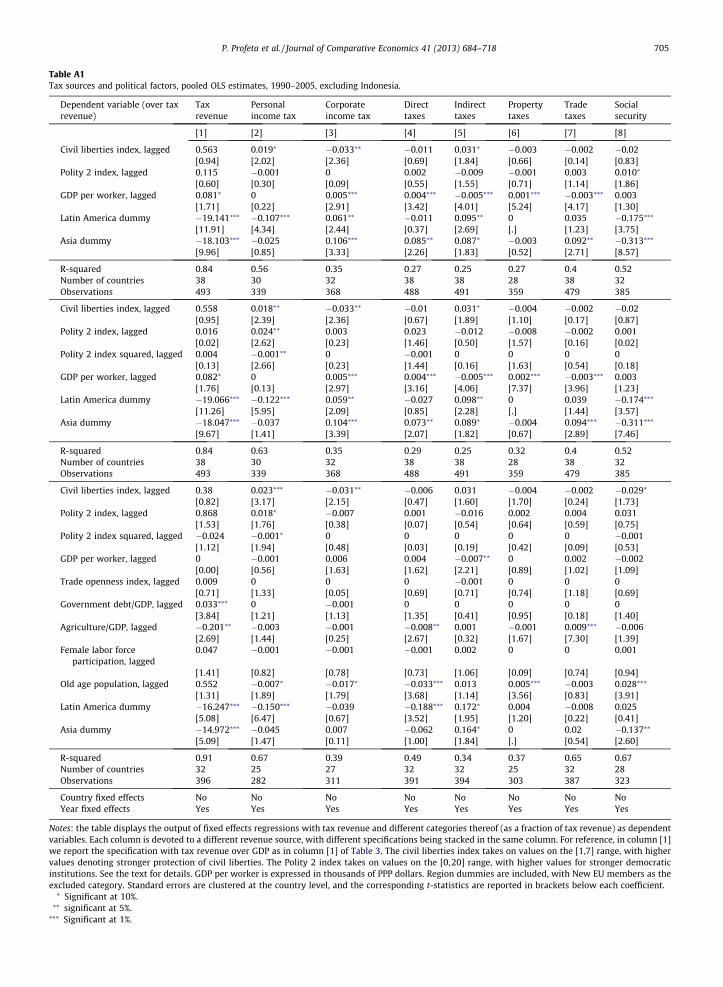
Table A1Tax sources and political factors, pooled OLS estimates, 1990–2005, excluding Indonesia.
Dependent variable (over taxrevenue)
Taxrevenue
Personalincome tax
Corporateincome tax
Directtaxes
Indirecttaxes
Propertytaxes
Tradetaxes
Socialsecurity
[1] [2] [3] [4] [5] [6] [7] [8]
Civil liberties index, lagged 0.563 0.019⁄ �0.033⁄⁄ �0.011 0.031⁄ �0.003 �0.002 �0.02[0.94] [2.02] [2.36] [0.69] [1.84] [0.66] [0.14] [0.83]
Polity 2 index, lagged 0.115 �0.001 0 0.002 �0.009 �0.001 0.003 0.010⁄
[0.60] [0.30] [0.09] [0.55] [1.55] [0.71] [1.14] [1.86]GDP per worker, lagged 0.081⁄ 0 0.005⁄⁄⁄ 0.004⁄⁄⁄ �0.005⁄⁄⁄ 0.001⁄⁄⁄ �0.003⁄⁄⁄ 0.003
[1.71] [0.22] [2.91] [3.42] [4.01] [5.24] [4.17] [1.30]Latin America dummy �19.141⁄⁄⁄ �0.107⁄⁄⁄ 0.061⁄⁄ �0.011 0.095⁄⁄ 0 0.035 �0.175⁄⁄⁄
[11.91] [4.34] [2.44] [0.37] [2.69] [.] [1.23] [3.75]Asia dummy �18.103⁄⁄⁄ �0.025 0.106⁄⁄⁄ 0.085⁄⁄ 0.087⁄ �0.003 0.092⁄⁄ �0.313⁄⁄⁄
[9.96] [0.85] [3.33] [2.26] [1.83] [0.52] [2.71] [8.57]
R-squared 0.84 0.56 0.35 0.27 0.25 0.27 0.4 0.52Number of countries 38 30 32 38 38 28 38 32Observations 493 339 368 488 491 359 479 385
Civil liberties index, lagged 0.558 0.018⁄⁄ �0.033⁄⁄ �0.01 0.031⁄ �0.004 �0.002 �0.02[0.95] [2.39] [2.36] [0.67] [1.89] [1.10] [0.17] [0.87]
Polity 2 index, lagged 0.016 0.024⁄⁄ 0.003 0.023 �0.012 �0.008 �0.002 0.001[0.02] [2.62] [0.23] [1.46] [0.50] [1.57] [0.16] [0.02]
Polity 2 index squared, lagged 0.004 �0.001⁄⁄ 0 �0.001 0 0 0 0[0.13] [2.66] [0.23] [1.44] [0.16] [1.63] [0.54] [0.18]
GDP per worker, lagged 0.082⁄ 0 0.005⁄⁄⁄ 0.004⁄⁄⁄ �0.005⁄⁄⁄ 0.002⁄⁄⁄ �0.003⁄⁄⁄ 0.003[1.76] [0.13] [2.97] [3.16] [4.06] [7.37] [3.96] [1.23]
Latin America dummy �19.066⁄⁄⁄ �0.122⁄⁄⁄ 0.059⁄⁄ �0.027 0.098⁄⁄ 0 0.039 �0.174⁄⁄⁄
[11.26] [5.95] [2.09] [0.85] [2.28] [.] [1.44] [3.57]Asia dummy �18.047⁄⁄⁄ �0.037 0.104⁄⁄⁄ 0.073⁄⁄ 0.089⁄ �0.004 0.094⁄⁄⁄ �0.311⁄⁄⁄
[9.67] [1.41] [3.39] [2.07] [1.82] [0.67] [2.89] [7.46]
R-squared 0.84 0.63 0.35 0.29 0.25 0.32 0.4 0.52Number of countries 38 30 32 38 38 28 38 32Observations 493 339 368 488 491 359 479 385
Civil liberties index, lagged 0.38 0.023⁄⁄⁄ �0.031⁄⁄ �0.006 0.031 �0.004 �0.002 �0.029⁄
[0.82] [3.17] [2.15] [0.47] [1.60] [1.70] [0.24] [1.73]Polity 2 index, lagged 0.868 0.018⁄ �0.007 0.001 �0.016 0.002 0.004 0.031
[1.53] [1.76] [0.38] [0.07] [0.54] [0.64] [0.59] [0.75]Polity 2 index squared, lagged �0.024 �0.001⁄ 0 0 0 0 0 �0.001
[1.12] [1.94] [0.48] [0.03] [0.19] [0.42] [0.09] [0.53]GDP per worker, lagged 0 �0.001 0.006 0.004 �0.007⁄⁄ 0 0.002 �0.002
[0.00] [0.56] [1.63] [1.62] [2.21] [0.89] [1.02] [1.09]Trade openness index, lagged 0.009 0 0 0 �0.001 0 0 0
[0.71] [1.33] [0.05] [0.69] [0.71] [0.74] [1.18] [0.69]Government debt/GDP, lagged 0.033⁄⁄⁄ 0 �0.001 0 0 0 0 0
[3.84] [1.21] [1.13] [1.35] [0.41] [0.95] [0.18] [1.40]Agriculture/GDP, lagged �0.201⁄⁄ �0.003 �0.001 �0.008⁄⁄ 0.001 �0.001 0.009⁄⁄⁄ �0.006
[2.69] [1.44] [0.25] [2.67] [0.32] [1.67] [7.30] [1.39]Female labor force
participation, lagged0.047 �0.001 �0.001 �0.001 0.002 0 0 0.001
[1.41] [0.82] [0.78] [0.73] [1.06] [0.09] [0.74] [0.94]Old age population, lagged 0.552 �0.007⁄ �0.017⁄ �0.033⁄⁄⁄ 0.013 0.005⁄⁄⁄ �0.003 0.028⁄⁄⁄
[1.31] [1.89] [1.79] [3.68] [1.14] [3.56] [0.83] [3.91]Latin America dummy �16.247⁄⁄⁄ �0.150⁄⁄⁄ �0.039 �0.188⁄⁄⁄ 0.172⁄ 0.004 �0.008 0.025
[5.08] [6.47] [0.67] [3.52] [1.95] [1.20] [0.22] [0.41]Asia dummy �14.972⁄⁄⁄ �0.045 0.007 �0.062 0.164⁄ 0 0.02 �0.137⁄⁄
[5.09] [1.47] [0.11] [1.00] [1.84] [.] [0.54] [2.60]
R-squared 0.91 0.67 0.39 0.49 0.34 0.37 0.65 0.67Number of countries 32 25 27 32 32 25 32 28Observations 396 282 311 391 394 303 387 323
Country fixed effects No No No No No No No NoYear fixed effects Yes Yes Yes Yes Yes Yes Yes Yes
Notes: the table displays the output of fixed effects regressions with tax revenue and different categories thereof (as a fraction of tax revenue) as dependentvariables. Each column is devoted to a different revenue source, with different specifications being stacked in the same column. For reference, in column [1]we report the specification with tax revenue over GDP as in column [1] of Table 3. The civil liberties index takes on values on the [1,7] range, with highervalues denoting stronger protection of civil liberties. The Polity 2 index takes on values on the [0,20] range, with higher values for stronger democraticinstitutions. See the text for details. GDP per worker is expressed in thousands of PPP dollars. Region dummies are included, with New EU members as theexcluded category. Standard errors are clustered at the country level, and the corresponding t-statistics are reported in brackets below each coefficient.⁄ Significant at 10%.⁄⁄ significant at 5%.⁄⁄⁄ Significant at 1%.
P. Profeta et al. / Journal of Comparative Economics 41 (2013) 684–718 705
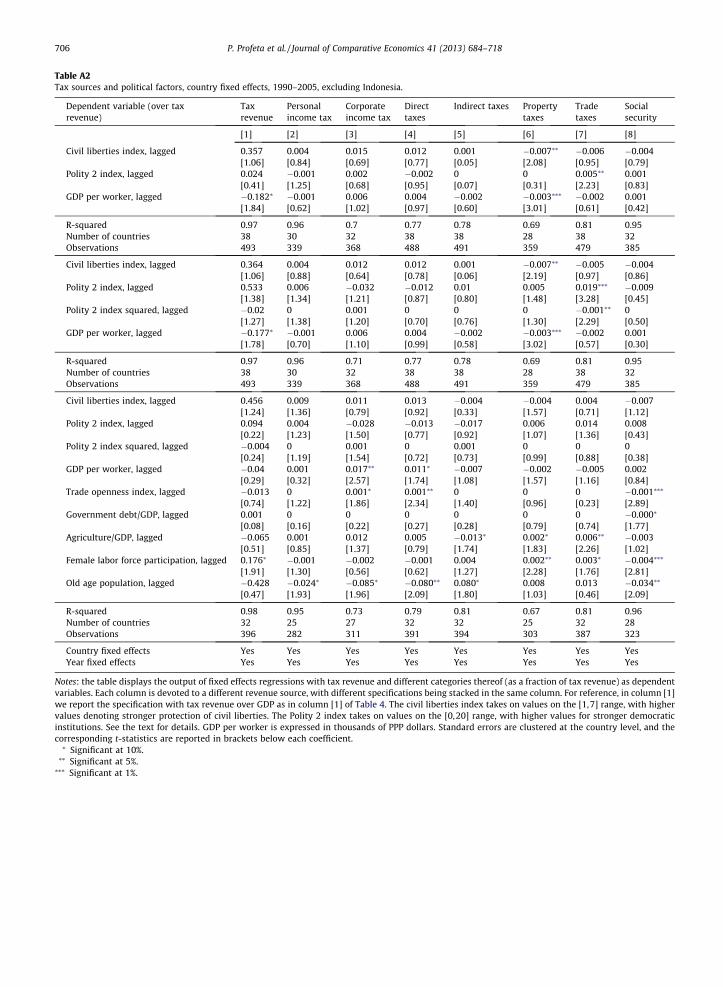
Table A2Tax sources and political factors, country fixed effects, 1990–2005, excluding Indonesia.
Dependent variable (over taxrevenue)
Taxrevenue
Personalincome tax
Corporateincome tax
Directtaxes
Indirect taxes Propertytaxes
Tradetaxes
Socialsecurity
[1] [2] [3] [4] [5] [6] [7] [8]
Civil liberties index, lagged 0.357 0.004 0.015 0.012 0.001 �0.007⁄⁄ �0.006 �0.004[1.06] [0.84] [0.69] [0.77] [0.05] [2.08] [0.95] [0.79]
Polity 2 index, lagged 0.024 �0.001 0.002 �0.002 0 0 0.005⁄⁄ 0.001[0.41] [1.25] [0.68] [0.95] [0.07] [0.31] [2.23] [0.83]
GDP per worker, lagged �0.182⁄ �0.001 0.006 0.004 �0.002 �0.003⁄⁄⁄ �0.002 0.001[1.84] [0.62] [1.02] [0.97] [0.60] [3.01] [0.61] [0.42]
R-squared 0.97 0.96 0.7 0.77 0.78 0.69 0.81 0.95Number of countries 38 30 32 38 38 28 38 32Observations 493 339 368 488 491 359 479 385
Civil liberties index, lagged 0.364 0.004 0.012 0.012 0.001 �0.007⁄⁄ �0.005 �0.004[1.06] [0.88] [0.64] [0.78] [0.06] [2.19] [0.97] [0.86]
Polity 2 index, lagged 0.533 0.006 �0.032 �0.012 0.01 0.005 0.019⁄⁄⁄ �0.009[1.38] [1.34] [1.21] [0.87] [0.80] [1.48] [3.28] [0.45]
Polity 2 index squared, lagged �0.02 0 0.001 0 0 0 �0.001⁄⁄ 0[1.27] [1.38] [1.20] [0.70] [0.76] [1.30] [2.29] [0.50]
GDP per worker, lagged �0.177⁄ �0.001 0.006 0.004 �0.002 �0.003⁄⁄⁄ �0.002 0.001[1.78] [0.70] [1.10] [0.99] [0.58] [3.02] [0.57] [0.30]
R-squared 0.97 0.96 0.71 0.77 0.78 0.69 0.81 0.95Number of countries 38 30 32 38 38 28 38 32Observations 493 339 368 488 491 359 479 385
Civil liberties index, lagged 0.456 0.009 0.011 0.013 �0.004 �0.004 0.004 �0.007[1.24] [1.36] [0.79] [0.92] [0.33] [1.57] [0.71] [1.12]
Polity 2 index, lagged 0.094 0.004 �0.028 �0.013 �0.017 0.006 0.014 0.008[0.22] [1.23] [1.50] [0.77] [0.92] [1.07] [1.36] [0.43]
Polity 2 index squared, lagged �0.004 0 0.001 0 0.001 0 0 0[0.24] [1.19] [1.54] [0.72] [0.73] [0.99] [0.88] [0.38]
GDP per worker, lagged �0.04 0.001 0.017⁄⁄ 0.011⁄ �0.007 �0.002 �0.005 0.002[0.29] [0.32] [2.57] [1.74] [1.08] [1.57] [1.16] [0.84]
Trade openness index, lagged �0.013 0 0.001⁄ 0.001⁄⁄ 0 0 0 �0.001⁄⁄⁄
[0.74] [1.22] [1.86] [2.34] [1.40] [0.96] [0.23] [2.89]Government debt/GDP, lagged 0.001 0 0 0 0 0 0 �0.000⁄
[0.08] [0.16] [0.22] [0.27] [0.28] [0.79] [0.74] [1.77]Agriculture/GDP, lagged �0.065 0.001 0.012 0.005 �0.013⁄ 0.002⁄ 0.006⁄⁄ �0.003
[0.51] [0.85] [1.37] [0.79] [1.74] [1.83] [2.26] [1.02]Female labor force participation, lagged 0.176⁄ �0.001 �0.002 �0.001 0.004 0.002⁄⁄ 0.003⁄ �0.004⁄⁄⁄
[1.91] [1.30] [0.56] [0.62] [1.27] [2.28] [1.76] [2.81]Old age population, lagged �0.428 �0.024⁄ �0.085⁄ �0.080⁄⁄ 0.080⁄ 0.008 0.013 �0.034⁄⁄
[0.47] [1.93] [1.96] [2.09] [1.80] [1.03] [0.46] [2.09]
R-squared 0.98 0.95 0.73 0.79 0.81 0.67 0.81 0.96Number of countries 32 25 27 32 32 25 32 28Observations 396 282 311 391 394 303 387 323
Country fixed effects Yes Yes Yes Yes Yes Yes Yes YesYear fixed effects Yes Yes Yes Yes Yes Yes Yes Yes
Notes: the table displays the output of fixed effects regressions with tax revenue and different categories thereof (as a fraction of tax revenue) as dependentvariables. Each column is devoted to a different revenue source, with different specifications being stacked in the same column. For reference, in column [1]we report the specification with tax revenue over GDP as in column [1] of Table 4. The civil liberties index takes on values on the [1,7] range, with highervalues denoting stronger protection of civil liberties. The Polity 2 index takes on values on the [0,20] range, with higher values for stronger democraticinstitutions. See the text for details. GDP per worker is expressed in thousands of PPP dollars. Standard errors are clustered at the country level, and thecorresponding t-statistics are reported in brackets below each coefficient.⁄ Significant at 10%.⁄⁄ Significant at 5%.⁄⁄⁄ Significant at 1%.
706 P. Profeta et al. / Journal of Comparative Economics 41 (2013) 684–718

Table A3Tax sources and political factors, country fixed effects, 1990–2005, excluding Indonesia. Separate regressions for each area.
Dependent variable (over tax revenue) Tax revenue Personal income tax Corporate income tax Direct taxes
New EU Latin Am Asia New EU Latin Am Asia New EU Latin Am Asia New EU Latin Am Asia[1] [2] [3] [4] [5] [6] [7] [8] [9] [10] [11] [12]
Civil liberties index, lagged 0.991 0.463 0.538 0.01 0.008 �0.002 0 0.037⁄⁄⁄ �0.049 0.009 0.024⁄ �0.052[1.12] [1.48] [0.87] [0.92] [1.28] [0.26] [0.01] [3.46] [1.49] [0.70] [2.03] [1.75]
Polity 2 index, lagged �1.247 �0.006 �0.058⁄ �0.025⁄ �0.001 0 �0.015 0.005 0.005 �0.036⁄⁄ �0.002 0.003[1.44] [0.06] [1.89] [1.93] [1.23] [0.39] [1.32] [0.99] [1.50] [3.35] [0.85] [1.80]
GDP per worker, lagged 0.556 �0.046 0.015 �0.001 0.001 �0.004 0.004 0.019 0.001 0.004 0.012 �0.003[1.06] [0.38] [0.17] [0.55] [0.78] [1.52] [1.34] [1.62] [0.10] [1.06] [1.48] [1.20]
R-squared 0.88 0.89 0.91 0.86 0.95 0.95 0.86 0.75 0.61 0.75 0.81 0.75Number of countries 9 19 10 9 12 9 9 14 9 9 19 10Observations 99 263 131 99 135 105 99 155 114 99 258 131
Indirect taxes Property taxes Trade taxes Social security
Civil liberties index, lagged 0.013 �0.022⁄⁄ 0.053 – �0.004 �0.003 �0.04 0.012 0.006 �0.016 �0.008 0.008[0.52] [2.52] [1.47] [1.28] [0.70] [1.40] [1.55] [0.77] [1.08] [1.20] [1.56]
Polity 2 index, lagged �0.009 0.006⁄ �0.007⁄⁄ – 0 0 0.017 0 0.006⁄⁄⁄ 0.033⁄⁄ 0.001 �0.003[0.38] [1.81] [2.73] [0.42] [0.97] [0.68] [0.37] [9.77] [2.93] [0.97] [1.95]
GDP per worker, lagged 0.013 �0.009 0.002 – �0.005⁄ �0.001 �0.022 �0.007⁄ 0.008⁄⁄⁄ �0.008⁄⁄⁄ 0.002 �0.009⁄
[1.32] [1.13] [0.43] [1.94] [0.84] [0.95] [1.76] [5.46] [3.71] [0.89] [2.36]
R-squared 0.53 0.86 0.74 0.63 0.87 0.68 0.77 0.93 0.9 0.92 0.82Number of countries 9 19 10 – 18 10 9 19 10 9 18 5Observations 99 261 131 – 239 120 90 261 128 99 248 38
Country fixed effects Yes Yes Yes – Yes Yes Yes Yes Yes Yes Yes YesYears fixed effects Yes Yes Yes – Yes Yes Yes Yes Yes Yes Yes Yes
Notes: the table displays the output of fixed effects regressions with tax revenue and different categories thereof (as a fraction of tax revenue) as dependent variables. Within each subgroup of columns, eachcolumn is devoted to a different area of the world. For reference, in columns [1], [2] and [3] we report the specification with tax revenue over GDP as in columns [1], [2] and [3] of Table 5. The civil liberties indextakes on values on the [1,7] range, with higher values denoting stronger protection of civil liberties. The Polity 2 index takes on values on the [0,20] range, with higher values for stronger democratic institutions.See the text for details. GDP per worker is expressed in thousands of PPP dollars. Standard errors are clustered at the country level, and the corresponding t-statistics are reported in brackets below eachcoefficient.⁄ Significant at 10%.⁄⁄ Significant at 5%.⁄⁄⁄ Significant at 1%.
P.Profetaet
al./Journalof
Comparative
Economics
41(2013)
684–718
707

Table A4Public expenditure and political factors, pooled OLS estimates, 1990–2005, excluding Indonesia.
Dependent variable (over totalgovernment expenditure)
Total governmentexpenditure
Generalpublicservices
Defenseexpenditure
Healthexpenditure
Educationexpenditure
Social protectionexpenditure
Public orderexpenditure
[1] [2] [3] [4] [5] [6] [7]
Civil liberties index, lagged �0.137 �0.019 �0.01 0.002 �0.004 0.028 0[0.14] [1.15] [1.56] [0.25] [0.51] [1.26] [0.07]
Polity 2 index, lagged 0.394 �0.008 0 0.001 0.004 �0.002 0.002[1.43] [1.39] [0.20] [0.65] [1.13] [0.51] [1.47]
GDP per worker, lagged 0.062 �0.007⁄⁄⁄ 0.002⁄⁄⁄ 0 0.002⁄⁄⁄ 0.002 0[1.04] [4.67] [2.87] [0.33] [2.82] [0.84] [0.40]
Latin America dummy �15.135⁄⁄⁄ �0.005 0.016 �0.022 0.074⁄⁄⁄ �0.072 0.002[5.43] [0.16] [1.11] [0.82] [3.40] [1.23] [0.20]
Asia dummy �14.133⁄⁄⁄ 0.078 0.095⁄⁄⁄ �0.075⁄⁄⁄ 0.060⁄⁄ �0.226⁄⁄⁄ �0.005[4.48] [1.33] [5.25] [3.08] [2.18] [5.55] [0.52]
R-squared 0.6 0.6 0.61 0.4 0.28 0.56 0.2Number of countries 35 33 33 33 33 33 33Observations 391 309 313 313 313 309 301
Civil liberties index, lagged �0.249 �0.018 �0.009 0.002 �0.004 0.028 0[0.27] [1.18] [1.56] [0.25] [0.48] [1.28] [0.07]
Polity 2 index, lagged �0.661 �0.034⁄⁄ 0.016⁄ 0 0.021⁄⁄ �0.024 0.005[0.51] [2.30] [2.01] [0.03] [2.17] [0.93] [1.47]
Polity 2 index squared, lagged 0.045 0.001⁄ �0.001⁄⁄ 0 �0.001⁄ 0.001 0[0.95] [1.80] [2.23] [0.14] [1.92] [0.90] [0.87]
GDP per worker, lagged 0.085 �0.007⁄⁄⁄ 0.002⁄⁄⁄ 0 0.002⁄⁄ 0.002 0[1.45] [4.86] [3.00] [0.36] [2.65] [1.07] [0.23]
Latin America dummy �14.358⁄⁄⁄ 0.012 0.005 �0.021 0.062⁄⁄⁄ �0.057 0[5.46] [0.38] [0.42] [0.70] [2.80] [0.89] [0.05]
Asia dummy �13.442⁄⁄⁄ 0.099 0.084⁄⁄⁄ �0.074⁄⁄ 0.047 �0.207⁄⁄⁄ �0.008[4.55] [1.64] [5.04] [2.67] [1.67] [4.14] [0.73]
R-squared 0.61 0.62 0.65 0.4 0.34 0.57 0.21Number of countries 35 33 33 33 33 33 33Observations 391 309 313 313 313 309 301
Civil liberties index, lagged 0.122 �0.026 �0.001 0.006 0.006 0.021 0.002[0.16] [1.48] [0.23] [0.79] [1.09] [1.29] [0.41]
Polity 2 index, lagged 0.382 �0.043⁄⁄ 0.010⁄ �0.015 0.019⁄⁄ 0.008 0.003[0.48] [2.26] [1.74] [1.51] [2.36] [0.64] [0.98]
Polity 2 index squared, lagged 0.003 0.001⁄ �0.000⁄ 0.001 �0.001⁄ 0 0[0.08] [1.97] [2.01] [1.70] [1.88] [0.63] [0.49]
GDP per worker, lagged �0.097 �0.004 0.001 �0.001 0.002 0 0[0.67] [1.21] [1.02] [0.51] [1.70] [0.08] [0.44]
trade openness index, lagged 0.032⁄ �0.001⁄ �0.000⁄⁄⁄ 0.001⁄⁄⁄ 0.000⁄ �0.001 0.000⁄⁄⁄
[1.77] [1.92] [3.82] [7.69] [1.75] [1.67] [4.20]Government debt/GDP, lagged 0.055⁄⁄ 0 0 0 0 0.001 0
[2.60] [0.01] [1.33] [0.19] [0.87] [1.52] [0.33]Agriculture/GDP, lagged �0.14 0 0.002 0 �0.002 �0.003 0.001
[1.18] [0.08] [1.39] [0.19] [0.60] [0.99] [0.91]Female labor force participation,
lagged�0.031 �0.005⁄⁄⁄ 0 0 0.002⁄⁄⁄ 0 0.001⁄⁄⁄
[0.83] [2.93] [0.30] [0.78] [3.03] [0.30] [3.04]Old age population, lagged 0.835 �0.014⁄ 0 �0.003 �0.020⁄⁄⁄ 0.043⁄⁄⁄ �0.002
[1.47] [1.71] [0.09] [0.78] [5.55] [6.26] [1.56]Latin America dummy �10.140⁄⁄ �0.122⁄⁄ �0.018 �0.015 �0.021 0.187⁄⁄⁄ 0.01
[2.40] [2.41] [1.03] [0.71] [0.72] [3.00] [1.01]Asia dummy �10.134⁄⁄ �0.01 0.051⁄⁄ �0.081⁄⁄⁄ �0.052⁄ 0.069 �0.016
[2.61] [0.15] [2.65] [3.01] [1.85] [1.19] [1.29]
R-squared 0.77 0.72 0.71 0.76 0.72 0.86 0.49Number of countries 29 27 27 27 27 27 27Observations 310 242 242 242 242 238 234
Country fixed effects No No No No No No NoYear fixed effects Yes Yes Yes Yes Yes Yes Yes
Notes: the table displays the output of fixed effects regressions with public expenditure and different categories thereof (as a fraction of total governmentexpenditure) as dependent variables. Each column is devoted to a different expenditure item, with different specifications being stacked in the samecolumn. For reference, in column [1] we report the specification with total government expenditure over GDP as in column [1] of Table 7. The civil libertiesindex takes on values on the [1,7] range, with higher values denoting stronger protection of civil liberties. The Polity 2 index takes on values on the [0, 20]range, with higher values for stronger democratic institutions. See the text for details. GDP per worker is expressed in thousands of PPP dollars. Regiondummies are included, with New EU members as the excluded category. Standard errors are clustered at the country level, and the corresponding t-statistics are reported in brackets below each coefficient.⁄ Significant at 10%.⁄⁄ Significant at 5%.⁄⁄⁄ Significant at 1%.
708 P. Profeta et al. / Journal of Comparative Economics 41 (2013) 684–718

Table A5Public expenditure and political factors, country fixed effects, 1990–2005, excluding Indonesia.
Dependent variable (over totalgovernment expenditure)
Totalgovernmentexpenditure
Generalpublicservices
Defenseexpenditure
Healthexpenditure
Educationexpenditure
Socialprotectionexpenditure
Public orderexpenditure
[1] [2] [3] [4] [5] [6] [7]
Civil liberties index, lagged 0.314 0.015 �0.006 0.003 �0.002 �0.002 �0.005⁄⁄⁄
[0.47] [1.13] [1.18] [1.11] [0.64] [0.32] [2.96]Polity 2 index, lagged 0.107 0.001 �0.002 0 0 0 0
[1.08] [0.32] [0.93] [0.54] [0.38] [0.13] [0.90]GDP per worker, lagged �0.017 �0.008⁄⁄⁄ 0.002 0 �0.001 0.001 0
[0.13] [3.13] [1.25] [0.77] [1.22] [0.46] [0.07]
R-squared 0.93 0.93 0.93 0.95 0.94 0.98 0.87Number of countries 35 33 33 33 33 33 33Observations 391 309 313 313 313 309 301
Civil liberties index, lagged 0.406 0.014 �0.005 0.004 �0.002 �0.002 �0.005⁄⁄⁄
[0.65] [1.12] [0.89] [1.16] [0.61] [0.34] [2.93]Polity 2 index, lagged 1.179⁄ �0.006 0.020⁄⁄⁄ 0.005 0.001 �0.008 �0.001
[1.96] [0.50] [3.00] [1.24] [0.12] [0.99] [0.25]Polity 2 index squared, lagged �0.042 0 �0.001⁄⁄⁄ 0 0 0 0
[1.66] [0.49] [2.93] [1.24] [0.16] [0.92] [0.34]GDP per worker, lagged �0.025 �0.008⁄⁄⁄ 0.002 0 �0.002 0.001 0
[0.21] [3.10] [1.14] [0.66] [1.21] [0.47] [0.06]
R-squared 0.93 0.93 0.94 0.95 0.94 0.98 0.87Number of countries 35 33 33 33 33 33 33Observations 391 309 313 313 313 309 301
Civil liberties index, lagged 0.24 0.005 �0.004 0.004 �0.001 �0.003 �0.004⁄
[0.42] [0.42] [0.72] [1.14] [0.39] [0.55] [2.02]Polity 2 index, lagged 0.779 0 0.018⁄⁄⁄ 0.003 0.006 �0.005 �0.001
[1.43] [0.02] [3.45] [0.62] [1.22] [0.65] [0.36]Polity 2 index squared, lagged �0.029 0 �0.001⁄⁄⁄ 0 0 0 0
[1.24] [0.03] [3.04] [0.54] [1.21] [0.47] [0.42]GDP per worker, lagged �0.005 �0.001 0 �0.001 0.001 �0.002 0
[0.03] [0.20] [0.11] [1.04] [0.74] [0.43] [0.09]Trade openness index, lagged �0.007 0 �0.000⁄⁄ 0 0 0 0
[0.30] [0.08] [2.17] [0.01] [0.14] [1.34] [1.39]Government debt/GDP, lagged 0.006 0.001⁄ �0.000⁄⁄⁄ 0 0 0 0
[0.36] [1.88] [2.94] [0.93] [1.65] [0.67] [0.88]Agriculture/GDP, lagged �0.239 �0.011 0.001 �0.001 0.001 0.001 0.001
[1.34] [1.34] [0.32] [0.58] [0.48] [0.34] [0.76]Female labor force
participation, lagged0.400⁄⁄⁄ �0.002 �0.001 0.001 0 0.004⁄⁄⁄ 0
[2.97] [0.84] [1.31] [1.15] [0.29] [2.96] [0.14]Old age population, lagged 2.215⁄⁄ �0.014 �0.019 0.005 �0.020⁄⁄ 0.022 �0.01
[2.17] [0.41] [1.51] [0.57] [2.31] [1.51] [1.29]
R-squared 0.94 0.93 0.93 0.96 0.97 0.98 0.87Number of countries 29 27 27 27 27 27 27Observations 310 242 242 242 242 238 234
Country fixed effects Yes Yes Yes Yes Yes Yes YesYear fixed effects Yes Yes Yes Yes Yes Yes Yes
Notes: the table displays the output of fixed effects regressions with public expenditure and different categories thereof (as a fraction of total governmentexpenditure) as dependent variables. Each column is devoted to a different expenditure item, with different specifications being stacked in the samecolumn. For reference, in column [1] we report the specification with total government expenditure over GDP as in column [1] of Table 8. The civil libertiesindex takes on values on the [1,7] range, with higher values denoting stronger protection of civil liberties. The Polity 2 index takes on values on the [0,20]range, with higher values for stronger democratic institutions. See the text for details. GDP per worker is expressed in thousands of PPP dollars. Standarderrors are clustered at the country level, and the corresponding t-statistics are reported in brackets below each coefficient.⁄ Significant at 10%.⁄⁄ Significant at 5%.⁄⁄⁄ Significant at 1%.
P. Profeta et al. / Journal of Comparative Economics 41 (2013) 684–718 709
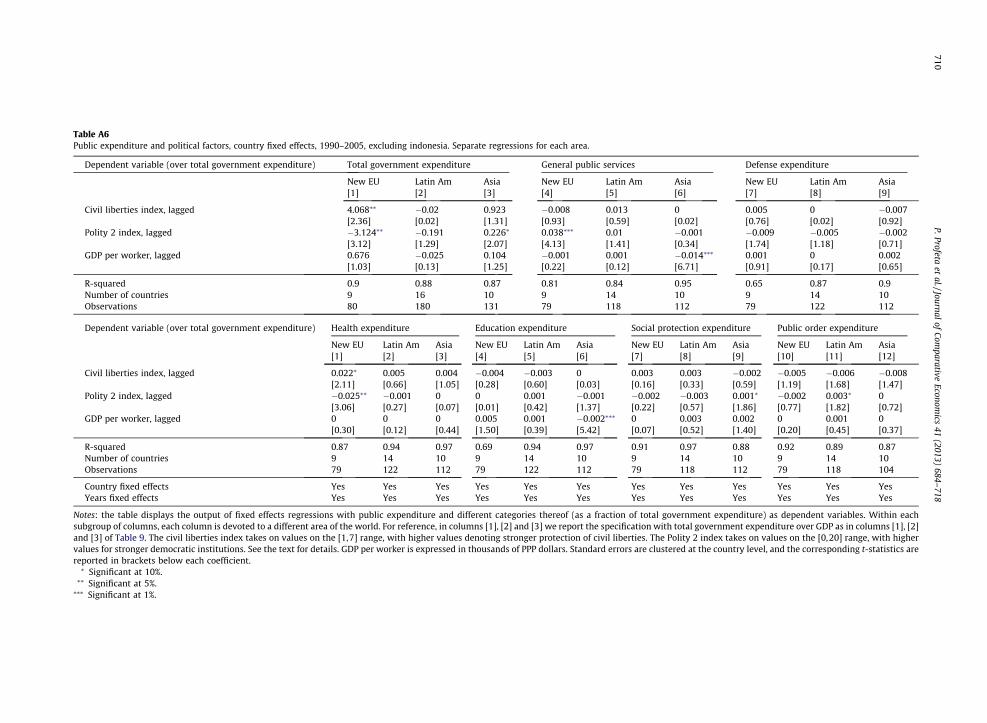
Table A6Public expenditure and political factors, country fixed effects, 1990–2005, excluding indonesia. Separate regressions for each area.
Dependent variable (over total government expenditure) Total government expenditure General public services Defense expenditure
New EU Latin Am Asia New EU Latin Am Asia New EU Latin Am Asia[1] [2] [3] [4] [5] [6] [7] [8] [9]
Civil liberties index, lagged 4.068⁄⁄ �0.02 0.923 �0.008 0.013 0 0.005 0 �0.007[2.36] [0.02] [1.31] [0.93] [0.59] [0.02] [0.76] [0.02] [0.92]
Polity 2 index, lagged �3.124⁄⁄ �0.191 0.226⁄ 0.038⁄⁄⁄ 0.01 �0.001 �0.009 �0.005 �0.002[3.12] [1.29] [2.07] [4.13] [1.41] [0.34] [1.74] [1.18] [0.71]
GDP per worker, lagged 0.676 �0.025 0.104 �0.001 0.001 �0.014⁄⁄⁄ 0.001 0 0.002[1.03] [0.13] [1.25] [0.22] [0.12] [6.71] [0.91] [0.17] [0.65]
R-squared 0.9 0.88 0.87 0.81 0.84 0.95 0.65 0.87 0.9Number of countries 9 16 10 9 14 10 9 14 10Observations 80 180 131 79 118 112 79 122 112
Dependent variable (over total government expenditure) Health expenditure Education expenditure Social protection expenditure Public order expenditure
New EU Latin Am Asia New EU Latin Am Asia New EU Latin Am Asia New EU Latin Am Asia[1] [2] [3] [4] [5] [6] [7] [8] [9] [10] [11] [12]
Civil liberties index, lagged 0.022⁄ 0.005 0.004 �0.004 �0.003 0 0.003 0.003 �0.002 �0.005 �0.006 �0.008[2.11] [0.66] [1.05] [0.28] [0.60] [0.03] [0.16] [0.33] [0.59] [1.19] [1.68] [1.47]
Polity 2 index, lagged �0.025⁄⁄ �0.001 0 0 0.001 �0.001 �0.002 �0.003 0.001⁄ �0.002 0.003⁄ 0[3.06] [0.27] [0.07] [0.01] [0.42] [1.37] [0.22] [0.57] [1.86] [0.77] [1.82] [0.72]
GDP per worker, lagged 0 0 0 0.005 0.001 �0.002⁄⁄⁄ 0 0.003 0.002 0 0.001 0[0.30] [0.12] [0.44] [1.50] [0.39] [5.42] [0.07] [0.52] [1.40] [0.20] [0.45] [0.37]
R-squared 0.87 0.94 0.97 0.69 0.94 0.97 0.91 0.97 0.88 0.92 0.89 0.87Number of countries 9 14 10 9 14 10 9 14 10 9 14 10Observations 79 122 112 79 122 112 79 118 112 79 118 104
Country fixed effects Yes Yes Yes Yes Yes Yes Yes Yes Yes Yes Yes YesYears fixed effects Yes Yes Yes Yes Yes Yes Yes Yes Yes Yes Yes Yes
Notes: the table displays the output of fixed effects regressions with public expenditure and different categories thereof (as a fraction of total government expenditure) as dependent variables. Within eachsubgroup of columns, each column is devoted to a different area of the world. For reference, in columns [1], [2] and [3] we report the specification with total government expenditure over GDP as in columns [1], [2]and [3] of Table 9. The civil liberties index takes on values on the [1,7] range, with higher values denoting stronger protection of civil liberties. The Polity 2 index takes on values on the [0,20] range, with highervalues for stronger democratic institutions. See the text for details. GDP per worker is expressed in thousands of PPP dollars. Standard errors are clustered at the country level, and the corresponding t-statistics arereported in brackets below each coefficient.⁄ Significant at 10%.⁄⁄ Significant at 5%.⁄⁄⁄ Significant at 1%.
710P.Profeta
etal./Journal
ofCom
parativeEconom
ics41
(2013)684–
718

Table A7Tax sources and political factors, pooled OLS estimates, 1990–2005, excluding Indonesia.
Dependent variable (over GDP) Taxrevenue
Personal incometax
Corporate incometax
Directtaxes
Indirecttaxes
Propertytaxes
Tradetaxes
Socialsecurity
[1] [2] [3] [4] [5] [6] [7] [8]
Civil liberties index, lagged �0.0696 0.709⁄⁄⁄ �0.521⁄ 0.0430 0.628⁄⁄ �0.117⁄ �0.0738 �0.672[�0.133] [3.570] [�2.025] [0.143] [2.113] [�2.035] [�0.260] [�1.397]
Polity 2 index, lagged 0.141 �0.109⁄⁄ �0.0434 �0.0506 �0.0199 0.0177 0.0239 0.275⁄⁄
[1.045] [�2.560] [�0.669] [�0.675] [�0.262] [1.052] [0.349] [2.248]Turnout, lagged 0.0880⁄⁄⁄ �0.0219⁄ 0.0141 0.00646 0.0418⁄⁄ 0.00844⁄⁄⁄ 0.00529 0.0491⁄⁄
[3.235] [�1.954] [1.094] [0.425] [2.601] [2.783] [0.470] [2.524]GDP per worker, lagged 0.00400 �0.00586 0.0967⁄⁄⁄ 0.0538⁄⁄ �0.0874⁄⁄⁄ 0.0196⁄⁄⁄ �0.0294 0.0310
[0.0840] [�0.230] [3.087] [2.204] [�3.208] [4.136] [�1.422] [0.557]Latin America dummy �21.11⁄⁄⁄ �4.578⁄⁄⁄ �1.054⁄ �5.693⁄⁄⁄ �5.695⁄⁄⁄ 0 �0.663 �10.08⁄⁄⁄
[�14.43] [�10.31] [�1.838] [�10.50] [�8.598] [.] [�0.863] [�10.98]Asia dummy �19.80⁄⁄⁄ �3.419⁄⁄⁄ �0.0341 �3.967⁄⁄⁄ �5.532⁄⁄⁄ �0.0510 0.278 �11.23⁄⁄⁄
[�10.75] [�6.968] [�0.0506] [�5.188] [�5.261] [�0.654] [0.302] [�9.355]
R-squared 0.889 0.874 0.364 0.734 0.652 0.394 0.221 0.863Number of countries 37 29 31 37 37 27 37 31Observations 127 82 87 126 126 96 124 104
Civil liberties index, lagged �0.0368 0.670⁄⁄⁄ �0.493⁄ 0.0377 0.604⁄ �0.113⁄ �0.0332 �0.668[�0.0660] [3.188] [�1.820] [0.121] [2.004] [�1.847] [�0.125] [�1.416]
Polity 2 index, lagged �0.259 0.0244 �0.170 0.0124 0.262 �0.0695 �0.467⁄⁄ 0.608[�0.363] [0.113] [�0.515] [0.0328] [0.715] [�0.747] [�2.321] [0.452]
Polity 2 index squared, lagged 0.0150 �0.00500 0.00477 �0.00236 �0.0106 0.00333 0.0184⁄⁄ �0.0102[0.562] [�0.617] [0.367] [�0.181] [�0.786] [1.000] [2.209] [�0.237]
Turnout, lagged 0.0835⁄⁄⁄ �0.0201 0.0125 0.00721 0.0451⁄⁄ 0.00723⁄ �0.000476 0.0490⁄⁄
[2.998] [�1.667] [0.877] [0.416] [2.709] [2.015] [�0.0440] [2.517]GDP per worker, lagged 0.00636 �0.00547 0.0963⁄⁄⁄ 0.0534⁄⁄ �0.0890⁄⁄⁄ 0.0208⁄⁄⁄ �0.0264 0.0328
[0.134] [�0.217] [3.022] [2.158] [�3.214] [4.468] [�1.354] [0.588]Latin America dummy �20.91⁄⁄⁄ �4.673⁄⁄⁄ �0.982 �5.723⁄⁄⁄ �5.833⁄⁄⁄ 0 �0.419 �10.09⁄⁄⁄
[�13.70] [�9.213] [�1.433] [�9.369] [�7.851] [.] [�0.622] [�10.83]Asia dummy �19.68⁄⁄⁄ �3.503⁄⁄⁄ 0.0269 �3.985⁄⁄⁄ �5.614⁄⁄⁄ �0.0710 0.424 �11.27⁄⁄⁄
[�10.48] [�6.459] [0.0380] [�5.193] [�5.384] [�0.835] [0.501] [�9.235]
R-squared 0.890 0.874 0.366 0.734 0.654 0.408 0.249 0.863Number of countries 37 29 31 37 37 27 37 31Observations 127 82 87 126 126 96 124 104
Civil liberties index, lagged �0.0427 0.638⁄⁄⁄ �0.426 �0.0673 0.715⁄⁄ �0.0608 �0.108 �0.324[�0.0879] [3.298] [�1.348] [�0.242] [2.192] [�1.101] [�0.387] [�0.951]
Polity 2 index, lagged �0.664 0.0597 �0.0548 �0.0227 0.162 0.0477 �0.354 0.479[�0.886] [0.213] [�0.159] [�0.0679] [0.297] [0.500] [�1.018] [0.535]
Polity 2 index squared, lagged 0.0262 �0.00601 0.00139 0.000149 �0.00796 �0.000767 0.0149 �0.0123[0.935] [�0.606] [0.100] [0.0117] [�0.401] [�0.224] [1.150] [�0.409]
Turnout, lagged 0.0459 �0.0177 0.0109 0.000335 0.0307 0.00159 0.00246 0.0253[1.520] [�1.147] [0.685] [0.0241] [1.488] [0.454] [0.207] [1.444]
GDP per worker, lagged 0.0225 0.0177 0.0221 0.0609 �0.151⁄⁄⁄ 0.00160 0.0551 �0.00725[0.240] [0.455] [0.325] [1.261] [�2.850] [0.185] [1.128] [�0.149]
Trade openness index, lagged 0.00804 �0.00262 0.000826 0.00366 �0.00122 �0.000562 0.00668⁄⁄ 0.00510[0.588] [�0.840] [0.191] [0.552] [�0.110] [�0.524] [2.305] [0.524]
Government debt/GDP, lagged 0.0390⁄⁄⁄ 0.00758 �0.0247⁄⁄ 0.000648 0.0175⁄ 0.00262⁄⁄ 0.00906 0.0134[2.984] [0.843] [�2.771] [0.0871] [2.028] [2.402] [1.308] [1.646]
Agriculture/GDP, lagged �0.170⁄ �0.0528 �0.0541 �0.151⁄⁄⁄ �0.0576 �0.0210⁄ 0.0859⁄⁄⁄ �0.104[�1.935] [�1.308] [�1.235] [�3.263] [�1.107] [�2.011] [4.159] [�1.418]
Female labor force participation,lagged
0.105⁄⁄⁄ 0.0128 0.00425 0.0318 0.0520⁄ �0.000258 0.00589 0.0477⁄
[2.927] [0.578] [0.189] [1.621] [1.708] [�0.0753] [0.559] [1.708]Old age population, lagged 0.264 �0.0408 �0.160 �0.535⁄⁄⁄ 0.516⁄ 0.0827⁄⁄ �0.0468 0.438⁄⁄
[0.563] [�0.266] [�1.080] [�3.163] [1.909] [2.563] [�0.380] [2.059]Latin America dummy �19.15⁄⁄⁄ �4.760⁄⁄⁄ �2.214⁄ �8.568⁄⁄⁄ �1.998 �0.00363 �1.368 �7.164⁄⁄⁄
[�5.601] [�3.623] [�1.757] [�6.970] [�1.004] [�0.0463] [�1.024] [�4.921]Asia dummy �17.24⁄⁄⁄ �3.217⁄⁄⁄ �0.784 �6.208⁄⁄⁄ �1.344 0 �0.939 �9.542⁄⁄⁄
[�5.466] [�2.990] [�0.666] [�5.304] [�0.792] [.] [�0.637] [�7.224]
R-squared 0.930 0.879 0.529 0.817 0.647 0.459 0.384 0.936Number of countries 31 24 26 31 31 24 31 27Observations 100 67 72 99 99 79 98 85
Country fixed effects No No No No No No No NoYear fixed effects Yes Yes Yes Yes Yes Yes Yes Yes
Notes: the table displays the output of fixed effects regressions with tax revenue and different categories thereof (as a fraction of GDP) as dependentvariables. Each column is devoted to a different revenue source, with different specifications being stacked in the same column. Following Mueller andStratmann (2003), in this set of regressions we control for parliamentary voter turnout. See the text for additional details. The civil liberties index takes onvalues on the [1,7] range, with higher values denoting stronger protection of civil liberties. The Polity 2 index takes on values on the [0, 20] range, withhigher values for stronger democratic institutions. See the text for details. GDP per worker is expressed in thousands of PPP dollars. Region dummies areincluded, with New EU members as the excluded category. Standard errors are clustered at the country level, and the corresponding t-statistics are reportedin brackets below each coefficient.⁄ Significant at 10%.⁄⁄ Significant at 5%.⁄⁄⁄ Significant at 1%.
P. Profeta et al. / Journal of Comparative Economics 41 (2013) 684–718 711

Table A8Tax sources and political factors, country fixed effects, 1990–2005, excluding Indonesia.
Dependent variable (overGDP)
Taxrevenue
Personalincome tax
Corporateincome tax
Directtaxes
Indirecttaxes
Propertytaxes
Tradetaxes
Socialsecurity
[1] [2] [3] [4] [5] [6] [7] [8]
Civil liberties index, lagged 0.310 0.226 0.450 0.333 �0.129 0.00509 0.0452 0.234[0.805] [1.122] [1.440] [1.353] [�0.468] [0.0360] [0.216] [1.145]
Polity 2 index, lagged �0.00467 0.000696 �0.0377 �0.0604 0.0588 0.0104 0.00832 �0.0504[�0.0519] [0.0255] [�0.592] [�1.189] [1.005] [0.601] [0.0998] [�0.721]
Turnout, lagged �0.00144 0.0271⁄ �0.00695 0.00814 0.00704 �0.00289 �0.0102 0.00840[�0.0649] [1.794] [�0.358] [0.770] [0.529] [�0.819] [�0.953] [0.865]
GDP per worker, lagged �0.207 �0.0987 �0.0354 �0.0422 �0.0124 �0.0503 �0.0703 �0.123⁄⁄
[�1.514] [�0.897] [�0.390] [�0.648] [�0.114] [�1.665] [�0.675] [�2.314]
R-squared 0.981 0.978 0.842 0.938 0.899 0.729 0.711 0.990Number of countries 37 29 31 37 37 27 37 31Observations 127 82 87 126 126 96 124 104
Civil liberties index, lagged 0.367 0.218 0.536 0.386 �0.105 0.00325 0.0399 0.237[0.961] [1.084] [1.640] [1.681] [�0.370] [0.0235] [0.176] [1.097]
Polity 2 index, lagged 0.453 �0.130 0.553 0.369 0.252 �0.00940 �0.0332 0.0335[0.738] [�0.874] [0.836] [1.157] [0.506] [�0.0661] [�0.0764] [0.0506]
Polity 2 index squared, lagged �0.0174 0.00517 �0.0234 �0.0163 �0.00735 0.000756 0.00158 �0.00274[�0.696] [0.827] [�0.848] [�1.256] [�0.383] [0.140] [0.103] [�0.127]
Turnout, lagged �0.000755 0.0282⁄ �0.0115 0.00886 0.00736 �0.00293 �0.0103 0.00823[�0.0327] [1.770] [�0.495] [0.850] [0.529] [�0.785] [�0.935] [0.896]
GDP per worker, lagged �0.200 �0.0975 �0.0353 �0.0359 �0.00955 �0.0507 �0.0709 �0.121⁄⁄
[�1.487] [�0.877] [�0.411] [�0.553] [�0.0881] [�1.695] [�0.675] [�2.205]
R-squared 0.981 0.978 0.849 0.939 0.899 0.729 0.711 0.990Number of countries 37 29 31 37 37 27 37 31Observations 127 82 87 126 126 96 124 104
Civil liberties index, lagged 0.508 0.273 0.413 0.283 �0.268 0.235 0.316 0.342⁄⁄
[0.771] [0.843] [0.910] [0.757] [�0.495] [1.319] [0.789] [2.079]Polity 2 index, lagged 0.773 �0.237 0.185 0.251 0.251 �0.0404 0.0366 0.957
[1.203] [�0.714] [0.324] [0.662] [0.430] [�0.308] [0.0758] [1.052]Polity 2 index squared, lagged �0.0339 0.00894 �0.0124 �0.0136 �0.0115 0.00124 0.00148 �0.0345
[�1.295] [0.735] [�0.487] [�0.856] [�0.509] [0.234] [0.0782] [�1.123]Turnout, lagged �0.0457⁄⁄ 0.0182 �0.00711 �0.00515 �0.00384 0.000949 �0.0229 0.000669
[�2.271] [0.927] [�0.256] [�0.427] [�0.165] [0.213] [�1.158] [0.0565]GDP per worker, lagged �0.149 �0.0754 0.0439 0.0202 0.114 �0.0279 �0.300 �0.0379
[�0.698] [�0.666] [0.254] [0.147] [0.387] [�0.475] [�1.133] [�0.720]Trade openness index, lagged �0.0134 0.00514 0.00784 0.00488 �0.0118 0.00538 0.000550 �0.00976
[�0.560] [0.830] [0.632] [0.391] [�0.482] [1.149] [0.0240] [�0.984]Government debt/GDP, lagged 0.00559 �0.00119 �0.00734 �0.00390 0.00602 0.00826⁄⁄ �0.00708 0.00464
[0.389] [�0.129] [�0.646] [�0.404] [0.447] [2.201] [�0.956] [0.495]Agriculture/GDP, lagged 0.0969 0.0156 0.0522 0.0463 0.0308 0.00753 0.0595 �0.0585
[0.703] [0.108] [0.387] [0.807] [0.204] [0.307] [0.716] [�0.795]Female labor force
participation, lagged0.0969 0.0218 0.0791 0.0192 0.0587 0.0619⁄⁄⁄ 0.0429 �0.0689
[0.626] [0.342] [0.795] [0.381] [0.393] [3.036] [0.804] [�1.626]Old age population, lagged �1.054 �1.154 �0.324 �1.454 0.357 0.102 �0.0655 �0.627
[�0.573] [�1.177] [�0.315] [�1.283] [0.198] [0.358] [�0.0376] [�0.701]
R-squared 0.987 0.982 0.876 0.949 0.886 0.802 0.756 0.992Number of countries 31 24 26 31 31 24 31 27Observations 100 67 72 99 99 79 98 85
Country fixed effects Yes Yes Yes Yes Yes Yes Yes YesYear fixed effects Yes Yes Yes Yes Yes Yes Yes Yes
Notes: the table displays the output of fixed effects regressions with tax revenue and different categories thereof (as a fraction of GDP) as dependentvariables. Each column is devoted to a different revenue source, with different specifications being stacked in the same column. Following Mueller andStratmann (2003), in this set of regressions we control for parliamentary voter turnout. See the text for additional details. The civil liberties index takes onvalues on the [1,7] range, with higher values denoting stronger protection of civil liberties. The Polity 2 index takes on values on the [0,20] range, withhigher values for stronger democratic institutions. See the text for details. GDP per worker is expressed in thousands of PPP dollars. Standard errors areclustered at the country level, and the corresponding t-statistics are reported in brackets below each coefficient.⁄ Significant at 10%.⁄⁄ Significant at 5%.⁄⁄⁄ Significant at 1%.
712 P. Profeta et al. / Journal of Comparative Economics 41 (2013) 684–718
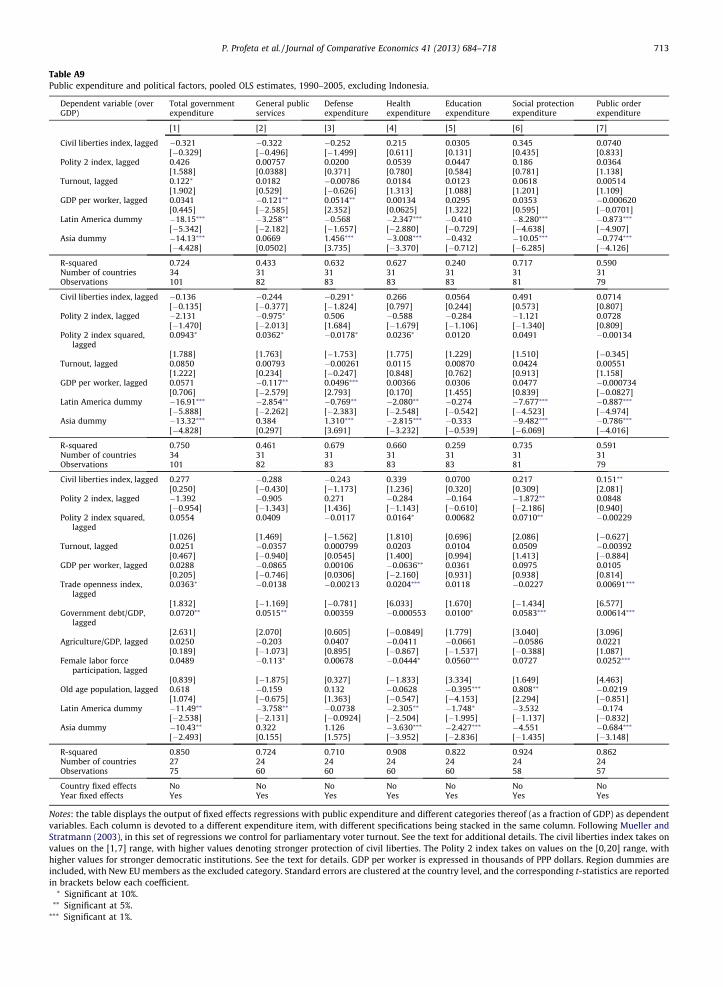
Table A9Public expenditure and political factors, pooled OLS estimates, 1990–2005, excluding Indonesia.
Dependent variable (overGDP)
Total governmentexpenditure
General publicservices
Defenseexpenditure
Healthexpenditure
Educationexpenditure
Social protectionexpenditure
Public orderexpenditure
[1] [2] [3] [4] [5] [6] [7]
Civil liberties index, lagged �0.321 �0.322 �0.252 0.215 0.0305 0.345 0.0740[�0.329] [�0.496] [�1.499] [0.611] [0.131] [0.435] [0.833]
Polity 2 index, lagged 0.426 0.00757 0.0200 0.0539 0.0447 0.186 0.0364[1.588] [0.0388] [0.371] [0.780] [0.584] [0.781] [1.138]
Turnout, lagged 0.122⁄ 0.0182 �0.00786 0.0184 0.0123 0.0618 0.00514[1.902] [0.529] [�0.626] [1.313] [1.088] [1.201] [1.109]
GDP per worker, lagged 0.0341 �0.121⁄⁄ 0.0514⁄⁄ 0.00134 0.0295 0.0353 �0.000620[0.445] [�2.585] [2.352] [0.0625] [1.322] [0.595] [�0.0701]
Latin America dummy �18.15⁄⁄⁄ �3.258⁄⁄ �0.568 �2.347⁄⁄⁄ �0.410 �8.280⁄⁄⁄ �0.873⁄⁄⁄
[�5.342] [�2.182] [�1.657] [�2.880] [�0.729] [�4.638] [�4.907]Asia dummy �14.13⁄⁄⁄ 0.0669 1.456⁄⁄⁄ �3.008⁄⁄⁄ �0.432 �10.05⁄⁄⁄ �0.774⁄⁄⁄
[�4.428] [0.0502] [3.735] [�3.370] [�0.712] [�6.285] [�4.126]
R-squared 0.724 0.433 0.632 0.627 0.240 0.717 0.590Number of countries 34 31 31 31 31 31 31Observations 101 82 83 83 83 81 79
Civil liberties index, lagged �0.136 �0.244 �0.291⁄ 0.266 0.0564 0.491 0.0714[�0.135] [�0.377] [�1.824] [0.797] [0.244] [0.573] [0.807]
Polity 2 index, lagged �2.131 �0.975⁄ 0.506 �0.588 �0.284 �1.121 0.0728[�1.470] [�2.013] [1.684] [�1.679] [�1.106] [�1.340] [0.809]
Polity 2 index squared,lagged
0.0943⁄ 0.0362⁄ �0.0178⁄ 0.0236⁄ 0.0120 0.0491 �0.00134
[1.788] [1.763] [�1.753] [1.775] [1.229] [1.510] [�0.345]Turnout, lagged 0.0850 0.00793 �0.00261 0.0115 0.00870 0.0424 0.00551
[1.222] [0.234] [�0.247] [0.848] [0.762] [0.913] [1.158]GDP per worker, lagged 0.0571 �0.117⁄⁄ 0.0496⁄⁄⁄ 0.00366 0.0306 0.0477 �0.000734
[0.706] [�2.579] [2.793] [0.170] [1.455] [0.839] [�0.0827]Latin America dummy �16.91⁄⁄⁄ �2.854⁄⁄ �0.769⁄⁄ �2.080⁄⁄ �0.274 �7.677⁄⁄⁄ �0.887⁄⁄⁄
[�5.888] [�2.262] [�2.383] [�2.548] [�0.542] [�4.523] [�4.974]Asia dummy �13.32⁄⁄⁄ 0.384 1.310⁄⁄⁄ �2.815⁄⁄⁄ �0.333 �9.482⁄⁄⁄ �0.786⁄⁄⁄
[�4.828] [0.297] [3.691] [�3.232] [�0.539] [�6.069] [�4.016]
R-squared 0.750 0.461 0.679 0.660 0.259 0.735 0.591Number of countries 34 31 31 31 31 31 31Observations 101 82 83 83 83 81 79
Civil liberties index, lagged 0.277 �0.288 �0.243 0.339 0.0700 0.217 0.151⁄⁄
[0.250] [�0.430] [�1.173] [1.236] [0.320] [0.309] [2.081]Polity 2 index, lagged �1.392 �0.905 0.271 �0.284 �0.164 �1.872⁄⁄ 0.0848
[�0.954] [�1.343] [1.436] [�1.143] [�0.610] [�2.186] [0.940]Polity 2 index squared,
lagged0.0554 0.0409 �0.0117 0.0164⁄ 0.00682 0.0710⁄⁄ �0.00229
[1.026] [1.469] [�1.562] [1.810] [0.696] [2.086] [�0.627]Turnout, lagged 0.0251 �0.0357 0.000799 0.0203 0.0104 0.0509 �0.00392
[0.467] [�0.940] [0.0545] [1.400] [0.994] [1.413] [�0.884]GDP per worker, lagged 0.0288 �0.0865 0.00106 �0.0636⁄⁄ 0.0361 0.0975 0.0105
[0.205] [�0.746] [0.0306] [�2.160] [0.931] [0.938] [0.814]Trade openness index,
lagged0.0363⁄ �0.0138 �0.00213 0.0204⁄⁄⁄ 0.0118 �0.0227 0.00691⁄⁄⁄
[1.832] [�1.169] [�0.781] [6.033] [1.670] [�1.434] [6.577]Government debt/GDP,
lagged0.0720⁄⁄ 0.0515⁄⁄ 0.00359 �0.000553 0.0100⁄ 0.0583⁄⁄⁄ 0.00614⁄⁄⁄
[2.631] [2.070] [0.605] [�0.0849] [1.779] [3.040] [3.096]Agriculture/GDP, lagged 0.0250 �0.203 0.0407 �0.0411 �0.0661 �0.0586 0.0221
[0.189] [�1.073] [0.895] [�0.867] [�1.537] [�0.388] [1.087]Female labor force
participation, lagged0.0489 �0.113⁄ 0.00678 �0.0444⁄ 0.0560⁄⁄⁄ 0.0727 0.0252⁄⁄⁄
[0.839] [�1.875] [0.327] [�1.833] [3.334] [1.649] [4.463]Old age population, lagged 0.618 �0.159 0.132 �0.0628 �0.395⁄⁄⁄ 0.808⁄⁄ �0.0219
[1.074] [�0.675] [1.363] [�0.547] [�4.153] [2.294] [�0.851]Latin America dummy �11.49⁄⁄ �3.758⁄⁄ �0.0738 �2.305⁄⁄ �1.748⁄ �3.532 �0.174
[�2.538] [�2.131] [�0.0924] [�2.504] [�1.995] [�1.137] [�0.832]Asia dummy �10.43⁄⁄ 0.322 1.126 �3.630⁄⁄⁄ �2.427⁄⁄⁄ �4.551 �0.684⁄⁄⁄
[�2.493] [0.155] [1.575] [�3.952] [�2.836] [�1.435] [�3.148]
R-squared 0.850 0.724 0.710 0.908 0.822 0.924 0.862Number of countries 27 24 24 24 24 24 24Observations 75 60 60 60 60 58 57
Country fixed effects No No No No No No NoYear fixed effects Yes Yes Yes Yes Yes Yes Yes
Notes: the table displays the output of fixed effects regressions with public expenditure and different categories thereof (as a fraction of GDP) as dependentvariables. Each column is devoted to a different expenditure item, with different specifications being stacked in the same column. Following Mueller andStratmann (2003), in this set of regressions we control for parliamentary voter turnout. See the text for additional details. The civil liberties index takes onvalues on the [1,7] range, with higher values denoting stronger protection of civil liberties. The Polity 2 index takes on values on the [0, 20] range, withhigher values for stronger democratic institutions. See the text for details. GDP per worker is expressed in thousands of PPP dollars. Region dummies areincluded, with New EU members as the excluded category. Standard errors are clustered at the country level, and the corresponding t-statistics are reportedin brackets below each coefficient.⁄ Significant at 10%.⁄⁄ Significant at 5%.⁄⁄⁄ Significant at 1%.
P. Profeta et al. / Journal of Comparative Economics 41 (2013) 684–718 713
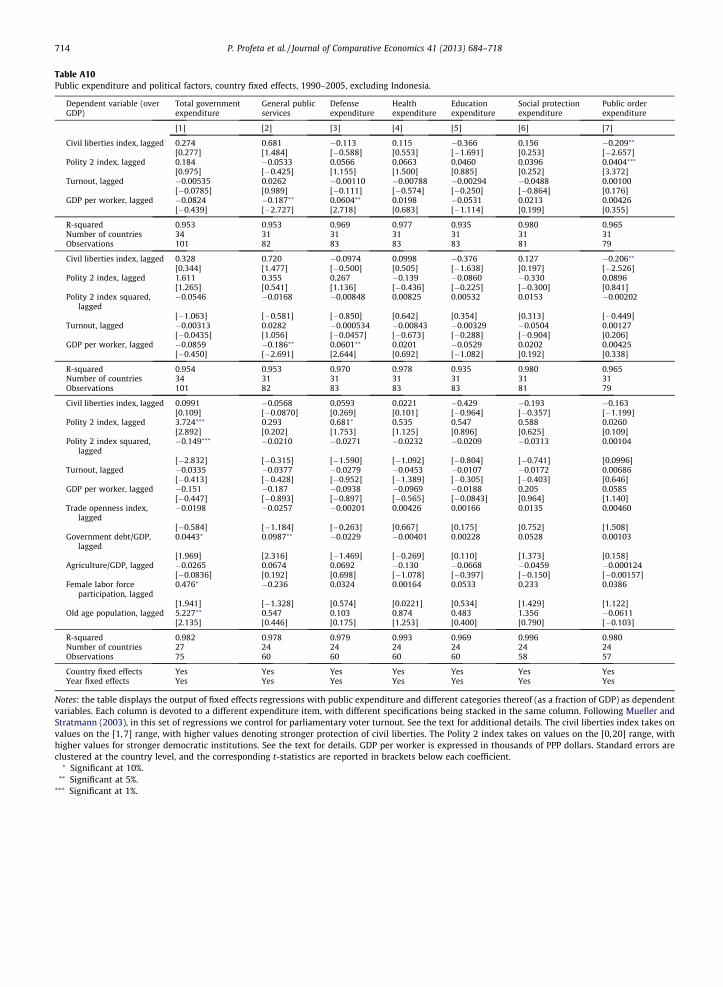
Table A10Public expenditure and political factors, country fixed effects, 1990–2005, excluding Indonesia.
Dependent variable (overGDP)
Total governmentexpenditure
General publicservices
Defenseexpenditure
Healthexpenditure
Educationexpenditure
Social protectionexpenditure
Public orderexpenditure
[1] [2] [3] [4] [5] [6] [7]
Civil liberties index, lagged 0.274 0.681 �0.113 0.115 �0.366 0.156 �0.209⁄⁄
[0.277] [1.484] [�0.588] [0.553] [�1.691] [0.253] [�2.657]Polity 2 index, lagged 0.184 �0.0533 0.0566 0.0663 0.0460 0.0396 0.0404⁄⁄⁄
[0.975] [�0.425] [1.155] [1.500] [0.885] [0.252] [3.372]Turnout, lagged �0.00535 0.0262 �0.00110 �0.00788 �0.00294 �0.0488 0.00100
[�0.0785] [0.989] [�0.111] [�0.574] [�0.250] [�0.864] [0.176]GDP per worker, lagged �0.0824 �0.187⁄⁄ 0.0604⁄⁄ 0.0198 �0.0531 0.0213 0.00426
[�0.439] [�2.727] [2.718] [0.683] [�1.114] [0.199] [0.355]
R-squared 0.953 0.953 0.969 0.977 0.935 0.980 0.965Number of countries 34 31 31 31 31 31 31Observations 101 82 83 83 83 81 79
Civil liberties index, lagged 0.328 0.720 �0.0974 0.0998 �0.376 0.127 �0.206⁄⁄
[0.344] [1.477] [�0.500] [0.505] [�1.638] [0.197] [�2.526]Polity 2 index, lagged 1.611 0.355 0.267 �0.139 �0.0860 �0.330 0.0896
[1.265] [0.541] [1.136] [�0.436] [�0.225] [�0.300] [0.841]Polity 2 index squared,
lagged�0.0546 �0.0168 �0.00848 0.00825 0.00532 0.0153 �0.00202
[�1.063] [�0.581] [�0.850] [0.642] [0.354] [0.313] [�0.449]Turnout, lagged �0.00313 0.0282 �0.000534 �0.00843 �0.00329 �0.0504 0.00127
[�0.0435] [1.056] [�0.0457] [�0.673] [�0.288] [�0.904] [0.206]GDP per worker, lagged �0.0859 �0.186⁄⁄ 0.0601⁄⁄ 0.0201 �0.0529 0.0202 0.00425
[�0.450] [�2.691] [2.644] [0.692] [�1.082] [0.192] [0.338]
R-squared 0.954 0.953 0.970 0.978 0.935 0.980 0.965Number of countries 34 31 31 31 31 31 31Observations 101 82 83 83 83 81 79
Civil liberties index, lagged 0.0991 �0.0568 0.0593 0.0221 �0.429 �0.193 �0.163[0.109] [�0.0870] [0.269] [0.101] [�0.964] [�0.357] [�1.199]
Polity 2 index, lagged 3.724⁄⁄⁄ 0.293 0.681⁄ 0.535 0.547 0.588 0.0260[2.892] [0.202] [1.753] [1.125] [0.896] [0.625] [0.109]
Polity 2 index squared,lagged
�0.149⁄⁄⁄ �0.0210 �0.0271 �0.0232 �0.0209 �0.0313 0.00104
[�2.832] [�0.315] [�1.590] [�1.092] [�0.804] [�0.741] [0.0996]Turnout, lagged �0.0335 �0.0377 �0.0279 �0.0453 �0.0107 �0.0172 0.00686
[�0.413] [�0.428] [�0.952] [�1.389] [�0.305] [�0.403] [0.646]GDP per worker, lagged �0.151 �0.187 �0.0938 �0.0969 �0.0188 0.205 0.0585
[�0.447] [�0.893] [�0.897] [�0.565] [�0.0843] [0.964] [1.140]Trade openness index,
lagged�0.0198 �0.0257 �0.00201 0.00426 0.00166 0.0135 0.00460
[�0.584] [�1.184] [�0.263] [0.667] [0.175] [0.752] [1.508]Government debt/GDP,
lagged0.0443⁄ 0.0987⁄⁄ �0.0229 �0.00401 0.00228 0.0528 0.00103
[1.969] [2.316] [�1.469] [�0.269] [0.110] [1.373] [0.158]Agriculture/GDP, lagged �0.0265 0.0674 0.0692 �0.130 �0.0668 �0.0459 �0.000124
[�0.0836] [0.192] [0.698] [�1.078] [�0.397] [�0.150] [�0.00157]Female labor force
participation, lagged0.476⁄ �0.236 0.0324 0.00164 0.0533 0.233 0.0386
[1.941] [�1.328] [0.574] [0.0221] [0.534] [1.429] [1.122]Old age population, lagged 5.227⁄⁄ 0.547 0.103 0.874 0.483 1.356 �0.0611
[2.135] [0.446] [0.175] [1.253] [0.400] [0.790] [�0.103]
R-squared 0.982 0.978 0.979 0.993 0.969 0.996 0.980Number of countries 27 24 24 24 24 24 24Observations 75 60 60 60 60 58 57
Country fixed effects Yes Yes Yes Yes Yes Yes YesYear fixed effects Yes Yes Yes Yes Yes Yes Yes
Notes: the table displays the output of fixed effects regressions with public expenditure and different categories thereof (as a fraction of GDP) as dependentvariables. Each column is devoted to a different expenditure item, with different specifications being stacked in the same column. Following Mueller andStratmann (2003), in this set of regressions we control for parliamentary voter turnout. See the text for additional details. The civil liberties index takes onvalues on the [1,7] range, with higher values denoting stronger protection of civil liberties. The Polity 2 index takes on values on the [0,20] range, withhigher values for stronger democratic institutions. See the text for details. GDP per worker is expressed in thousands of PPP dollars. Standard errors areclustered at the country level, and the corresponding t-statistics are reported in brackets below each coefficient.⁄ Significant at 10%.⁄⁄ Significant at 5%.⁄⁄⁄ Significant at 1%.
714 P. Profeta et al. / Journal of Comparative Economics 41 (2013) 684–718

Table A11Tax sources and political factors, Blundell and Bond estimates, 1990–2005, excluding Indonesia.
Dependent variable (overGDP)
Taxrevenue
Personalincome tax
Corporateincome tax
Directtaxes
Indirecttaxes
Propertytaxes
Tradetaxes
Socialsecurity
[1] [2] [3] [4] [5] [6] [7] [8]
Dependent variable, lagged 0.853⁄⁄⁄ 0.926⁄⁄⁄ 0.570⁄⁄⁄ 0.850⁄⁄⁄ 0.422⁄⁄⁄ 0.741⁄⁄⁄ 0.809⁄⁄⁄ 0.888⁄⁄⁄
[41.56] [25.34] [10.08] [21.35] [11.67] [10.50] [37.91] [32.75]Civil liberties index, lagged 0.442⁄⁄ �0.036 �0.0239 0.0354 �0.14 0.00696 0.0212 0.0139
[2.536] [�0.519] [�0.208] [0.331] [�1.248] [0.187] [0.274] [0.166]Polity 2 index, lagged 0.0437 �0.0129 0.0142 �0.0242 �0.02 �0.00301 0.0257 �0.021
[1.111] [�0.919] [0.543] [�0.978] [�0.783] [�0.407] [1.462] [�0.574]GDP per worker, lagged 0.0560⁄⁄⁄ 0.0196⁄⁄ 0.0213 0.0298⁄⁄ 0.0998⁄⁄⁄ �0.00121 �0.0150⁄⁄ 0.0475⁄⁄⁄
[3.306] [2.433] [1.606] [2.475] [10.36] [�0.368] [�2.560] [4.009]
Number of countries 38 30 32 38 38 28 38 32Observations 476 316 344 469 473 351 465 367p-Value on first lag of error
term0 0 0 0 0.00135 7.01E�08 8.83E�07 0
p-Value on second lag of errorterm
0.448 0.914 0.00173 0.00834 0.138 0.00345 8.85E�07 0.239
Dependent variable, lagged 0.860⁄⁄⁄ 0.906⁄⁄⁄ 0.587⁄⁄⁄ 0.832⁄⁄⁄ 0.396⁄⁄⁄ 0.716⁄⁄⁄ 0.832⁄⁄⁄ 0.879⁄⁄⁄
[42.22] [26.43] [11.85] [21.88] [11.91] [12.57] [37.60] [33.17]Civil liberties index, lagged 0.442⁄⁄⁄ �0.00434 0.0176 0.0663 0.0136 0.00553 0.021 0.00967
[2.706] [�0.0672] [0.167] [0.673] [0.131] [0.158] [0.287] [0.123]Polity 2 index, lagged 0.682⁄⁄⁄ �0.0384 0.0417 0.0158 0.218 0.0967⁄ 0.208⁄ �0.212
[2.831] [�0.383] [0.284] [0.106] [1.382] [1.881] [1.899] [�0.975]Polity 2 index squared, lagged �0.0278⁄⁄⁄ 0.000918 �0.00126 �0.00181 �0.0111⁄ �0.00416⁄⁄ �0.00781⁄ 0.00726
[�2.777] [0.225] [�0.206] [�0.290] [�1.692] [�2.003] [�1.721] [0.970]GDP per worker, lagged 0.0624⁄⁄⁄ 0.0231⁄⁄⁄ 0.0186 0.0343⁄⁄⁄ 0.106⁄⁄⁄ �0.00117 �0.0126⁄⁄ 0.0458⁄⁄⁄
[3.741] [2.996] [1.567] [2.932] [11.61] [�0.379] [�2.158] [4.024]
Number of countries 38 30 32 38 38 28 38 32Observations 476 316 344 469 473 351 465 367p-Value on first lag of error
term0 0 0 0 0.0044 5.55E�09 9.24E�07 0
p-Value on second lag of errorterm
0.568 0.894 0.0017 0.00966 0.138 0.0046 1.04E�06 0.295
Dependent variable, lagged 0.769⁄⁄⁄ 0.893⁄⁄⁄ 0.646⁄⁄⁄ 0.762⁄⁄⁄ 0.798⁄⁄⁄ 0.572⁄⁄⁄ 0.820⁄⁄⁄ 0.666⁄⁄⁄
[24.60] [30.12] [17.72] [22.32] [26.90] [9.87] [44.05] [15.89]Civil liberties index, lagged 0.242⁄ �0.061 0.13 0.13 0.072 0.002 0.127⁄ �0.052
[1.74] [1.27] [1.43] [1.36] [0.69] [0.06] [1.70] [0.91]Polity 2 index, lagged 0.348⁄ 0.023 0.116 0.247 �0.307⁄⁄ 0.084⁄ 0.037 �0.182
[1.65] [0.35] [0.92] [1.61] [1.96] [1.92] [0.32] [1.14]Polity 2 index squared, lagged �0.015⁄ �0.002 �0.005 �0.011⁄ 0.011⁄ �0.003⁄ �0.002 0.006
[1.74] [0.65] [0.98] [1.83] [1.74] [1.93] [0.36] [1.14]GDP per worker, lagged �0.031 �0.003 �0.017 �0.018 0.037⁄ 0.012 �0.028⁄ �0.036⁄⁄⁄
[1.15] [0.30] [0.71] [0.90] [1.90] [1.56] [1.81] [3.40]Trade openness index, lagged 0.015⁄⁄⁄ 0.003⁄⁄ 0.008⁄⁄⁄ 0.009⁄⁄⁄ 0.005⁄⁄ �0.001 0.001 0.005⁄⁄⁄
[4.21] [2.07] [3.61] [3.52] [2.02] [1.46] [0.61] [4.44]Government debt/GDP, lagged 0.004 0.001 0.004 0.001 0.001 0.001 2.00E�03 �0.002⁄⁄
[1.31] [0.34] [0.97] [0.27] [0.47] [0.93] [0.95] [2.08]Agriculture/GDP, lagged �0.074⁄⁄ �0.009 �0.028 �0.016 �0.024 0.005 �0.018 �0.080⁄⁄⁄
[2.26] [0.86] [1.54] [0.72] [0.99] [0.78] [1.08] [4.94]Female labor force
participation, lagged�0.001 0.005 �0.01 �0.001 0.016 �0.001 �0.003 0
[0.08] [0.81] [0.72] [0.10] [1.45] [0.41] [0.33] [0.03]Old age population, lagged 0.353⁄⁄⁄ 0.044⁄ �0.007 0.101⁄⁄ �0.046 0.064⁄⁄ �0.015 0.277⁄⁄⁄
[4.16] [1.92] [0.20] [2.53] [1.34] [2.48] [0.53] [5.97]
Number of countries 32 25 27 32 32 25 32 28Observations 388 270 298 381 385 296 379 314p-Value on first lag of error
term0 0 0 0 0 0 0 0
p-Value on second lag of errorterm
0.23 0.77 0 0.01 0.01 0 0 0.05
Notes: the table displays the output of Blundell and Bond regressions with tax revenue and different categories thereof (as a fraction of GDP) as dependentvariables. Each column is devoted to a different revenue source, with different specifications being stacked in the same column. The civil liberties indextakes on values on the [1,7] range, with higher values denoting stronger protection of civil liberties. The Polity 2 index takes on values on the [0, 20] range,with higher values for stronger democratic institutions. See the text for details. GDP per worker is expressed in thousands of PPP dollars. Standard errors arerobust, and the corresponding z-statistics are reported in brackets below each coefficient.⁄ Significant at 10%.⁄⁄ Significant at 5%.⁄⁄⁄ Significant at 1%.
P. Profeta et al. / Journal of Comparative Economics 41 (2013) 684–718 715
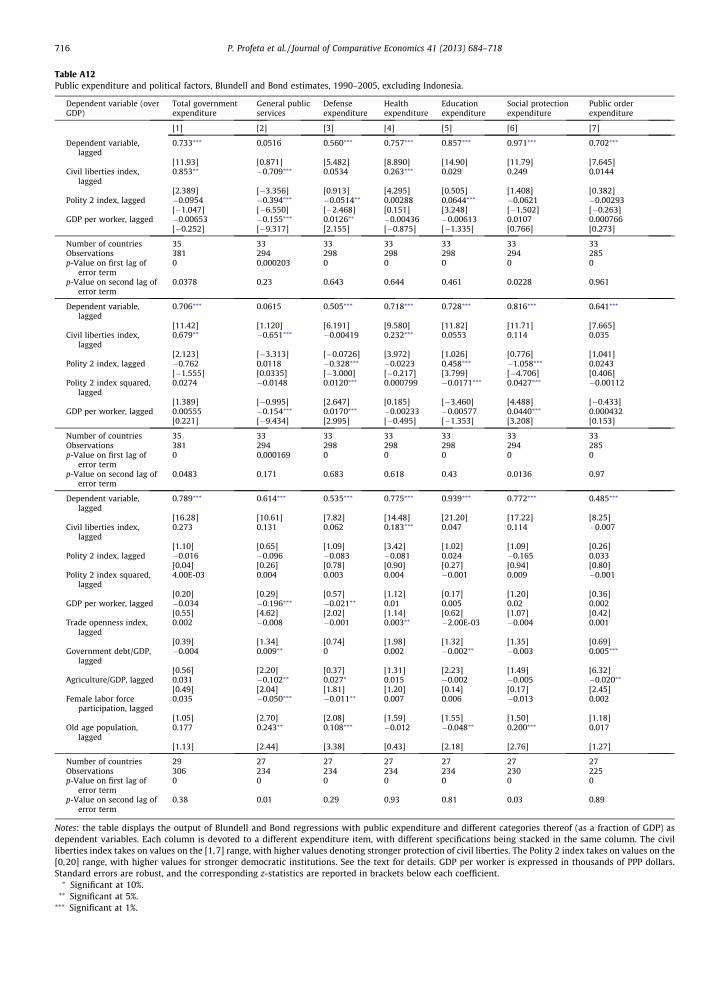
Table A12Public expenditure and political factors, Blundell and Bond estimates, 1990–2005, excluding Indonesia.
Dependent variable (overGDP)
Total governmentexpenditure
General publicservices
Defenseexpenditure
Healthexpenditure
Educationexpenditure
Social protectionexpenditure
Public orderexpenditure
[1] [2] [3] [4] [5] [6] [7]
Dependent variable,lagged
0.733⁄⁄⁄ 0.0516 0.560⁄⁄⁄ 0.757⁄⁄⁄ 0.857⁄⁄⁄ 0.971⁄⁄⁄ 0.702⁄⁄⁄
[11.93] [0.871] [5.482] [8.890] [14.90] [11.79] [7.645]Civil liberties index,
lagged0.853⁄⁄ �0.709⁄⁄⁄ 0.0534 0.263⁄⁄⁄ 0.029 0.249 0.0144
[2.389] [�3.356] [0.913] [4.295] [0.505] [1.408] [0.382]Polity 2 index, lagged �0.0954 �0.394⁄⁄⁄ �0.0514⁄⁄ 0.00288 0.0644⁄⁄⁄ �0.0621 �0.00293
[�1.047] [�6.550] [�2.468] [0.151] [3.248] [�1.502] [�0.263]GDP per worker, lagged �0.00653 �0.155⁄⁄⁄ 0.0126⁄⁄ �0.00436 �0.00613 0.0107 0.000766
[�0.252] [�9.317] [2.155] [�0.875] [�1.335] [0.766] [0.273]
Number of countries 35 33 33 33 33 33 33Observations 381 294 298 298 298 294 285p-Value on first lag of
error term0 0.000203 0 0 0 0 0
p-Value on second lag oferror term
0.0378 0.23 0.643 0.644 0.461 0.0228 0.961
Dependent variable,lagged
0.706⁄⁄⁄ 0.0615 0.505⁄⁄⁄ 0.718⁄⁄⁄ 0.728⁄⁄⁄ 0.816⁄⁄⁄ 0.641⁄⁄⁄
[11.42] [1.120] [6.191] [9.580] [11.82] [11.71] [7.665]Civil liberties index,
lagged0.679⁄⁄ �0.651⁄⁄⁄ �0.00419 0.232⁄⁄⁄ 0.0553 0.114 0.035
[2.123] [�3.313] [�0.0726] [3.972] [1.026] [0.776] [1.041]Polity 2 index, lagged �0.762 0.0118 �0.328⁄⁄⁄ �0.0223 0.458⁄⁄⁄ �1.058⁄⁄⁄ 0.0243
[�1.555] [0.0335] [�3.000] [�0.217] [3.799] [�4.706] [0.406]Polity 2 index squared,
lagged0.0274 �0.0148 0.0120⁄⁄⁄ 0.000799 �0.0171⁄⁄⁄ 0.0427⁄⁄⁄ �0.00112
[1.389] [�0.995] [2.647] [0.185] [�3.460] [4.488] [�0.433]GDP per worker, lagged 0.00555 �0.154⁄⁄⁄ 0.0170⁄⁄⁄ �0.00233 �0.00577 0.0440⁄⁄⁄ 0.000432
[0.221] [�9.434] [2.995] [�0.495] [�1.353] [3.208] [0.153]
Number of countries 35 33 33 33 33 33 33Observations 381 294 298 298 298 294 285p-Value on first lag of
error term0 0.000169 0 0 0 0 0
p-Value on second lag oferror term
0.0483 0.171 0.683 0.618 0.43 0.0136 0.97
Dependent variable,lagged
0.789⁄⁄⁄ 0.614⁄⁄⁄ 0.535⁄⁄⁄ 0.775⁄⁄⁄ 0.939⁄⁄⁄ 0.772⁄⁄⁄ 0.485⁄⁄⁄
[16.28] [10.61] [7.82] [14.48] [21.20] [17.22] [8.25]Civil liberties index,
lagged0.273 0.131 0.062 0.183⁄⁄⁄ 0.047 0.114 �0.007
[1.10] [0.65] [1.09] [3.42] [1.02] [1.09] [0.26]Polity 2 index, lagged �0.016 �0.096 �0.083 �0.081 0.024 �0.165 0.033
[0.04] [0.26] [0.78] [0.90] [0.27] [0.94] [0.80]Polity 2 index squared,
lagged4.00E-03 0.004 0.003 0.004 �0.001 0.009 �0.001
[0.20] [0.29] [0.57] [1.12] [0.17] [1.20] [0.36]GDP per worker, lagged �0.034 �0.196⁄⁄⁄ �0.021⁄⁄ 0.01 0.005 0.02 0.002
[0.55] [4.62] [2.02] [1.14] [0.62] [1.07] [0.42]Trade openness index,
lagged0.002 �0.008 �0.001 0.003⁄⁄ �2.00E-03 �0.004 0.001
[0.39] [1.34] [0.74] [1.98] [1.32] [1.35] [0.69]Government debt/GDP,
lagged�0.004 0.009⁄⁄ 0 0.002 �0.002⁄⁄ �0.003 0.005⁄⁄⁄
[0.56] [2.20] [0.37] [1.31] [2.23] [1.49] [6.32]Agriculture/GDP, lagged 0.031 �0.102⁄⁄ 0.027⁄ 0.015 �0.002 �0.005 �0.020⁄⁄
[0.49] [2.04] [1.81] [1.20] [0.14] [0.17] [2.45]Female labor force
participation, lagged0.035 �0.050⁄⁄⁄ �0.011⁄⁄ 0.007 0.006 �0.013 0.002
[1.05] [2.70] [2.08] [1.59] [1.55] [1.50] [1.18]Old age population,
lagged0.177 0.243⁄⁄ 0.108⁄⁄⁄ �0.012 �0.048⁄⁄ 0.200⁄⁄⁄ 0.017
[1.13] [2.44] [3.38] [0.43] [2.18] [2.76] [1.27]
Number of countries 29 27 27 27 27 27 27Observations 306 234 234 234 234 230 225p-Value on first lag of
error term0 0 0 0 0 0 0
p-Value on second lag oferror term
0.38 0.01 0.29 0.93 0.81 0.03 0.89
Notes: the table displays the output of Blundell and Bond regressions with public expenditure and different categories thereof (as a fraction of GDP) asdependent variables. Each column is devoted to a different expenditure item, with different specifications being stacked in the same column. The civilliberties index takes on values on the [1,7] range, with higher values denoting stronger protection of civil liberties. The Polity 2 index takes on values on the[0,20] range, with higher values for stronger democratic institutions. See the text for details. GDP per worker is expressed in thousands of PPP dollars.Standard errors are robust, and the corresponding z-statistics are reported in brackets below each coefficient.⁄ Significant at 10%.⁄⁄ Significant at 5%.⁄⁄⁄ Significant at 1%.
716 P. Profeta et al. / Journal of Comparative Economics 41 (2013) 684–718

P. Profeta et al. / Journal of Comparative Economics 41 (2013) 684–718 717
References
Acemoglu, D., Robinson, J.A., 2006. Economic Origins of Dictatorship and Democracy. Cambridge University Press.Aidt, T.S., Dutta, J., Loukoianova, E., 2006. Democracy comes to Europe: franchise extension and fiscal outcomes 1830–1938. European Economic Review 50,
249–283.Aidt, T.S., Jensen, P.S., 2009a. Tax structure, size of government, and the extension of the voting franchise in Western Europe, 1860–1938. International Tax
and Public Finance 16, 362–394.Aidt, T.S., Jensen, P.S., 2009b. The taxman tools up: an event history study of the introduction of the personal income tax. Journal of Public Economics 93,
160–175.Aidt, T.S., Eterovic, D.S., 2011. Political competition, electoral participation and public finance in 20th century Latin America. European Journal of Political
Economy 27, 181–200.Aidt, T.S., Dutta, J., Dauntan, M., 2010. The retrenchment hypothesis and the extension of the franchise in England and Wales. The Economic Journal 120,
990–1020.Alm, J., 1996. Explaining tax compliance. In: Pozo, S. (Ed.), Exploring the Underground Economy: Studies of Illegal and Unreported Activity. W.E. Upjohn
Institute for Employment Research, Kalamazoo, Michigan.Alvarez, M., Cheibub, J.A., Limongi, F., Przewroski, A., 1996. Classifying political regimes. Studies in Comparative International Development 31 (2), 3–36.Barro, R.J., 1996. Democracy and growth. Journal of Economic Growth 1, 1–27.Bartels, R., Fiebig, D.G., 1991. ‘A simple characterization of seemingly unrelated regressions models in which OLS Is BLUE. The American Statistician 45 (2),
137–140.Becker, G.S., 1983. A theory of competition among pressure groups for political influence. The Quarterly Journal of Economics 3, 371–400.Berlin, I., 1969. Four Essays on Liberty. Oxford University Press, London.Bertocchi, G., 2010. The enfranchisement of women and the welfare state. European Economic Review 55, 535–553.Bertrand, M., Duflo, E., Mullainathan, S., 2004. How much should we trust difference in differences estimates? Quarterly Journal of Economics 119 (1), 249–
275.Blundell, R., Bond, S., 1998. Initial conditions and moment restrictions in dynamic panel data models. Journal of Econometrics 87, 115–143.Boix, C., 2001. Democracy, development, and the public sector. American Journal of Political Science 45 (1), 1–17.Boix, C., 2003. Democracy and Redistribution. Cambridge University Press.Burgess, R., Stern, N., 1993. Taxation and development. Journal of Economic Literature 2, 762–830.Cacciatore, M., Profeta, P., Scabrosetti, S., 2006. Democracy and welfare without welfare state. In: Bernardi, L., Fraschini, A., Shome, P. (Eds.), Tax Systems and
Tax Reforms in South and East Asia. Routledge, London.Chelliah, R.J., 1971. Trends in Taxation in Developing Countries. Staff Papers, International Monetary Fund 18, 254–331.Cheibub, J.A., Gandhi, J., Vreeland, J.R., 2010. Democracy and dictatorhip revisited. Public Choice 143 (1–2), 67–101.Dahl, R.A., 1971. Polyarchy: Participation and Opposition. Yale University Press, New Haven.de Juan, A., Lasheres, M., Mayo, R., 1994. Voluntary tax compliant behavior of Spanish income tax payers. Public Finance 49, 90–105.Feld, L.P., Frey, B.S., 2002. Trust breeds trust: how taxpayers are treated. Economics of Governance 3, 87–99.Fernandez, R., Rodrik, D., 1991. Resistance to reform: status quo bias in the presence of individual-specific uncertainty. The American Economic Review 81
(5), 1146–1155.Ferris, J., Park, S.B., Winer, S.L., 2008. Studying the role of political competition in the evolution of government size over long horizons. Public Choice 137,
369–401.Ghura, D., 1998. Tax Revenue in Sub Saharan Africa: Effects of Economic Policies and Corruption. IMF Working Paper 98/135. International Monetary Fund,
Washington.Giavazzi, F., Tabellini, G., 2005. Economic and political liberalizations. Journal of Monetary Economics 52 (7), 1297–1330.Gould, A.C., Baker, P.J., 2002. Democracy and taxation. Annual Review of Political Science 5, 87–110.Gupta, S., Clements, B., Inchauste, G. (Eds.), 2004. Helping Countries develop: The Role of Fiscal Policy. International Monetary Fund, Washington.Habibi, N., 1994. Budgetary policy and political liberty: a cross-sectional analysis. World Development 22 (4), 579–586.Hausken, K., Martin, C.W., Plümper, T., 2004. Government spending and taxation in democracies and autocracies. Constitutional Political Economy 15, 239–
259.Hettich, W., Winer, S.L., 1999. Democratic Choice and Taxation: A Theoretical and Empirical Analysis. Cambridge University Press, New York.Hicks, A.M., Swank, D.H., 1992. Politics, Institutions, and Welfare Spending in Industrialized Democracies, 1960–82. The American Political Science Review
86, 658–674.Hinrichs, H.H., 1966. A General Theory of Tax Structure. Change During Economic Development, Harvard Law School International Tax Program.Husted, T.A., Kenny, L.W., 1997. The effect of the expansion of the voting franchise on the size and scope of Government. Journal of Political Economy 105,
54–82.International Monetary Fund (IMF), 2010. World Economic Outlook Report, April.Kenny, L.W., Winer, S.L., 2006. Tax systems in the world: an empirical investigation into the importance of tax bases, administration costs, scale and political
regime. International Tax and Public Finance 13 (2/3), 181–215.Kim, W., 2007. Social insurance expansion and political regime dynamics in Europe, 1880–1945. Social Science Quarterly 88 (2), 494–514.Lindert, P.H., 1994. The rise in social spending 1880–1930. Explorations in Economic History 31, 1–37.Lindert, P.H., 2004. Growing Public: Social Spending and Economic Growth Since the Eighteenth Century, vols. 1–2. Cambridge University Press, Cambridge,
UK.Lipset, S.M., 1959. Some social prerequisites for democracy: economic development and political legitimacy. American Political Science Review 53, 69–105.Martin, C.W., Plümper, T., 2003. Democracy, government spending, and economic growth: a political-economic explanation of the barro-effect. Public
Choice 117, 27–50.Meltzer, A.H., Richard, S.F., 1981. A rational theory of the size of government. Journal of Political Economy 89 (5), 914–927.Milanovic, B., 2000. The median-voter hypothesis, income inequality, and income redistribution: an empirical test with the required data. European Journal
of Political Economy 16, 367–410.Mueller, D.C., Stratmann, T., 2003. The economic effects of democratic participation. Journal of Public Economics 87, 2129–2155.Mulligan, C.B., Gil, R., Sala-i-Martin, X., 2004. Do democracies have different public policies than non democracies? Journal of Economic Perspectives 18 (1),
51–74.Musgrave, R.A., 1969. Fiscal Systems. Yale University Press, New Haven.Papaioannou, E., Siourounis, G., 2008. Democratization and growth. The Economic Journal 118, 1520–1551.Perotti, R., 1996. Growth, income distribution, and democracy: what the data say. Journal of Economic Growth 1, 149–187.Persson, T., Tabellini, G., 2006. Democracy and development: the devil in the details. American Economic Review, Papers and Proceedings 96, 319–324.Persson, T., Tabellini, G., 2007. The Growth Effect of Democracy: Is It Heterogeneous and How Can It be Estimated. NBER Working Papers, 13150.Plümper, T., Neumayer, E., 2010. The level of democracy during interregnum periods: recoding the polity2 score. Political Analysis 18, 206–226.Pommerehne, W., Weck-Hannemann, H., 1996. Tax rates, tax administration and income tax evasion in Switzerland. Public Choice 88, 161–170.Profeta, P., 2002. Retirement and social security in a probabilistic voting model. International Tax and Public Finance 9, 331–348.Profeta, P., 2007. Political support and tax reforms with an application to Italy. Public Choice 131 (1-2), 141–155.

718 P. Profeta et al. / Journal of Comparative Economics 41 (2013) 684–718
Profeta, P., Scabrosetti, S., 2008. Political economy issues of taxation. In: Bernardi, L., Barreix, A., Marenzi, A., Profeta, P. (Eds.), Tax Systems and Tax Reformsin Latin America. Routledge, London.
Profeta, P., Scabrosetti, S., 2010. The Political Economy of Taxation: Lessons from Developing Countries. Edward Elgar Publishing, Cheltenham (UK).Przeworski, A., Alvarez, M., Cheibub, J.A., Limongi, F., 2000. Democracy and Development: Political Institutions and Material Well-being in the World: 1950–
1990. Cambridge University Press, New York.Rodrik, D., 1998. Why do more open economies have bigger Governments? Journal of Political Economy 106, 997–1032.Rodrik, D., Wacziarg, R., 2005. Do democratic transitions produce bad economic outcomes? American Economic Review Papers and Proceedings 95 (2), 50–
55.Schumpeter, J.A., 1942. Capitalism, Socialism and Democracy. Harper & Brothers, New York.Tanzi, V., 1987. Quantitative characteristics of the tax systems of developing countries. In: Newbery, D.M.G., Stern, N.H. (Eds.), The Theory of Taxation for
Developing Countries. Oxford University Press, New York.Tanzi, V., 1992. ‘Structural factors and tax revenue in developing countries: a decade of evidence. In: Goldin, I., Winters, L.A. (Eds.), Open Economies:
Structural Adjustment and Agriculture. Cambridge University Press.Tanzi, V., Tsibouris, G., 2000. Fiscal Reform Over Ten Years of Transition, IMF Working Paper, WP/00/113.Tridimas, G., Winer, S.L., 2005. The political economy of Government size. European Journal of Political Economy 21, 643–666.Tullock, G., 1987. Autocracy. Kluwer Academic Publishers, Boston, MA.Wagner, A., 1883. Grundlegung der Politischen Oekonomie, third ed. C.F. Winter, Leipzig.Wintrobe, R., 1990. The tinpot and the totalitarian: an economic theory of dictatorship. American Political Science Review 84, 849–872.Wintrobe, R., 1998. The Political Economy of Dictatorship. Cambridge University Press.