does corruption ever help entrepreneurship? - the citadel
TRANSCRIPT

1 23
Small Business EconomicsAn Entrepreneurship Journal ISSN 0921-898XVolume 47Number 1 Small Bus Econ (2016) 47:179-199DOI 10.1007/s11187-016-9728-7
Does corruption ever helpentrepreneurship?
Nabamita Dutta & Russell Sobel

1 23
Your article is protected by copyright and all
rights are held exclusively by Springer Science
+Business Media New York. This e-offprint is
for personal use only and shall not be self-
archived in electronic repositories. If you wish
to self-archive your article, please use the
accepted manuscript version for posting on
your own website. You may further deposit
the accepted manuscript version in any
repository, provided it is only made publicly
available 12 months after official publication
or later and provided acknowledgement is
given to the original source of publication
and a link is inserted to the published article
on Springer's website. The link must be
accompanied by the following text: "The final
publication is available at link.springer.com”.

Does corruption ever help entrepreneurship?
Nabamita Dutta . Russell Sobel
Accepted: 20 March 2016 / Published online: 26 April 2016
� Springer Science+Business Media New York 2016
Abstract The current literature contains mixed
results regarding the impact of corruption on
entrepreneurship and economic growth. In this paper,
we examine a much larger set of countries and time
periods to attempt to gain insights into this relation-
ship. In particular, the central question is whether
corruption can compensate for a bad business climate.
Our results are clear; corruption hurts entrepreneur-
ship. The impact is smaller, but remains negative,
when business climates are bad. This is in contrast to
previous literature that suggests corruption may
increase entrepreneurship under a bad business cli-
mate. We find corruption never improves
entrepreneurship; it simply hurts less when business
climates are not conducive to growth in the first place.
Keywords Entrepreneurship � Corruption � Businessregulations
JEL Classifications D73 � L26 � O43
1 Introduction
A growing literature suggests that corruption can help
entrepreneurship and economic growth (see, e.g.,
Dreher and Gassebner 2013; Rose 2000). By allowing
entrepreneurs to bribe their way through the start-up
process, the argument goes; it makes it easier for new
ventures to be created. This strand of the literature is
known as the ‘grease the wheels’ argument, as it
argues that corruption can improve entrepreneurial
opportunities like putting grease on a wheel can make
it move faster. This literature, however, stands in stark
contrast to other studies that find that, in general,
corruption in government is harmful for growth and
prosperity for a country (see, e.g., Shleifer and Vishny
1993; Ehrlich and Lui 1999; Mauro 1995; La Porta
et al. 1999; Treisman 2000; Busenitz et al. 2000;
Glaeser and Saks 2006).
In this paper, we attempt to rectify these two strands
of the literature, by delineating between the direct and
indirect effects of corruption on entrepreneurship.
This novel insight allows us to more directly examine
the issue of whether corruption is good or bad for
entrepreneurship, as one of the effects only exists
strongly in countries with preexisting bad business
climates that create high government burdens on start-
up activity. More fundamentally, even if corruption
does help but only in a situation where a country’s
business climate is ‘bad’—then precisely how bad
does it have to be for the effect to turn positive? This is
important for policy because efforts to dampen
N. Dutta (&)
Department of Economics, College of Business
Administration, University of Wisconsin, La Crosse,
WI, USA
e-mail: [email protected]
R. Sobel
School of Business Administration, The Citadel,
Charleston, SC 29409, USA
e-mail: [email protected]
123
Small Bus Econ (2016) 47:179–199
DOI 10.1007/s11187-016-9728-7
Author's personal copy

corruption in countries may be bad policy, and lower
entrepreneurship and prosperity, if the business cli-
mate is not fixed first. Using panel data from theWorld
Bank and World Governance Indicators for 104
countries, we find that while there is a slightly positive
partial-equilibrium impact of corruption when busi-
ness climates are bad, that across the board the
general-equilibrium impact is negative. That is,
always and everywhere corruption harms
entrepreneurship, just not as much in countries with
bad business climates. Section 2 gives a literature
review and a theoretical treatment of our hypothesis.
Section 3 describes the data and methodology. Sec-
tion 4 contains our main empirical results, and Sect. 5
presents robustness tests. Finally, Sect. 6 concludes.
2 Literature review and theoretical arguments
The ‘grease the wheels’ strand of the literature
suggests that corruption can increase the rate of
entrepreneurship. Perhaps nowhere is the evidence
stronger than for post-socialist economies, which have
some of the highest corruption rates in the world (see,
e.g., Hellman et al. 2000; Radaev 2004; Ovaska and
Sobel 2005; Rose 2000). The argument that bribery or
corruption may improve inefficient outcomes is not
new, nor limited to the field of entrepreneurship.
Spiller (1990), for example, shows formally how
allowing political agents to be bribed can increase
efficiency of government more generally by allowing
dollar values, rather than yes/no decisions, influence
outcomes.1
Inefficient rules, by definition, create private and
social deadweight losses. Those affected are willing to
pay up to this value to overcome the bad policy in
place, and if a bribe allows that to happen when it
otherwise would not, bribery and corruption increase
economic activity and lessen deadweight losses. In
areas with bad business climates, inefficient rules
stand in the way of productive entrepreneurship.When
this happens, entrepreneurs can expand the number of
ventures they can undertake if they are able to get
government officials to bend or ignore the rules
through other means.2 In other words, the bribes are
not simply a ‘cost of doing business’ that is higher and
therefore lowers entrepreneurship rates—quite the
contrary, without the bribes the businesses would not
exist.
This strand of the literature, however, apparently
argues that corruption is good for economic growth
and entrepreneurship, conditional on a country having
a preexisting bad business climate. For example, using
data for 43 countries from 2003 through 2005, Dreher
and Gassebner (2013) find that corruption is beneficial
in highly regulated economies (specifically those with
a higher number of procedures required to start a
business and a larger minimum capital requirement).
Their conclusion is that corruption has a positive
impact on entrepreneurship in countries with bad
business climates.
The contrasting strand of the literature argues that
corruption in government is harmful for overall
growth and prosperity in general (see, e.g., Shleifer
and Vishny 1993; Ehrlich and Lui 1999; Mauro 1995;
La Porta et al. 1999; Treisman 2000; Busenitz et al.
2000; Glaeser and Saks (2006). Using data from the
Global Entrepreneurship Monitor (GEM) on measures
of entrepreneurship (patents, TEA and realized inno-
vation measures) and a measure of control of corrup-
tion from the World Governance Indicators for 64
countries from 1996 to 2002, Anokhin and Schulze
(2009), for example, conclude that corruption is
harmful to entrepreneurship and innovation, the
driving source of economic growth. Employing
GEM surveys in 55 countries, Estrin et al. (2012) find
that controlling for the level of development, less
corruption (and stronger protection of property rights),
increases the growth plans of entrepreneurs. Their
results suggest entrepreneurs planning larger-scale
ventures should search out locations where property
rights are more secure and corruption is lower. Aidis
et al. (2012) find mixed results using GEM data, with
1 The argument that corruption may improve the efficiency of a
political process from a standpoint of economic efficiency has
its roots in the fact that votes or political preferences sometimes
do not accurately convey the full economic value of alternatives
(see, e.g., Tidemann and Tulloc 1976).
2 While most articles approach the subject from the standpoint
of viewing corruption as the exogenous determinant of
entrepreneurial activity, Tonoyan et al. (2010) examine the
choice of entrepreneurs to engage in bribe-paying schemes in
these economies. They examine the role of both formal and
informal institutions on entrepreneurs as bribe payers and find
that the likelihood of engaging in this practice is influenced by
the lower efficiency of financial and legal institutions and the
lack of their enforcement.
180 N. Dutta, R. Sobel
123
Author's personal copy

some models showing weak responses to corruption
and other country fixed-effect models having insignif-
icant results, however, when the richest countries are
removed from the sample the impact of corruption
appears strongest in lowering entrepreneurship. This
hints at the main issue we address in this paper, which
is that the impact of corruption on entrepreneurship
may depend on other factors, such as the quality of
existing institutions.
The idea that corruption, which is normally harmful
to economic activity, may be good for growth when
the business climate is bad can be viewed within the
framework of the ‘theory of the second best’ (see
Lipsey and Lancaster 1956). This theory explains how
a policy that by itself in an already efficient environ-
ment would be inefficient can, in the presence of a
preexisting distortion, be a positive influence. For
example, generally turning a competitive industry into
a monopoly would be efficiency reducing due to the
reduction in output. However, if this industry was one
that created a significant negative externality, and thus
already was producing an inefficiently large output,
imposition of a monopoly, in theory, could improve
efficiency by reducing output closer to the ideal level.
That is, something that might be efficiency reducing if
starting from an already efficient outcome, such as
imposing a monopoly, may flip on its head if the
starting point is no longer an efficient outcome. If
inefficiencies already exist, something that would
normally hurt may help improve efficiency. In our
context, this translates into government corruption.
Under normal circumstances, with a well-functioning
government and efficient rules, the introduction of
corruption would harm outcomes and lead to ineffi-
ciency. However, just because this is true does not
mean the same conclusion necessarily follows if one
begins from a point of a poorly functioning govern-
ment with already inefficient rules. If the current rules
prevent efficient actions from being taken legally,
corruption can allow these activities to happen.
Take a simple example. During alcohol prohibition
in the USA, it was illegal to operate a bar selling
alcohol. If the political processes (i.e., police and
courts) do their jobs properly, they will try to shut the
entire industry down. If, however, an entrepreneur
wanting to run a bar bribes the local police to look the
other way, he may be able to operate despite the rules
against his business’s existence. If there were two
areas, one where police took bribes and one where
they did not, quite simply, there would be more bars
(i.e., more entrepreneurship) in the area where bribery
and corruption existed. The more interesting question
is how the number of bars will compare to a third
different area where alcohol was completely legal.
Obviously as the opportunities for corruption and
bribery grow, there will be more bars—so we move
closer to the unrestricted level as corruption expands.
Compare this to a situation where alcohol was legal
and a corrupt police force decided to try mafia tactics
and actually harm businesses if they did not pay
bribes. In that situation, the bribes would simply
function as a cost of doing business and would result in
a decrease in the number of ventures. The point is that
whether corruption helps or hurts the number of
business ventures depends on the preexisting institu-
tions. When current laws prevent mutually beneficial
voluntary exchanges from taking place, deadweight
losses are created, and bribes and corruption may
expand economic activity.
The idea that corruption, which in theory should be
harmful to economic growth and entrepreneurship,
could be helpful in an environment in which business
regulations and government policies were already too
strict, is similar to this theory of the second best
argument. Largely the idea is that when barriers to
opening a business are severe, being able to bribe
political agents can ease the business start-up process
actually improving the level of entrepreneurial activity
in an economy relative to an environment in which
there was less corruption.
An entrepreneur attempting to start a new venture
faces many bureaucratic hurdles. The World Bank’s
Doing Business database, for example, shows that in
many countries of the world, the number of procedures
or steps (and the cost of them) can be excessive to the
point of significantly hampering the ability to get a
new venture formed. Whether it be bureaucratic
challenges in legally forming the business, getting
any necessary construction permits, electricity hook-
ups, financing, or contract enforcement, all of these
hurdles—in theory—could be overcome by bribing
the right government official. The recent headline-
making event of casino owner Sheldon Adelson
admitting he likely violated US law by bribing
Chinese officials (see Schwirtz 2013) is a case in
point, ‘‘as with many lucrative business spheres in
China, the gambling industry on Macau is laced with
corruption. Companies must rely on the good will of
Does corruption ever help entrepreneurship? 181
123
Author's personal copy

Chinese officials to secure licenses and contracts.
Officials control even the flow of visitors, many of
whom come on government-run junkets from the
mainland.’’ When government agents control the flow
of licenses, contracts or customers, the entrepreneurs
who provide favors to these government agents are
able to successfully navigate the process of opening a
successful business.
We argue that a novel framework within which to
approach this question is to delineate between the
direct and indirect impacts of corruption on
entrepreneurship. For this purpose, it is important to
be more precise than in the previous literature on the
possible nature of corruption. Glaeser and Goldin
(2006) outline three main sources or types of corrup-
tion: (1) public officials directly stealing public funds
through embezzlement; (2) public officials taking
bribes or other indirect means of compensation for
favorably transferring government funds or providing
breaks on government rules and regulations; and (3)
public officials manipulating laws or rules to directly
benefit their own financial interests.
Source (2) is clearly what we have been discussing,
when corrupt public officials relax rules for entrepre-
neurs. This source of corruption and its impact we will
call the ‘direct effect’ of corruption on entrepreneur-
ship. Sources (1) and (3) really have nothing to do
specifically with entrepreneurs trying to escape gov-
ernment rules. These are cases where government
officials simply benefit themselves at the expense of
the general public. While at first glance this may seem
unrelated, it is not. The literature clearly shows that
corruption like these sources harms the overall level of
prosperity in a country.3 Among many reasons,
corruption endangers the trust relations necessary for
economic exchange, lowers the efficiency of govern-
ment provided public goods provision and increases
the cost of doing business. These factors result in
lowered productive activity and a lower overall
standard of living and income, meaning there are
fewer opportunities for entrepreneurs. We term this
second effect the ‘indirect effect.’ While source (2) is
the possible avenue through which corruption can help
entrepreneurship, the other two sources clearly have a
negative influence.
The direct effect (through source 2 of those listed
above) is how corruption influences entrepreneurship
through interactions with a burdensome regulatory/
permit process or bad business climate. This direct
effect is the debate about whether given bad rules if
corruption makes it easier to navigate the process. If
this direct effect is zero, then corruption must have an
overall negative impact on entrepreneurship and
growth. If the direct effect is positive (in that
corruption makes it easier to navigate the hurdles of
starting a business), then there is a new remaining
question. Even if this second effect is ‘positive,’ it may
or may not be large enough to outweigh the indirect
effects. So even if a more corrupt economy allows
more businesses to skip hurdles and open, the overall
corruption may harm prosperity so much that there are
significantly fewer entrepreneurial opportunities.
If the direct effect is small but positive, then
corruption probably harms entrepreneurship at all
levels of corruption and at all preexisting business
climates, as the small positive would not outweigh the
large negative indirect effects. However, if the direct
effect is big enough, then corruption may actually
increase the rate of entrepreneurship if this direct
effect outweighs the negative indirect effects. The
previous literature has not been clear on this distinc-
tion and often focuses on only one of these two effects.
However, from the standpoint of growth and prosper-
ity it is the combined effect that matters.
We now turn to our empirical analysis. In partic-
ular, we wish to see: (1) whether corruption is bad or
good for entrepreneurship; (2) whether this depends on
the preexistence of a bad business climate; and (3)
exactly how bad does the business climate have to be
(if ever) to create a positive impact on the economy of
corruption.
3 Data and methodology
3.1 Data
Our dependent variable, extent of entrepreneurial
initiatives in country, comes from the World Bank.
The annual data are collected from 130 company
registrars providing information on the number of
3 See the literature discussed earlier, including Shleifer and
Vishny (1993), Ehrlich and Lui (1999), Mauro (1995), La Porta
et al. (1999), Treisman (2000), Busenitz et al. (2000) and
Glaeser and Saks (2006).
182 N. Dutta, R. Sobel
123
Author's personal copy
newly registered firms over the past 7 years. Our main
measure of entrepreneurship is new business entry
density that is defined as ‘the number of newly
registered limited liability corporations per calendar,
normalized by population’ (World Bank 2013). The
concept of limited liability implies that the liability of
the owners of a firm is limited to their investment in the
business. Due to differences and lack of consistency in
the definition of partnerships and sole proprietorships
across the world, those are not considered in the
database. Population data come from World Develop-
ment Indicators database, and the normalized values
indicate the number of new entrepreneurial initiatives
per 1000working age people (between ages 15 and 64).
Based on our sample, the average score for business
density is approximately 2.69. The maximum value of
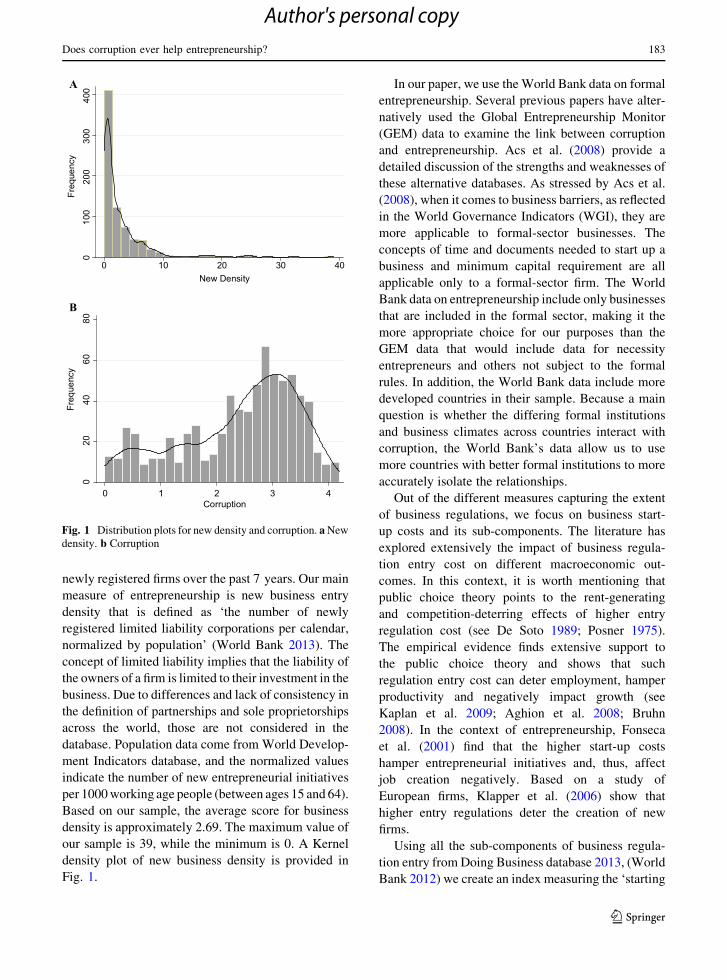
our sample is 39, while the minimum is 0. A Kernel
density plot of new business density is provided in
Fig. 1.
In our paper, we use theWorld Bank data on formal
entrepreneurship. Several previous papers have alter-
natively used the Global Entrepreneurship Monitor
(GEM) data to examine the link between corruption
and entrepreneurship. Acs et al. (2008) provide a
detailed discussion of the strengths and weaknesses of
these alternative databases. As stressed by Acs et al.
(2008), when it comes to business barriers, as reflected
in the World Governance Indicators (WGI), they are
more applicable to formal-sector businesses. The
concepts of time and documents needed to start up a
business and minimum capital requirement are all
applicable only to a formal-sector firm. The World
Bank data on entrepreneurship include only businesses
that are included in the formal sector, making it the
more appropriate choice for our purposes than the
GEM data that would include data for necessity
entrepreneurs and others not subject to the formal
rules. In addition, the World Bank data include more
developed countries in their sample. Because a main
question is whether the differing formal institutions
and business climates across countries interact with
corruption, the World Bank’s data allow us to use
more countries with better formal institutions to more
accurately isolate the relationships.
Out of the different measures capturing the extent
of business regulations, we focus on business start-
up costs and its sub-components. The literature has
explored extensively the impact of business regula-
tion entry cost on different macroeconomic out-
comes. In this context, it is worth mentioning that
public choice theory points to the rent-generating
and competition-deterring effects of higher entry
regulation cost (see De Soto 1989; Posner 1975).
The empirical evidence finds extensive support to
the public choice theory and shows that such
regulation entry cost can deter employment, hamper
productivity and negatively impact growth (see
Kaplan et al. 2009; Aghion et al. 2008; Bruhn
2008). In the context of entrepreneurship, Fonseca
et al. (2001) find that the higher start-up costs
hamper entrepreneurial initiatives and, thus, affect
job creation negatively. Based on a study of
European firms, Klapper et al. (2006) show that
higher entry regulations deter the creation of new
firms.
Using all the sub-components of business regula-
tion entry fromDoing Business database 2013, (World
Bank 2012) we create an index measuring the ‘starting
010
020
030
040
0
Freq
uenc
y
0 10 20 30 40New Density
A
B
020
4060
80
Freq
uenc
y
0 1 2 3 4Corruption
Fig. 1 Distribution plots for new density and corruption. aNewdensity. b Corruption
Does corruption ever help entrepreneurship? 183
123
Author's personal copy

a business’ cost. We construct this index via principal
component analysis4 by using standardized values5 of
the components. The sub-components are procedures
required to start a business (number), time required to
start a business (days), cost as percentage of income
per capita and minimum capital requirement as
percentage of income per capita. We term this the
SB (starting a business) cost index. Higher values of
the index imply greater business restrictions in terms
of longer time requirement, completion of greater
number of procedures, high cost and higher minimum
capital requirement for starting a business.
There are a few alternate databases of corruption
that are used commonly in the literature as well. Two
such popular databases are the Corruption Perception
Index (CPI) by Transparency International (TI) and
‘Control of Corruption’ in the World Governance
Indicators (WGI) database by Kauffman et al. (2010).
As stressed by Rohwer (2009), WGI adopts the basic
approach used by TI and improves on it. Yet,
Ackerman (2006) has shown that both these databases
are strongly correlated with each other. One of the
main advantages of the measure from WGI is that it is
constructed based on several sources that reflect the
views and assessment of a large number of enterprises,
citizens, expert survey respondents, think tanks,
survey institutes, non-government organizations and
international organizations. Thus, the index is rela-
tively more comprehensive compared with other
measures of corruption. Additionally, WGI assigns
differential weights to the individual sources from
which the aggregate index is constructed that improve
its accuracy. Thus, we choose to use the WGI measure
of corruption.
Control of corruption is one of the six measures of
governance compiled in the database. Specifically, it
aims to capture the ‘‘perceptions of the extent to which
public power is exercised for private gain, including
both petty and grand forms of corruption, as well as
‘capture’ of the state by elites and private interests’’
(Kauffman et al. 2010). Each governance indicator,
including corruption, is compiled from several indi-
vidual sources, and then unobserved components
model (UCM) is used to ‘construct a weighted average
of the individual indicators for each source.’ The
database provides a range of -2.5 to 2.5 with higher
numbers representing lower levels of corruption. For
our convenience, we have converted the scale by using
a monotonic transformation—our data range from 0 to
5 with higher values representing greater corruption.
The mean of the sample is 2.4 with the maximum
value being 4.2. A Kernel density plot of our
corruption data is also provided in Fig. 1.
The choice of determinants for entrepreneurship
follows popular literature, both macro and micro
studies. As mentioned by Audretsch and Keilbach
(2007), GDP growth captures the level of economic
opportunities for a region. Rising wealth in a region
implies increasing market size and, thus, rising
opportunities for new business to thrive due to greater
potential for economic exchange. Thus, as a measure
for market size and wealth, we consider GDP per
capita and GDP growth as control variables. Numer-
ous previous studies, including the Global
Entrepreneurship Monitor (GEM), 2009 report, have
shown that population growth is significantly related
to entrepreneurship, so we include it as well (Tamasy
and Le Heron 2008; Armington and Acs 2002;
Reynolds et al. 1995, 1999; Keeble and Walker
1994; ILO 1990).
Other than GDP per capita, growth and population
growth, we include female labor force participation
rate (FLPR), population in the largest city as a
percentage of total population and working population
as a percentage of total population. According to
Delmar and Davidsson (2000), gender is strongly
4 PCA is a multivariate statistical technique used to examine
relationships among different quantitative variables. Mathemat-
ically speaking, if there are n correlated variables, PCA
generates uncorrelated indices or components, where each
component is a linear weighted combination of the n variables.
For example, for a set of variables X1. . .:Xn;PC1 ¼ w11X1 þ w22X2 þ � � � � � � � � � þ w1nXn
..
.
PCm ¼ wm1X1 þ wm2X2 þ � � � � � � � � � þ wmnXn
where wmn represents the weight for the mth principal component
and the nth variable. These weights are the eigenvectors of the
covariance matrix (since we have standardized our data; otherwise
it is the correlation matrix). The eigenvalue of the corresponding
eigenvector is the variance (r) for each principal component. The
first principal component, PC1, explains the largest possible
variation in the dataset subject to the constraint,Pn
i¼1 w21i. Since
the sum of the eigenvalues equals the number of variables in the
original dataset, the proportion of total variation accounted for
by each principal component is the ratio ri
n.
5 Standardized values for each component have been used to
generate the index—thus, the index ranges from negative to
positive figures. A more negative number implies less business
regulation.
184 N. Dutta, R. Sobel
123
Author's personal copy

associated with entrepreneurship. The probability of
male starting a business is higher than of female. In a
similar context, countries with higher female share in
the labor force have been shown to have lower
percentage of self-employed individuals (Uhlaner
et al. 2002). Also studies like Du Rietz and Henrekson
(2000) show that the exit rates for female entrepre-
neurs are higher than their male counterparts (see also
Verheul et al. 2006). Audretsch et al. (2002) find that,
in general, total labor force participation rates along
with female labor force participation rates are impor-
tant determinants of entrepreneurship. We also check
the robustness of our results using total labor force
participation rates in alternate specifications.
Population density has been found to be signifi-
cantly related to entrepreneurship rates (Reynolds
et al. 2004; Wagner and Sternberg 1985). Specifically
Reynolds et al. (2004) show that urbanization pro-
motes spillovers. Population density in the cities
generates externalities and opportunities for increas-
ing returns and, thus, affects entrepreneurial initiatives
positively. Other studies that have provided similar
conclusions are Bruderl and Preisendorfer (1998) and
Storey (1994). We control for population in the largest
city as a percentage of total population and urban
population as a percentage of total population in
alternate specifications (see Leeson and Sobel 2008).
Finally, to remove any impacts of the young or elderly,
we control for working age population (see Sachs and
Warner 1997).
We consider an extensive unbalanced panel of 104
countries over the sample period 2004–2011. The
number of years of data available for each country
varies between 1 and 8. ‘‘Appendix 1’’ describes the
countries used in our empirical analysis. We also
provide the business density and corruption figures for
each country in the Appendix. ‘‘Appendix 2’’ provides
summary statistics, and ‘‘Appendix 3’’ presents the
correlation matrix.
3.2 Empirical methodology
Our empirical strategy aims at estimating the effect on
corruption on entrepreneurship conditional on the
quality of the business climate of the country. As
mentioned earlier, we consider the cost of starting a
business along with its sub-components to measure the
business climate. Specifically, we want to examine
how the levels of corruption in a nation interact with
the cost to start a business in determining the level of
entrepreneurship for countries.
In order to deal with unobserved heterogeneity
associated with panel data, fixed-effect estimators can
be employed. While fixed-effect estimates are suited
to take into account unobserved heterogeneity, they
cannot handle several other panel data challenges.
Removing unobserved heterogeneity by first differ-
encing is commonly employed technique for panel
data and falls under the family of linear dynamic panel
33
B
A
C
02
46
8Fi
tted
value
s
0 1 2 3 4Corruption
SB index <= -0.60 SB index > -0.60
-20
24
68
Fitted
value
s
0 1 2 3 4Corruption
Time <=14 Time > 14
-50
510
Fitted
value
s
0 1 2 3 4Corruption
Min. Capital <=12.6 Min. Capital > 12.6
Fig. 2 Business density fitted values versus corruption strati-
fied by business climate. a Business density fitted values:
stratified by starting business (SB) index. b Business density
fitted values: stratified by time (days). c Business density fitted
values: stratified by paid in minimum capital
Does corruption ever help entrepreneurship? 185
123
Author's personal copy

data (DPD) model estimators. The challenge with such
models is that standard errors might be rendered
inconsistent since the unobserved panel-level effects
are correlated with the lagged-dependent variable.
Arellano and Bond (1991) proposed the general
method of moments (GMM) estimator that generates
consistent estimates for such models, which we
employ as our benchmark estimator.
Along with panel data challenges mentioned above,
we face the challenge of endogeneity associated with
our variable of interest, corruption. The policies and
laws of a country are not completely exogenous and
can be driven by the level of economic development.
Additionally, as entrepreneurial development occurs
in a country due to a favorable and competitive
business climate, the need to indulge in corrupt
activities goes down. GDP per capita and growth
should be endogenous as well. Thus, we treat corrup-
tion along with these variables to be endogenous in our
specifications.
Table 1 System GMM specifications: corruption, entrepreneurship and business climate
(1) (2) (3) (4) (5) (6)
New density (lagged) 0.740***
(0.00302)
0.739***
(0.00263)
0.748***
(0.00317)
0.741***
(0.00359)
0.738***
(0.00210)
0.743***
(0.00323)
Corruption -0.0387**
(0.0174)
-0.155***
(0.0342)
-0.316***
(0.0234)
-0.153***
(0.0227)
-0.331***
(0.0252)
-0.367***
(0.0229)
Starting business (SB) index -0.0687**
(0.0289)
-0.449***
(0.0312)
-0.0420
(0.0384)
0.00244
(0.0124)
-0.304***
(0.0447)
-0.0903***
(0.0336)
Corr*SB index 0.0156*
(0.00842)
0.132***
(0.00793)
0.0338***
(0.0123)
0.00822**
(0.00396)
0.104***
(0.0129)
0.0430***
(0.00906)
GDP per capita (log) 0.529***
(0.0110)
-0.0389
(0.0388)
0.0407
(0.0720)
0.489***
(0.0107)
-0.0491
(0.0247)
-0.0176
(0.0609)
GDP growth 0.0515***
(0.00115)
0.0616***
(0.00102)
0.0628***
(0.000994)
0.0647***
(0.000806)
0.0690***
(0.00129)
0.0623***
(0.00135)
Labor force participation (total) -0.000612
(0.00195)
-0.0129***
(0.00391)
-0.0185***
(0.00220)
Population growth -0.0737***
(0.00833)
0.000235
(0.0154)
0.0132
(0.0134)
-0.101***
(0.0111)
-0.0305***
(0.0105)
-0.0317***
(0.0107)
Population (largest city) 0.0159***
(0.00113)
0.0151***
(0.00145)
Working age population (15–64) 0.157***
(0.00648)
0.132***
(0.00814)
0.152***
(0.00564)
0.136***
(0.00720)
Urban population -0.00335
(0.00262)
-0.00227
(0.00245)
Labor force participation (female) -0.00737***
(0.00165)
-0.0190***
(0.00245)
-0.0164***
(0.00169)
Constant -4.600***
(0.218)
-8.296***
(0.475)
-6.355***
(0.358)
-3.561***
(0.179)
-7.168***
(0.291)
-6.314***
(0.313)
Observations 519 543 543 519 543 543
Number of countries 102 104 104 102 104 104
Number of instruments 129 129 129 129 129 129
Sargan (p value) 0.91 0.92 0.92 0.93 0.93 0.90
Second-order autocorrelation (p value) 0.46 0.55 0.54 0.53 0.53 0.54
Standard errors in parentheses; *** p\ 0.01, ** p\ 0.05, * p\ 0.1
All specifications include year dummies
186 N. Dutta, R. Sobel
123
Author's personal copy

One way to handle endogeneity and omitted
variable bias concerns instrumental variable (IV)
strategy can be employed. In this context, Persson
and Tabellini (2006) point out that it is a daunting task
to find strictly exogenous instruments for regressions
with country fixed effects. Thus, weak instruments can
exacerbate the bias. Dynamic panel estimators solve
this problem since they allow us to address the
endogeneity issues by not having to find strictly
exogenous instruments and, thus, have become pop-
ular for recent empirical panel studies (see, e.g., Dutta
et al. 2013; Asiedu and Lien 2011; Asiedu et al. 2009;
Djankov et al. 2006; Acemoglu et al. 2008 to mention
a few).
The estimator proposed by Arellano and Bond
(1991) is known as the difference GMM estimator that
uses lagged values of the first difference of the
endogenous variables as instruments. Yet, these
lagged levels can be poor instruments for first
differences. System GMM6 estimator proposed by
Blundell and Bond (1998) mitigates this problem by
using additional moment conditions. The use of extra
moment conditions by the system GMM estimates
results in reduced bias and greater precision over
difference GMM estimates. Thus, we rely on system
GMM estimators to be our benchmark estimator.
Both difference and system GMM estimates are
rendered inconsistent in the presence of second-order
autocorrelation. Thus, for all specifications we report
the p values from the second-order autocorrelation
test. Additionally, we report p values for over-
identification test checking the validity of the
instruments.
We estimate the following reduced form model
Entit ¼ b0 þ b1Entit�1 þ b2Corritþ b3 Corr� SB costð Þitþb4SB costit
þXJ
j¼1
ajXjit þ b5ci þ b6ht þ eit ð1Þ
where Entit is the measure of entrepreneurship (new
business entry density) for country i in time t. Entit-1
represents business density in period t - 1. Corrit is
the measure of corruption for country i in time t. Xijt is
the matrix of control variables, ci is the country fixed
effect, ht is the time-specific effect and eit is the
random error term. Our coefficients of interest are b2and b3. Specifically, we are interested in estimating the
overall effect of corruption on entrepreneurship,
which is given by dEntitdCorrit
¼ b2 þ b3SB costit. Based
on whether b2[, = or\ 0, and b3[, = or\ 0 and
the magnitude of SB cost, dEntitdCorrit
will be[, = or\ 0.
4 Main empirical results
4.1 Benchmark results
Before getting into empirical analysis, we present
some fitted plots in Fig. 2 that can help to illustrate the
implications of our empirical results. We plot the
estimated responses for the relationship between
corruption and business density for different values
of business start-up cost. This allows a visual illustra-
tion of how the lines have different slopes for different
values of business start-up costs. Our argument is
consistent with the idea that the negative impact
should be greater (e.g., a more negatively sloped line)
when the business climate is worse (higher values for
our measures). We consider our SB index, time (in
days) and minimum capital requirement (% of income
per capita).
We split the sample based on the specific value of
these start-up cost sub-components. In panel (B) of
Fig. 2, for example, the dashed line represents a fitted
plot for the subsample between corruption and busi-
ness density when time[14, thus indicating higher
government regulatory costs and a worse business
climate. The solid line represents a similar plotted line
for the subsample for time B14. Both lines slope
negative, suggesting that as corruption rises, business
density decreases. The dashed line has a less negative
slope relative to the solid line, suggesting that for
similar rise in corruption, the fall in business density is
more when time[14 compared to the fall in corruption
when time B14. Thus, in the face of higher govern-
ment hurdles, corruption hurts less. We find similar
conclusion in the other figure when we use the
6 According to Roodman (2009), GMM dynamic panel esti-
mators are particularly suited for (1) small ‘‘T’’ (fewer time
periods) and large ‘‘N’’ (many individual or country) panels, (2)
a linear functional relationship, (3) a single dependent variable
that is dynamic, depending on its own past realizations, (4)
independent variables that are not strictly exogenous and are
correlated with present as well as past realizations of the error,
(5) country fixed effects and (6) heteroskedasticity and
autocorrelation within countries.
Does corruption ever help entrepreneurship? 187
123
Author's personal copy

measure of start-up cost—minimum capital require-
ment (% of income per capita) in panel (C) and for the
overall index in panel (A).
Our benchmark results are presented in Table 1. As
mentioned in Sect. 3, the bias arising out of lagged
business density is taken care of in system GMM
estimation. The coefficient of corruption, itself, is
negative and significant, suggesting that corruption
harms business density. Yet, the coefficient of the
interaction term is positive and significant, suggesting
that higher the start-up cost, greater will be the impact of
corruption on business density. The overall impact of
corruption is givenby dEntitdCorrit
for different levels of start-
up costs. Unless we estimate this, we cannot conclude
anything about the varying impact of corruption on new
business entry rates across our sample.
In terms of the controls, GDP per capita has a
positive impact on business density, but it is not
significant for all the specifications. Female labor
force participations rates (FLPR) have a significant
and negative impact on entrepreneurship measure
supporting studies that have found this result in
previous studies. Higher population in the largest city
affects entry rate of new firms positively supporting
the findings of the existing literature.
Our main interest is to estimate the marginal impact
of corruption on entrepreneurship for different levels
of business entry regulation. In Table 2, we report the
marginal effects of corruption on new density for
different values of SB index cost based ondEntit
dCorrit= b1 ? b2SB costit. The index of SB cost
ranges from negative to positive values. Following
Asiedu et al. (2009), we calculate the means for
dSB cost for each country and then calculate the
marginal at the 10th, 25th, 50th, 75th, 90th and 95th
percentiles of the means and the mean of SB cost. To
provider a deeper perspective, we provide the names
of the countries to which these percentiles correspond.
So, for example, the 10th percentile corresponds to
mean SB index for Romania; similarly, 25th percentile
corresponds to the mean SB index for Estonia.
Likewise, the other countries corresponding to the
50th, 75th, 90th, 95th percentiles and the mean of SB
Table 2 Marginal impact of corruption on entrepreneurship at different levels of business cost
Value of SB
cost index
Percentile of
dSB cost
Corresponding
country
(1) Column (2)
estimates
(2) Column (3)
estimates
(3) Column (5)
estimates
(4) Column (6)
estimates
-1.06 10th Romania -0.29***
(0.03)
-0.35***
(0.025)
-0.44***
(0.032)
-0.41***
(0.026)
-0.60 25th Estonia 0.23***
(0.03)
-0.33***
(0.024)
-0.39***
(0.028)
-0.39***
(0.024)
-0.12 50th Serbia -0.17***
(0.033)
-0.31***
(0.023)
-0.34***
(0.025)
-0.37***
(0.02)
0.47 75th El Salvador -0.09***
(0.04)
-0.29***
(0.024)
-0.28***
(0.023)
-0.34***
(0.022)
1.19 90 Greece -0.003***
(0.04)
-0.27***
(0.03)
-0.20***
(0.014)
-0.31***
(0.023)
1.79 95 Cambodia 0.008
(0.019)
-0.25***
(0.03)
-0.25***
(0.03)
-0.29***
(0.025)
0.01 Mean Czech Republic -0.15***
(0.03)
-0.31***
(0.02)
-0.33***
(0.025)
-0.34***
(0.022)
dEntitdCorrit
¼ b1 þ b2 � SB Cost, evaluated at various values of SB cost. b1 and b2 correspond to estimates from this table
These marginal impacts have been estimated based on the estimates from this table. We state for each column the corresponding
column from this table
SB cost is the index of starting business cost that has been created using principal component analysis. dSB cost represents the mean
over the sample period. As we have an unbalanced panel, the number of available years for each country differs
Standard errors in parentheses; *** p\ 0.01, ** p\ 0.05, * p\ 0.1
188 N. Dutta, R. Sobel
123
Author's personal copy

costs are Serbia, El Salvador, Greece, Cambodia and
Czech Republic, respectively.
We report marginal estimates for four out of the six
specifications of Table 1 since they have the
maximum number of observations. The column num-
bers indicate that corresponding estimates from
Table (2) have been considered to estimate the
marginal impacts. We can see from the table that as
Table 3 System GMM specifications: corruption, entrepreneurship and business climate
(1) (2) (3) (4) (5) (6)
New density (lagged) 0.915***
(0.00498)
0.953***
(0.00365)
0.909***
(0.00260)
0.954***
(0.00400)
0.598***
(0.0188)
0.781***
(0.0374)
Corruption -0.120**
(0.0574)
-0.115*
(0.0596)
-0.0101
(0.0448)
-0.0793*
(0.0453)
-0.443***
(0.134)
-0.205
(0.220)
Starting business (SB) index -0.151***
(0.0474)
-0.194***
(0.0605)
-0.312***
(0.0516)
-0.160**
(0.0682)
-1.217***
(0.443)
-0.254
(0.552)
Corr*SB index 0.0785***
(0.0171)
0.0859***
(0.0184)
0.129***
(0.0171)
0.0770***
(0.0212)
0.378***
(0.141)
0.110
(0.178)
GDP per capita (in log terms) 0.114**
(0.0518)
-0.256***
(0.0462)
0.225***
(0.0491)
-0.152***
(0.0351)
-0.0938
(0.205)
-0.121
(0.217)
GDP growth 0.0552***
(0.00193)
0.0647***
(0.00199)
0.0565***
(0.00199)
0.0627***
(0.00171)
0.00173
(0.00937)
0.0219**
(0.00994)
Labor force participation (total) -0.0273***
(0.00312)
-0.0323***
(0.00346)
-0.0293***
(0.00254)
-0.0323***
(0.00371)
-0.0227*
(0.0136)
0.00946
(0.0182)
Population growth -0.0186
(0.0207)
0.0118
(0.0238)
-0.00878
(0.0152)
0.00799
(0.0216)
0.0911
(0.174)
-0.0450
(0.116)
Working age population (15–64) 0.0488***
(0.00899)
0.140***
(0.00841)
0.0387***
(0.00882)
0.117***
(0.00800)
0.00924
(0.0348)
0.0309
(0.0415)
FD1 0.00432***
(0.000199)
0.00700***
(0.000319)
FD2 0.00577***
(0.000568)
0.00732***
(0.000416)
FD3 -0.00215
(0.00205)
0.000284
(0.00369)
Primary completion rate -0.00980***
(0.000651)
-0.00995***
(0.000738)
-0.00258
(0.00164)
School enrollment (secondary) -0.0078***
(0.000520)
-0.0103***
(0.000378)
-0.00489***
(0.000800)
Constant -1.960***
(0.712)
-4.133***
(0.666)
-2.372***
(0.622)
-3.579***
(0.606)
3.591**
(1.499)
-0.510
(2.782)
Observations 294 353 294 353 66 97
Number of countries 84 88 84 88 25 28
Number of instruments 129 127 129 127 71 94
Sargan (p value) 0.91 0.91 0.92 0.90 0.94 0.90
Second-order autocorrelation (p value) 0.31 0.82 0.29 0.79 0.28 0.11
Standard errors in parentheses; *** p\ 0.01, ** p\ 0.05, * p\ 0.1
All specifications include year dummies
FD1 domestic credit provided by banking sector (% of GDP), FD2 domestic credit to private sector (% of GDP), FD3 liquid
liabilities (% of GDP)
Does corruption ever help entrepreneurship? 189
123
Author's personal copy

the value of the SB index rises, corruption continues to
have a negative impact on new density, but it hurts less
and less. For example, considering the estimates in
column (2), for Romania, which is at the 10th
percentile in terms of SB cost, a standard deviation
(SD) rise in corruption reduces new business density
by 0.29 percentage points.7 The reduction is less for
Serbia (by 0.17 % points) which is at the 50th
percentile. The impacts are stronger in columns (2),
(3) and (4). A standard deviation rise in corruption
reduces business density by 0.44 % points (see
column 5). Yet, if Romania’s business regulations
becomes as bad as El Salvador (SB cost = 0.47), then
the same rise in corruption reduces business density by
0.28 % points, that is, 36 % less decrease compared
with Romania.
Thus, our data fail to support the claim that corruption
under any circumstance can actually help entrepreneurial
initiatives. Increases in corruption for all countries in our
sample reduce entrepreneurial initiatives. The negative
indirect effect of corruption on entrepreneurship out-
weighs the direct beneficial impact. This has important
implications as it suggests that lowering corruption levels
is never harmful in an economy, contrary to what the
‘grease the wheels’ hypothesis implies. Under that
hypothesis, reducing corruption actually harms the
amount of entrepreneurship in countries with bad
business climates, therefore only justifying attempts to
curtail corruption in the countries with better business
climates.Our results, to the contrary, suggest that fighting
corruption is aworthwhilegoal everywhere, at least to the
extent that it never harms entrepreneurship to reduce
corruption. On the flip side, the benefit of reducing
corruption is clearly highest in those countries with the
best business climates.
We check the robustness of our results to the
inclusion of additional controls. The level of financial
development of an economy signifies the efficiency of
financial institutions and measures the size, activity
and efficiency of financial intermediaries and markets
(Beck et al. 2000). The previous literature has stressed
a strong connection between financial development
Table 4 Marginal impact of corruption on entrepreneurship at different levels of business cost
Value of SB cost index Percentile dSB cost Corresponding country Column 2 estimates Column 4 estimates
-1.06 10th Romania -0.20***
(0.05)
-0.16***
(0.03)
-0.60 25th Estonia -0.17***
(0.05)
-0.13***
(0.04)
-0.12 50th Serbia -0.13***
(0.06)
-0.09***
(0.04)
0.47 75th El Salvador -0.07*
(0.06)
-0.04*
(0.05)
1.19 90 Greece -0.01
(0.08)
0.01
(0.06)
1.79 95 Cambodia 0.04
(0.08)
0.05
(0.07)
0.01 Mean Czech Republic -0.11**
(0.06)
-0.07*
(0.04)
dEntitdCorrit
¼ b1 þ b2 � SB Cost, evaluated at various values of SB cost. b1 and b2 correspond to estimates from Table 5
These marginal impacts have been estimated based on the estimates from Table 5. We state for each column the corresponding
column from Table 7 for which we report the estimates
SB cost is the index of starting business cost that has been created using principal component analysis. dSB cost represents the mean
over the sample period. As we have an unbalanced panel, the number of available years for each country differs
Standard errors in parentheses; *** p\ 0.01, ** p\ 0.05, * p\ 0.1
7 SD of corruption = 1.04.
190 N. Dutta, R. Sobel
123
Author's personal copy

and entrepreneurship (see, e.g., Karaivanov 2012;
Bianchi 2012). Additionally, previous literature has
stressed that human capital affects entrepreneurial
development across nations. As pointed out by Le
(1999), level of education via the channels of
managerial ability and outside options might increase
Table 5 System GMM specifications: corruption, entrepreneurship and business climate
(1) (2) (3) (4)
Procedures Time Cost Paid in min. cap
New density (lagged) 0.751***
(0.00188)
0.751***
(0.00292)
0.757***
(0.00343)
0.735***
(0.00199)
Corruption -0.357***
(0.0356)
-0.274***
(0.0479)
-0.666***
(0.0387)
-0.499***
(0.0338)
Starting business measure (SBM) -0.0207*
(0.0113)
Corr* procedures 0.0126***
(0.00313)
GDP per capita (log) 0.0652
(0.0505)
-0.00149
(0.0450)
-0.441***
(0.0554)
-0.0454
(0.0526)
GDP growth 0.0387***
(0.000921)
0.0417***
(0.00139)
0.0319***
(0.00158)
0.0442***
(0.00188)
Labor force participation (total) -0.0107***
(0.00224)
-0.00697***
(0.00246)
-0.0125***
(0.00173)
-0.0105***
(0.00145)
Population growth -0.0507***
(0.00933)
-0.00403
(0.00905)
-0.0260**
(0.0104)
-0.0656***
(0.0115)
Working age population (15–64) 0.120***
(0.00968)
0.143***
(0.00580)
0.136***
(0.0112)
0.134***
(0.00989)
Time -0.00643***
(0.000293)
Corr* time 0.00238***
(0.000102)
Cost -0.00727***
(0.000374)
Corr* cost 0.00216***
(0.000107)
Min. capital -0.00210***
(6.07e-05)
Corr* min. capital 0.000609***
(1.79e-05)
Constant -6.669***
(0.334)
-7.902***
(0.421)
-2.227***
(0.270)
-6.018***
(0.244)
Observations 544 544 544 543
Number of countries 104 104 104 104
Number of instruments 131 131 131 131
Sargan test (p value) 0.87 0.93 0.89 0.87
Second-order autocorrelation (p value) 0.56 0.57 0.56 0.57
Standard errors in parentheses; *** p\ 0.01, ** p\ 0.05, * p\ 0.1
All specifications include year dummies
Does corruption ever help entrepreneurship? 191
123
Author's personal copy

the likelihood of being self-employed. Yet, Van Der
Sluis et al. (2008) point out that higher levels of
educational attainment may increase the opportunities
for wage employment and thus reduce the probability
of being self-employed. Thus, we include three
different measures of financial development (FD)—
domestic credit provided by banking sector (% of
GDP), domestic credit to private sector (% of GDP)
and liquid liabilities (% of GDP), and two measures of
human capital—net secondary8 enrollment ratio and
primary completion rate. Both sets of measures are
considered from WDI (2013). The results are pre-
sented in Table 3. While the coefficient of corruption
remains negative and significant for most of the
specifications, the coefficient of the interaction term is
positive and significant for almost all the specifica-
tions. We report the estimates for column (2) and
column (4) specifications in Table 3 for which we
have the maximum number of observations, approx-
imately 4 observations per country. As mentioned
earlier, cross-country data availability across time for
human capital measures is constrained and, thus, our
sample size shrinks. The primary completion rate has
relatively more available data compared with the other
education variable.
The marginal estimates from Table 4 reinstate our
conclusions. We report the estimates for two out of the
six specifications from Table 3. We choose these two
specifications since they have the maximum number
of observations. These are column (2) and column (4)
specifications from Table 3 for which the marginal
estimates are reported in Table 4. As we can see, for
higher costs of starting a business, corruptions hurts
less and less. The indirect (negative) effects of
corruption still outweigh the direct (positive) effects,
but by a lesser extent as the regulatory cost rises. For
example, if Romania’s corruption rises by 1 standard
deviation, then business density falls by 0.2 % points.
Yet, for El Salvador, it only declines by 0.07 % points
which is 65 % less decline. For very high values of SB
cost, the marginal impact is not significant.
5 Robustness analysis
We perform several robustness tests to ensure the
validity of our results. Our initial set of robustness
analysis9 consists of checking our results with the
individual components of the starting business (SB)
cost index. These are procedures (number), time
(days), cost (percent of income per capita) and
minimum capital requirement (percentage of income
per capita). We present the results in Table 5.
All controls are included except human capital
measures to maximize sample size. The sign and
significance of the coefficient of corruption is retained
for all the specifications. Likewise, the coefficient of
the interaction term remains positive. To find out
whether our benchmark results are supported, we report
the corresponding marginal estimates in Table 6.
Out of the four measures, we present the marginal
estimates for procedures and cost (% of income per
capita) keeping the space constraint in mind. The
estimates for the two other measures are available on
request. We use the actual values of these variables
and not the standardized values. As we can see from
the table, our main conclusions are reiterated in these
estimates. For both measures, as the number of
procedures or percentage of cost goes up, the magni-
tude of the negative impact on business density
decreases. Compared with Japan, Argentina faces a
lower cost in terms of rising corruption on its business
density as the number of procedures for Argentina
required to open a new business is much higher.
Finally, we test our results to alternate measures of
corruption. We consider yet another popular measure
of corruption from International Country Risk Guide
(ICRG) database. As mentioned by ICRG, their
8 Based on World Bank definition, net enrollment ratio ‘is the
ratio of children of official school age based on the International
Standard Classification of Education 1997 who are enrolled in
school to the population of the corresponding official school
age’ (WDI 2013). Primary completion rate to the completion of
primary education. The figures are expressed as a percentage of
the relevant age group.
9 We further test our results to the inclusion of different
indicators of economic freedom. Studies like Bjørnskov and
Foss (2008) have shown that certain indicators of economic
freedom affect entrepreneurial initiatives of nation. The differ-
ent measures of economic freedom we consider from Heritage
database are measures of property rights, fiscal freedom,
government spending, labor freedom, monetary freedom, trade
freedom and financial freedom. The coefficient on the interac-
tion term remains positive and significant for all the alternate
specifications. The coefficient of corruption is negative and
significant for all the alternate specifications. The estimated
marginal effects are similar to our benchmark results. The
coefficients of most indicators of economic freedom are
significant, indicating that they do affect entrepreneurship for
nations.
192 N. Dutta, R. Sobel
123
Author's personal copy

corruption measures assesses corruption within the
political system that discourages foreign investment,
distorts the incentives of both government and busi-
ness people by favoring and generating patronage and
nepotism activities and overall distorts the environ-
ment. It considers both business and financial corrup-
tion that are related to the running of the business as
well as ‘actual corruption’ in the forms of nepotism,
patronage, job reservations and so on. The index runs
from 0 to 6 points with higher points representing
lower levels of corruption. To be able to have
comparable analysis with our benchmark results, we
convert the score from 0 to 6 so that higher values
reflect higher corruption.
Table 7 presents our results. We include all our
benchmark controls along with the three measures of
financial development and two measures of human
capital. Human capital measures are included in
specifications (4)–(7) so that again we can test our
results with the maximum number of observations.
Except in column (3) specification, the coefficient
of corruption is negative and significant for all the
specifications and that of the interaction term is
positive and significant. Keeping the space constraint
in mind, we have not report the marginal estimates, but
they reiterate our benchmark conclusions.
6 Conclusion
Previous literature points to the potential for corrup-
tion to be a positive force for economic prosperity in
countries that make it difficult or costly to start a
business. By allowing entrepreneurs to bribe their way
through the permit and approval process, corruption
allows for more new businesses. This ‘grease the
wheels’ hypothesis, while plausible, is only half the
story. It represents the direct effect of corruption on
entrepreneurship. A large body of other literature
suggests that corruption is harmful to an economy, and
entrepreneurship indirectly through the indirect effect
of how corruption within government hampers the
effective functioning of government itself, creates a
climate opposite of what a predictable ‘rule of law’
regime would provide, and lowers income and pros-
perity of consumers.
According to the ‘grease the wheels’ argument,
efforts to stamp out corruption across the globe could
be very dangerous to growth and prosperity, particu-
larly in the poorest and least developed countries.
With bad business climates, without corruption,
business formation would be lower and growth less
robust. These arguments, however, ignore the indirect
effects of corruption on the overall economic vitality
Table 6 Marginal impact of corruption on entrepreneurship at different levels of procedures and cost
Value of
procedures
Percentile of
dProc
Corresponding
country
Estimates Value of
cost
Percentile of
dCost
Corresponding
country
Estimates
5 10th Japan -0.29***
(0.03)
0 10th Singapore -0.66***
(0.04)
6.25 25th Madagascar -0.27***
(0.04)
0 25th Netherlands -0.65***
(0.04)
8.75 50th Botswana -0.24***
(0.03)
19.8 50th Ethiopia -0.62***
(0.03)
10 75th Italy -0.23***
(0.04)
48.3 75th El Salvador -0.56***
(0.03)
12.52 90 Argentina -0.19***
(0.04)
230.4 90 Greece -0.16***
(0.02)
14.6 95 Bulgaria -0.17
(0.05)
563.1 95 Cambodia 0.54
(0.04)
8.6 Mean Czech Republic -0.24***
(0.03)
118.3 Mean Czech Republic -0.41***
(0.03)
dEntitdCorrit
¼ b1 þ b2 � SB Measure, evaluated at various values of SB measure. b1 and b2 correspond to estimates from Table 7
These marginal impacts have been estimated based on the estimates from Table 7
Standard errors in parentheses; *** p\ 0.01, ** p\ 0.05, * p\ 0.1
Does corruption ever help entrepreneurship? 193
123
Author's personal copy

Table 7 System GMM specifications: corruption, entrepreneurship and business climate
(1) (2) (3) (4) (5) (6) (7)
New density (lagged) 0.686***
(0.00481)
0.700***
(0.00322)
0.835***
(0.0537)
0.635***
(0.0246)
0.636***
(0.0236)
0.776***
(0.00876)
0.776***
(0.00638)
Corruption (ICRG) -0.0548***
(0.0187)
-0.0242*
(0.0131)
-0.0871
(0.105)
-0.215***
(0.0343)
-0.185***
(0.0130)
-0.211***
(0.0387)
-0.204***
(0.0325)
Starting business (SB) index -2.107***
(0.0690)
-1.882***
(0.0513)
-1.032***
(0.356)
-1.705***
(0.272)
-1.671***
(0.200)
-2.153***
(0.155)
-1.636***
(0.148)
Corr*SB index 0.389***
(0.0135)
0.346***
(0.00952)
0.170**
(0.0683)
0.342***
(0.0512)
0.330***
(0.0389)
0.403***
(0.0314)
0.308***
(0.0311)
GDP per capita (log) 0.465***
(0.0386)
0.447***
(0.0425)
-0.172
(0.164)
0.554***
(0.0592)
0.415***
(0.0607)
0.717***
(0.0556)
0.931***
(0.0524)
GDP growth 0.0593***
(0.00163)
0.0623***
(0.00137)
0.0310***
(0.00632)
0.0502***
(0.00114)
0.0538***
(0.00127)
0.0506***
(0.00156)
0.0497***
(0.00182)
Labor force participation
(total)
0.0706***
(0.00300)
0.0649***
(0.00334)
-0.0368**
(0.0145)
-0.00439
(0.00487)
-0.0138***
(0.00442)
-0.00265
(0.00528)
0.00913**
(0.00358)
Population growth -0.0687***
(0.0110)
-0.0728***
(0.0108)
0.214*
(0.115)
-0.206***
(0.0301)
-0.169***
(0.0218)
-0.177***
(0.0259)
-0.179***
(0.0193)
Working age population
(15–64)
0.0533***
(0.00790)
0.0658***
(0.00659)
0.0276
(0.0186)
0.0740***
(0.0137)
0.0724***
(0.0149)
-0.0600***
(0.0127)
-0.0565***
(0.00856)
FD1 -0.0117***
(0.000432)
-0.000757*
(0.000450)
-0.0164***
(0.000570)
FD2 -0.0114***
(0.000529)
0.00157***
(0.000560)
-0.0180***
(0.000709)
FD3 0.00765***
(0.00245)
School enrollment
(secondary)
-0.0378***
(0.00444)
-0.0343***
(0.00414)
Primary completion rate -0.0115***
(0.00191)
-0.0151***
(0.00148)
Constant -10.40***
(0.552)
-10.95***
(0.509)
1.975**
(1.000)
-5.056***
(0.711)
-3.692***
(0.861)
0.979*
(0.550)
-1.583***
(0.509)
Observations 407 407 118 243 243 284 284
Number of countries 89 89 34 67 67 76 76
Number of instruments 90 90 90 91 91 91 91
Sargan (p value) 0.56 0.59 0.95 0.92 0.94 0.91 0.92
Second-order
autocorrelation (p value)
0.32 0.33 0.31 0.65 0.64 0.27 0.26
Standard errors in parentheses; *** p\ 0.01, ** p\ 0.05, * p\ 0.1
All specifications include year dummies
FD1 domestic credit provided by banking sector (% of GDP), FD2 domestic credit to private sector (% of GDP), FD3 liquid
liabilities (% of GDP)
194 N. Dutta, R. Sobel
123
Author's personal copy

of a country through broader institutional channels and
fly in the face of well-cited studies by authors such as
Shleifer and Vishny (1993) and Glaeser and Saks
(2006) among many others listed in our literature
review that suggest corruption harms growth.
Our results help to provide some clarity to this
debate. We indeed find a positive coefficient on our
interaction term with corruption and the business
climate, seemingly supporting the grease the wheels
hypothesis. However, with a strong negative coeffi-
cient on corruption itself, the true impact of changes in
corruption levels depends on the combined direct and
indirect effects. Once we estimate this combined total,
our results are clear, higher corruption is never
positive and statistically significant. The total impact
of corruption is clearly negative for the countries with
the better business climates. In a nutshell, efforts to
reduce corruption are not a danger to entrepreneurship,
even in the countries with the worst business climates.
While corruption certainly hurts less when a country
has a bad business climate, it never has a positive
impact on entrepreneurship in total once both the
direct and indirect effects are considered. While
corruption may ‘grease the wheels,’ any benefit of
this is more than offset by corruption’s negative
impact in terms of slowing the overall entrepreneurial
engine.
Acknowledgments We thank the editor and the referees for
their invaluable comments and suggestions. We also thank the
session participants at Southern Economic Association, 2013,
and the seminar participants at University of Wollongong,
Wollongong, New South Wales, Australia, for their feedback.
Appendix 1
See Table 8.
Table 8 Countries with means for corruption and business density
Country Corruption Business
density
Country Corruption Business
density
Country Corruption Business
density
Afghanistan 4.09 0.12 United Kingdom 0.86 8.93 Nigeria 3.62 0.61
Albania 3.19 0.89 Georgia 2.80 2.53 Netherlands 0.45 3.03
UAE 1.51 1.73 Ghana 2.60 0.84 Norway 0.49 4.40
Argentina 3.01 0.56 Greece 2.25 0.88 New Zealand 0.21 20.30
Armenia 3.19 1.33 Guatemala 3.16 0.68 Oman 2.20 1.42
Australia 0.51 6.23 Croatia 2.51 2.85 Pakistan 3.51 0.04
Austria 0.69 0.62 Hungary 2.09 5.01 Panama 2.87 2.22
Azerbaijan 3.69 0.72 Indonesia 3.30 0.19 Peru 2.83 1.83
Belgium 1.18 2.66 India 2.99 0.07 Philippines 3.27 0.23
Burkina Faso 2.92 0.09 Ireland 0.93 5.37 Poland 2.28 0.49
Bangladesh 3.73 0.07 Iraq 4.02 0.32 Portugal 1.53 4.01
Bulgaria 2.67 7.09 Israel 1.68 4.66 Romania 2.76 5.43
Bosnia 2.89 0.80 Italy 2.41 1.83 Russia 3.52 2.85
Belarus 3.30 0.60 Jamaica 2.99 1.17 Rwanda 2.58 0.34
Bolivia 3.10 0.38 Jordan 2.32 0.67 Senegal 2.99 0.20
Brazil 2.64 2.10 Japan 1.19 1.08 Singapore 0.33 7.18
Bhutan 1.82 0.04 Kazakhstan 3.53 1.82 Sierra Leone 3.48 0.24
Botswana 1.60 7.35 Kenya 3.48 0.56 El Salvador 2.85 0.50
Canada 0.61 8.00 Kyrgyz Republic 3.74 0.98 Serbia 2.83 2.02
Switzerland 0.48 2.33 Cambodia 3.71 0.23 Suriname 2.71 0.50
Does corruption ever help entrepreneurship? 195
123
Author's personal copy

Appendix 2
See Table 9.
Table 8 continued
Country Corruption Business
density
Country Corruption Business
density
Country Corruption Business
density
Chile 1.14 2.80 Korea, Rep. 2.13 1.58 Slovak Rep. 2.22 3.90
Colombia 2.80 1.16 Kosovo 3.17 0.78 Slovenia 1.60 3.40
Costa Rica 2.08 16.29 Lao PDR 3.68 0.07 Sweden 0.35 4.61
Cyprus 1.53 25.78 Sri Lanka 2.87 0.38 Syrian 3.50 0.03
Czech Republic 2.23 2.60 Lesotho 2.54 0.98 Togo 3.55 0.06
Germany 0.80 1.23 Lithuania 2.41 2.09 Thailand 2.85 0.64
Denmark 0.10 5.36 Latvia 2.35 6.82 Tajikistan 3.65 0.32
Dominican Rep. 3.35 0.74 Morocco 2.86 0.98 Tunisia 2.64 0.63
Algeria 3.09 0.20 Moldova 3.24 1.60 Turkey 2.56 0.98
Egypt 3.15 0.13 Madagascar 2.84 0.08 Uganda 3.37 0.62
Spain 1.44 3.55 Mexico 2.85 0.73 Ukraine 3.34 0.91
Estonia 1.62 7.43 Macedonia, FYR 2.73 5.55 Uruguay 1.43 3.24
Ethiopia 3.25 0.03 Mauritius 2.04 7.88 Uzbekistan 3.67 0.56
Finland 0.19 3.25 Malawi 3.13 0.08 South Africa 2.27 1.09
France 1.15 3.13 Malaysia 2.40 2.36 Zambia 3.17 0.85
Gabon 3.43 3.78 Niger 3.32 0.01
Table 9 Summary statistics
Variable Obs. Mean SD Min Max
New density 744 2.7 4.2 0 39
Corruption 744 2.4 1 0 4.2
SB index 728 0 1.2 -1.9 7
GDP per capita (PPP) 731 13,742.4 12,877.8 582.5 70,928.2
GDP growth 734 4.4 4.5 -18 46.5
Labor force participation 663 62 9.5 40.2 85.8
Labor force participation (fem) 663 50.60452 15.09871 10.8 86.3
Urban population 740 59.5 21.4 13 100
Working age population 741 64.2 6.1 48.7 82.7
Population in the largest city 636 29.9 15.8 5.6 100.8
Population growth 743 1.3 1.4 -1.0 14.8
FD1 713 71.7 62.7 -18.4 337.5
FD2 713 62.3 55.8 1.8 294.8
FD3 200 48.9 39.5 13.8 217.4
FD1 domestic credit provided by banking sector (% of GDP), FD2 domestic credit to private sector (% of GDP), FD3 liquid
liabilities (% of GDP)
196 N. Dutta, R. Sobel
123
Author's personal copy

Table
10
Correlationmatrix
New
density
Corruption
SB
index
GDP
p.c.
GDP
growth
LFPR
(total)
LFPR
(fem
.)
Urban
pop.
Wor.age
pop.
Pop.larg.
city
Pop.
growth
FD1
FD2
FD3
New
density
1
Corruption
-0.48*
1
SB
index
-0.34*
0.44*
1
GDPp.c.
0.31*
-0.85*
-0.43*
1
GDPgrowth
-0.16*
0.31*
0.22*
-0.30*
1
LFPR
(total)
0.01
-0.01
0.04
-0.02
0.09*
1
LFPR
(fem
)0.09*
-0.13*
-0.07
0.05
-0.03
0.88*
1
Urban
Pop.
0.34*
-0.62*
-0.27*
0.61*
-0.26*
-0.32*
-0.21*
1
Wor.agepop.
0.33*
-0.44*
-0.33*
0.40*
-0.22*
-0.27*
-0.16*
0.54*
1
Pop.larg.city
0.07
0.04
0.09*
-0.03
0.12*
0.26*
0.21*
-0.08
-0.15*
1
Pop.growth
-0.12*
0.13*
0.18*
-0.01
0.17*
0.32*
-0.02
-0.19*
-0.28*
0.18*
1
FD1
0.07
-0.21*
-0.08*
0.22*
-0.09*
-0.05
0.02
0.09*
0.07
-0.01
-0.16*
1
FD2
0.09*
-0.22*
-0.07
0.21*
-0.01*
0.01
0.07
0.06
0.08*
0.01
-0.14*
0.95*
1
FD3
-0.01
-0.18*
-0.08
0.40*
-0.11
-0.19*
-0.06
0.04
0.17*
-0.11
-0.07
0.84*
0.82*
1
FD
1domesticcreditprovided
bybankingsector(%
ofGDP),
FD
2domesticcreditto
privatesector(%
ofGDP),
FD
3liquid
liabilities(%
ofGDP)
Appendix
3
See
Table
10.
Does corruption ever help entrepreneurship? 197
123
Author's personal copy

References
Acemoglu, D., Johnson, S., Robinson, J. A., & Yared, P. (2008).
Income and democracy. American Economic Review, 98,
808–842.
Ackerman, R. S. (2006). International Handbook on the Eco-
nomics of Corruption. Northampton, MA: Edward Elgar
Publishing.
Acs, Z. J., Desai, S., & Klapper, L. F. (2008). What does ‘‘En-
trepreneurship’’ data really show? A comparison of the
global entrepreneurship monitor and World Bank group
datasets. Small Business Economics, 31(3), 265–281.
Aghion, P., Burgess, R., Redding, S., & Zilibotti, F. (2008). The
unequal effects of liberalization: Evidence from disman-
tling the license raj in India. American Economic Review,
94(4), 1397–1412.
Aidis, R., Estrin, S., & Mickiewicz, T. M. (2012). Size matters:
Entrepreneurial entry and government. Small Business
Economics, 39(1), 119–139.
Anokhin, S., & Schulze, W. S. (2009). Entrepreneurship,
innovation, and corruption. Journal of Business Venturing,
24, 465–476.
Arellano, M., & Bond, S. (1991). Some tests of specification for
panel data: Monte Carlo evidence and an application to
employment equations. Review of Economic Studies, 58,
277–297.
Armington, C., & Acs, Z. (2002). The determinants of regional
variation in new firm formation. Regional Studies: The
Journal of the Regional Studies Association, 36(1), 33–45.
Asiedu, E., Jin, Y., & Nandwa, B. (2009). Does foreign aid
mitigate the adverse effect of expropriation risk on foreign
direct investment? Journal of International Economics,
78(2), 268–275.
Asiedu, E., & Lien, D. (2011). Democracy, foreign direct
investment and natural resources. Journal of International
Economics, 84(1), 99–111.
Audretsch, D. B., & Keilbach, M. (2007). The localisation of
entrepreneurship capital: Evidence from Germany. Papers
in Regional Science, 86(3), 351–365.
Audretsch, D. B., Thurik, A. R., Verheul, I., & Wennekers, A.
R. M. (Eds.). (2002). Entrepreneurship: Determinants and
policy in an European—US Comparison. Boston/Dor-
drecht: Kluwer.
Beck, T., Asli, D.-K., & Ross, L. (2000). A new database on
financial development and structure. World Bank Eco-
nomic Review, 14, 597–605.
Bianchi, M. (2012). Financial development, entrepreneurship,
and job satisfaction. Review of Economics and Statistics,
94(1), 273–286.
Bjørnskov, C., & Foss, N. (2008). Economic freedom and
entrepreneurial activity: Some cross-country evidence.
Public Choice, 134(3), 307–328.
Blundell, R., & Bond, S. (1998). Initial conditions and moment
restrictions in dynamic panel data models. Journal of
Econometrics, 87, 115–144.
Bruderl, J., & Preisendorfer, P. (1998). Network support and the
success of newly founded businesses. Small Business
Economics, 10(3), 213–225.
Bruhn, M. (2008). License to sell: The effect of business regis-
tration reform on entrepreneurial activity in Mexico. World
Bank, Washington, DC. � World Bank. https://
openknowledge.worldbank.org/handle/10986/6596 License:
Creative Commons Attribution CC BY 3.0 Unported.
Busenitz, L. W., Gomez, C., & Spencer, J. W. (2000). Countryinstitutional profiles: Unlocking entrepreneurial phenom-
ena. Academy of Management Journal, 43(5), 994–1003.
De Soto, H. (1989). The other path: The invisible revolution in
the third world. New York: Harper Row.
Delmar, F., & Davidsson, P. (2000). Where do they come from?
Prevalence and characteristics of nascent entrepreneurs.
Entrepreneurship & Regional Development, 12, 1–23.
Djankov, S., Montalvo, J. G., & Reynal-Querol, M. (2006). The
curse of aid. Journal of Economic Growth, 13, 169–194.
Doing Business Database, The World Bank (http://www.
doingbusiness.org), 2013
Dreher, A., & Gassebner, M. (2013). Greasing the wheels? The
impact of regulations and corruption on firm entry. Public
Choice, 155(3), 413–432.
Du Rietz, A., & Henrekson, M. (2000). Testing the female
underperformance hypothesis. Small Business Economics,
14(1), 1–10.
Dutta, N., Leeson, P. T., & Williamson, C. (2013). The ampli-
fication effect: Foreign aid’s impact on political institu-
tions. Kyklos, 66(2), 208–228.
Ehrlich, I., & Lui, F. (1999). Bureaucratic corruption and
endogenous economic growth. Journal of Political Econ-
omy, 107(6), 270–293.
Estrin, S., Korosteleva, J., & Mickiewicz, T. (2012). Which
institutions encourage entrepreneurial growth aspirations?
Journal of Business Venturing, 28(4), 564–580.
Fonseca, R., Lopez-Garcia, P., & Pissarides, C. A. (2001).
Entrepreneurship, start-up costs and employment. Euro-
pean Economic Review, 45(4–6), 692–705.
Glaeser, E., & Goldin, C. (2006). Corruption and reform: An
introduction. In Corruption and reform (pp. 3–22). NBER:
University of Chicago Press.
Glaeser, E., & Saks, R. (2006). Corruption in America. Journal
of Public Economics, 90, 1053–1072.
Hellman, J. S., Jones, G., Kaufman, D., & Shankerman,M. (2000).
Measuring governance, corruption and state capture: How
firms and bureaucrats shape the business environment in
transition economies. World Bank Policy Research Working
Papers 2312. Washington, DC: The World Bank.
International Country Risk Guide. (2012). Political Risk Service
(PRS) Database, 2012.
International Labor Organization (ILO). (1990). The promotion
of self-employment. Geneva: ILO.
Kaplan, D. S., Piedra, E., & Seira, E. (2009). Entry regulation
and business startups: Evidence fromMexico. World Bank
Policy Research Working Paper 4322.
Karaivanov, A. (2012). Financial constraints and occupational
choice in Thai Villages. Journal of Development Eco-
nomics, 27(2), 201–220.
Kauffman, D., Kraay, A., & Mastruzzi, M. (2010). The world-
wide governance indicators: Methodology and analytical
issues. Policy Research Working Paper Series 5430, The
World Bank.
Keeble, D., & Walker, S. (1994). New firms, small firms and
dead firms: Spatial patterns and determinants in the United
Kingdom. Regional Studies, 28(4), 411–427.
198 N. Dutta, R. Sobel
123
Author's personal copy

Klapper, L., Laeven, L., & Rajan, R. G. (2006). Entry regulation
as a barrier to entrepreneurship. Journal of Financial
Economics, 82(3), 591–629.
La Porta, R., Lopez-de-Silanes, F., Shleifer, A., & Vishny, R.
(1999). The quality of government. Journal of Law, Eco-
nomics and Organization, 15(1) 222–279.
Le, A. T. (1999). Empirical studies of self-employment. Journal
of Economic Surveys, 13(4), 381–416.
Leeson, P. T., & Sobel, R. S. (2008). Weathering corruption.
Journal of Law and Economics, 51(4), 667–681.
Lipsey, R. G., & Lancaster, K. (1956). The general theory of
second best. The Review of Economic Studies, 24(1),
11–32.
Mauro, P. (1995). Corruption and growth. Quarterly Journal of
Economics, 110(3), 681–712. doi:10.2307/2946696.
Ovaska, T., & Sobel, R. S. (2005). Entrepreneurship in post-
socialist economies. Journal of Private Enterprise, 21(1),
8–28.
Persson, T., & Tabellini, G. (2006). Democracy and develop-
ment: The devil in the details. American Economic Review,
99, 319–324.
Posner, R. A. (1975). The social costs of monopoly and regu-
lation. The Journal of Political Economy, 83, 807–827.
Radaev, V. (2004). How trust is established in economic rela-
tionships when institutions and individuals are not trust-
worthy. In J. Kornai, B. Rothstein, & S. Rose-Ackerman
(Eds.), Creating social trust in post-socialist transition (pp.
91–111). Basingstoke: Palgrave.
Reynolds, P. D., Carter, N. M., Gartner, W. B., & Greene, P. G.
(2004). The prevalence of nascent entrepreneurs in the
United States: Evidence from the panel study of entrepre-
neurial dynamics. Small Business Economics, 23(4),
263–284.
Reynolds, P. D., Hay, M., & Camp, S. M. (1999). Global
entrepreneurship monitor: 1999 executive report. Babson
College, London Business School and Kauffman Center
for Entrepreneurial Leadership.
Reynolds, P. D., Miller, B., & Maki, W. R. (1995). Explaining
regional variation in business births and deaths: U.S.
1976–1988. Small Business Economics, 7, 389–407.
Rohwer, A. (2009). Measuring corruption: A comparison
between the transparency International’s corruption per-
ceptions index and the world bank’s worldwide governance
indicators. CESifo DICE Report, 7(3), 42–52. Ifo Institute
for Economic Research at the University of Munich.
Roodman, D. (2009). A note on the theme of too many instru-
ments. Oxford Bulletin of Economics and Statistics, 71(1),
135–158.
Rose, R. (2000). Getting things done in an anti-modern society:
Social capital networks in Russia. In P. Dasgupta & I.
Serageldin (Eds.), Social capital: A multifaceted perspec-
tive (pp. 147–171). Washington, DC: The World Bank.
Sachs, J. D., & Warner, A. M. (1997). Fundamental sources of
long-run growth. American Economic Review, 87(2),
184–188.
Schwirtz, M. (2013). in filing, casino operator admits likely
violation of an antibribery law. The New York Times
(March 2). http://www.nytimes.com/2013/03/03/business/
in-filing-casino-operator-admits-likely-violation-of-an-anti
bribery-law.html?_r=0. Accessed March 8, 2013.
Shleifer, A., & Vishny, R. (1993). Corruption. Quarterly Jour-
nal of Economics, 108(3) 599–617.
Spiller, P. T. (1990). Politicians, interest groups, and regulators:
A multiple-principals agency theory of regulation, or ‘Let
Them Be Bribed’. Journal of Law and Economics, 33(1),
65–101.
Storey, D. J. (1994). Understanding the small business sector.
University of Illinois at Urbana-Champaign’s Academy for
Entrepreneurial Leadership Historical Research Reference
in Entrepreneurship. SSRN: http://ssrn.com/abstract=
1496214.
Tamasy, C., & Le Heron, R. (2008). The geography of firm
formation in New Zealand. Tijdschrift Voor Economische
En Sociale Geografie, 99(1), 37–52.
Tidemann, N., & Tulloc, G. (1976). A new and superior process
for making social choices. Journal of Political Economy
1145–1159.
Tonoyan, V., Strohmeyer, R., Habib, M., & Perlitz, M. (2010).
Corruption and entrepreneurship: How formal and infor-
mal institutions shape small firm behavior in transition and
mature market economies. Entrepreneurship Theory and
Practice, 34, 803–831.
Treisman, D. (2000). The causes of corruption: A cross-national
study. Journal of Public Economics 399–457.
Uhlaner, L. M., Thurik, A. R., & Hutjes, J. (2002). Post-mate-
rialism as a cultural factor influencing entrepreneurial
activity across nations. ERIM Report ERS-2002-62-STR,
Erasmus University Rotterdam.
van der Sluis, J., van Praag, M., & Vijverberg, W. (2008).
Education and entrepreneurship selection and perfor-
mance: A review of the empirical literature. Journal of
Economic Surveys, 22(5), 795–841.
Verheul, I., Stel, A. V., & Thurik, R. (2006). Explaining female
and male entrepreneurship at the country level. En-
trepreneurship & Regional Development, 18(2), 151–183.
Wagner, R. K., & Sternberg, R. J. (1985). Practical intelligence
in real-world pursuits: The role of tacit knowledge. Journal
of Personality and Social Psychology, 49, 436–458.
World Bank. (2012). Doing business, entrepreneurship data-
base. http://www.doingbusiness.org/data/exploretopics/
entrepreneurship
World Bank. (2013). World Development Indicators, Online
Database.
Does corruption ever help entrepreneurship? 199
123
Author's personal copy